currency wars triple dips and politics to dominate 2013
TRANSCRIPT

Currency Wars, Triple‐Dips & Politics to Dominate in the Year of the Snake
13 March 2013
Richard Ramsey Chief Economist Northern Ireland

Slide 2
Depending
on who you talk to things may not that bad…
Source:
The Economist
Muhammed Saeed al-Sahafaka ‘Comical Ali’
Iraqi Information Minister 2003

Slide 3
Global output growth continues…
Global Output - PMI
25
30
35
40
45
50
55
60
65
Feb-07 Feb-08 Feb-09 Feb-10 Feb-11 Feb-12 Feb-13
Total Manufacturing Services
Source: Markit Economics
ExpansionC
ontraction

Slide 4
US remains the best performer relative to China, UK & EZ
Composite PMIs (Manufacturing & Services ** Excludes Construction**)
35
40
45
50
55
60
65
Feb-08 Feb-09 Feb-10 Feb-11 Feb-12 Feb-13
Eurozone US (ISM) China UK
Source: Markit Economics
ExpansionC
ontraction

Slide 5March 14, 2013 – Page 5 © Ulster Bank
The biggest threat to growth & financial markets is / was….sovereign debt dominos….
?

Slide 6
Investor sentiment in sovereign debt markets has improved since Draghi’s
‘Whatever it takes’
8-Yr Govt Bond Yields
2
4
6
8
10
12
14
16
18
Dec-09
Mar-10
Jun-1
0Sep
-10Dec
-10Mar-
11Ju
n-11
Sep-11
Dec-11
Mar-12
Jun-1
2Sep
-12Dec
-12Mar-
13%
Source: Bloomberg

Slide 7
Debt Mountain still has to be conquered and that applies to the US too
Source:
The Economist

Slide 8
The fiscal challenges in the Eurozone remain…
Euro Area Budget Balances 2012,% of GDP
-9-8-7-6-5-4-3-2-1
-
German
yFinl
and
Estonia
Luxe
mbourg
Malta
Italy
Austria
Belgium
Netherl
ands
Sloven
iaFran
ceCyp
rus
Slovak
Rep
ublic
Portug
alSpa
inGree
ceIre
land
Source: IMF, Dept of Finance
Euro Area Debt Levels 2012,% of GDP
-20406080
100120140160180
Greece Italy
Portug
alIre
land
Belgium
Spain
France
Cyprus
German
yAus
triaMalt
aNeth
erlan
dsSlov
enia
Finlan
d
Slovak
Rep
ublic
Luxe
mbourg
Estonia
Source: IMF, Dept of Finance
Slide 9
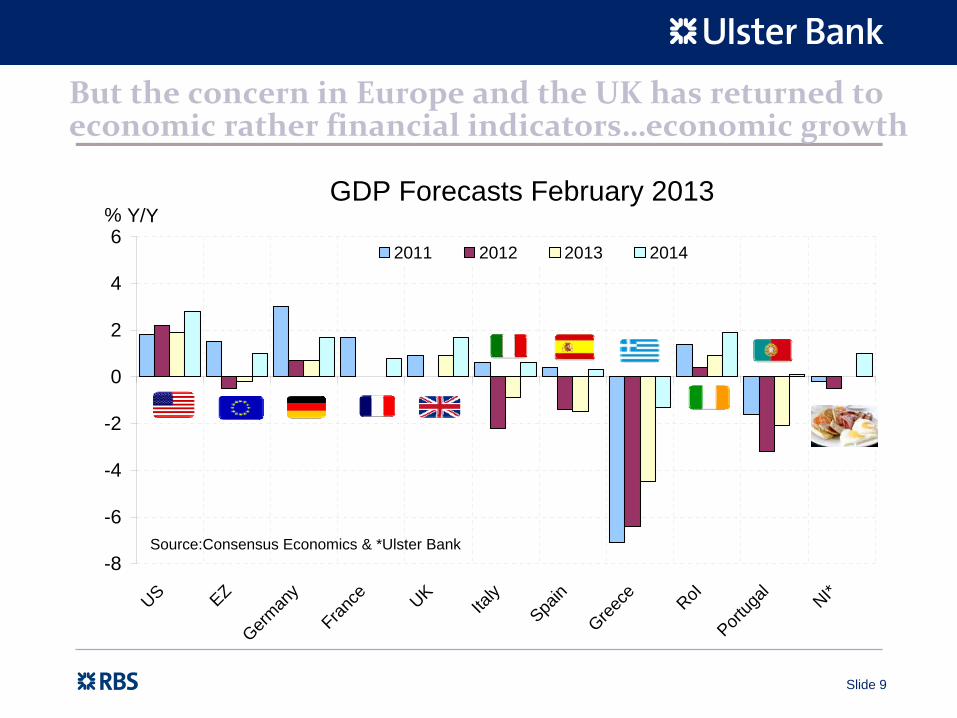
But the concern in Europe and the UK has returned to economic rather financial indicators…economic growth
GDP Forecasts February 2013
-8
-6
-4
-2
0
2
4
6
US EZGerm
any
France UK
Italy
Spain
Greece RoI
Portug
al NI*
% Y/Y
2011 2012 2013 2014
Source:Consensus Economics & *Ulster Bank

Slide 10
Recovery well under way in some economies –
focus on levels of GDP
not just growth rates
Recession & Recoveries (% GDP Change Since Pre-Recession Peak as of Q4 2012*)
+2.4%
-3.0%
-3.3%
-7.7% or -9.5% using GNP
-12%
-10%
-8%
-6%
-4%
-2%
0%
2%
4%
0 1 2 3 4 5 6 7 8 9 10 11 12 13 14 15 16 17 18 19 20 21Time in Quarters, Pre-Recession GDP Peak = 0
US EZ UK RoI
Source: Bloomberg, *RoI as of Q3 2012

Slide 11
Last year saw Portugal, Italy, Spain & Greece continue to contract at a rapid rate
Recession & Recoveries (% GDP Change Since Pre-Recession Peak as of Q4 2012)
-6.7%
-7.7%
-6.6%
-1.1%
-7.7%
+1.4%
-12%
-10%
-8%
-6%
-4%
-2%
0%
2%
4%
0 1 2 3 4 5 6 7 8 9 10 11 12 13 14 15 16 17 18 19 20Time in Quarters, Pre-Recession GDP Peak = 0
Portugal Ireland Italy Spain Germany France
Source: Bloomberg & UB Calculations @ -20%

Slide 12
The 2nd, 3rd
& 4th
largest economies within the eurozone are contracting at a rapid rate in 2013
Composite PMIs (Manufacturing & Services ** Excludes Construction**)
30
35
40
45
50
55
60
65
Feb-07 Feb-08 Feb-09 Feb-10 Feb-11 Feb-12 Feb-13
Source: Markit Economics PMIs
Contraction
Expansion

Slide 13
After Greece, France & Italy post steepest falls in manufacturing output. Denmark posts strongest gain
PMIs: Manufacturing Output February 2013
35 40 45 50 55 60 65
GreeceFrance
ItalyIsrael**
AustraliaSpain
EZJapan
EUSingapore
AustriaPoland
VietnamUK
S.KoreaCzech
IndonesiaNetherlands
TaiwanGermany
ChinaIreland
CanadaGlobal
South AfricaNI
RussiaTurkey
BrazilMexico
IndiaSwitzerland
USN.Zealand*
Denmark
Source: Markit Economics Output Indices, * January, **December
NI, RoI & UK

Slide 14
It’s a similar story when it comes to services
PMIs: Services Output February 2013
40 45 50 55 60
ItalyFranceSpain
NIEZ
AustraliaEU
JapanUK
ChinaBrazil
Emerging MarketsGlobalIreland
IndiaGermany
RussiaUS*
Source: Markit Economics Output Indices, * US Non-manufacturing which is wider than services
€

March / April 2012
‘The Psycho-Dwarf’’
April / May 2012 November 2012
France hitting the headlines for the wrong reasons

Slide 16
Les Misérable economy needs an economic revolution
•
U‐Rate 10.6% Q4 2012 (7.5% Q1 2008)
•
<25yrs U‐Rate 25.2% Q4 2012 (17.2% Q1 2008 & 5.9% Q1 1975)
•
Employment Rate 51.1% (Male 56% & Female 46.6%)
•
Corporation tax rate 33.3% (EU average 20.5%)
Key Facts
Starring Francois Hollande
Slide 17
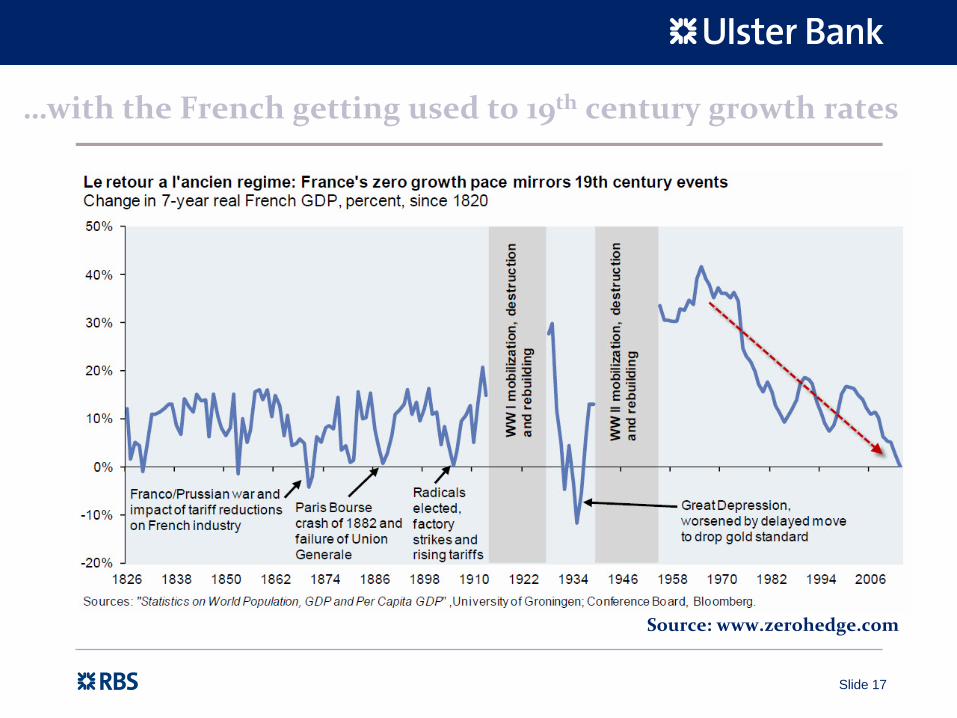
…with the French getting used to 19th
century growth rates
Source: www.zerohedge.com

Slide 18Slide 18
‘The Grizz’ blasts French work ethic
Maurice ‘The Grizz’
Taylor
Chairman of Titan International, a US tyre giant asked by the French government to take over a Goodyear
plant in France.
“The French worker can be as productive as anyone else when he
works, but he is not working”
“The French workers are paid high wages but only work three
hours….they get one hour for breaks & lunch, talk for three hours and
work for three”.
“In five years, Michelin won’t be producing tyres in France. You can
keep your so‐called workers”.
Comments made February 2013
Slide 19
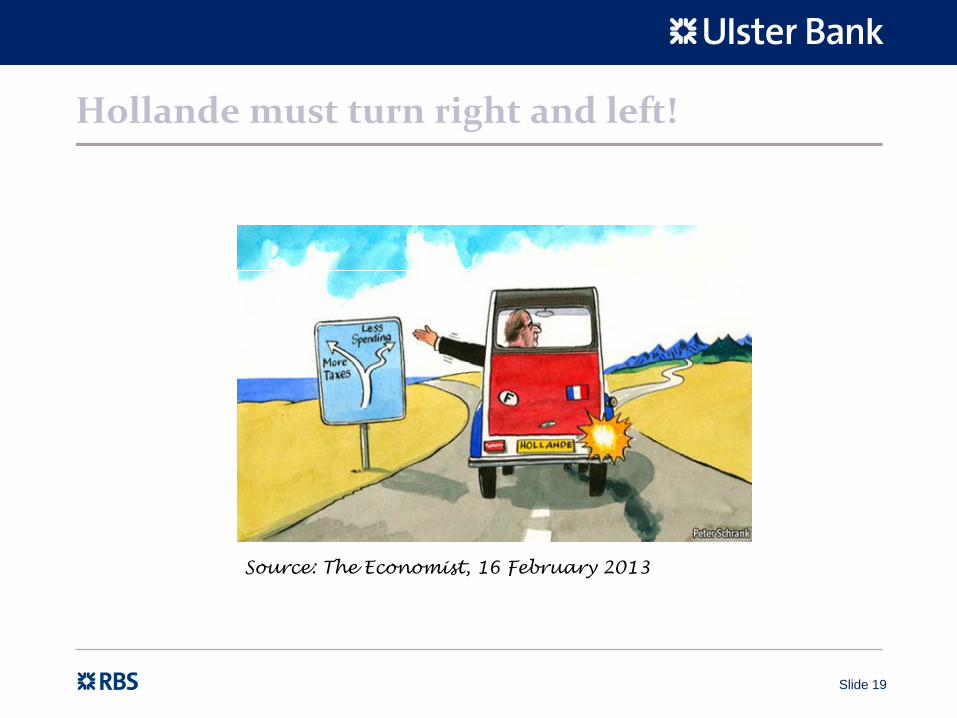
Hollande must turn right and left!
Source: The Economist, 16 February 2013Source: The Economist, 16 February 2013

The Self Preservation Society or Grand Coalition?The Self Preservation Society or a Grand Coalition?
€ € €€
‘Rigor Montis’
the Technocrat
The Comedian‘Dead man talking’
‘The Psycho-Dwarf’’
Slide 21
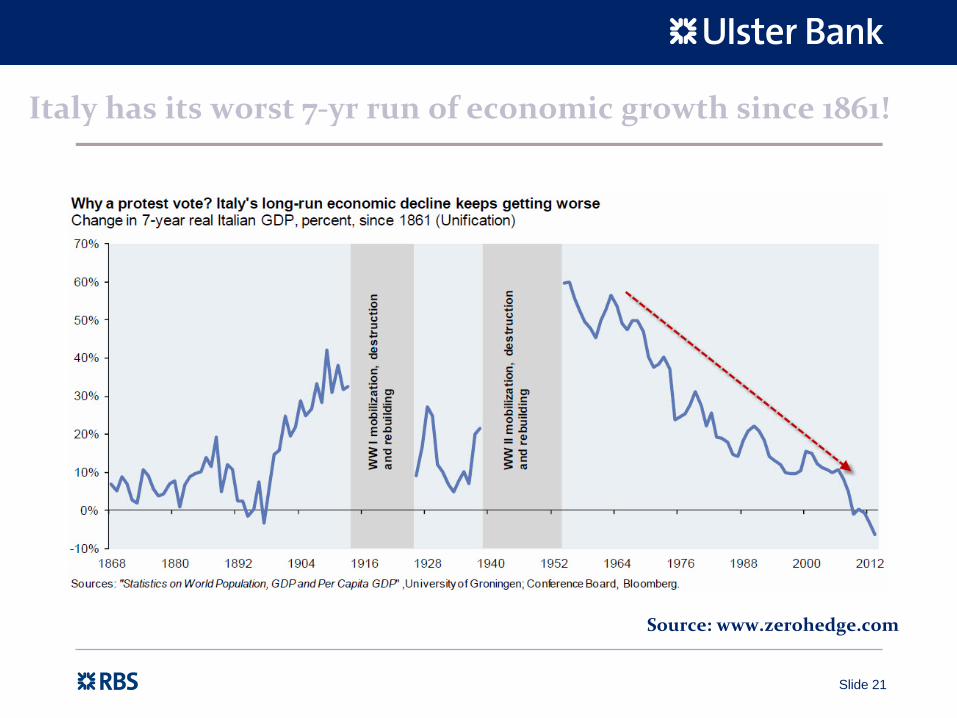
Italy has its worst 7‐yr run of economic growth since 1861!
Source: www.zerohedge.com

Slide 22
Italy not in great shape either, particularly the labour market
•
U‐Rate 11.7% Jan‐2013 (5.8% Apr‐07)
•
<25yrs U‐Rate 38.7% Jan‐2013 (17.2% Q1 2008 & 5.9% Q1 1975)
•
Employment Rate 51.1% (Male 56% & Female 46.6%)
•
Corporation tax rate 31.4% (EU average 20.5%)
Key Facts
Big political risk for Eurozone as a whole

Slide 23
Italy has overtaken Portugal and its Youth unemployment is where Greece was 2 years ago
€€
Source: www.zerohedge.com

Slide 24Slide 24
No quick‐fix – the ‘Juncker Conundrum’
“We all know what we need to do, we just don’t know how to get re‐elected after doing it”
Jean‐Claude Juncker – Former President of the Euro Group (January 2005 – January
2013)
& current Luxembourg Prime Minister. Quote November 2012.

Slide 25
Italy has overtaken Portugal and its Youth unemployment is where Greece was 2 years ago
€€
Source: www.zerohedge.com

Slide 26
The eurozone is also at a distinct advantage with its currency & outbreak of currency wars
Euro / Yen Exchange Rate
80
100
120
140
160
180
Mar-07 Nov-07 Jul-08 Mar-09 Nov-09 Jul-10 Mar-11 Nov-11 Jul-12 Mar-13
Yen per
Source: Bloomberg
€
Yen weakening / Euro strengthening
Yen strengthening / Euro weakening
Sterling / Euro Exchange Rate
1.1434
1.0
1.1
1.2
1.3
1.4
1.5
1.6
Mar-06 Mar-07 Mar-08 Mar-09 Mar-10 Mar-11 Mar-12 Mar-13
€
Source: Bloomberg
2009/10€1.13
2008/09€1.20
2007/08€1.41
2010/11€1.18
2011/12 €1.16 (86.3p)

Slide 27
German & South Korean brands have gained market share since 2007. But so too have brands built in the UK
Change (PP) in Market Share in EU New Car Sales* 2007-2012
-3 -2 -1 +0 +1 +2 +3
VolkswagenNissan
HyundaiAudi
KiaDaciaBMW
SkodaMini
Land RoverVolvo
MercedesChevrolet
Alfa RomeoSeat
PeugeotFord
CitroenSuzukiMazdaHonda
RenaultFiat
Opel (GM)Toyota
Percentage Point Change
Source: ACEA, *flags denote nationality of manufacturer
Land Rover, Mini & Nissan are built in the
UK so +ve for UK economy
Seat's dominance in Spanish market, & severe downturn in
Spain explains brands declining
market share

Slide 28
French & Italian brands losing significant market share in 2012 as their domestic economies battle recession
Change (PP) in Market Share in EU New Car Sales* 2011-2012
-1.5 -1.0 -0.5 +0.0 +0.5 +1.0
AudiHyundai
KiaVW
BMWSkoda
MercedesLand Rover
ToyotaChevrolet
NissanDaciaJeepMini
HondaJaguarLexus
GM (US)Lancia/Chrysler
SmartVolvo
MazdaSuzuki
SeatMitsubishi
Alfa RomeoCitroen
PeugeotFiat
FordOpel / Vauxhall
Renault
Percentage Point Change
Source: ACEA, *flags denote nationality of manufacturer
Jaguar, Land Rover, Mini & Nissan are built in the UK so +ve for
UK economy
French, Spanish (Seat German owned) & Italian brands suffering as their
domestic economies battle with recession
Slide 29Slide 29
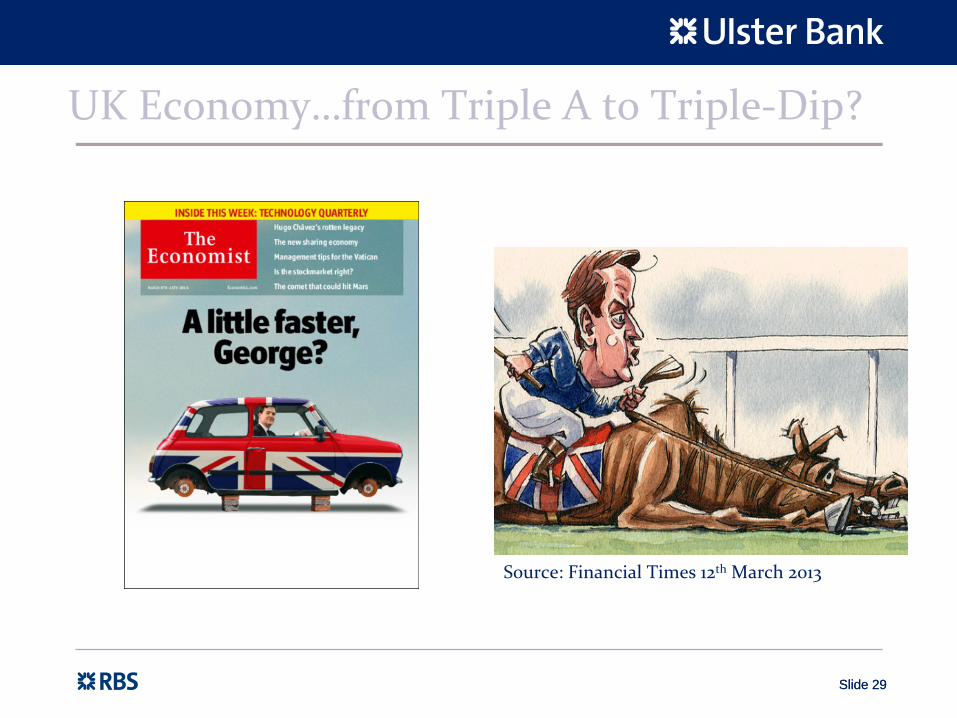
UK Economy…from Triple A to Triple‐Dip?
Source: Financial Times 12th
March 2013

Slide 30
UK composite PMI suggests Q1 2013 GDP growth will be marginal at best
UK GDP versus UK Composite PMI
25
30
35
40
45
50
55
60
65
2007 Q1 2008 Q1 2009 Q1 2010 Q1 2011 Q1 2012 Q1 2013 Q1*
PMI Index
-2.5
-2
-1.5
-1
-0.5
0
0.5
1
1.5GDP Q/Q
GDP Q/Q PMI PMI No Change
Source: ONS & Markit Economics, * refers to January & February
Slide 31
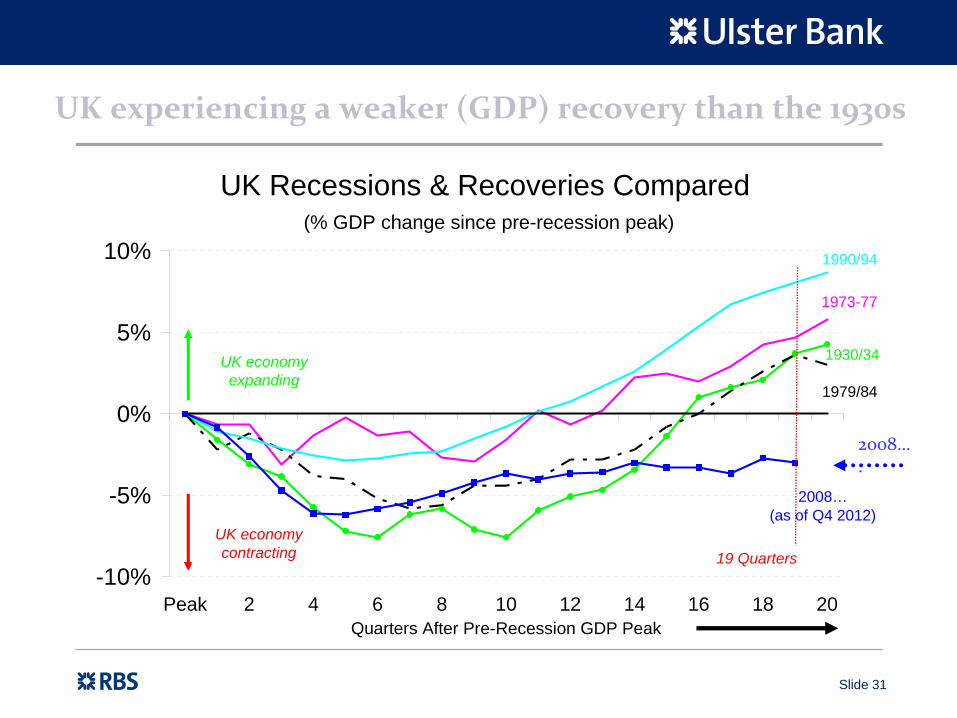
UK experiencing a weaker (GDP) recovery than the 1930s
UK Recessions & Recoveries Compared (% GDP change since pre-recession peak)
1930/34
1973-77
1979/84
1990/94
2008… (as of Q4 2012)
-10%
-5%
0%
5%
10%
Peak 2 4 6 8 10 12 14 16 18 20Quarters After Pre-Recession GDP Peak
UK economy contracting 19 Quarters
UK economy expanding
2008…
.

Slide 32
A lack of a consumer recovery explains the UK’s poor performance…
UK GDP by Expenditure Category(% Change Since Pre-Recession Peak Q1 2008)
-3.6%
+0.8%
+4.7%
-12%-10%-8%-6%-4%-2%0%2%4%6%8%
0 1 2 3 4 5 6 7 8 9 10 11 12 13 14 15 16 17 18 19Time in Quarters, Pre-Recession GDP Peak = 0
Household Final ConsumptionExports (Goods & Services)General Government Consumption Expenditure
Slide 33
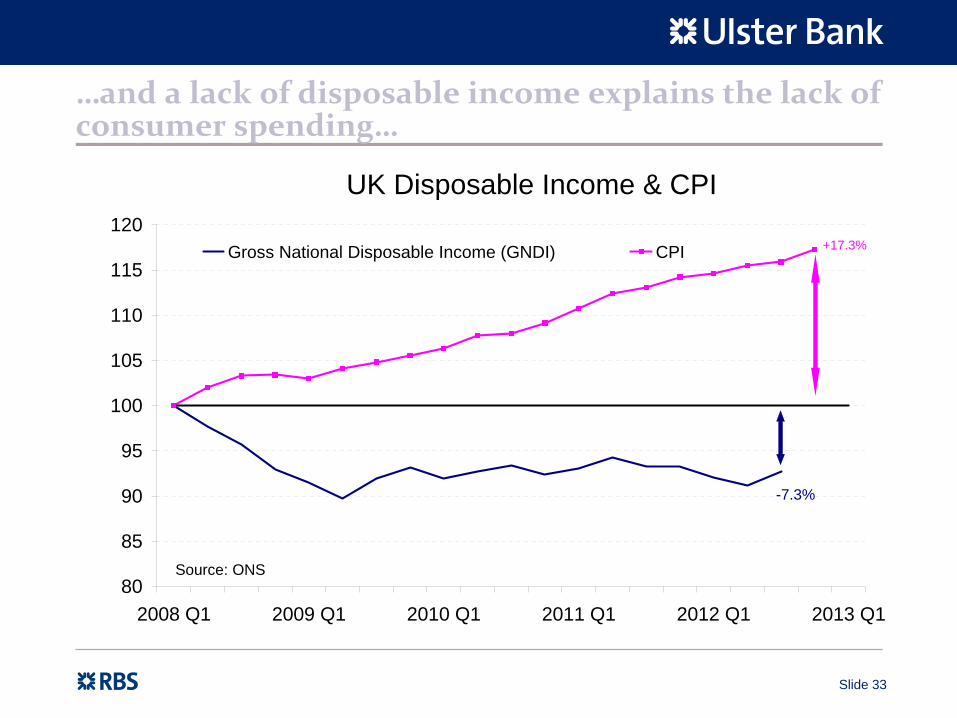
…and a lack of disposable income explains the lack of consumer spending…
UK Disposable Income & CPI
-7.3%
+17.3%
80
85
90
95
100
105
110
115
120
2008 Q1 2009 Q1 2010 Q1 2011 Q1 2012 Q1 2013 Q1
Gross National Disposable Income (GNDI) CPI
Source: ONS

Slide 34
With inflation set to go higher, UK consumer likely to remain on strike…UK CPI (annual average) above 2% for 10 years!!
CPI inflation projection based on market interest rate expectations & £375 billion asset purchases
3 years of an overshoot
Source: BoE QIR February 2013
CPI inflation projection based on market interest rate expectations & £375 billion asset purchases
3 years of an overshoot
Source: BoE QIR February 2013
CPI inflation projection based on market interest rate expectations & £375 billion asset purchases
3 years of an overshoot
Source: BoE QIR February 2013

Slide 35
Weak sterling good for exports but UK struggling from weak demand in core export markets
UK Exports of Goods*
12% below pre-downturn high
44% above 2009 low & 22% below
pre-downturn level
80
90
100
110
120
130
140
2006 Q4 2007 Q4 2008 Q4 2009 Q4 2010 Q4 2011 Q4 2012 Q4
Index 2009 = 100
EU Non-EU Total
Source: ONS,Excludes Oil & Erratics

Slide 36
Contrast UK performance with the RoI. Consumer downturn not as bad but export recovery not as good…
RoI GNP by Expenditure Category(% Change Since Pre-Recession GNP Peak Q1 2007)
-6.3%
+9.8%
-18%
-25%
-20%
-15%
-10%
-5%
0%
5%
10%
0 2 4 6 8 10 12 14 16 18 20
22
Time in Quarters, Pre-Recession GDP Peak = 0
Personal Consumption ExpenditureExports (Goods & Services)General Government Consumption Expenditure

Slide 37
Ireland is a small & extremely open economy…
Ireland UK Germany US Port Greece Spain
Consumption 53 66 58 71 68 70 57Govt Spending 17 23 20 20 21 20 21Investment 12 15 17 12 19 16 24Exports 101 29 49 13 33 21 23Imports 82 33 43 17 41 27 26GDP 100 100 100 100 100 100 100
GDP Breakdown, % of Total

Slide 38Slide 38
UK loses ‘Triple‐A’
rating….So what?
10-Yr Government Bond Yields
0
1
2
3
4
5
6
Mar-10 Sep-10 Mar-11 Sep-11 Mar-12 Sep-12 Mar-13
Interest Rate %
Reflects the cost (interest rate) of Government borrowing
Source:Bloomberg
Moody's downgrade

Slide 39
UK recovery more evident within the labour market
UK Workforce Jobs
31.945
32.083
30.8
31
31.2
31.4
31.6
31.8
32
32.2
Sep-05 Sep-06 Sep-07 Sep-08 Sep-09 Sep-10 Sep-11 Sep-12
Millions
Source: ONS
After 2.6% PTT fall employment
0.4% below peak
UK, NI & RoI Unemployment Rates
NI & UK 7.8%
14.1%
3%
5%
7%
9%
11%
13%
15%
Jan-97 Jan-99 Jan-01 Jan-03 Jan-05 Jan-07 Jan-09 Jan-11 Jan-13
NI UK RoI
Source: ONS, Labour Force Survey & CSO Live Register
Slide 40Slide 40
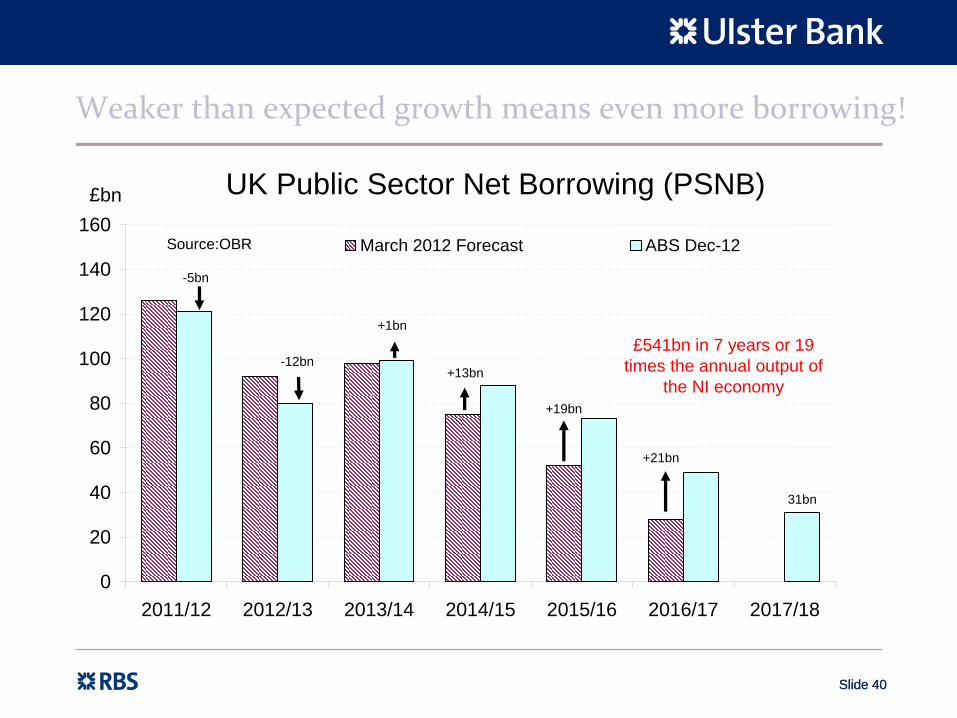
Weaker than expected growth means even more borrowing!
UK Public Sector Net Borrowing (PSNB)
31bn
+21bn
+19bn
+13bn
+1bn
-12bn
-5bn
0
20
40
60
80
100
120
140
160
2011/12 2012/13 2013/14 2014/15 2015/16 2016/17 2017/18
£bn
March 2012 Forecast ABS Dec-12Source:OBR
£541bn in 7 years or 19 times the annual output of
the NI economy

Slide 41Slide 41
Almost £170bn more than what UK Government first expected
UK Public Sector Net Borrowing (PSNB)
+5bn
-9bn
+39bn
+51bn
+28bn+53bn
0
20
40
60
80
100
120
140
160
2011/12 2012/13 2013/14 2014/15 2015/16 2016/17 2017/18
£bn
June 2010 Forecast ABS Dec-12Source:OBR
£169bn additional borrowing required over 6 years or £198bn over 7 years
Slide 42Slide 42
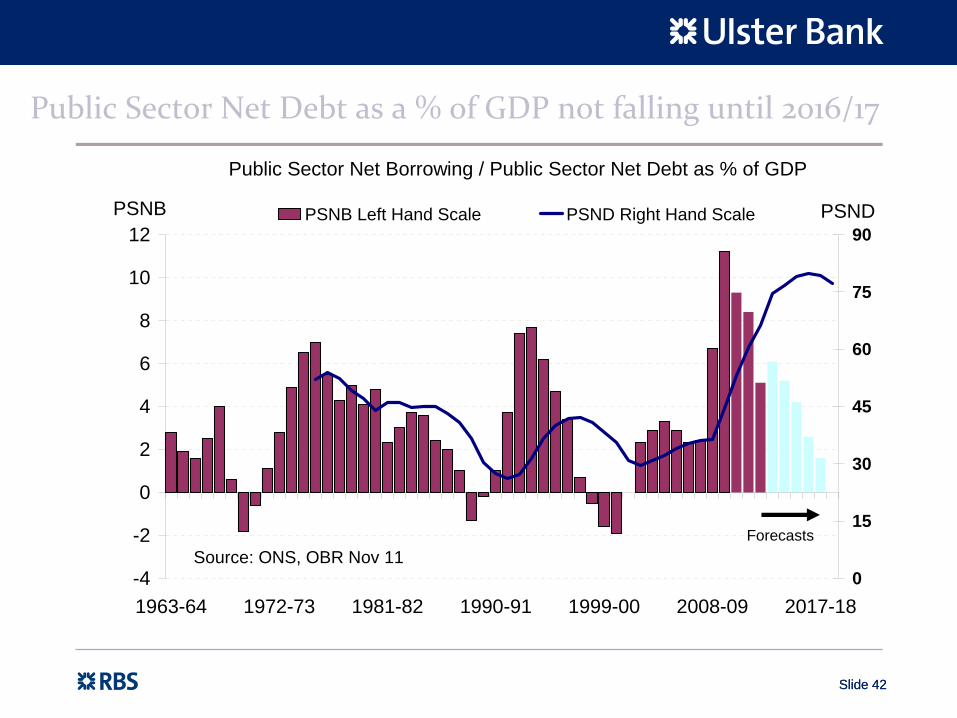
Public Sector Net Debt as a % of GDP not falling until 2016/17
Public Sector Net Borrowing / Public Sector Net Debt as % of GDP
-4
-2
0
2
4
6
8
10
12
1963-64 1972-73 1981-82 1990-91 1999-00 2008-09 2017-18
PSNB
0
15
30
45
60
75
90PSNDPSNB Left Hand Scale PSND Right Hand Scale
ForecastsSource: ONS, OBR Nov 11

Slide 43Slide 43
Meanwhile 12‐yr public spending feast followed by 7‐year famine
UK Public Spending Growth in Real Terms (excluding Debt Interest & Social Security)
-10%
-5%
0%
5%
10%
15%
1951-52 1962-63 1973-74 1984-85 1995-96 2006-07 2017-18
Y/Y
Source: IFS February 2013
We are here
17% cut in 7yrs over 60% of Departmental cuts have been made

Slide 44Slide 44
And how is the Northern Ireland economy doing….

N.Ireland downturn by numbers 10 Facts1.
Unemployment (claimant count) up 41,500 (Jan 2013)
2.
Workforce jobs have fallen by almost 55,000 in 4 yrs to June 2012
3.
Personal insolvencies have doubled since 2007 & still rising
4.
Corporate insolvencies have doubled since 2007 & still rising
5.
House prices down 56% from peak (by Q4 2012)
6.
House completions down 66% from 2006 peak & still falling
7.
Mortgages for home movers at lowest level since 1974
8.
Almost 1 in 4 retail outlets are vacant in Belfast
9.
New car sales have fallen by one third relative to 2007
10.
Consumer prices (UK CPI) up 19% since August 2007
Slide 46Slide 46
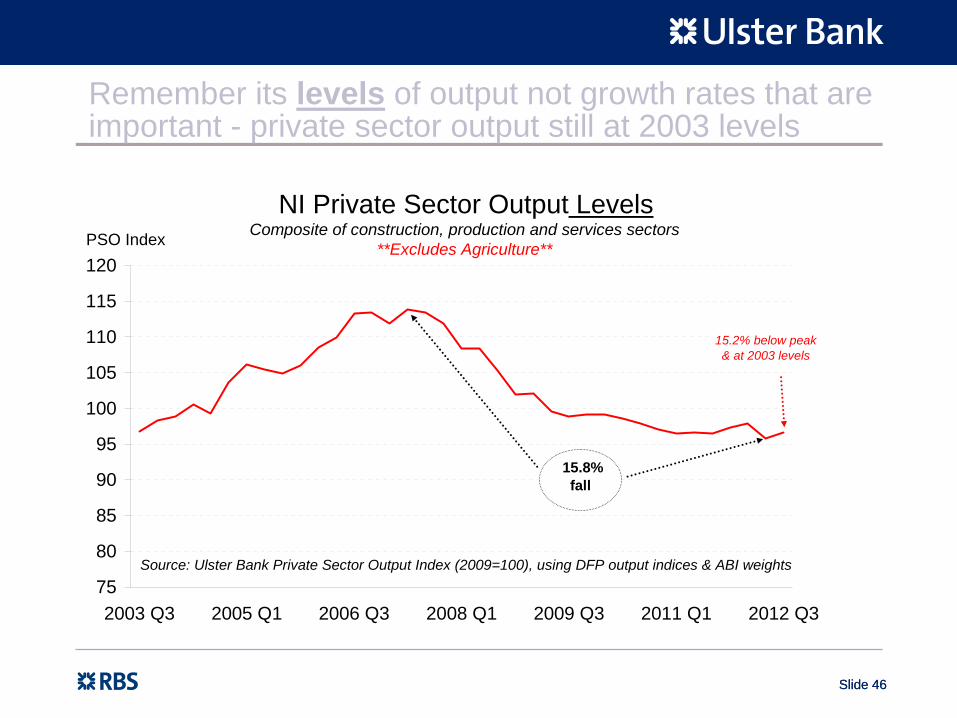
Remember its levels of output not growth rates that are important - private sector output still at 2003 levels
NI Private Sector Output LevelsComposite of construction, production and services sectors
**Excludes Agriculture**
75
80
85
90
95
100
105
110
115
120
2003 Q3 2005 Q1 2006 Q3 2008 Q1 2009 Q3 2011 Q1 2012 Q3
PSO Index
Source: Ulster Bank Private Sector Output Index (2009=100), using DFP output indices & ABI weights
15.8%fall
15.2% below peak & at 2003 levels

Slide 47
Services sector output has now been below its pre- downturn peak for 24 quarters or 6 years
NI Private Sector Output Relative to Pre-Recession PeaksAs of Q3 2012 (Peak = 0)
-15.2%
-11.8%-13.6%
-42.3%
-50%
-40%
-30%
-20%
-10%
0%
10%
0 2 4 6 8 10 12 14 16 18 20 22 24Time in Quarters Since Pre-Recession Output Peak
Total Private Sector Output Private Sector Services Industrial Production Construction

Slide 48
‘Winners’ during the downturn…
Slide 48
Industrial Group % Change
Recession Winners ↑↑↑
Other Services 50.0%
Chemicals & Pharmaceutical Products 26.8%
Utilities (Electricity & Gas) 10.1%
Transport, Storage & Communications 7.3%
Food, Drink & Tobacco 5.8%
Wholesale & Retail Distribution, Accommodation & Food Service 1.2%
Agriculture (Gross annual output in real terms 2007‐11) 0.5%
Source: DFP Indices of Production, Services and Construction, DARD & Ulster Bank calculations
Change in NI Private Sector OutputQ2 2007 ‐ Q3 2012
Slide 49
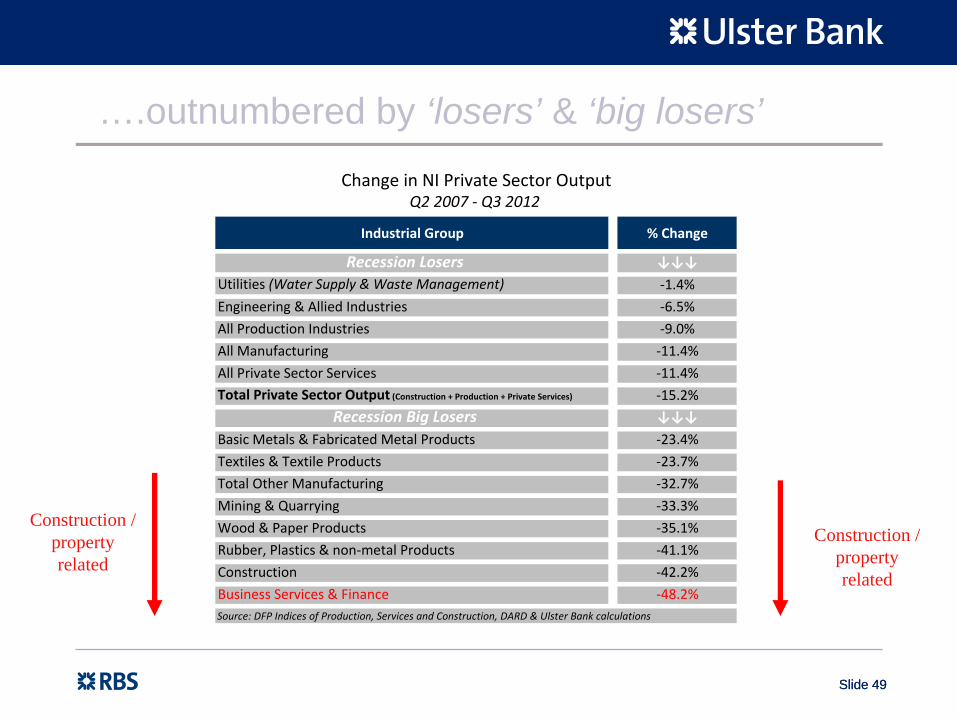
….outnumbered by ‘losers’ & ‘big losers’
Slide 49
Construction / property related
Construction / property related
Industrial Group % Change
Recession Losers ↓↓↓Utilities (Water Supply & Waste Management) ‐1.4%
Engineering & Allied Industries ‐6.5%
All Production Industries ‐9.0%
All Manufacturing ‐11.4%
All Private Sector Services ‐11.4%Total Private Sector Output (Construction + Production + Private Services) ‐15.2%
Recession Big Losers ↓↓↓
Basic Metals & Fabricated Metal Products ‐23.4%
Textiles & Textile Products ‐23.7%
Total Other Manufacturing ‐32.7%
Mining & Quarrying ‐33.3%
Wood & Paper Products ‐35.1%
Rubber, Plastics & non‐metal Products ‐41.1%
Construction ‐42.2%
Business Services & Finance ‐48.2%Source: DFP Indices of Production, Services and Construction, DARD & Ulster Bank calculations
Change in NI Private Sector OutputQ2 2007 ‐ Q3 2012

Slide 50Slide 50
Recent investments in 2011/12 – dominated by ‘the worst performing sector’
business services & finance
Source: Invest NI
Jobs Areas
501 IT Development, FX securities/settlement, Legal & Compliance
106 Marketing
317 HR, Finance, Legal
359 FS IT Development, Service Delivery, Project Management
90 FS IT Development, Project Management
242 R&D Product Development, Sales, Marketing
45 HR Consulting, Risk and Actuarial – Pensions management
50 IT Development
104 IT Development, Product Development, Engineering
85 IT Development, Project Management
297 Call Centre, Customer Service and Management
109 IT Development, Product Development, Sales
130 R&D Product Development, Engineering
102 Legal
In the last 10 years
78% of new FDI jobs
have been in
business & financial
services and
software
Slide 51
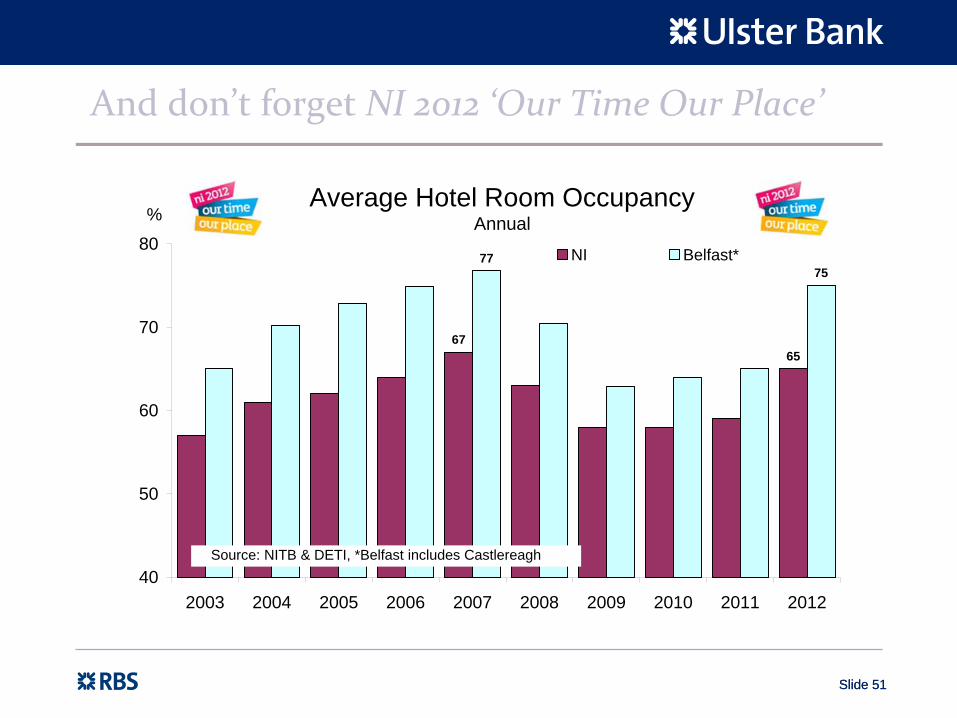
And don’t forget NI 2012 ‘Our Time Our Place’
Slide 51
Average Hotel Room Occupancy Annual
6765
7775
40
50
60
70
80
2003 2004 2005 2006 2007 2008 2009 2010 2011 2012
%
NI Belfast*
Source: NITB & DETI, *Belfast includes Castlereagh

Slide 52
UK workforce jobs are just 0.5% below their June 2008 peak whereas NI has not recouped any of its job losses
NI & UK Workforce Jobs (as of June 2012)
-7%
-6%
-5%
-4%
-3%
-2%
-1%
0%
1%
2%
3%
June 2008 Peak to Trough Recovery from Trough Net Position Relative toJune 2008 Peak
NI UK
Source: DFP & NOMIS, June annual figures

Slide 53
Apart from manufacturing, NI’s job losses have been more severe than in the UK
Employee Jobs Q3 2012 relative to recent peaks
-40%
-35%
-30%
-25%
-20%
-15%
-10%
-5%
0%
Construction Manufacturing Services Total
NI UK NI Peak Q4 2007
NI Peak Q2 2007
NI Peak Q2 2008 NI Peak Q2 2008
Source: DFP & NOMIS

Slide 54
No meaningful jobs recovery outside of manufacturing
Northern Ireland Employment (Employee Jobs)
-40%
-30%
-20%
-10%
0%
10%
All Sectors Services Manufacturing Construction
Peak to Trough Recovery from Trough Q3 2012 Relative to Peak
Source: DFP, QES

Slide 55
Demand in NI remains weak in 2013 but pace of decline has eased…
Private Sector Business Activity - PMIs
30
35
40
45
50
55
60
65
Feb-04 Aug-05 Feb-07 Aug-08 Feb-10 Aug-11 Feb-13
NI UK RoI
Source: Markit & Ulster Bank NI PMI: 50 = threshold between expansion / contraction
Expansion
Contraction
**PMI Surveys Exclude Agriculture & Public Sector**

Slide 56
… lack of demand still a problem for jobs
NI PMI - Employment Index 3 month moving average
25
30
35
40
45
50
55
60
65
Feb-04 Feb-05 Feb-06 Feb-07 Feb-08 Feb-09 Feb-10 Feb-11 Feb-12 Feb-13
Manufacturing Services Construction
Source: Markit Economics & Ulster Bank NI PMI
Job Gains
Job Losses

Slide 57
NI enjoyed Southern Comfort through the Celtic Tiger years
WealthTrade Tourism Investment WealthWealthTradeTrade TourismTourism InvestmentInvestment

Slide 58
Eurozone’s
fastest growing economy was on NI’s doorstep. But what went up ……
•
ISEQ +101% & +231% (5yr/10yr prior to Feb‐2007 peak)
•
House Completions +68% / +162% (5yr/10yr prior to 2006 peak)
•
Unemployment rate 4.6%
(average 1998‐2007)
& 33% rise in employment
(Q3 1998 – Q3 2007)
•
Annual GDP growth 6.7% (1998‐2007; averaged 5% 2002‐2007)
•
House prices +269% (10 years prior to Sep‐2007 peak)
•
NI manufacturing exports to RoI +81% (6 years to 2007/08)

Slide 59
TradeTourism Wealth
InvestmentTradeTrade
TourismTourism WealthWealthInvestmentInvestment
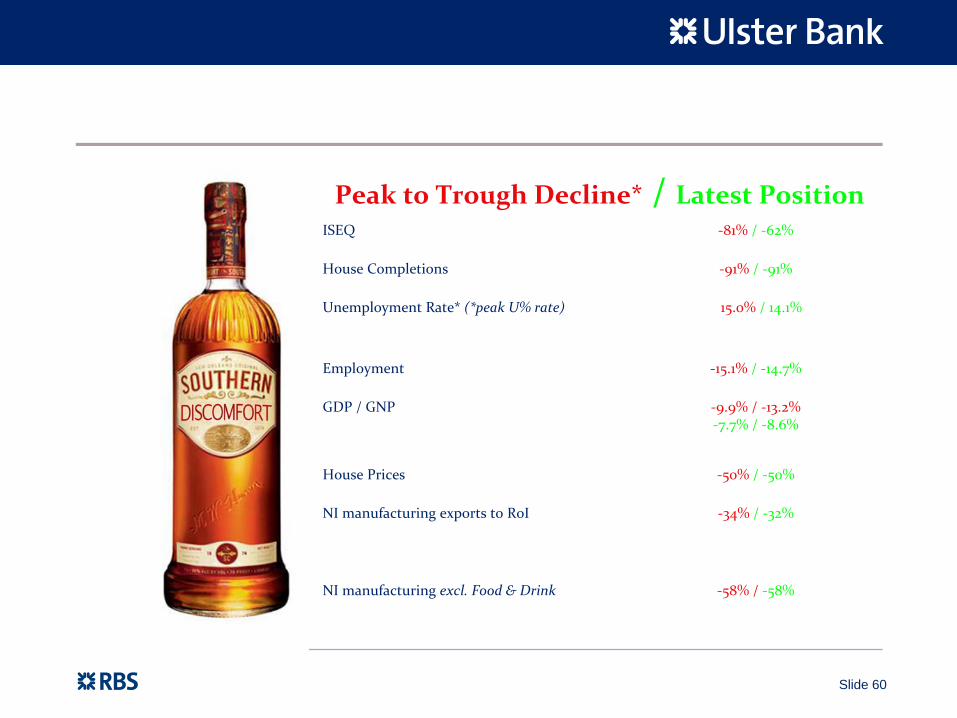
Slide 60
ISEQ ‐81% / ‐62%
House Completions ‐91% / ‐91%
Unemployment Rate* (*peak U% rate) 15.0% / 14.1%
Employment ‐15.1% / ‐14.7%
GDP / GNP ‐9.9% / ‐13.2%
‐7.7% / ‐8.6%
House Prices ‐50% / ‐50%
NI manufacturing exports to RoI ‐34% / ‐32%
NI manufacturing excl. Food & Drink ‐58% / ‐58%
Peak to Trough Decline*
/ Latest Position

Slide 61
Inflationary Pressures & Declining Disposable Incomes
Challenge
Slide 62
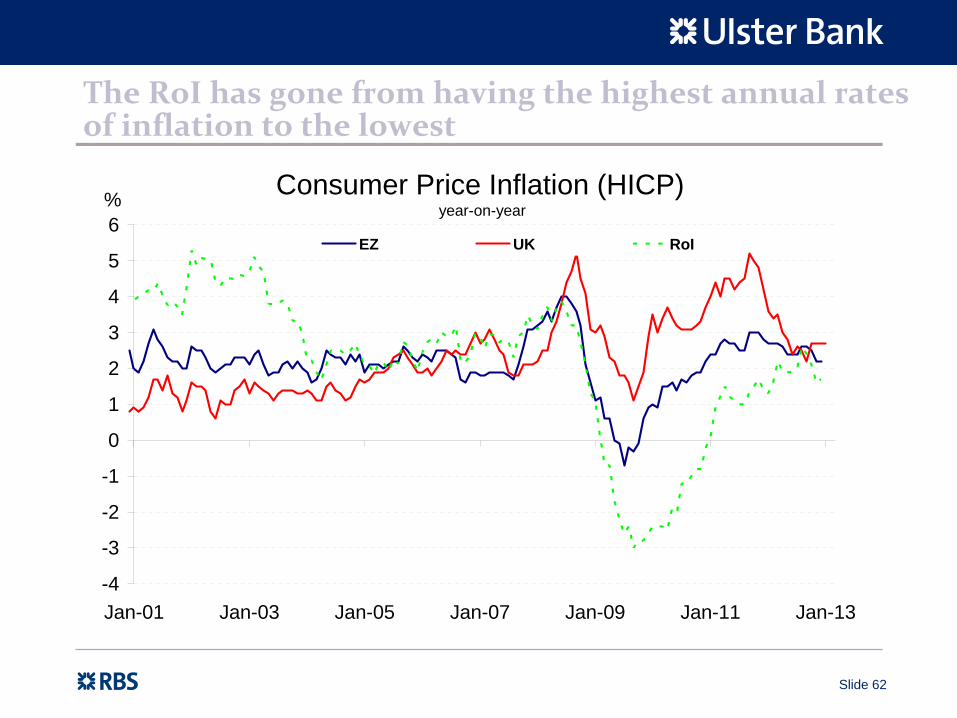
The RoI has gone from having the highest annual rates of inflation to the lowest
Consumer Price Inflation (HICP) year-on-year
-4
-3
-2
-1
0
1
2
3
4
5
6
Jan-01 Jan-03 Jan-05 Jan-07 Jan-09 Jan-11 Jan-13
%
EZ UK RoI

Slide 63
Ireland has become the poster child of low inflation with the UK experiencing the highest rises outside of Eastern Europe
EU-27 Cumulative % Rise in Consumer Prices (HICP) August 2007 to December 2012 / January 2013*
0% 5% 10% 15% 20% 25% 30% 35% 40%
Romania Hungary
Lithuania Estonia
Latvia Bulgaria Poland
UK Greece Finland
Slovakia Italy
Slovenia Cyprus
LuxembourgEU 27 Spain
Belgium Czech Republic
Austria Denmark
MaltaNetherlands
SwedenEZ
Portugal France
Germany Ireland
Source: ONS, CSO, *January 2013 only for EZ & UK, all others December
€
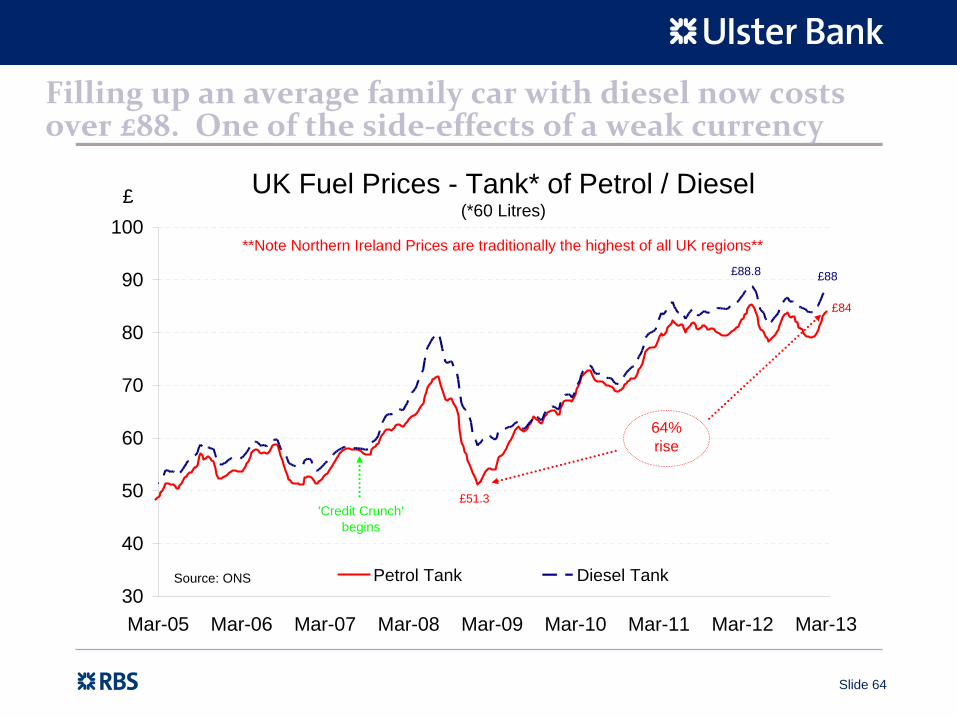
Slide 64
Filling up an average family car with diesel now costs over £88. One of the side‐effects of a weak currency
UK Fuel Prices - Tank* of Petrol / Diesel (*60 Litres)
£51.3
£84
£88.8 £88
30
40
50
60
70
80
90
100
Mar-05 Mar-06 Mar-07 Mar-08 Mar-09 Mar-10 Mar-11 Mar-12 Mar-13
£
Petrol Tank Diesel Tank
64% rise
Source: ONS
**Note Northern Ireland Prices are traditionally the highest of all UK regions**
'Credit Crunch' begins

Slide 65
Drinking, smoking & eating have become expensive pastimes particularly after duty rises – past, present & future
UK v RoI Cumulative % Change in Consumer Prices since 'Credit Crunch' began (Aug 2007 to January 2013)
18.8%
0%
10%
20%
30%
40%
50%
60%
Food & Non-Alcoholic
Beverages
Food ElectricityGas & Other
Fuels
TransportFuels &
Lubricants
TransportServices
All CPI
UK RoISource: ONS & Eurostat

Slide 66
EU 27 Cumulative % Rise in Food & Drink Prices August 2007 to December 2012 (HICP)
0% 5% 10% 15% 20% 25% 30% 35% 40%
HungaryUK
MaltaLatvia
LithuaniaEstonia
RomaniaPoland
BulgariaFinland
Czech RepublicSloveniaDenmark
CyprusSlovakia
AustriaBelgium
EU 27Luxembourg
SwedenGermany
NetherlandsItalyEZ
GreeceFranceSpain
PortugalIreland Source: ONS, CSO & Eurostat
€
After Hungary, the UK has posted the largest rise in food & drink prices (& the RoI the least)
within the EU‐27 since Aug‐07
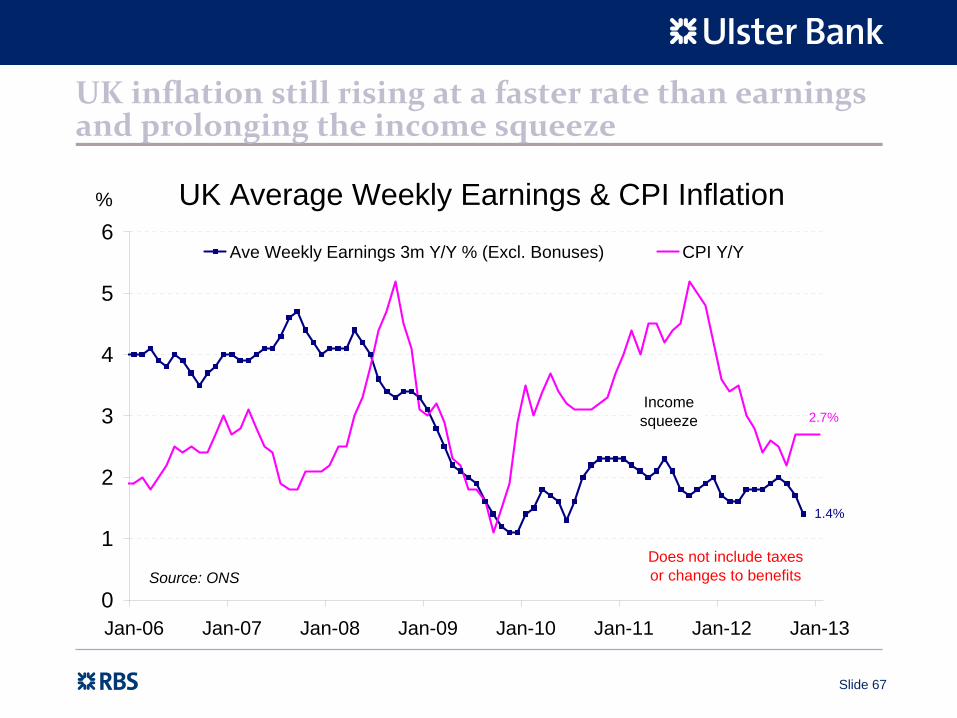
Slide 67
UK inflation still rising at a faster rate than earnings and prolonging the income squeeze
UK Average Weekly Earnings & CPI Inflation
1.4%
2.7%
0
1
2
3
4
5
6
Jan-06 Jan-07 Jan-08 Jan-09 Jan-10 Jan-11 Jan-12 Jan-13
%
Ave Weekly Earnings 3m Y/Y % (Excl. Bonuses) CPI Y/Y
Source: ONS
Income squeeze
Does not include taxes or changes to benefits

Slide 68
Discretionary spending hit with consumer confidence also very weak…
21,200 fewer NI new car sales relative to 2007 peak 12 Month Rolling Sum
57,170
47,580 47,532
68,708
30,000
40,000
50,000
60,000
70,000
80,000
Feb-07 Feb-08 Feb-09 Feb-10 Feb-11 Feb-12 Feb-13
Sales now 31% below
peak
Source: SMMT
Temporary reduction in VAT rate to 15% & 'Cash for Clunkers'

Slide 69
….. following rise in dole queue & job insecurity
Slide 69
NI Unemployment Claimant Count Levels
0
20,000
40,000
60,000
80,000
100,000
120,000
140,000
Dec-85 Dec-88 Dec-91 Dec-94 Dec-97 Dec-00 Dec-03 Dec-06 Dec-09 Dec-12
Source: DFP
Dec 2012 65,200 highest levels
since April 1997
Record low Aug 0723,500
Good Friday Agreement signed
April 199857,900

Slide 70
NI has posted steepest decline in UK but new car sales in RoI remain 60% below peak…
New Car RegistrationsIndexed 2007 =100
-31%
-8.5%
-18%-14%
-60%
0
20
40
60
80
100
120
Dec-07 Sep-08 Jun-09 Mar-10 Dec-10 Sep-11 Jun-12 Mar-13
NI Scotland Wales UK RoI
Source: SMMT & SIMI

Slide 71
Kia car sales more than treble, Hyundai up 58% & Skoda up 13%. All post new record sales in 2012
Growth in NI New Car Registrations by Manufacturer 2007-2012
0% 50% 100% 150% 200% 250%
Kia
Hyundai
Chevrolet
Nissan
Skoda Source: SMMT

Slide 72
Brands gaining NI market share 2007‐2012
Cool? Seriously
Cool? Sub‐Zero?
Value for Money?
Slide 73
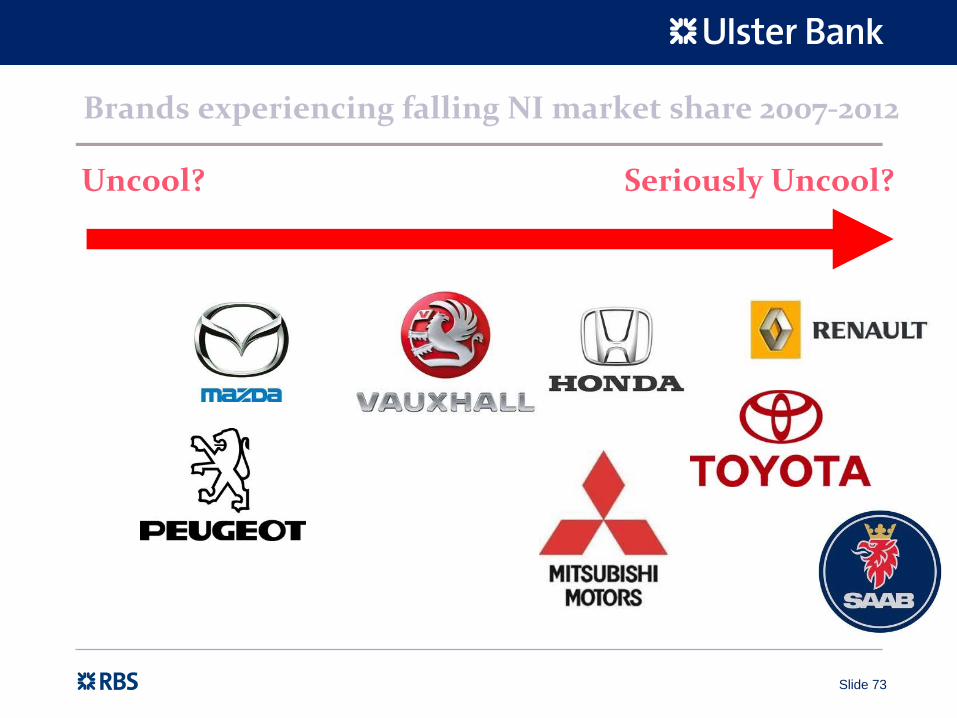
Brands experiencing falling NI market share 2007‐2012
Uncool? Seriously Uncool?
Slide 74
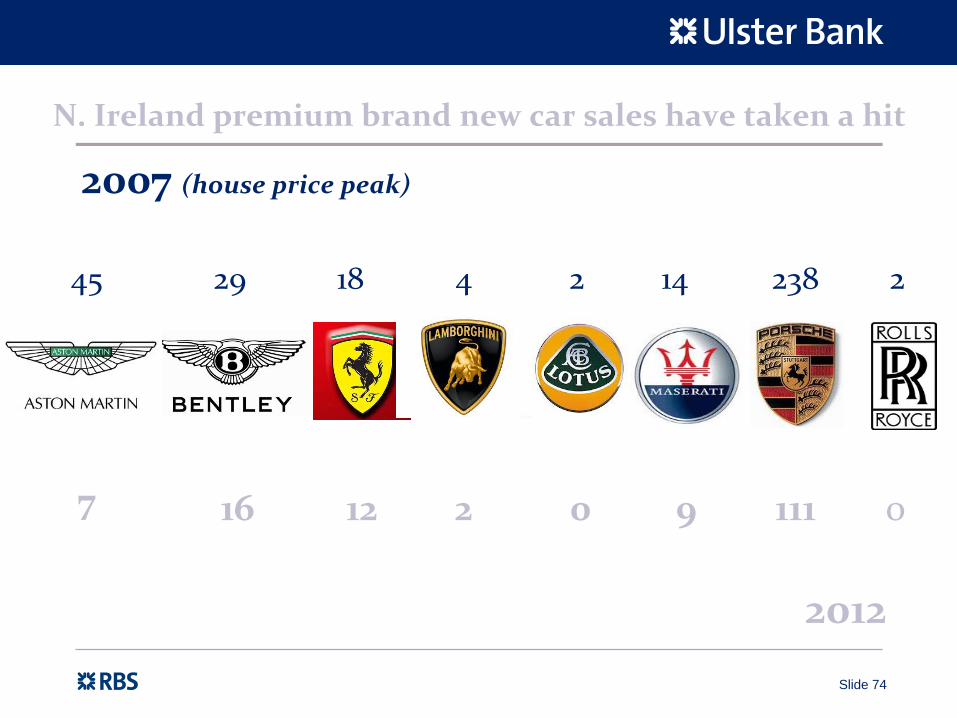
N. Ireland premium brand new car sales have taken a hit
2007 (house price peak)
2012
12
45
02 11190
29 218 4 2 14 238
167


Slide 76
UK high street hit by changing consumer trends
UK Internet Sales as a % of Total Retail Sales* Not Seasonally Adjusted
10.4%
0
2
4
6
8
10
12
2006 Q4 2007 Q4 2008 Q4 2009 Q4 2010 Q4 2011 Q4 2012 Q4
%
Source: ONS, * Excluding Automotive Fuel

Slide 77
The Changing Face of the UK High Street 2012
Winners Payday Loans +20.0%
Pawnbrokers +13.2%
Poundshops +13.0%
Supermarkets +3.6%
Coffee Shops +3.4%
Betting Shops +3.3%
Charity Shops +2.7%
Losers
Net change in units in 2012. Source: Local Data Company
Computer Games ‐45.0%
Health Food ‐24.7%
Card Shops ‐23.4%
Recruitment ‐15.1%
General Clothes ‐8.7%
Women’s Clothes ‐7.2%
Banks / Financial ‐2.9%

Slide 78
Input cost inflation eases in February (but up over last 3 months)
with output prices and charges still falling
NI Private Sector Profit Squeeze3 Month Moving Average
30
40
50
60
70
80
Feb-04 Aug-05 Feb-07 Aug-08 Feb-10 Aug-11 Feb-13
Output Prices Input Prices No Change
InflationD
eflation
Source: Markit Economics & Ulster Bank NI PMI
Profits squeeze
Price of goods & services falling

Slide 79
Unemployment a major problem within the <25s
Slide 79
NI Youth Claimant Count Levels<25 years of age
17,876
Nov 07 low 7,050
0
5,000
10,000
15,000
20,000
25,000
Nov-96 Nov-98 Nov-00 Nov-02 Nov-04 Nov-06 Nov-08 Nov-10 Nov-12
Source: DFP
19,551 Highest level since October
1996
GFAApril 1998
14,145

Slide 80
Public sector employment boom has been & gone. A sustained period of job losses is anticipated going forward
NI Public Sector Employee Jobs Levels
213,480
Pre-recession peak Q4 2005221,050
Good Friday Agreement Signed April 1998
195,120 Q2 98209,480
180,000
190,000
200,000
210,000
220,000
230,000
Q3 1994 Q3 1997 Q3 2000 Q3 2003 Q3 2006 Q3 2009 Q3 2012
Public Unadjusted Public Adjusted* (excl. financial institutions)
Source: DFP, * UB estimates
Public sector employment boosted by @5k in Q4 2008 as
part-nationalised financial institutions reclassified as
public sector. Public sector jobs (excl. financial institutions) now estimated at @209.5k or
Q4 2002 levels.
+26,000 jobs (13%) in 7yrs
post GFA

Slide 81
Decade
ahead will HURT
Downside risks to NI growth (EZ crisis linked to EZ politics)
Unemployment to stay higher for longer…. a lost decade for the under 25’s?
Households face devaluation in S.O.L, debt de-leverage
Factors present in ‘NICE’ era have gone into reverse - Next decade ahead will HURT – Higher Unemployment Rising Taxes / Tariffs
Fiscal austerity in NI – it hasn’t really started yet!
Key labour market trends: part-time v full-time, working longer, multi-job careers v job for life, demand for jobs with no skills falling
Slide 82Slide 82
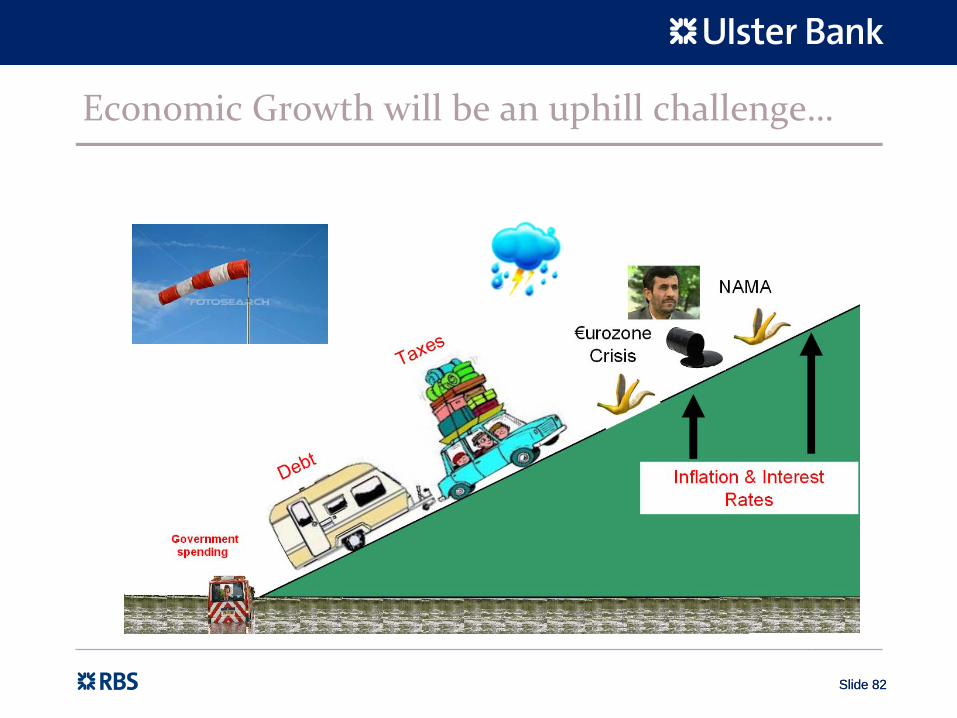
Economic Growth will be an uphill challenge…
Source:
The Economist

Slide 83Slide 83
…with a ‘spreadsheet recovery’
Source:
The Economist
Computer says Yes. But consumer says No!

Slide 84Slide 84
In UK & NI we too face the ‘Juncker Conundrum’
“We all know what we need to do, we just don’t know how to get re‐elected after doing it”
Jean‐Claude Juncker – Former President of the Euro Group (January 2005 – January
2013)
& current Luxembourg Prime Minister. Quote November 2012.

Slide 85
Any Questions
?

Slide 86Slide 86
But NI is still better when I left school!
Laganside
1994 Source: Invest NI

Slide 87Slide 87
Laganside today
Source: Invest NI
Titanic QuarterTitanic Quarter

Slide 88
Website
www.ulsterbankcapitalmarkets.comContact me (to be added to distribution lists)
Tel .no. 02890 276354

Slide 89Slide 89
DisclaimerThis document is issued for information purposes only for clients of Ulster Bank Group who are eligible counterparties or professional customers, and does not constitute an offer or invitation to purchase or sell any instrument or to provide any service in any jurisdiction where the required authorisation is not held. Ulster Bank and/or its associates and/or its employees may have a position or engage in transactions in any of the instruments mentioned.
The information including any opinions expressed and the pricing given, is indicative, and constitute our judgement at time of publication and are subject to change without notice. The information contained herein should not be construed as advice, and is not intended to be construed as such. This publication provides only a brief review of the complex issues discussed and readers should not rely on information contained here without seeking specific advice on matters that concern them. Ulster Bank make no representations or warranties with respect to the information and disclaim all liability for use the recipient or their advisors make of the information. Over-the-counter (OTC) derivates can involve a number of significant and complex risks which are dependent on the terms of the particular transaction and your circumstances. In the event the market has moved against the transaction you have undertaken, you may incur substantial costs if you wish to close out your position.
Ulster Bank Limited Registered Number R733 Northern Ireland. Registered Office 11-16 Donegal Square East, Belfast, BT1 5UB. Authorised and regulated by the Financial Services Authority. Member of The Royal Bank of Scotland Group.
Ulster Bank Ireland Limited, a private company limited by shares, trading as Ulster Bank, Ulster Bank Group and Bank Uladh. Registered No. 25766. Registered Office Ulster Bank Group Centre, George’s Quay, Dublin 2. Ulster Bank Ireland Limited is regulated by the Financial Regulator. Member of The Royal Bank of Scotland Group.
Calls may be recorded.