cvd jsna - kingston datadata.kingston.gov.uk/wp-content/uploads/2017/09/jsna_cvd...history of cvd....
TRANSCRIPT

1
CVD JSNA May 2016
Overview Cardiovascular Diseases (CVD) is an overarching term that describes a family of diseases (including stroke,
heart attack and peripheral vascular disease) sharing a common set of risk factors. CVD is the biggest killer
in England, and stroke is the largest single cause of adult disability.
Lifestyle and behavioural risk factors (such as smoking, physical inactivity, poor diet and obesity) reflect an
individual’s circumstances and choices. There are also a number of risk factors for CVD which are not
dependant on how people behave but on biological and social aspects of their lives, such as age, sex,
ethnicity and deprivation. In addition, physical risk factors (including hypertension) reflect changes to body
systems that are also reversible or preventable in their early stages but may require medical treatment.
The gap between the expected number of people with CVD, based on research and the prevalence rates
recorded by GP practices suggest that large number of patients with CVD are undiagnosed. The NHS Health
Check programme is a major opportunity to diagnose CVD and encourage participants to improve their
lifestyles and hence the years they live in good health. Stratification of CVD risk for the purposes of
therapeutic intervention is a key component of the NHS Health Check.
Better management of cardiovascular conditions in primary care has a significant influence on the usage of
secondary care. The admission rates for both Coronary Heart Disease (CHD) and heart failure in Kingston
Clinical Commissioning Group (CCG) have declined over the last decade whilst the admission rates for stroke
have increased during the same time period. The emergency admission rates for CHD, Stroke and heart
failure in Kingston (persons of all ages) were lower than the regional and national averages. The emergency
admission rates for cardiovascular conditions were significantly higher for those living in the most deprived
areas of Kingston compared to the least deprived.
Deprivation and social class are key risk factors for CVD mortality and as a result CVD is the main contributor
to the health inequalities between the most and least deprived communities. There are also gender
inequalities with women being particularly at a high risk of stroke. The rates of premature and preventable
CVD mortality are declining for both men and women and the decline in women’s mortality rates is larger
than that of men.
The National Service Frameworks for CHD, diabetes and Chronic Kidney Disease (CKD), the Stroke Strategy
and NICE quality standards have all driven significant progress in tackling cardiovascular diseases in recent
years. The Department of Health published a Cardiovascular Disease Outcomes Strategy in 2013. This
evidence based strategy should form the basis of CCG plans for effective CVD care.

2
Introduction
Cardiovascular disease (CVD) affects the lives of millions of people and is one of the largest causes of death
and disability in the UK. Huge improvements have been made in the prevention and treatment of CVD over
the last decade, with a 40% reduction in the under 75 mortality rates between 2001 and 2010. Over the same
period, the difference in the under 75 mortality rates between the most and least deprived areas in England
has narrowed1.
CVD is a common condition caused by atherosclerosis (furring or stiffening of the walls of arteries). Although
CVD may manifest itself differently in individual patients, in practice it represents a single family of diseases
and conditions linked by common risk factors and the direct effect they have on mortality and morbidity.
These include coronary heart disease (CHD), stroke, hypertension, hypercholesterolemia, diabetes, chronic
kidney disease (CKD), peripheral arterial disease (PAD) and vascular dementia1. In 2012, for the first time
since 1961, CVD became the second main cause of death in the United Kingdom with cancer being the first.
In 2012 CVD caused 28% of all deaths whilst cancers caused 29%. However, CVD remains to be the main
cause of death among women with it accounting for 28% of deaths whilst 27% of deaths were attributable to
cancers. In men, cancer accounted for 32% of deaths whilst CVD accounted for 29%2.
Broken by gender, 26% of male and 18% of female premature (under-75s) mortality was attributed to CVD
in 2012. In total there were almost 42,000 premature deaths from CVD in the UK. When all age mortality is
considered, 28% of female and 29% of male deaths were attributable to CVD.
Just under half of CVD deaths are from CHD (46%) and around a quarter are from stroke (26%). CHD by
itself is the biggest single cause of death in the UK. In 2012, 16% of male deaths and 10% of female deaths
were from CHD, a total of just over 73,500 deaths.
Around 41,000 deaths in the UK were from stroke, making up 6% and 9% of total deaths in men and women
respectively. Other heart diseases caused 16% of all CVD deaths, and were mainly due to pulmonary heart
diseases, heart failure and Atrial Fibrilation (AF). About 18% of CVD deaths in women were from other heart
diseases, compared to 13% in men. Of people dying from CVD under the age of 35, around 47% of these
deaths are from other heart diseases. Diseases of the arteries, arterioles and capillaries comprised around
6% of all CVD deaths2.
Risk factors for CVD include non-modifiable and modifiable risk factors3. Non-modifiable risk factors are
those that cannot be altered such as age, family history, ethnic origin and gender. Modifiable risk factors can
be affected by changing lifestyle or behaviour patterns and through the administration of prescribed drugs.
These include smoking, high cholesterol, obesity, lack of physical activity, high blood pressure/hypertension,
diabetes, unhealthy diets, stress and harmful use of alcohol.
1 Cardiovascular Disease Outcomes Strategy, 2013
https://www.gov.uk/government/uploads/system/uploads/attachment_data/file/217118/9387-2900853-CVD-Outcomes_web1.pdf
2 Cardiovascular Disease Statistics 2014 – British Heart Foundation
https://www.bhf.org.uk/publications/statistics/cardiovascular-disease-statistics-2014
3Cardiovascular Disease: risk assessment and reduction, including lipid modification, NICE, July 2014
https://www.nice.org.uk/guidance/cg181/resources/cardiovascular-disease-risk-assessment-and-reduction-including-lipid-
modification-35109807660997

3
Most deaths caused by cardiovascular disease are premature and could easily be prevented by making
lifestyle changes, such as eating healthily, exercising regularly and stopping smoking4. To significantly reduce
the risk of developing CVD, lifestyle needs to be looked at as a whole. In particular the factors that need to
be considered are: diet, weight, smoking, amount of alcohol consumed and the amount of exercise
undertaken.
The National Service Frameworks for CHD, diabetes and CKD, the Stroke Strategy and National Institute for
Health and Care Excellence (NICE) quality standards have all driven significant progress in tackling
cardiovascular diseases in recent years. However, CVD is still the biggest killer in England, and stroke is the
largest single cause of adult disability. In addition, an ageing population and the increasing prevalence of risk
factors for cardiovascular diseases could start to erode the progress that has been made. More, therefore,
needs to be done to prevent cardiovascular diseases by tackling the lifestyle factors which can lead to their
development.
4 NHS Choices, 2015
http://www.nhs.uk/conditions/Cardiovascular-disease/Pages/Introduction.aspx

4
Local Picture
Risk factors
Key non-modifiable risk factors for Cardiovascular Disease CVD are: age, gender, ethnicity and a family history of CVD. However, there are significant reversible risk factors for CVD:
Lifestyle factors: smoking, lack of exercise, poor diet and increased consumption of alcohol.
Poor access to quality primary care, in particular access to cholesterol and blood pressure lowering treatments and smoking cessation services and optimum management of diabetes.
Poverty, poor housing conditions and education. In addition to different levels of individual CVD risk, there is considerable variability in how quickly patients
present with symptoms and signs. Also, there are often differences in the types of investigations and
treatments offered and delivered to patients with the same level of disease. All of these factors help explain
why patients with similar types of CVD can have different outcomes.
Non modifiable Risk Factors
Age: CVD predominantly affects people older than 50 and the risk increases significantly with age5. However,
in some ethnic groups such as the South Asians CVD is more likely to develop in men at a younger age. This
relationship of CVD with age is becoming increasingly important in light of the ageing population. In 2014,
the proportion of people aged 50 and over in Kingston was 28.8% which is lower than the England (35.6%)
but higher than London (26.4%) percentages. The proportion of people aged 50 and over in Kingston is
predicted to increase by 19.0% between 2014 and 20246.
Gender: Cardiovascular disease develops 7 to 10 years later in women than in men. As a result the risk of
heart disease in women is often underestimated due to the misperception that females are ‘protected’ against
cardiovascular disease. Once past the menopause, a woman’s risk is similar to that of a man and in fact the
lifetime burden is greater in women because of their longevity and their increased risk of stroke over the age
of 757.
Ethnicity: Ethnicity is a recognised risk factor for developing CVD. Research evidence suggests that the
relationship between the two is complex. South Asians living in the UK have a higher risk (approximately 1.5
times) of developing CVD compared to the rest of the population. South Asian men have a higher possibility
of developing Coronary Health Disease (CHD) at a younger age and higher rates of heart attacks. Black
people are twice as likely to have a stroke and together with the South Asians have strokes at a significantly
younger age than white people8.CVD mortality in South Asians groups is approximately 50% higher than in
the White British population9.
5 Lipid modification: cardiovascular risk assessment and the modification of blood lipids for the primary and secondary prevention
of cardiovascular disease. NICE clinical guideline 67 (2008).
6 ONS midyear population estimates, 2014 and GLA population projections - short term migration scenario, 2014
7 Seshadri S, Beiser A, Kelly-Hayes M et al. (2006) The lifetime risk of stroke: estimates from the Framingham Study. Stroke 37:
345–50.
8 State of the Nation, Stroke statistics January 2015, The Stroke Association
9 Allender S et al, The burden of physical activity‐ related ill health in the UK. J Epidemiol Community Health. 2007 Apr; 61(4):
344–348.

5
The proportion of the Black and Minority Ethnic (BME) population in Kingston is projected to increase from
28.8% to 35.1% between 2014 and 2024. The percentage of the Asian (Indian, Pakistani, Bangladeshi and
Other Asians) population in Kingston is predicted to increase by 28.6% between 2014 and 2024. During the
same time period Black (Black African, Black Caribbean and Black Other) population in Kingston is projected
to increase by 26.4%10.
Family history: A family history of CVD represents the net effect of shared genetic, biochemical, behavioural,
and environmental components. In adults, epidemiologic studies have demonstrated that a family history of
premature CHD in a first-degree relative—heart attack, treated angina, percutaneous coronary catheter
interventional procedure, or coronary artery bypass surgery, stroke or sudden cardiac death in a male parent
or sibling before age 55 years or a female parent or sibling before age 65 years - is an important independent
risk factor for future CVD. A sentinel study in this area showed that the presence of a positive parental history
doubled baseline risk for CVD11. Offspring risk was strongly inversely related to the age of the parent at the
time of the index event. The association of a positive family history with increased CV risk has been confirmed
for men, women, and siblings and for different racial and ethnic groups12.
Family History of CVD is one of the indicators recorded for patients having their NHS health check in Kingston.
However, it is not possible to provide this data as it has not been possible to access the individual records of
patients having their health checks in local practices.
Modifiable Risk Factors
Socioeconomic status
The prevalence of CVD varies by deprivation. CVD is strongly associated with low income and social
deprivation13. Kingston has 1.1% of its population living in the 20% most deprived areas in England14 where
the prevalence of CVD is around three times higher than that of the more affluent areas. Modifiable CVD risk
factors are less likely to be diagnosed in people living in more deprived areas, which may result in poorer
access to treatment15.
A study undertaken by ONS looked into the social inequalities in male mortality for selected causes of death
during 2001–03. The study showed that differences in circulatory disease mortality between the social
classes exist with the Routine and Manual class having more than twice the mortality of the Managerial and
Professional class and higher mortality rates than for all men16. In Kingston, mortality from heart disease was
10 2014 Round of Demographic Projections, Local authority population projections for 2014 - Trend-based ethnic group projections,
long-term migration scenario, © GLA 2014 Round Demographic Projections
11 Colditz GA, Rimm EB, Giovannucci E, Stampfer MJ, Rosner B, Willett WC. A prospective study of parental history of myocardial
infarction and coronary artery disease in men. Am J Cardiol 1991;67(11):933-938.
12 Myers RH, Kiely DK, Cupples LA, Kannel WB. Parental history is an independent risk factor for coronary artery disease: the
Framingham Study. Am Heart J 1990;120(4):963-969.
13 Services for the prevention of cardiovascular disease, NICE commissioning guides [CMG45], 2012
14 English Indices of Multiple Deprivation, Department of Communities and Local Government, 2015
15 Closing the Gap, Care Quality Commission, 2009
http://webarchive.nationalarchives.gov.uk/20100813162719/http:/www.cqc.org.uk/_db/_documents/Closing_the_gap.pdf
16 Social inequalities in male mortality for selected causes of death by the National Statistics Socioeconomic Classification, England
and Wales, 2001–03, Office for National Statistics, 2008
6
shown to be three times higher in Norbiton (the most deprived ward in Kingston) than the more affluent
areas17.
This social class gradient is also reflected in the morbidity rates, with angina, heart attack and stroke all more
common amongst those in manual social classes18.
Lifestyle choices
Poor lifestyle choices, such as smoking, misuse of alcohol, poor diet and lack of physical activity are key
contributors to the development and progression of CVD. People’s lifestyles and their complex relationship
with the broader determinants of health, such as income, education and housing, particularly in the context
of deprivation or poverty, also has a major impact on the risk of CVD.
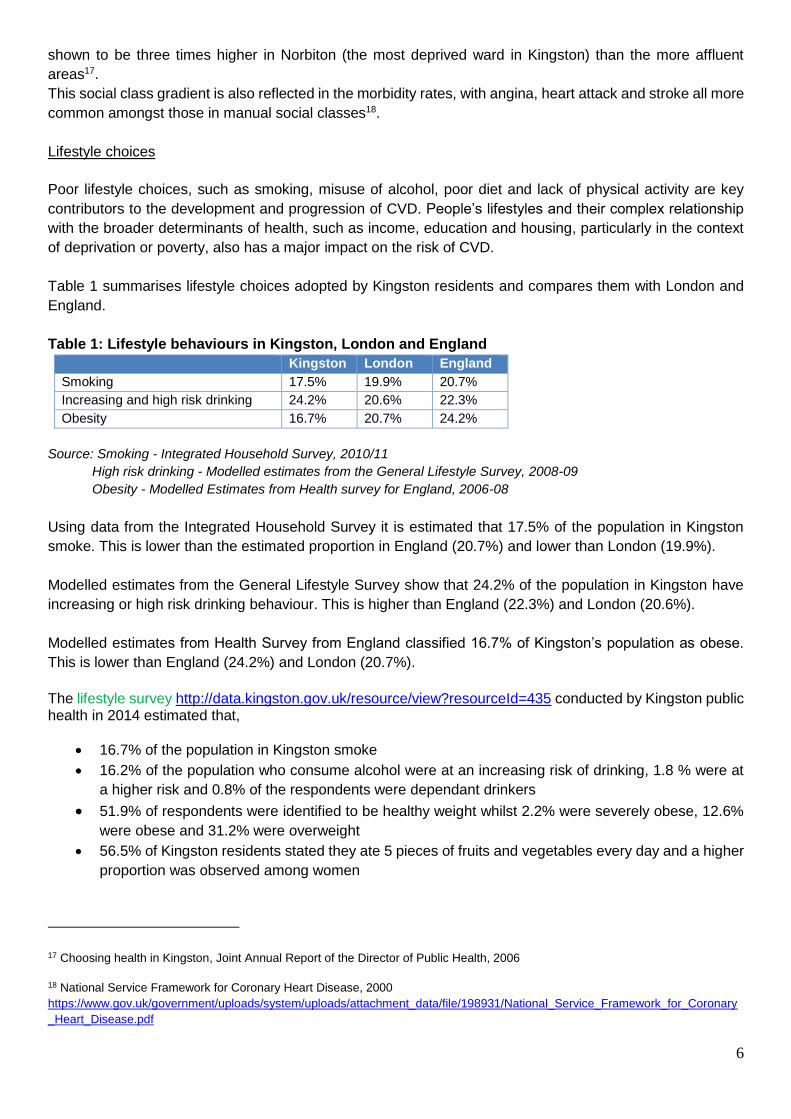
Table 1 summarises lifestyle choices adopted by Kingston residents and compares them with London and
England.
Table 1: Lifestyle behaviours in Kingston, London and England
Kingston London England
Smoking 17.5% 19.9% 20.7%
Increasing and high risk drinking 24.2% 20.6% 22.3%
Obesity 16.7% 20.7% 24.2%
Source: Smoking - Integrated Household Survey, 2010/11
High risk drinking - Modelled estimates from the General Lifestyle Survey, 2008-09
Obesity - Modelled Estimates from Health survey for England, 2006-08
Using data from the Integrated Household Survey it is estimated that 17.5% of the population in Kingston
smoke. This is lower than the estimated proportion in England (20.7%) and lower than London (19.9%).
Modelled estimates from the General Lifestyle Survey show that 24.2% of the population in Kingston have
increasing or high risk drinking behaviour. This is higher than England (22.3%) and London (20.6%).
Modelled estimates from Health Survey from England classified 16.7% of Kingston’s population as obese.
This is lower than England (24.2%) and London (20.7%).
The lifestyle survey http://data.kingston.gov.uk/resource/view?resourceId=435 conducted by Kingston public health in 2014 estimated that,
16.7% of the population in Kingston smoke
16.2% of the population who consume alcohol were at an increasing risk of drinking, 1.8 % were at
a higher risk and 0.8% of the respondents were dependant drinkers
51.9% of respondents were identified to be healthy weight whilst 2.2% were severely obese, 12.6%
were obese and 31.2% were overweight
56.5% of Kingston residents stated they ate 5 pieces of fruits and vegetables every day and a higher
proportion was observed among women
17 Choosing health in Kingston, Joint Annual Report of the Director of Public Health, 2006
18 National Service Framework for Coronary Heart Disease, 2000
https://www.gov.uk/government/uploads/system/uploads/attachment_data/file/198931/National_Service_Framework_for_Coronary
_Heart_Disease.pdf

7
45.5% of Kingston residents were achieving at least 150 minutes of physical activity per week, in
accordance with UK CMO recommended guidelines on physical activity.
Please refer to the Current Services section for more information on the services offered by the Kingston
Public Health. More information on recent services can be found in lifestyle services directory
http://data.kingston.gov.uk/resource/view?resourceId=700.
Prevalence of CVD in Kingston
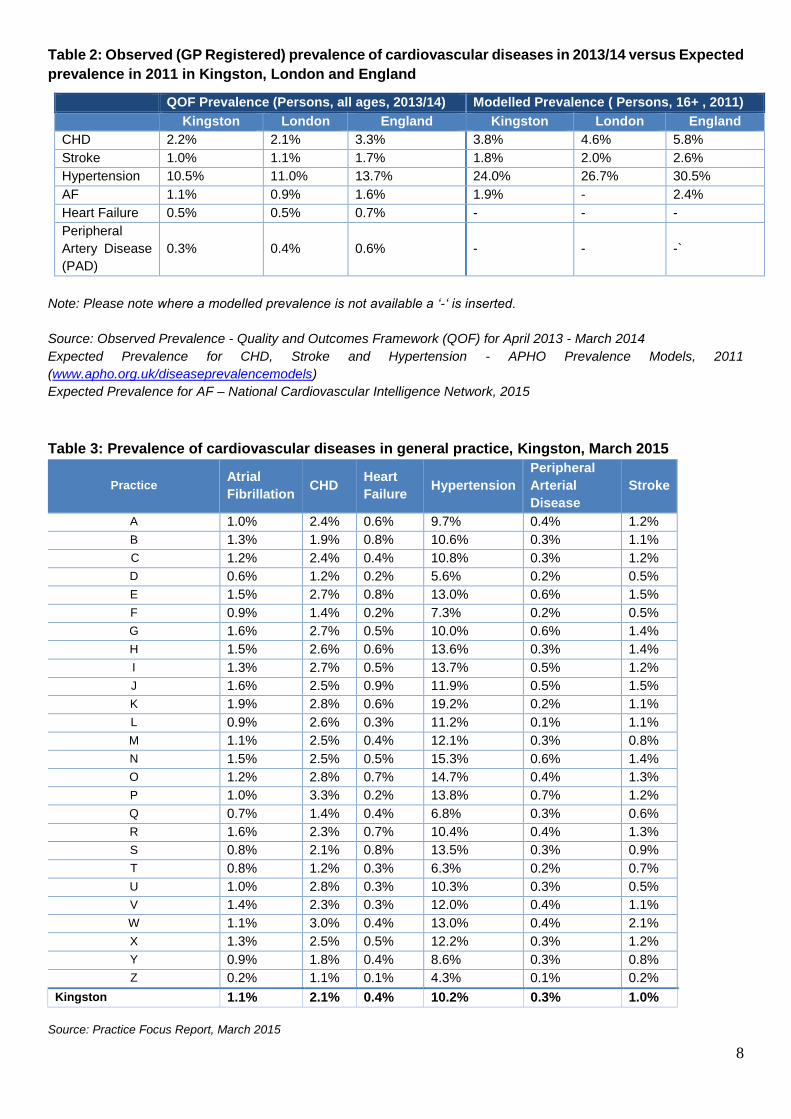
Table 2 shows the observed and expected prevalence of different cardiovascular conditions as well as the
conditions contributing to them in Kingston, London and England. The observed prevalence is taken from the
practice QOF data (practice disease register) whilst the expected prevalence is taken from the disease
prevalence models developed by the Association of Public Health Observatories (APHO) to estimate the
likely prevalence of cardiovascular conditions in different areas taking into account key factors including age,
gender, deprivation and where relevant smoking. When compared with the number of people living with
cardiovascular disease in Kingston these models suggest that considerable numbers of people are still
undiagnosed.
The observed prevalence of CHD in Kingston (2.2%) during 2013-14 was slightly higher than that for London
(2.1%) but lower than the national prevalence (3.3%). The modelled prevalence for CHD in Kingston is 3.8%
(table 2).
The observed prevalence of stroke in Kingston (1.0%) during 2013-14 was lower than the London (1.1%)
and England (1.7%) prevalences. The modelled prevalence for stroke in Kingston is 1.8% (table 2).
The observed prevalence of hypertension in Kingston (10.5%) during 2013-14 was lower than London
(11.0%) and England (13.7%) prevalences. The modelled prevalence for hypertension in Kingston is 24.0%
(table 2).
The observed prevalence of Atrial Fibrillation (AF) in Kingston (1.1%) during 2013-14 was higher than the
London (0.9%) prevalence but lower than the prevalence of AF in England (1.6%). The modelled prevalence
for AF in Kingston is 1.9% (table 2).
The observed prevalence of heart failure in Kingston (0.5%) during 2013-14 was similar to regional
prevalence (0.5%) but lower than the national prevalence (0.7%).
The observed prevalence of peripheral arterial disease in Kingston (0.3%) during 2013-14 was lower than
the London (0.4%) and England (0.6%) prevalences.
This suggests that a large number of patients with CHD, stroke, hypertension, AF, heart failure and Peripheral
Artery Disease (PAD) are not on the respective disease registers and may not be receiving appropriate
clinical management for their condition. Table 3 shows the observed prevalence of CVD conditions in local
general practices.
8
Table 2: Observed (GP Registered) prevalence of cardiovascular diseases in 2013/14 versus Expected
prevalence in 2011 in Kingston, London and England
QOF Prevalence (Persons, all ages, 2013/14) Modelled Prevalence ( Persons, 16+ , 2011) Kingston London England Kingston London England
CHD 2.2% 2.1% 3.3% 3.8% 4.6% 5.8%
Stroke 1.0% 1.1% 1.7% 1.8% 2.0% 2.6%
Hypertension 10.5% 11.0% 13.7% 24.0% 26.7% 30.5%
AF 1.1% 0.9% 1.6% 1.9% - 2.4%
Heart Failure 0.5% 0.5% 0.7% - - -
Peripheral
Artery Disease
(PAD)
0.3% 0.4% 0.6% - - -`
Note: Please note where a modelled prevalence is not available a ‘-‘ is inserted.
Source: Observed Prevalence - Quality and Outcomes Framework (QOF) for April 2013 - March 2014
Expected Prevalence for CHD, Stroke and Hypertension - APHO Prevalence Models, 2011
(www.apho.org.uk/diseaseprevalencemodels)
Expected Prevalence for AF – National Cardiovascular Intelligence Network, 2015
Table 3: Prevalence of cardiovascular diseases in general practice, Kingston, March 2015
Practice Atrial
Fibrillation CHD
Heart
Failure Hypertension
Peripheral
Arterial
Disease
Stroke
A 1.0% 2.4% 0.6% 9.7% 0.4% 1.2%
B 1.3% 1.9% 0.8% 10.6% 0.3% 1.1%
C 1.2% 2.4% 0.4% 10.8% 0.3% 1.2%
D 0.6% 1.2% 0.2% 5.6% 0.2% 0.5%
E 1.5% 2.7% 0.8% 13.0% 0.6% 1.5%
F 0.9% 1.4% 0.2% 7.3% 0.2% 0.5%
G 1.6% 2.7% 0.5% 10.0% 0.6% 1.4%
H 1.5% 2.6% 0.6% 13.6% 0.3% 1.4%
I 1.3% 2.7% 0.5% 13.7% 0.5% 1.2%
J 1.6% 2.5% 0.9% 11.9% 0.5% 1.5%
K 1.9% 2.8% 0.6% 19.2% 0.2% 1.1%
L 0.9% 2.6% 0.3% 11.2% 0.1% 1.1%
M 1.1% 2.5% 0.4% 12.1% 0.3% 0.8%
N 1.5% 2.5% 0.5% 15.3% 0.6% 1.4%
O 1.2% 2.8% 0.7% 14.7% 0.4% 1.3%
P 1.0% 3.3% 0.2% 13.8% 0.7% 1.2%
Q 0.7% 1.4% 0.4% 6.8% 0.3% 0.6%
R 1.6% 2.3% 0.7% 10.4% 0.4% 1.3%
S 0.8% 2.1% 0.8% 13.5% 0.3% 0.9%
T 0.8% 1.2% 0.3% 6.3% 0.2% 0.7%
U 1.0% 2.8% 0.3% 10.3% 0.3% 0.5%
V 1.4% 2.3% 0.3% 12.0% 0.4% 1.1%
W 1.1% 3.0% 0.4% 13.0% 0.4% 2.1%
X 1.3% 2.5% 0.5% 12.2% 0.3% 1.2%
Y 0.9% 1.8% 0.4% 8.6% 0.3% 0.8%
Z 0.2% 1.1% 0.1% 4.3% 0.1% 0.2%
Kingston 1.1% 2.1% 0.4% 10.2% 0.3% 1.0%
Source: Practice Focus Report, March 2015

9
Hospital Admissions
Better management of cardiovascular conditions in primary care will significantly reduce the need for secondary care. Table 3 shows the rate of hospital admission for cardiovascular disease in Kingston, London and England. In 2013/14 the admission rates for CHD in Kingston CCG (563.8/100,000 - 672 admissions) were not
significantly different than the national average (559.6/100,000). Similarly, the rate of heart failure admissions
in Kingston (147.8/100,000 - 181 admissions) were also not significantly different from the national rate
(133.7/100,000). Figures 1 and 2 compare the Kingston admission rates for CHD and heart failure with the
national and regional rates.
The admission rate for stroke in Kingston CCG (218.1/100,000 - 260 admissions) was however significantly
higher in 2013/14 than the national (174.3/ 100,000). Between 2003/04 and 2013/14, the admission rate for
stroke in Kingston CCG increased by 24.2% whilst the national rate declined.
Overall the incidence of stroke and hospital admission rates in the UK has decreased and survival after
stroke has improved in the past 10 years. Improved drug treatment in primary care is likely to be a major
contributor to this, with better identification and control of risk factors both before and after incident stroke.
In Kingston, there is scope for further improvement in risk factor reduction in high-risk patients with atrial
fibrillation.
Figure 1: CHD admission rates (DSR’s per 100,000 population), all ages, 2002/03 to 2013/14
Note: London values for 2013/14 are not available Source: Public Health England, 2015
810.6
563.8
767.9
663.6
718.6
559.6
.0
200.0
400.0
600.0
800.0
1000.0
1200.0
Kingston CCG London England

10
Figure 2: Heart failure admission rates (DSR’s per 100,000 population), all ages, 2002/03 to 2013/14
Note: London values for 2013/14 are not available Source: Public Health England, 2015
Figure 3: Stroke admission rates (DSR’s per 100,000 population), all ages, 2003/04 to 2013/14
Note: London values for 2013/14 are not available Source: Public Health England, 2015
Table 4: CHD, stroke and heart failure hospital admission rates per 100,000 population, all ages,
persons, 2002/03 and 2013/14 Directly standardised admission/100,000
Kingston London* England
CHD 2002/03 810.6 767.9 718.6
2013/14 563.8 663.6 559.6
Stroke 2003/04 175.5 170.5 180.8
2013/14 218.1 220.7 174.3
Heart Failure 2002/03 187.7 181.8 170.6
2013/14 147.8 173.3 133.7
Note: Please note the values for London are for 2012/13. The values for 2013/14 were not released at the time of
compilation of this report.
Source: Cardiovascular Disease Profile, Public Health England, 2015
187.7147.8
181.8
173.3
170.6133.7
.0
50.0
100.0
150.0
200.0
250.0
Kingston CCG London England
175.5 218.1
170.5
220.7
180.8
174.3
.0
50.0
100.0
150.0
200.0
250.0
Kingston CCG London England
11
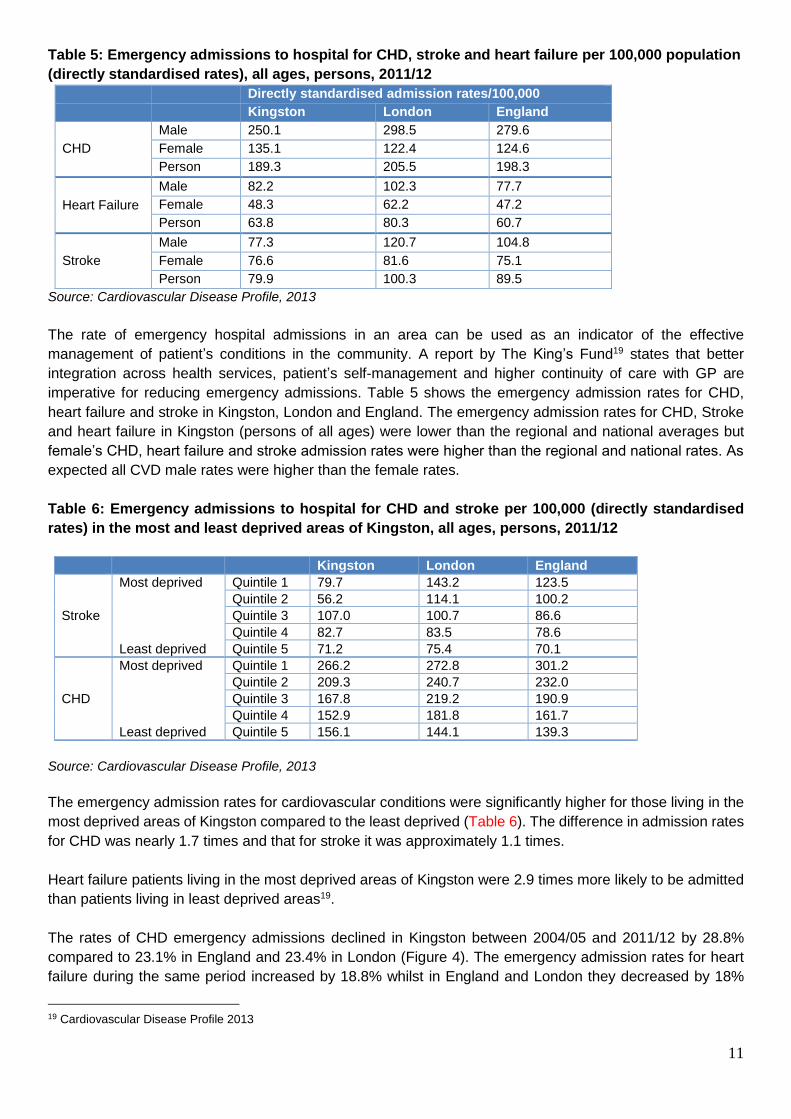
Table 5: Emergency admissions to hospital for CHD, stroke and heart failure per 100,000 population
(directly standardised rates), all ages, persons, 2011/12
Directly standardised admission rates/100,000
Kingston London England
CHD
Male 250.1 298.5 279.6
Female 135.1 122.4 124.6
Person 189.3 205.5 198.3
Heart Failure
Male 82.2 102.3 77.7
Female 48.3 62.2 47.2
Person 63.8 80.3 60.7
Stroke
Male 77.3 120.7 104.8
Female 76.6 81.6 75.1
Person 79.9 100.3 89.5
Source: Cardiovascular Disease Profile, 2013
The rate of emergency hospital admissions in an area can be used as an indicator of the effective
management of patient’s conditions in the community. A report by The King’s Fund19 states that better
integration across health services, patient’s self-management and higher continuity of care with GP are
imperative for reducing emergency admissions. Table 5 shows the emergency admission rates for CHD,
heart failure and stroke in Kingston, London and England. The emergency admission rates for CHD, Stroke
and heart failure in Kingston (persons of all ages) were lower than the regional and national averages but
female’s CHD, heart failure and stroke admission rates were higher than the regional and national rates. As
expected all CVD male rates were higher than the female rates.
Table 6: Emergency admissions to hospital for CHD and stroke per 100,000 (directly standardised
rates) in the most and least deprived areas of Kingston, all ages, persons, 2011/12
Kingston London England
Stroke
Most deprived Quintile 1 79.7 143.2 123.5
Quintile 2 56.2 114.1 100.2
Quintile 3 107.0 100.7 86.6
Quintile 4 82.7 83.5 78.6
Least deprived Quintile 5 71.2 75.4 70.1
CHD
Most deprived Quintile 1 266.2 272.8 301.2
Quintile 2 209.3 240.7 232.0
Quintile 3 167.8 219.2 190.9
Quintile 4 152.9 181.8 161.7
Least deprived Quintile 5 156.1 144.1 139.3
Source: Cardiovascular Disease Profile, 2013
The emergency admission rates for cardiovascular conditions were significantly higher for those living in the
most deprived areas of Kingston compared to the least deprived (Table 6). The difference in admission rates
for CHD was nearly 1.7 times and that for stroke it was approximately 1.1 times.
Heart failure patients living in the most deprived areas of Kingston were 2.9 times more likely to be admitted
than patients living in least deprived areas19.
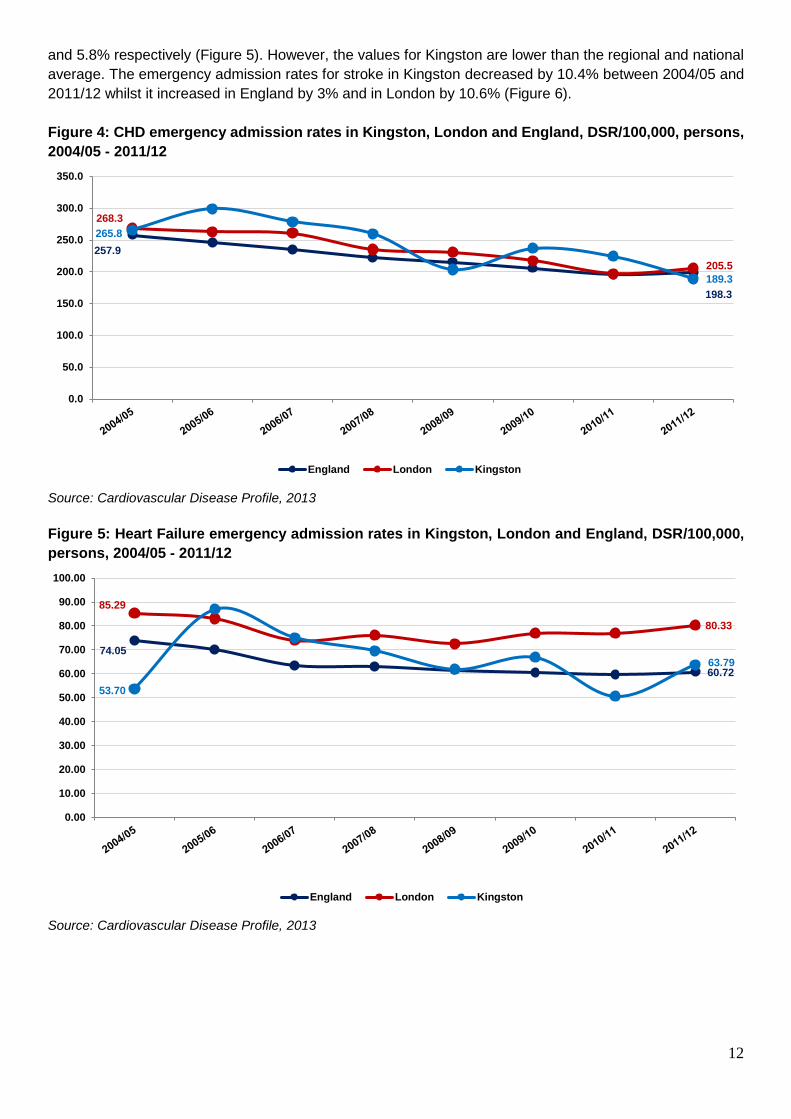
The rates of CHD emergency admissions declined in Kingston between 2004/05 and 2011/12 by 28.8%
compared to 23.1% in England and 23.4% in London (Figure 4). The emergency admission rates for heart
failure during the same period increased by 18.8% whilst in England and London they decreased by 18%
19 Cardiovascular Disease Profile 2013
12
and 5.8% respectively (Figure 5). However, the values for Kingston are lower than the regional and national
average. The emergency admission rates for stroke in Kingston decreased by 10.4% between 2004/05 and
2011/12 whilst it increased in England by 3% and in London by 10.6% (Figure 6).
Figure 4: CHD emergency admission rates in Kingston, London and England, DSR/100,000, persons,
2004/05 - 2011/12
Source: Cardiovascular Disease Profile, 2013
Figure 5: Heart Failure emergency admission rates in Kingston, London and England, DSR/100,000,
persons, 2004/05 - 2011/12
Source: Cardiovascular Disease Profile, 2013
257.9
198.3
268.3
205.5
265.8
189.3
0.0
50.0
100.0
150.0
200.0
250.0
300.0
350.0
England London Kingston
74.05
60.72
85.29
80.33
53.70
63.79
0.00
10.00
20.00
30.00
40.00
50.00
60.00
70.00
80.00
90.00
100.00
England London Kingston

13
Figure 6: Stroke emergency admission rates in Kingston, London and England, DSR/100,000,
persons, 2004/05 - 2011/12
Source: Cardiovascular Disease Profile, 2013
Mortality
Cardiovascular disease (CVD) is one of the major causes of death in England. There have been huge gains
over the past decades in terms of better treatment for CVD and improvements in lifestyle. Mortality from
cardiovascular disease has fallen over recent years. In England, between 2001 and 2010, all age mortality
rates from cardiovascular disease decreased by 36%, with decreases of 43% for CHD and 37% for stroke.
Over the same period, premature mortality rates from cardiovascular disease decreased by 40%, with
decreases of 46% for CHD and 42% for stroke. Government policy on smoking (where prevalence has fallen
from 27% to 20%), the relevant National Service Frameworks, the Stroke Strategy and the work of the
national improvement organisations and clinical networks and service providers in the NHS have all
contributed to these important improvementsError! Bookmark not defined..
80% of premature heart disease and stroke is preventable. Focusing on a combination of risk factors for
cardiovascular disease at once, implementing medical screening for individuals at risk and then providing
effective and affordable treatment to those who require it can prevent disability and death and improve quality
of life.
It has been predicted that mortality from CHD in the UK could be halved by small changes in CVD risk factors:
a 1% decrease in cholesterol in the population could lead to a 2-4% CHD mortality reduction; a 1% reduction
in smoking prevalence could lead to 2,000 fewer CHD deaths per year; and a 1% reduction in population
diastolic blood pressure could prevent around 1,500 CHD deaths each year20.
Table 7 compares the premature CVD mortality rates with those considered preventable in people under 75
years of age in Kingston, London and England. The premature and preventable CVD mortality rates
20 http://www.euro.who.int/en/health-topics/noncommunicable-diseases/cardiovascular-diseases/data-and-statistics
86.9
89.590.7
100.3
89.1
79.9
0.0
20.0
40.0
60.0
80.0
100.0
120.0
England London Kingston

14
decreased in Kingston between 2001-03 and 2012-14 by 44.3% and 41.7% respectively. During the same
period these rates decreased in London by 45.7% and 50.2% and in England they decreased by 45.1% and
50.1% respectively. These figures indicate that most of the premature mortality deaths are preventable.
Table 7: Age-standardised CVD mortality rates (3 year average) and those considered preventable
(including heart disease and stroke) in persons less than 75 years per 100,000 in Kingston, London
and England, 2001-03 to 2012-14
CVD Mortality Rates Preventable CVD Mortality Rates
Kingston London England Kingston London England
2001 - 03 117.92 145.02 137.96 72.77 99.48 98.64
2002 - 04 109.28 137.44 129.54 69.77 93.42 91.95
2003 - 05 99.03 128.42 120.90 63.13 85.77 85.31
2004 - 06 92.37 118.14 112.26 58.39 77.53 78.89
2005 - 07 86.74 110.48 105.12 54.67 72.30 73.39
2006 - 08 80.48 104.87 99.02 53.39 69.50 68.90
2007 - 09 72.19 98.90 93.07 50.94 65.44 64.30
2008 - 10 69.04 93.47 88.57 48.07 60.93 60.70
2009 - 11 72.32 86.45 84.04 47.77 55.07 56.57
2010 - 12 70.65 82.74 80.76 46.08 51.96 53.45
2011 - 13 68.85 79.71 77.83 46.42 50.22 50.89
2012 - 14 65.64 78.74 75.72 42.45 49.55 49.19
Source: Public Health England, 2015
Table 7a also shows that the rates of premature and preventable CVD mortality are declining for both men
and women and the decline in women’s mortality rates was larger than that for men21.
Table 7a: Age-standardised CVD mortality rates (3 year average) and those considered preventable
(including heart disease and stroke) in males and females less than 75 years per 100,000 in Kingston,
London and England, 2001-03 to 2012-14
Males Females
Premature mortality rates for
all CVD
Kingston 2001-03 164.0 76.4
2012-14 96.1 36.8
London 2001-03 205.9 90.0
2012-14 111.0 49.3
England 2001-03 193.8 86.7
2012-14 106.2 46.9
Preventable CVD mortality
Kingston 2001-03 113.1 36.5
2012-14 65.9 20.3
London 2001-03 150.1 53.9
2012-14 74.9 26.5
England 2001-03 147.4 53.9
2012-14 74.1 25.6
Source: Public Health England, 2015
Table 8 shows that in Kingston, between 2003 and 2013, the all age mortality rate for CHD, stroke and
diabetes have decreased by 27.9%, 50.9% and 19.0% respectively. Over the same period, the CHD
premature mortality rates decreased by 35.6% and the stroke premature mortality rates decreased by 50.8%.
21 Age-standardised rate of mortality from all cardiovascular diseases (including heart disease and stroke), Public Health England,
2015

15
Table 8: Mortality from CHD, stroke and diabetes, directly standardised rate/100,000, annual trend, all
ages and under 75, in Kingston, 2003 and 2013
All Ages
2003 2013
CHD 170.2 122.7
Stroke 124 60.9
Diabetes 10.5 8.5
Under 75
CHD 58.4 37.6
Stroke 26 12.8
Diabetes - -
Note: The under 75 mortality rates for diabetes are not available
Source: The NHS Indicator Portal, 2015
Deprivation and social class are key risk factors for CVD mortality and as a result CVD is the main contributor
to the health inequalities between the most and least deprived communities. Table 9 shows that people with
CHD who live in the most deprived quintile in Kingston will gain 1.3 (males) and 0.7 (females) life years if
they experience the same mortality rate as those living in the least deprived quintile. This is slightly higher in
comparison with stroke where they would gain 0.33 (males) and 0.55 (females) years.
Table 9: Table showing life expectancy years gained or lost if Kingston’s most deprived quintile had
the same mortality rates as Kingston’s least deprived quintile, 2010-12 CHD Stroke
Male
Number of deaths in the most deprived quintile 63.0 19.0
Number of excess deaths in the most deprived quintile 32.0 8.0
Number of years of life gained or lost * 1.33 0.33
Female
Number of deaths in the most deprived quintile 46.0 16.0
Number of excess deaths in the most deprived quintile 16.0 -1.0
Number of years of life gained or lost * 0.74 0.55
Notes:
* - A positive figure indicates that life expectancy years would be gained if the most deprived quintile of the local authority
had the same mortality rate as the least deprived quintile (i.e. the mortality rate in the most deprived quintile for the
cause is higher than that of the least deprived quintile).
A negative figure indicates that life expectancy years would be lost if the most deprived quintile in the local authority had
the same mortality rate as the least deprived quintile.
Source: Life Expectancy Segment Tool, PHE 2015. Analysis based on ONS death registration data, and midyear
population estimates, and DCLG Index of Multiple Deprivation, 2010

16
What Works
Government policy
1. The National Service Framework (NSF) for Coronary Heart Disease18 defined a series of priorities and
targets which aimed to;
specify interventions that are known to be effective
identify models of care that deliver those interventions reliably, tackle variations in levels of care,
develop audit tools and performance indicators to help ensure services are being delivered to an
acceptable standard
indicate milestones and goals by which the NHS can monitor progress towards delivery
identify gaps in knowledge or standards to inform the research and other agenda
reduce deaths from CHD over the decade (2000-2010)
The NSF delivered considerable success, predominantly in stop smoking services, rapid treatment of heart
attacks and the management of angina. NSF was a practical, evidence-based and flexible approach to
tackling CHD that led to reducing the CVD mortality by 47% in 2005 against of a Public Service Agreement
target of 40% reduction by 2010.
2. NHS RightCare has published an optimal value pathway on cardiovascular disease (CVD) prevention
which commissioners are asked to consider during the ‘what to change’ phase of their RightCare work.
A number of elements of an optimal CVD prevention pathway are featured including the evidence base,
clinical interventions, information on the risk conditions and potential opportunities for improvement.
3. Reducing health inequalities - In 2001 the government asked PCTs to reduce the absolute gap between
the worst fifth of areas in the country for health & deprivation (the spearhead PCTs) and the national
average by 40% by 2010.
The absolute gap in health inequalities was reduced by 38.4% between 1996 and 2007 with the narrowing
of the mortality rates variation between the 1st & 5th deprivation quintiles. In both the 1st & 5th quintiles, the
highest mortality rates in 2005-07 were lower than the lowest mortality rates in 1995-97.
4. The National Service Framework for Older People published in 200122 included a standard that aimed to
reduce the incidence of stroke in the population and ensured that those who have had a stroke had
prompt access to integrated stroke care services. This drove forward improvements in stroke care.
5. The National Strategy for Stroke23 was published in 2007. The strategy set a framework of quality markers
(QMs) for raising the quality of stroke prevention, treatment, care and support over next ten years (2007-
2017). It provided a blueprint for which local services could secure improvements to stroke services and
address health inequalities related to stroke over the next ten years. It also provided advice, guidance
and support for commissioners, strategic health authorities, the voluntary sector and social care, in the
22 National Service Framework for Older People, 2001
https://www.gov.uk/government/uploads/system/uploads/attachment_data/file/198033/National_Service_Framework_f
or_Older_People.pdf
23 National Strategy for Stroke, 2005
http://webarchive.nationalarchives.gov.uk/20130107105354/http:/www.dh.gov.uk/prod_consum_dh/groups/dh_digitala
ssets/documents/digitalasset/dh_081059.pdf

17
planning, development and monitoring of services. The expectations of those affected by stroke and their
families were catered for by providing a guide to high-quality health and social care services.
6. The National Strategy for Stroke http://clahrc-gm.nihr.ac.uk/wp-content/uploads/DoH-National-Stroke-
Strategy-2007.pdf was linked closely with the Long-term Conditions National Service Framework (NSF)
(2005) https://www.gov.uk/government/uploads/system/uploads/attachment_data/file/198114/National_
Service_Framework_for_Long_Term_Conditions.pdf of its emphasis on improvement of neurological
services for all conditions – from diagnosis to end-of-life care.
7. The NHS Health Check Programme – The NHS Health Check programme was launched in 2009 to
reduce CVD risks and events. Internationally, it is the first of its kind, aiming to provide a routine structured
clinical assessment and management for adults aged 40-74 years without pre-existing CVD condition.
The health check includes a review of CVD risks, behavioural change support and treatment of newly
identified risk factors or co-morbidity through integration with routine clinical provision in general practice.
The NHS Health Check is a 5-year rolling programme which targets one-fifth of the eligible population
each year. Nationally, the uptake of the programme is reported to be around 50% while the local uptake
has been over 70%. Evaluation of the programme in Kingston indicated that over 23,000 health checks
were provided in Kingston during 2009 – 2015 and the majority were provided by local practices. An
outreach programme was also delivered during this period to improve the access to the health checks
and reduce health inequalities. The programme was also delivered by a small number of pharmacies but
did not prove to be cost effective.
8. The Cardiovascular Disease Outcomes Strategy1, launched in 2013 highlighted the UK’s relatively poor
mortality rates and the Department of Health’s call to action to the health and care system to improve
mortality rates across the board. The strategy will contribute by providing advice to local authority and
NHS commissioners and providers about actions in relation to cardiovascular disease that can help
deliver that ambition. However, improving outcomes is not just about reducing mortality, it is also about
improving people’s quality of life, their experience of care and the safety of that care. While improving
quality of care, cost effectiveness also needs to be looked at.
9. NICE Guidance: There is a large body of evidence-based guidance for the management and treatment
of cardiovascular diseases. These include clinical guidelines (CG) from the National Institute for Health
and Clinical Evidence (NICE). A summary of the latest NICE guidance for the Prevention of cardiovascular
disease https://www.nice.org.uk/guidance/ph25 is given below:
This guidance suggests that CVD risk can be tackled with population-wide, community-level and
individual interventions. Population-wide approaches aim to change the social, economic, material and
environmental risk factors that affect an entire population. This can be achieved through regulation,
legislation, subsidy and taxation or rearranging the physical layout of communities. Community-level
approaches are targeted at groups of people who are at high risk of cardiovascular disease (for example
a specific black and minority ethnic group (BME) or geographical area) and may include activities to
change health behaviours among the group. Individual approaches are interventions that give people
direct encouragement to change their behaviour. This may involve providing information about the health
risks of their current behaviour, offering advice or prescribing a treatment24. Individual-level behaviour
change interventions can be delivered through different methods – brief advice, brief intervention and
motivational interviewing.
24 https://www.nice.org.uk/guidance/cg181/resources/services-for-the-prevention-of-cardiovascular-disease-commissioning-guide-
317824525/chapter/2-An-integrated-approach-to-commissioning-high-quality-services-for-the-prevention-of-cardiovascular-disease
18
Studies have shown that combining population, community and individual approaches can reduce
cardiovascular disease mortality25. Research evidence suggests that an individual is most likely to have
more than one risk factor and hence a policy to tackle any single risk factor is unlikely to be effective. An
effective and equitable intervention not only requires collaborative working amongst a number of partners
and stakeholders but also a variety of approaches to tackle different population group. Local Government
Improvement and Development, the Department of Health and the Cardio and Vascular Coalition
recognise that a combination of approaches is needed to ensure sustained lifestyle and behaviour
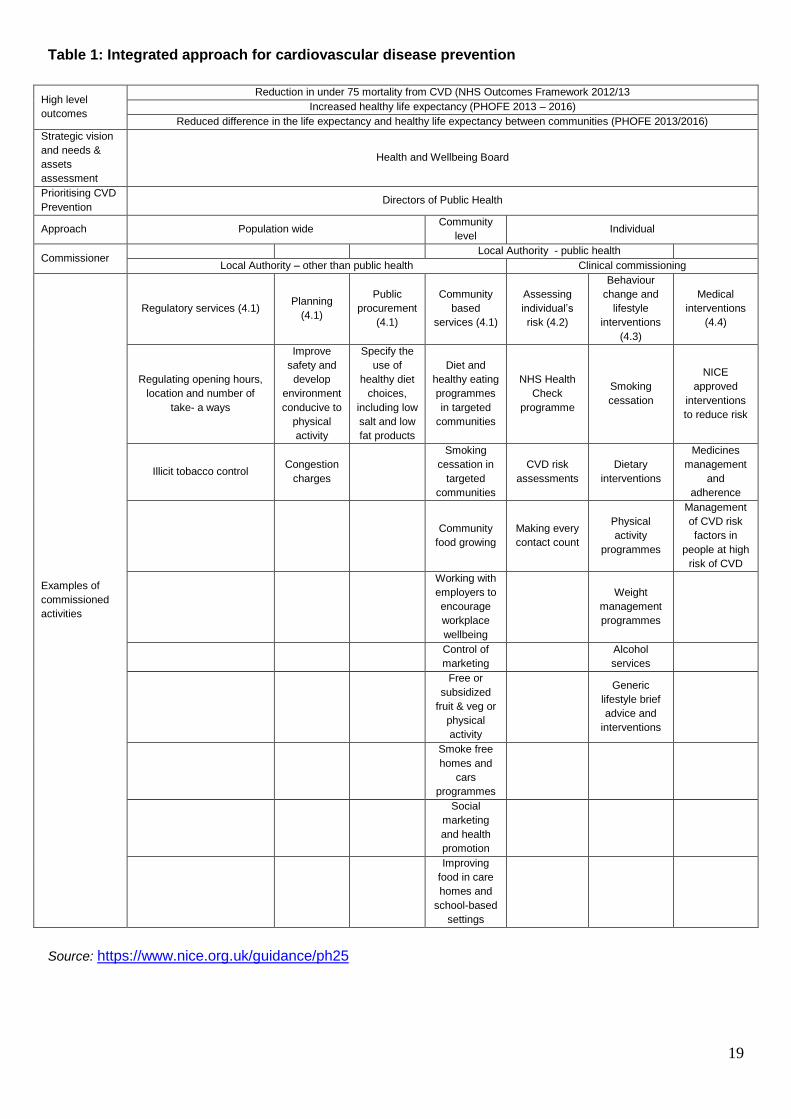
change26,27,28. Table 1 summarises the integrated approach for cardiovascular disease prevention. The
current services section describes the lifestyle programmes provided in Kingston. This section also
identifies the needs of the population, services provision and gaps in the services.
The NICE public health guidance documents below have been published for the prevention of cardiovascular
disease:
1. PH15 (2008) - Identifying and supporting people most at risk of dying prematurely: guidance
2. PH25 (2010) - Prevention of cardiovascular disease: guidance
25 Capewell S, Graham H (2010) Will cardiovascular disease prevention widen health inequalities? PLOS Medicine 7: e1000320. 26 Cardio & Vascular Coalition Destination 2020 A plan for Cardiac and Vascular health The voluntary sector vision for change
https://heartuk.org.uk/files/uploads/CVC_destination_2020.pdf 27 Improvement and Development Agency (2009). London: Matrix Evidence. 28 Department of Health (2011) Healthy lives, health people: a call to action on obesity in England. London: Department of Health
19
Table 1: Integrated approach for cardiovascular disease prevention
High level
outcomes
Reduction in under 75 mortality from CVD (NHS Outcomes Framework 2012/13
Increased healthy life expectancy (PHOFE 2013 – 2016)
Reduced difference in the life expectancy and healthy life expectancy between communities (PHOFE 2013/2016)
Strategic vision
and needs &
assets
assessment
Health and Wellbeing Board
Prioritising CVD
Prevention Directors of Public Health
Approach Population wide Community
level Individual
Commissioner Local Authority - public health
Local Authority – other than public health Clinical commissioning
Examples of
commissioned
activities
Regulatory services (4.1) Planning
(4.1)
Public
procurement
(4.1)
Community
based
services (4.1)
Assessing
individual’s
risk (4.2)
Behaviour
change and
lifestyle
interventions
(4.3)
Medical
interventions
(4.4)
Regulating opening hours,
location and number of
take- a ways
Improve
safety and
develop
environment
conducive to
physical
activity
Specify the
use of
healthy diet
choices,
including low
salt and low
fat products
Diet and
healthy eating
programmes
in targeted
communities
NHS Health
Check
programme
Smoking
cessation
NICE
approved
interventions
to reduce risk
Illicit tobacco control Congestion
charges
Smoking
cessation in
targeted
communities
CVD risk
assessments
Dietary
interventions
Medicines
management
and
adherence
Community
food growing
Making every
contact count
Physical
activity
programmes
Management
of CVD risk
factors in
people at high
risk of CVD
Working with
employers to
encourage
workplace
wellbeing
Weight
management
programmes
Control of
marketing
Alcohol
services
Free or
subsidized
fruit & veg or
physical
activity
Generic
lifestyle brief
advice and
interventions
Smoke free
homes and
cars
programmes
Social
marketing
and health
promotion
Improving
food in care
homes and
school-based
settings
Source: https://www.nice.org.uk/guidance/ph25

20
Local actions
1. Increased training in cardio-pulmonary resuscitation (CPR)
Research evidence suggests that survival rates have doubled, where CPR is attempted. Currently CPR
is attempted in only 20% – 30% of cases following an out of hospital heart attack. There are multiple
reasons for low levels of bystander initiated CPR, including lack of training and fear of litigation. The CVD
Outcomes Strategy proposes that all emergency service personnel could be trained in CPR and that
basic life support skills could be taught more widely, e.g. in the work place and in schools. Other options
might be; ensure all NHS staff that works with patients is taught CPR, including healthcare assistants,
physiotherapy assistants etc. and work with local businesses and services, such as leisure centres and
shopping centre security staff29. In Kingston, the CPR training is offered by the British Heart Foundation
and London Ambulance Services.
2. Improved management of people with diagnosed Atrial Fibrillation (AF)
People with AF have a 5-6 fold increased risk of stroke. There are relatively high rates of
undiagnosed cases of AF and treatment varies across the country. It is recommended that CCGs
could work with local practices to improve the identification of patients with AF and ensure
appropriate pharmacological interventions in line with NICE guidelines. In Kingston, measuring the
pulse regularity was added to the health checks but only a small number of patients were identified
via this route. The Medicine Management Team is also auditing the medication of patients with AF.
The observed prevalence of AF in Kingston is 1.1%, which is less than the modelled prevalence of
1.9%. This suggests that more effort needs to be spent on identifying new AF cases.
Treatments available include:
Medicines to reduce the risk of a stroke
Medicines to control AF
Cardioversion (electric shock treatment) to restore normal heart rhythm
Catheter ablation
Having a pacemaker fitted
Table 2 shows interventions offered in primary care during 2014/15 for management of people
diagnosed with AF in Kingston, London and England.
Table 2: Intervention offered in primary care for management of people diagnosed with AF in
Kingston, 2014 - 2015
Source: Quality and Outcomes Framework (QOF) for April 2014 - March 2015
29 Factsheet: Increase bystander initiated CPR by increasing proportion of population trained in CPR from 3.8m people to 5 million
nationally
https://www.england.nhs.uk/wp-content/uploads/2014/02/pm-fs-3-2.pdf
Kingston London England
Patients with AF in whom there is a record of a CHADS2 score of 1 (latest in the preceding 12 months), the percentage of patients who are currently treated with anti-coagulation drug therapy or anti-platelet therapy
90.8% 91.3% 92.2%
Patients with AF whose latest record of a CHADS2 score is greater than 1, the percentage of patients who are currently treated with anti-coagulation therapy
67.5% 71.2% 74.3%
21
3. Early diagnosis of people with Familial Hypercholesterolaemia (FH)
FH is an inherited condition caused by an alteration in a gene, which results in a high cholesterol
concentration in the blood. Raised cholesterol concentrations are present from birth and lead to early
development of atherosclerosis and coronary heart disease. The condition is transmitted from generation
to generation in such a way that siblings and children of a person with FH have a 1 in 2 chance (50:50
risk) of also having FH.
Most people with FH have inherited an altered gene for FH in an autosomal dominant pattern from only
1 parent and are therefore 'heterozygous'. Occasionally, a person will inherit an altered gene from both
parents and will have 'homozygous' FH or 'compound heterozygous' FH. Homozygous FH is rare, with
an incidence of approximately one in a million.
The prevalence of heterozygous FH in the UK population is estimated to be 1 in 500, which means that
approximately 120,000 people are expected to be affected. However, more than 80% of these are
currently undiagnosed and untreated. If left untreated, more than 50% of men with heterozygous FH will
develop CHD by the age of 50 years and more than 50% of women by the age of 60 years. Life
expectancy is restored to near normal with early preventive treatment, particularly statin treatment and
smoking cessation.
The importance of better identification of families/individuals at very high risk of cardiovascular disease,
including those with FH, is recognised in the Department of Health's Cardiovascular Disease Outcomes
Strategy.
In 2008, NICE published a clinical guideline for the Identification and Management of FH (CG71).
The guideline recommends identifying cases of FH, using cholesterol measurements and cascade
genetic testing of their families. Referral to specialist lipid clinics is recommended for confirmation
of the diagnosis, patient counselling and in order to initiate the cascade testing30.
In 2013, NICE published a new guidance for the identification and management of FH that included
the following quality standards:
Statement 1: Adults with baseline total cholesterol above 7.5 mmol/l are assessed for a clinical diagnosis
of familial hypercholesterolaemia (FH).
Statement 2: People with a clinical diagnosis of familial hypercholesterolaemia (FH) are referred for
specialist assessment.
Statement 3: People with a clinical diagnosis of familial hypercholesterolaemia (FH) are offered DNA
testing as part of a specialist assessment.
Statement 4: Children at risk of familial hypercholesterolaemia (FH) are offered diagnostic tests by the
age of 10 years.
Statement 5: Relatives of people with a confirmed diagnosis of monogenic familial
hypercholesterolaemia (FH) are offered DNA testing through a nationwide, systematic cascade process.
Statement 6: Adults with familial hypercholesterolemia (FH) receive lipid-modifying drug treatment to
reduce LDL-C concentration by more than 50% from baseline.
30 Factsheet: Early diagnosis of people with Familial Hypercholesterolaemia (FH) in England
https://www.england.nhs.uk/wp-content/uploads/2014/02/pm-fs-3-42.pdf
22
Statement 7: Children with familial hypercholesterolaemia (FH) are assessed for lipid-modifying drug
treatment by a specialist with expertise in FH in a child-focused setting by the age of 10 years.
Statement 8: People with familial hypercholesterolaemia (FH) are offered a structured review at least
annually.
4. Increase proportion of patients with Transient Ischaemic Attack (TIA) treated within 24 hours
In 2012, around 1 in 20 TIAs led to a stroke within a week. There are already local areas offering a
comprehensive service for people who have suffered a TIA, but there is significant regional variation
in the availability and the capacity of services. Up to 80 percent of strokes that occur after a TIA
could be avoided if timely and effective treatments were provided. This depends on better public
awareness of the importance of recognising the symptoms of a stroke but also on having responsive
services that are available in all parts of the country and seven days a week. This requires access
to specialists for diagnosis, brain imaging for some patients and vascular surgery for the 5-10
percent of people with TIA that are appropriate for carotid endarterectomy31 (removing the plaque
from the carotid artery to restore normal blood flow).
The rate of performed carotid endarterectomies for Kingston was 7.1/100,000, which was
significantly lower than the London (7.3/100,000) and England (8.7/100,000) rates19.
Kingston Hospital Trust has an Acute Stroke Unit which is part of the London Stroke Network. A
daily consultant led TIA clinic takes place on the AEC (Ambulatory Emergency Care) for urgent
assessment and treatment of suspected TIAs.
5. Establishment of hyper-acute stroke services
Optimisation of acute stroke services to ensure 24/7 access to specialist care (including
thrombolysis) and prompt admission to acute stroke units, reconfiguring services where necessary
to ensure high-quality, safe and effective care for all those experiencing stroke is important.
Evidence from the implementation of the London model for hyper acute stroke services is that
mortality from stroke is currently 28% lower in London than the rest of England32.
There is a hyper acute stroke unit at St. George’s Hospital Trust which gives immediate care for
patients who have a suspected stroke. This is a regional service so the patients from local hospitals
who do not provide thrombolysis outside normal working hours are also treated there.
Table 3 below shows that the care received by stroke patients in Kingston is generally better than
the national average and the percentage of patients who spent more time in a stroke unit has
increased between 2013/14 and 2014/15 from 79% to 86%.
31 Factsheet: Increase proportion of patients with Transient Ischaemic Attack (TIA) treated within 24 hours
https://www.england.nhs.uk/wp-content/uploads/2014/03/pm-fs-3-5.pdf
32 Factsheet: Establishment of hyper-acute stroke services
https://www.england.nhs.uk/wp-content/uploads/2014/02/pm-fs-3-6.pdf

23
Table 3: Treatment offered to patients with Stroke in Kingston and England, 2013 to 2015
2013-14 2014-15
Percentage of patients with stroke admitted to an acute stroke unit within 4 hours of arrival to hospital
Kingston 62.0 60.8
England 59.9 58.7
Percentage of people who have had an acute stroke that receive thrombolysis
Kingston 16.0 12.2
England 11.6 11.6
Percentage of people with stroke discharged from hospital with a joint health and social care plan
Kingston 91.4 91.3
England 69.1 81.1
The percentage of people who have a follow-up assessment between 4 and 8 months after initial admission for stroke
Kingston 14.3 32.3
England 16.3 20.6
Percentage of people that have had an acute stroke who spend 90% or more of their hospital inpatient stay on a stroke unit
Kingston 78.7 86.0
England 83.6 82.4
Source: The Royal College of Physicians (RCP) Sentinel Stroke National Audit Programme (SSNAP), accessible via
the CCG Outcomes Tool, 2015
6. Encourage use of Intermittent Pneumatic Compression sleeves in stroke patients
Approximately 60,000 - 80,000 patients each year are admitted to UK hospitals with an acute stroke
and are immobile. It is estimated that 10-25 percent will develop deep vein thrombosis (DVT). Until
recently there were no preventive strategies which had been clearly shown to be both effective and
safe. However, there is now good evidence to suggest that Intermittent Pneumatic Compression
(IPC) sleeves are effective in preventing DVT and consequently reducing mortality in patients who
are initially immobile after being hospitalised with acute stroke. It is estimated that if IPC sleeves
are used in all appropriate patients approximately 1,000 lives could be saved a year across England,
and also reduce emergency admissions through reduced risk of clotting33.
7. Improved management of patients with ST-elevated Myocardial Infarction (STEMI)
ST-segment-elevation myocardial infarction (STEMI) occurs when a coronary artery becomes
blocked by a blood clot, causing the heart muscle supplied by the artery to die. It belongs to a group
of heart conditions known as acute coronary syndromes.
Evidence suggests there is a clear relationship between speed of reopening an artery following a
heart attack and muscle damage. Improved mortality rate comes from reducing variation in
performance34. Implementation of the NICE guidelines 167 and 172 in all cardiac centres would
speed up the process between “doors to balloon time" and reduce variation in care processes for
patients following a heart attack. In England in 2011/12, 92% of STEMI patients eligible for primary
angioplasty were treated within 90 minutes of arrival at a heart attack centre.
Primary angioplasty for Kingston residents was 100% of all reperfusion35 for patients diagnosed as
STEMI, compared to 95% in England (2011/12). The median time to primary angioplasty treatment
33 Factsheet: Intermittent Pneumatic Compression to prevent post stroke Deep Vein Thrombosis (DVT) https://www.england.nhs.uk/wp-content/uploads/2014/02/pm-fs-3-71.pdf 34 Factsheet: Greater provision of angioplasty following ST-elevated Myocardial Infarction (STEMI) and reduced door to balloon times https://www.england.nhs.uk/wp-content/uploads/2014/02/pm-fs-3-81.pdf 35 Reperfusion therapy - is medical treatment that restores blood flow through blocked arteries, typically after a heart attack
(myocardial infarction). Categories of reperfusion therapy thus include clot-busting (fibrinolytic) drugs and procedures to open
arteries with stents, or to graft arteries around blockages.

24
from a call for help was 106 minutes for Kingston residents; this is lower than in London and England
(115 and 111 respectively). There were less than 5 deaths recorded within 30 days of hospital
admission for STEMI patients resident in Kingston in 2011/12. The 30 day mortality rate in London
and England was 8% and 8.7% respectively19.
8. Improved management of NSTEMI patients
Non-ST segment elevation myocardial infarction is one type of myocardial infarction defined as a
development of heart muscle necrosis (a form of cell death) without the ECG (electrocardiography)
change of ST-segment elevation, resulting from an acute interruption of blood supply to a part of
the heart. Absence of ST-segment elevation in NSTEMI is understood to involve less than full
thickness (partial thickness) damage of heart muscle. Therefore, NSTEMI is less severe type of
heart attack compared to STEMI (ST-segment elevation myocardial infarction) in which full
thickness damage of heart muscle develops.
For STEMI patients ambulance protocols dictate that the ambulance team should take the patient
directly to a cardiac centre, but there is no automatic requirement to do so for NSTEMI patients. As
a result, inter-hospital transfers to specialist centres can be delayed and some patients die awaiting
a transfer.
Non-STEMI patients can be treated less invasively, but still need specialist management.
Anticoagulation and antiplatelet agents are given to prevent the narrowed artery from occluding.
The proportion of non-STEMIs seen by a member of the cardiology team for Kingston residents is
100%; this is higher than London and England (96.4% and 93.7% respectively)19.
9. Increase proportion of patients offered cardiac rehabilitation
Currently, many people who might benefit do not receive adequate cardiac rehabilitation, particularly
following a diagnosis of heart failure. There are also marked inequalities in the way people access
the available services. Women, minority ethnic groups, the elderly and people with more severe
CHD are all under-represented among users of the rehabilitation services. The extent and nature of
provision varies dramatically around the country. Cardiac rehabilitation is recommended by NICE
(Clinical Guideline 48) for the secondary prevention of myocardial infarction (MI) following a hospital
admission. The case for rehabilitation in patients with chronic heart failure is made in the NICE
quality standard. There is evidence that exercise-based cardiac rehabilitation is effective in reducing
mortality hospital admissions in people with CHD and that it significantly reduces hospitalisation for
people with chronic heart failure and significantly improves their quality of life and exercise
tolerance36.
The cardiac rehabilitation services to Kingston residents are being provided by Your Healthcare, a
non-profit social enterprise, formerly part of NHS Kingston. The cardiac rehabilitation services care
for people with heart disease and those who are at a high risk of developing CVD. There is a team
of specialist nurses, a physiotherapist and cardiac exercise instructors who run clinics and session
on an individual basis and group programmes.
822 patients were offered cardiac rehabilitation services by Your Healthcare between 2013 and
2015. Table 4 shows the different sources of referral.
36 Factsheet: Increase uptake of cardiac rehabilitation for people with coronary artery disease and following acute heart failure https://www.england.nhs.uk/wp-content/uploads/2014/02/pm-fs-3-10.pdf
25
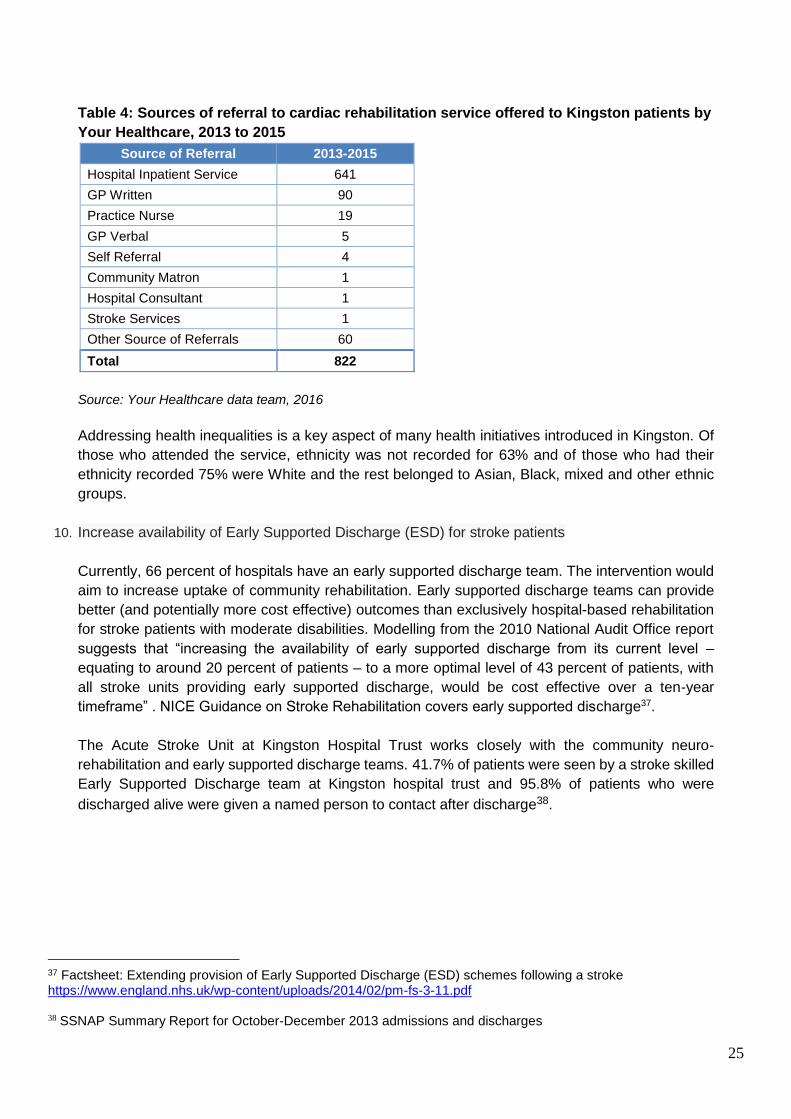
Table 4: Sources of referral to cardiac rehabilitation service offered to Kingston patients by
Your Healthcare, 2013 to 2015
Source of Referral 2013-2015
Hospital Inpatient Service 641
GP Written 90
Practice Nurse 19
GP Verbal 5
Self Referral 4
Community Matron 1
Hospital Consultant 1
Stroke Services 1
Other Source of Referrals 60
Total 822
Source: Your Healthcare data team, 2016
Addressing health inequalities is a key aspect of many health initiatives introduced in Kingston. Of
those who attended the service, ethnicity was not recorded for 63% and of those who had their
ethnicity recorded 75% were White and the rest belonged to Asian, Black, mixed and other ethnic
groups.
10. Increase availability of Early Supported Discharge (ESD) for stroke patients
Currently, 66 percent of hospitals have an early supported discharge team. The intervention would
aim to increase uptake of community rehabilitation. Early supported discharge teams can provide
better (and potentially more cost effective) outcomes than exclusively hospital-based rehabilitation
for stroke patients with moderate disabilities. Modelling from the 2010 National Audit Office report
suggests that “increasing the availability of early supported discharge from its current level –
equating to around 20 percent of patients – to a more optimal level of 43 percent of patients, with
all stroke units providing early supported discharge, would be cost effective over a ten-year
timeframe” . NICE Guidance on Stroke Rehabilitation covers early supported discharge37.
The Acute Stroke Unit at Kingston Hospital Trust works closely with the community neuro-
rehabilitation and early supported discharge teams. 41.7% of patients were seen by a stroke skilled
Early Supported Discharge team at Kingston hospital trust and 95.8% of patients who were
discharged alive were given a named person to contact after discharge38.
37 Factsheet: Extending provision of Early Supported Discharge (ESD) schemes following a stroke https://www.england.nhs.uk/wp-content/uploads/2014/02/pm-fs-3-11.pdf 38 SSNAP Summary Report for October-December 2013 admissions and discharges

26
Current Services
CVD Prevention
NHS Health Check Programme
The ‘NHS Health Checks’ programme is a national initiative that offers a ‘vascular check’ (for heart disease,
stroke, diabetes and kidney disease) to all persons aged between 40 and 74 years every 5 years. The aim
of the programme is to promote the prevention of vascular disease and to reduce vascular morbidity and help
people to improve their quality of life. The programme may also identify existing, but not previously diagnosed
cases of vascular disease. This universal risk assessment and management programme could significantly
increase the uptake of preventive lifestyle programmes (such as weight management and physical activity)
and encourage individuals to make personal changes to improve their health.
Locally, the programme was launched in September 2009. It is currently being provided by all practices and
in the community targeting hard to reach population groups. Over 23,000 health checks were delivered in
Kingston since the program began.
The overall uptake rate of the health checks in Kingston was generally good with an average uptake over
70% during the last 5 years (2010-15). Further work is required to improve the uptake in General practice
which was 62% during the same period. The providers of the outreach programme were successful in terms
of delivering large number of health checks but they did not manage to target the health check to the hard to
reach communities. The average percentage of people who were identified to be at high risk of developing
CVD in the community (8%) was lower than the estimated CVD risk (9 – 10%). Large numbers of patients
were referred to the lifestyle services. Local data show that between 2010 and 2015 over 4,000 patients were
referred, however only 1,700 referrals were received by the lifestyle coordinator and of these only around
1,000 patients attended a lifestyle programme. The uptake of the pharmacy health checks in local
pharmacies was on average low.
Lifestyle Programmes
Smoking Cessation
636 (361 females and 320 males) Kingston residents accessed smoking cessation services in 2014/15. To
reduce health inequalities, it is important that NHS stop smoking services target larger numbers of smokers
from the deprived communities. The Kick-it service targets people in the more deprived areas of Kingston
such as Norbiton, Grove and Kingsnympton.
The quit rate for those people who access the stop smoking services locally is 33% in a hospital setting, 42%
in a pharmacy setting, 46% in a practice setting, 50% in a community setting and 27% in a workplace setting
giving an average quit rate of 45% in 2014/15.

27
Weight Management
Weigh 2 Go
Weigh 2 Go is a local ten week programme offered free to adults aged 18 and over which aims to help people
to reduce their weight and promote healthy lifestyle changes. The programme is delivered by trained
specialist advisors in selected GP surgeries and pharmacies in both one-to-one and group settings.
Sessions involve practical nutrition advice in line with public health messages, for example on label reading
and portion size control. The majority of participants who attended Weigh 2 Go were female (77% in 2014/15)
and most participants were aged between 18-65 years (78% in 2014/15).
Weigh 2 Go has a very good retention and completion rate for a primary care-led intervention when compared
to other similar weight management programmes39. During the period 2014-2015, 319 participants enrolled
onto the programme with a retention rate of 57% across the GP and Pharmacy setting. Of these, 75% of
participants achieved some degree of weight loss in the short term. 18% of participants achieved a clinically
significant weight loss of 5% or more. This rises to 31% amongst participants who ‘completed’ the programme
by attending six or more sessions40.
There is a lack of a Tier 3 weight management service. This would be a multidisciplinary service for obese patients who
have either attended Tier 1 or 2 with limited improvement or are at high risk (e.g. obese with co-morbidity) and therefore
may be eligible for bariatric surgery. This service would allow for more intensive weight management and help
to meet NICE guidelines for the weight management pathway towards bariatric surgery (or alternatively help
them lose weight rather than go for surgery depending on the needs of the patient). Far fewer men are
accessing this service despite them being available at Tier 2.
Physical Activity
Table 1 shows the number of people participating in various physical activity programmes provided by the
Department of Public Health in Kingston. It shows that in 2013/14 over 10,000 people participated in these
programmes. The majority (8,000 people) were those participating in the ParkRun programme.
Table 1: Number of people participating in the programmes offered by Kingston Public Health,
2013/14
Programs offered by Kingston Public
Health Team
Number of
Participants
Percentage
Participants
Get Active 562 6.0%
Health Walks 742 7.0%
Fit as Fiddle 244 2.0%
ParkRun 8,000 80.0%
Sustrans active travel 367 4.0%
Good Energy Club (mental health) 43 0.0%
Active Gardening 60 1.0%
Total 10,018 100.0%
39 Jolly K, Lewis A, Beach J, Denley J, Adab P, Deeks J, Daley A, Aveyard P. Comparison of range of commercial or
primary care led weight reduction programmes with minimal intervention control for weight loss in obesity: Lighten Up
randomised controlled trial. BMJ 2011: 343:d6500 doi: 10.1136/bmj.d6500
40 Weigh2 Go data 2012/13 year end summary evaluation

28
Source: Physical Activity Team, Kingston Public Health, 2013/14
There is a need for a low cost specialist and accessible service to support people with mental health problems
to participate in physical activity and improve the opportunities available to tackle maternal obesity and
associated health risks through physical activity. More information can be found in the Physical Activity
http://data.kingston.gov.uk/SH_Physical_Activity/ Chapter of the JSNA.
Alcohol Services
The e-drink-check is a free, tailored website for Kingston residents that provides a discreet and flexible way
of thinking about how much they are drinking and whether they would like to drink less or even stop altogether.
It contains information about alcohol and its effects, as well as tools and tips for people wishing to moderate
their drinking. Participants will need access to an internet connection and can register at http://e-drink-
check.kingston.gov.uk/ . Between October 2013 and May 2015 1,250 users accessed the site, 709 completed
AUDIT-C, 495 went on to complete the full AUDIT. GP referrals increased from 9% to 14% from April 2014
to May 2015. The past week’s alcohol intake decreased from a mean of 24 units in 13/14 to 20 units in 14/15.
The Kingston Wellbeing Service can offer a range of treatments to local residents, aged 18 years and over,
who have problems with drugs and/or alcohol. Whether people are looking to control their drinking or feel
that their drug use has become problematic, help is available. Kingston Wellbeing Service provides a single
point of access to assessment and treatment, including treatment of related depression and anxiety disorders.
In 2014-15, 227 people accessed alcohol treatment through the Kingston Wellbeing Service in Kingston.
Kingston has a significantly higher proportion of GP referrals with 34% compared to 19% nationally. However
referrals from hospital and A&E are lower than the national average with 4% referred via this route compared
to 8% nationally.
There is a need to increase access to evidence based alcohol treatment interventions outside of the treatment
service hub at Surbiton Health Centre. This should include access to evidence based online treatment and
recovery programmes to better meet the needs of parents and those with caring responsibilities, people with
mobility issues and those in employment or education.
Addiction Support and Care Agency (ASCA) is an established charity (c. 1990) offering low-cost, confidential,
1-to-1 counselling and advice in Kingston for those affected by alcohol and substance misuse. In 2014 – 15
ASCA provided counselling and assessment to 77 Kingston residents who had alcohol as a primary problem
and also provided advice and telephone support to 58 people. During this time they also provided carers
counselling or group support to 29 residents and telephone support to another 46.
Over the last 5 years (2009/10 to 2013/14) the alcohol-related cardiovascular disease conditions hospital
admissions have increased from 832/100,000 to 1,038/100,000. Hospital admissions are higher for males in
comparison with their female counterparts and Kingston has had a higher rate of admissions for alcohol
related cardiovascular disease conditions for males than the England average.
Reduce Your Risk
Reduce Your Risk (RYR) is an intensive lifestyle programme offered for people at increased risk of developing
cardiovascular disease. The programme is provided by the cardiac rehabilitation team who ensures that the
programme is supported by a nurse, a physiotherapist and specialist instructors. Patients are offered one-to-
one assessment and support, exercise classes, weight management, educational sessions, stress
management and relaxation training. All patients receive CVD risk assessment before and after joining the
programme and all the patients outcomes are fed back to their GP. The programme is open to patients’
29
partners who can join the educational session or join the programme if they were assessed to be at high risk
of developing CVD.
Only a small fraction of the patients who were identified via the health check to be at high risk of developing
CVD were referred to RYR whilst the majority of the high risk patients were referred to less suitable lifestyle
programmes. Work is currently undergoing to extend the opening hours of the RYR programme.
Community Cardiology Programme
The Community Cardiology Programme was a nine months pilot which started in November 2014. This new
model of care was initiated by Kingston CCG’s specifically for patients with low cardiovascular risk. The
Kingston Community Cardiology Service (KCCS) pilot provided a community service for the cohort of
patients, who do not clinically require a secondary care first appointment.
The new model of care delivered by the pilot KCCS provided Kingston CCG GPs with easy referral routes, a
cardiology education programme as well as an on-going link to secondary care specialists to obtain advice
on managing their low risk cardiovascular patients within the primary care setting. The pilot KCCS also
informed and educated the patients to understand their diagnosis and empower them to effectively self-
manage and seek clinical advice and assistance when required, from their GP.
This pilot also assisted in reducing inappropriate demand for outpatient services and potentially non-elective
emergency care, thus supporting the need to reduce use of secondary care services required strategically.
A patient survey was conducted and there were only 6 responses received from the 61 patients who received
their care via this route. From the survey it is evident that people did not feel confident in handling their
condition after their first contact with their GP.
Community Voice
A patient survey was conducted within the Community Cardiology Programme – 61 patients who already
received their care via this route were all asked to take part in the survey. However, the response rate for this
survey was very low (10%).
In addition to the above, patient satisfaction surveys were also conducted for the NHS Health checks
community outreach programs. Please also see the Customer Satisfaction Survey report
http://data.kingston.gov.uk/resource/view?resourceId=669 . User views on services relate to Chronic Kidney
Disease (CKD) as well as to services covered in the JSNA: obesity, physical activity, diabetes.

30
Recommendations
1. Actively promote the public health lifestyle programmes to the public to encourage more people to adopt
a healthier lifestyle.
2. Encourage practice health professionals to refer more people to the lifestyle programmes to reduce the
prevalence of smoking, obesity, alcohol misuse and inactivity.
3. Encourage the identification of CVD cases in primary care. Estimates of the prevalence of CVD in
Kingston indicate that large numbers of people are unaware of their condition.
4. Improve the care of stroke patients in the community to reduce the number of hospital admissions.
5. Encourage the case finding of CVD in women to reduce the number of emergency admissions.
6. Encourage more people living in the deprived areas of Kingston to adopt a healthier lifestyle.
7. Encourage more people living in the deprived areas of Kingston to join the lifestyle programmes.
8. Improve the case finding of CVD in the deprived areas of Kingston by encouraging more people to have
the health check.
9. Improve the care of heart failure patients in the community.
10. Mortality from stroke and CHD declined in Kingston between 2003 and 2013 by 50% and 28%. More
effort is needed to reduce the prevalence of obesity, improve the case finding of people with non-diabetic
hyperglycaemia and diabetes to reduce the mortality from diabetes which only declined by 19% during
the same period.
11. Improve the case finding of people with non-diabetic hyperglycaemia and diabetes via the NHS health
check programme.
12. Encourage more people and health professionals to take up training in cardio-pulmonary resuscitation
(CPR).
13. Improve the identification of patients with AF and ensure appropriate pharmacological interventions are
in line with NICE guidelines to reduce the incidence of AF related strokes in Kingston.
14. A good number of practices have managed to achieve a good uptake of the NHS Health checks, however
more work is still needed to encourage the other practices to increase the number of delivered health
checks and to improve the risk management and follow-up of their patients.
15. Encourage future providers of the outreach programme to target the health checks to BME and
marginalised groups.
16. The main aim of the health check programme is to encourage people to modify their lifestyle to reduce
their risk factors and practices can play an important part in achieving this aim by providing the health
promotion part of the health check and motivating the patients to join suitable lifestyle programmes.
17. Reduce the number of pharmacies delivering the health checks due to the low uptake of the programme.
18. Encourage practices to refer their high risk patients to an intensive lifestyle programme such as the
Reduce Your Risk multi-factorial programme.

31
19. Extend the opening hours of the Reduce Your Risk (RYR) or provide it during the weekend.
20. People need to be encouraged to feedback their views about the Community Cardiology Programme.
21. Additional support is needed for CVD patients who do not feel confident in handling their condition after
their first contact with their GP.
22. Opportunities to raise awareness of community alcohol intervention options within Kingston Hospital and
develop local pathways.
23. Increase the number of people accessing alcohol treatment and recovery interventions in primary care,
community hubs and acute settings through the use of online treatment and recovery programmes and
the development of shared care models/pathways.
24. Develop a framework to monitor the local implementation of IBA for increasing risk and higher risk drinkers
and to targeted groups and review practice to ensure effectiveness.
25. Improve the impact of the Kingston e-drink-check website by wider dissemination through local authority
channels and partners’ distribution networks.
26. Improve effectiveness of local community voice methodologies in order to capture user satisfaction of
NHS Health Checks, lifestyle programmes, and community cardiology programmes.

32
Useful Links
NCVIN Cardiovascular disease profile updates NCVIN Cardiovascular disease profiles have been refreshed. The profiles,
which are updated annually, provide a wide range of data on cardiovascular disease (CVD) for each CCG in England, bringing together the latest intelligence from five separate profiles - Risk Factors, Diabetes, Heart disease, Chronic Kidney disease and Stroke as downloadable PDFs. The profiles are for commissioners and health professionals to use when assessing the impact of CVD on their local population, opportunities for improvement and making decisions about services and emerging issues.
CVD Outcomes Strategy (https://www.gov.uk/government/publications/improving-cardiovascular-disease-outcomes-strategy ) Optimal value pathway on CVD prevention http://www.pcc-cic.org.uk/article/optimal-value-pathway-cardiovascular-disease-prevention Check your heart age (https://www.nhs.uk/tools/pages/heartage.aspx ) CVD Intelligence Pack (http://www.yhpho.org.uk/default.aspx?RID=185783 ) Commissioning for value Focus Pack (http://www.yhpho.org.uk/default.aspx?RID=185783 ) Key fact sheets for behavioural, non behavioural risk factors and CVD conditions (http://www.yhpho.org.uk//resource/view.aspx?RID=185796 ) Hypertension profile
(http://www.yhpho.org.uk/default.aspx?RID=185783 )
Help and Information Your healthcare cardiac rehabilitation service http://www.yourhealthcare.org/services/cardiac-rehabilitation/ Kingston Hospital Stroke Unit https://www.kingstonhospital.nhs.uk/media/33579/rehab-file-info-for-stroke-handbook-insert-3-.pdf St George’s Hospital cardiology department https://www.stgeorges.nhs.uk/service/cardiovascular/cardiology/ Free and low cost services to help you stay healthy https://www.kingston.gov.uk/info/200307/staying_healthy

33
Glossary
1. QOF – Quality and Outcomes Framework
2. CHD – Coronary Heart Disease, Also known as ischaemic heart disease, this is the most common
form of heart disease in Australia. The two major forms of coronary heart disease are heart attack
(also known as acute myocardial infarction) and angina.
A heart attack is caused when blood supply to the heart is blocked completely, often
causing damage to the heart muscle and its function.
Angina is a chronic condition where short episodes of chest pain occur periodically, caused
by a temporary shortage of blood supply to the heart. Angina is not usually life-threatening,
but can be associated with increased risk of heart attack.
3. CVD – Cardiovascular disease
4. PAD - Peripheral arterial disease. This term refers to disease of large arteries that supply blood to the
peripheries and can be caused by blockage of arteries due to cholesterol or fatty substances, or
caused by widening of the arteries such as the aorta, which in severe cases can lead to rupture of the
arterial wall
5. AF – Atrial Fibrillation
6. APHO – Association of Public Health Observatories
7. CCG – Clinical Commissioning Group
8. CKD Chronic Kidney Disease
9. PHE – Public Health England
10. RYR – Reduce your Risk
11. BME – Black and Minority Ethnics
12. KCCS - Kingston Community Cardiology Service
13. IBA – Identification and Brief Advice
14. CPR - Cardio-Pulmonary Resuscitation
15. DSR – Directly Standardised Mortality Rate. The age-specific rates of the subject population are
applied to the age structure of the standard population. This gives the overall rate that would have
occurred in the subject population if it had the standard age-profile.
16. AUDIT C - is an alcohol screening test designed to see if people are drinking harmful or hazardous
amounts of alcohol. It can also be used to identify people who warrant further diagnostic tests for
alcohol dependence.