d3.js: a quick workshop - university of notre dameqzhi/class/webapplication/d3/d3.pdfmaking...
TRANSCRIPT

D3.js: a quick workshop

Data Visualization

Design Motivations

Design Motivations —Make sense of why, not just how

Making visualizing easier

Using existing standards (HTML and SVG)
• expressiveness
• future-proofing
• compatibility with existing tools

Constructing a DOM from data
• each data has a corresponding element
• mapping
• update DOM for new data

Data-Driven Documents

Learning D3 is a process of learning web standards

HTML
<!DOCTYPE html> <meta charset="utf-8"> <body> Hello, world!

SVG (draw vector graphs in browser)
<!DOCTYPE html> <meta charset="utf-8"> <svg width="960" height="500"> <text y="12"> Hello, world! </text> </svg>
d3: using js to embed svg into html

CSS
<style> body { background: steelblue; } </style>

JavaScript
<!DOCTYPE html> <meta charset="utf-8"> <body> <script> console.log("Hello, world!"); </script>

Start Small
You don’t need to know everything before starts

Getting start
• <script src="https://d3js.org/d3.v4.min.js"></script>
• web server is required (not file://)
• MAMP
• python -m SimpleHTTPServer 8888 &
• browser developer tool
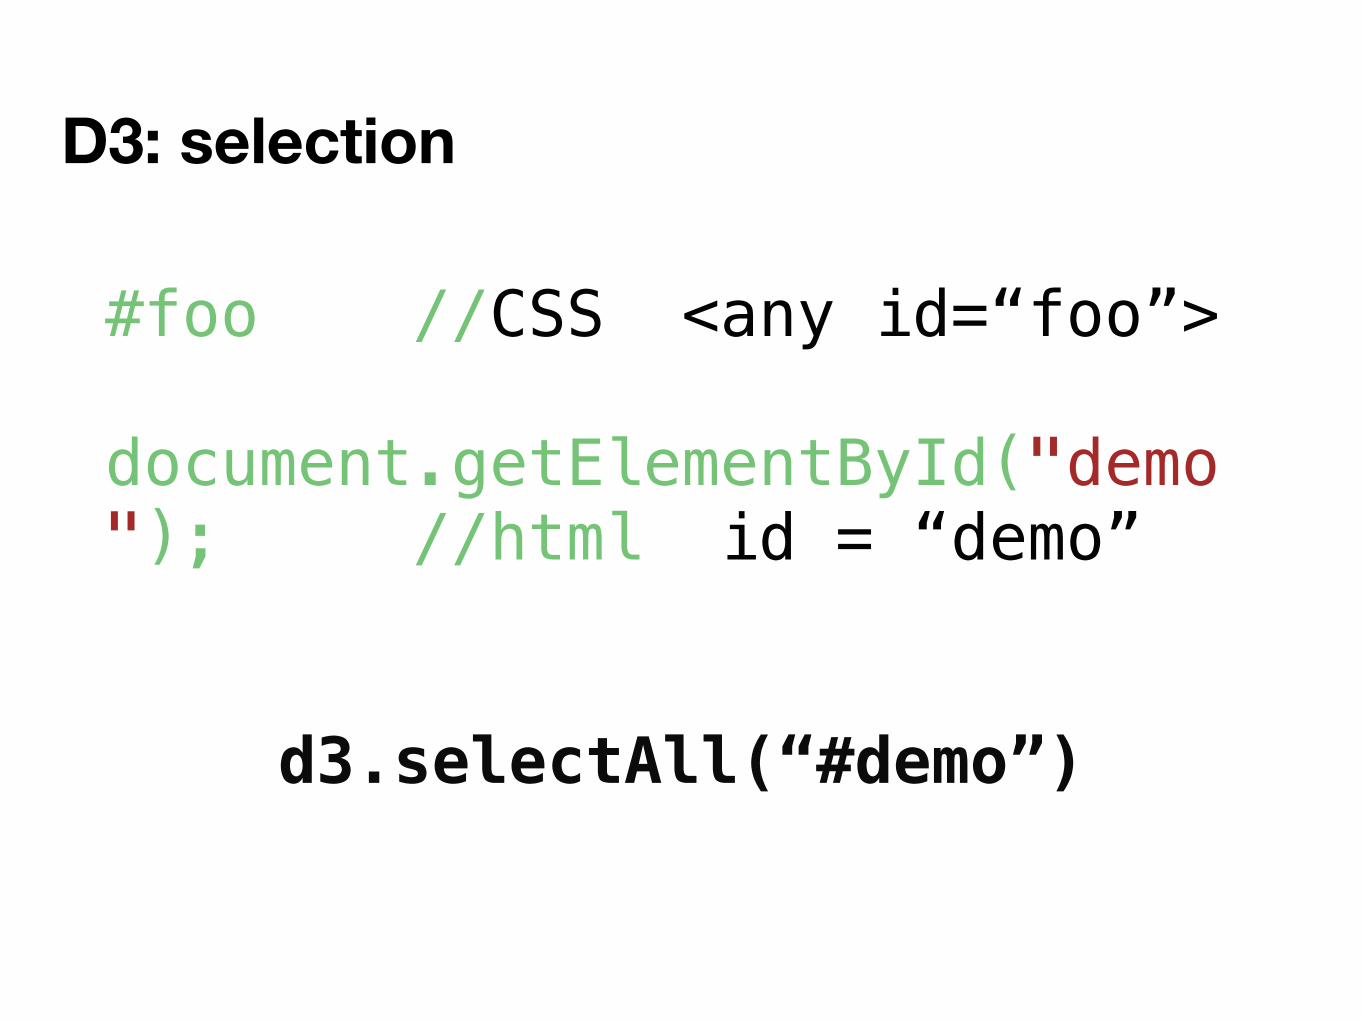
D3: selection
#foo //CSS <any id=“foo”>
document.getElementById("demo"); //html id = “demo”
d3.selectAll(“#demo”)

D3: selection and attr
d3.selectAll("circle") .attr("cx", 20) .attr("cy", 12) .attr("r", 24) .style("fill", "red");
Chaining: shorter + readable

D3: selection and append
// select the <body> element var body = d3.select("body");
// add an <h1> element var h1 = body.append("h1"); h1.text("Hello!");

D3: bind data
var data = [1, 1, 2, 3, 5, 8];

D3: bind data
var data = [ {x: 10.0, y: 9.14}, {x: 8.0, y: 8.14}, {x: 13.0, y: 8.74}, {x: 9.0, y: 8.77}, {x: 11.0, y: 9.26} ];

D3: bind data

D3: bind data
svg.selectAll("circle")

D3: bind data
svg.selectAll("circle") .data(data)

D3: bind data
svg.selectAll("circle") .data(data) .enter().append("circle")

D3: bind data
svg.selectAll("circle") .data(data) .enter().append("circle") .attr("cx", x) .attr("cy", y) .attr("r", 2.5);

D3: HW example
<body> <div id="bar"></div> </body>

D3: HW example
data = [5,10]
var svg =
d3.select("#bar").append("svg").attr("width",
960).attr("height",500);

D3: HW example
svg.selectAll(".bar")
.data(data)
.enter()
.append("rect")
.attr("class", "bar")
.attr("x", 0)
.attr("y", function(d,i) { return i*60})
.attr("width", function(d) { return d*50})
.attr("height", 50);

D3: HW example

D3: further topics
• scale
• axis
• update data

Material
• d3 gallery
• Scott Murray Book (v3)
• API ref