daftar pustaka - media.unpad.ac.idmedia.unpad.ac.id/thesis/200110/2011/200110110030_l_3272.pdf ·...
TRANSCRIPT
29
DAFTAR PUSTAKA
Bernardini M., Castellini C., Lattaioli P., 1995. Effect of Strain, Feeding, Age and
Sex on Rabbit Carcass. World Rabbit Res. 15, 775-786
Blakely, J. dan Bade, D. H. 1994. Ilmu Peternakan. Gadjah Mada University Press:
Yogyakarta
Brahmantiyo, Bram., Raharjo Y.C., dan Prasetyo L.H. 2017. Production
Performance of HyCole, New Zealand White Rabbits and Its Reciprocal. JITV 22(1): 16-23
_____________. 2015. Hycole and Hyla Rabbits Performance were Raised in
Indonesia. Proceeding of the 3rd Internasional Seminar on Animal Industry,
Bogor, 17-18 September 2015.
Brahmantiyo, Bram., Nuraini, H., Rahmadiansyah D. 2017. Produktivitas Karkas
Kelinci Hyla, Hycole dan New Zealand White. Prosiding Seminar Nasional
TPV 2017: 616-626
Brahmantiyo, Bram., Priyono., Rosartio, Rian. 2016. Pendugaan Jarak Genetik
Kelinci (Hyla, Hycole, Hycole x NZW, Rex, dan Satin) Melalui Analisis
Morfometrik. Jurnal Veteriner Juni 2016 Vol.17 No.2, 226-234
Coleman, S.W. & B.C. Evans, 1985. Effect of Nutrition of Age and Size on
Compensatory Growth in Two Breeds of Steers. Journal Animal Science
63: 1968-1982.
Fourie, P. J., F. W. C. Neser, J. J. Oliver & C. Van Der Weathuizen. 2002.
Relationship between Production Performance, Visual Appraisal and Body
Measurements of Young Dorper Rams. South African Journal of Animal
Science 32: 256-262.
Grimaud. 2012. Manual of Hyplus Rabbits. Roussay (FR): La Corbiere.
Hernandez JA, Rubio MS. 2001. Effect of Breed and Sex on Rabbit Carcass Yield
and Meat Quality. World Rabbit Sci. 9:51-56
Kamalzadeh, A., W. J. Koops & J. van Bruchem, 1998. Feed Quality Restriction
and Compensatory Growth in Growing Sheep: Modelling Changes in Both
Dimensions. Livestock Production Science 53: 57-67.
30
Laidding, A. R. 1996. Hubungan Berat Badan dan Lingkar Dada dengan beberapa
Sifat Ekonomi Penting pada Sapi Bali. Buletin Ilmu Peternakan dan
Perikanan Universitas Hassanudin IV. 127-133.
Marai., I.F.M., Habeeb., A.A.M. and Gad., A.E. (2002). Rabbits' Productive,
Reproductive and Physiological Performance Traits as Affected by Heat
Stress: a Review. Livestock Production Science, 78: 71–90.
Martojo, H. 1990. Peningkatan Mutu Genetik Ternak. Pusat antar Universitas
Bioteknologi. Institut Pertanian Bogor, Bogor.
Mulliadi, D. 1996. Sifat Fenotipik Domba Priangan di Kabupaten Pandeglang dan
Garut. Disertasi. Program Pascasarjana. Institut Pertanian Bogor, Bogor.
Nizza A, Moniello G. 2000. Meat Quality and Caecal Content Characteristics of Rabbit
According to Dietary and Botanical Origin of Starch. World Rabbit Sci. 1:3-9.
Ouhayoun, J. 1987. Croissance et Qualites Boucheres dua Lapin. Cuniculture, 11 No.
58, 181-188.
Priyanti A, Raharjo YC. 2012. Market Driving to Develop Rabbit Meat Products in
Indonesia. Wartazoa 22(3): 99–106.
Sarwono, B.,2001. Kelinci Potong dan Hias. AgroMedia Pustaka. Jakarta.
Sudjana, 2005. Metode Statistika. Cet.1. PT. Tarsito: Bandung. 101
Suradi K. 2005. Upaya Peningkatan Gizi Masyarakat melalui Teknologi
Pengolahan Daging Kelinci. Lokakarya Nasional Potensi dan
Pengembangan Usaha Kelinci. [internet]. Diunduh 2 April 2018]. Tersedia
pada: http://peternakan.litbang.pertanian.go/lklc05-3.pdf.
31
LAMPIRAN
32
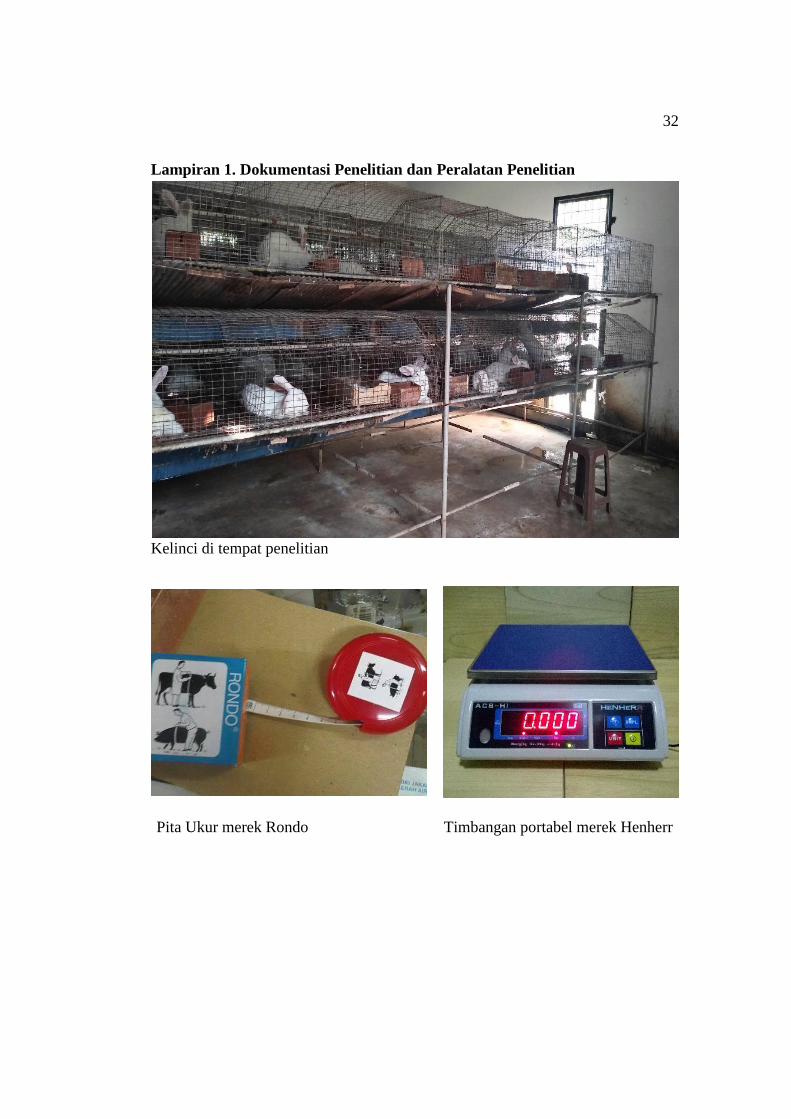
Lampiran 1. Dokumentasi Penelitian dan Peralatan Penelitian
Kelinci di tempat penelitian
Pita Ukur merek Rondo Timbangan portabel merek Henherr
33
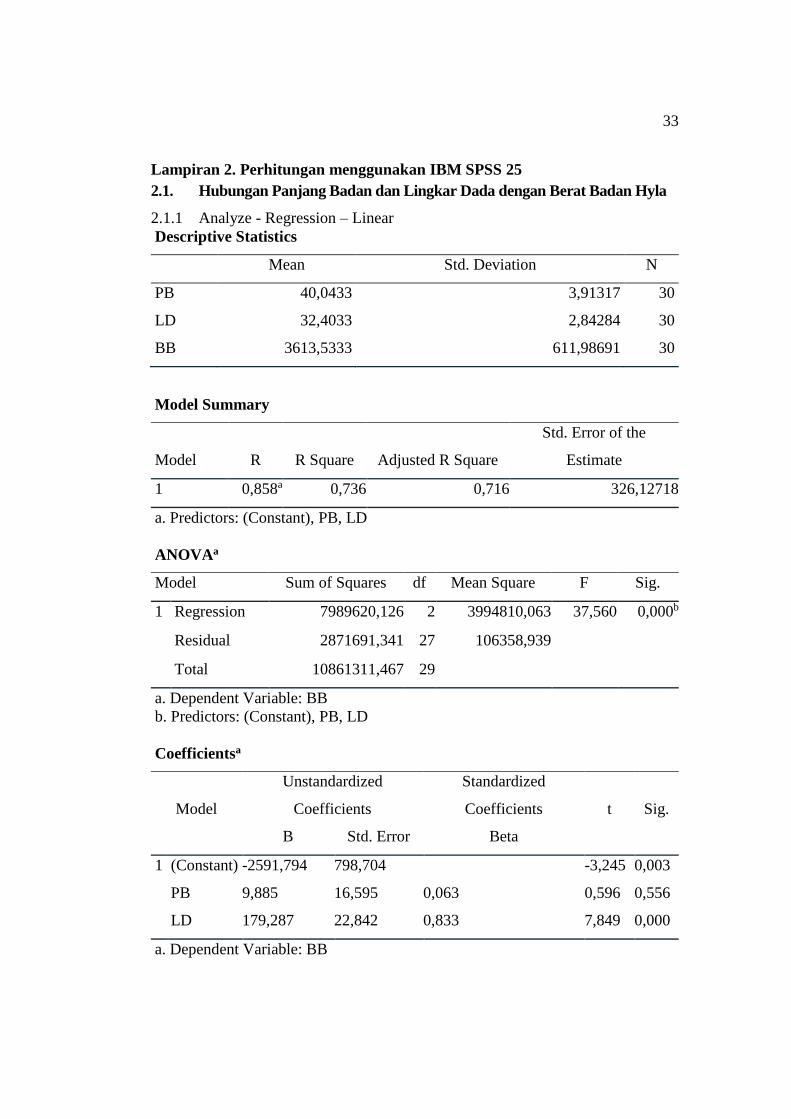
Lampiran 2. Perhitungan menggunakan IBM SPSS 25
2.1. Hubungan Panjang Badan dan Lingkar Dada dengan Berat Badan Hyla
2.1.1 Analyze - Regression – Linear
Descriptive Statistics
Mean Std. Deviation N
PB 40,0433 3,91317 30
LD 32,4033 2,84284 30
BB 3613,5333 611,98691 30
Model Summary
Model R R Square Adjusted R Square
Std. Error of the
Estimate
1 0,858a 0,736 0,716 326,12718
a. Predictors: (Constant), PB, LD
ANOVAa
Model Sum of Squares df Mean Square F Sig.
1 Regression 7989620,126 2 3994810,063 37,560 0,000b
Residual 2871691,341 27 106358,939
Total 10861311,467 29
a. Dependent Variable: BB
b. Predictors: (Constant), PB, LD
Coefficientsa
Model
Unstandardized
Coefficients
Standardized
Coefficients t Sig.
B Std. Error Beta
1 (Constant) -2591,794 798,704 -3,245 0,003
PB 9,885 16,595 0,063 0,596 0,556
LD 179,287 22,842 0,833 7,849 0,000
a. Dependent Variable: BB
34
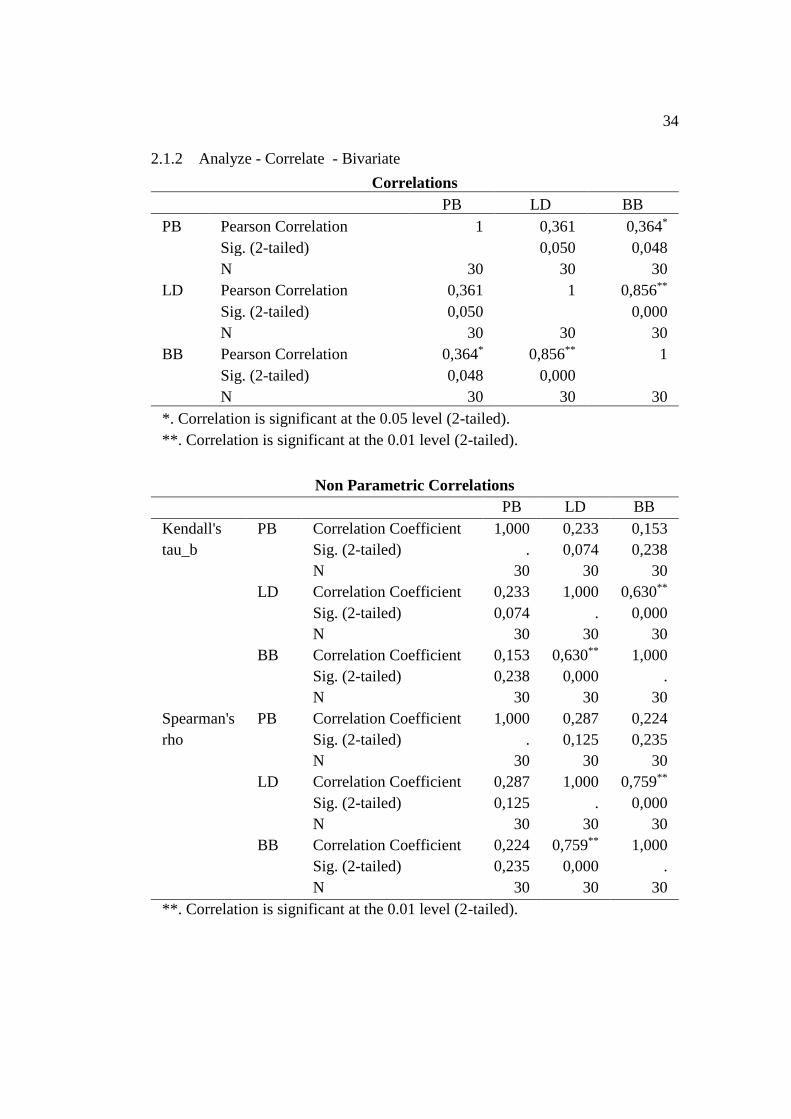
2.1.2 Analyze - Correlate - Bivariate
Correlations
PB LD BB
PB Pearson Correlation 1 0,361 0,364*
Sig. (2-tailed) 0,050 0,048
N 30 30 30
LD Pearson Correlation 0,361 1 0,856**
Sig. (2-tailed) 0,050 0,000
N 30 30 30
BB Pearson Correlation 0,364* 0,856** 1
Sig. (2-tailed) 0,048 0,000
N 30 30 30
*. Correlation is significant at the 0.05 level (2-tailed).
**. Correlation is significant at the 0.01 level (2-tailed).
Non Parametric Correlations
PB LD BB
Kendall's
tau_b
PB Correlation Coefficient 1,000 0,233 0,153
Sig. (2-tailed) . 0,074 0,238
N 30 30 30
LD Correlation Coefficient 0,233 1,000 0,630**
Sig. (2-tailed) 0,074 . 0,000
N 30 30 30
BB Correlation Coefficient 0,153 0,630** 1,000
Sig. (2-tailed) 0,238 0,000 .
N 30 30 30
Spearman's
rho
PB Correlation Coefficient 1,000 0,287 0,224
Sig. (2-tailed) . 0,125 0,235
N 30 30 30
LD Correlation Coefficient 0,287 1,000 0,759**
Sig. (2-tailed) 0,125 . 0,000
N 30 30 30
BB Correlation Coefficient 0,224 0,759** 1,000
Sig. (2-tailed) 0,235 0,000 .
N 30 30 30
**. Correlation is significant at the 0.01 level (2-tailed).
35
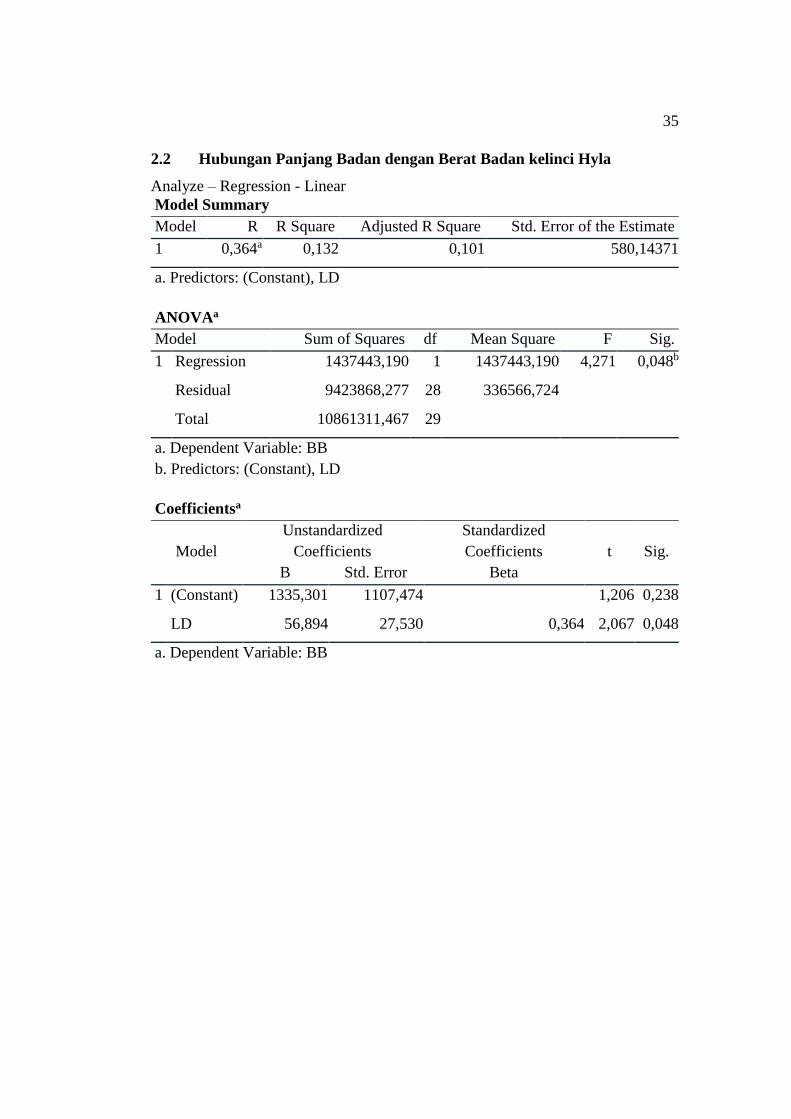
2.2 Hubungan Panjang Badan dengan Berat Badan kelinci Hyla
Analyze – Regression - Linear
Model Summary
Model R R Square Adjusted R Square Std. Error of the Estimate
1 0,364a 0,132 0,101 580,14371
a. Predictors: (Constant), LD
ANOVAa
Model Sum of Squares df Mean Square F Sig.
1 Regression 1437443,190 1 1437443,190 4,271 0,048b
Residual 9423868,277 28 336566,724
Total 10861311,467 29
a. Dependent Variable: BB
b. Predictors: (Constant), LD
Coefficientsa
Model
Unstandardized
Coefficients
Standardized
Coefficients t Sig.
B Std. Error Beta
1 (Constant) 1335,301 1107,474 1,206 0,238
LD 56,894 27,530 0,364 2,067 0,048
a. Dependent Variable: BB
36
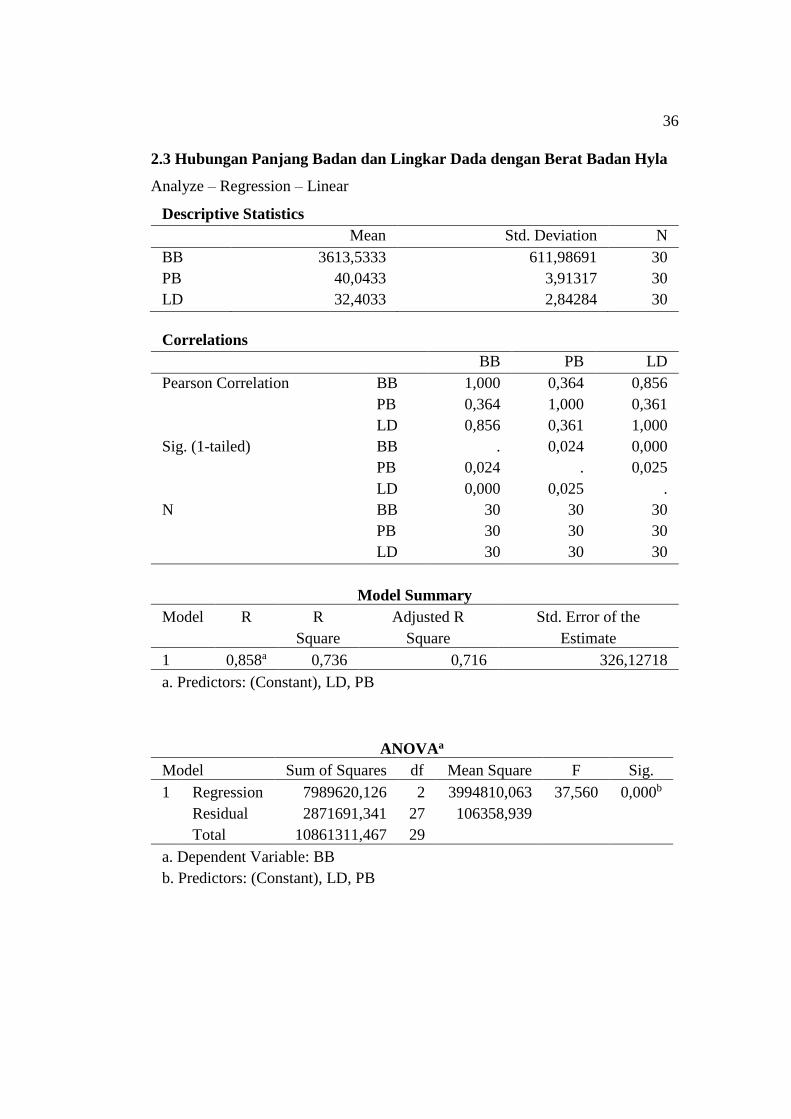
2.3 Hubungan Panjang Badan dan Lingkar Dada dengan Berat Badan Hyla
Analyze – Regression – Linear
Descriptive Statistics
Mean Std. Deviation N
BB 3613,5333 611,98691 30
PB 40,0433 3,91317 30
LD 32,4033 2,84284 30
Correlations
BB PB LD
Pearson Correlation BB 1,000 0,364 0,856
PB 0,364 1,000 0,361
LD 0,856 0,361 1,000
Sig. (1-tailed) BB . 0,024 0,000
PB 0,024 . 0,025
LD 0,000 0,025 .
N BB 30 30 30
PB 30 30 30
LD 30 30 30
Model Summary
Model R R
Square
Adjusted R
Square
Std. Error of the
Estimate
1 0,858a 0,736 0,716 326,12718
a. Predictors: (Constant), LD, PB
ANOVAa
Model Sum of Squares df Mean Square F Sig.
1 Regression 7989620,126 2 3994810,063 37,560 0,000b
Residual 2871691,341 27 106358,939
Total 10861311,467 29
a. Dependent Variable: BB
b. Predictors: (Constant), LD, PB
37
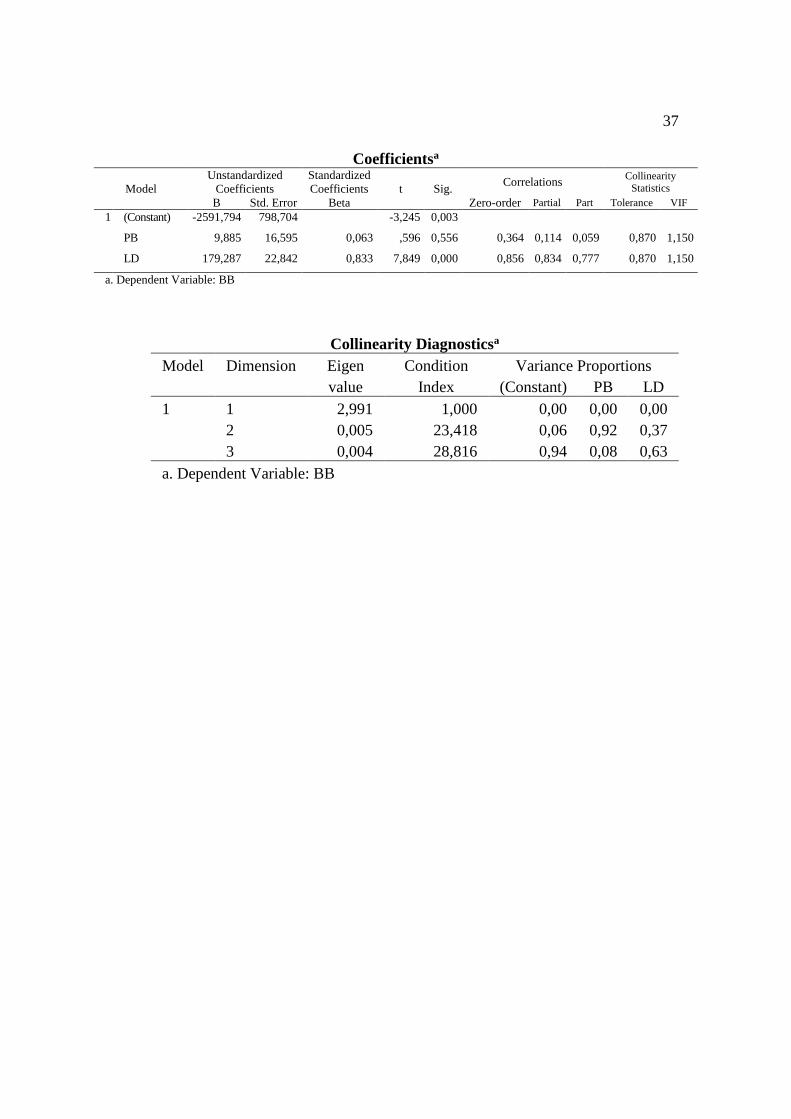
Coefficientsa
Model
Unstandardized
Coefficients
Standardized
Coefficients t Sig. Correlations
Collinearity
Statistics
B Std. Error Beta Zero-order Partial Part Tolerance VIF
1 (Constant) -2591,794 798,704 -3,245 0,003
PB 9,885 16,595 0,063 ,596 0,556 0,364 0,114 0,059 0,870 1,150
LD 179,287 22,842 0,833 7,849 0,000 0,856 0,834 0,777 0,870 1,150
a. Dependent Variable: BB
Collinearity Diagnosticsa
Model Dimension Eigen
value
Condition
Index
Variance Proportions
(Constant) PB LD
1 1 2,991 1,000 0,00 0,00 0,00
2 0,005 23,418 0,06 0,92 0,37
3 0,004 28,816 0,94 0,08 0,63
a. Dependent Variable: BB
38
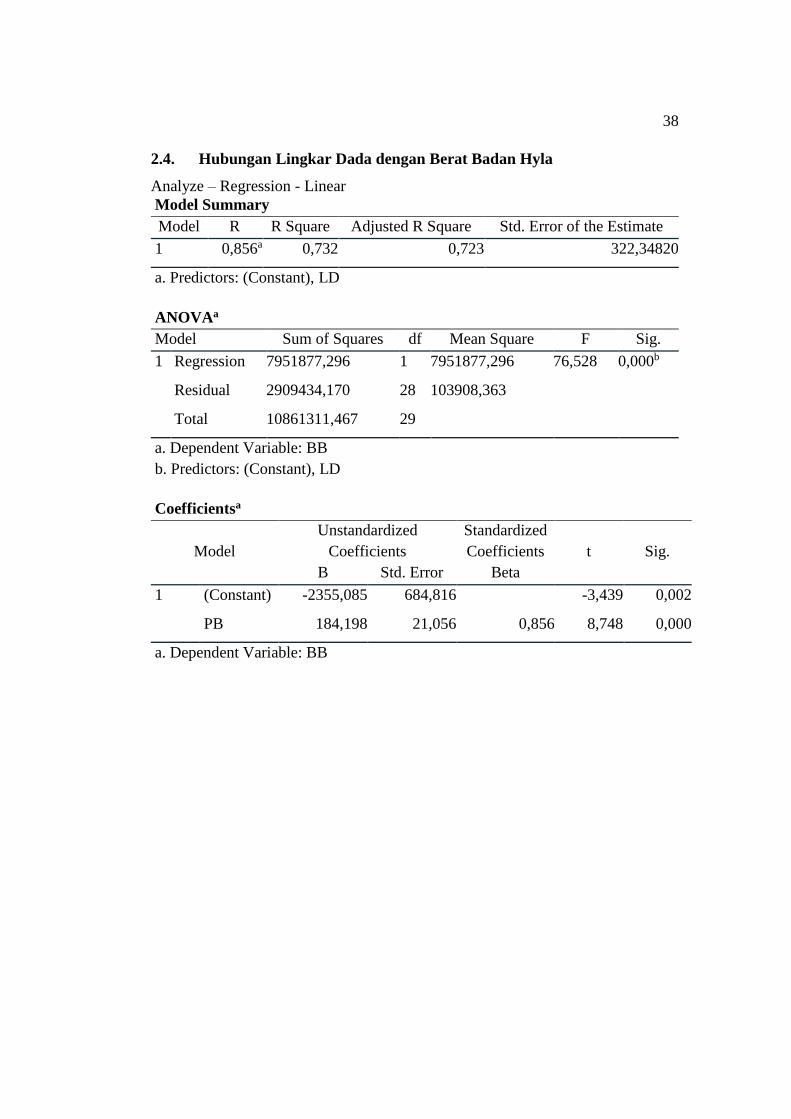
2.4. Hubungan Lingkar Dada dengan Berat Badan Hyla
Analyze – Regression - Linear
Model Summary
Model R R Square Adjusted R Square Std. Error of the Estimate
1 0,856a 0,732 0,723 322,34820
a. Predictors: (Constant), LD
ANOVAa
Model Sum of Squares df Mean Square F Sig.
1 Regression 7951877,296 1 7951877,296 76,528 0,000b
Residual 2909434,170 28 103908,363
Total 10861311,467 29
a. Dependent Variable: BB
b. Predictors: (Constant), LD
Coefficientsa
Model
Unstandardized
Coefficients
Standardized
Coefficients t Sig.
B Std. Error Beta
1 (Constant) -2355,085 684,816 -3,439 0,002
PB 184,198 21,056 0,856 8,748 0,000
a. Dependent Variable: BB
39
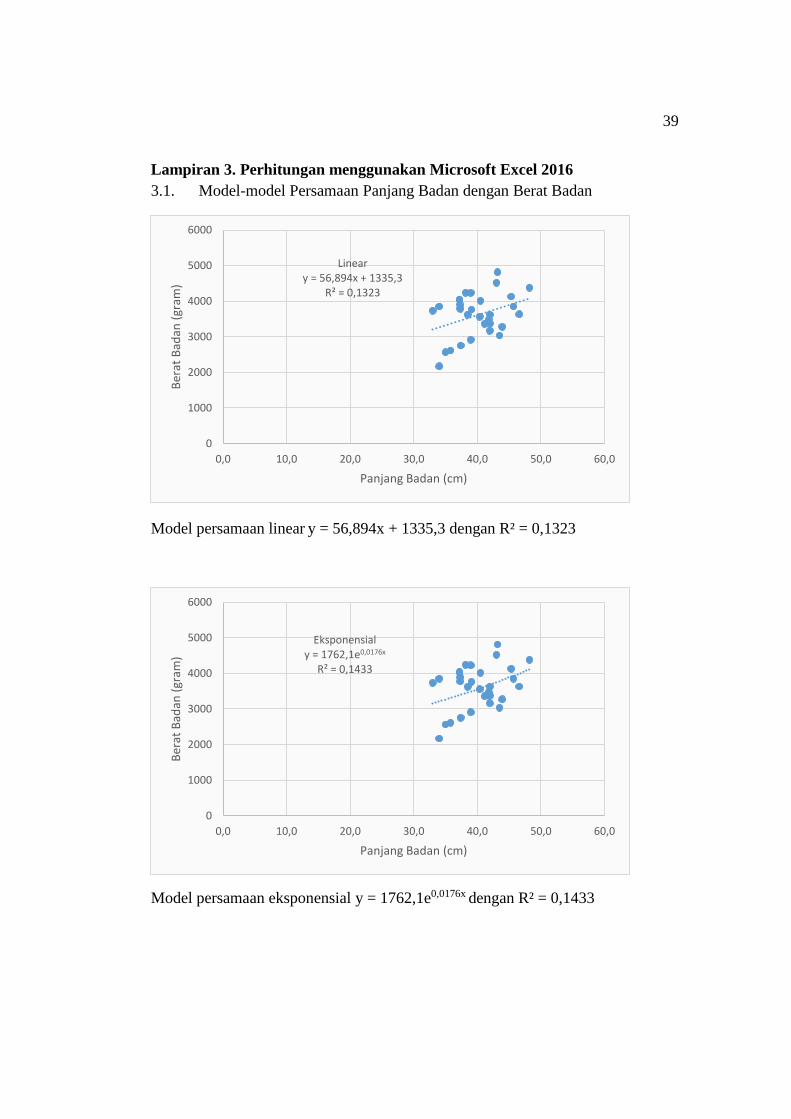
Lampiran 3. Perhitungan menggunakan Microsoft Excel 2016
3.1. Model-model Persamaan Panjang Badan dengan Berat Badan
Model persamaan linear y = 56,894x + 1335,3 dengan R² = 0,1323
Model persamaan eksponensial y = 1762,1e0,0176x dengan R² = 0,1433
Lineary = 56,894x + 1335,3
R² = 0,1323
0
1000
2000
3000
4000
5000
6000
0,0 10,0 20,0 30,0 40,0 50,0 60,0
Ber
at B
adan
(gr
am)
Panjang Badan (cm)
Eksponensialy = 1762,1e0,0176x
R² = 0,1433
0
1000
2000
3000
4000
5000
6000
0,0 10,0 20,0 30,0 40,0 50,0 60,0
Ber
at B
adan
(gr
am)
Panjang Badan (cm)
40
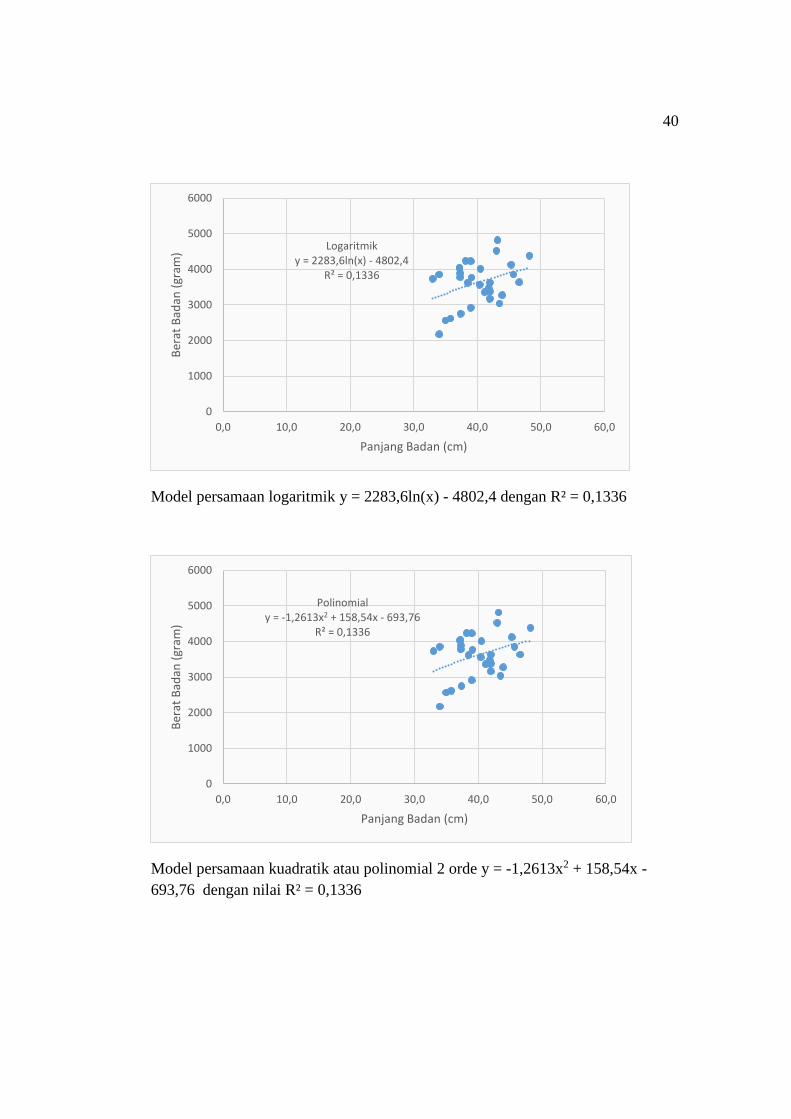
Model persamaan logaritmik y = 2283,6ln(x) - 4802,4 dengan R² = 0,1336
Model persamaan kuadratik atau polinomial 2 orde y = -1,2613x2 + 158,54x -
693,76 dengan nilai R² = 0,1336
Logaritmiky = 2283,6ln(x) - 4802,4
R² = 0,1336
0
1000
2000
3000
4000
5000
6000
0,0 10,0 20,0 30,0 40,0 50,0 60,0
Ber
at B
adan
(gr
am)
Panjang Badan (cm)
Polinomialy = -1,2613x2 + 158,54x - 693,76
R² = 0,1336
0
1000
2000
3000
4000
5000
6000
0,0 10,0 20,0 30,0 40,0 50,0 60,0
Ber
at B
adan
(gr
am)
Panjang Badan (cm)
41
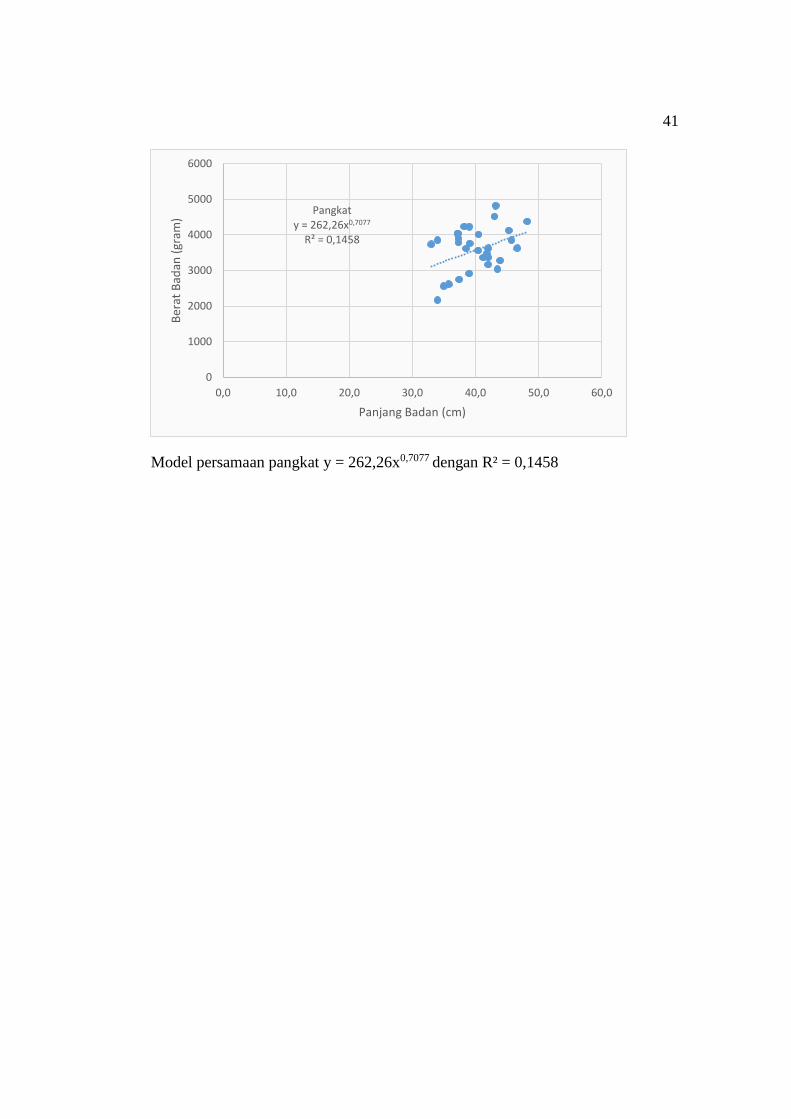
Model persamaan pangkat y = 262,26x0,7077 dengan R² = 0,1458
Pangkaty = 262,26x0,7077
R² = 0,1458
0
1000
2000
3000
4000
5000
6000
0,0 10,0 20,0 30,0 40,0 50,0 60,0
Ber
at B
adan
(gr
am)
Panjang Badan (cm)
42
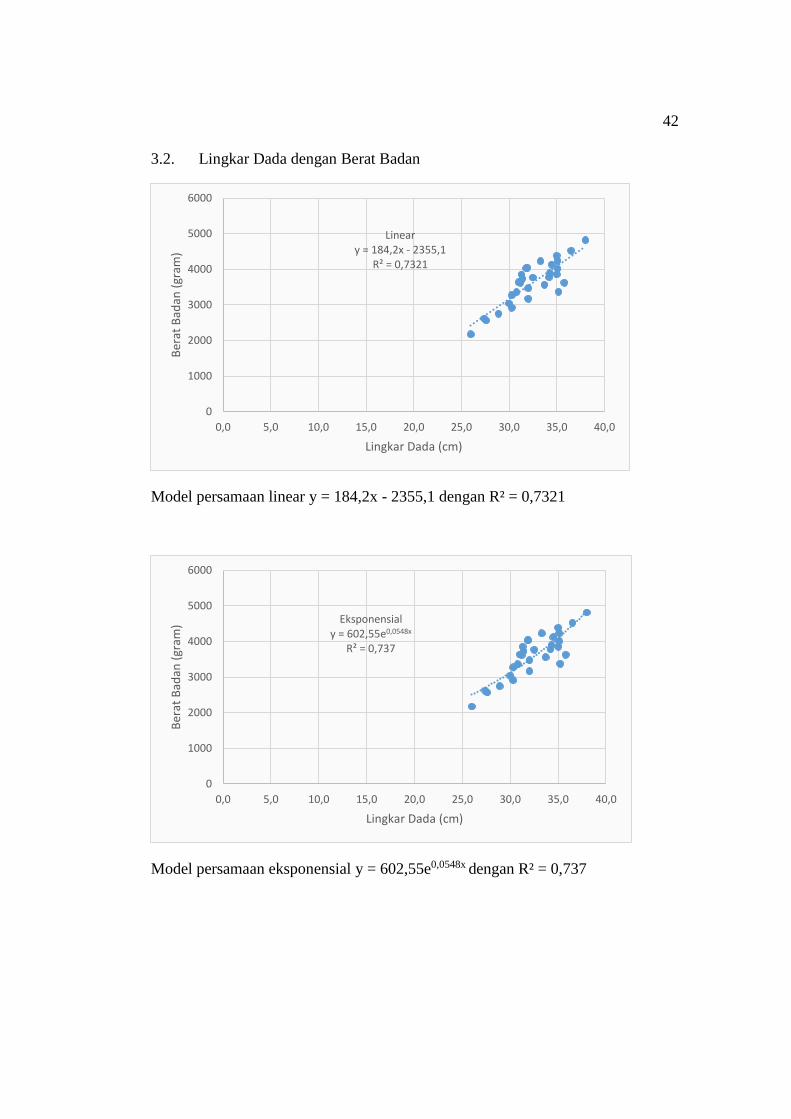
3.2. Lingkar Dada dengan Berat Badan
Model persamaan linear y = 184,2x - 2355,1 dengan R² = 0,7321
Model persamaan eksponensial y = 602,55e0,0548x dengan R² = 0,737
Lineary = 184,2x - 2355,1
R² = 0,7321
0
1000
2000
3000
4000
5000
6000
0,0 5,0 10,0 15,0 20,0 25,0 30,0 35,0 40,0
Ber
at B
adan
(gr
am)
Lingkar Dada (cm)
Eksponensialy = 602,55e0,0548x
R² = 0,737
0
1000
2000
3000
4000
5000
6000
0,0 5,0 10,0 15,0 20,0 25,0 30,0 35,0 40,0
Ber
at B
adan
(gr
am)
Lingkar Dada (cm)
43
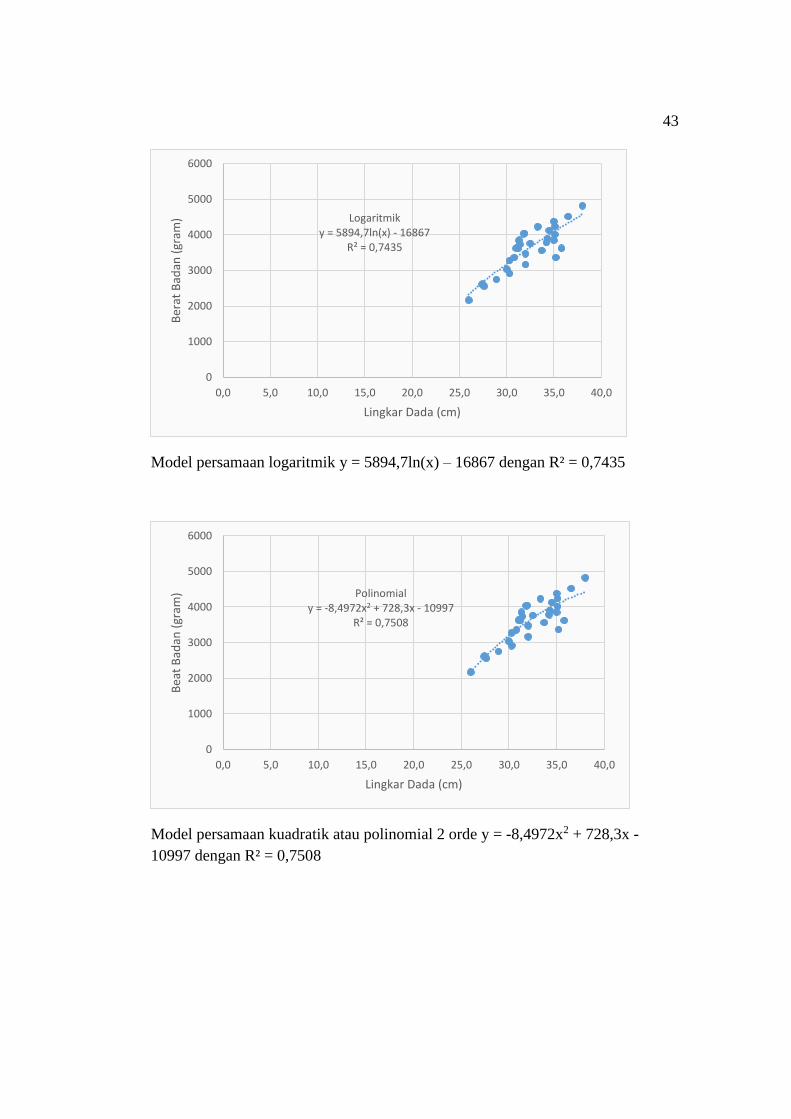
Model persamaan logaritmik y = 5894,7ln(x) – 16867 dengan R² = 0,7435
Model persamaan kuadratik atau polinomial 2 orde y = -8,4972x2 + 728,3x -
10997 dengan R² = 0,7508
Logaritmiky = 5894,7ln(x) - 16867
R² = 0,7435
0
1000
2000
3000
4000
5000
6000
0,0 5,0 10,0 15,0 20,0 25,0 30,0 35,0 40,0
Ber
at B
adan
(gr
am)
Lingkar Dada (cm)
Polinomialy = -8,4972x2 + 728,3x - 10997
R² = 0,7508
0
1000
2000
3000
4000
5000
6000
0,0 5,0 10,0 15,0 20,0 25,0 30,0 35,0 40,0
Bea
t B
adan
(gr
am)
Lingkar Dada (cm)
44
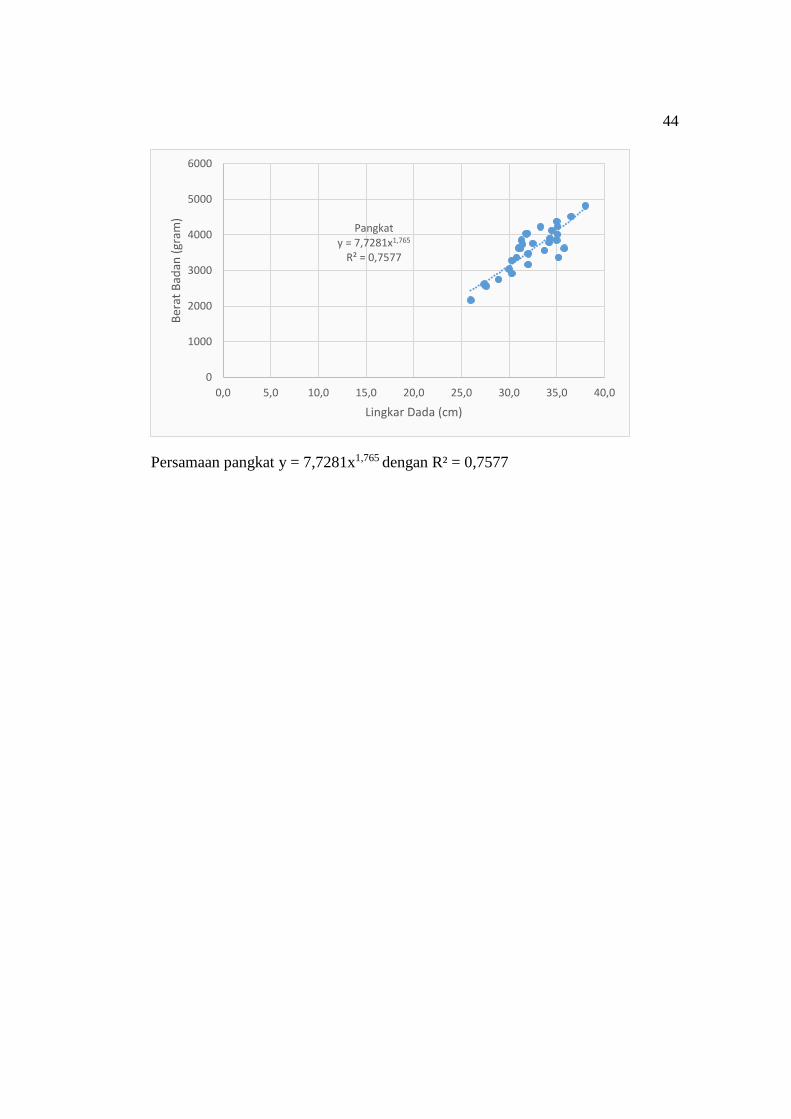
Persamaan pangkat y = 7,7281x1,765 dengan R² = 0,7577
Pangkaty = 7,7281x1,765
R² = 0,7577
0
1000
2000
3000
4000
5000
6000
0,0 5,0 10,0 15,0 20,0 25,0 30,0 35,0 40,0
Ber
at B
adan
(gr
am)
Lingkar Dada (cm)
45
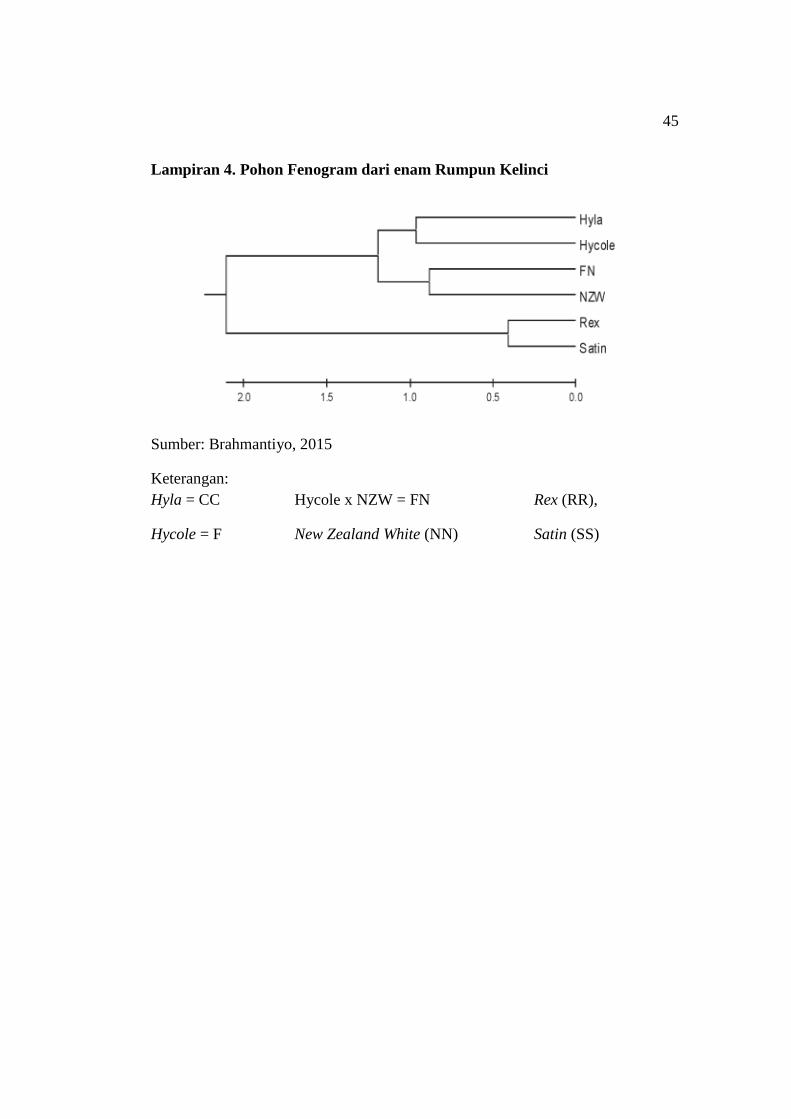
Lampiran 4. Pohon Fenogram dari enam Rumpun Kelinci
Sumber: Brahmantiyo, 2015
Keterangan:
Hyla = CC Hycole x NZW = FN Rex (RR),
Hycole = F New Zealand White (NN) Satin (SS)