data architecture and data warehousing
DESCRIPTION
Data Architecture and Data Warehousing are major components of an Enterprise Archtiecture.TRANSCRIPT
Integrating Enterprise DataArchitecture with EnterpriseData Warehousing
by Ken Orr, Fellow,Cutter Business Technology Council
Businesses worldwide are moving toward becoming real-time enterprises.
In the interests of reaching that goal, they're showing widening interest
in the intersection of high-level enterprise data architecture activities
with those of data warehousing and strategic IT planning. This Executive
Report examines how the major efforts of strategic IT planning, enterprise
architecture, and data integration and access relate to one another and the
critical role that the enterprise data architecture plays in this.
Business Intelligence
Vol. 3, No. 2

Acce
ss
Rob Austin Christine Davis Tom DeMarco Jim Highsmith Tim Lister Ken Orr Ed Yourdon
About Cutter Consortium
Cutter Consortium’s mission is to foster the debate of, and dialogue on, thebusiness-technology issues challenging enterprises today and to help orga-nizations leverage IT for competitive advantage and business success. Cutter’sphilosophy is that most of the issues managers face are complex enough tomerit examination that goes beyond simple pronouncements. The Consortiumtakes a unique view of the business-technology landscape, looking beyond theone-dimensional “technology” fix approach so common today. We know thereare no “silver bullets” in IT and that successful implementation and deploymentof a technology is as crucial as the selection of that technology.
To accomplish our mission, we have assembled the world’s preeminent ITconsultants — a distinguished group of internationally recognized expertscommitted to delivering top-level, critical, objective advice. Each of theConsortium’s nine practice areas features a team of Senior Consultants whosecredentials are unmatched by any other service provider. This group of expertsprovides all the consulting, performs all the research and writing, develops andpresents all the workshops, and fields all the inquiries from Cutter clients.
This is what differentiates Cutter from other analyst and consulting firms andwhy we say Cutter gives you access to the experts. All of Cutter’s products andservices are provided by today’s top thinkers in business and IT. Cutter’s clientstap into this brain trust and are the beneficiaries of the dialogue and debate ourexperts engage in at the annual Cutter Summit, in the pages of the Cutter ITJournal, through the collaborative forecasting of the Cutter Business TechnologyCouncil, and in our many reports and advisories.
Cutter Consortium’s menu of products and services can be customized to fit yourorganization’s budget. Most importantly, Cutter offers objectivity. Unlike so manyinformation providers, the Consortium has no special ties to vendors and cantherefore be completely forthright and critical. That’s why more than 5,300global organizations rely on Cutter for the no-holds-barred advice they need togain and to maintain a competitive edge — and for the peace of mind thatcomes with knowing they are relying on the best minds in the business for theirinformation, insight, and guidance.
Accessto the
Experts
Cutter Business Technology Council
INTRODUCTION
Large organizations are becomingincreasingly interested in the inter-section of high-level enterprisedata architecture (EDA) activitieswith those of data warehousingand strategic IT planning. Why?Organizations worldwide aremoving to become real-timeenterprises. In a recent EnterpriseArchitecture Executive Report,“Building a Real-Time Enterprise:Why It’s Worth the Effort” (Vol. 5,No. 10), I sought to explain whythis EDA is so important and whyorganizations that can make thetransition to a real-time enterpriseare apt to be more competitive asthe world comes out of the cur-rent economic downturn.
In the real-time enterprise, datawarehousing becomes muchmore important. Rather than
being something that’s nice tohave, near real-time data ware-houses are essential to runningthe real-time enterprise. In thiscontext, having the right kindof data warehousing becomeskey to making the real-time enter-prise really real-time. To supportreal-time decisionmaking, orga-nizations must create straight-through processing of their criticaldata, where operational data-bases, data warehouses, andassociated data marts becomepart of an integrated set ofdistributed enterprise data that’supdated consistently.
But enterprise architecture (EA)is even more critical to building atruly real-time enterprise. A fewyears ago, most organizationsbelieved that their high-levelarchitecture activities were pretty
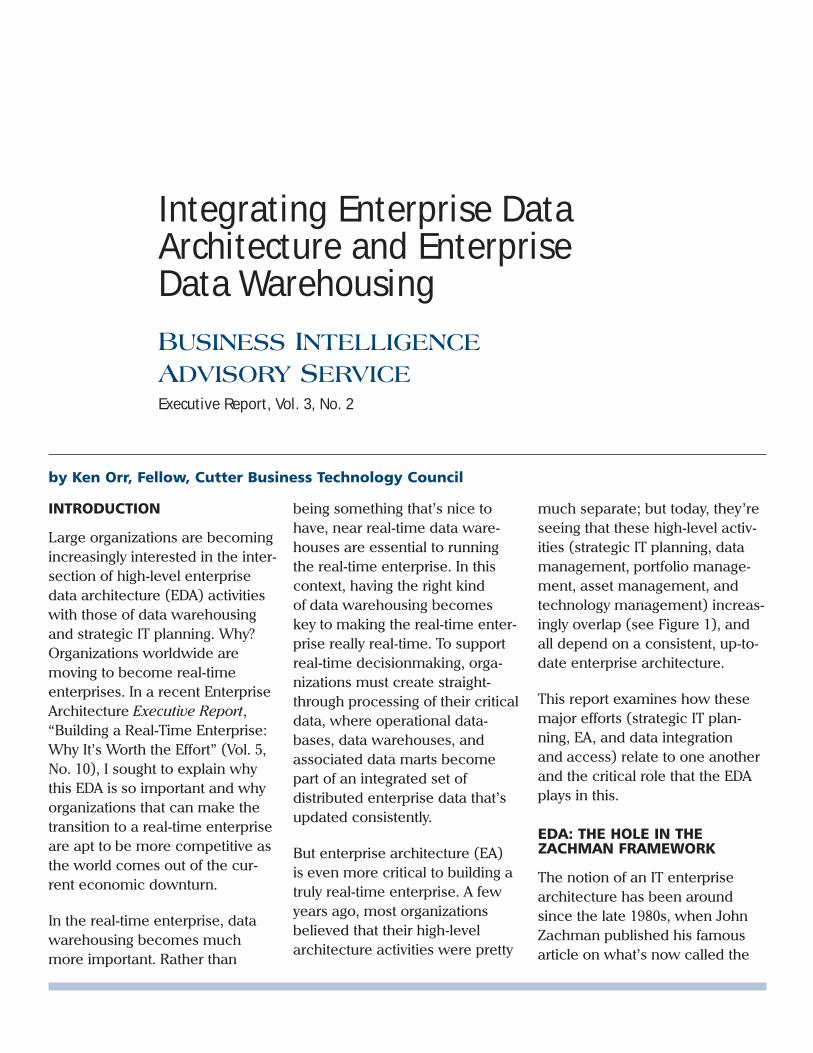
much separate; but today, they’reseeing that these high-level activ-ities (strategic IT planning, datamanagement, portfolio manage-ment, asset management, andtechnology management) increas-ingly overlap (see Figure 1), andall depend on a consistent, up-to-date enterprise architecture.
This report examines how thesemajor efforts (strategic IT plan-ning, EA, and data integrationand access) relate to one anotherand the critical role that the EDAplays in this.
EDA: THE HOLE IN THEZACHMAN FRAMEWORK
The notion of an IT enterprisearchitecture has been aroundsince the late 1980s, when JohnZachman published his famousarticle on what’s now called the
by Ken Orr, Fellow, Cutter Business Technology Council
Integrating Enterprise DataArchitecture and EnterpriseData WarehousingBUSINESS INTELLIGENCEADVISORY SERVICEExecutive Report, Vol. 3, No. 2
Zachman Framework [7]. In itscurrent form, the framework con-tains six columns and six rows(see Figure 2).
Enterprise architecture is in. Moreorganizations are using this frame-work as a way to capture andmaintain high-level informationlinking IT assets, business con-cerns, and strategies. In a recentCutter Consortium survey, forexample, Cutter ConsortiumSenior Consultant Paul Harmonfound that nearly two-thirds ofresponding companies are devel-oping EAs (see Figure 3) [1].
It’s rare to find two-thirds of anylarge group of enterprises doingthe same thing, yet it clearlydemonstrates that there’s sig-nificant interest in EA.
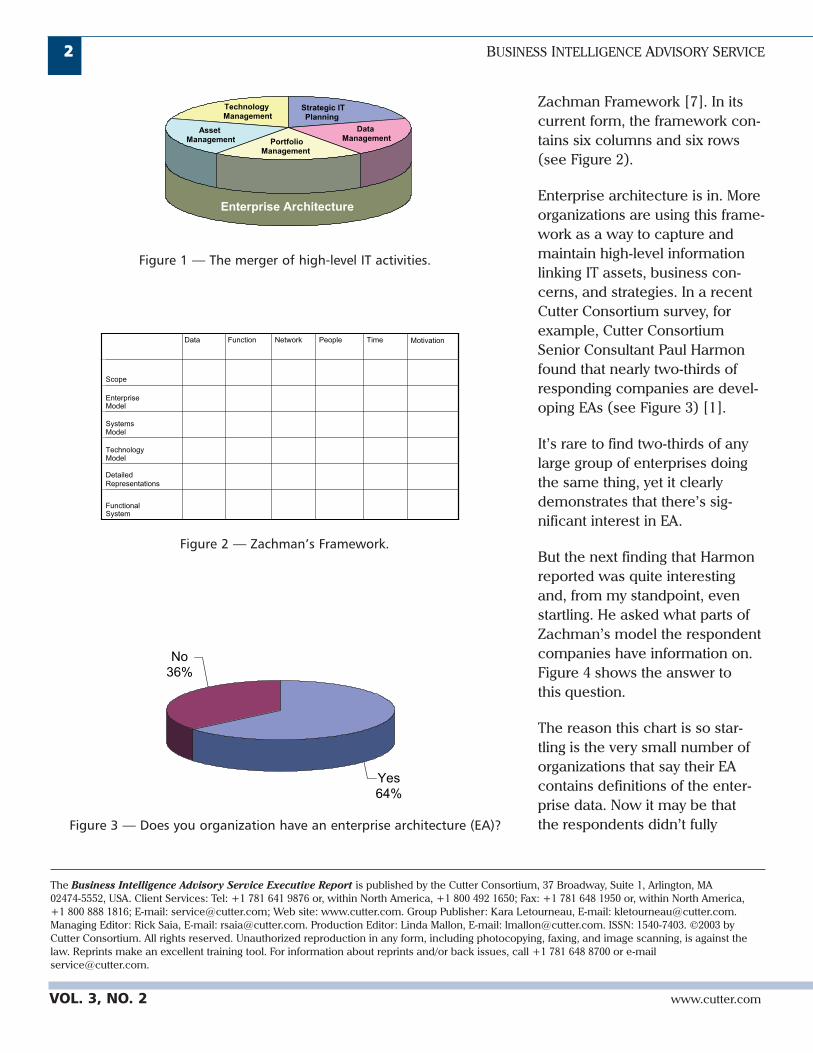
But the next finding that Harmonreported was quite interestingand, from my standpoint, evenstartling. He asked what parts ofZachman’s model the respondentcompanies have information on.Figure 4 shows the answer tothis question.
The reason this chart is so star-tling is the very small number oforganizations that say their EAcontains definitions of the enter-prise data. Now it may be thatthe respondents didn’t fully
VOL. 3, NO. 2 www.cutter.com
22 BUSINESS INTELLIGENCE ADVISORY SERVICE
The Business Intelligence Advisory Service Executive Report is published by the Cutter Consortium, 37 Broadway, Suite 1, Arlington, MA 02474-5552, USA. Client Services: Tel: +1 781 641 9876 or, within North America, +1 800 492 1650; Fax: +1 781 648 1950 or, within North America, +1 800 888 1816; E-mail: [email protected]; Web site: www.cutter.com. Group Publisher: Kara Letourneau, E-mail: [email protected] Editor: Rick Saia, E-mail: [email protected]. Production Editor: Linda Mallon, E-mail: [email protected]. ISSN: 1540-7403. ©2003 byCutter Consortium. All rights reserved. Unauthorized reproduction in any form, including photocopying, faxing, and image scanning, is against thelaw. Reprints make an excellent training tool. For information about reprints and/or back issues, call +1 781 648 8700 or [email protected].
Asset Management
Data ManagementPortfolio
Management
Technology Management
Strategic ITPlanning
Enterprise Architecture
Figure 1 — The merger of high-level IT activities.
MotivationTimePeopleNetworkFunctionData
FunctionalSystem
DetailedRepresentations
TechnologyModel
SystemsModel
EnterpriseModel
Scope
Figure 2 — Zachman’s Framework.
No36%
Yes64%
Figure 3 — Does you organization have an enterprise architecture (EA)?
understand the question, but itmay relate to a deeper, more sig-nificant problem. The problem, Isuspect, is that people think thatwith so much effort devoted toapplication data models anddatabase design, there’s no needfor a specific EDA. But that’s notthe case.
Data is the most important ITasset that an enterprise has; itrepresents the crown jewels of IT.Without it, nothing else works. Soit would seem that if the “data”column in Zachman’s frameworkis largely missing in most enter-prise architecture activities, thenthere’s a major hole in most EAefforts. And since I believe that thedata column is perhaps the mostimportant in the entire frame-work, I hope to provide guidanceon how someone would go aboutdeveloping an EDA and show howcritical it would be in developing adata warehousing strategy.
I want to stress here that EA andall its pieces and connectionsare not an academic or abstractexercise, at least to my clients.The enterprise architecture is acore component of IT strategicplanning and IT management.EA is somewhat new and certainlydifficult, and there are few proventools and methods for buildingone. But an enterprise architec-ture is nonetheless very importantto building a successful real-timeenterprise in the 21st century.
Building a Real-World EA
Over the years, there has beenmuch criticism in EA articles thatmany organizations took theZachman Framework too literally.Indeed, for most of its history, theframework has lacked substance.In part, this was the result of toomany people (including, to adegree, Zachman himself) tryingto figure out what should go intoeach cell, as if by simply filling inthis matrix, we would suddenlyhave a model that — like the DNAdouble-helix — would allow us tounderstand the structure of theentire IT world.
I believe most folks doingserious enterprise architectureunderstand that the ZachmanFramework is a useful intellectualdevice for talking about high-levelissues in IT planning and design,but it’s not a road map, certainlynot one you can pull out whenyou’re lost. What we have foundin “doing enterprise architecture”is that the Zachman Framework
is a very rough map that’s onlypartially filled in. Our experienceis that most large organizationshave only pieces of the informa-tion they need to develop a com-plete EA. Figure 5, for example,illustrates the information mostorganizations have.
What we see here is that whenwe start developing an EA wehave lots of detailed informationat the bottom layers (rows) ofthe Zachman Framework andfairly spotty information every-where else. 1 In addition, muchof the information that we dohave is either very dated or ofpoor quality.
The job of developing an accu-rate EA, then, involves coming upwith a logical framework that con-tains all the needed information,
EXECUTIVE REPORT 33
©2003 CUTTER CONSORTIUM VOL. 3, NO. 2
Applications25%
Systems24%
Components13%
Network7%
Data2%
Infrastructure29%
Figure 4 — If you have an EA, which of the following does it define?
1In some respects, Figure 5 shows that wehave perhaps more detailed information thanwe actually have. What it really represents isthe fact that in order for the enterprise tooperate at all, the bottom rows of Zachman’smatrix must be filled in.
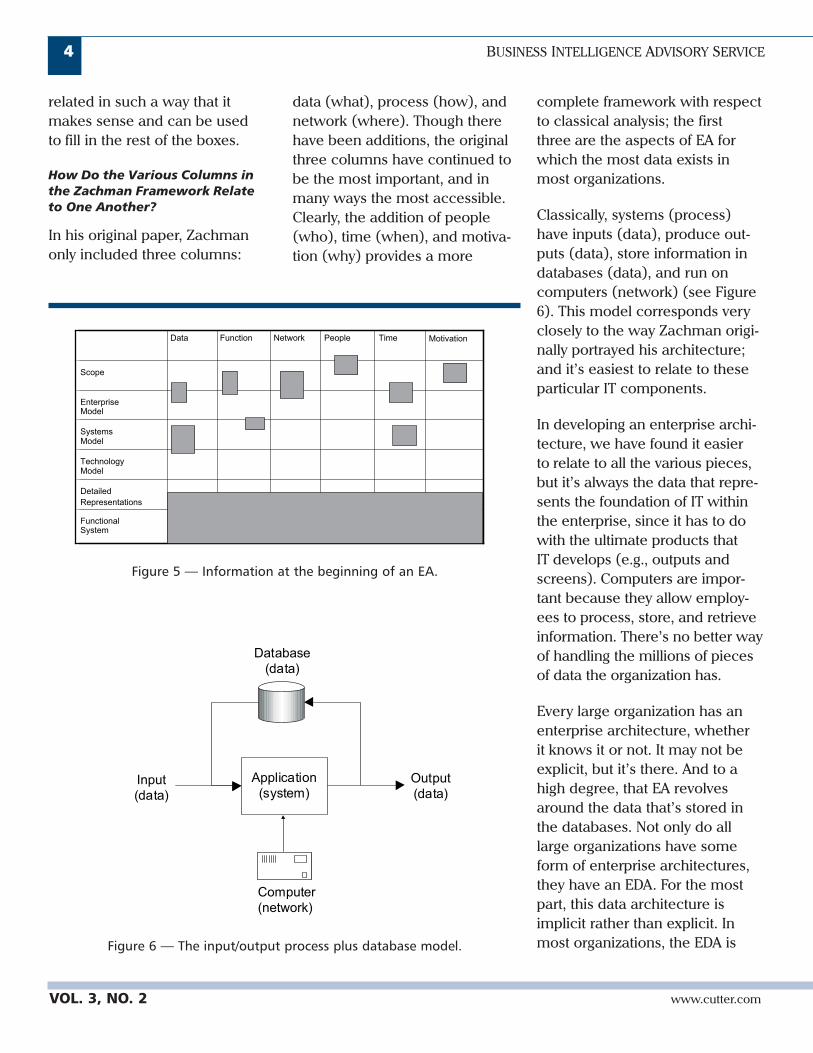
related in such a way that itmakes sense and can be usedto fill in the rest of the boxes.
How Do the Various Columns inthe Zachman Framework Relateto One Another?
In his original paper, Zachmanonly included three columns:
data (what), process (how), andnetwork (where). Though therehave been additions, the originalthree columns have continued tobe the most important, and inmany ways the most accessible.Clearly, the addition of people(who), time (when), and motiva-tion (why) provides a more
complete framework with respectto classical analysis; the firstthree are the aspects of EA forwhich the most data exists inmost organizations.
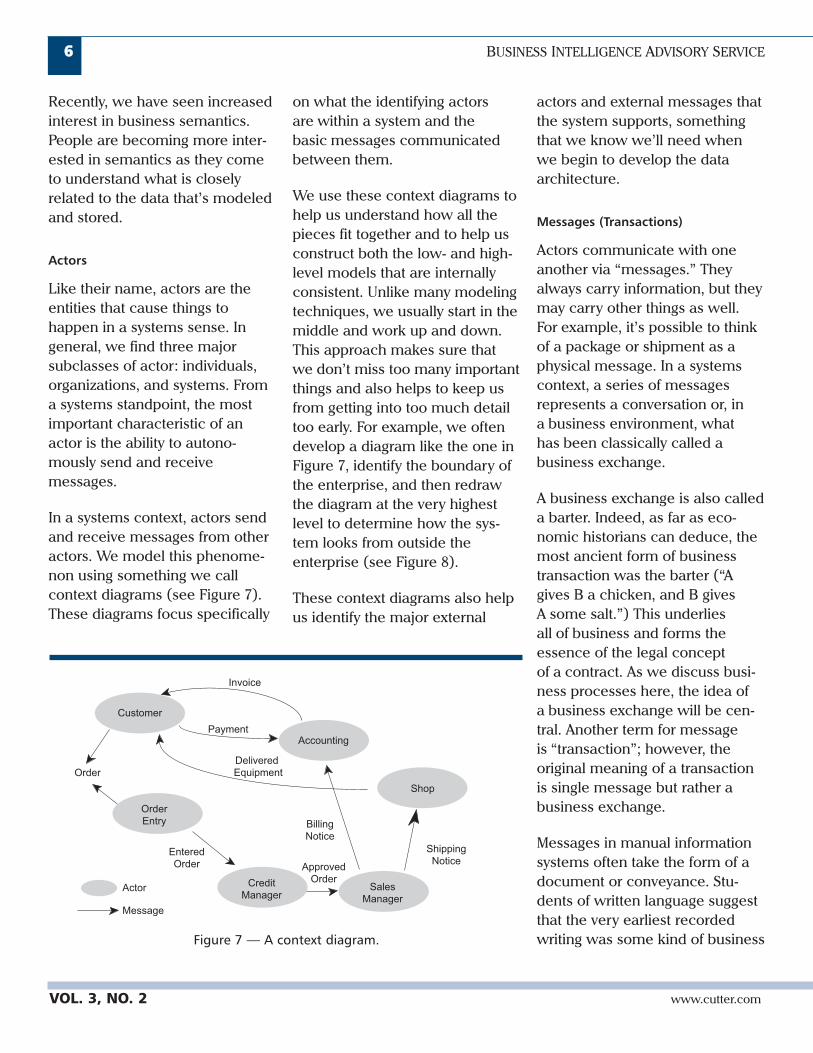
Classically, systems (process)have inputs (data), produce out-puts (data), store information indatabases (data), and run oncomputers (network) (see Figure6). This model corresponds veryclosely to the way Zachman origi-nally portrayed his architecture;and it’s easiest to relate to theseparticular IT components.
In developing an enterprise archi-tecture, we have found it easierto relate to all the various pieces,but it’s always the data that repre-sents the foundation of IT withinthe enterprise, since it has to dowith the ultimate products thatIT develops (e.g., outputs andscreens). Computers are impor-tant because they allow employ-ees to process, store, and retrieveinformation. There’s no better wayof handling the millions of piecesof data the organization has.
Every large organization has anenterprise architecture, whetherit knows it or not. It may not beexplicit, but it’s there. And to ahigh degree, that EA revolvesaround the data that’s stored inthe databases. Not only do alllarge organizations have someform of enterprise architectures,they have an EDA. For the mostpart, this data architecture isimplicit rather than explicit. Inmost organizations, the EDA is
VOL. 3, NO. 2 www.cutter.com
44 BUSINESS INTELLIGENCE ADVISORY SERVICE
MotivationTimePeopleNetworkFunctionData
FunctionalSystem
Detailed
Representations
TechnologyModel
SystemsModel
EnterpriseModel
Scope
Figure 5 — Information at the beginning of an EA.
Input(data)
Output(data)
Database(data)
Application(system)
Computer(network)
Figure 6 — The input/output process plus database model.

fragmented over the thousands ofapplications within the organiza-tion and shows up in the thou-sands of tables and files that aremaintained on regular bases, suchas daily, weekly, and monthly.
Over the years, there have beennumerous attempts to rationalizethe implicit data architecture tohelp us make some sense ofour data, remove redundancy,and improve data quality. Wehave done enterprise datamodels and application datamodels repeatedly, but after all issaid and done, most organizationsdon’t have coherent EDAs.
We have discovered that onething that’s missing is a way torelate the data that we keep inour technical systems with theimportant things in the real world.We need a new way of thinkingabout data at a high level. Forthis, we need to have common“business semantics.”
AN INTRODUCTION TOBUSINESS SEMANTICS
As with most areas of architectureand design, there’s no one bestway to do things. “Doing enter-prise architecture,” for example,takes analytical and communica-tion skills and requires research.My own feeling is that the bestdata architects are like the bestbuilding architects: they’re con-stantly learning about their usersand looking for good models inbooks and articles.
Simple data models are hard tocome up with; it’s only the com-plex ones that are easy. My experi-ence is that the harder you work,the simpler and more elegant themodel becomes. But it helps ifyou’ve done a lot of them andhave worked in other industriesor companies. All the good mod-els for the same industry tend tolook alike; it’s only the bad mod-els that have a lot of variety. In ourwork, we’re constantly amazedat how a basic understanding ofbusiness semantics aids in bothenterprise data architecture anddata warehouse design.
On a base level, data models areabstract representations of thereal world. The better they modelthat real world, the better theywork. Over time, most databasescome to model the same classesof objects in much the same fash-ion. As a consequence, it’s notstretching the point too muchto say that all of the good datamodels look alike. The principalreason this is true is that the realworld is pretty much the samefor all enterprises in the samemarket. As a consequence, westore information about “cus-tomers,” “salespeople,” “prod-ucts,” “orders,” and “shipments.”This is not an accident.
But even though database design-ers and architects have the besttools and the most experience atmodeling large things, they havenot had, by and large, a way ofclassifying the different classes ofentities that they’re modeling.
In an attempt to be general, andbusiness independent, most of thepeople doing this kind of model-ing have what I refer to as a “flat-land view” of the things they’remodeling. In IT, everything is an“entity” or an “object.” All entitiesare the same; it’s just the name ofthe entity and its connection withother entities that are important.There’s no fundamental differencebetween a “customer” and an“order.” This kind of thinkinghas kept us from seeing that thereare real differences between thedifferent subclasses of entitiesand that the differences ought toguide us in developing a veryhigh-level, logical view of theenterprise’s data.
In this section, we’re going todiscuss the semantics that under-lie all our data modeling. We’regoing to attempt to show thatthese semantics show up every-where in the organization andthat, if we develop the right kindsof models that reflect thesesemantics, a whole range ofvaluable things are possible.
The Four Major Classes of Entities
In our work, we have discoveredfour basic classes of entitiesthat are found in nearly everykind of business system. Theseentities are:
1. Actors
2. Messages
3. Objects (subjects)
4. Events
©2003 CUTTER CONSORTIUM VOL. 3, NO. 2
EXECUTIVE REPORT 55
Recently, we have seen increasedinterest in business semantics.People are becoming more inter-ested in semantics as they cometo understand what is closelyrelated to the data that’s modeledand stored.
Actors
Like their name, actors are theentities that cause things tohappen in a systems sense. Ingeneral, we find three majorsubclasses of actor: individuals,organizations, and systems. Froma systems standpoint, the mostimportant characteristic of anactor is the ability to autono-mously send and receivemessages.
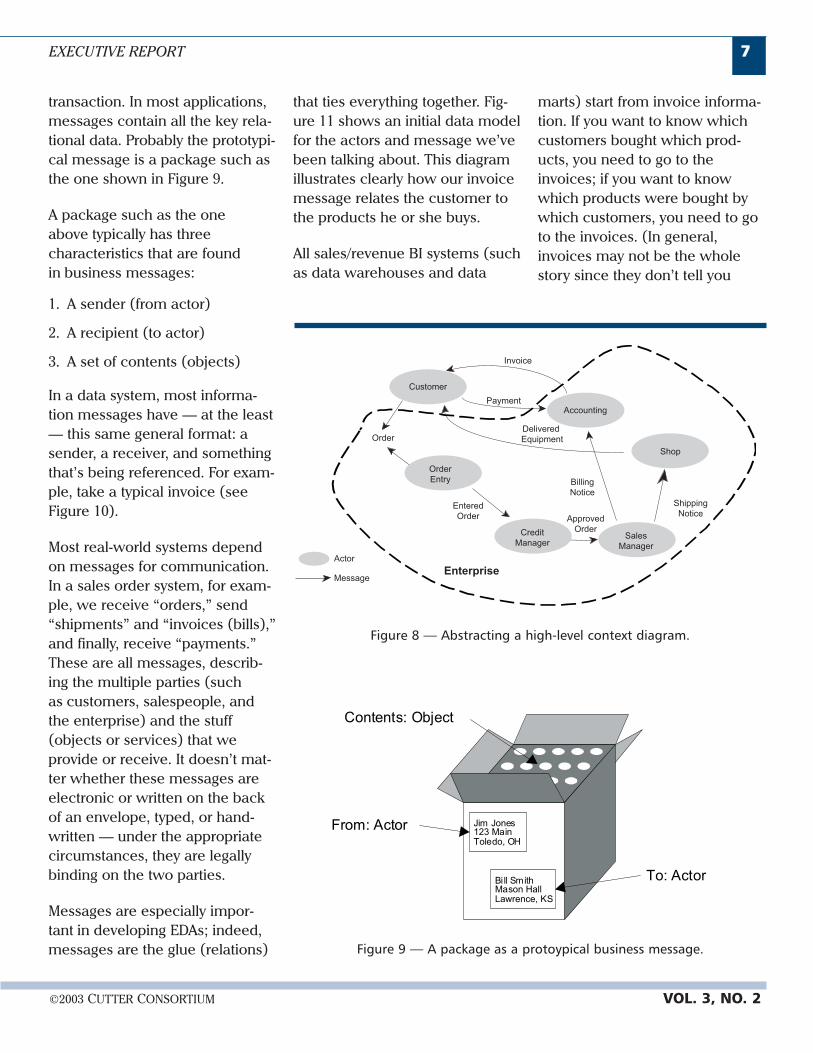
In a systems context, actors sendand receive messages from otheractors. We model this phenome-non using something we callcontext diagrams (see Figure 7).These diagrams focus specifically
on what the identifying actorsare within a system and thebasic messages communicatedbetween them.
We use these context diagrams tohelp us understand how all thepieces fit together and to help usconstruct both the low- and high-level models that are internallyconsistent. Unlike many modelingtechniques, we usually start in themiddle and work up and down.This approach makes sure thatwe don’t miss too many importantthings and also helps to keep usfrom getting into too much detailtoo early. For example, we oftendevelop a diagram like the one inFigure 7, identify the boundary ofthe enterprise, and then redrawthe diagram at the very highestlevel to determine how the sys-tem looks from outside theenterprise (see Figure 8).
These context diagrams also helpus identify the major external
actors and external messages thatthe system supports, somethingthat we know we’ll need whenwe begin to develop the dataarchitecture.
Messages (Transactions)
Actors communicate with oneanother via “messages.” Theyalways carry information, but theymay carry other things as well.For example, it’s possible to thinkof a package or shipment as aphysical message. In a systemscontext, a series of messagesrepresents a conversation or, ina business environment, whathas been classically called abusiness exchange.
A business exchange is also calleda barter. Indeed, as far as eco-nomic historians can deduce, themost ancient form of businesstransaction was the barter (“Agives B a chicken, and B givesA some salt.”) This underliesall of business and forms theessence of the legal conceptof a contract. As we discuss busi-ness processes here, the idea ofa business exchange will be cen-tral. Another term for messageis “transaction”; however, theoriginal meaning of a transactionis single message but rather abusiness exchange.
Messages in manual informationsystems often take the form of adocument or conveyance. Stu-dents of written language suggestthat the very earliest recordedwriting was some kind of business
VOL. 3, NO. 2 www.cutter.com
66 BUSINESS INTELLIGENCE ADVISORY SERVICE
Actor
Message
Customer
OrderEntry
SalesManager
Accounting
Shop
Invoice
Payment
Order
ShippingNotice
EnteredOrder
CreditManager
BillingNotice
ApprovedOrder
Delivered Equipment
Figure 7 — A context diagram.
transaction. In most applications,messages contain all the key rela-tional data. Probably the prototypi-cal message is a package such asthe one shown in Figure 9.
A package such as the oneabove typically has threecharacteristics that are foundin business messages:
1. A sender (from actor)
2. A recipient (to actor)
3. A set of contents (objects)
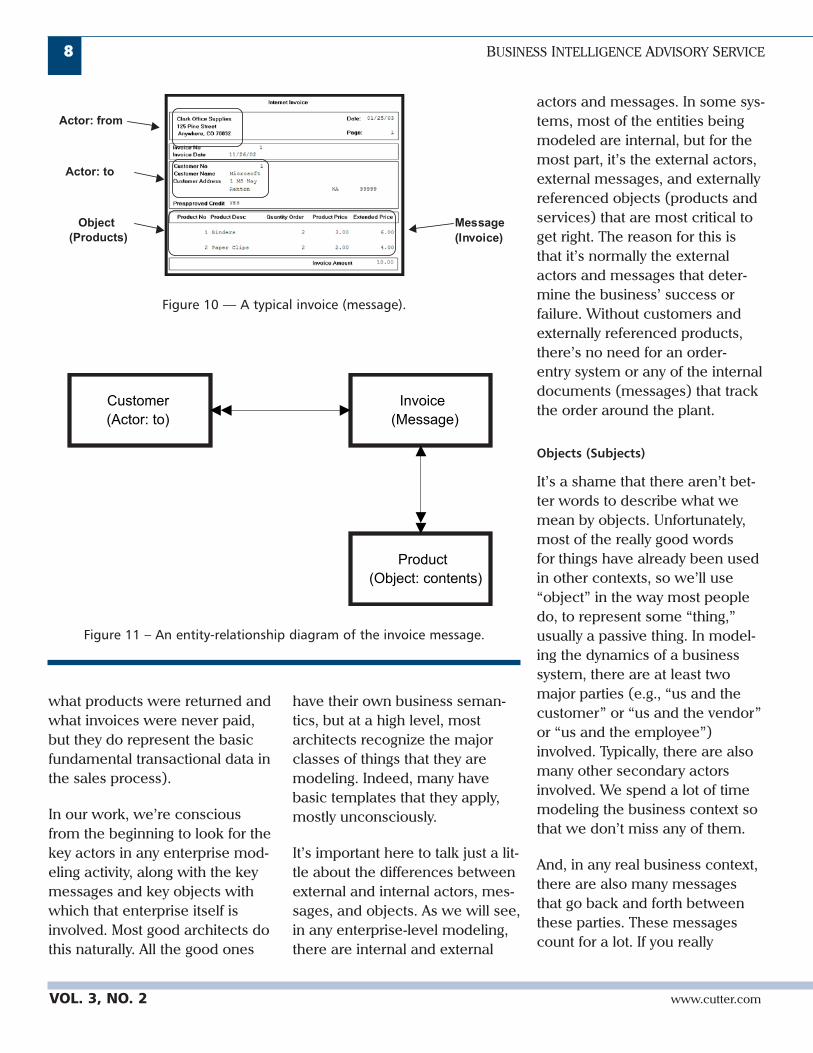
In a data system, most informa-tion messages have — at the least— this same general format: asender, a receiver, and somethingthat’s being referenced. For exam-ple, take a typical invoice (seeFigure 10).
Most real-world systems dependon messages for communication.In a sales order system, for exam-ple, we receive “orders,” send“shipments” and “invoices (bills),”and finally, receive “payments.”These are all messages, describ-ing the multiple parties (suchas customers, salespeople, andthe enterprise) and the stuff(objects or services) that weprovide or receive. It doesn’t mat-ter whether these messages areelectronic or written on the backof an envelope, typed, or hand-written — under the appropriatecircumstances, they are legallybinding on the two parties.
Messages are especially impor-tant in developing EDAs; indeed,messages are the glue (relations)
that ties everything together. Fig-ure 11 shows an initial data modelfor the actors and message we’vebeen talking about. This diagramillustrates clearly how our invoicemessage relates the customer tothe products he or she buys.
All sales/revenue BI systems (suchas data warehouses and data
marts) start from invoice informa-tion. If you want to know whichcustomers bought which prod-ucts, you need to go to theinvoices; if you want to knowwhich products were bought bywhich customers, you need to goto the invoices. (In general,invoices may not be the wholestory since they don’t tell you
EXECUTIVE REPORT 77
Actor
Message
Customer
OrderEntry
SalesManager
Accounting
Shop
Invoice
Payment
Order
ShippingNotice
EnteredOrder
CreditManager
BillingNotice
ApprovedOrder
Enterprise
Delivered Equipment
Figure 8 — Abstracting a high-level context diagram.
To: Actor
Jim Jones123 MainToledo, OH
Bill SmithMason HallLawrence, KS
From: Actor
Contents: Object
Figure 9 — A package as a protoypical business message.
©2003 CUTTER CONSORTIUM VOL. 3, NO. 2
what products were returned andwhat invoices were never paid,but they do represent the basicfundamental transactional data inthe sales process).
In our work, we’re consciousfrom the beginning to look for thekey actors in any enterprise mod-eling activity, along with the keymessages and key objects withwhich that enterprise itself isinvolved. Most good architects dothis naturally. All the good ones
have their own business seman-tics, but at a high level, mostarchitects recognize the majorclasses of things that they aremodeling. Indeed, many havebasic templates that they apply,mostly unconsciously.
It’s important here to talk just a lit-tle about the differences betweenexternal and internal actors, mes-sages, and objects. As we will see,in any enterprise-level modeling,there are internal and external
actors and messages. In some sys-tems, most of the entities beingmodeled are internal, but for themost part, it’s the external actors,external messages, and externallyreferenced objects (products andservices) that are most critical toget right. The reason for this isthat it’s normally the externalactors and messages that deter-mine the business’ success orfailure. Without customers andexternally referenced products,there’s no need for an order-entry system or any of the internaldocuments (messages) that trackthe order around the plant.
Objects (Subjects)
It’s a shame that there aren’t bet-ter words to describe what wemean by objects. Unfortunately,most of the really good wordsfor things have already been usedin other contexts, so we’ll use“object” in the way most peopledo, to represent some “thing,”usually a passive thing. In model-ing the dynamics of a businesssystem, there are at least twomajor parties (e.g., “us and thecustomer” or “us and the vendor”or “us and the employee”)involved. Typically, there are alsomany other secondary actorsinvolved. We spend a lot of timemodeling the business context sothat we don’t miss any of them.
And, in any real business context,there are also many messagesthat go back and forth betweenthese parties. These messagescount for a lot. If you really
VOL. 3, NO. 2 www.cutter.com
88 BUSINESS INTELLIGENCE ADVISORY SERVICE
Customer
(Actor: to)
Invoice
(Message)
Product
(Object: contents)
Figure 11 – An entity-relationship diagram of the invoice message.
Actor: to
Actor: from
Object
(Products)
Message
(Invoice)
Figure 10 — A typical invoice (message).
understand these messages andthe sequence in which they flowaround the system from actor toactor, it’s pretty straightforward tounderstand the business processthat’s going on. Messages are keybecause they provide clues towhat activities go on in the sys-tem. And these activities lead toreports and screens that peopleneed to do their work. In turn,these reports and screens pointto data attributes and data struc-tures needed in the enterprisedata architecture. By focusingon the actors and messages, wecan systematically extract thedata structures and data attributedefinitions that we need out ofthe systems definition.
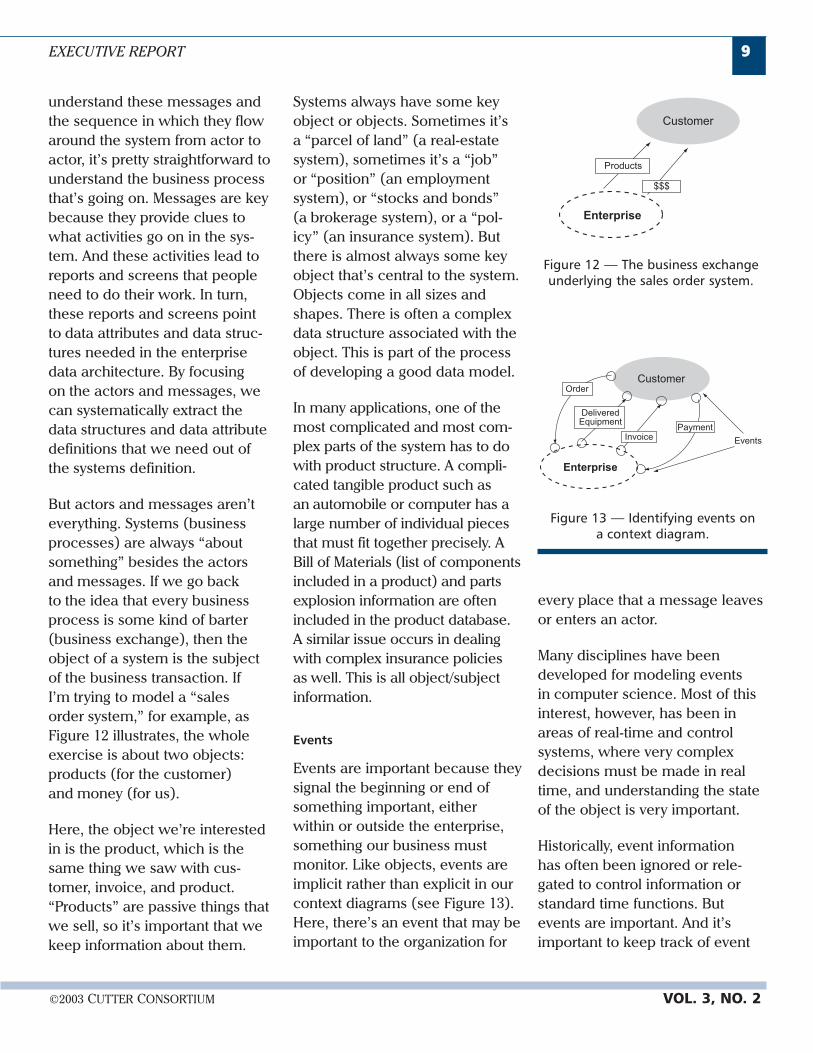
But actors and messages aren’teverything. Systems (businessprocesses) are always “aboutsomething” besides the actorsand messages. If we go backto the idea that every businessprocess is some kind of barter(business exchange), then theobject of a system is the subjectof the business transaction. IfI’m trying to model a “salesorder system,” for example, asFigure 12 illustrates, the wholeexercise is about two objects:products (for the customer)and money (for us).
Here, the object we’re interestedin is the product, which is thesame thing we saw with cus-tomer, invoice, and product.“Products” are passive things thatwe sell, so it’s important that wekeep information about them.
Systems always have some keyobject or objects. Sometimes it’sa “parcel of land” (a real-estatesystem), sometimes it’s a “job”or “position” (an employmentsystem), or “stocks and bonds”(a brokerage system), or a “pol-icy” (an insurance system). Butthere is almost always some keyobject that’s central to the system.Objects come in all sizes andshapes. There is often a complexdata structure associated with theobject. This is part of the processof developing a good data model.
In many applications, one of themost complicated and most com-plex parts of the system has to dowith product structure. A compli-cated tangible product such asan automobile or computer has alarge number of individual piecesthat must fit together precisely. ABill of Materials (list of componentsincluded in a product) and partsexplosion information are oftenincluded in the product database.A similar issue occurs in dealingwith complex insurance policiesas well. This is all object/subjectinformation.
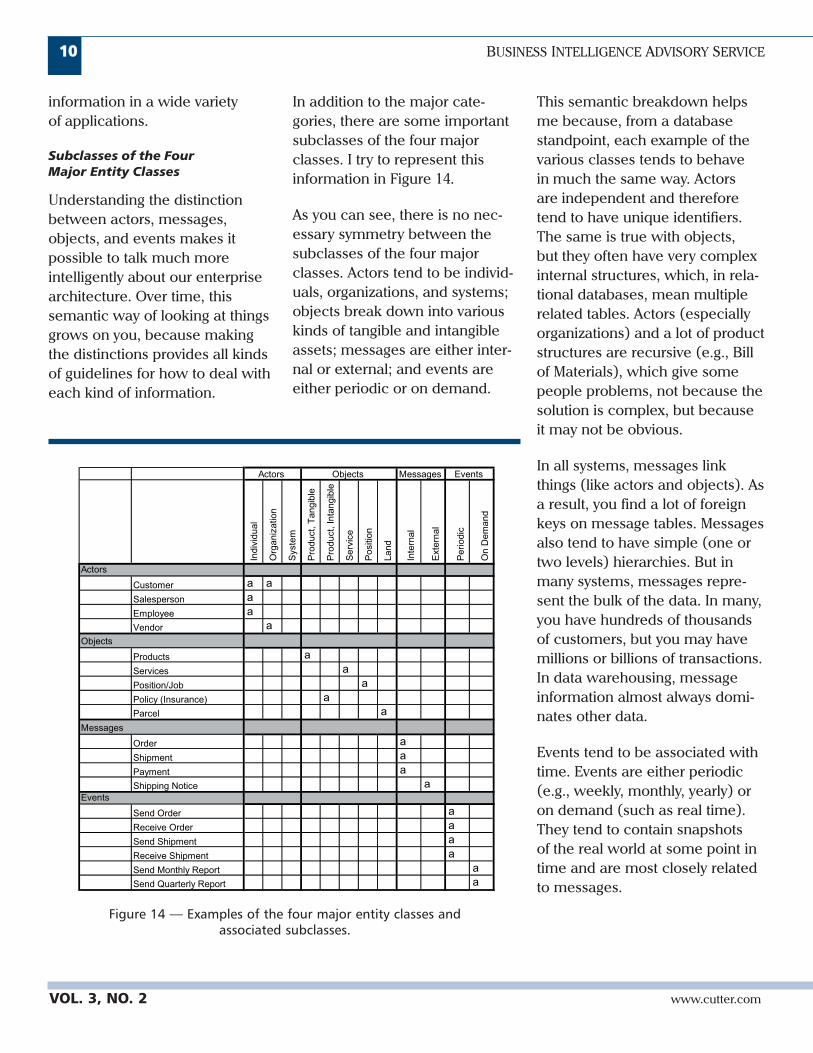
Events
Events are important because theysignal the beginning or end ofsomething important, eitherwithin or outside the enterprise,something our business mustmonitor. Like objects, events areimplicit rather than explicit in ourcontext diagrams (see Figure 13).Here, there’s an event that may beimportant to the organization for
every place that a message leavesor enters an actor.
Many disciplines have beendeveloped for modeling eventsin computer science. Most of thisinterest, however, has been inareas of real-time and controlsystems, where very complexdecisions must be made in realtime, and understanding the stateof the object is very important.
Historically, event informationhas often been ignored or rele-gated to control information orstandard time functions. Butevents are important. And it’simportant to keep track of event
©2003 CUTTER CONSORTIUM VOL. 3, NO. 2
EXECUTIVE REPORT 99
Customer
Enterprise
DeliveredEquipment
Invoice
Order
Payment
Events
Figure 13 — Identifying events ona context diagram.
Customer
Enterprise
Products
$$$
Figure 12 — The business exchangeunderlying the sales order system.
information in a wide varietyof applications.
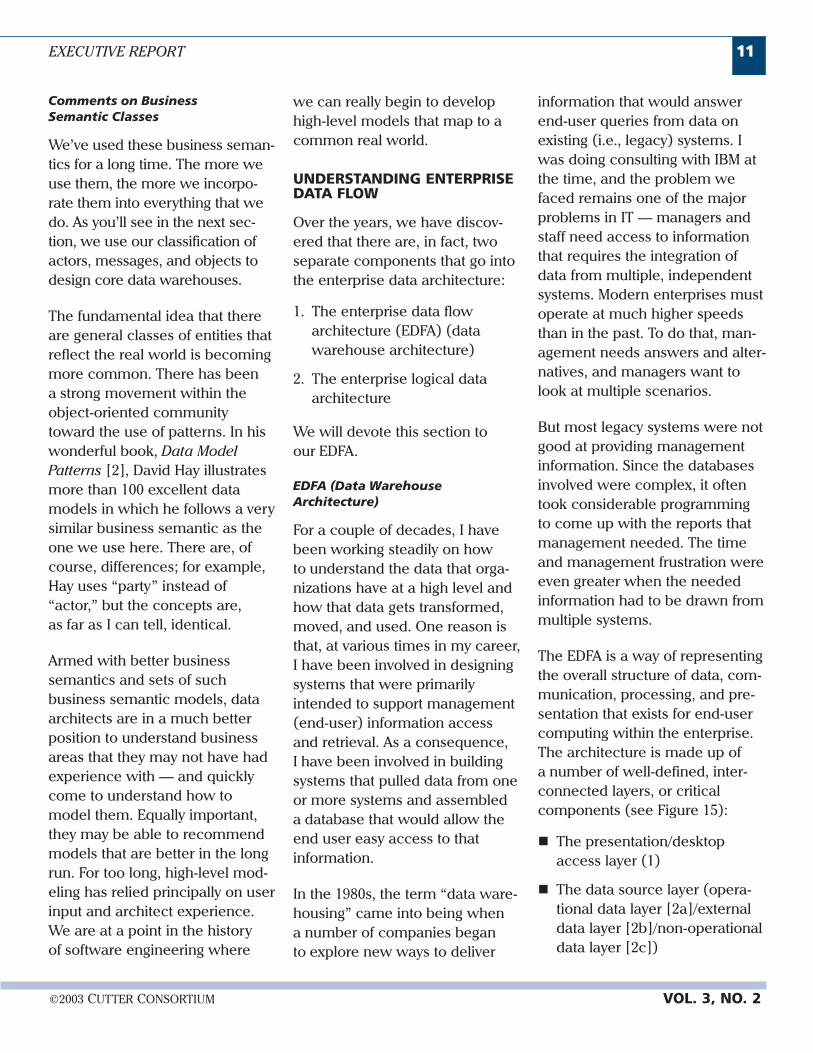
Subclasses of the FourMajor Entity Classes
Understanding the distinctionbetween actors, messages,objects, and events makes itpossible to talk much moreintelligently about our enterprisearchitecture. Over time, thissemantic way of looking at thingsgrows on you, because makingthe distinctions provides all kindsof guidelines for how to deal witheach kind of information.
In addition to the major cate-gories, there are some importantsubclasses of the four majorclasses. I try to represent thisinformation in Figure 14.
As you can see, there is no nec-essary symmetry between thesubclasses of the four majorclasses. Actors tend to be individ-uals, organizations, and systems;objects break down into variouskinds of tangible and intangibleassets; messages are either inter-nal or external; and events areeither periodic or on demand.
This semantic breakdown helpsme because, from a databasestandpoint, each example of thevarious classes tends to behavein much the same way. Actorsare independent and thereforetend to have unique identifiers.The same is true with objects,but they often have very complexinternal structures, which, in rela-tional databases, mean multiplerelated tables. Actors (especiallyorganizations) and a lot of productstructures are recursive (e.g., Billof Materials), which give somepeople problems, not because thesolution is complex, but becauseit may not be obvious.
In all systems, messages linkthings (like actors and objects). Asa result, you find a lot of foreignkeys on message tables. Messagesalso tend to have simple (one ortwo levels) hierarchies. But inmany systems, messages repre-sent the bulk of the data. In many,you have hundreds of thousandsof customers, but you may havemillions or billions of transactions.In data warehousing, messageinformation almost always domi-nates other data.
Events tend to be associated withtime. Events are either periodic(e.g., weekly, monthly, yearly) oron demand (such as real time).They tend to contain snapshotsof the real world at some point intime and are most closely relatedto messages.
VOL. 3, NO. 2 www.cutter.com
1100 BUSINESS INTELLIGENCE ADVISORY SERVICE
Indiv
idual
Org
aniz
atio
n
Syste
m
Pro
duct, T
angib
le
Pro
duct, Inta
ngib
le
Serv
ice
Positi
on
Land
Exte
rnal
Inte
rnal
Periodic
On D
em
and
Actors
Customer a a
Salesperson a
Employee a
Vendor a
Objects
Products a
Services a
Position/Job a
Policy (Insurance) a
Parcel a
Messages
Order a
Shipment a
Payment a
Shipping Notice aEvents
Send Order a
Receive Order a
Send Shipment a
Receive Shipment a
Send Monthly Report a
Send Quarterly Report a
EventsActors MessagesObjects
Figure 14 — Examples of the four major entity classes andassociated subclasses.
Comments on BusinessSemantic Classes
We’ve used these business seman-tics for a long time. The more weuse them, the more we incorpo-rate them into everything that wedo. As you’ll see in the next sec-tion, we use our classification ofactors, messages, and objects todesign core data warehouses.
The fundamental idea that thereare general classes of entities thatreflect the real world is becomingmore common. There has beena strong movement within theobject-oriented communitytoward the use of patterns. In hiswonderful book, Data ModelPatterns [2], David Hay illustratesmore than 100 excellent datamodels in which he follows a verysimilar business semantic as theone we use here. There are, ofcourse, differences; for example,Hay uses “party” instead of“actor,” but the concepts are,as far as I can tell, identical.
Armed with better businesssemantics and sets of suchbusiness semantic models, dataarchitects are in a much betterposition to understand businessareas that they may not have hadexperience with — and quicklycome to understand how tomodel them. Equally important,they may be able to recommendmodels that are better in the longrun. For too long, high-level mod-eling has relied principally on userinput and architect experience.We are at a point in the historyof software engineering where
we can really begin to develophigh-level models that map to acommon real world.
UNDERSTANDING ENTERPRISEDATA FLOW
Over the years, we have discov-ered that there are, in fact, twoseparate components that go intothe enterprise data architecture:
1. The enterprise data flowarchitecture (EDFA) (datawarehouse architecture)
2. The enterprise logical dataarchitecture
We will devote this section toour EDFA.
EDFA (Data WarehouseArchitecture)
For a couple of decades, I havebeen working steadily on howto understand the data that orga-nizations have at a high level andhow that data gets transformed,moved, and used. One reason isthat, at various times in my career,I have been involved in designingsystems that were primarilyintended to support management(end-user) information accessand retrieval. As a consequence,I have been involved in buildingsystems that pulled data from oneor more systems and assembleda database that would allow theend user easy access to thatinformation.
In the 1980s, the term “data ware-housing” came into being whena number of companies beganto explore new ways to deliver
information that would answerend-user queries from data onexisting (i.e., legacy) systems. Iwas doing consulting with IBM atthe time, and the problem wefaced remains one of the majorproblems in IT — managers andstaff need access to informationthat requires the integration ofdata from multiple, independentsystems. Modern enterprises mustoperate at much higher speedsthan in the past. To do that, man-agement needs answers and alter-natives, and managers want tolook at multiple scenarios.
But most legacy systems were notgood at providing managementinformation. Since the databasesinvolved were complex, it oftentook considerable programmingto come up with the reports thatmanagement needed. The timeand management frustration wereeven greater when the neededinformation had to be drawn frommultiple systems.
The EDFA is a way of representingthe overall structure of data, com-munication, processing, and pre-sentation that exists for end-usercomputing within the enterprise.The architecture is made up ofa number of well-defined, inter-connected layers, or criticalcomponents (see Figure 15):
� The presentation/desktopaccess layer (1)
� The data source layer (opera-tional data layer [2a]/externaldata layer [2b]/non-operationaldata layer [2c])
EXECUTIVE REPORT 1111
©2003 CUTTER CONSORTIUM VOL. 3, NO. 2
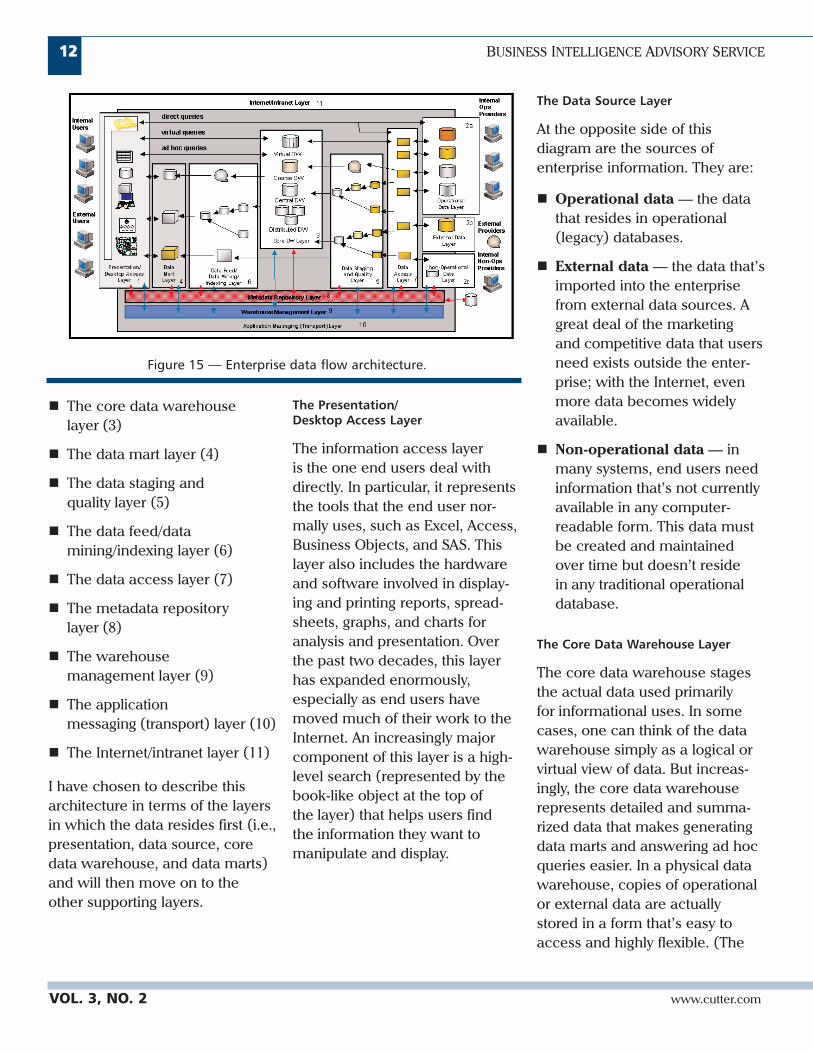
� The core data warehouselayer (3)
� The data mart layer (4)
� The data staging andquality layer (5)
� The data feed/datamining/indexing layer (6)
� The data access layer (7)
� The metadata repositorylayer (8)
� The warehousemanagement layer (9)
� The applicationmessaging (transport) layer (10)
� The Internet/intranet layer (11)
I have chosen to describe thisarchitecture in terms of the layersin which the data resides first (i.e.,presentation, data source, coredata warehouse, and data marts)and will then move on to theother supporting layers.
The Presentation/Desktop Access Layer
The information access layeris the one end users deal withdirectly. In particular, it representsthe tools that the end user nor-mally uses, such as Excel, Access,Business Objects, and SAS. Thislayer also includes the hardwareand software involved in display-ing and printing reports, spread-sheets, graphs, and charts foranalysis and presentation. Overthe past two decades, this layerhas expanded enormously,especially as end users havemoved much of their work to theInternet. An increasingly majorcomponent of this layer is a high-level search (represented by thebook-like object at the top ofthe layer) that helps users findthe information they want tomanipulate and display.
The Data Source Layer
At the opposite side of thisdiagram are the sources ofenterprise information. They are:
� Operational data — the datathat resides in operational(legacy) databases.
� External data — the data that’simported into the enterprisefrom external data sources. Agreat deal of the marketingand competitive data that usersneed exists outside the enter-prise; with the Internet, evenmore data becomes widelyavailable.
� Non-operational data — inmany systems, end users needinformation that’s not currentlyavailable in any computer-readable form. This data mustbe created and maintainedover time but doesn’t residein any traditional operationaldatabase.
The Core Data Warehouse Layer
The core data warehouse stagesthe actual data used primarilyfor informational uses. In somecases, one can think of the datawarehouse simply as a logical orvirtual view of data. But increas-ingly, the core data warehouserepresents detailed and summa-rized data that makes generatingdata marts and answering ad hocqueries easier. In a physical datawarehouse, copies of operationalor external data are actuallystored in a form that’s easy toaccess and highly flexible. (The
VOL. 3, NO. 2 www.cutter.com
1122 BUSINESS INTELLIGENCE ADVISORY SERVICE
Figure 15 — Enterprise data flow architecture.
design of the core data ware-house is a critical issue in theEDFA, and business semanticscan help in this activity.)
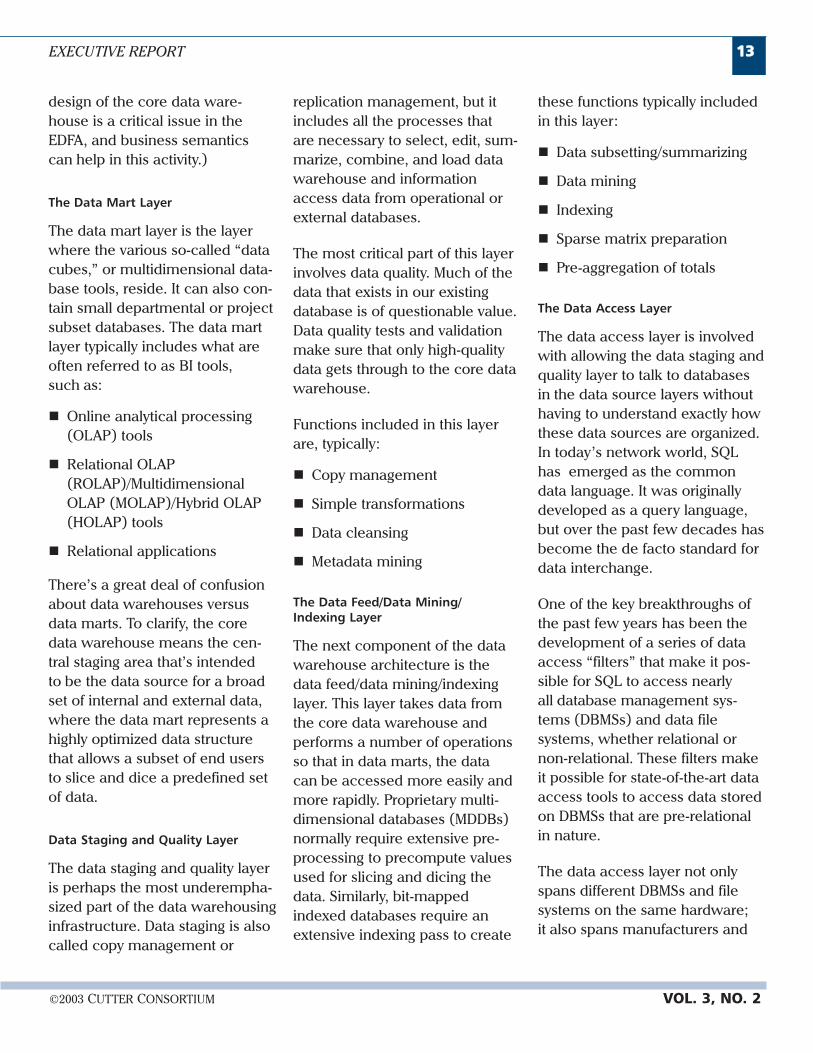
The Data Mart Layer
The data mart layer is the layerwhere the various so-called “datacubes,” or multidimensional data-base tools, reside. It can also con-tain small departmental or projectsubset databases. The data martlayer typically includes what areoften referred to as BI tools,such as:
� Online analytical processing(OLAP) tools
� Relational OLAP(ROLAP)/MultidimensionalOLAP (MOLAP)/Hybrid OLAP(HOLAP) tools
� Relational applications
There’s a great deal of confusionabout data warehouses versusdata marts. To clarify, the coredata warehouse means the cen-tral staging area that’s intendedto be the data source for a broadset of internal and external data,where the data mart represents ahighly optimized data structurethat allows a subset of end usersto slice and dice a predefined setof data.
Data Staging and Quality Layer
The data staging and quality layeris perhaps the most underempha-sized part of the data warehousinginfrastructure. Data staging is alsocalled copy management or
replication management, but itincludes all the processes thatare necessary to select, edit, sum-marize, combine, and load datawarehouse and informationaccess data from operational orexternal databases.
The most critical part of this layerinvolves data quality. Much of thedata that exists in our existingdatabase is of questionable value.Data quality tests and validationmake sure that only high-qualitydata gets through to the core datawarehouse.
Functions included in this layerare, typically:
� Copy management
� Simple transformations
� Data cleansing
� Metadata mining
The Data Feed/Data Mining/Indexing Layer
The next component of the datawarehouse architecture is thedata feed/data mining/indexinglayer. This layer takes data fromthe core data warehouse andperforms a number of operationsso that in data marts, the datacan be accessed more easily andmore rapidly. Proprietary multi-dimensional databases (MDDBs)normally require extensive pre-processing to precompute valuesused for slicing and dicing thedata. Similarly, bit-mappedindexed databases require anextensive indexing pass to create
these functions typically includedin this layer:
� Data subsetting/summarizing
� Data mining
� Indexing
� Sparse matrix preparation
� Pre-aggregation of totals
The Data Access Layer
The data access layer is involvedwith allowing the data staging andquality layer to talk to databasesin the data source layers withouthaving to understand exactly howthese data sources are organized.In today’s network world, SQLhas emerged as the commondata language. It was originallydeveloped as a query language,but over the past few decades hasbecome the de facto standard fordata interchange.
One of the key breakthroughs ofthe past few years has been thedevelopment of a series of dataaccess “filters” that make it pos-sible for SQL to access nearlyall database management sys-tems (DBMSs) and data filesystems, whether relational ornon-relational. These filters makeit possible for state-of-the-art dataaccess tools to access data storedon DBMSs that are pre-relationalin nature.
The data access layer not onlyspans different DBMSs and filesystems on the same hardware;it also spans manufacturers and
©2003 CUTTER CONSORTIUM VOL. 3, NO. 2
EXECUTIVE REPORT 1133
network protocols. One of thekeys to a data warehousing strat-egy is to provide end users with“universal data access.” In theoryat least, that means that endusers, regardless of location ordata access tool, should be ableto access any or all of the data inthe enterprise that’s necessary forthem to do their jobs.
The data access layer, then,is responsible for interfacingbetween data access tools andoperational databases. In somecases, this is all that certain endusers need. However, in general,organizations are developing amuch more sophisticated schemeto support data warehousing.
Functions in this layer include:
� Conversion between SQL andnative database access
� Native database retrieval
� Conversion of native databaseformat to SQL tables
� Sending SQL responses
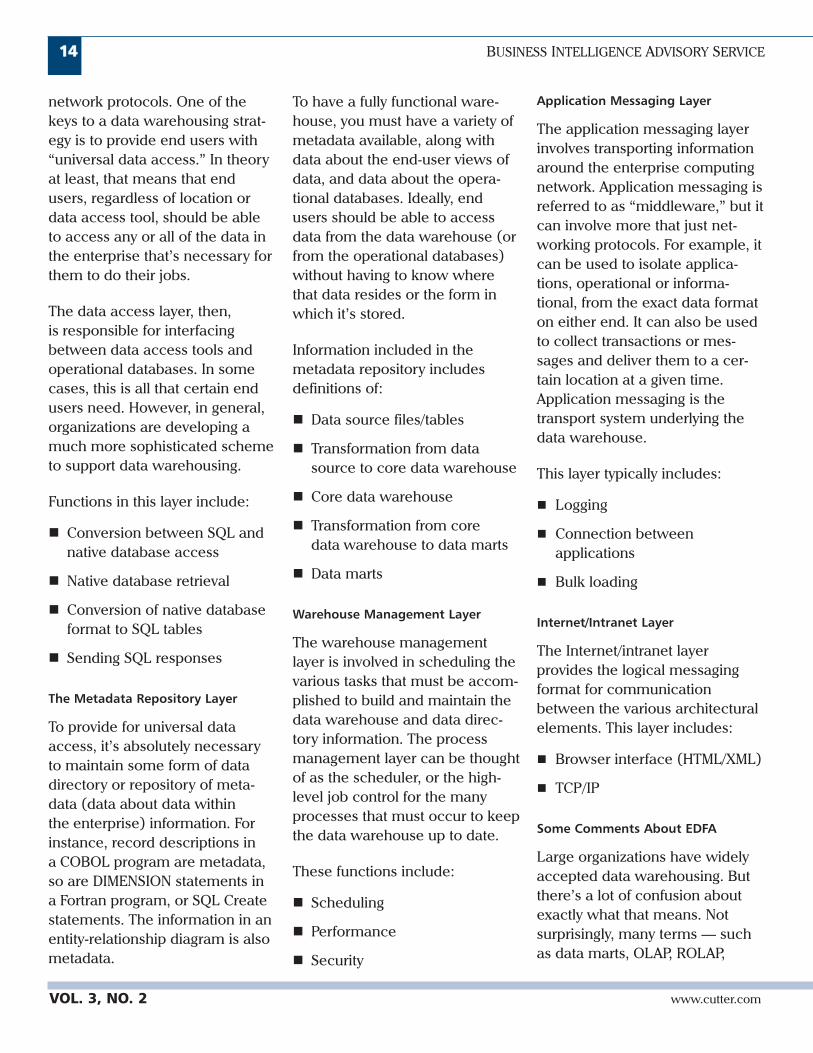
The Metadata Repository Layer
To provide for universal dataaccess, it’s absolutely necessaryto maintain some form of datadirectory or repository of meta-data (data about data withinthe enterprise) information. Forinstance, record descriptions ina COBOL program are metadata,so are DIMENSION statements ina Fortran program, or SQL Createstatements. The information in anentity-relationship diagram is alsometadata.
To have a fully functional ware-house, you must have a variety ofmetadata available, along withdata about the end-user views ofdata, and data about the opera-tional databases. Ideally, endusers should be able to accessdata from the data warehouse (orfrom the operational databases)without having to know wherethat data resides or the form inwhich it’s stored.
Information included in themetadata repository includesdefinitions of:
� Data source files/tables
� Transformation from datasource to core data warehouse
� Core data warehouse
� Transformation from coredata warehouse to data marts
� Data marts
Warehouse Management Layer
The warehouse managementlayer is involved in scheduling thevarious tasks that must be accom-plished to build and maintain thedata warehouse and data direc-tory information. The processmanagement layer can be thoughtof as the scheduler, or the high-level job control for the manyprocesses that must occur to keepthe data warehouse up to date.
These functions include:
� Scheduling
� Performance
� Security
Application Messaging Layer
The application messaging layerinvolves transporting informationaround the enterprise computingnetwork. Application messaging isreferred to as “middleware,” but itcan involve more that just net-working protocols. For example, itcan be used to isolate applica-tions, operational or informa-tional, from the exact data formaton either end. It can also be usedto collect transactions or mes-sages and deliver them to a cer-tain location at a given time.Application messaging is thetransport system underlying thedata warehouse.
This layer typically includes:
� Logging
� Connection betweenapplications
� Bulk loading
Internet/Intranet Layer
The Internet/intranet layerprovides the logical messagingformat for communicationbetween the various architecturalelements. This layer includes:
� Browser interface (HTML/XML)
� TCP/IP
Some Comments About EDFA
Large organizations have widelyaccepted data warehousing. Butthere’s a lot of confusion aboutexactly what that means. Notsurprisingly, many terms — suchas data marts, OLAP, ROLAP,
VOL. 3, NO. 2 www.cutter.com
1144 BUSINESS INTELLIGENCE ADVISORY SERVICE
MOLAP, and business intelligence— have sprouted around the coreconcept. This has allowed manypeople to simply rename theirstandalone end-user applications(data marts) as data warehouseactivities. Data warehousinginvolves implementing a core datawarehouse that acts as an enter-prise data asset; this makessupporting end-user requests forcore information easier and moretimely than using the traditionalpiecemeal approaches.
The reason we have laid out ourEDFA is that it’s vitally importantto understand the distinctions thatunderlie the rest of this report.Readers must not only understandthat “data marts” and “core datawarehouses” are different, butalso where they fit in the overallenterprise data flow. If we createa real-time enterprise, we mustknow all of the places data existsin the EDFA so it can be updatedand accessed correctly.
So, with a clear understanding ofour business semantics and thecore data warehouse, we can dis-cuss how we go about designingthe core data warehouse itself.
DESIGNING THE COREDATA WAREHOUSE
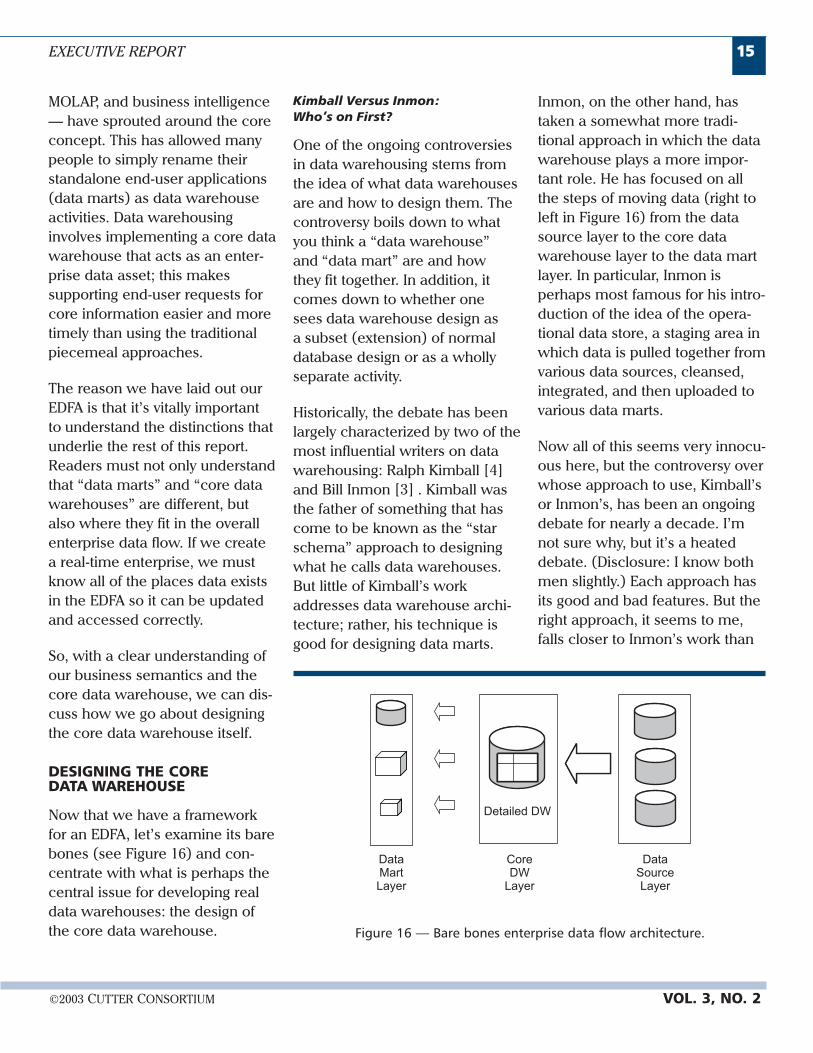
Now that we have a frameworkfor an EDFA, let’s examine its barebones (see Figure 16) and con-centrate with what is perhaps thecentral issue for developing realdata warehouses: the design ofthe core data warehouse.
Kimball Versus Inmon:Who’s on First?
One of the ongoing controversiesin data warehousing stems fromthe idea of what data warehousesare and how to design them. Thecontroversy boils down to whatyou think a “data warehouse”and “data mart” are and howthey fit together. In addition, itcomes down to whether onesees data warehouse design asa subset (extension) of normaldatabase design or as a whollyseparate activity.
Historically, the debate has beenlargely characterized by two of themost influential writers on datawarehousing: Ralph Kimball [4]and Bill Inmon [3] . Kimball wasthe father of something that hascome to be known as the “starschema” approach to designingwhat he calls data warehouses.But little of Kimball’s workaddresses data warehouse archi-tecture; rather, his technique isgood for designing data marts.
Inmon, on the other hand, hastaken a somewhat more tradi-tional approach in which the datawarehouse plays a more impor-tant role. He has focused on allthe steps of moving data (right toleft in Figure 16) from the datasource layer to the core datawarehouse layer to the data martlayer. In particular, Inmon isperhaps most famous for his intro-duction of the idea of the opera-tional data store, a staging area inwhich data is pulled together fromvarious data sources, cleansed,integrated, and then uploaded tovarious data marts.
Now all of this seems very innocu-ous here, but the controversy overwhose approach to use, Kimball’sor Inmon’s, has been an ongoingdebate for nearly a decade. I’mnot sure why, but it’s a heateddebate. (Disclosure: I know bothmen slightly.) Each approach hasits good and bad features. But theright approach, it seems to me,falls closer to Inmon’s work than
©2003 CUTTER CONSORTIUM VOL. 3, NO. 2
EXECUTIVE REPORT 1155
DataMartLayer
CoreDW
Layer
DataSourceLayer
Detailed DW
Figure 16 — Bare bones enterprise data flow architecture.

Kimball’s, which lacks both rigorand understanding.
The most important thing torecognize is that, ultimately, theKimball-Inmon debate centers onsummary versus atomic data asthe foundation for data ware-houses. Kimball, unfortunately,has approached the problem ofbuilding a data resource for anenterprise from a traditionalend-user/data processing stand-point. This view sees the devel-opment of data warehouses asdata repositories that are simpleenough for end users to accessdirectly. But it focuses on repos-itories that are far too limited tosupport large-scale data accessneeds. In addition, Kimball’s
approach has enormous problemsscaling.
The approach that we use todesign a core data warehouseis based on our business seman-tics. As you will see, we believein utilizing the notion of actors,messages, objects, and events todesign and populate our datawarehouses.
The goal of developing a datawarehouse is to have it be amodular set of data tables thatcan be used to support the broad-est range of end-user reportingneeds. In general, the core datawarehouse is not intended fordirect access by the end usersthemselves, but as a mechanismto allow the staging of data to data
marts and other data sets that areintended for end-user access.
The controversy over the respec-tive roles of data marts and datawarehouses is a direct result ofmisunderstanding the architec-tural role of the data warehouse.Why is the core data warehousethere at all? Why not simply loaddata directly from source data sys-tems directly into data marts? Theanswers to these questions are atthe heart of building the real-timeenterprise.
The answer to both questions isthe same: end users must be ableto easily find, access, manipulate,and display data from a numberof sources. But there’s a funda-mental conflict between ease ofuse and scope. In other words,we can present data to the enduser that’s easy to manipulate butlimited in scope (i.e., it containsonly a limited amount of dataabout one subject), or we cangive the end user access to datathat will answer very complexqueries requiring data frommultiple tables, but we can’t doboth without data marts (or end-user databases) and core datawarehouses.
Figure 17 illustrates this key prob-lem involved with data marts andcore data warehouses. On oneaxis we have ease of use, and onthe other, scope. Over decades ofwork in this field, it has becomeclear to me that the easiest dataformat for end users to dealwith is an old-fashioned “flat file,”
VOL. 3, NO. 2 www.cutter.com
1166 BUSINESS INTELLIGENCE ADVISORY SERVICE
Flat File
Data Cube
Star Schema
Snowflake
Snowball
Avalanche ThirdNormalForm (3NF)
Ease o
f U
se
Scope
Figure 17 – Ease of use versus scope.
in which all the data is stored ona file with one record that con-tains all the data fields. Althoughthese files are highly redundant,most users find it easy to manipu-late data found on these files, andease of use is perhaps the mostimportant factor when it comes toproviding immediate access to awide class of end users.
Next in ease of use would proba-bly be data cubes. Data cubesarguably make slicing and dicingdata easiest and most direct formanagers and end users. Much ofthe early push to data warehous-ing came from vendors of MDDBs,which is another term for datacubes. Data cubes representedthe majority of OLAP tools.
The star schema enables most ofthe same capabilities of the datacube within the world of relationaldatabases (see Appendix on page32). Star schema designs are notquite as easy to use as flat files ordata cubes, but they provide mostof the same capabilities and runon most commercial relationalDBMSs. However, data cubes andstar schema are somewhat lim-ited when it comes to scope. Starschema, like flat files, work bestwhere there is only one (or a few)“fact” tables. As designers attemptto add more tables to their datamarts, it becomes more complexand difficult to work with datacubes and star schema.
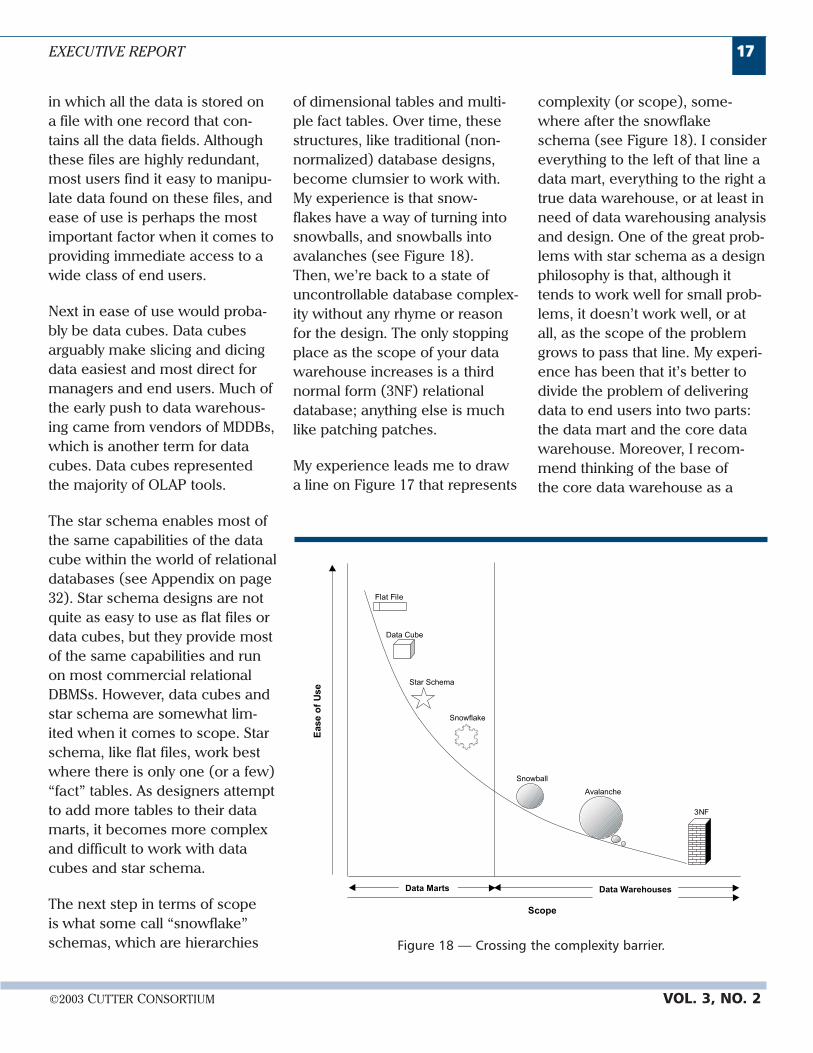
The next step in terms of scopeis what some call “snowflake”schemas, which are hierarchies
of dimensional tables and multi-ple fact tables. Over time, thesestructures, like traditional (non-normalized) database designs,become clumsier to work with.My experience is that snow-flakes have a way of turning intosnowballs, and snowballs intoavalanches (see Figure 18).Then, we’re back to a state ofuncontrollable database complex-ity without any rhyme or reasonfor the design. The only stoppingplace as the scope of your datawarehouse increases is a thirdnormal form (3NF) relationaldatabase; anything else is muchlike patching patches.
My experience leads me to drawa line on Figure 17 that represents
complexity (or scope), some-where after the snowflakeschema (see Figure 18). I considereverything to the left of that line adata mart, everything to the right atrue data warehouse, or at least inneed of data warehousing analysisand design. One of the great prob-lems with star schema as a designphilosophy is that, although ittends to work well for small prob-lems, it doesn’t work well, or atall, as the scope of the problemgrows to pass that line. My experi-ence has been that it’s better todivide the problem of deliveringdata to end users into two parts:the data mart and the core datawarehouse. Moreover, I recom-mend thinking of the base ofthe core data warehouse as a
©2003 CUTTER CONSORTIUM VOL. 3, NO. 2
EXECUTIVE REPORT 1177
Flat File
Data Cube
Star Schema
Snowflake
Snowball
Avalanche
3NF
Ease o
f U
se
Scope
Data Marts Data Warehouses
Figure 18 — Crossing the complexity barrier.
normalized database copied pri-marily for the key source systemsin which the base-level messages,actors, and objects are enteredand processed.
Normalization of data in largedatabases has a really bad rap inthe data warehousing world.Why? Largely because really nor-malized databases need a greatdeal of manipulation (selecting,projecting, and joining) to yieldwhat often seems to be a rathersimple answer. A client recentlycommented that it was notunusual for a fairly straightforwardquery to involve as many as 20different tables in one of his majorsystems. But end users have trou-ble writing SQL for three tables,much less 20. So if you readmuch of the BI literature, thereis this common assumption that
however you organize your datawarehouse, you want to makesure to denormalize it. It seemslike a good suggestion, but nor-malization, it turns out, is not allbad, especially if you’re tryingto build a core data warehousethat can support multiple busi-ness functions with the samedata resource.
Normalized databases have twoimportant capabilities: they’rethe most flexible way to organizelarge sets of organized data, andthey’re also the least redundantway to store large amounts ofdata. Because of these advan-tages, we develop our core datawarehouse around mostly nor-malized atomic data, or base-level business messages, suchas transactions. Now before youget concerned about the fact that
normalized data is difficult for endusers to manipulate directly, you’llnotice that end users interactmostly with data marts or spe-cially designed mini-marts thatcontain highly structured data inways that are easy for the enduser to manipulate. The core datawarehouse is just what its nameimplies: a warehouse of informa-tion that’s used to stage and storethe information that’s ultimatelyreformatted and used to loadthese user-friendly data marts.
Designing the CoreData Warehouse
Even though I don’t try to build anentire enterprise level data all atonce (I highly recommend youimplement your EDFA one appli-cation at a time), the core datawarehouse will ultimately needto provide a large portion of thedata the organization needs tomanage business. No highlydenormalized star schemaapproach will solve this prob-lem. We need an approach withsignificant theory and experiencebehind it: a (nearly) normalizedbase of data.
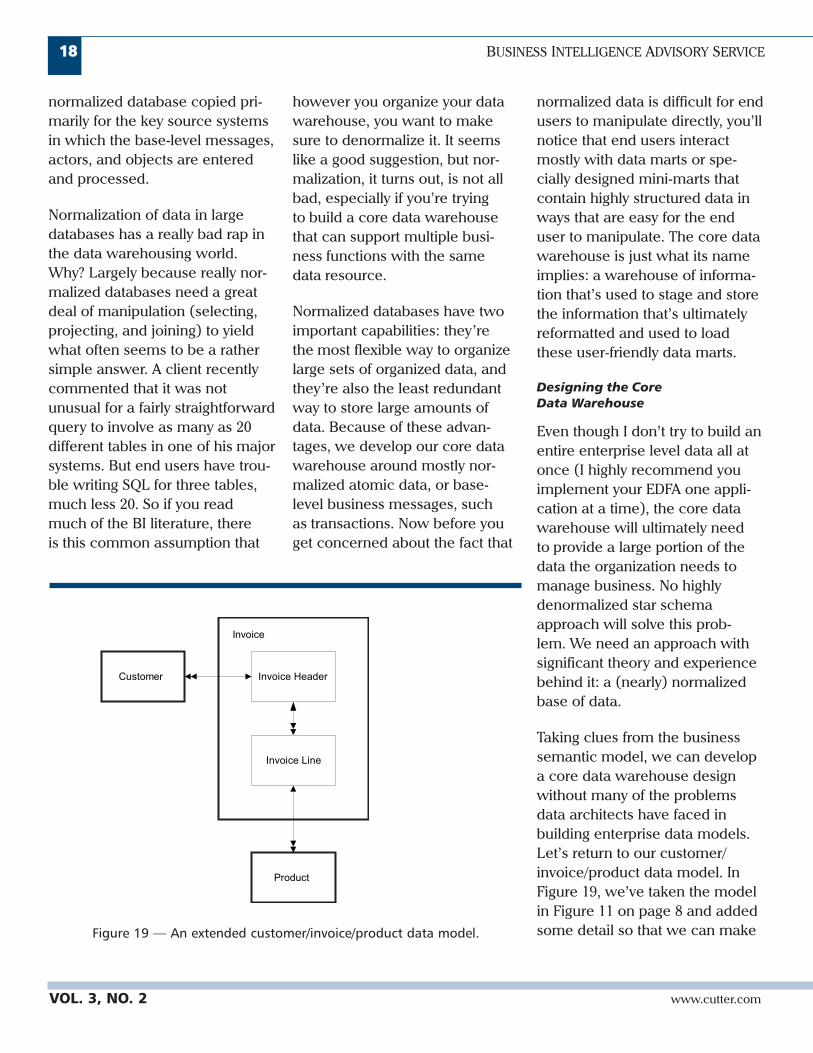
Taking clues from the businesssemantic model, we can developa core data warehouse designwithout many of the problemsdata architects have faced inbuilding enterprise data models.Let’s return to our customer/invoice/product data model. InFigure 19, we’ve taken the modelin Figure 11 on page 8 and addedsome detail so that we can make
VOL. 3, NO. 2 www.cutter.com
1188 BUSINESS INTELLIGENCE ADVISORY SERVICE
Customer
Product
Invoice Header
Invoice Line
Invoice
Figure 19 — An extended customer/invoice/product data model.
it directly into a normalized set oftables. We’ve done that by intro-ducing an “invoice header” andan “invoice line” within theinvoice entity.
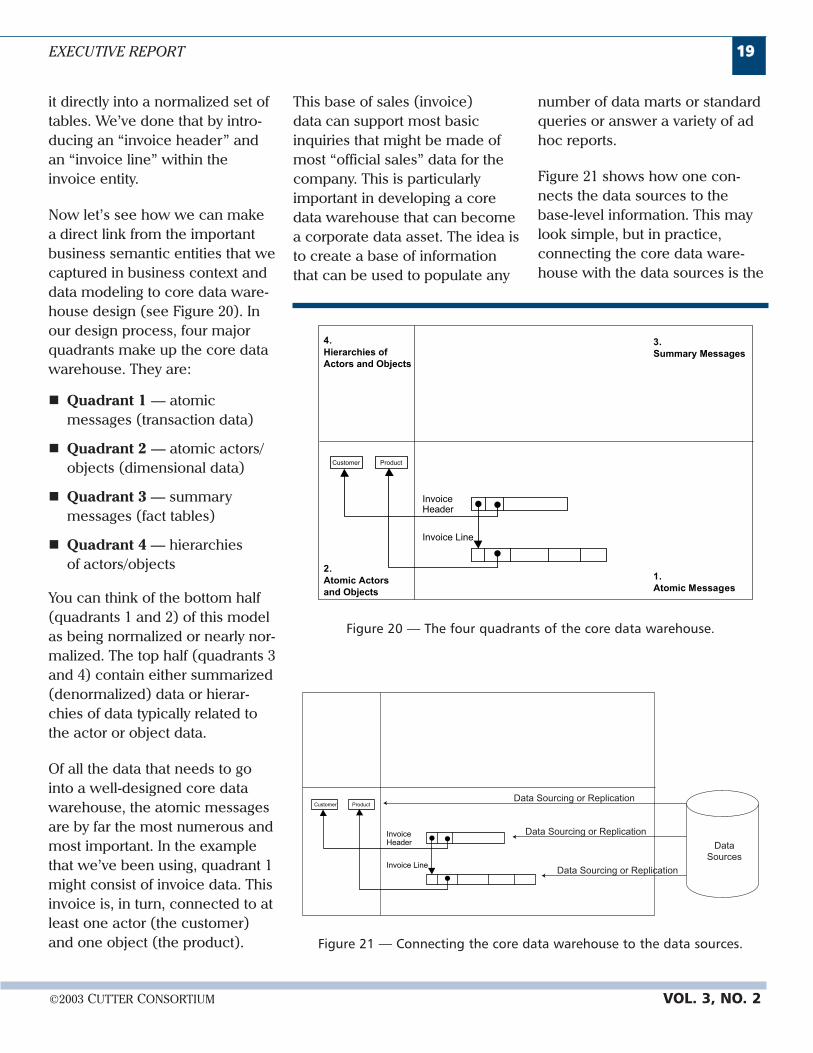
Now let’s see how we can makea direct link from the importantbusiness semantic entities that wecaptured in business context anddata modeling to core data ware-house design (see Figure 20). Inour design process, four majorquadrants make up the core datawarehouse. They are:
� Quadrant 1 — atomicmessages (transaction data)
� Quadrant 2 — atomic actors/objects (dimensional data)
� Quadrant 3 — summarymessages (fact tables)
� Quadrant 4 — hierarchiesof actors/objects
You can think of the bottom half(quadrants 1 and 2) of this modelas being normalized or nearly nor-malized. The top half (quadrants 3and 4) contain either summarized(denormalized) data or hierar-chies of data typically related tothe actor or object data.
Of all the data that needs to gointo a well-designed core datawarehouse, the atomic messagesare by far the most numerous andmost important. In the examplethat we’ve been using, quadrant 1might consist of invoice data. Thisinvoice is, in turn, connected to atleast one actor (the customer)and one object (the product).
This base of sales (invoice)data can support most basicinquiries that might be made ofmost “official sales” data for thecompany. This is particularlyimportant in developing a coredata warehouse that can becomea corporate data asset. The idea isto create a base of informationthat can be used to populate any
number of data marts or standardqueries or answer a variety of adhoc reports.
Figure 21 shows how one con-nects the data sources to thebase-level information. This maylook simple, but in practice,connecting the core data ware-house with the data sources is the
©2003 CUTTER CONSORTIUM VOL. 3, NO. 2
EXECUTIVE REPORT 1199
Invoice Line
Customer Product
InvoiceHeader
1.
Atomic Messages
2.
3.
Summary Messages
4.
Hierarchies of
Actors and Objects
Atomic Actors
and Objects
Figure 20 — The four quadrants of the core data warehouse.
Invoice Line
Customer Product
InvoiceHeader Data
Sources
Data Sourcing or Replication
Data Sourcing or Replication
Data Sourcing or Replication
Figure 21 — Connecting the core data warehouse to the data sources.
most complex part of most datawarehousing projects. It’s madesomewhat easier if one paysattention to capturing the basicsource (atomic) with which to
populate the data warehouse.This means that the data normallycomes from a smaller number ofultimate sources.
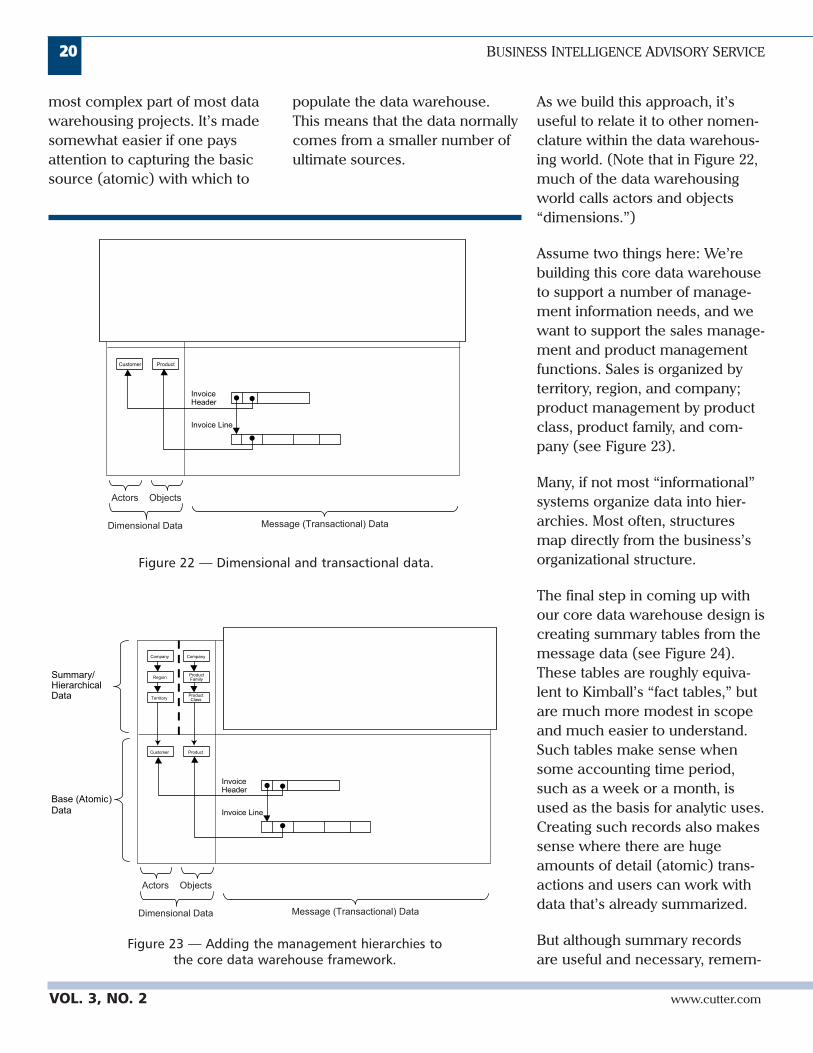
As we build this approach, it’suseful to relate it to other nomen-clature within the data warehous-ing world. (Note that in Figure 22,much of the data warehousingworld calls actors and objects“dimensions.”)
Assume two things here: We’rebuilding this core data warehouseto support a number of manage-ment information needs, and wewant to support the sales manage-ment and product managementfunctions. Sales is organized byterritory, region, and company;product management by productclass, product family, and com-pany (see Figure 23).
Many, if not most “informational”systems organize data into hier-archies. Most often, structuresmap directly from the business’sorganizational structure.
The final step in coming up withour core data warehouse design iscreating summary tables from themessage data (see Figure 24).These tables are roughly equiva-lent to Kimball’s “fact tables,” butare much more modest in scopeand much easier to understand.Such tables make sense whensome accounting time period,such as a week or a month, isused as the basis for analytic uses.Creating such records also makessense where there are hugeamounts of detail (atomic) trans-actions and users can work withdata that’s already summarized.
But although summary recordsare useful and necessary, remem-
VOL. 3, NO. 2 www.cutter.com
2200 BUSINESS INTELLIGENCE ADVISORY SERVICE
Invoice Line
Customer Product
InvoiceHeader
Actors Objects
Dimensional Data Message (Transactional) Data
Figure 22 — Dimensional and transactional data.
Invoice Line
Customer Product
InvoiceHeader
Actors Objects
Dimensional Data Message (Transactional) Data
Company
Region
Territory
Company
ProductFamily
ProductClass
Base (Atomic)Data
Summary/HierarchicalData
Figure 23 — Adding the management hierarchies tothe core data warehouse framework.
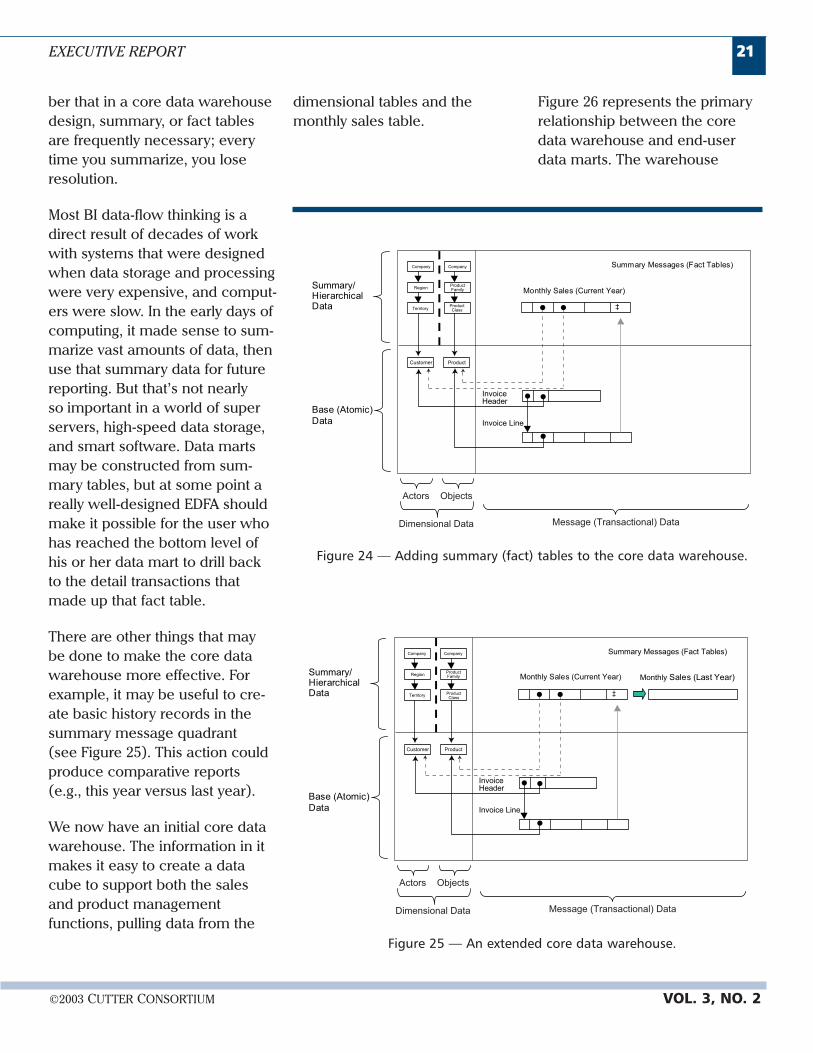
ber that in a core data warehousedesign, summary, or fact tablesare frequently necessary; everytime you summarize, you loseresolution.
Most BI data-flow thinking is adirect result of decades of workwith systems that were designedwhen data storage and processingwere very expensive, and comput-ers were slow. In the early days ofcomputing, it made sense to sum-marize vast amounts of data, thenuse that summary data for futurereporting. But that’s not nearlyso important in a world of superservers, high-speed data storage,and smart software. Data martsmay be constructed from sum-mary tables, but at some point areally well-designed EDFA shouldmake it possible for the user whohas reached the bottom level ofhis or her data mart to drill backto the detail transactions thatmade up that fact table.
There are other things that maybe done to make the core datawarehouse more effective. Forexample, it may be useful to cre-ate basic history records in thesummary message quadrant(see Figure 25). This action couldproduce comparative reports(e.g., this year versus last year).
We now have an initial core datawarehouse. The information in itmakes it easy to create a datacube to support both the salesand product managementfunctions, pulling data from the
dimensional tables and themonthly sales table.
Figure 26 represents the primaryrelationship between the coredata warehouse and end-userdata marts. The warehouse
©2003 CUTTER CONSORTIUM VOL. 3, NO. 2
EXECUTIVE REPORT 2211
Invoice Line
Customer Product
InvoiceHeader
Actors Objects
Dimensional Data Message (Transactional) Data
Base (Atomic)Data
Summary/HierarchicalData
Monthly Sales (Current Year)
‡
Summary Messages (Fact Tables)
Region
Territory
ProductFamily
ProductClass
Company Company
Figure 24 — Adding summary (fact) tables to the core data warehouse.
Invoice Line
Customer Product
InvoiceHeader
Actors Objects
Dimensional Data Message (Transactional) Data
Base (Atomic)Data
Summary/HierarchicalData
Monthly Sales (Current Year)
‡
Summary Messages (Fact Tables)
Monthly Sales (Last Year)Region
Territory
ProductFamily
ProductClass
Company Company
Figure 25 — An extended core data warehouse.
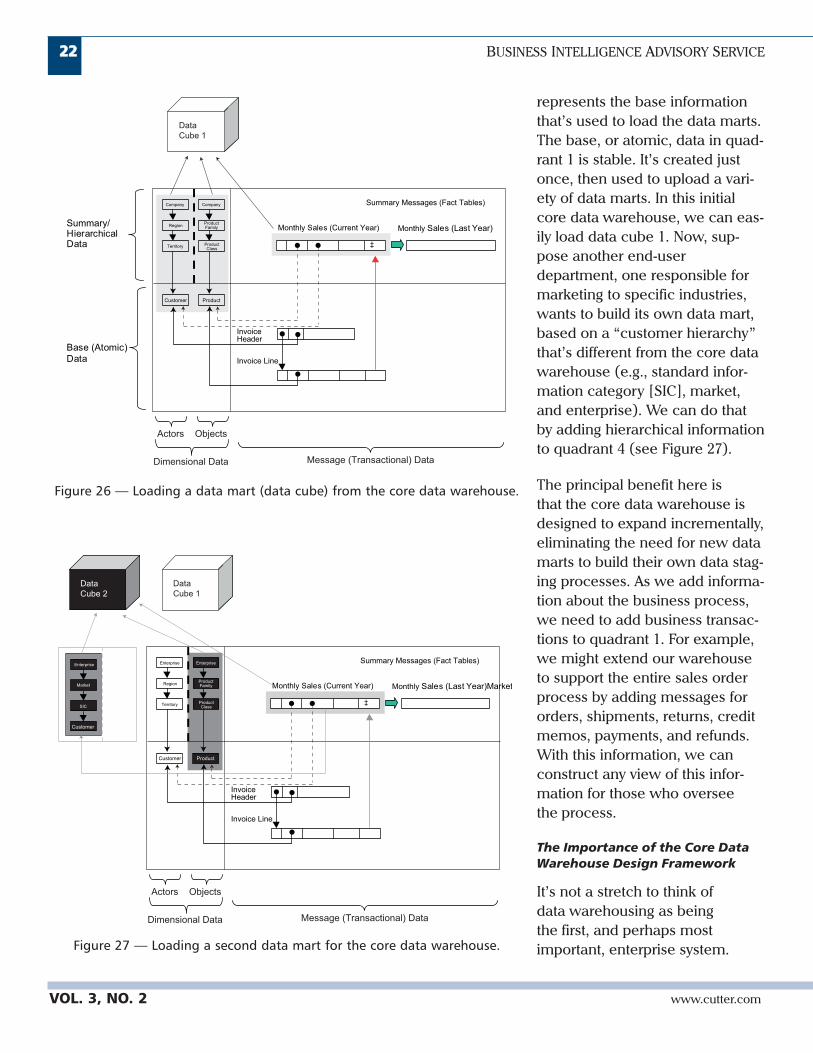
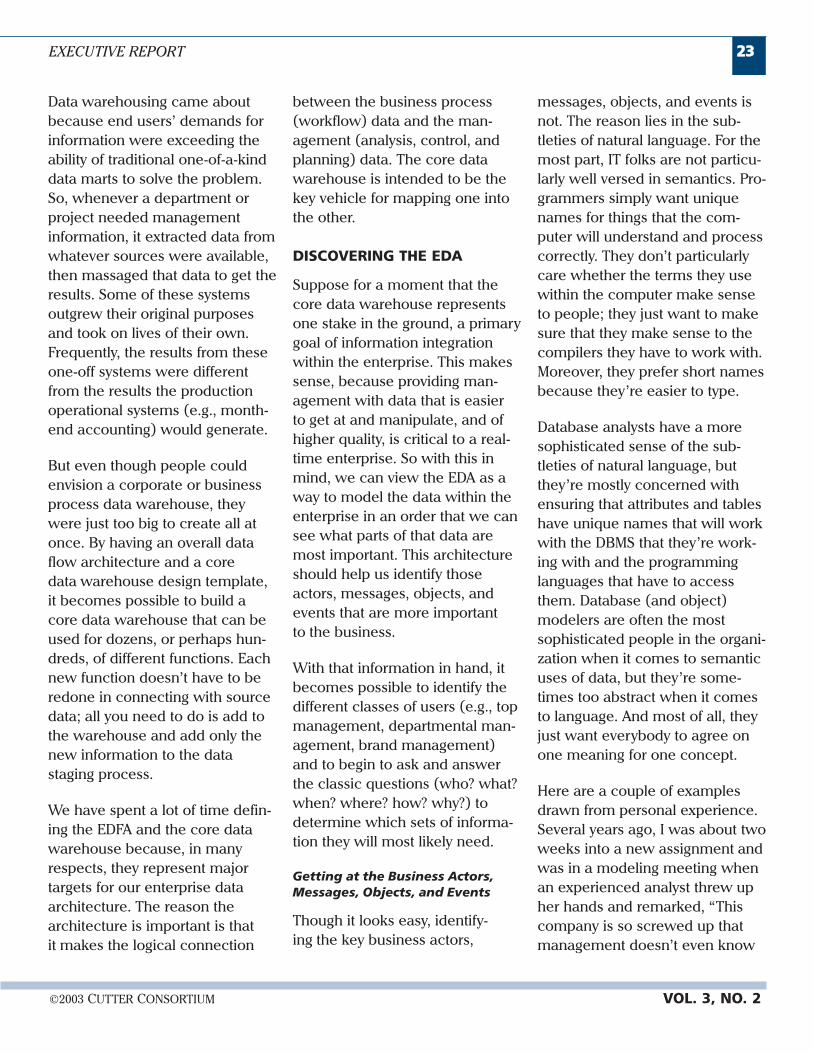
represents the base informationthat’s used to load the data marts.The base, or atomic, data in quad-rant 1 is stable. It’s created justonce, then used to upload a vari-ety of data marts. In this initialcore data warehouse, we can eas-ily load data cube 1. Now, sup-pose another end-userdepartment, one responsible formarketing to specific industries,wants to build its own data mart,based on a “customer hierarchy”that’s different from the core datawarehouse (e.g., standard infor-mation category [SIC], market,and enterprise). We can do thatby adding hierarchical informationto quadrant 4 (see Figure 27).
The principal benefit here isthat the core data warehouse isdesigned to expand incrementally,eliminating the need for new datamarts to build their own data stag-ing processes. As we add informa-tion about the business process,we need to add business transac-tions to quadrant 1. For example,we might extend our warehouseto support the entire sales orderprocess by adding messages fororders, shipments, returns, creditmemos, payments, and refunds.With this information, we canconstruct any view of this infor-mation for those who overseethe process.
The Importance of the Core DataWarehouse Design Framework
It’s not a stretch to think ofdata warehousing as beingthe first, and perhaps mostimportant, enterprise system.
VOL. 3, NO. 2 www.cutter.com
2222 BUSINESS INTELLIGENCE ADVISORY SERVICE
Invoice Line
Customer Product
InvoiceHeader
Actors Objects
Dimensional Data Message (Transactional) Data
Base (Atomic)Data
Summary/HierarchicalData
Monthly Sales (Current Year)
‡
Summary Messages (Fact Tables)
Monthly Sales (Last Year)
DataCube 1
Region
Territory
ProductFamily
ProductClass
Company Company
Figure 26 — Loading a data mart (data cube) from the core data warehouse.
Invoice Line
Customer Product
InvoiceHeader
Actors Objects
Dimensional Data Message (Transactional) Data
Monthly Sales (Current Year)
‡
Summary Messages (Fact Tables)
Monthly Sales (Last Year)Market
DataCube 1
DataCube 2
Customer
Enterprise
Region
Territory
Enterprise
ProductFamily
ProductClass
Enterprise
Market
SIC
Figure 27 — Loading a second data mart for the core data warehouse.
Data warehousing came aboutbecause end users’ demands forinformation were exceeding theability of traditional one-of-a-kinddata marts to solve the problem.So, whenever a department orproject needed managementinformation, it extracted data fromwhatever sources were available,then massaged that data to get theresults. Some of these systemsoutgrew their original purposesand took on lives of their own.Frequently, the results from theseone-off systems were differentfrom the results the productionoperational systems (e.g., month-end accounting) would generate.
But even though people couldenvision a corporate or businessprocess data warehouse, theywere just too big to create all atonce. By having an overall dataflow architecture and a coredata warehouse design template,it becomes possible to build acore data warehouse that can beused for dozens, or perhaps hun-dreds, of different functions. Eachnew function doesn’t have to beredone in connecting with sourcedata; all you need to do is add tothe warehouse and add only thenew information to the datastaging process.
We have spent a lot of time defin-ing the EDFA and the core datawarehouse because, in manyrespects, they represent majortargets for our enterprise dataarchitecture. The reason thearchitecture is important is thatit makes the logical connection
between the business process(workflow) data and the man-agement (analysis, control, andplanning) data. The core datawarehouse is intended to be thekey vehicle for mapping one intothe other.
DISCOVERING THE EDA
Suppose for a moment that thecore data warehouse representsone stake in the ground, a primarygoal of information integrationwithin the enterprise. This makessense, because providing man-agement with data that is easierto get at and manipulate, and ofhigher quality, is critical to a real-time enterprise. So with this inmind, we can view the EDA as away to model the data within theenterprise in an order that we cansee what parts of that data aremost important. This architectureshould help us identify thoseactors, messages, objects, andevents that are more importantto the business.
With that information in hand, itbecomes possible to identify thedifferent classes of users (e.g., topmanagement, departmental man-agement, brand management)and to begin to ask and answerthe classic questions (who? what?when? where? how? why?) todetermine which sets of informa-tion they will most likely need.
Getting at the Business Actors,Messages, Objects, and Events
Though it looks easy, identify-ing the key business actors,
messages, objects, and events isnot. The reason lies in the sub-tleties of natural language. For themost part, IT folks are not particu-larly well versed in semantics. Pro-grammers simply want uniquenames for things that the com-puter will understand and processcorrectly. They don’t particularlycare whether the terms they usewithin the computer make senseto people; they just want to makesure that they make sense to thecompilers they have to work with.Moreover, they prefer short namesbecause they’re easier to type.
Database analysts have a moresophisticated sense of the sub-tleties of natural language, butthey’re mostly concerned withensuring that attributes and tableshave unique names that will workwith the DBMS that they’re work-ing with and the programminglanguages that have to accessthem. Database (and object)modelers are often the mostsophisticated people in the organi-zation when it comes to semanticuses of data, but they’re some-times too abstract when it comesto language. And most of all, theyjust want everybody to agree onone meaning for one concept.
Here are a couple of examplesdrawn from personal experience.Several years ago, I was about twoweeks into a new assignment andwas in a modeling meeting whenan experienced analyst threw upher hands and remarked, “Thiscompany is so screwed up thatmanagement doesn’t even know
EXECUTIVE REPORT 2233
©2003 CUTTER CONSORTIUM VOL. 3, NO. 2
what it means by the term‘customer!’” Since then, I’veheard this same thing many times.And it isn’t just “customer”; I’veheard the same remarks about“employee,” “vendor,” and “prod-uct.” It caused me to start won-dering: What’s the real problemhere? I came to see that termssuch as customer, employee, andvendor are not simple concepts.
The reason that people had somany problems with commonterms was that they were usingthe same words to representdifferent things. In a major diversi-fied company, for example, thereare lots of different classes ofcustomers because the companyhas different classes of products.For example, General Electric(GE) sells dishwashers and micro-waves, as well as locomotives andjet engines. Each group refers tocustomers and products, but thecustomers and products are verydifferent. In the consumer world,there are two major classes ofcustomers: the retail outlets thatbuy GE appliances directly, andthe consumer who buys themfrom the retail outlets. Meanwhile,a locomotive or jet engine, beinga different kind of product, needsdifferent product, marketing, andpricing information, and are soldin ones and twos, not thousands.
Our recommendations to peoplebuilding an EDA is to do it bybusiness domain, since it’s alwayseasier to put things together thanto pull them apart.
Understanding theBusiness Context
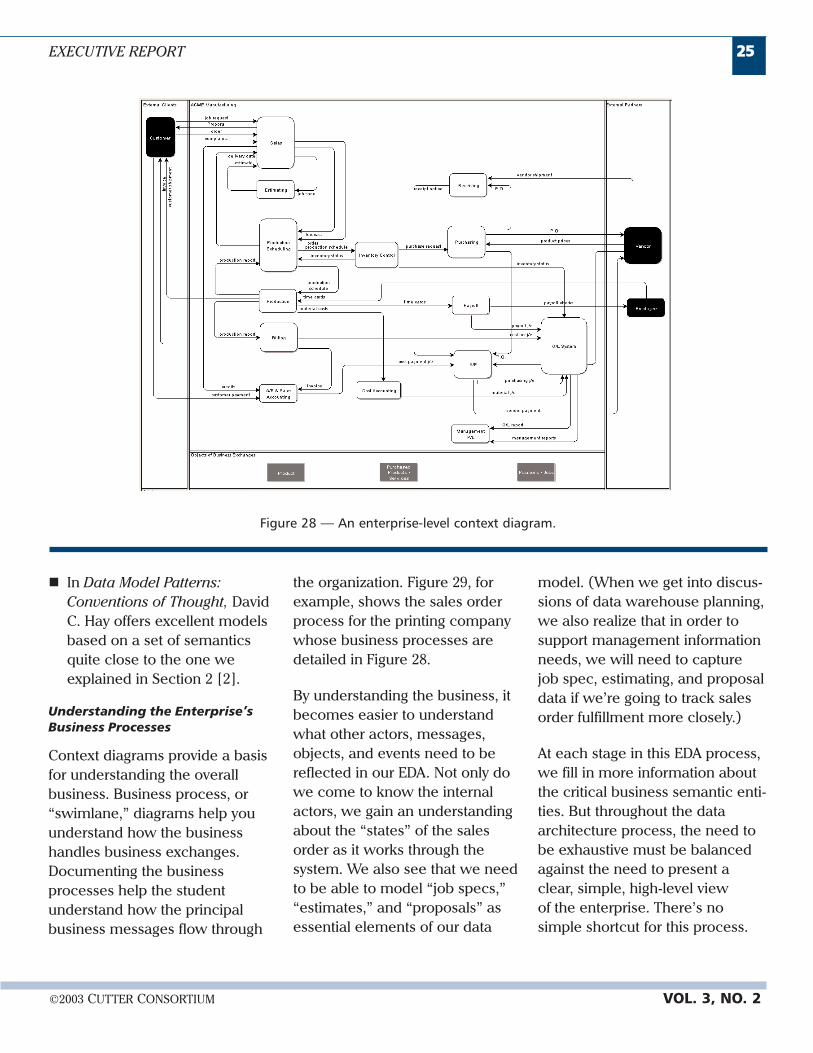
Normally, the best place to begindeveloping an enterprise dataarchitecture is to define the busi-ness context. As we said in thebusiness semantics section, we’relooking for the business-criticalactors, messages, objects, andevents. What we capture providesthe context in which things exist,such as who starts things off andwhat we send to whom. Figure28 shows the context of an enter-prise, in this case a printingcompany.
The framework diagram in Figure28 is really the sum of a numberof context diagrams of individualsystems. At this level, this systemprovides a basis for thinkingabout the business’s majorprocesses, such as sales order,supply chain, payroll, and man-agement reporting.
From a data architecture stand-point, there are a number ofthings that stand out here. First,it begins to point out some of theactors that we’ll have to track(customers, vendors, employees).In addition, we can begin to spotthe objects that will be in thesame part of the model with thekey external actors.
Reviewing Existing Data Models
The great thing about an enter-prise data architecture is that itdoesn’t change very much overtime. If an enterprise stays in thesame business and operates
through the same channels, theEDA is likely to stay the same. Forthis reason, it’s important to goback through previous require-ments or modeling activities. Asan example, I have been workingwith one of my best clients for acouple of decades; in that time,its basic data models haven’tchanged much. Moreover, it oftendoesn’t matter that a particularmodel wasn’t implemented orwas only partially implemented.What matters is that it’s a goodhigh-level, logical model ofthe business.
There are times when the basicbusiness changes, and the histori-cal data models don’t reflect that.For example, a few years back,I worked with an apparel com-pany that shifted its fundamentalbusiness model from manufac-turing private label clothing forlarge retail chains using theirown plants (mostly in the US) toacquiring small companies withtheir own labels, who made theirclothing in Third-World countries.
It makes sense to try to determinewhatever models exist. If youhave worked in similar industriesor have friends who do, it can’thurt to look at other models.Finally, there are some books withwhich you should be familiar:
� In Enterprise-Wide DataModeling: Systems in Industry,A.W. Scheer explains howenterprise data architecturesgo together [5].
2244 BUSINESS INTELLIGENCE ADVISORY SERVICE
VOL. 3, NO. 2 www.cutter.com
� In Data Model Patterns:Conventions of Thought, DavidC. Hay offers excellent modelsbased on a set of semanticsquite close to the one weexplained in Section 2 [2].
Understanding the Enterprise’sBusiness Processes
Context diagrams provide a basisfor understanding the overallbusiness. Business process, or“swimlane,” diagrams help youunderstand how the businesshandles business exchanges.Documenting the businessprocesses help the studentunderstand how the principalbusiness messages flow through
the organization. Figure 29, forexample, shows the sales orderprocess for the printing companywhose business processes aredetailed in Figure 28.
By understanding the business, itbecomes easier to understandwhat other actors, messages,objects, and events need to bereflected in our EDA. Not only dowe come to know the internalactors, we gain an understandingabout the “states” of the salesorder as it works through thesystem. We also see that we needto be able to model “job specs,”“estimates,” and “proposals” asessential elements of our data
model. (When we get into discus-sions of data warehouse planning,we also realize that in order tosupport management informationneeds, we will need to capturejob spec, estimating, and proposaldata if we’re going to track salesorder fulfillment more closely.)
At each stage in this EDA process,we fill in more information aboutthe critical business semantic enti-ties. But throughout the dataarchitecture process, the need tobe exhaustive must be balancedagainst the need to present aclear, simple, high-level viewof the enterprise. There’s nosimple shortcut for this process.
©2003 CUTTER CONSORTIUM VOL. 3, NO. 2
EXECUTIVE REPORT 2255
Figure 28 — An enterprise-level context diagram.

Producing this view is challengingunder the best of circumstances.The most important thing toremember is that the EDA’s role isdifferent from that of an applica-tion’s data model. It’s a way wecan help people understand howthey can conceptualize enterprisedata so that we can do a betterjob of positioning various systemsprojects and activities.
Modeling Major Objects
Most organizations produce some-thing. In manufacturing or con-struction businesses, there is acommon consensus about theimportance of the enterprise’sproducts. In other kinds of busi-nesses, such as service organiza-tions and public agencies, theproduct or service they deliveris more abstract and, therefore,not quite so well thought out. Inour work, we have found thatmodeling an enterprise’s majorproducts or services are veryimportant and useful in under-standing how it should structureits enterprise data architecture.How information is or will beused to support managementneeds is equally important.
In a recent project, in which Iworked with a construction orga-nization, it became clear that atthe highest level, they delivered a“completed project”; in this case,the completed project was somesegment of roadway with suchelements as bridges and over-passes (see Figure 30).
VOL. 3, NO. 2 www.cutter.com
2266 BUSINESS INTELLIGENCE ADVISORY SERVICE
Figure 30 — Basic object structure.
Product
Accounts Receivable and Sales Accounting
Billing
Production
Production Scheduling
Estimating
Sales
Customer
job r
equest
job spec
estimate
proposal
orderReview Job
Estimate Job
PrepareProposal
Submit Order
Submit Orderand Forecast
Figure 29 — Sales order business process.
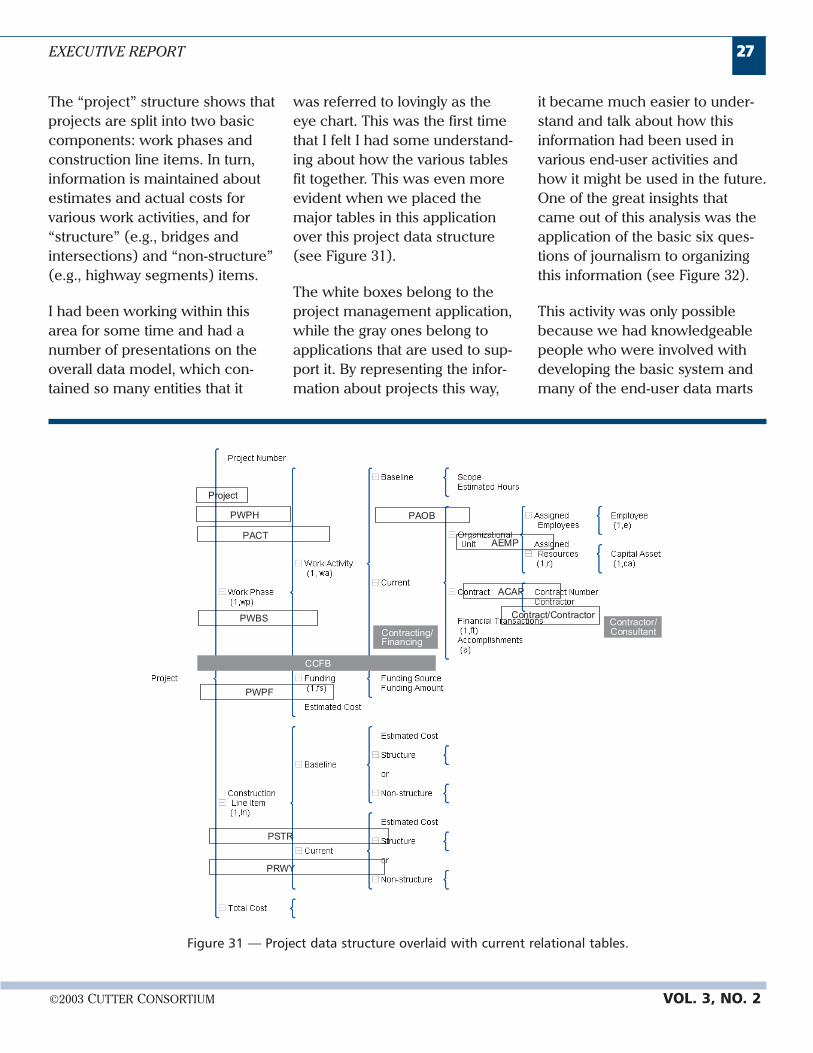
The “project” structure shows thatprojects are split into two basiccomponents: work phases andconstruction line items. In turn,information is maintained aboutestimates and actual costs forvarious work activities, and for“structure” (e.g., bridges andintersections) and “non-structure”(e.g., highway segments) items.
I had been working within thisarea for some time and had anumber of presentations on theoverall data model, which con-tained so many entities that it
was referred to lovingly as theeye chart. This was the first timethat I felt I had some understand-ing about how the various tablesfit together. This was even moreevident when we placed themajor tables in this applicationover this project data structure(see Figure 31).
The white boxes belong to theproject management application,while the gray ones belong toapplications that are used to sup-port it. By representing the infor-mation about projects this way,
it became much easier to under-stand and talk about how thisinformation had been used invarious end-user activities andhow it might be used in the future.One of the great insights thatcame out of this analysis was theapplication of the basic six ques-tions of journalism to organizingthis information (see Figure 32).
This activity was only possiblebecause we had knowledgeablepeople who were involved withdeveloping the basic system andmany of the end-user data marts
EXECUTIVE REPORT 2277
©2003 CUTTER CONSORTIUM VOL. 3, NO. 2
PWPH
Project
PACT
PRWY
PSTR
PAOB
PWPF
Contracting/Financing
AEMP
ACAP
PWBS
CCFB
Contractor/Consultant
Contract/Contractor
Figure 31 — Project data structure overlaid with current relational tables.
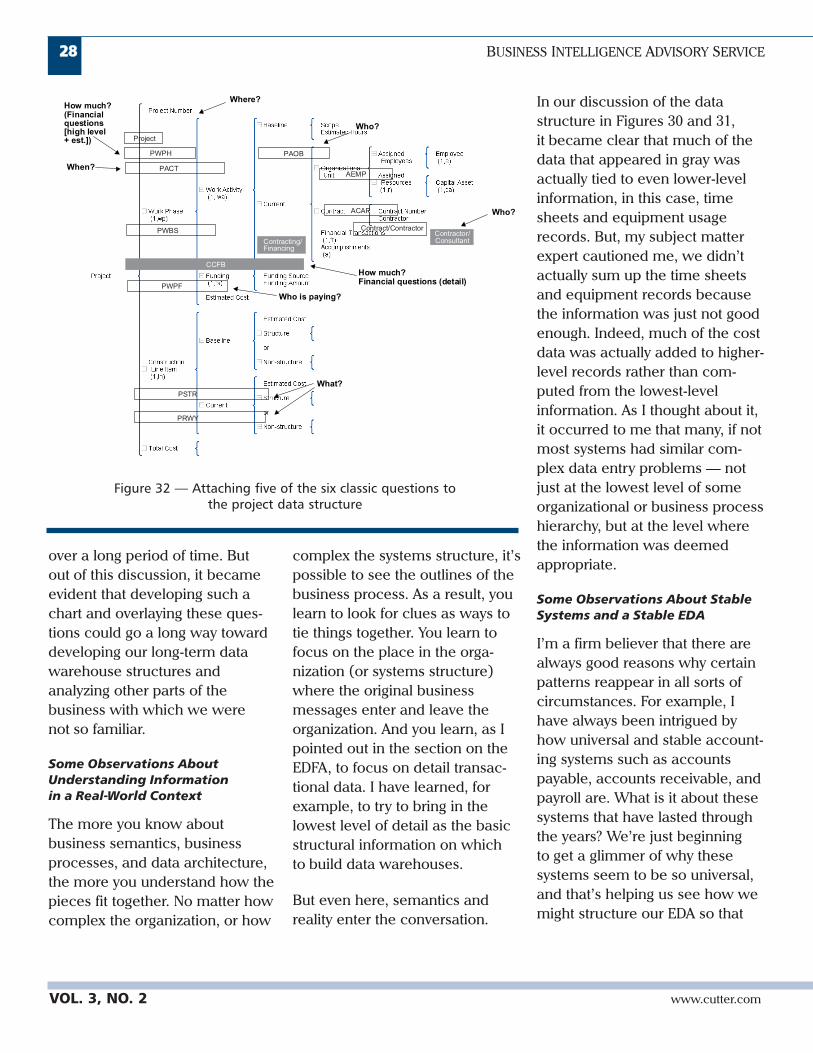
over a long period of time. Butout of this discussion, it becameevident that developing such achart and overlaying these ques-tions could go a long way towarddeveloping our long-term datawarehouse structures andanalyzing other parts of thebusiness with which we werenot so familiar.
Some Observations AboutUnderstanding Informationin a Real-World Context
The more you know aboutbusiness semantics, businessprocesses, and data architecture,the more you understand how thepieces fit together. No matter howcomplex the organization, or how
complex the systems structure, it’spossible to see the outlines of thebusiness process. As a result, youlearn to look for clues as ways totie things together. You learn tofocus on the place in the orga-nization (or systems structure)where the original businessmessages enter and leave theorganization. And you learn, as Ipointed out in the section on theEDFA, to focus on detail transac-tional data. I have learned, forexample, to try to bring in thelowest level of detail as the basicstructural information on whichto build data warehouses.
But even here, semantics andreality enter the conversation.
In our discussion of the datastructure in Figures 30 and 31,it became clear that much of thedata that appeared in gray wasactually tied to even lower-levelinformation, in this case, timesheets and equipment usagerecords. But, my subject matterexpert cautioned me, we didn’tactually sum up the time sheetsand equipment records becausethe information was just not goodenough. Indeed, much of the costdata was actually added to higher-level records rather than com-puted from the lowest-levelinformation. As I thought about it,it occurred to me that many, if notmost systems had similar com-plex data entry problems — notjust at the lowest level of someorganizational or business processhierarchy, but at the level wherethe information was deemedappropriate.
Some Observations About StableSystems and a Stable EDA
I’m a firm believer that there arealways good reasons why certainpatterns reappear in all sorts ofcircumstances. For example, Ihave always been intrigued byhow universal and stable account-ing systems such as accountspayable, accounts receivable, andpayroll are. What is it about thesesystems that have lasted throughthe years? We’re just beginningto get a glimmer of why thesesystems seem to be so universal,and that’s helping us see how wemight structure our EDA so that
2288 BUSINESS INTELLIGENCE ADVISORY SERVICE
VOL. 3, NO. 2 www.cutter.com
PWPH
Project
PACT
PRWY
PSTR
PAOB
PWPF
Contracting/Financing
AEMP
ACAP
PWBS
CCFB
Contractor/Consultant
Contract/Contractor
How much? Financial questions (detail)
How much?(Financial questions[high level+ est.])
When?
Who?
What?
Where?
Who is paying?
Who?
Figure 32 — Attaching five of the six classic questions tothe project data structure
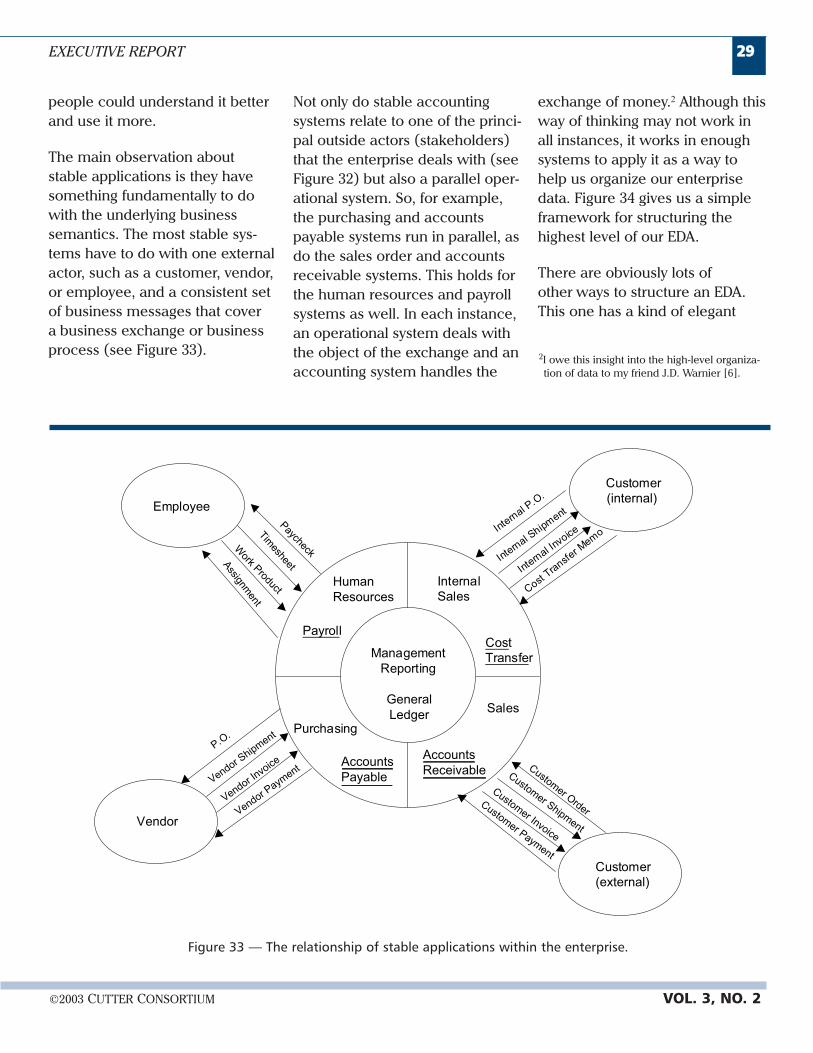
people could understand it betterand use it more.
The main observation aboutstable applications is they havesomething fundamentally to dowith the underlying businesssemantics. The most stable sys-tems have to do with one externalactor, such as a customer, vendor,or employee, and a consistent setof business messages that covera business exchange or businessprocess (see Figure 33).
Not only do stable accountingsystems relate to one of the princi-pal outside actors (stakeholders)that the enterprise deals with (seeFigure 32) but also a parallel oper-ational system. So, for example,the purchasing and accountspayable systems run in parallel, asdo the sales order and accountsreceivable systems. This holds forthe human resources and payrollsystems as well. In each instance,an operational system deals withthe object of the exchange and anaccounting system handles the
exchange of money.2 Although thisway of thinking may not work inall instances, it works in enoughsystems to apply it as a way tohelp us organize our enterprisedata. Figure 34 gives us a simpleframework for structuring thehighest level of our EDA.
There are obviously lots ofother ways to structure an EDA.This one has a kind of elegant
©2003 CUTTER CONSORTIUM VOL. 3, NO. 2
EXECUTIVE REPORT 2299
Customer(external)
Employee
Vendor
Customer(internal)
HumanResources
Payroll
Purchasing
AccountsPayable
Sales
CostTransfer
P.O.
Vendor Shipment
Vendor Invo
ice
Vendor Paym
ent
InternalSales
Customer Order
Customer Shipm
ent
Customer Invoice
Customer Paym
ent
Inte
rnal P
.O.
Inte
rnal S
hipment
Inte
rnal In
voice
Cost Tra
nsfer M
emo
GeneralLedger
ManagementReporting
Assignm
ent
Work Product
Timesheet
Paycheck
AccountsReceivable
Figure 33 — The relationship of stable applications within the enterprise.
2I owe this insight into the high-level organiza-tion of data to my friend J.D. Warnier [6].
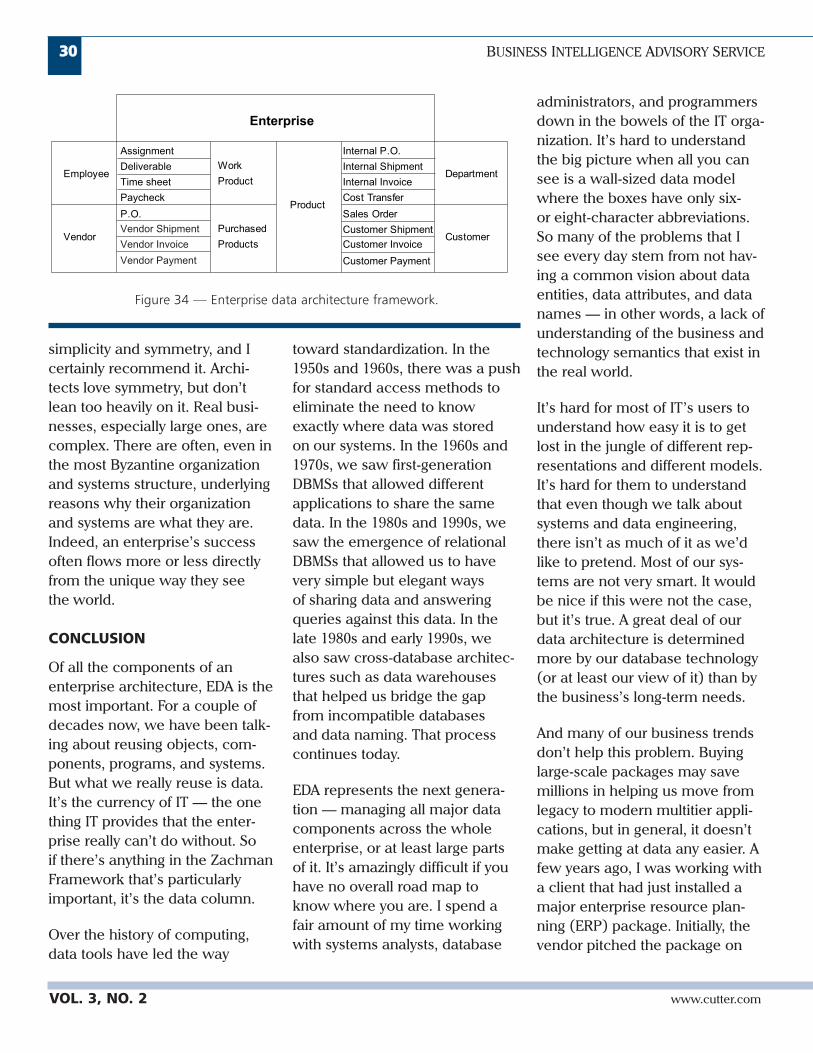
simplicity and symmetry, and Icertainly recommend it. Archi-tects love symmetry, but don’tlean too heavily on it. Real busi-nesses, especially large ones, arecomplex. There are often, even inthe most Byzantine organizationand systems structure, underlyingreasons why their organizationand systems are what they are.Indeed, an enterprise’s successoften flows more or less directlyfrom the unique way they seethe world.
CONCLUSION
Of all the components of anenterprise architecture, EDA is themost important. For a couple ofdecades now, we have been talk-ing about reusing objects, com-ponents, programs, and systems.But what we really reuse is data.It’s the currency of IT — the onething IT provides that the enter-prise really can’t do without. Soif there’s anything in the ZachmanFramework that’s particularlyimportant, it’s the data column.
Over the history of computing,data tools have led the way
toward standardization. In the1950s and 1960s, there was a pushfor standard access methods toeliminate the need to knowexactly where data was storedon our systems. In the 1960s and1970s, we saw first-generationDBMSs that allowed differentapplications to share the samedata. In the 1980s and 1990s, wesaw the emergence of relationalDBMSs that allowed us to havevery simple but elegant waysof sharing data and answeringqueries against this data. In thelate 1980s and early 1990s, wealso saw cross-database architec-tures such as data warehousesthat helped us bridge the gapfrom incompatible databasesand data naming. That processcontinues today.
EDA represents the next genera-tion — managing all major datacomponents across the wholeenterprise, or at least large partsof it. It’s amazingly difficult if youhave no overall road map toknow where you are. I spend afair amount of my time workingwith systems analysts, database
administrators, and programmersdown in the bowels of the IT orga-nization. It’s hard to understandthe big picture when all you cansee is a wall-sized data modelwhere the boxes have only six-or eight-character abbreviations.So many of the problems that Isee every day stem from not hav-ing a common vision about dataentities, data attributes, and datanames — in other words, a lack ofunderstanding of the business andtechnology semantics that exist inthe real world.
It’s hard for most of IT’s users tounderstand how easy it is to getlost in the jungle of different rep-resentations and different models.It’s hard for them to understandthat even though we talk aboutsystems and data engineering,there isn’t as much of it as we’dlike to pretend. Most of our sys-tems are not very smart. It wouldbe nice if this were not the case,but it’s true. A great deal of ourdata architecture is determinedmore by our database technology(or at least our view of it) than bythe business’s long-term needs.
And many of our business trendsdon’t help this problem. Buyinglarge-scale packages may savemillions in helping us move fromlegacy to modern multitier appli-cations, but in general, it doesn’tmake getting at data any easier. Afew years ago, I was working witha client that had just installed amajor enterprise resource plan-ning (ERP) package. Initially, thevendor pitched the package on
VOL. 3, NO. 2 www.cutter.com
3300 BUSINESS INTELLIGENCE ADVISORY SERVICE
Assignment Internal P.O.
Deliverable Internal Shipment
Time sheet Internal Invoice
Paycheck Cost Transfer
P.O. Sales Order
Customer Shipment
Enterprise
Product
Customer
Employee DepartmentWork
Product
VendorPurchased
Products
Vendor Shipment
Vendor Invoice
Vendor Payment
Customer Invoice
Customer Payment
Figure 34 — Enterprise data architecture framework.
the basis that “we have thousandsof reports, any information youneed, we already have!” Unfortu-nately, the client didn’t need anyof the thousands of reports, andgetting the data out of the pack-age and into a form in which itcould integrate that informationwith other information it alreadyhad, became a nightmare. At onepoint, the company could get oneof its data marts to come within$30 million of its operating state-ment (more than just a roundingerror for this particular division).
For those of you challenged to jus-tify the cost of developing a goodEDA, just point to the cost of hun-dreds or thousands of redundantdata files in the operations. As atest, see whether the operationsguys can tell you what’s on anyspecific database or how redun-dant the data on that database isto that of an adjacent application,such as order entry and shipping,or shipping and billing.
In IT, we have watched fordecades as we have promisedmore than one generation ofmanagement that with just onemore technological upgrade, wewould at last be able to get themthe information they need in theappropriate time frame. And wecan get the prepackaged stuffsuch as canned queries andstandard reports most of the time.But if anything, we’re furtheraway from being able to providethe kind of instantaneous infor-mation that the real-time enter-prise needs.
Cisco has gotten a lot of mileagefrom IT executives for its internalsystems and claims it can closeits books in less than a day. Mostof my clients are not in that boat.But Cisco got there through lots ofwork and commitment to goodsystems architecture. Cisco is per-haps as close to being a real-timeenterprise as there is in the busi-ness world. But other companiesmake the same commitment,intent on becoming real-timeenterprises.
If you read my EnterpriseArchitecture Executive Report lastOctober, you know that I believethat the top row of the ZachmanFramework more nearly repre-sents city and regional planningthan it does architecture. In muchthe same way, the data architectshould be thought of more as adata planner than a data architect.The city planning function is notso much involved in laying outexactly how various parts of thecity are to be organized but in try-ing to gain a political consensuson the general topology of the cityand its environs. In the same way,the top-level data planning func-tion involves laying out the gen-eral flow (the enterprise data flowarchitecture) and the generaltopology of the major data assets.
As more organizations movetoward becoming real-timeenterprises, they’re going to needEDAs to help them make thismove, and architects who under-stand the map of the whole enter-prise, not just one piece. Today,
this is especially important workin the evolution of advancedcomputer systems.
ABOUT THE AUTHOR
Ken Orr is a Fellow of the CutterBusiness Technology Counciland a Cutter Consortium SeniorConsultant and contributor toCutter’s Business-IT Strategies andEnterprise Architecture Practices.He is also a regular speaker atCutter Summits and symposia.Mr. Orr is a Principal Researcherwith the Ken Orr Institute, a busi-ness technology research orga-nization. Previously, he was anAffiliate Professor and Directorof the Center for the InnovativeApplication of Technology withthe School of Technology andInformation Management atWashington University. He is aninternationally recognized experton technology transfer, softwareengineering, information archi-tecture, and data warehousing.Mr. Orr has more than 30 years’experience in analysis, design,project management, technologyplanning, and managementconsulting. He is the author ofStructured Systems Development,Structured RequirementsDefinition, and The One MinuteMethodology. He can be reachedat [email protected].
REFERENCES
1. Harmon, P. “EnterpriseArchitectures.” Cutter ConsortiumEnterprise Architecture ExecutiveUpdate, Vol. 5, No. 16, September2002.
©2003 CUTTER CONSORTIUM VOL. 3, NO. 2
EXECUTIVE REPORT 3311
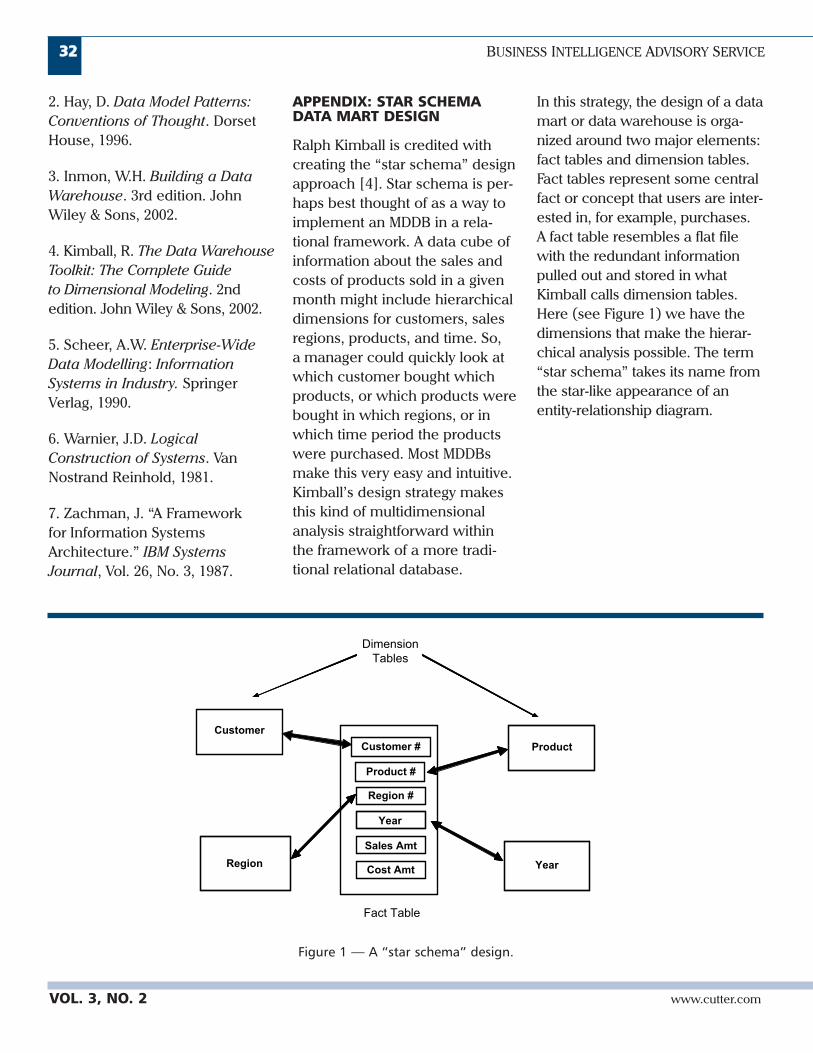
2. Hay, D. Data Model Patterns:Conventions of Thought. DorsetHouse, 1996.
3. Inmon, W.H. Building a DataWarehouse. 3rd edition. JohnWiley & Sons, 2002.
4. Kimball, R. The Data WarehouseToolkit: The Complete Guideto Dimensional Modeling. 2ndedition. John Wiley & Sons, 2002.
5. Scheer, A.W. Enterprise-WideData Modelling: InformationSystems in Industry. SpringerVerlag, 1990.
6. Warnier, J.D. LogicalConstruction of Systems. VanNostrand Reinhold, 1981.
7. Zachman, J. “A Frameworkfor Information SystemsArchitecture.” IBM SystemsJournal, Vol. 26, No. 3, 1987.
APPENDIX: STAR SCHEMADATA MART DESIGN
Ralph Kimball is credited withcreating the “star schema” designapproach [4]. Star schema is per-haps best thought of as a way toimplement an MDDB in a rela-tional framework. A data cube ofinformation about the sales andcosts of products sold in a givenmonth might include hierarchicaldimensions for customers, salesregions, products, and time. So,a manager could quickly look atwhich customer bought whichproducts, or which products werebought in which regions, or inwhich time period the productswere purchased. Most MDDBsmake this very easy and intuitive.Kimball’s design strategy makesthis kind of multidimensionalanalysis straightforward withinthe framework of a more tradi-tional relational database.
In this strategy, the design of a datamart or data warehouse is orga-nized around two major elements:fact tables and dimension tables.Fact tables represent some centralfact or concept that users are inter-ested in, for example, purchases.A fact table resembles a flat filewith the redundant informationpulled out and stored in whatKimball calls dimension tables.Here (see Figure 1) we have thedimensions that make the hierar-chical analysis possible. The term“star schema” takes its name fromthe star-like appearance of anentity-relationship diagram.
VOL. 3, NO. 2 www.cutter.com
3322 BUSINESS INTELLIGENCE ADVISORY SERVICE
Customer
Customer #
Product #
Fact Table
Product
Region #
Region
Year
Sales Amt
Cost Amt Year
DimensionTables
Figure 1 — A “star schema” design.
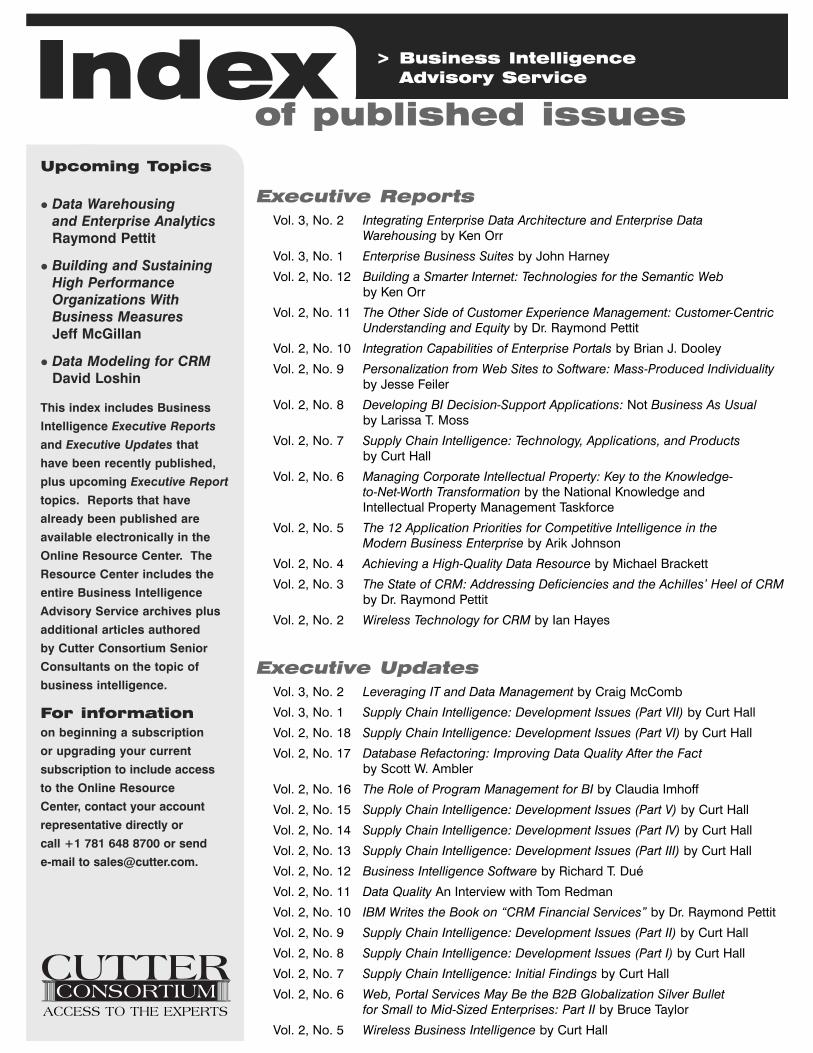
Index
ACCESS TO THE EXPERTS
Upcoming Topics
� Data Warehousingand Enterprise AnalyticsRaymond Pettit
� Building and SustainingHigh PerformanceOrganizations WithBusiness Measures Jeff McGillan
� Data Modeling for CRM David Loshin
This index includes Business
Intelligence Executive Reports
and Executive Updates that
have been recently published,
plus upcoming Executive Report
topics. Reports that have
already been published are
available electronically in the
Online Resource Center. The
Resource Center includes the
entire Business Intelligence
Advisory Service archives plus
additional articles authored
by Cutter Consortium Senior
Consultants on the topic of
business intelligence.
For informationon beginning a subscription
or upgrading your current
subscription to include access
to the Online Resource
Center, contact your account
representative directly or
call +1 781 648 8700 or send
e-mail to [email protected].
Executive ReportsVol. 3, No. 2 Integrating Enterprise Data Architecture and Enterprise Data
Warehousing by Ken Orr
Vol. 3, No. 1 Enterprise Business Suites by John Harney
Vol. 2, No. 12 Building a Smarter Internet: Technologies for the Semantic Webby Ken Orr
Vol. 2, No. 11 The Other Side of Customer Experience Management: Customer-CentricUnderstanding and Equity by Dr. Raymond Pettit
Vol. 2, No. 10 Integration Capabilities of Enterprise Portals by Brian J. Dooley
Vol. 2, No. 9 Personalization from Web Sites to Software: Mass-Produced Individualityby Jesse Feiler
Vol. 2, No. 8 Developing BI Decision-Support Applications: Not Business As Usualby Larissa T. Moss
Vol. 2, No. 7 Supply Chain Intelligence: Technology, Applications, and Productsby Curt Hall
Vol. 2, No. 6 Managing Corporate Intellectual Property: Key to the Knowledge-to-Net-Worth Transformation by the National Knowledge and Intellectual Property Management Taskforce
Vol. 2, No. 5 The 12 Application Priorities for Competitive Intelligence in the Modern Business Enterprise by Arik Johnson
Vol. 2, No. 4 Achieving a High-Quality Data Resource by Michael Brackett
Vol. 2, No. 3 The State of CRM: Addressing Deficiencies and the Achilles’ Heel of CRMby Dr. Raymond Pettit
Vol. 2, No. 2 Wireless Technology for CRM by Ian Hayes
Executive UpdatesVol. 3, No. 2 Leveraging IT and Data Management by Craig McComb
Vol. 3, No. 1 Supply Chain Intelligence: Development Issues (Part VII) by Curt Hall
Vol. 2, No. 18 Supply Chain Intelligence: Development Issues (Part VI) by Curt Hall
Vol. 2, No. 17 Database Refactoring: Improving Data Quality After the Factby Scott W. Ambler
Vol. 2, No. 16 The Role of Program Management for BI by Claudia Imhoff
Vol. 2, No. 15 Supply Chain Intelligence: Development Issues (Part V) by Curt Hall
Vol. 2, No. 14 Supply Chain Intelligence: Development Issues (Part IV) by Curt Hall
Vol. 2, No. 13 Supply Chain Intelligence: Development Issues (Part III) by Curt Hall
Vol. 2, No. 12 Business Intelligence Software by Richard T. Dué
Vol. 2, No. 11 Data Quality An Interview with Tom Redman
Vol. 2, No. 10 IBM Writes the Book on “CRM Financial Services” by Dr. Raymond Pettit
Vol. 2, No. 9 Supply Chain Intelligence: Development Issues (Part II) by Curt Hall
Vol. 2, No. 8 Supply Chain Intelligence: Development Issues (Part I) by Curt Hall
Vol. 2, No. 7 Supply Chain Intelligence: Initial Findings by Curt Hall
Vol. 2, No. 6 Web, Portal Services May Be the B2B Globalization Silver Bulletfor Small to Mid-Sized Enterprises: Part II by Bruce Taylor
Vol. 2, No. 5 Wireless Business Intelligence by Curt Hall
> Business Intelligence Advisory Service
of published issues
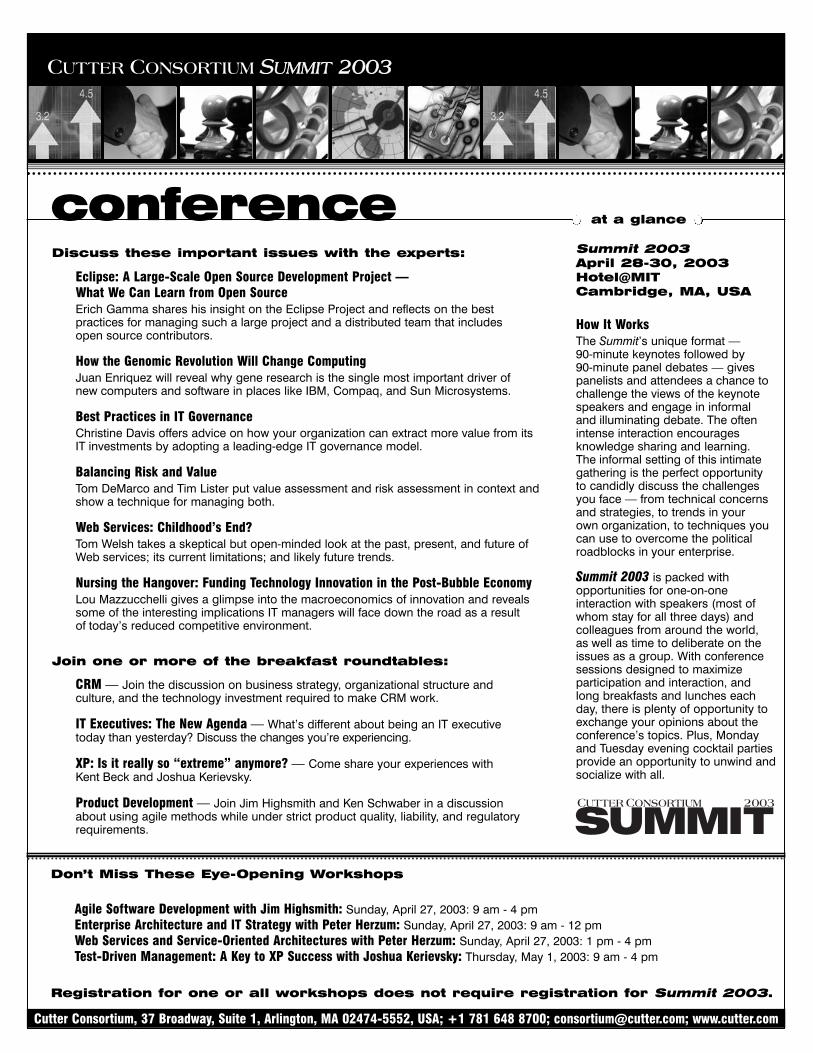
CUTTER CONSORTIUM SSUMMIT 22000033
at a glanceconferenceDiscuss these important issues with the experts:
Eclipse: A Large-Scale Open Source Development Project — What We Can Learn from Open SourceErich Gamma shares his insight on the Eclipse Project and reflects on the best practices for managing such a large project and a distributed team that includes open source contributors.
How the Genomic Revolution Will Change ComputingJuan Enriquez will reveal why gene research is the single most important driver ofnew computers and software in places like IBM, Compaq, and Sun Microsystems.
Best Practices in IT GovernanceChristine Davis offers advice on how your organization can extract more value from itsIT investments by adopting a leading-edge IT governance model.
Balancing Risk and ValueTom DeMarco and Tim Lister put value assessment and risk assessment in context andshow a technique for managing both.
Web Services: Childhood’s End?Tom Welsh takes a skeptical but open-minded look at the past, present, and future ofWeb services; its current limitations; and likely future trends.
Nursing the Hangover: Funding Technology Innovation in the Post-Bubble EconomyLou Mazzucchelli gives a glimpse into the macroeconomics of innovation and revealssome of the interesting implications IT managers will face down the road as a resultof today’s reduced competitive environment.
Join one or more of the breakfast roundtables:
CRM — Join the discussion on business strategy, organizational structure andculture, and the technology investment required to make CRM work.
IT Executives: The New Agenda — What’s different about being an IT executivetoday than yesterday? Discuss the changes you’re experiencing.
XP: Is it really so “extreme” anymore? — Come share your experiences withKent Beck and Joshua Kerievsky.
Product Development — Join Jim Highsmith and Ken Schwaber in a discussionabout using agile methods while under strict product quality, liability, and regulatoryrequirements.
Summit 2003April 28-30, 2003Hotel@MITCambridge, MA, USA
How It WorksThe Summit’s unique format — 90-minute keynotes followed by 90-minute panel debates — givespanelists and attendees a chance tochallenge the views of the keynotespeakers and engage in informaland illuminating debate. The oftenintense interaction encouragesknowledge sharing and learning.The informal setting of this intimategathering is the perfect opportunityto candidly discuss the challengesyou face — from technical concernsand strategies, to trends in yourown organization, to techniques youcan use to overcome the politicalroadblocks in your enterprise.
Summit 2003 is packed withopportunities for one-on-oneinteraction with speakers (most ofwhom stay for all three days) andcolleagues from around the world,as well as time to deliberate on theissues as a group. With conferencesessions designed to maximizeparticipation and interaction, andlong breakfasts and lunches eachday, there is plenty of opportunity toexchange your opinions about theconference’s topics. Plus, Mondayand Tuesday evening cocktail partiesprovide an opportunity to unwind andsocialize with all.
CUTTER CONSORTIUM 2003
SUMMIT
Cutter Consortium, 37 Broadway, Suite 1, Arlington, MA 02474-5552, USA; +1 781 648 8700; [email protected]; www.cutter.com
Don’t Miss These Eye-Opening Workshops
Agile Software Development with Jim Highsmith: Sunday, April 27, 2003: 9 am - 4 pmEnterprise Architecture and IT Strategy with Peter Herzum: Sunday, April 27, 2003: 9 am - 12 pmWeb Services and Service-Oriented Architectures with Peter Herzum: Sunday, April 27, 2003: 1 pm - 4 pmTest-Driven Management: A Key to XP Success with Joshua Kerievsky: Thursday, May 1, 2003: 9 am - 4 pm
Registration for one or all workshops does not require registration for Summit 2003.
Agile Software Development with Jim HighsmithAgile software development combines specific software development and project managementpractices with an explicit organizational perspective that enables teams to deliver softwareproducts in volatile business and technology situations. Whether your key projects involveimplementing a new CRM system, developing custom software, delivering a sophisticatedproduct with embedded software, or installing the latest Web services technology, agility isthe key to success. In this full-day tutorial, Jim Highsmith will help you discover how yourorganization can adopt and benefit from agile software development.
Enterprise Architecture and IT Strategy with Peter HerzumWhy — and how — have many Fortune 100 companies chosen to invest in enterprisearchitecture (EA) — even when forced to reduce the overall IT budget? How is EA usedto reduce costs and align IT with the business? Find out in this half-day workshop withPeter Herzum. In this session, you will get a comprehensive overview of modern and pragmaticapproaches to EA. The session provides executives, senior managers, and senior architectswith an intense update on state-of-the-art conceptual frameworks, viewpoints, models,processes, and techniques for EA.
Web Services and Service-Oriented Architectures with Peter HerzumIn this fast-paced half-day workshop, Peter Herzum provides you with the state-of-the-art ofWeb services and service-oriented architectures. You’ll focus on what senior technologistsand technology executives need to know about these much-hyped topics. Gain an overviewof the most relevant concepts, standards, technologies, and architectural issues; discuss themost important dimensions of a successful adoption of Web services; look at how variousenterprises have actually adopted Web services, their critical success factors and ROI, and thelessons learned; review existing platforms, architectures, and methodologies for Web servicesand service-oriented architectures; and discuss the future of Web services and their impacton the business.
Test-Driven Management: A Key to XP Success with Joshua KerievskySenior managers frequently don’t communicate their organizational intentions and businessobjectives to XP teams. As a result, an XP team can create finely crafted, fully tested soft-ware that still fails to meet unarticulated organizational or financial objectives. Test-drivenmanagement enables XP project managers to clearly articulate and assess organizationalintentions and business objectives for their projects and teams. In this one-day workshop,together with Joshua Kerievsky, you will explore how management tests can be integrated intoproject charters to ensure that organizational goals are well understood; study several real-world management tests; discuss the differences between internal and external managementtests; and determine under what circumstances each is best for your organization.
at a glanceworkshops
Agile Software Development with Jim HighsmithSunday, April 27, 2003 9 am - 4 pm
Enterprise Architecture andIT Strategy with Peter HerzumSunday, April 27, 20039 am - 12 pm
Web Services and Service-OrientedArchitectures with Peter HerzumSunday, April 27, 2003 1 pm - 4 pm
Test-Driven Management: A Key toXP Success with Joshua KerievskyThursday, May 1, 2003 9 am - 4 pm
Registration for one orall workshops does notrequire registration forSummit 2003.
Register online:www.cutter.com/summit/
CUTTER CONSORTIUM SSUMMIT 22000033
Event # Registrants Subtotal PaymentSummit 2003 Conference
US $1,995 per person ______ ___________US $1,795 each for three or more people ______ ___________
Agile Software DevelopmentUS $597 workshop only ______ ___________US $497 when registered for Summit ______ ___________
Enterprise Architecture and IT StrategyUS $330 workshop only ______ ___________US $280 when registered for Summit ______ ___________
Web Services and Service-Oriented Architecture US $330 workshop only ______ ___________US $280 when registered for Summit ______ ___________
Test-Driven Management: A Key to XP Success US $597 workshop only ______ ___________US $497 when registered for Summit ______ ___________
Name Title
Organization Department
Address/P.O. Box City State/Province ZIP/Postal Code Country
Telephone Fax E-Mail
Total $______________________
Check enclosed (payable to Cutter Consortium)
Invoice my companyCredit card (Mastercard, Visa, AmEx, or Diners Club)
(Charge will appear as Cutter Consortium.)
Name on Credit Card
Card # Exp. Date
Signature
“Very thought-provoking. I’m sure that I will be ableto quickly put some of theseconcepts into practice.”
— Gary Walker, Manager, Software Development, MDS Sciex
Business IntelligencePracticeThe strategies and technologies of business intelligence and knowledgemanagement are critical issues enterprises must embrace if they are to remaincompetitive in the e-business economy. It’s more important than ever to makethe right strategic decisions the first time.
Cutter Consortium’s Business Intelligence Practice helps companies take all theirenterprise data, augment it if appropriate, and turn it into a powerful strategicweapon that enables them to make better business decisions. The practice is uniquein that it provides clients with the full picture: technology discussions, productreviews, insight into organizational and cultural issues, and strategic advice acrossthe full spectrum of business intelligence. Clients get the background they need tomanage technical issues like data cleansing as well as management issues such ashow to encourage employees to participate in knowledge sharing and knowledgemanagement initiatives. From tactics that will help transform your company to aculture that accepts and embraces the value of information, to surveys of the toolsavailable to implement business intelligence initiatives, the Business IntelligencePractice helps clients leverage data into revenue-generating information.
Through Cutter’s subscription-based service and consulting, mentoring, and training,clients are ensured opinionated analyses of the latest data warehousing, datamining, knowledge management, CRM, and business intelligence strategies andproducts. You’ll discover the benefits of implementing these solutions, as wellas the pitfalls companies must consider when embracing these technologies.
Products and Services Available from the Business Intelligence Practice
• The Business Intelligence Advisory Service• Consulting• Inhouse Workshops• Mentoring• Research Reports
Other Cutter Consortium PracticesCutter Consortium aligns its products and services into the nine practice areasbelow. Each of these practices includes a subscription-based periodical service,plus consulting and training services.
• Agile Project Management• Business Intelligence• Business-IT Strategies• Business Technology Trends and Impacts• Enterprise Architecture• IT Management• Measurement and Benchmarking Strategies• Risk Management and Security• Sourcing
Senior ConsultantTeamThe Senior Consultants on Cutter’s BusinessIntelligence team are thought leaders in themany disciplines that make up businessintelligence. Like all Cutter ConsortiumSenior Consultants, each has gained a stellarreputation as a trailblazer in his or her field.They have written groundbreaking papers andbooks, developed methodologies that havebeen implemented by leading organizations,and continue to study the impact that businessintelligence strategies and tactics are havingon enterprises worldwide. The team includes:
• Verna Allee• Stowe Boyd• Clive Finkelstein• Jonathan Geiger• David Gleason• Curt Hall• Claudia Imhoff• André LeClerc• Lisa Loftis• David Marco• Larissa T. Moss• Joyce Norris-Montanari• Ken Orr• Raymond Pettit• Ram Reddy• Thomas C. Redman• Michael Schmitz• Karl M. Wiig