data book on consolidated financial results for the year ended … · 2020-06-29 · intangible...
TRANSCRIPT

Mitsui & Co., Ltd.
May 1, 2020
Data Book on Consolidated Financial Results
for the Year Ended March 31, 2020
1. Consolidated Statements of Income ……………………… 2
2. Consolidated Statements of Financial Position …………… 5
3. Consolidated Statements of Cash Flows ………………… 7
4. Operating Segment Information ………………………… 10
5. Forecasts for the Year Ending March 31, 2021 …………… 15
6. Affiliated Companies Information ………………………… 17
7. Historical Commodity Prices (Informative) ……………… 20
8. Major Risk Exposure by Country and Fund Operation …… 21
9. Number of Employees …………………………………… 22
10. Historical Data …………………………………………… 23
Note:“Mar-20” in this booklet represents either “for the year ended March 31, 2020” or“as of March 31, 2020”, whichever is appropriate. It is also the same for “Mar-19”.
Segment abbreviations:(IS) Iron & Steel Products(MM) Mineral & Metal Resources(EN) Energy(MI) Machinery & Infrastructure(CH) Chemicals(LI) Lifestyle(IC) Innovation & Corporate Development(OT) All other / Adjustments and Eliminations
- 1 -

1. Consolidated Statements of Income 1) Revenue (See “4. Operating Segment Information” for the breakdown by operating segment.)
(Billions of yen) Mar-20 Mar-19 Increase Description Total 6,885.0 6,957.5 (72.5) Miscellaneous
2) Gross Profit (See “4. Operating Segment Information” for the breakdown by operating segment.)
(Billions of yen) Mar-20 Mar-19 Increase Description Total 839.4 838.5 0.9 Increase :
(MM) +50.4 (Iron ore in Australia +68.5, Coal in Australia -17.0) (EN) +7.5 (Good performance in the LNG trading business, METS +5.9, MEPTX -4.5, MEPME -3.7, MEPUSA -3.1) (MI) +3.5 (BAF +4.6, Newly consolidated subsidiary related to overseas rail business)
Decrease : (CH) -31.2 (MMTX -7.6, Novus -6.8, ITC) (IC) -18.5 (Loss in the valuation of fair value -18.4) (LI) -6.9 (Loss in the valuation of fair value -2.4)
Average Ex. Rate Mar-20 Mar-19 Increase
US Dollar ¥108.95 ¥111.07 (¥2.12)
Australian Dollar ¥73.81 ¥80.77 (¥6.96) Oil price per barrel $68.00 $71.00 ($3.00) Note) JCC (Japan Crude Cocktail) price as reflected in operating results for the stated periods.
3) Selling, general and administrative expenses (Billions of yen) Breakdown by sub-account Mar-20 Mar-19 Increase Personnel (298.8) (299.5) 0.7 Welfare (10.4) (11.9) 1.5 Travel (27.5) (30.9) 3.4 Entertainment (6.1) (6.6) 0.5 Communication (44.1) (43.8) (0.3) Rent (9.3) (30.2) 20.9 Depreciation (41.9) (16.5) (25.4) Fees and Taxes (13.3) (12.4) (0.9) Provision for Doubtful Receivables (31.3) (13.3) (18.0) Others (102.2) (101.2) (1.0) Total (584.9) (566.3) (18.6)
- 2 -

4) Gain (loss) on securities and other investments, Impairment reversal (loss) of fixed assets, Gain (loss) on disposal or sales of fixed assets, and Other income (expense)
(Billions of yen) Mar-20 Mar-19 Increase Description for Mar-20 Description for Mar-19 Gain (loss) on securities and other investments -net
25.1 4.4 20.7 (MI) Sale of IPP business in North America (LI) Sale of Sogo Medical Holdings, Partial sale and deconsolidation of RareJob (IC) Sale of equity stake in real estate business in Singapore
LI) Change in the profit share in IHH +7.5
Impairment reversal (loss) of fixed assets -net
(110.8) (27.0) (83.8) (EN) Impairment Loss in GED -31.2, Eagle Ford -23.4, Tempa Rossa -13.9, MOECO offshore project in the Gulf of Mexico -4.3 (LI) Impairment Loss in XINGU AGRI AG -14.0, Accountable -6.8 (MI) Impairment Loss in overseas rail project
(EN) Eagle Ford -11.6, Exploration expenses -4.3 (CH) Novus -7.9
Gain (loss) on disposal or sales of fixed assets -net
9.5 17.9 (8.4) Miscellaneous (MM) Sale of Bengalla (IS) Sale of land +5.9 (LI) Sale of buildings in Japan (CH) Novus -5.1
Other income (expense) -net 38.5 (18.8) 57.3 (CH) Increase in the Chemical segment including insurance proceeds in the business in North America (IC) Valuation profit on derivative +4.4 (MI) Insurance proceeds +4.0 (LI) Sales of property management business (EN/MM) Exploration expenses -6.5
(CH) ITC fire accident -20.6 (EN/MM) Exploration expenses -3.7
Provision related to Multigrain business
- 11.1 (11.1) (LI/OT) Loss related to Multigrain
5) Interest income/expense ⅰ) Interest income/expense
(Billions of yen)
Mar-20 Mar-19 Increase Interest income 41.4 43.4 (2.0) Interest expense (89.6) (80.1) (9.5) (48.2) (36.7) (11.5) < Breakdown by entity category > Parent (30.1) (26.0) (4.1) Overseas Trading Subs. (1.0) 0.3 (1.3) Domestic Subs. (1.0) (1.1) 0.1 Overseas Subs. (16.1) (9.9) (6.2)
- 3 -

ⅱ) Interest-bearing debt (Billions of yen) Gross interest-bearing debt Mar-20 Mar-19 4,550.5 4,558.3
Mar-19 Mar-18
4,558.3 4,157.4
Average for the period-ends Mar-20 Mar-19 4,554.4 4,357.9
Note) From FY Mar/2020, interest-bearing debt comprises long-term and short-term debt and excludes lease liabilities. The figures for the end of FY Mar/2018 and FY Mar/2019 period have been restated. ⅲ) Market indication
(%)
Mar-20 Mar-19 (monthly average) 3-month Yen Tibor 0.07 0.07 3-month US$ Libor 2.02 2.51 10-year government bond (0.11) 0.05 6) Dividend income (Billions of yen)
Mar-20 Mar-19 Increase 1Q 24.8 21.1 3.7 2Q 17.5 28.0 (10.5) 3Q 39.8 39.4 0.4 4Q 14.4 17.4 (3.0) Total 96.5 105.9 (9.4) Domestic 15.2 14.8 0.4 Overseas 81.3 91.1 (9.8) (Overseas LNG projects*) 50.3 63.4 (13.1)
Total 96.5 105.9 (9.4) * Abu Dhabi, Oman, Qatar-Gas 1&3, Equatorial Guinea and Sakhalin II
7) Share of profit (loss) of investments accounted for using the equity method (See “4. Operating Segment Information” for the breakdown by operating segment.)
(Billions of yen) Mar-20 Mar-19 Increase Description Total 269.2 255.4 13.8 Increase:
(LI) +8.6 (Sale of CLA +13.0, IHH +3.0) (EN) +5.6 (MEPMOZ DTA recognition etc, +11.2, Arctic LNG2 +4.1, JAL-MIMI decrease) (MI) +0.2 (DTA recognition in IPP in Indonesia, Gas distribution in Brazil, Automobile company in Canada, FPSO/FSO -5.4, Impairment loss in offshore supporting vessels, Loss in VLI -3.7, Mar-19: Loss in overseas rail project, DTA recognition in IPP)
Decrease: (MM) -0.1 (Nacala Corridor rail & port infrastructure business -5.1, Decrease of Coal in Australia, Iron Ore in Australia +14.2)
8) Income taxes
(Billions of yen) Mar-20 Mar-19 Increase Description Profit before Income taxes 534.3 584.3 (50.0)
Mainly due to a decrease of a valuation allowance to deferred tax asset
Income taxes (123.0) (152.6) 29.6 (tax rate) 23.0% 26.1% (3.1pt)
- 4 -
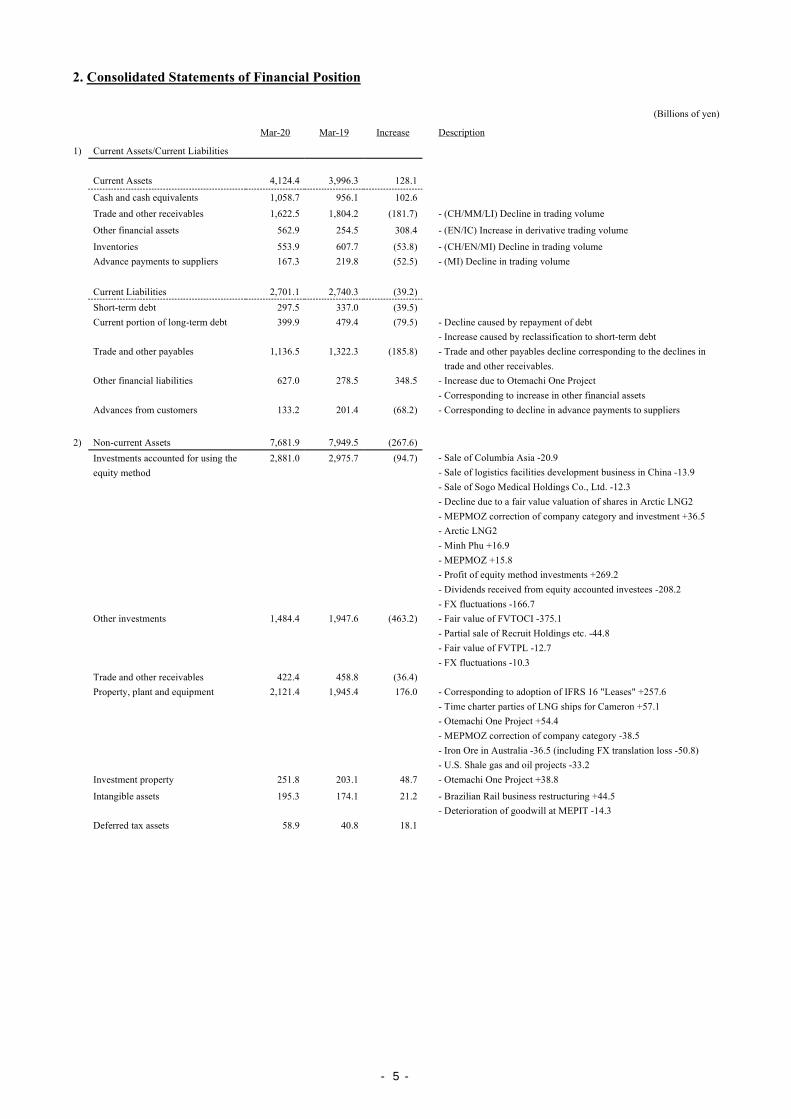
2. Consolidated Statements of Financial Position (Billions of yen) Mar-20 Mar-19 Increase Description 1) Current Assets/Current Liabilities Current Assets 4,124.4 3,996.3 128.1 Cash and cash equivalents 1,058.7 956.1 102.6 Trade and other receivables 1,622.5 1,804.2 (181.7) - (CH/MM/LI) Decline in trading volume Other financial assets 562.9 254.5 308.4 - (EN/IC) Increase in derivative trading volume Inventories 553.9 607.7 (53.8) - (CH/EN/MI) Decline in trading volume Advance payments to suppliers 167.3 219.8 (52.5) - (MI) Decline in trading volume Current Liabilities 2,701.1 2,740.3 (39.2) Short-term debt 297.5 337.0 (39.5) Current portion of long-term debt 399.9 479.4 (79.5) - Decline caused by repayment of debt
- Increase caused by reclassification to short-term debt Trade and other payables 1,136.5 1,322.3 (185.8) - Trade and other payables decline corresponding to the declines in
trade and other receivables. Other financial liabilities 627.0 278.5 348.5 - Increase due to Otemachi One Project
- Corresponding to increase in other financial assets Advances from customers 133.2 201.4 (68.2) - Corresponding to decline in advance payments to suppliers 2) Non-current Assets 7,681.9 7,949.5 (267.6) Investments accounted for using the
equity method 2,881.0 2,975.7 (94.7) - Sale of Columbia Asia -20.9
- Sale of logistics facilities development business in China -13.9 - Sale of Sogo Medical Holdings Co., Ltd. -12.3 - Decline due to a fair value valuation of shares in Arctic LNG2 - MEPMOZ correction of company category and investment +36.5 - Arctic LNG2 - Minh Phu +16.9 - MEPMOZ +15.8 - Profit of equity method investments +269.2 - Dividends received from equity accounted investees -208.2 - FX fluctuations -166.7
Other investments 1,484.4 1,947.6 (463.2) - Fair value of FVTOCI -375.1 - Partial sale of Recruit Holdings etc. -44.8 - Fair value of FVTPL -12.7 - FX fluctuations -10.3
Trade and other receivables 422.4 458.8 (36.4) Property, plant and equipment 2,121.4 1,945.4 176.0 - Corresponding to adoption of IFRS 16 "Leases" +257.6
- Time charter parties of LNG ships for Cameron +57.1 - Otemachi One Project +54.4 - MEPMOZ correction of company category -38.5 - Iron Ore in Australia -36.5 (including FX translation loss -50.8) - U.S. Shale gas and oil projects -33.2
Investment property 251.8 203.1 48.7 - Otemachi One Project +38.8 Intangible assets 195.3 174.1 21.2 - Brazilian Rail business restructuring +44.5
- Deterioration of goodwill at MEPIT -14.3 Deferred tax assets 58.9 40.8 18.1
- 5 -

3) Non-current Liabilities 5,044.3 4,675.2 369.1 Long-term debt, less the current
portion 4,229.2 3,809.1 420.1 - Adoption of IFRS 16 "Leases" etc.
Other financial liabilities 105.3 72.1 33.2 Provisions 228.2 212.4 15.8 Deferred tax liabilities 413.0 499.8 (86.8) - Declines in financial assets measured at FVTOCI 4) Total equity attributable to
owners of the parent 3,817.7 4,263.2 (445.5)
Common stock 341.8 341.5 0.3 Capital surplus 402.7 387.3 15.4 Retained earnings 3,362.3 3,078.7 283.6 Other components of equity (223.9) 463.3 (687.2) <breakdown> Financial assets measured at
FVTOCI 7.5 356.5 (349.0) - Lower share prices
Foreign currency translation adjustments
(177.1) 124.5 (301.6) - AUD -141.7 (Mar-20 JPY66.09/AUD ← Mar-19 JPY78.64/AUD) - BRL -65.7 (Mar-20 JPY20.95/BRL ← Mar-19 JPY28.44/BRL) - MYR -28.1 (Mar-20 JPY25.15/MYR ← Mar-19 JPY27.29/MYR) - USD -25.1 (Mar-20 JPY108.83/USD ← Mar-19 JPY110.99/USD)
Cash flow hedges (54.2) (17.7) (36.5) Treasury Stock (65.1) (7.6) (57.5) Non-controlling interests 243.3 267.1 (23.8)
<Net Debt-to-Equity Ratio (Net DER)>
Mar-20 Mar-19 Short-term debt 297.5 337.0 Long-term debt 4,629.1 4,288.5 Total debt 4,926.6 4,625.5 (-)Lease debt (376.1) (67.1) Interest-bearing debt 4,550.5 4,558.3 (-) Cash and cash equivalents (1,063.8) (966.3) Net Interest-bearing debt 3,486.7 3,592.0 Total equity attributable to owners of the parent
3,817.7 4,263.2
Net DER (times) 0.91 0.84 Adjusted Net DER* (times) 0.78 0.73 * Adjusted Net DER by including 50% of subordinated syndicated loan (JPY555.0 billion) in capital. Note) From FY Mar/2020, interest-bearing debt comprises long-term and short-term debt and excludes lease liabilities. The figure for the end of the FY Mar/2019 period has been restated.
- 6 -

3. Consolidated Statements of Cash Flows 1) Operating activities (Billions of yen)
Mar-20 Mar-19 Increase
(a) Profit for the Year 411.3 431.8 (20.5)
Adjustments to reconcile profit for the period to cash flows from operating activities:
(b) Depreciation and amortization 256.1 186.3 69.8
(c) Change in retirement benefit liabilities (46.8) (2.4) (44.4)
(d) Loss allowance, Reversal of provision related to Multigrain business, Gain (loss) on securities and other investments -net, Impairment reversal (loss) of fixed assets -net, Gain (loss) on disposal or sales of fixed assets -net, Valuation gain (loss) related to contingent considerations and others
101.0 5.5 95.5
(e) Interest income, dividend income and interest expense (77.6) (64.3) (13.3)
(f) Income taxes 123.0 152.6 (29.6)
(g) Share of profit (loss) of investments accounted for using the equity method (269.2) (255.4) (13.8)
(h) Interest received/paid, Dividends received, Income taxes paid 124.1 116.4 7.7
Subtotal ((b)+(c)+(d)+(e)+(f)+(g)+(h)) 210.6 138.7 71.9
Core Operating cash flow((a)+(b)+(c)+(d)+(e)+(f)+(g)+(h)) 621.9 570.5 51.4
Changes in operating assets and liabilities:
(i) Change in trade and other receivables/payables, inventories, other-net (95.5) (159.8) 64.3
Net cash provided by operating activities ((a)+(b)+(c)+(d)+(e)+(f)+(g)+(h)+(i)) 526.4 410.7 115.7
Depreciation and amortization <Breakdown by Operating Segment>
(Billions of yen)
Mar-20 Mar-19 Increase
Iron & Steel Products 1.4 1.1 0.3 Mineral & Metal Resources 36.3 37.0 (0.7) Energy 116.5 88.0 28.5 Machinery & Infrastructure 21.7 15.5 6.2 Chemicals 21.5 19.1 2.4 Lifestyle 27.3 12.2 15.1 Innovation & Corporate Development 11.7 6.9 4.8
Total 236.4 179.8 56.6
Others/ Adjustments and Eliminations 19.7 6.5 13.2 Consolidated Total 256.1 186.3 69.8
- 7 -

2) Investing activities (Billions of yen)
Mar-20 Mar-19
Net Gross Description Net Gross Description Net change in investments to equity accounted investees
9.1 (87.9) <Increases> Arctic LNG 2 Minh Phu -16.9 MEPMOZ -15.8
(377.1) (421.8) <Increases> IHH Healthcare -223.2 ETC Group -21.9 PTL Account payable MAERSK PRODUCT TANKERS ACCF3 Trustee -15.2 Kansai Helios Coating -12.3 Ouro Fino Inversiones Mitta Cameron LNG Holdings -11.3 Axiata (Cambodia) Holdings -10.1
97.0 <Decrease> Columbia Asia +23.8 Sogo Medical Holdings +19.5 Logistics facilities development business in China +18.3 C2C LP, power wind & solar power generation portfolio in Canada +16.8
44.7 <Decreases> Medica Asia +11.5
Net change in other investments
70.7 (32.8) (35.9) (172.9) <Increases> Oil and gas business in Australia -48.2 CT Corp Bonds -33.0 U.S. real estate business -26.3 FKS Food & Agri -11.8
103.5 <Decrease> Partial sale of Recruit Holdings +44.8
137.0 <Decreases> Business transfer (NSSB) +64.4 Sale of Bengalla coal business +15.3 Sale of power generation business in Japan +14.6 Synlait Milk +12.0
Net change in property, plant, and equipment
(253.1) (287.8) <Increases> Oil and gas projects -62.9 Iron ore in Australia -34.0 Otemachi One Project -25.3 Coal in Australia -18.4 U.S. distributed power projects -17.7 Railroad rolling stock related leasing business in Europe -16.9 Thai sugar manufacturing -13.0 U.S. tank operation -12.4
(255.6) (307.7) <Increases> Oil and gas projects -103.9 Iron ore in Australia -21.8 Lease transactions -60.9 (incl. aircraft leasing business -18.8) U.S. tank operation -17.0 Thai sugar manufacturing -15.6 Coal in Australia -14.8 U.S. IPP -11.2
34.7 52.1 <Decreases> Lease transactions +42.3
Net change in investment property
(16.5) (23.4) (6.9) (18.5) <Increases> Redevelopment project in Shinbashi Tokyo area -10.8
6.9 11.6 <Decreases> Sale of buildings in Japan +11.0
Net change in loan receivables
0.7 Loans to the IPP project in Middle East -17.8 (40.3) Loans to the IPP project in Morocco -16.7 Loans to the IPP project in Middle East -15.8 Collection of loan to the nickel business in Philippines
Net change in time deposits
3.9 (3.2)
Cash flows from investing activities
(185.2) (719.0)
- 8 -

3) Financing activities (Billions of yen)
Mar-20 Mar-19
Net Description Net Description
Net change in short-term debt (27.2) 103.3
Net change in long-term debt 27.5 912.0
161.5 857.4
(884.5) (695.9)
Purchase and sales of treasury stock-net (58.1) 0.0
Dividends paid (139.1) (139.0)
Transactions with non-controlling interest shareholders (7.7) 1.6
Cash flows from financing activities (204.6) (127.4)
- 9 -

4. Operating Segment Information Year ended March 31, 2020 (from April 1, 2019 to March 31, 2020)
(Billions of yen)
Iron & Steel Products
Mineral & Metal
Resources Energy Machinery &
Infrastructure Chemicals Lifestyle Innovation & Corporate
Development Total
Others/ Adjustments
and Eliminations
Consolidated Total
Revenue 250.1 1,075.2 893.7 911.8 1,544.2 2,018.1 185.4 6,878.4 6.6 6,885.0 Gross profit 24.6 226.0 141.5 134.2 116.8 134.9 60.1 838.0 1.4 839.4 Share of Profit (Loss) of
Investments 13.1 59.2 45.9 87.7 11.5 35.0 17.0 269.4 (0.2) 269.2
Profit for the Year
Attributable to Owners of
the Parent 4.7 183.3 59.7 87.5 22.3 32.0 14.6 404.1 (12.6) 391.5
Total Assets (as of Mar 31,
2020) 539.6 1,921.9 2,549.2 2,377.1 1,217.7 1,907.6 1,198.3 11,711.4 94.9 11,806.3
Core Operating CF 2.6 244.8 221.0 95.2 38.3 37.3 8.6 647.7 (25.8) 621.9
Year ended March 31, 2019 (from April 1, 2018 to March 31, 2019)
Iron & Steel Products
Mineral & Metal
Resources Energy Machinery &
Infrastructure Chemicals Lifestyle Innovation & Corporate
Development Total
Others/ Adjustments
and Eliminations
Consolidated Total
Revenue 247.4 1,055.8 708.0 904.6 1,788.2 2,039.0 209.5 6,952.5 5.0 6,957.5 Gross profit 27.2 175.6 134.0 130.7 148.0 141.8 78.6 836.0 2.5 838.5 Share of Profit (Loss) of
Investments 16.2 59.3 40.3 87.5 14.3 26.4 13.1 257.2 (1.8) 255.4
Profit for the Year
Attributable to Owners of
the Parent 9.9 167.2 95.7 78.4 5.2 36.3 22.0 414.7 (0.5) 414.2
Total Assets (as of Mar 31,
2019) 606.6 2,222.9 2,425.4 2,450.6 1,337.7 2,006.1 971.8 12,021.1 (75.3) 11,945.8
Core Operating CF 5.9 181.5 219.1 74.0 31.0 24.7 19.8 555.9 14.6 570.5
Increase/Decrease
Iron & Steel Products
Mineral & Metal
Resources Energy Machinery &
Infrastructure Chemicals Lifestyle Innovation & Corporate
Development Total
Others/ Adjustments
and Eliminations
Consolidated Total
Revenue 2.7 19.4 185.7 7.2 (244.0) (20.9) (24.1) (74.1) 1.6 (72.5) Gross profit (2.6) 50.4 7.5 3.5 (31.2) (6.9) (18.5) 2.0 (1.1) 0.9 Share of Profit (Loss) of
Investments (3.1) (0.1) 5.6 0.2 (2.8) 8.6 3.9 12.2 1.6 13.8
Profit for the Year
Attributable to Owners of
the Parent (5.2) 16.1 (36.0) 9.1 17.1 (4.3) (7.4) (10.6) (12.1) (22.7)
Total Assets (67.0) (301.0) 123.8 (73.5) (120.0) (98.5) 226.5 (309.7) 170.2 (139.5) Core Operating CF (3.3) 63.3 1.9 21.2 7.3 12.6 (11.2) 91.8 (40.4) 51.4
- 10 -

Gross Profit (Billions of yen) Mar-20 Mar-19 Increase Description
Iron & Steel Products 24.6 27.2 (2.6)
Mineral & Metal Resources 226.0 175.6 50.4 -Iron ore mining operations in Australia +68.5 (higher iron ore prices) -Coal mining operations in Australia -17.0 (lower coal sales prices)
Energy 141.5 134.0 7.5
-Good performance in the LNG trading business -METS +5.9 (good trading performance) -MEPTX -4.5 (lower oil and gas prices) -MEPME -3.7 (higher costs) -MEPUSA -3.1 (lower gas prices)
Machinery & Infrastructure 134.2 130.7 3.5 -BAF +4.6 (good sales in motorcycle and car financing business) -Newly consolidated subsidiary related to overseas rail business
Chemicals 116.8 148.0 (31.2) -MMTX -7.6 (price drop of methanol) -Novus -6.8 (price drop of products) -ITC (decline due to the accidental incident)
Lifestyle 134.9 141.8 (6.9) -Fair value losses of FVTPL -2.4 Innovation & Corporate Development 60.1 78.6 (18.5) -Fair value losses of FVTPL -18.4
Total 838.1 835.9 2.2 Others/ Adjustments and Eliminations 1.3 2.6 (1.3)
Consolidated Total 839.4 838.5 0.9
Share of Profit (Loss) of Investments Accounted for Using the Equity Method (Billions of yen) Mar-20 Mar-19 Increase Description Iron & Steel Products 13.1 16.2 (3.1)
Mineral & Metal Resources 59.2 59.3 (0.1)
-Nacala Corridor rail & port infrastructure business -5.1 (impairment loss) -Coal mining operations in Australia (lower coal sales prices) -Iron ore mining operations in Australia +14.2 (higher iron ore prices)
Energy 45.9 40.3 5.6
-MEPMOZ +11.2 (DTA recognition in accordance with FID) -Arctic LNG2 +4.1 (evaluation gains on changes in oil price, FX and others) -JAL-MIMI decrease in profit (lower oil and gas prices)
Machinery & Infrastructure 87.7 87.5 0.2
-DTA recognition in IPP in Indonesia -Gas distribution in Brazil (refund of service tax payments) -Automobile company in Canada (good sales) -FPSO/FSO -5.4 (refinance and other costs) -Offshore supporting vessels (impairment loss) -VLI -3.7 (change of the accounting principle) -Mar-19: Loss in overseas rail project -Mar-19: DTA recognition in IPP
Chemicals 11.5 14.3 (2.8)
Lifestyle 35.0 26.4 8.6 -Sale of Columbia Asia +13.0 -IHH +3.0
Innovation & Corporate Development 17.0 13.1 3.9
Total 269.4 257.1 12.3 Others/ Adjustments and Eliminations (0.2) (1.7) 1.5
Consolidated Total 269.2 255.4 13.8
- 11 -
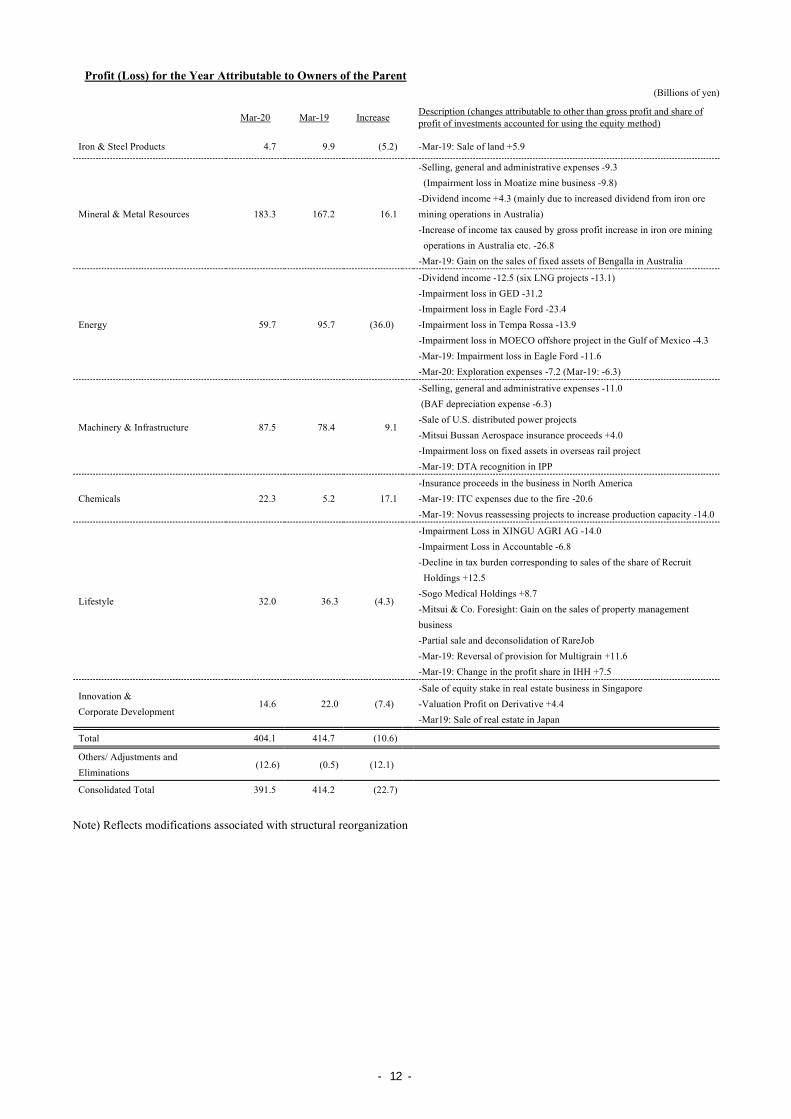
Profit (Loss) for the Year Attributable to Owners of the Parent (Billions of yen)
Mar-20 Mar-19 Increase Description (changes attributable to other than gross profit and share of profit of investments accounted for using the equity method)
Iron & Steel Products 4.7 9.9 (5.2) -Mar-19: Sale of land +5.9
Mineral & Metal Resources 183.3 167.2 16.1
-Selling, general and administrative expenses -9.3 (Impairment loss in Moatize mine business -9.8) -Dividend income +4.3 (mainly due to increased dividend from iron ore mining operations in Australia) -Increase of income tax caused by gross profit increase in iron ore mining operations in Australia etc. -26.8 -Mar-19: Gain on the sales of fixed assets of Bengalla in Australia
Energy 59.7 95.7 (36.0)
-Dividend income -12.5 (six LNG projects -13.1) -Impairment loss in GED -31.2 -Impairment loss in Eagle Ford -23.4 -Impairment loss in Tempa Rossa -13.9 -Impairment loss in MOECO offshore project in the Gulf of Mexico -4.3 -Mar-19: Impairment loss in Eagle Ford -11.6 -Mar-20: Exploration expenses -7.2 (Mar-19: -6.3)
Machinery & Infrastructure 87.5 78.4 9.1
-Selling, general and administrative expenses -11.0 (BAF depreciation expense -6.3) -Sale of U.S. distributed power projects -Mitsui Bussan Aerospace insurance proceeds +4.0 -Impairment loss on fixed assets in overseas rail project -Mar-19: DTA recognition in IPP
Chemicals 22.3 5.2 17.1 -Insurance proceeds in the business in North America -Mar-19: ITC expenses due to the fire -20.6 -Mar-19: Novus reassessing projects to increase production capacity -14.0
Lifestyle 32.0 36.3 (4.3)
-Impairment Loss in XINGU AGRI AG -14.0 -Impairment Loss in Accountable -6.8 -Decline in tax burden corresponding to sales of the share of Recruit Holdings +12.5 -Sogo Medical Holdings +8.7 -Mitsui & Co. Foresight: Gain on the sales of property management business -Partial sale and deconsolidation of RareJob -Mar-19: Reversal of provision for Multigrain +11.6 -Mar-19: Change in the profit share in IHH +7.5
Innovation & Corporate Development 14.6 22.0 (7.4)
-Sale of equity stake in real estate business in Singapore -Valuation Profit on Derivative +4.4 -Mar19: Sale of real estate in Japan
Total 404.1 414.7 (10.6) Others/ Adjustments and Eliminations (12.6) (0.5) (12.1)
Consolidated Total 391.5 414.2 (22.7) Note) Reflects modifications associated with structural reorganization
- 12 -

<Ref.> Breakdown by Business Unit
Year ended March 31, 2020 (from April 1, 2019 to March 31, 2020) (Billions of yen)
Machinery & Infrastructure Chemicals
Infrastructure Projects
Mobility I
Mobility II Total Basic
Materials Performance Materials
Nutrition & Agriculture Total
Gross profit 21.2 85.3 27.7 134.2 33.9 40.9 42.0 116.8 Share of Profit (Loss) of Investments Accounted for Using the Equity Method 43.7 36.1 7.9 87.7 4.4 5.7 1.4 11.5
Profit for the Year Attributable to Owners of the Parent 39.9 26.3 21.3 87.5 17.0 9.3 (4.0) 22.3
Total Assets (as of Mar 31, 2020) 1,007.7 904.7 464.7 2,377.1 452.3 411.6 353.8 1,217.7 Core Operating CF 30.0 36.3 28.8 95.2 31.4 8.3 (1.5) 38.3
Lifestyle Innovation & Corporate Development
Food Food & Retail Management
Healthcare & Service Total IT &
Communication Corporate
Development Total
Gross profit 50.8 73.6 10.5 134.9 29.2 30.9 60.1 Share of Profit (Loss) of Investments Accounted for Using the Equity Method 3.9 6.6 24.4 35.0 9.0 8.0 17.0
Profit for the Year Attributable to Owners of the Parent (6.0) 9.7 28.4 32.0 5.4 9.2 14.6
Total Assets (as of Mar 31, 2020) 602.5 713.0 592.1 1,907.6 191.9 1,006.4 1,198.3 Core Operating CF 11.9 22.1 3.2 37.3 3.8 4.8 8.6
Year ended March 31, 2019 (from April 1, 2018 to March 31, 2019)
Machinery & Infrastructure Chemicals
Infrastructure Projects
Mobility I
Mobility II Total Basic
Materials Performance Materials
Nutrition & Agriculture Total
Gross profit 19.7 81.0 30.0 130.7 51.1 44.8 52.1 148.0 Share of Profit (Loss) of Investments Accounted for Using the Equity Method 56.1 28.6 2.7 87.5 7.8 6.8 (0.2) 14.3
Profit for the Year Attributable to Owners of the Parent 38.6 25.0 14.8 78.4 4.4 11.0 (10.3) 5.2
Total Assets (as of Mar 31, 2019) 1,058.1 878.3 514.2 2,450.6 530.3 459.6 347.8 1,337.7 Core Operating CF 19.3 35.8 19.0 74.0 13.4 10.2 7.4 31.0
Lifestyle Innovation & Corporate Development
Food Food & Retail Management
Healthcare & Service Total IT &
Communication Corporate
Development Total
Gross profit 54.2 72.8 14.8 141.8 32.1 46.6 78.6 Share of Profit (Loss) of Investments Accounted for Using the Equity Method 8.1 6.6 11.7 26.4 5.2 7.9 13.1
Profit for the Year Attributable to Owners of the Parent 19.9 10.1 6.3 36.3 3.9 18.1 22.0
Total Assets (as of Mar 31, 2019) 619.6 712.2 674.3 2,006.1 202.3 769.5 971.8 Core Operating CF 14.3 10.6 (0.2) 24.7 7.4 12.5 19.8
- 13 -

Increase/Decrease
Machinery & Infrastructure Chemicals
Infrastructure Projects
Mobility I
Mobility II Total Basic
Materials Performance Materials
Nutrition & Agriculture Total
Gross profit 1.5 4.3 (2.3) 3.5 (17.2) (3.9) (10.1) (31.2) Share of Profit (Loss) of Investments Accounted for Using the Equity Method (12.4) 7.5 5.2 0.2 (3.4) (1.1) 1.6 (2.8)
Profit for the Year Attributable to Owners of the Parent 1.3 1.3 6.5 9.1 12.6 (1.7) 6.3 17.1
Total Assets (50.4) 26.4 (49.5) (73.5) (78.0) (48.0) 6.0 (120.0) Core Operating CF 10.7 0.5 9.8 21.2 18.0 (1.9) (8.9) 7.3
Lifestyle Innovation & Corporate Development
Food Food & Retail Management
Healthcare & Service Total IT &
Communication Corporate
Development Total
Gross profit (3.4) 0.8 (4.3) (6.9) (2.9) (15.7) (18.5) Share of Profit (Loss) of Investments Accounted for Using the Equity Method (4.2) 0.0 12.7 8.6 3.8 0.1 3.9
Profit for the Year Attributable to Owners of the Parent (25.9) (0.4) 22.1 (4.3) 1.5 (8.9) (7.4)
Total Assets (17.1) 0.8 (82.2) (98.5) (10.4) 236.9 226.5 Core Operating CF (2.4) 11.5 3.4 12.6 (3.6) (7.7) (11.2)
Note) Integrated Transportation System Business Unit I and Unit II changed their names to Mobility Business Unit I and Unit II, respectively, on October 1,
2018.
- 14 -

5. Forecasts for the Year Ending March 31, 2021 <Assumption> March 31, 2021
Forecast March 31, 2020
Result Exchange rate (JPY/USD) 108.00 108.95 Crude oil (JCC) $33/bbl $67/bbl Consolidated oil price $39/bbl $68/bbl
(Billions of yen)
March 31, 2021 Forecast
March 31, 2020 Result Change Description
Gross profit 680.0 839.4 (159.4) COVID-19 Lower crude oil and gas prices Lower iron ore prices
Selling, general and administrative expenses
(610.0) (584.9) (25.1) Miscellaneous
Gain on investments, fixed assets and other
30.0 (37.7) 67.7 Absence of impairment loss in Energy segment
Interest expenses (50.0) (48.2) (1.8)
Dividend income 60.0 96.5 (36.5) Decrease in dividends from six LNG projects
Profit (loss) of equity method investments
170.0 269.2 (99.2) COVID-19 Lower crude oil and gas prices
Profit before income taxes 280.0 534.3 (254.3)
Income taxes (85.0) (123.0) 38.0
Non-controlling Interests (15.0) (19.8) 4.8
Profit for the year attributable to owners of the parent
180.0 391.5 (211.5)
Depreciation and amortization 300.0 256.1 43.9
Core operating cash flow 400.0 561.0 (161.0)
Note) From April 1, 2020, in order to reflect a regular cash generation output from operating activities more appropriately, a payment amount for repayment of lease obligation (absolute value) has been deducted from Core operating cash flow. In conformity with this change, Core operating cash flow for the year ended March, 2020 has been restated.
- 15 -

Profit for the year attributable to owners of the parent (Billions of yen)
Operating Segment Mar-21 Forecast
Mar-20 Result Change Description of Increase/Decrease
Iron & Steel Products 5.0 4.7 0.3 Mineral & Metal Resources 120.0 183.3 (63.3) Lower iron ore prices Energy 0.0 57.8 (57.8) Lower crude oil and gas prices Machinery & Infrastructure 35.0 89.4 (54.4) COVID-19
Chemicals 20.0 22.3 (2.3)
Lifestyle 5.0 32.0 (27.0) COVID-19 Innovation & Corporate Development
15.0 14.6 0.4
Total 200.0 404.1 (204.1)
All Other / Adjustments and Eliminations
(20.0) (12.6) (7.4)
Consolidated Total 180.0 391.5 (211.5)
Core Operating Cash Flow (Billions of yen)
Operating Segment Mar-21 Forecast
Mar-20 Result Change Description of Increase/Decrease
Iron & Steel Products 0.0 2.2 (2.2) Mineral & Metal Resources 160.0 243.7 (83.7) Lower iron ore prices Energy 90.0 206.5 (116.5) Lower crude oil and gas prices
Machinery & Infrastructure 60.0 86.9 (26.9) COVID-19
Chemicals 45.0 35.8 9.2 Lifestyle 15.0 20.8 (5.8) Innovation & Corporate Development
15.0 3.9 11.1
Total 385.0 599.8 (214.8)
All Other / Adjustments and Eliminations
15.0 (38.8) 53.8 Absence of contribution to corporate pension
Consolidated Total 400.0 561.0 (161.0)
- 16 -

6. Affiliated Companies Information <Profit & Loss Attributable to Mitsui & Co., Ltd.>
Name
Principal lines of business
Ownership interest (%)
Entity category
Fiscal year-end
1-3Q
4Q
Mar-20 Earnings
Mar-19 Earnings
Increase/ Decrease
(JPY billion) (JPY billion) (JPY billion) (JPY billion) (JPY billion) Iron & Steel Products Mitsui & Co. Steel Ltd. Sales, export, import of steel products Var. S Mar 3.0 0.7 3.8 4.1 (0.3)
NIPPON STEEL TRADING
CORPORATION (*3)(*5) Sales, export and import of steel products 19.9 A Mar 3.7 - - 6.9 -
Gestamp companies (*1) Manufacture of automotive components Var. A Dec 1.1 1.3 2.4 2.3 0.1
GRI Renewable Industries Manufacture of wind turbine towers and
flanges 25.0 A Dec (0.2) 0.0 (0.2) (2.4) 2.2
Game Changer Holdings Inc. Investment in steel processing company 100.0 S Mar 1.0 0.5 1.4 3.9 (2.5) Mineral & Metal Resources Iron ore mining operations in Australia (*1) Mining and sales of Australian iron ore Var. S Mar 127.2 44.3 171.5 106.7 64.8
Coal mining operations in Australia (*1) Investments in Australian coal business Var. S/A Var. 22.3 5.2 27.4 48.5 (21.1)
Coal and rail & port infrastructure business in
Mozambique (*1) Investments in coal and rail & port
infrastructure business in Mozambique 100.0 S Var. (21.5) 0.8 (20.6) 4.1 (24.7)
Oriente Copper Netherlands B.V. Investment in copper business in Chile
through Inversiones Mineras Becrux SpA 100.0 S Mar (2.2) (3.5) (5.7) (2.7) (3.0)
Mitsui Bussan Copper Investment & Co., Ltd. Investment in Caserones copper mine in
Chile 100.0 S Mar (0.7) (0.2) (0.9) (2.3) 1.4
Japan Collahuasi Resources B.V. Investment in Collahuasi copper mine in
Chile 91.9 S Dec 5.3 3.6 8.9 9.1 (0.2)
Inner Mongolia Erdos Electric Power &
Metallurgical Co., Ltd
Coal mining, power generation, ferrous
alloy and chemical production and water
pumping 20.2 A Dec 4.9 0.9 5.9 5.1 0.8
Energy
Mitsui E&P Australia Pty Limited Exploration, development and production of
oil and natural gas in Oceania 100.0 S Dec 0.8 (15.0) (14.2) (0.3) (13.9)
Mitsui E&P Middle East B.V. Exploration, development and production of
oil and natural gas in Middle East 89.7 S Dec 3.7 0.0 3.7 6.5 (2.8)
Mitsui Oil Exploration Co., Ltd. Exploration, development and production of
oil and natural gas 74.3 S Mar 23.5 (1.5) 22.0 24.8 (2.8)
Mitsui E&P USA LLC (*2) Exploration, development and production of
shale gas 89.7 S Dec 4.2 0.8 5.0 8.2 (3.2)
MEP Texas Holdings LLC (*2) Exploration, development and production of
shale oil/gas 89.7 S Dec 2.8 (20.5) (17.7) (3.0) (14.7)
Mitsui E&P UK Limited Exploration, development and production of
oil and natural gas in Europe & Africa 89.7 S Dec 2.2 (2.0) 0.3 0.1 0.2
Mitsui E&P Italia A S.r.l. Exploration, development and production of
oil and natural gas based in Italy 89.7 S Dec (2.9) (14.0) (17.0) (2.5) (14.5)
AWE Pty Ltd. Exploration, development and production of
oil and natural gas in Oceania 100.0 S Dec (3.4) (1.0) (4.5) (3.7) (0.8)
Mitsui Sakhalin Holdings B.V. (*3) Investment in Sakhalin Energy Investment 100.0 S Mar - - - - -
Mitsui E&P Mozambique Area 1 Limited Exploration, development and production of
oil and natural gas in Mozambique 50.1 A Dec 11.2 0.0 11.2 (3.2) 14.4
Mitsui & Co. Energy Trading Singapore Pte.
Ltd. International trading of petroleum products
and crude oil 100.0 S Mar 9.3 (2.1) 7.2 0.8 6.4
ENEOS GLOBE Corporation Sales of liquefied petroleum gas in Japan 30.0 A Mar 0.5 0.2 0.8 1.2 (0.4)
Japan Australia LNG (MIMI) Pty. Ltd. (*3) Exploration, development and sales of crude
oil and natural gas 50.0 A Dec - - - - -
Mitsui & Co. LNG Investment USA, Inc. (*4) Investments in LNG export project in the
U.S. 100.0 S Dec (2.3) (0.4) (2.8) (3.4) 0.6
Japan Arctic LNG B.V. Exploration, development and sales of crude
oil and natural gas 25.4 A Dec (1.3) 5.4 4.1 0.0 4.1
- 17 -

Name
Principal lines of business
Ownership interest (%)
Entity category
Fiscal year-end
1-3Q
4Q
Mar-20 Earnings
Mar-19 Earnings
Increase/ Decrease
(JPY billion) (JPY billion) (JPY billion) (JPY billion) (JPY billion) Machinery & Infrastructure <Infrastructure Projects> IPP businesses (*1) Investment in power generation businesses Var. A Dec 23.6 4.0 27.6 26.7 0.9
FPSO/FSO leasing businesses (*1) FPSO/FSO leasing Var. A Dec 3.5 0.5 3.9 9.3 (5.4)
Drillship business Investment to the deep-water drillship
leasing business Var. S Var. 0.6 0.4 1.0 2.4 (1.4)
Gas distribution companies (*1) Investments in gas distribution companies in
Brazil and Mexico 100.0 S Dec 8.6 2.7 11.3 6.5 4.8
Mitsui & Co. Plant Systems, Ltd. Sales of various plants, electric power
facilities and transportation 100.0 S Mar 1.3 2.3 3.6 2.6 1.0
Tokyo International Air Cargo Terminal Ltd. Operation of air cargo terminal at Tokyo
International Airport 100.0 S Mar 1.1 0.0 1.1 1.8 (0.7)
Mitsui Water Holdings (Thailand) Ltd. Investment in water supply business 100.0 S Mar 1.8 0.7 2.6 2.2 0.4
<Mobility I> Penske Automotive Group, Inc. Automotive retailer 16.5 A Dec 5.9 1.8 7.7 8.2 (0.5)
Truck leasing and rental businesses Truck leasing, rental and logistics
businesses 100.0 S Dec 6.7 2.3 9.0 7.1 1.9
Asian motor vehicle businesses (*1) Asian motor vehicle businesses Var. A Var. 5.6 1.7 7.2 7.2 0.0
Toyota Chile S.A. Import and sales of automobiles and auto
parts 100.0 S Dec 0.1 0.0 0.1 1.1 (1.0)
PT. Bussan Auto Finance Motorcycle retail finance 65.0 S Dec 1.5 (0.7) 0.8 1.0 (0.2)
MITSUI AUTO FINANCE CHILE LTDA. Automobile retail finance 100.0 S Dec 1.0 0.3 1.3 1.7 (0.4)
VLI S.A. Integrated Freight Transportation 20.0 A Dec (0.1) (0.9) (1.0) 2.7 (3.7)
Guarana Urban Mobility Incorporated (*3) Investment in passenger transportation
business in Brazil 57.6 S Mar - - - - -
Construction & industrial machinery
businesses (*1) Construction & industrial machinery
businesses Var. S/A Var. 3.8 2.1 6.0 7.1 (1.1)
<Mobility II> Orient Marine Co., Ltd. Shipping business 100.0 S Mar 1.4 0.4 1.8 1.8 0.0
OMC SHIPPING PTE. LTD. Shipping business 100.0 S Mar 0.7 (0.6) 0.1 2.0 (1.9)
Rolling stock leasing businesses (*1) Freight car and locomotive leasing Var. S/A Var. 1.6 1.2 2.8 3.3 (0.5)
Aviation businesses (*1) Aviation businesses Var. S/A Var. 1.8 1.7 3.5 1.7 1.8
Chemicals <Basic Materials>
Japan-Arabia Methanol Company Ltd. Investments in methanol producing business
in Saudi Arabia and sales of products 55.0 S Mar 1.3 0.1 1.3 2.8 (1.5)
MMTX Inc. Investment in methanol producing business
in United States and sale of products 100.0 S Mar 2.8 (1.2) 1.6 7.2 (5.6)
Intercontinental Terminals Company LLC(*3) Chemical tank leasing 100.0 S Mar - - - (10.5) -
Mitsui Bussan Chemicals Co., Ltd. Sales and trading of solvents and coating
materials 100.0 S Mar 0.7 0.3 1.0 1.0 0.0
SHARK BAY SALT PTY LTD Production of salt 100.0 S Mar 1.1 0.6 1.7 1.1 0.6
<Performance Materials> MITSUI & CO. PLASTICS LTD. Sales of plastics and chemicals 100.0 S Mar 2.6 0.8 3.4 3.8 (0.4)
Living & Environmental Business(*1) Life essentials businesses Var. S/A Var. 1.8 0.0 1.9 1.7 0.2
<Nutrition & Agriculture> Novus International, Inc. Manufacture and sales of feed additives 80.0 S Mar (2.5) 0.3 (2.2) (9.3) 7.1
Mitsui AgriScience International
(Europe/Americas) (*1) Investments in crop protection businesses in
Europe and Americas 100.0 S Mar 1.4 1.0 2.4 1.3 1.1
MVM Resources International B.V. Investment in phosphate rock operation in
Peru 25.0 A Dec 0.2 (0.3) 0.0 (1.0) 1.0
- 18 -

Name
Principal lines of business
Ownership interest (%)
Entity category
Fiscal year-end
1-3Q
4Q
Mar-20 Earnings
Mar-19 Earnings
Increase/ Decrease
(JPY billion) (JPY billion) (JPY billion) (JPY billion) (JPY billion) Lifestyle <Food> XINGU AGRI AG Production of agricultural products 100.0 S Dec (0.3) (9.6) (10.0) (0.3) (9.7)
United Grain Corporation of Oregon Origination and merchandising of grain 100.0 S Mar 0.2 0.0 0.3 1.2 (0.9)
Mitsui Sugar Co., Ltd. Manufacture of refined sugar 33.5 A Mar 1.0 - - 2.1 -
FEED ONE CO., LTD. (*3) Manufacturing and sales of compound
feedstuffs 24.9 A Mar 0.7 - - 1.2 -
PRIFOODS CO., LTD. Production, processing and sales of broilers 50.2 S Mar 1.0 (0.1) 0.9 1.4 (0.5)
Mit-Salmon Chile SpA Investment in salmon farming, processing
and sales company 100.0 S Dec (0.3) 0.0 (0.2) 1.4 (1.6)
<Food & Retail Management>
Domestic food & retail management
businesses (*1) Domestic food & retail management
businesses 100.0 S Mar 3.3 1.1 4.4 5.3 (0.9)
WILSEY FOODS, INC. Investments in edible oil products company 90.0 S Mar 3.3 0.7 3.9 3.3 0.6
Fashion & textile businesses (*1) Fashion & textile businesses Var. S/A Var. 1.5 1.0 2.4 2.0 0.4
<Healthcare & Service> IHH Healthcare Berhad Provider of healthcare services 32.9 A Dec 3.3 1.7 4.9 1.9 3.0
PHC Holdings Corporation (*3) Development, manufacture and sales of
healthcare products 21.7 A Mar - - - - -
MicroBiopharm Japan Co., Ltd. Manufacture and sales of medicines and
chemicals 80.0 S Mar 0.9 0.1 1.0 1.2 (0.2)
AIM SERVICES CO., LTD. Contract food services 50.0 A Mar 2.0 0.4 2.4 2.4 0.0
MITSUI & CO. FORESIGHT LTD Property management 100.0 S Mar 2.5 (0.1) 2.4 0.2 2.2
UHS PARTNERS, INC. Investment in healthcare staffing business 100.0 S Dec (5.7) (0.9) (6.6) (0.4) (6.2)
Innovation & Corporate Development <IT & Communication>
Relia, Inc. (*3) Comprehensive telemarketing and direct
marketing operations 34.4 A Mar 1.7 - - 0.9 1.8
QVC JAPAN INC. (*3) TV shopping using a 24-hour dedicated
channel 40.0 A Dec - - 5.4 5.3 0.1
MITSUI KNOWLEDGE INDUSTRY CO.,
LTD. Planning, development and sales of
information and communication systems 100.0 S Mar 2.5 1.6 4.2 3.5 0.7
<Corporate Development> JA Mitsui Leasing, Ltd. Leasing and financing business 31.4 A Mar 2.5 1.4 3.9 3.8 0.1
Mitsui & Co.Global Logistics, Ltd. Domestic warehousing businesses and
international integrated transportation
services 100.0 S Mar 2.5 0.4 2.9 2.3 0.6
Mitsui Bussan Commodities Ltd Trading of energy and basemetal derivatives 100.0 S Mar 1.0 1.0 2.0 2.9 (0.9)
Mitsui & Co. Asset Management Holdings
LTD. Real estate asset management 100.0 S Mar 1.5 0.4 1.9 1.9 0.0
SABRE INVESTMENTS, LLC (*3) Vehicle for the investment in a real asset
owner and operator in US 100.0 S Dec - - - - -
Mitsui & Co. Real Estate Ltd. Real estate sales, leasing, management and
consulting 100.0 S Mar 0.7 0.8 1.5 2.6 (1.1)
Overseas real estate businesses (*1) Overseas real estate businesses Var. S/A Var. 1.8 2.8 4.6 0.8 3.8
(*1) Combined sum of consolidated earnings of affiliated companies engaged in those businesses. (*2) Mitsui E&P USA LLC and MEP Texas Holdings LLC show income (loss) before income taxes. (*3) Earnings of those companies are not disclosed here based on confidentiality agreements with joint venture partners or on the ground that they are listed companies that have not released their operating results yet and on. (*4)Mitsui & Co. LNG Investment USA, Inc. shows income (loss) after income taxes for the natural gas liquefaction tolling activities starting from this 4Q. (*5) NIPPON STEEL & SUMIKIN BUSSAN CORPORATION changed its name to NIPPON STEEL TRADING CORPORATION on April 1, 2019. Note) Entity category: S represents subsidiary and A represents equity accounted investee.
- 19 -

7. Historical Commodity Prices (Informative)
Crude oil ($/bbl) Apr-Jun 2018
Jul-Sep 2018
Oct-Dec 2018
Jan-Mar 2019
Apr-Jun 2019
Jul-Sep 2019
Oct-Dec 2019
Jan-Mar 2020
JCC 76.56 76.09 77.43 63.54 71.75 66.34 65.75 67.81 *
WTI 67.88 69.50 58.81 54.90 59.82 56.45 56.96 46.17
Brent 74.90 75.97 68.08 63.90 68.32 62.00 62.50 50.96
Henry Hub($/MMBtu) 2.832 2.864 3.743 2.863 2.507 2.332 2.419 1.868
* Latest 3 months data are provisional. (Source: Trade Statistics of Japan, MOF)
Average of representative iron ore index prices (Fine, 62% Fe, CFR North China, US$/MT)
Apr-Jun 2018
Jul-Sep 2018
Oct-Dec 2018
Jan-Mar 2019
Apr-Jun 2019
Jul-Sep 2019
Oct-Dec 2019
Jan-Mar 2020
65.2 66.8 71.6 82.6 99.8 101.5 88.5 89.1
Coal ($/MT) Apr-Jun 2018
Jul-Sep 2018
Oct-Dec 2018
Jan-Mar 2019
Apr-Jun 2019
Jul-Sep 2019
Oct-Dec 2019
Jan-Mar 2020
Hard coking coal 196.56 187.56 212.45 210.34 207.89 177.79 141.96 147.05
Soft coking coal 132.00 129.00 135.00 132.00 129.00 115.00 98.00 103.70
Thermal coal 110.00 - 109.77 - 94.75 - - -
Copper ($/MT) Apr-Jun 2018
Jul-Sep 2018
Oct-Dec 2018
Jan-Mar 2019
Apr-Jun 2019
Jul-Sep 2019
Oct-Dec 2019
Jan-Mar 2020
LME price 6,871.70 6,102.65 6,167.70 6,220.41 6,113.95 5,797.77 5,888.34 5,638.11
Forex (¥/Foreign currency) Apr-Jun 2018
Jul-Sep 2018
Oct-Dec 2018
Jan-Mar 2019
Apr-Jun 2019
Jul-Sep 2019
Oct-Dec 2019
Jan-Mar 2020
Yen to US$ 109.53 111.88 112.58 110.27 109.67 107.67 109.33 109.11
Yen to A$ 82.04 81.54 80.50 78.98 76.47 73.02 75.31 70.44
Yen to BRL 29.76 28.28 29.58 29.25 28.00 26.71 26.79 23.67
Interest (%) Apr-Jun 2018
Jul-Sep 2018
Oct-Dec 2018
Jan-Mar 2019
Apr-Jun 2019
Jul-Sep 2019
Oct-Dec 2019
Jan-Mar 2020
3-month Tibor (Yen) 0.07 0.07 0.07 0.07 0.07 0.07 0.07 0.07
3-month Libor (US$) 2.34 2.36 2.70 2.65 2.47 2.16 1.91 1.55
Japanese government bond (10-year) 0.04 0.10 0.07 -0.03 -0.10 -0.21 -0.07 -0.07
- 20 -

8. Major Risk Exposure by Country and Fund Operation 1) Investments, loans and guarantees (Mar-20) (Sum of Mitsui & Co., Ltd., Trading Subsidiaries and some investment vehicles and subsidiaries)
(Billions of yen)
Investments Loans Guarantees Total Hedged (ex.Insurance) Net Position
Brazil 683.2 45.6 185.0 913.8 68.6 845.2 Malaysia 335.8 0.3 10.0 346.1 0.3 345.8
Mozambique 141.8 - 153.1 295.0 - 295.0
Chile 29.3 39.6 221.2 290.1 - 290.1
Russia 104.2 - 163.9 268.1 - 268.1
Italy 94.0 - 127.0 221.0 - 221.0
Indonesia 130.0 2.5 60.4 192.9 - 192.9
Mexico 74.7 0.5 72.8 147.9 - 147.9
China 121.0 0.7 5.5 127.3 0.3 127.0
Thailand 79.4 1.8 36.6 117.9 - 117.9
Ireland 26.5 1.0 71.3 98.8 - 98.8
India 34.1 1.6 42.0 77.7 13.1 64.6 Note) Among the countries subject to country risk reporting, we disclose countries with significance as to the balance. Note) “Hedged” represents the amounts by which credit risk is hedged by such as investment insurance and third-party guarantees. Note) “Investment” represents book value for accounting purpose on the basis of Japanese GAAP, not reflecting the effects of
applying net investment hedging relationships. Note) From March-18, the balance of “China” in the above table includes Hong Kong.
2) Trade receivables (Mar-20) (Sum of Mitsui & Co., Ltd., Trading Subsidiaries and some investment vehicles and subsidiaries)
(Billions of yen)
Gross Hedged (ex.Insurance) Net Position
Brazil 27.2 0.8 26.4 Malaysia 12.8 2.2 10.6
Mozambique 0.2 - 0.2
Chile 10.8 0.6 10.2
Russia 2.1 0.1 2.0
Italy 15.0 1.9 13.1
Indonesia 23.1 0.8 22.3
Mexico 13.3 0.7 12.6
China 130.6 13.0 117.6
Thailand 27.3 2.4 24.9
Ireland 7.9 2.4 5.5
India 30.7 1.2 29.5 Note) Among the countries subject to country risk reporting, we disclose countries with significance as to the balance. Note) “Hedged” represents the amounts by which credit risk is hedged by such as trade insurance and Confirmed L/C. Note) From March-18, the balance of “China” in the above table includes Hong Kong.
【Fund operation】 We maintain cash and cash equivalents as liquidity sources, which consist mainly of highly liquid and highly-rated short-term financial instruments and deposits to flexibly meet capital requirements for our business activities
- 21 -

9. Number of Employees ◆Mitsui & Co., Ltd. and Subsidiaries (Consolidated)
(1) By Operating Segment (2) Overseas Offices and Trading Subsidiaries
Mar-20 Mar-19 Mar-20 Mar-19
Iron & Steel Products 1,505 1,518 Japan - -
Mineral & Metal Resources 634 619 Americas 558 560
Machinery & Infrastructure 17,017 15,264 Europe, the Middle East and Africa 594 615
Chemicals 5,238 5,276 Asia Pacific 1,520 1,482
Energy 888 843 Total 2,672 2,657
Lifestyle 10,642 13,298 Note) The number above is the number of employees at overseas offices and trading subsidiaries,which is included in the number of employees in Table (1).
Innovation & Corporate Development 6,301 3,694
All Other 3,399 3,481
Total 45,624 43,993
Note) The above number does not include part-timers and temporary employees.
◆Mitsui & Co., Ltd.
(3) By Operating Segment (4) By Geographic Area
Mar-20 Mar-19 Mar-20 Mar-19
Iron & Steel Products 305 328 Japan 4,464 4,561
Mineral & Metal Resources 278 291 Americas 324 330
Machinery & Infrastructure 853 844 Europe, the Middle East and Africa 249 241
Chemicals 738 676 Asia Pacific 514 498
Energy 401 392 All Other 125 142
Lifestyle 834 971 Total 5,676 5,772
Innovation & Corporate Development 476 419 Note) The number above does not include employees at overseas offices and trading subsidiaries. All Other 1,791 1,851
Total 5,676 5,772
Note) The above number does not include part-timers and temporary employees.
- 22 -

10. Historical Data
U.S.GAAP Mar-2010 Mar-2011 Mar-2012 Mar-2013 Mar-2014
(Billions of yen) Revenues 4,096.4 4,679.4 5,251.6 4,911.6 5,740.7
Gross Profit 702.0 859.2 878.3 790.4 859.9
Other Expenses (Income) -576.0 -586.6 -465.1 -476.3 -406.2
SG&A expense -546.2 -533.0 -514.8 -521.1 -574.7
Provision for doubtful rec. -11.3 -9.2 -15.1 -14.7 -10.0
Interest expense -10.4 -0.7 -5.4 -1.2 2.1
(Interest income) 35.9 40.0 37.2 41.7 46.5
(Interest expense) -46.3 -40.7 -42.6 -42.9 -44.4
Dividend income 37.7 51.0 86.5 80.1 120.5
Gain on sales of securities 20.9 39.5 21.9 44.9 80.9
Gain on securities contributed to an employee retirement benefit trust
- - - - 2.1
Loss on write-down of sec. -48.5 -19.5 -33.5 -27.3 -18.9
Gain on disposal of PP&E - 0.2 5.7 6.2 15.7
Impairment of long-lived assets -8.7 -18.3 -14.0 -12.3 -6.5
Impairment loss of goodwill -9.9 -0.6 -4.2 - -4.1
Settlement of the Oil Spill Incident in the Gulf of Mexico
- -88.6 - - -
Other expense 0.4 -7.4 7.9 -30.9 -13.3
Income before Taxes 126.0 272.6 413.2 314.1 453.7
Income Taxes -89.2 -203.9 -172.6 -158.3 -180.7
Income before Equity in Earnings 36.8 68.7 240.6 155.8 273.0
Minority Interests - - - - -
Equity in Earnings 131.5 242.2 232.1 176.2 173.7
Discontinued Operations -0.8 - - - -
Net Income 167.5 310.9 472.7 332.0 446.7 Net Income Attributable to Noncontrolling Interests -17.8 -4.2 -38.2 -24.1 -24.5
Net Income Attributable to Mitsui & Co., Ltd. 149.7 306.7 434.5 307.9 422.2
Total trading transactions (Japan GAAP) 9,358.4 9,942.5 10,481.2 10,049.6 11,165.7
Operating income (Japan GAAP) 144.5 317.0 348.4 254.6 275.2 Total Assets 8,369.0 8,598.1 9,011.8 10,324.6 11,001.3
Current Assets 4,261.1 4,317.6 4,426.3 4,631.5 4,430.3
Fixed Assets 4,107.9 4,280.5 4,585.5 5,693.1 6,571.0
Interest-bearing debt 3,471.7 3,377.5 3,578.0 4,269.3 4,455.1
Cash and Time deposits 1,416.0 1,443.6 1,435.2 1,429.9 1,230.7
Net interest-bearing debt 2,055.7 1,933.9 2,142.8 2,839.4 3,224.4
Shareholders’ Equity 2,230.1 2,366.2 2,641.3 3,181.8 3,586.4
Common stock 341.5 341.5 341.5 341.5 341.5 ROA 1.8% 3.6% 4.9% 3.2% 4.0%
ROE 7.3% 13.3% 17.4% 10.6% 12.5%
DER (Net) 0.92 0.82 0.81 0.89 0.90
Shareholders’ equity to total assets 26.6% 27.5% 29.3% 30.8% 32.6%
- 23 -

IFRS Mar-2013 Mar-2014 Mar-2015 Mar-2016 Mar-2017 Mar-2018 Mar-2019 Mar-2020 (Billions of yen) Revenue 4,912.1 5,731.9 5,404.9 4,759.7 4,364.0 4,892.1 6,957.5 6,831.9 Gross Profit 814.1 880.1 845.8 726.6 719.3 790.7 838.5 839.4 Other Income (Expenses) -560.0 -609.3 -655.5 -605.6 -458.8 -536.2 -578.7 -622.6 SG&A expense -529.3 -574.9 -584.6 -566.0 -539.0 -571.7 -566.3 -584.9
Gain (loss) on securities and other investments-net 20.5 30.8 42.5 93.2 65.0 55.1 4.4 25.1
Impairment loss of fixed assets -33.7 -60.0 -79.9 -89.0 -5.7 -25.5 -27.0 -110.8
Gain (loss) on disposal or sales of fixed assets-net 6.1 16.4 1.4 -11.7 11.0 15.1 17.9 9.5
Other income(expense)-net -23.6 -21.6 -34.9 -32.1 9.9 15.8 -18.8 38.5 Provision related to Multigrain business - - - - - -25.0 11.1 - Finance Income (Costs) 74.3 108.5 97.0 35.3 29.8 54.8 69.2 48.3 Interest income 40.3 33.7 33.1 31.6 34.9 36.5 43.4 41.4 Dividend income 80.6 124.0 114.1 54.7 51.9 84.8 -80.1 96.5 Interest expense -46.6 -49.2 -50.2 -51.0 -57.0 -66.5 105.9 -89.6 Share of Profit (Loss) of Investments Accounted for Using the Equity Method 183.1 171.2 144.6 -132.0 170.6 234.9 255.4 269.2
Profit before Income Taxes 511.5 550.5 431.8 24.3 460.8 544.4 584.3 534.3 Income Taxes -195.2 -176.7 -104.9 -91.2 -134.6 -103.1 -152.6 -123.0 Profit (Loss) for the Year 316.3 373.8 326.9 -66.9 326.2 441.3 431.8 411.3 Profit (Loss) for the Year Attributable to Non-controlling Interests -19.7 -23.7 -20.4 -16.5 -20.0 -22.8 -17.5 -19.8
Profit (Loss) for the Year Attributable to Owners of the Parent 296.6 350.1 306.5 -83.4 306.1 418.5 414.2 391.5
Note) May not match with the total of items due to rounding off. Total trading transactions (Japan GAAP) 10,050.6 11,155.4 10,827.8 9,616.8 - - - - Operating income (Japan GAAP) 284.8 305.2 - - - - - - Total Assets 10,777.3 11,491.3 12,202.9 10,910.5 11,501.0 11,306.7 11,945.8 11,806.3 Current Assets 4,628.5 4,465.4 4,730.5 4,286.7 4,474.7 4,226.2 3,996.3 4,124.4 Fixed Assets 6,148.8 7,025.9 7,472.4 6,623.8 7,026.3 7,080.5 7,949.5 7,681.9 Interest-bearing debt 4,176.4 4,411.1 4,793.9 4,710.5 4,801.6 4,226.9 4,625.5 4,550.5 Cash and Time deposits 1,432.5 1,232.3 1,411.7 1,495.5 1,519.5 1,137.7 966.3 1,063.8 Net interest-bearing debt 2,743.9 3,178.8 3,382.2 3,215.0 3,282.1 3,089.2 3,659.2 3,486.7 Shareholders’ Equity 3,439.1 3,815.8 4,099.8 3,379.7 3,732.2 3,974.7 4,263.2 3,817.7 Common stock 341.5 341.5 341.5 341.5 341.5 341.5 341.5 341.8
ROA 2.9% 3.1% 2.6% -0.7% 2.7% 3.7% 3.6% 3.3% ROE 9.4% 9.7% 7.7% -2.2% 8.6% 10.9% 10.1% 9.7% DER (Net) 0.80 0.83 0.82 0.95 0.88 0.78 0.86 0.91 Shareholders’ equity to total assets 31.9% 33.2% 33.6% 31.0% 32.5% 35.2% 35.7% 32.3% Note) Mitsui adopted IFRS for its annual securities report under the Financial Instruments and Exchange Act from the year ended
March 31,2014, filed with the Director-General of the Kanto Local Finance Bureau of the Ministry of Finance of Japan on June 20, 2014.
Note1) Figures have not been reclassified to conform to the change in current year presentation for discontinued operations in
accordance with ASC205-20. Note2) ASC810-10-65 (SFAS No. 160) was adopted effective Mar-2010. Figures for prior years have not been reclassified. Note3) Tax effects on investments in associated companies which were formerly included in “Equity in Earnings” are included in
“Income Taxes” for the year ended Mar-2010. Figures for prior years have not been reclassified.
Note4) In regards to transactions where Mitsui and its subsidiaries were not a contracting party and acted as an agent, we changed the presentation to include only the commission amount in “Total trading transactions” from the presentation based on total amounts of the gross transaction volume and the commission we received for the year ended Mar-2010. Figures for prior years have not been reclassified.
- 24 -