data brought to you by - iab ireland · research data brought to you by convertro 4 a...
TRANSCRIPT

DATA BROUGHT TO YOU BY
RESEARCH DATA BROUGHT TO YOU BY CONVERTRO 2
WHY BEING CUSTOMER-CENTRIC MEANS BEING DATA-DRIVENA CROSS-CHANNEL ANALYSIS OF HOW MULTI-TOUCH ATTRIBUTION CHALLENGES CATEGORY MARKETING NORMS.
Changing habits and the rapid rise of digital advertising technology have veered the seemingly linear path to purchase into a meandering trail of online and offline marketing touchpoints. This makes it extremely difficult for advertisers to identify exactly which of their actions led to a sale and complicates metrics of success.
Legacy methodologies such as last-click or first-touch are not up to the specifications necessary for marketers today to fully understand how their dollars are being spent. Fortunately, after years of refinement and cultivation, multi-touch attribution (MTA) finally offers brands a dynamic, sophisticated algorithmic model that considers every digital and offline marketing touchpoint. Today, MTA is the only analytics technology that provides full transparency into how consumers decide on and make their purchases.
The emerging methodology emphasizes that marketers no longer have to solely rely on advertising rules of thumb. Rather than aiming to meet industry averages and benchmarks, brands have the ability to optimize their campaigns to tailored goals with the help of more accurate data analysis. They can now look beyond vertical and industry generalizations and understand their own brand performance.
KEY TAKEAWAYS In this proprietary report, AOL Platforms analyzed customer path data across eight industries and eight marketing channels. AOL Platforms examined brand-specific nuances, as well as levels of channel-specific optimization to reveal strong differences in how a brand is able to generate positive return on investments (ROI). The findings are powerful.
• While digital marketing generates positive and healthy ROIs for all of the eight industries studied, the results vary by:
- Product category
- Advertising channel
- Brand (even if differing advertisers were in the same industry and utilizing the same mediums)
• Media buyers can no longer solely rely on industry-wide ROI averages or paid media channel rankings.
• Industry and category results are helpful in providing brands with competitive context, direction and opportunity sizing, but only when broken down into ROI by publisher, placement, creative and keyword.
• A best practice for improving ROI should include multiple buying tools, an advanced MTA methodology and an advertiser’s first-party data.
RESEARCH DATA BROUGHT TO YOU BY CONVERTRO 4
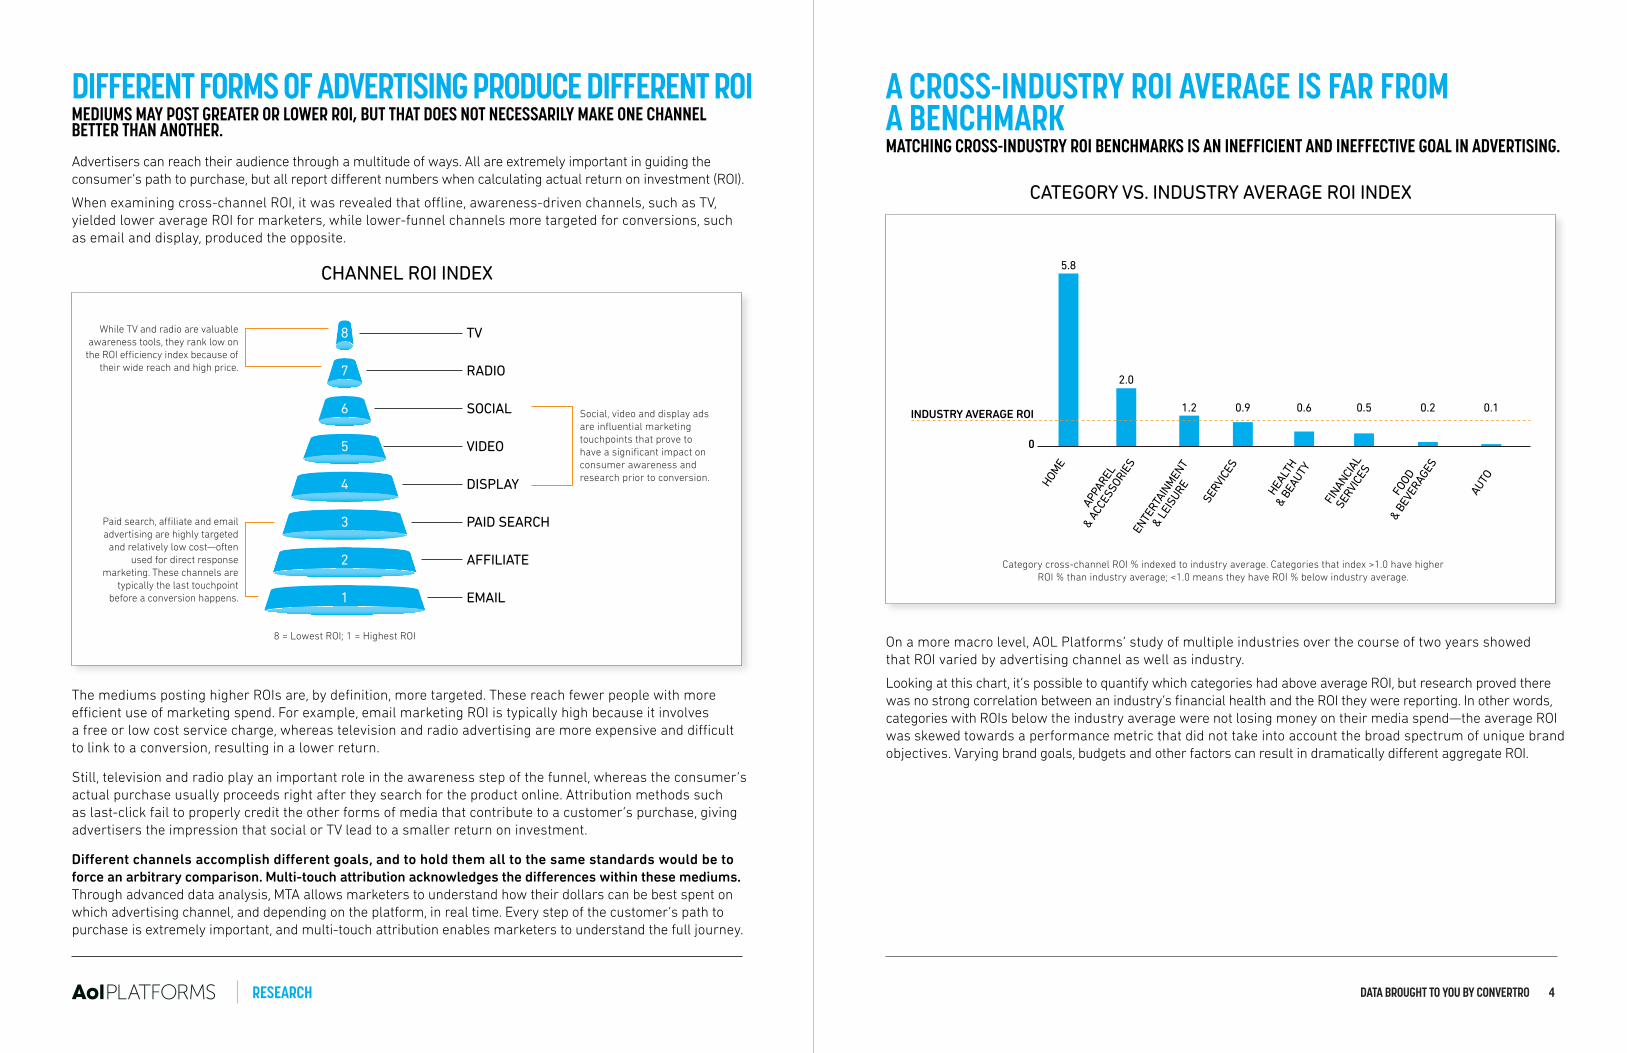
A CROSS-INDUSTRY ROI AVERAGE IS FAR FROM A BENCHMARKMATCHING CROSS-INDUSTRY ROI BENCHMARKS IS AN INEFFICIENT AND INEFFECTIVE GOAL IN ADVERTISING.
On a more macro level, AOL Platforms’ study of multiple industries over the course of two years showed that ROI varied by advertising channel as well as industry.
Looking at this chart, it’s possible to quantify which categories had above average ROI, but research proved there was no strong correlation between an industry’s financial health and the ROI they were reporting. In other words, categories with ROIs below the industry average were not losing money on their media spend—the average ROI was skewed towards a performance metric that did not take into account the broad spectrum of unique brand objectives. Varying brand goals, budgets and other factors can result in dramatically different aggregate ROI.
DIFFERENT FORMS OF ADVERTISING PRODUCE DIFFERENT ROI MEDIUMS MAY POST GREATER OR LOWER ROI, BUT THAT DOES NOT NECESSARILY MAKE ONE CHANNEL BETTER THAN ANOTHER.
Advertisers can reach their audience through a multitude of ways. All are extremely important in guiding the consumer’s path to purchase, but all report different numbers when calculating actual return on investment (ROI).
When examining cross-channel ROI, it was revealed that offline, awareness-driven channels, such as TV, yielded lower average ROI for marketers, while lower-funnel channels more targeted for conversions, such as email and display, produced the opposite.
The mediums posting higher ROIs are, by definition, more targeted. These reach fewer people with more efficient use of marketing spend. For example, email marketing ROI is typically high because it involves a free or low cost service charge, whereas television and radio advertising are more expensive and difficult to link to a conversion, resulting in a lower return.
Still, television and radio play an important role in the awareness step of the funnel, whereas the consumer’s actual purchase usually proceeds right after they search for the product online. Attribution methods such as last-click fail to properly credit the other forms of media that contribute to a customer’s purchase, giving advertisers the impression that social or TV lead to a smaller return on investment.
Different channels accomplish different goals, and to hold them all to the same standards would be to force an arbitrary comparison. Multi-touch attribution acknowledges the differences within these mediums. Through advanced data analysis, MTA allows marketers to understand how their dollars can be best spent on which advertising channel, and depending on the platform, in real time. Every step of the customer’s path to purchase is extremely important, and multi-touch attribution enables marketers to understand the full journey.
CATEGORY VS. INDUSTRY AVERAGE ROI INDEX
CHANNEL ROI INDEX
TV
RADIO
SOCIAL
VIDEO
DISPLAY
PAID SEARCH
AFFILIATE
Category cross-channel ROI % indexed to industry average. Categories that index >1.0 have higher ROI % than industry average; <1.0 means they have ROI % below industry average.
HOME
5.8
APPA
REL
& AC
CESS
ORIE
S
2.0
ENTE
RTAI
NMEN
T
& LE
ISUR
E
1.2
SERV
ICES
0.9
HEALT
H&
BEAU
TY
0.6
FINAN
CIAL
SERV
ICES
0.5
FOOD
& BE
VERA
GES
0.2
AUTO
0.1INDUSTRY AVERAGE ROI
0
While TV and radio are valuable awareness tools, they rank low on
the ROI efficiency index because of their wide reach and high price.
Social, video and display ads are influential marketing touchpoints that prove to have a significant impact on consumer awareness and research prior to conversion.
Paid search, affiliate and email advertising are highly targeted
and relatively low cost—often used for direct response
marketing. These channels are typically the last touchpoint
before a conversion happens.
8 = Lowest ROI; 1 = Highest ROI

RESEARCH DATA BROUGHT TO YOU BY CONVERTRO
CHANNEL EFFICIENCY FURTHER VARIES BY CATEGORYEVERY INDUSTRY HAS ITS OWN IDEAL MEDIA MIX. WHAT WORKS FOR ONE WILL NOT WORK FOR ALL.
The reason for this disparate spectrum can be better understood when viewing which channels contributed to each industry’s ROI numbers. The representative sample of categories shown below provides a more granular perspective on which advertising channels were part of each industry’s respective media mix.
For example, the entertainment & leisure category, which boasted an ROI that was 20% above the industry average according to the previous chart, leveraged the broadest mix of paid digital and offline advertising mediums. The higher-than-average ROI most likely stems from the fact that stronger performing digital channels offset weaker offline channels.
6
ROI MEASURED BY CATEGORY & CHANNEL
90%80%60%70%40%30%20%10%
ENTERTAINMENT & LEISURE
80%90%70%40%60%50%
HEALTH & BEAUTY
70%60%80%90%50%
FINANCIAL SERVICES
AFFILIATE
PAID SEARCH
DISPLAY
VIDEO
SOCIAL
RADIO
TV
While cross-industry research is useful for directional purposes, the findings show that there is risk in over-relying on cross-industry averages or paid media channel rankings when making media spend decisions. Marketers should not anticipate comparable ROI due to the extensive range of variables—from audience make up and media exposure to budgets, it is rare that these factors will be identical across brands.
Because there is no clear, consistent pattern to marketing channels across industries, we believe there are significant opportunities to outperform industry averages and rankings by looking deeper than channel-level ROI and optimizing across publishers, placements, creative and keywords—a unique capability that only multi-touch attribution affords. Multi-touch attribution optimizes at the most granular level according to what is beneficial for that brand specifically.
RESEARCH DATA BROUGHT TO YOU BY CONVERTRO 8
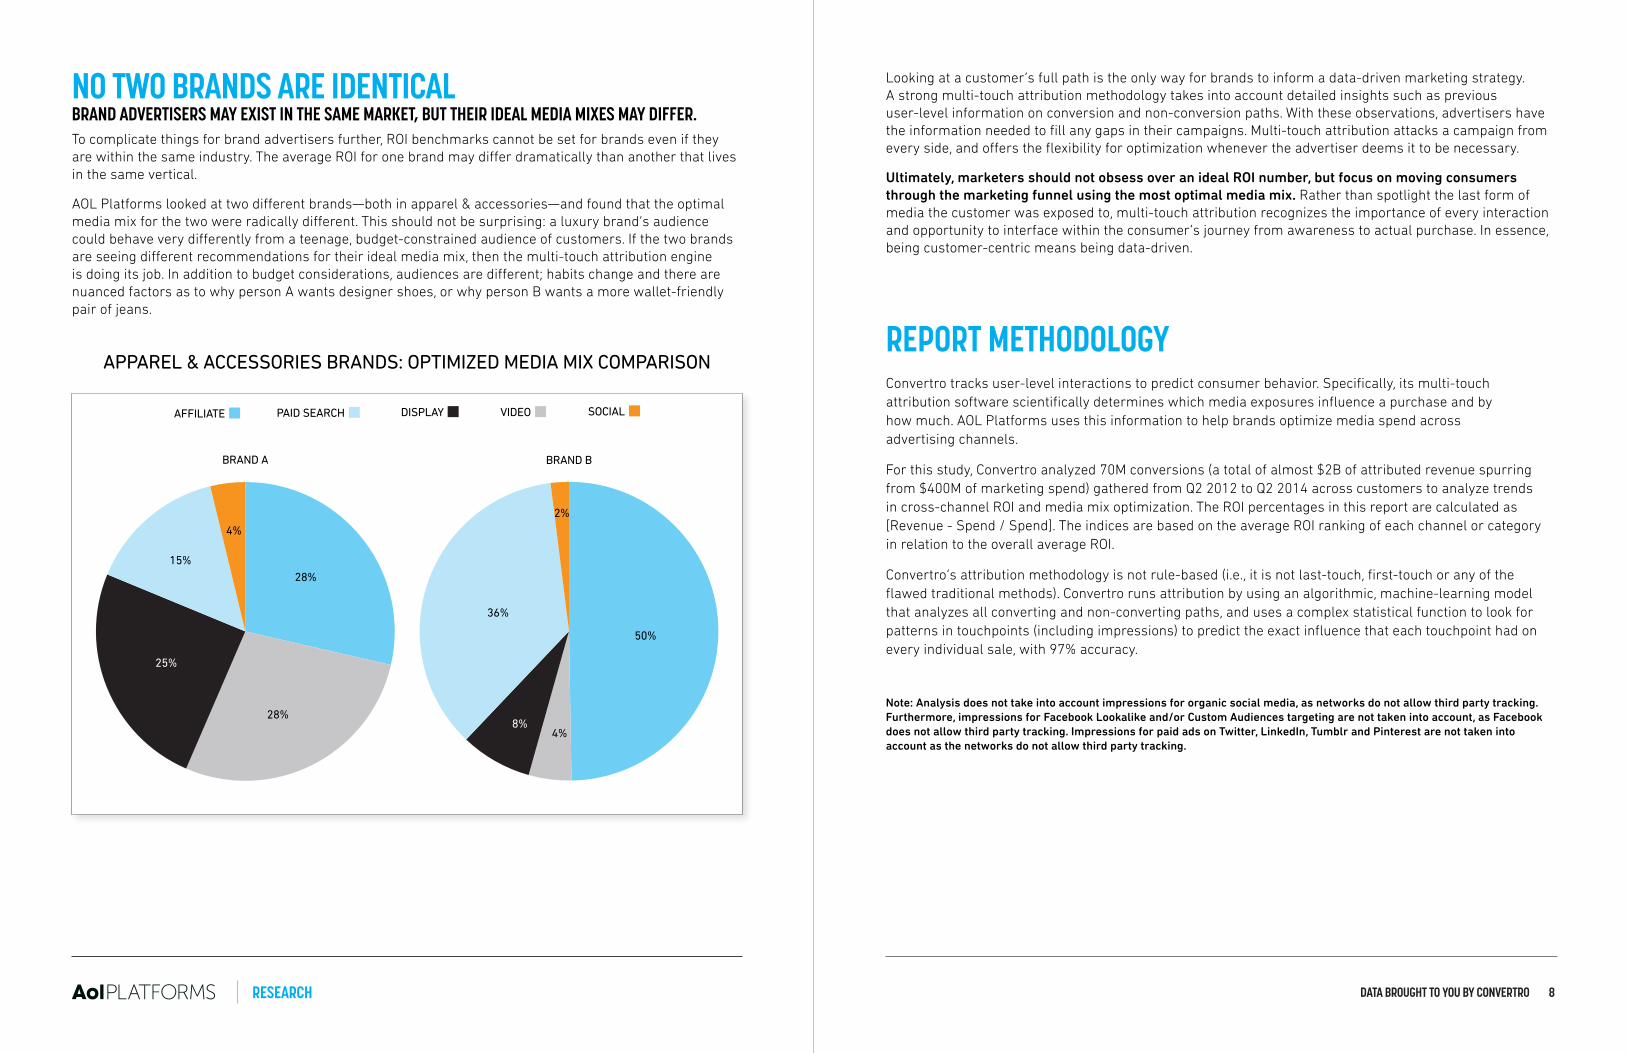
NO TWO BRANDS ARE IDENTICALBRAND ADVERTISERS MAY EXIST IN THE SAME MARKET, BUT THEIR IDEAL MEDIA MIXES MAY DIFFER.To complicate things for brand advertisers further, ROI benchmarks cannot be set for brands even if they are within the same industry. The average ROI for one brand may differ dramatically than another that lives in the same vertical.
AOL Platforms looked at two different brands—both in apparel & accessories—and found that the optimal media mix for the two were radically different. This should not be surprising: a luxury brand’s audience could behave very differently from a teenage, budget-constrained audience of customers. If the two brands are seeing different recommendations for their ideal media mix, then the multi-touch attribution engine is doing its job. In addition to budget considerations, audiences are different; habits change and there are nuanced factors as to why person A wants designer shoes, or why person B wants a more wallet-friendly pair of jeans.
APPAREL & ACCESSORIES BRANDS: OPTIMIZED MEDIA MIX COMPARISON
BRAND A
4%
28%15%
28%
25%
BRAND B
2%
36%
50%
4%8%
Looking at a customer’s full path is the only way for brands to inform a data-driven marketing strategy. A strong multi-touch attribution methodology takes into account detailed insights such as previous user-level information on conversion and non-conversion paths. With these observations, advertisers have the information needed to fill any gaps in their campaigns. Multi-touch attribution attacks a campaign from every side, and offers the flexibility for optimization whenever the advertiser deems it to be necessary.
Ultimately, marketers should not obsess over an ideal ROI number, but focus on moving consumers through the marketing funnel using the most optimal media mix. Rather than spotlight the last form of media the customer was exposed to, multi-touch attribution recognizes the importance of every interaction and opportunity to interface within the consumer’s journey from awareness to actual purchase. In essence, being customer-centric means being data-driven.
REPORT METHODOLOGYConvertro tracks user-level interactions to predict consumer behavior. Specifically, its multi-touch attribution software scientifically determines which media exposures influence a purchase and by how much. AOL Platforms uses this information to help brands optimize media spend across advertising channels.
For this study, Convertro analyzed 70M conversions (a total of almost $2B of attributed revenue spurring from $400M of marketing spend) gathered from Q2 2012 to Q2 2014 across customers to analyze trends in cross-channel ROI and media mix optimization. The ROI percentages in this report are calculated as [Revenue - Spend / Spend]. The indices are based on the average ROI ranking of each channel or category in relation to the overall average ROI.
Convertro’s attribution methodology is not rule-based (i.e., it is not last-touch, first-touch or any of the flawed traditional methods). Convertro runs attribution by using an algorithmic, machine-learning model that analyzes all converting and non-converting paths, and uses a complex statistical function to look for patterns in touchpoints (including impressions) to predict the exact influence that each touchpoint had on every individual sale, with 97% accuracy.
Note: Analysis does not take into account impressions for organic social media, as networks do not allow third party tracking. Furthermore, impressions for Facebook Lookalike and/or Custom Audiences targeting are not taken into account, as Facebook does not allow third party tracking. Impressions for paid ads on Twitter, LinkedIn, Tumblr and Pinterest are not taken into account as the networks do not allow third party tracking.

RESEARCH

©2015 AOL Platforms. All rights reserved.