data gathering and transmission system for prject ehv
DESCRIPTION
This file is to download file from scribd.TRANSCRIPT
other temperatures was no t great. All cores had been subjected to t he usual tests by t he manufacturer , and only those meeting min imum specifications for squareness, coercive force, etc., were sup-plied.
The experimental da t a presented in the curves of Figs. 3 a n d 4 were obtained from four cores each of 1/2-mil, 1-mil, 2-mil, and 4-mil thickness, annealed a t 1,950 F , and they were driven with pro-grammed sequence of rectangular current pulses through 10-turn toroidal windings. Rates of change of flux were observed by means of a Tektronix, Inc. , model 545 oscilloscope connected across an addi-tional winding placed on the core. T h e programmed current pulses came from a modified Rese Engineering Company ' s magnetic core tester model 1100, wi th cur-rent rise and decay t imes of abou t 0.09 microsecond, and a constant current out -pu t ampli tude for the entire durat ion of the current pulse (within 5 % under the worst conditions encountered during the experimentat ion). T h e wraps in each core were counted wi th t he help of a microscope, as this information was needed for calculation purposes.
Conclusions
Evidence shows t h a t flux reversal in Ni-Fe t ape cores init iates a t t h e surface. While experimentat ion was carried ou t
wi th cores made from 5 0 % Ni-Fe tapes only, t he same general behavior can be expected from other Ni-Fe tapes, except for differences discussed in the closure of reference 2.
T h e model for t he init iat ion of flux reversal is developed b y showing t h a t i t is independent of the internal domain s t ructure of the tape due to the previous magnet izat ion history. This result is impor tan t in unders tanding flux changes which are ini t iated in unsa tu ra ted cores. I t now becomes possible to develop a model for the ins tantaneous process dur-ing flux reversal with a rb i t ra ry (or almost arbi t rary) initial conditions—in simple si tuations, merely b y extending t he model presented in reference 2, and in more com-plex si tuations, by means of a more careful consideration of the domain wall dynamics . 4
T h e results obtained by prepulsing a core wi th a field of magni tude H' before continuing flux reversal wi th a smaller field Η (i.e. Η<Ά') indicate t h a t domains will continue t o grow, once s tar ted, even if Η is reduced below the normal thresh-old value for t h e domain after t h e ini t iat ing pulse is applied. This ob-servation supports t he conjecture t h a t t he value of s ta r t ing field required for a given domain depends on its initial rad ius . 6
T h e initial pulse apparent ly has expanded t h e nuclei enough so t h a t t hey will continue growing wi th smaller applied
fields. Additional experimental evidence is needed to confirm this s t a tement ; ex-tensions of t he method used to obtain Fig. 8 m a y be used for this purpose.
Finally, i t is hoped t h a t the quanti ta-t ive model for surface nucleation will be p u t on a firmer basis by addit ional work on t he surface metal lurgy of tape cores, wi th the u l t imate a im t h a t quant i ta t ive metallurgical d a t a will confirm the pres-ence of the postulated number of nuclea-t ion sites.
References
1. A MATHEMATICAL MODEL FOR A MAGNETIC-AMPLIFIER REACTOR CORE, Η . H . Woodson. AIEE Transactions, pt . I (Communication and Elec-tronics), vol . 7 8 , 1 9 5 9 (Jan. 1 9 6 0 sect ion) , pp. 8 7 2 -7 8 . (Additional references quoted in this reference.)
2 . FLUX REVERSAL IN MAGNETIC AMPLIFIER CORES, F. J. Friedlaender. Ibid., vol. 7 5 , July 1 9 5 6 , pp. 2 6 8 - 7 8 . (Additional references quoted in this reference.)
3 . DOMAIN BOUNDARY CONFIGURATIONS DURING MAGNETIZATION REVERSALS, J. J. Becker . Journal of Applied Physics, N e w York, Ν . Y . , vol . 3 0 , no. 3 , Mar. 1 9 5 9 , pp. 3 8 7 - 9 0 .
4 . A N IMPROVED MODEL FOR FLUX REVERSAL IN N I - F E CORES, I . P . Leliakov, F . J . Friedlaender. AIEE Transactions, pt . I (Communication and Electronics), vol . 8 0 , Mar . 1 9 6 1 , pp . 2 3 - 2 6 .
5 . REVERSIBLE AND SLOW SPEED IRREVERSIBLE MAGNETIZATION PROCESSES IN 5 0 % N I - F E ALLOYS, L. L. Ogborn. Ph.D. Thesis, Purdue Universi ty , Lafayet te , Ind. , Jan. 1 9 6 1 .
6 . THE PROCESS OF FLUX REVERSAL IN GRAIN-ORIENTED 5 0 % NICKEL-IRON TAPE CORES, F. J. Friedlaender. Magnetic Amplifier Technical Re-Port no. 21, Carnegie Inst i tute of Technology, Pi t tsburgh, Pa. , Aug. 1 9 5 5 .
Data Gathering and Transmission System
for Project E H V
P. A. ABETTI D. W CAVERLY M E M B E R A I E E A S S O C I A T E M E M B E R A I E E
D. D. DAVIS E. A. WHEPLEY M E M B E R A I E E A S S O C I A T E M E M B E R A I E E
TH E General Electric Company extra-high-voltage project (called "Project
E H V " for short) was announced in June 1958, 1 after more t h a n a yea r of pre-l iminary planning. Project E H V in-volves t he design, construction, and oper-ation of a complete a-c t ransmission system, which will carry power first a t 460-500 k v and then a t 650-690 k v (750-kv max imum) . Th i s is more t h a n twice t he max imum voltage presently used by utilities in t h e Uni ted Sta tes and Canada and 5 0 % higher t h a n t he highest transmission voltage in t he world—500
k v in t h e Soviet Union. Detai led plan-ning, cost es t imating, and writing of t h e specifications for t h e line and appara tus were essentially completed on M a y 27, 1959, when construction was begun a t the site and in various p lants of t h e co-operat-ing companies. Construction is pro-ceeding and energization a t 460-500 k v began in December 1960.
Th i s paper will review briefly t he objec-t ives of Project E H V , t h e reasons for t h e selection of i ts r ight of way as determined b y t h e desired measurements , and finally, the over-all philosophy of system design
in relation t o t he acquisition of data . T h e d a t a gathering and transmission system, which will obta in about 10 mil-lion i tems of da t a annually, will be de-scribed in detail . Examples will be given of t h e analog and digital computat ions which are necessary in order to acquire t h e planned meteorological, mechanical, and electrical quant i t ies in t h e desired form. T h e over-all procedure will be ment ioned for t h e processing of the da ta and thei r s tat ist ical evaluation through a large digital computer , an Internat ional Business Machines Corporat ion ( IBM) 705.
Previous unpubl ished papers have pre-sented in detai l t he over-all technical p lan ; t h e prel iminary laboratory in-vestigations, such as t h e insulation design
Paper 60-1407, recommended b y the A I E E Com-put ing D ev i ce s Commit tee and approved by the A I E E Technical Operations Department for presentat ion at the A I E E Winter General Meet ing , N e w York, Ν . Y . , January 29-February 3 , 1961. Manuscr ipt submit ted August 12 , 1960; made available for printing December 1 4 , 1960.
P. A. ABETTI, D . W. CAVERLY, D . D . DAVIS, and E . A. WHEPLEY are wi th the General Electric Com-pany , Pittsfield, Mass .
272 Abetti, Caverly, Davis, Whepley—Project EHV Transmission System J U L Y 1 9 6 1

of the system; the Nor th Stat ion and the three adjacent portal - type towers; t he conductors, insulators, and accessories; and the preHminary corona investiga-t ions . 2
T h e over-all objectives of Project E H V a re :
1. To help re-establish the United States as a world leader in the broad areas of EHV power systems.
2. To prove that EHV systems (460 kv and above), in all their interrelated corn-components and aspects, are feasible, more reliable, and more economical for the trans-mission of large blocks of power over smaller rights of way than systems presently used.
3. To contribute technical knowledge which will advance the continued expansion of electric power at reduced costs.
Location and System Characteristics
T h e r ight of way was selected according to t he following specifications:
1. It must be ad j acent to an existing 115-kv line of the Western Massachusetts Electric Company, in order to draw power at the two terminal stations. It must be farther than 1,000 feet from existing 115-kv lines in order to avoid radio-noise interference (RI) .
2. It must be on relatively level ground, with maximum differences of about 100 feet in elevation. This requirement is dictated by the fact that corona loss, and presumably RI, are dependent upon air density which, in turn, depends upon eleva-tion. For a line of variable altitude, most of the loss and RI would be generated from the sections at the higher altitudes, and it would be quite difficult to analyze and correlate the experimental data.
3. I t must be on terrain with a variety of soil conditions (to study its effect on the line performance), and fairly well exposed to lightning, sleet storms, and steady winds (to study aeolian vibrations).
Mos t of these specifications were m e t by t h e site selected—over pas tures , swamps, and rocky woods along t h e Housatonic River, in t h e towns of Lenox and Lee, Berkshire County , western Massachuset ts . T h e meteorological characteristics of th i s zone are believed to be representat ive of m a n y regions of nor thern Uni ted States a n d southern Canada , and are probably more severe t h a n average Uni ted Sta tes conditions.
T h e region h a s a great var ie ty of weather, with a goodly number of s to rms of minor in tensi ty , a l though s torms of hurr icane force occur occasionally. T h e tempera ture varies between — 25 F (de-grees Fahrenhei t ) and 95 F . A t t he loca-t ion of the line through rural country , contaminat ion other t h a n b y pollen should be mild. There is a good deal of fog along the Housatonic River, and
i t is hoped t h a t critical icing conditions will exist several t imes during t h e in-vestigation. T h e isokeraunic level of t h e area is 27. While this is ra ther low for purposes of l ightning investigations, is is hoped t h a t abou t one s troke per mile-year will contact some port ion of the line because of the height of the s truc-tures which are provided with addi t ional l ightning rods. Experiments also will be m a d e to determine t h e number of strokes per square mile and to obta in correlation with t he strokes to t h e line. T h e line is equipped with two oscillo-graphs a t each of t h e 18 towers to obta in no t only t h e magni tude b u t also t h e wave-shape of t he stroke currents .
A 4.3-mile 300-foot-wide str ip of land was acquired for t h e line r ight of way and also approximately 8 acres of land a t each end for t he terminal s tat ions. F ive
areas approximately 50X375 feet, uni-formly spaced along t h e r ight of way, to be used for locating measuring in-s t ruments such as R I meters and the analog-to-digital converters, were also obtained. T h e 300-foot width of the r ight of way is sufficient for a double-circuit line a t 650-kv al ternat ing current ; a single-circuit line a t 1,000-kv alternating current, or 2X500-kv direct current, which are assumed to be maximum vol-tages conceivable under present E H V technology. T h e 4.3-mile length is con-siderably greater t h a n the length of other experimental E H V l ines , 3 which range from 0.03 to 1.4 miles. I t was chosen to obta in a bet ter simulation of actual E H V lines, which m a y have sections from 10 to 200 miles between switching stations. For instance, R I measurements on short lines have shown marked s tanding waves
-NORTH STATION- -TRANSMISSION LINE - -SOUTH STATION-
NORTH STATION INSTRUMENT
BUILDING
SHORT SECTION TEST LINE
F0A-T-60-40000 (OUTPUT) 650000 GR.Y/375000-GR.Y/77400-DELTA
650 KV DISCONNECT
SWITCH
134000 $516 MILES
LONG SECTION · TEST LINE I
\ 10 MVAR REMOVABLE \ SER'ES CONNECTION \ CAPACITOR
—If
23/4.16 KV-SUB O A / F A - T - 6 0 -
30000/40000 (OUTPUT)! -110000 GR.Y/63500-£j
110000 GR.Y/63500 \ t 3 0 % (72 STEP) ^~X"
5000 MVA A.C.B.*)
D.S. 8 PHASE L REVERSAL f
•i—L-
IMPULSE GENERATOR
- 3 . 7 -MILES
460 KV CONDUCTOR AGING
V
TO PITTS FIELD
4160 V DISTRIBUTION LINE FOR MEASURING APPARATUS POWER
110 KV + 2 KV
23 KV
TO LEE
Fig. 2. Project EHV circuit diagram
J U L Y 1 9 6 1 Abetti, Caverly, Davis, Whepley—Project EHV Transmission System 273
DISTANCE FROM NORTH STATION, FEET
Fig. 1 . Profile of Project E H V 650-kv line
which m a y greatly distort the R l picture. Furthermore, a t tenuat ion characteristics a t R l frequencies are of great interest in predicting t he R l performance of a line. Recent invest igat ions 4 have shown t h a t the principal mode of propagat ion of R l has an a t tenuat ion of approximately 6 d b / (decibels per) mile. Thus , i ts a t -tenuat ion characteristics m a y be deter-mined with sufficient accuracy on a line several miles long.
With respect to corona losses, i t ha s been found on short, open-ended, ex-perimental lines t h a t t he rat io between the highest foul-weather and fair-weather losses m a y be 100 or even higher. I t is very doubtful whether such a ra t io would apply to actual lines of normal length, because i t is highly improbable t ha t all the line would be subjected to extreme weather conditions s imultane-ously. I t is, therefore, of interest to s tudy the effect of nonuniform weather on the corona, mechanical, and R l per-formances. In the Berkshires, heavy rain or snow in one location and sunshine in a location a few miles away is qui te com-mon. Thus , the Project E H V line, with three complete weather s tat ions located about 2 miles apar t , will be very useful in investigating this effect.
Another reason for choosing the 4.3-mile length was t o s tudy a t t enua t ion characteristics of impulse-generator traveling waves along the line and their penetrat ion in to t h e te rminal s tat ions. On a line several miles long, a marked a t tenuat ion of t he impulse waves m a y be obtained, a n d abnormal reflections m a y be avoided.
The profile of t he line, shown in Fig. I , indicates t h a t there will be a to ta l of 18 towers and 17 spans ranging from 880 to 2,200 feet, with an average span of 1,300 feet. I t is desirable t o h a v e a t least one span over 2,000 feet long to s tudy the mechanical performance of the conductors and adjacent towers under unusual conditions. As ment ioned pre-viously, t he soil conditions are variable along t h e r ight of way. For instance, ground resistivity varies from 10 meter-ohms in the swampy region around tower
I I , t o 300-1,000 meter-ohms in t he loose sand a t tower 1. Towers are numbered start ing from the nor th end. This will enable an extensive s tudy of t he electrical and mechanical characteristics of the various foundations and grounding ar-rangements. A circuit d iagram of Proj -ect E H V is shown in Fig. 2. Of par-ticular interest is the 4,160-volt 300-kva distribution circuit for supplying power to the instruments and the various build-ings along the line.
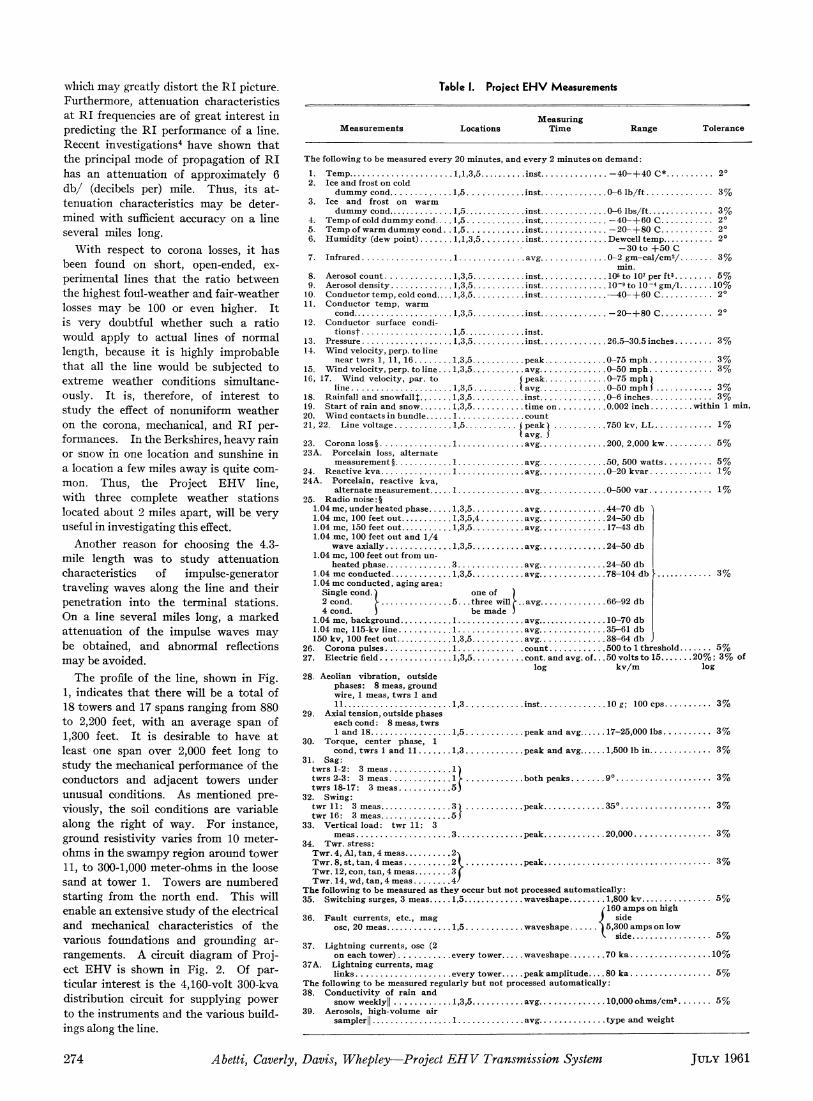
Table I. Project EHV Measurements
M e a s u r e m e n t s Locations Measur ing
T i m e Range Tolerance
The following to be measured every 20 minutes , and every 2 minutes on demand:
1. 2.
T e m p 1,1,3,5 inst - 4 0 - + 4 0 C * Ice and frost on cold
d u m m y cond 1,5 inst 0 - 6 lb / f t Ice and frost on warm
d u m m y cond 1,5 inst 0 - 6 lbs / f t T e m p of cold d u m m y cond. . . . 1,5 inst —40-4-60 C T e m p of warm d u m m y cond . . 1 , 5 inst — 2 0 - + 80 C H u m i d i t y (dew point) 1,1,3,5 inst Dewcell t emp
- 3 0 t o + 5 0 C Infrared 1 avg 0 -2 g m - c a l / c m 2 / .
. inst —40—1-60 C.
. inst - 2 0 — ( - 8 0 C
. inst .
. inst 26 .5-30 .5 inches .
Aerosol count 1,3,5 inst 105 to 10' per f t 3 . Aerosol densi ty 1,3,5 inst 10" 9 to 10 ~ 4 g m / 1 . Conductor t emp, cold cond 1,3,5 Conductor t e m p , warm
cond 1,3,5 Conductor surface condi-
t ionsf 1,5 13. Pressure 1,3,5 14. Wind velocity , perp. to line
near twrs 1, 11, 16 1,3,5 peak 0 - 7 5 m p h . . . . 15. Wind velocity , perp. to line . . . 1,3,5 avg 0 - 5 0 m p h . . . . 16. 17. Wind veloci ty , par. to ( p e a k 0 - 7 5 m p h )
line 1,3,5 \ avg 0 - 5 0 m p h ) . . . Rainfall and snowfa l l j 1,3,5 inst 0 - 6 inches Start of rain and snow 1,3,5 t ime on 0.002 inch . . . . Wind contacts in bundle 1 count
22. Line voltage 1,5 ί peak ) 750 kv, L L . . . I avg. ]
Corona loss § 1 avg 200, 2,000 k w .
12
18. 19. 20. 21,
. 2°
• 3 %
. 3 %
. 2°
. 2°
. 2°
. 3 %
. 5 % • 10% . 2°
3 %
3 % 3 %
3 % 3 %
.within 1 min.
23 23A. alternate
one of ) . three will r .. a be made )
Porcelain loss, measurement § 1 avg 50, 500 w a t t s .
24. React ive k v a 1 avg 0 - 2 0 k v a r . . . . 24A. Porcelain, react ive kva ,
alternate measurement 1 avg 0 -500 v a r . . . . 25. Radio noise :§
1.04 mc , under heated phase 1,3,5 avg 4 4 - 7 0 db 1.04 mc, 100 feet out 1,3,5,4 a v g 2 4 - 5 0 db 1.04 mc, 150 feet out 1,3,5 a v g 17-43 db 1.04 mc, 100 feet out and 1/4
wave axially 1,3,5 avg 2 4 - 5 0 db 1.04 mc, 100 feet out from un-
heated phase 3 avg 2 4 - 5 0 db 1.04 mc conducted 1,3,5 a v g 7 8 - 1 0 4 db ) 1.04 mc conducted , aging area:
Single cond . ) n „ n n
2 cond. } 5 . . . three will f .. avg 66 -92 db 4 cond.
1.04 mc, background 1 avg 10-70 db 1.04 mc, 115-kv line 1 a v g 35 -61 db 150 k v , 100 feet out 1,3,5 avg 3 8 - 6 4 db
26. Corona pulses 1 count 500 to 1 threshold. 27. Electric field 1,3,5 cont. and avg. o f . . . 50 vo l t s t o 15
log k v / m 28. Aeolian vibration, outside
phases: 8 meas, ground wire, 1 meas, twrs 1 and 11 1,3 inst.
29. Axial tension, outside phases each cond: 8 meas , twrs , » Λ ^ Λ Λ Λ 1 « _ 1 a n d i g 1,5 peak and avg 17-25 ,000 lbs
30. Torque, center phase, 1 . cond, twrs 1 and 11 1,3 peak and avg 1,500 lb i n . . .
31. Sag: twrs 1-2: 3 meas Π twrs 2-3: 3 meas 1 λ twrs 18-17: 3 meas 5 )
32. Swing: twr 11: 3 meas 3 ) twr 16: 3 meas 5 )
1%
5 %
5 % 1%
1%
3 %
5 % . 2 0 % ; 3 % of
log
10 g; 100 cps 3 %
3 %
3 %
. both peaks .
.peak. . 3 5 °
. 20 ,000 . 33. Vertical load: twr 11: 3
meas 3 peak. 34. Twr. stress:
Twr. 4, Al, tan , 4 meas 2 \ Twr. 8, st , tan, 4 meas 2 peak. Twr. 12, con, tan, 4 meas Twr. 14, wd, tan , 4 meas
The following to be measured as they occur but not processed automat ica l ly: 35. Switching surges, 3 meas 1,5 waveshape 1,800 k v
/ 1 6 0 amps on high mag J side
1,5 waveshape 15,300 amps on low Ν side
Lightning currents, ose (2 on each tower) every tower waveshape 70 ka
37 A. Lightning currents, mag links every tower peak a m p l i t u d e . . . . 80 ka
The following to be measured regularly but not processed automatical ly: 38. Conduct iv i ty of rain and
snow weeklyII 1,3,5 avg 10,000 o h m s / c m 3 . . 39. Aerosols, high-volume air
sampler 11 1 avg type and weight
36.
37.
Faul t currents, etc . , ose, 20 meas
. 3 %
. 3 %
. 3 %
• 3 %
. 5 %
. 5 %
. 1 0 %
. 5 %
. 5 %
2 7 4 Abetti, Caverly, Davis, Whepley—Project EHV Transmission System J U L Y 1961
3.
2°
.9° .
4. 5 . 6.
7.
8. 9.
10. 11.

Table I. (continued)
M e a s u r e m e n t s Locations Measur ing
T i m e Range Tolerance
40. Small ion meter 1 inst. 41. Conductor contaminat ion
evert 20 min^[ 1 cont 42. Porcelain contaminat ion
every 20 m i n f ·. . 1 cont 43. Aerosols, dust spot every
20 min 1 avg. 44. T V interference, weekly 1 inst. .
* Degrees centigrade.
f Photographically.
J 0.005 resolution.
§ T w o scales.
II Manual ly .
If Closed-circuit TV.
Abbreviat ions:
Al = a luminum amps = amperes avg = average cir = circuit con = concrete cond = conductor cont = continuous cps = cycles per second dia = diameter gm-cal = gram-calories gm/1 = grams/ l i ter inst = instantaneous ka = kiloamperes k v / m = ki lovolts per meter
• 2 0 %
Philosophy and Scope of Measurements
One of the mos t impor tan t goals of Project E H V is to obtain experimental da ta on an E H V line in actual operat ion. Advanced measurement systems in con-nection with a modern digital computer and techniques of statistical analysis will permit a t t a inmen t of th is goal with an unprecedented quan t i ty and accuracy of da ta . N o t only the s tudy of the broad practical aspects will be under taken, bu t physical causes for observed effects will be interpreted in as much detai l as pos-sible. This should eliminate some of t he broad scat ter of information from other investigations. For instance, weather has often been classified as fair or foul; we will subdivide foul weather into rain, fog, snow, and frost. Project E H V will t r y to establish correlation between labor-a tory and field results, part icularly for R1V (RI voltage) measurements , and to establish all t he reasons for 2 to 1 lower performance of conductors installed on lines compared with the same conductors tes ted in t he laboratory. In t he past , da ta on most experimental lines frequently have been obtained a t irregular t imes either th rough observat ion or recording on charts . Subsequent analysis of the da t a becomes very laborious because i t mus t first be converted into numerical form.
In Project E H V all da ta will be meas-ured, t ransmit ted , and processed auto-
lb-in = pound-inches lbs / f t = pounds per foot LL = l i n e to line mag = magnetic mc = megacycles meas = measurements mph = miles per hour ose = oscillograph par = parallel perp = perpendicular st = steel t e m p = temperature twrs = towers w d = laminated wood
matically. Since m a n y conditions be-yond the observers ' control influence t he da ta , cont inuous long-duration meas-urements are required to obtain answers which have statist ical significance. Fo r instance, R I m a y vary in t he ra t io of 30 to 1 as a result of weather , t ime of year, or day, etc. A stat ist ical distr ibution of R I versus t ime is required, not jus t t he average fair-weather or foul-weather values. Wi th such a statistical distribu-tion, i t will be possible t o m a k e meaning-ful predictions. Fo r instance, under ac-tua l conditions, R I will no t exceed a given value for 9 5 % of the to ta l t ime. Because of the stochastic na tu re of mos t experimental da ta , i t will be necessary to accumulate a quan t i ty of measure-ments in order to compare the perform-ance of different line configurations for instance. Therefore, da t a will be ac-quired automatical ly and simultaneously on all ins t ruments a t definite intervals of t ime. This is a broadening of t he concept first used in t he 500-kv tes t sta-t ion of Rheinau . 5 All quanti t ies of theoretical or practical interest will be measured for t h e determinat ion of t he electrical and mechanical performance of an E H V line. In addition, measure-ments of outside influences on this per-formance will be taken, e.g., t he quan t i ty and size of aerosols (small particles float-ing in the air) because they probably affect R I and corona loss.
A list of all t he measurements to be made on Project EHV, their location,
measurement t ime, range, and specified accuracy is given in Table I. A tota l of 267 measurements of 47 different types will be made, subdivided as follows: 133 (13 types) will be electrical, such as corona loss and R I which will be measured in 23 locations; 71 (11 types) will be me-chanical, such as aeolian vibrations, conductor, and tower stresses; and 63 (23 types) will be meteorological. They will be m a d e a t five tes t stat ions spaced fairly equally along the line (Fig. 1). Of t h e measurements , 158 will be made a t regular in tervals : every 20 minutes in fair weather and 2 minutes automati-cally in bad weather when preset limits are exceeded, or a t a n y t ime on demand, for a to ta l of about 10 million yearly. An automat ic digital system (Fig. 3) will be used to handle the da t a a t the lowest cost and with max imum accuracy.
T h e first link in the automat ic da ta acquisition system is the transducer, which converts the quant i ty being meas-ured into an electrical quan t i ty such as voltage, resistance, or switch position. Whenever the ou tpu t of the transducers is resistive, i t is converted to a d-c volt-age; for example, accelerometers, whose ou tpu t is a change of resistance, and ba-rometers where bellows ac tua te a potenti-ometer. Typical transducers with out-p u t in the form of a d-c voltage are the pyrheliometer for infrared measurement and radio-noise meters . In most cases t he transducers are accessible (as for t h e 23 R I meters) and are connected to t he da ta acquisition system by a system of shielded wires. In some cases the trans-ducers are located directly on the con-ductors of the E H V line and their out-pu t (as for some strain gages) is brought to ground by special radio telemetering equipment. This equipment is designed for operation from batteries which will be recharged every 30 days. I t will work in all the severe environmental conditions normally encountered in the Berkshires. T h e ou tpu t of the transducers changes very fast in some cases and very slowly
NORTH STATION I
( 3 ) ( 3 )
TAPE T A P E
READERS PUNCHES
TRANSDUCERS 00
TU ! Π
A - D
CONV.
SCANNER
11
A - D
CONV.
SCANNER
Fig. 3. Simplified block diagram of measure-ment and data acquisition system
J U L Y 1961 Abetti, Caverly, Davis, Whepley—Project EHV Transmission System 275
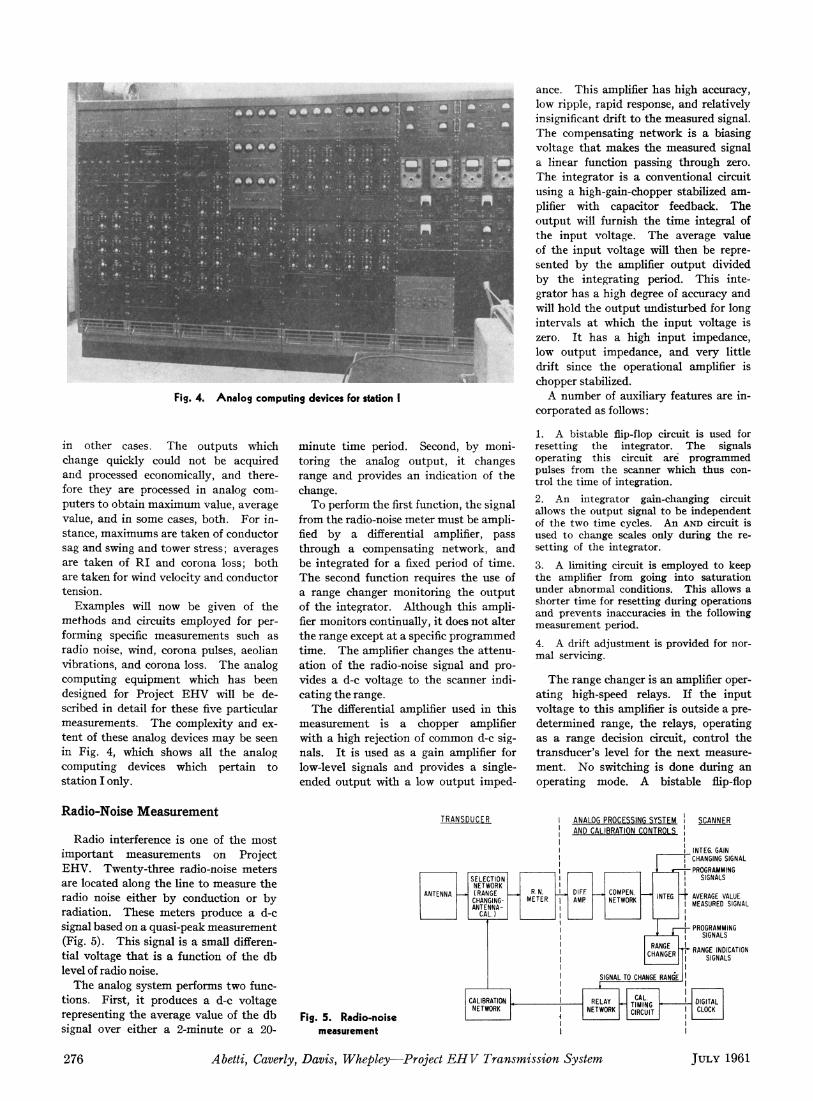
Fig. 4. Analog computing devices for station I
in other cases. T h e outpu ts which change quickly could not be acquired and processed economically, and there-fore they are processed in analog com-puters to obtain max imum value, average value, and in some cases, both. For in-stance, max imums are taken of conductor sag and swing and tower stress; averages are taken of R l and corona loss; both are taken for wind velocity and conductor tension.
Examples will now be given of the methods and circuits employed for per-forming specific measurements such as radio noise, wind, corona pulses, aeolian vibrations, and corona loss. T h e analog computing equipment which has been designed for Project E H V will be de-scribed in detail for these five part icular measurements . T h e complexity and ex-ten t of these analog devices m a y be seen in Fig. 4, which shows all t he analog computing devices which pertain to stat ion I only.
minu te t ime period. Second, by moni-toring the analog output , it changes range and provides an indication of the change.
T o perform the first function, the signal from the radio-noise meter mus t be ampli-fied by a differential amplifier, pass through a compensating network, and be integrated for a fixed period of t ime. T h e second function requires the use of a range changer monitoring the ou tpu t of t he integrator . Although this ampli-fier monitors continually, i t does not alter the range except a t a specific programmed t ime. T h e amplifier changes the a t tenu-at ion of t he radio-noise signal and pro-vides a d-c voltage to the scanner indi-cat ing the range.
T h e differential amplifier used in this measurement is a chopper amplifier with a high rejection of common d-c sig-nals. I t is used as a gain amplifier for low-level signals and provides a single-ended o u t p u t with a low ou tpu t imped-
ance. This amplifier ha s high accuracy, low ripple, rapid response, and relatively insignificant drift to the measured signal. T h e compensating network is a biasing voltage t h a t makes t he measured signal a linear function passing through zero. T h e integrator is a conventional circuit using a high-gain-chopper stabilized am-plifier with capacitor feedback. T h e ou tpu t will furnish the t ime integral of the input voltage. T h e average value of t he inpu t voltage will then be repre-sented by the amplifier ou tpu t divided by the integrat ing period. This inte-grator has a high degree of accuracy and will hold the ou tpu t undis turbed for long intervals a t which t he input voltage is zero. I t has a high inpu t impedance, low ou tpu t impedance, and very little drift since the operational amplifier is chopper stabilized.
A number of auxiliary features are in-corporated as follows:
1. A bistable flip-flop circuit is used for resetting the integrator. The signals operating this circuit are programmed pulses from the scanner which thus con-trol the time of integration.
2. An integrator gain-changing circuit allows the output signal to be independent of the two time cycles. An AND circuit is used to change scales only during the re-setting of the integrator.
3. A limiting circuit is employed to keep the amplifier from going into saturation under abnormal conditions. This allows a shorter time for resetting during operations and prevents inaccuracies in the following measurement period.
4. A drift adjustment is provided for nor-mal servicing.
T h e range changer is an amplifier oper-at ing high-speed relays. If t he input voltage to this amplifier is outside a pre-determined range, t h e relays, operating as a range decision circuit, control the transducer 's level for t h e next measure-ment . N o switching is done during an operating mode. A bistable flip-flop
Radio-Noise Measurement
Radio interference is one of the most impor tan t measurements on Project EHV. Twenty- three radio-noise meters are located along t h e line to measure t h e radio noise either b y conduction or by radiation. These meters produce a d-c signal based on a quasi-peak measurement (Fig. 5) . Th is signal is a small differen-tial voltage t h a t is a function of t he db level of radio noise.
T h e analog system performs two func-tions. First, i t produces a d-c voltage representing t h e average value of t he db signal over either a 2-minute or a 20-
TRANSDUCER
Fig. 5. Radio-noise measurement
SELECTION 1
NETWORK 1
ANTENNA (RANGE R. N. 1 , DIFF COMPEN. ANTENNA CHANGING-ANTENNA-
CAL.)
METER
! AMP NETWORK
CALIBRATION
NETWORK
ANALOG PROCESSING SYSTEM
AND CALIBRATION CONTROLS
RANGE
CHANGER
SIGNAL TO CHANGE RANGE
RELAY CAL.
TIMING CIRCUIT
! DIGITAL
NETWORK
CAL. TIMING CIRCUIT ! CLOCK
SCANNER
I NT EG. GAIN
CHANGING SIGNAL
-PROGRAMMING SIGNALS
AVERAGE VALUE
MEASURED SIGNAL
PROGRAMMING SIGNALS
RANGE INDICATION
SIGNALS
2 7 6 Abetti, Caverly, Davis, Whepley—Project EHV Transmission System J U L Y 1961

χ χ χ χ 0 χ χ 0 χ χ χ χ χ χ χ χ χ χ χ χ χ χ χ χ χ χ χ χ 0 χ
I
2 4 : 0 0
I
2 0 : 0 0
0 0 I
16 :00
I
1 2 : 0 0 0 0 0 0 χ χ χ χ χ χ χ χ 0 χ χ 0 0 χ χ I
0 8 0 0
0 0 0 0 0 0 I
0 4 : 0 0 χ
Fig. 6. Six-variable Veitch diagram For 4-hour determination
circuit p rogrammed by t h e scanner con-trols the switching function.
Radio-Noise-Meter Calibration
Since t he radio-noise meters can get ou t of al ignment for various reasons, e.g., t h e weakening of bias batteries, t hey m u s t be supplied with some s tandard signal to provide a periodic calibration. Th i s calibration signal will replace t he normal signal received a t t he antenna .
Referring t o Fig. 5, the requirements for t he calibration t iming circuit are t h a t : (1) it be tu rned on a t selected t imes during a 24-hour period; (2) i t remain on for 2 or 20 minu tes ; and (3) t h a t i t permi t t he calibration equipment to be tu rned on in synchronization with t he integra-tors .
In Fig. 5, a relay network is shown following t h e calibration t iming circuit. T h e purpose of th i s ne twork is to as-semble in one package t h e functions: (1) selection of t he 2- or 20-minute out-p u t of t h e t iming circuit, (2) t h e final co-ordination of t he calibration t iming circuit with t h e integrators , and (3) t h e selection of a range-changing signal ( + 4 8 volts direct current) or a calibration t im-ing signal (—48 volts direct current ) . T h e digital clock was selected t o provide t he t ime base for t h e t iming circuit. Th i s was t h e na tu ra l selection since t he integrators r u n from th is clock a n d i ts use satisfied the need for some external means of synchronization.
T h e radio-noise meters are cal ibrated every 4 hours when the system is in opera-t ion. When the 20-minute t ime cycle of operat ion is in effect, t he first 20-minu te period after t h e s ta r t of t he hour is used. T h e problem is somewhat com-plicated when t h e 2-minute cycle of operation is in effect, in t h a t t he first 2-minute period after t he s ta r t of t he hour cannot be used. T h e periods finally chosen were 0008-0010, 0408-0410, 0808-
0810, 1208-1210, 1608-1610, and 2008-2010.
T h e o u t p u t of t h e digital clock is binary-coded decimal. T h e o u t p u t lines of t h e clock are numbered and the t ime m a y be indicated by simply writing these numbers . T h e problem of design was simplified by dividing the problem into two pa r t s and combining the two solutions. T h e problem of turning on the calibration equipment every 4 hours can be solved first since i t is common to both t he 2- and 20-minute cycle. T h e me thod of design is to write t he t ime in local form, transfer th i s logical form to a t r u th table wri t ten for t h e max imum number of variables, and then use a Veitch dia-gram to arrive a t t h e correct solution.
T h e hour ly o u t p u t of the clock can be defined by t h e following l ines:
Output(hours) =f0 (lines Η, I, J, K, L, M) (1)
This means t h a t any one of the 24 hours can be defined by the presence of one or more of the variables in equation 1. If t he b inary number 1 is assigned to the lines when a potent ial of + 6 volts is present and binary number 0 is as-signed when no voltage is present, the t ime of the day can be wri t ten as follows.
0400 = / = 0 0 1 0 0 0 0 8 0 0 = # = 0 0 0 1 0 0 1200=7, L=010010 1600=/ , £,=011010 2000 = i f=000001 2 4 0 0 = / , ikf=001001 (2)
T h e b inary t r u t h table for six variables was prepared along with the logical form of each of t h e 24 hours . Since six vari-ables produce a 64-element t r u t h table, there are 58 combinat ions left after the desired 6 calibration hours are noted. Eighteen of t h e 58 combinations are the remaining 18 hours of t he day. How-ever, these hours are no t desired as cali-brat ing periods, t h u s the 18 possibilities form t h e so-called "forbidden combina-t ions ." T h e remaining 40 combinations comprise t h e "redundancies ," meaning t h a t they can be used for simplification of t he ou tpu t functions.
T h e t r u t h table is now transferred to a 6-variable Veitch diagram in which t h e numbers in equat ion 1 are equated to let ters. Th i s is shown in Fig. 6. T h e desired 4-hour calibration periods are marked with their hours. T h e circles
indicate the 18 forbidden combinations and the X's are the redundancies.
Using the combination rules of Boolean algebra, the ou tpu t for the 4-hour calibra-tion period is*
Output(4_hour) =ΪΪΊ-Ζ+Π'Ι·Σ _ = # ( / · £ , + / · £ ) (3)
where the bar over t he let ter indicates the NOT function; t h e dots show t h a t t he relay contacts indicated by the letters should be connected in series; and the -f-'s indicate t h a t t he relay contacts should be connected in parallel.
If a circuit were to be fabricated on the basis of equat ion 3, t he calibration period would last an entire hour—an undesirable condition. Now, a solution of a circuit m u s t be found which would be active for only a 2- or 20-minute period. When this circuit is combined with the one just solved, t he desired calibration t iming circuit will fulfill t he first two requirements. T h e method of solution is very similar to t he one used for the 4-hour determinat ion and will no t be shown here.
Output (20-min) — F-G
Output (2_min) =D'E'F'G
(4)
(5)
By combining equations 3 and 4, the t iming circuit will be active for a period of 20 minutes every 4 hours as indicated by the subscript. T h e ou tpu t is :
Output (4 20—min) = H'(I'L+1.L)+F'G (6)
T h e combination of equations 3 and 5 will provide an ou tpu t t h a t is active for 2 minutes every 4 hours as indicated by the subscript. T h e ou tpu t i s :
Output( 4 2-min) = R'(I'L + /·!) + D'E-FG (7)
Relays with C-type contacts will im-plement t he Boolean expressions. The letters in equat ions 6 and 7 are ou tpu t lines from the clock; therefore the coil of the relay would be energized if the line is active. T h e normally closed contact of the relay would be designated with the NOT notat ion (A, B, C . . L) and the open contact with t he normal notat ion (A,B, C...L).
Fig. 7 is derived from equations 6 and 7. T h e coil of each relay is energized from the o u t p u t line of the digital clock which corresponds to the letter indicated
EVERY 4 HOURS FOR 2 MINUTES
OUTPUT
Fig. 7. Calibration circuit
timing INPUT (-48 V )
ο
EVERY 4 HOURS FOR 20 MINUTES
fH f l JT^ t G ^
J U L Y 1 9 6 1 Abetti, Caverly, Davis, Whepley—Project EHV Transmission System 277
TIME-CYCLE RELAY
2 MIN.
INPUT
20 MIN. ο—
CLOCK RELAY
XT
-48 V POWER SUPPLY
INTEGRATOR RELAY
SELECTION RELAY
Fig. 8.
π t i
Calibration
circuit
INPUT FROM INTEGRATORS
OUTPUT (+ 48 V DC OR - 48 V DC )
INPUT FROM RANGE-CHANGING-MECHANISM ( + 48 V DC )
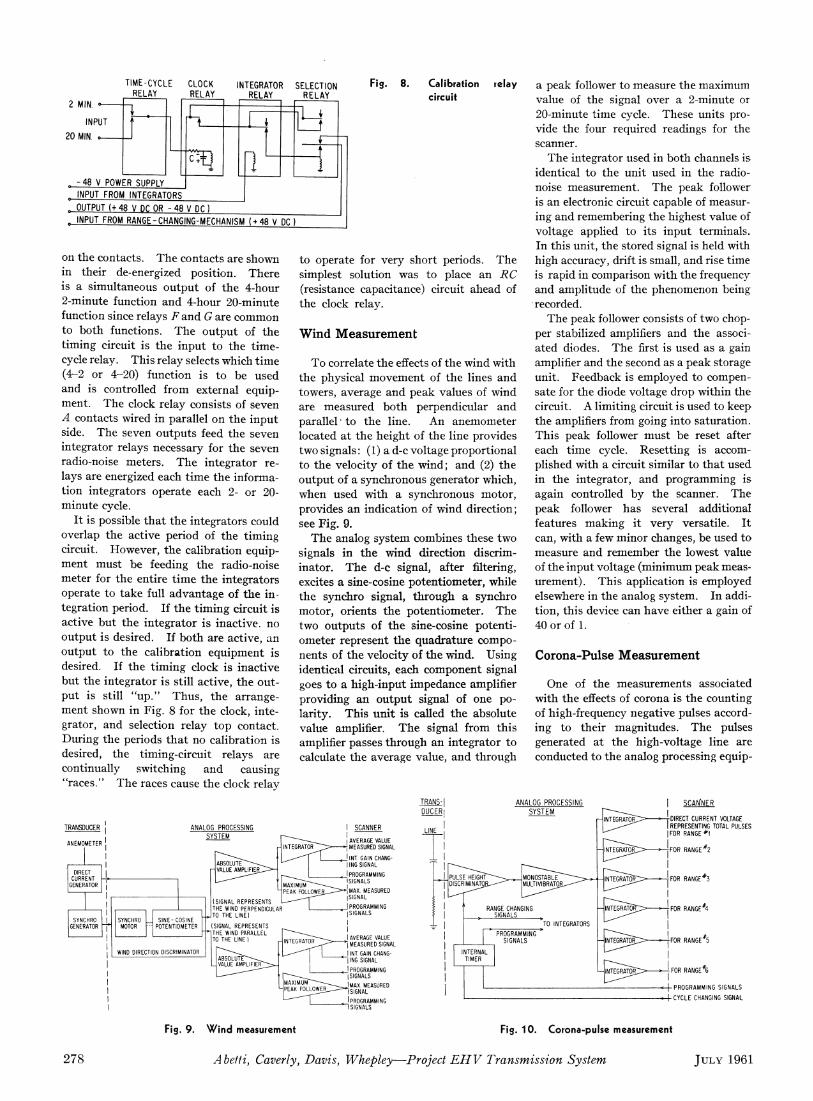
on the contacts . T h e contacts are shown in their de-energized posit ion. The re is a s imultaneous ou tpu t of t h e 4-hour 2-minute function and 4-hour 20-minute function since relays F and G are common to bo th functions. T h e o u t p u t of t h e t iming circuit is the input to the t ime-cycle relay. Th i s relay selects which t ime (4-2 or 4-20) function is to be used and is controlled from external equip-ment. T h e clock relay consists of seven A contacts wired in parallel on t he inpu t side. T h e seven ou tpu t s feed t he seven integrator relays necessary for the seven radio-noise meters . T h e integrator re-lays are energized each t ime the informa-tion integrators operate each 2- or 20-minute cycle.
I t is possible t h a t t h e integrators could overlap the active period of the t iming circuit. However, t he calibration equip-ment mus t be feeding t he radio-noise meter for t h e ent ire t i m e t h e integrators operate to t ake full advan tage of t h e in-tegration period. If t he t iming circuit is active bu t the in tegra tor is inact ive, no ou tpu t is desired. If bo th are active, an ou tpu t to t h e cal ibrat ion equ ipment is desired. If t he t iming clock is inact ive but the in tegra tor is still active, t h e out -pu t is still " u p . " T h u s , t h e arrange-men t shown in Fig. 8 for t h e clock, inte-grator, and selection relay t o p contact . During the periods t h a t no cal ibrat ion is desired, the timing-circuit relays are continually switching and causing "races ." T h e races cause t he clock relay
ANALOG PROCESSING SYSTEM
to operate for very shor t periods. T h e simplest solution was to place an RC (resistance capacitance) circuit ahead of the clock relay.
Wind Measurement
T o correlate t he effects of the wind with the physical movement of t he lines and towers, average and peak values of wind are measured bo th perpendicular and parallel · to t he line. An anemometer located a t t he height of the line provides two signals: (1) a d-c voltage proport ional to t h e velocity of t h e wind; and (2) t h e ou tpu t of a synchronous generator which, when used with a synchronous motor , provides an indicat ion of wind direction; see Fig. 9 .
T h e analog system combines these two signals in t h e wind direction discrim-inator . T h e d-c signal, after filtering, excites a sine-cosine potent iometer , while the synchro signal, th rough a synchro motor , orients t h e potent iometer . T h e two ou tpu t s of t h e sine-cosine potent i -ometer represent t h e quadra ture compo-nents of t h e velocity of t h e wind. Using identical circuits, each component signal goes to a high-input impedance amplifier providing an ou tpu t signal of one po-lari ty. This un i t is called t h e absolute value amplifier. T h e signal from this amplifier passes through an integrator to calculate t he average value, and through
relay a peak follower to measure the maximum value of the signal over a 2-minute or 20-minute t ime cycle. These uni ts pro-vide the four required readings for the scanner.
T h e integrator used in both channels is identical to the uni t used in the radio-noise measurement . T h e peak follower is an electronic circuit capable of measur-ing and remembering the highest value of voltage applied to its input terminals . In this unit , the stored signal is held with high accuracy, drift is small, and rise t ime is rapid in comparison wi th the frequency and ampli tude of the phenomenon being recorded.
The peak follower consists of two chop-per stabilized amplifiers and the associ-ated diodes. T h e first is used as a gain amplifier and the second as a peak storage unit . Feedback is employed to compen-sate for the diode voltage drop within the circuit. A limiting circuit is used to keep the amplifiers from going into saturat ion. Th i s peak follower mus t be reset after each t ime cycle. Reset t ing is accom-plished with a circuit similar to t h a t used in the integrator, and programming is again controlled by the scanner. T h e peak follower ha s several additional features making i t very versatile. I t can, with a few minor changes, be used t o measure and remember the lowest value of the input voltage (minimum peak meas-urement) . Th i s application is employed elsewhere in the analog system. In addi-t ion, th is device can have either a gain of 40 or of 1.
Corona-Pulse Measurement
One of the measurements associated with the effects of corona is t he counting of high-frequency negat ive pulses accord-ing to thei r magni tudes . T h e pulses generated a t the high-voltage line are conducted to the analog processing equip-
TRANS-
DUCER
DIRECT CURRENT
GENERATOR
ι AVERAGE VALUE MEASURED SIGNAL
SYNCHRO SINE-COSINE MOTOR POTENTIOMETER
WIND DIRECTION DISCRIMINATOR
I AVERAGE VALUE "j MEASURED SIGNAL I INT. GAIN CHANG-
ANALOG PROCESSING
S Y S T E M
I SCAN'NER
TDIRECT CURRENT VOLTAGE I REPRESENTING TOTAL PULSES I FOR RANGE # 1
FOR RANGE # 2
PROGRAMMING SIGNALS
\- CYCLE CHANGING SIGNAL
Fig. 9. W ind measurement Fig. 10. Corona-pulse measurement
2 7 8 Abetti, Caverly, Davis, Whepley—Project EHV Transmission System J U L Y 1961
ACCELEROMETER AND TELEMETERING TRANS-MITTER
TRANSDUCER SCANNER
Fig. 1 1 . Aeolian vibration measurement Fig. 12. Corona-loss measurement
merit by a capacitor-resistor divider. T h e processing equipment counts t he number of pulses within specified vol tage l imits . These l imits are 0-50, 50-100, 100-200, 200-300, 300-400, 400-500. Th i s produces six d-c voltage ou tpu t s which correspond to t he to ta l number of pulses counted in each group. Each magn i tude range h a s i ts own ra te of rep-et i t ion. Thus , the counting period for each group is made inversely proport ional to t he m a x i m u m average repeti t ion rate , making t h e maximum o u t p u t level the same for each counter.
T h e process equipment consists of a pulse height discriminator (magnitude range selector), a monostable-mult ivi-brator , six integrators , and an internal t iming device (Fig. 10). T h e pulse height discriminator controls the range selection for the counting of different magni tude pulses. T h e discriminator produces an o u t p u t pulse which triggers a monostable-mult ivibrator for each pulse detected in t he selected range. T h e mult ivibrator ' s o u t p u t is passed through a "cl ipper" circuit and then directed t o an integrator . An in ternal t iming circuit co-ordinates the selection of an integrator with the corresponding magni tude range of the pulse height discriminator. T h e t imer also controls the resett ing functions of the equipment after each period of operat ion. T h e program signals from the scanner control t he in ternal t iming circuit to synchronize t he operat ion of t he measurement with the scanner.
Since t he corona pulse system's entire operat ion for one measurement period is 2 minutes , i t operates continuously when the scanner is on a 2-minute cycle a n d only during the last 2 minutes of a 20-minute cycle.
T h e pulse height discriminator, using two Schmit t triggers, sets t he upper and lower l imits of the magni tude range. T h e ou tpu t of these circuits, working into an anticoincidence circuit, produces an out-pu t signal dependent on the input signal and the magni tude range sett ing. T h e
integrators are basically the same as those used in the radio-noise measurement . T h e y do no t require extra circuits for programming and integrator gain chang-ing since the internal t imer controls t he t ime function. T h e internal t imer con-sists of two mechanical t imers , the first delays the measurement for 18 minutes on a 20-minute cycle and the second con-trols t he t ime cycle of t he operation.
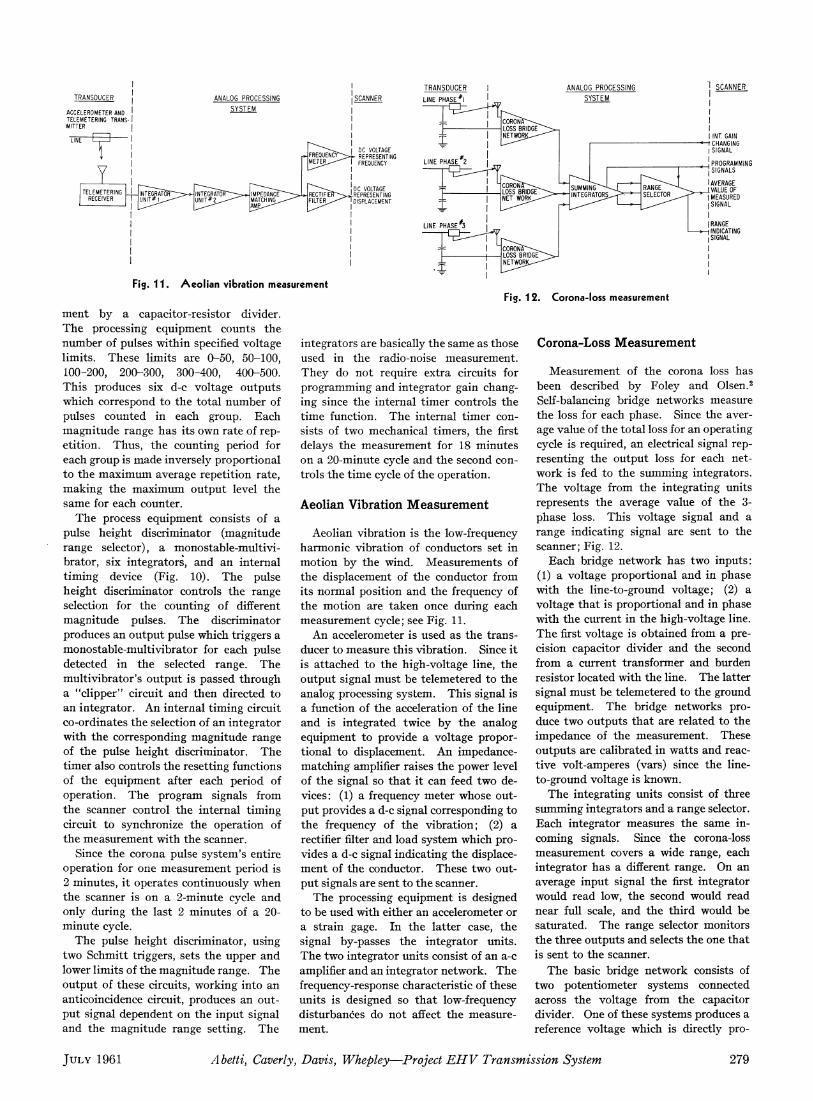
Aeolian Vibration Measurement
Aeolian vibrat ion is t h e low-frequency harmonic vibrat ion of conductors set in mot ion by the wind. Measurements of the displacement of t he conductor from its normal posit ion and the frequency of the mot ion are taken once during each measurement cycle; see Fig. 11.
An accelerometer is used as t he t rans -ducer to measure th is vibrat ion. Since i t is a t tached to the high-voltage line, the o u t p u t signal m u s t be telemetered to the analog processing system. Th is signal is a function of the acceleration of t he line and is integrated twice by t h e analog equipment to provide a voltage propor-t ional to displacement. An impedance-matching amplifier raises t he power level of the signal so t h a t i t can feed two de-vices: (1) a frequency meter whose out-pu t provides a d-c signal corresponding to t h e frequency of t he vibrat ion; (2) a rectifier filter and load system which pro-vides a d-c signal indicat ing t he displace-men t of t he conductor. These two out-pu t signals are sent to t h e scanner.
T h e processing equipment is designed to be used with either an accelerometer or a s train gage. In t he la t ter case, t he signal by-passes t he integrator uni ts . T h e two integrator uni ts consist of an a-c amplifier and an integrator network. T h e frequency-response characteristic of these uni ts is designed so t h a t low-frequency disturbances do n o t affect the measure-ment .
Corona-Loss Measurement
Measurement of the corona loss has been described by Foley and Olsen. 2
Self-balancing bridge networks measure the loss for each phase. Since the aver-age value of the to ta l loss for an operat ing cycle is required, an electrical signal rep-resenting the ou tpu t loss for each net-work is fed to the summing integrators. T h e voltage from the integrat ing units represents t he average value of the 3-phase loss. This voltage signal and a range indicat ing signal are sent to the scanner; Fig. 12.
Each bridge network has two inputs : (1) a voltage proport ional and in phase with the line-to-ground voltage; (2) a voltage t h a t is proport ional and in phase with t he current in the high-voltage line. T h e first voltage is obta ined from a pre-cision capacitor divider and the second from a current transformer and burden resistor located with the line. T h e lat ter signal mus t be telemetered to the ground equipment. T h e bridge networks pro-duce two ou tpu t s t h a t are related to the impedance of the measurement . These ou tpu t s are calibrated in wat t s and reac-t ive volt-amperes (vars) since the line-to-ground voltage is known.
T h e integrat ing uni ts consist of three summing integrators and a range selector. Each integrator measures the same in-coming signals. Since the corona-loss measurement covers a wide range, each integrator ha s a different range. On an average input signal the first integrator would read low, the second would read near full scale, and the th i rd would be saturated. T h e range selector monitors t he three ou tpu ts and selects t he one t h a t is sent to the scanner.
T h e basic bridge network consists of two potent iometer systems connected across the voltage from the capacitor divider. One of these systems produces a reference voltage which is directly pro-
J U L Y 1961 Abetti, Caverly, Davis, Whepley—Project EHV Transmission System 279
A N A L O G Y INPUTS | = *
CONTROL SI6NALS
TO ANALOG DEVICES
CLOCK AND
CALENDAR
DIGITAL
SCANNER
CLOCK AND
CALENDAR
DIGITAL
SCANNER
ANALOG SCANNER
J l
ATTENUATOR AND
SCALER
D I F F E R -ENTIAL
AMP
PROGRAMMER b ~
ANALOG -DIGITAL
CONVERTER
Fig. 13. Block dia-gram of 310 data acquisition system
OUTPUT-
CONTROL
REMOTE P A P E R TAPE
PUNCH
HIGH OR LOW LIMIT SETT INGS FOR 2 OR 2 0 MINUTE SCAN RATE
portional to the line-to-ground voltage.
T h e other system produces a reference
voltage which is 90 degrees out of phase
with t h e l ine-to-ground voltage. T h e
voltage t h a t is te lemetered from t h e cur-
rent transformer is complex and consists
of real and quadra ture components rela-
t ive to t h e l ine-to-ground voltage. When
the bridge ne twork is balanced, por t ions
of t he voltages across t h e potent iometers
are chosen to construct a voltage exactly
equal in magni tude b u t opposi te in phase
to t h e voltage from t h e current . T h e
position of these potent iometers indicates
the wa t t s loss and vars in the phase. T h e
summing integrators m u s t change gain
for t he two t ime cycles. Program signals
from t h e scanner are used by the integra-
tors and the range selector for all t ime
functions.
Data Acquisition System
For all t h e 158 measurements to be
processed automatical ly, analog ou tpu t s
are available a t s tat ions I, I I I , and V.
T h e General Electric Company 310 d a t a
acquisition systems will be used to com-
pile th is information in digital form on
paper t ape and on typed log sheets a t
s tat ion I.
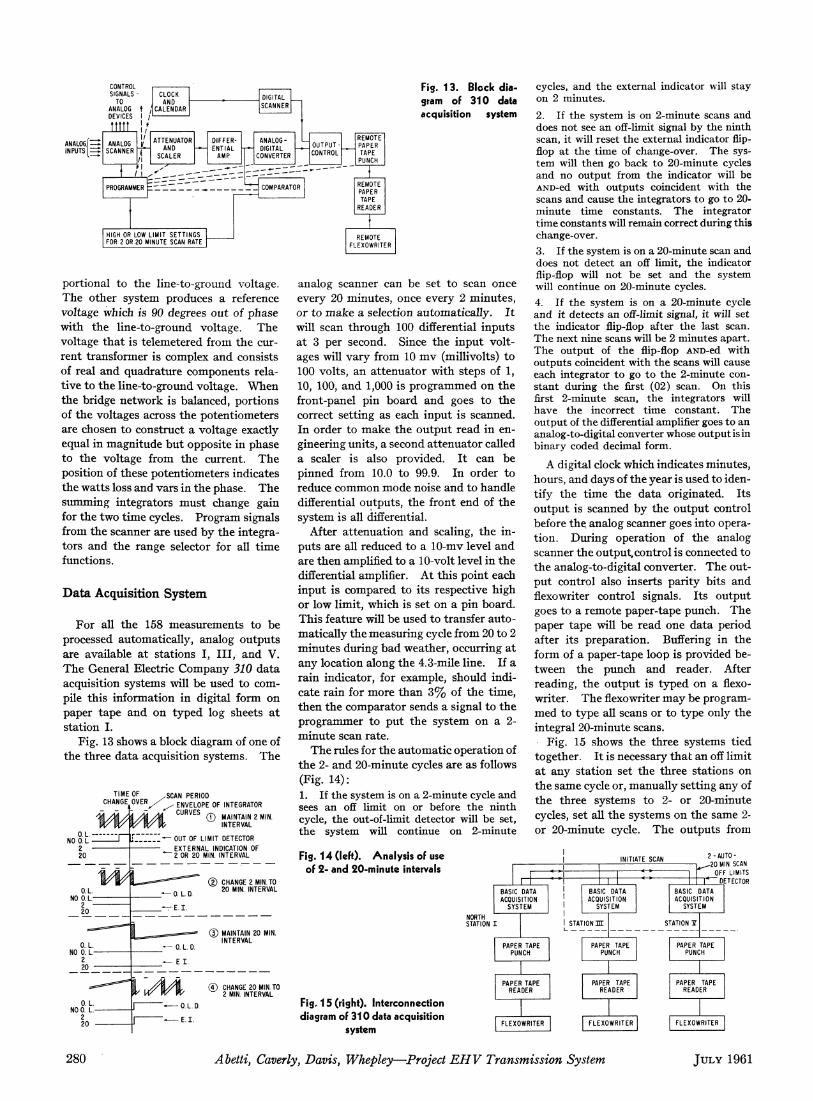
Fig. 13 shows a block diagram of one of
the three da t a acquisition systems. T h e
SCAN PERIOD
ENVELOPE OF INTEGRATOR
MAINTAIN 2 MIN.
INTERVAL
© CHANGE 2 0 MIN. TO 2 MIN. INTERVAL
REMOTE PAPER TAPE
READER
REMOTE FLEXOWRITER
analog scanner can be set to scan once
every 20 minutes , once every 2 minu tes ,
or to m a k e a selection automatical ly . I t
will scan th rough 100 differential inpu t s
a t 3 per second. Since t h e i npu t volt-
ages will va ry from 10 m v (millivolts) to
100 vol ts , an a t t enua to r with steps of 1,
10, 100, and 1,000 is p rog rammed on t h e
front-panel pin board and goes to t h e
correct set t ing as each inpu t is scanned.
In order to m a k e t h e o u t p u t r ead in en-
gineering uni ts , a second a t t enua to r called
a scaler is also provided. I t can be
pinned from 10.0 to 99.9. In order to
reduce common mode noise and to handle
differential ou tpu ts , t he front end of t he
system is all differential.
After a t tenua t ion and scaling, t h e in-
pu ts are all reduced to a 10-mv level and
are t hen amplified to a 10-volt level in t h e
differential amplifier. A t th is point each
inpu t is compared to i ts respective high
or low l imit , which is set on a pin board.
Th i s feature will be used to transfer au to-
matical ly t h e measur ing cycle from 20 to 2
minu tes during bad weather , occurring a t
any location along the 4.3-mile line. If a
ra in indicator, for example, should indi-
cate ra in for more t h a n 3 % of t h e t ime ,
t hen t h e compara tor sends a signal to t h e
p rogrammer to p u t t he system on a 2-
minu te scan ra te .
T h e rules for t h e au toma t i c operat ion of
t h e 2- and 20-minute cycles are as follows
(Fig. 14):
1. If the system is on a 2-minute cycle and sees an off limit on or before the ninth cycle, the out-of-limit detector will be set, the system will continue on 2-minute
Fig. 14 (left). Analysis of use of 2- and 20-minute intervals
cycles, and the external indicator will stay on 2 minutes.
2. If the system is on 2-minute scans and does not see an off-limit signal by the ninth scan, it will reset the external indicator flip-flop at the time of change-over. The sys-tem will then go back to 20-minute cycles and no output from the indicator will be AND-ed with outputs coincident with the scans and cause the integrators to go to 20-minute time constants. The integrator time constants will remain correct during this change-over.
3. If the system is on a 20-minute scan and does not detect an off limit, the indicator flip-flop will not be set and the system will continue on 20-minute cycles.
4. If the system is on a 20-minute cycle and it detects an off-limit signal, it will set the indicator flip-flop after the last scan. The next nine scans will be 2 minutes apart. The output of the flip-flop AND-ed with outputs coincident with the scans will cause each integrator to go to the 2-minute con-stant during the first (02) scan. On this first 2-minute scan, the integrators will have the incorrect time constant. The output of the differential amplifier goes to an analog-to-digital converter whose output is in binary coded decimal form.
A digital clock which indicates minutes ,
hours, and days of t he year is used to iden-
tify the t ime the da t a originated. I t s
ou tpu t is scanned by t h e ou tpu t control
before t h e analog scanner goes into opera-
t ion. Dur ing operat ion of t he analog
scanner t h e output , control is connected to
t he analog-to-digital converter. T h e out-
pu t control also inserts par i ty bi ts and
flexowriter control signals. I t s ou tpu t
goes to a remote paper- tape punch. T h e
paper t ape will be read one da ta period
after i ts prepara t ion. Buffering in the
form of a paper- tape loop is provided be-
tween the punch and reader. After
reading, the ou tpu t is t yped on a flexo-
writer. T h e flexowriter m a y be program-
med to type all scans or to type only the
integral 20-minute scans.
Fig. 15 shows the three systems t ied
together. I t is necessary t h a t an off l imit
a t any s ta t ion set t he three s ta t ions on
the same cycle or, manual ly sett ing any of
the three systems to 2- or 20-minute
cycles, set all t h e sys tems on the same 2-
or 20-minute cycle. T h e ou tpu t s from
2 - AUTO -
^ 2 0 MIN SCAN
OFF LIMITS
1 DETECTOR
BASIC DATA ACQUISITION
S Y S T E M
BASIC DATA ACQUISITION
SYSTEM
BASIC DATA ACQUISITION
SYSTEM
Fig. 15 (right). Interconnection diagram of 310 data acquisition
system
I I S T A T I O N S ι
STATION Y
PAPER TAPE PUNCH
PAPER TAPE PUNCH
PAPER TAPE PUNCH
I I I P A P E R TAPE
READER PAPER TAPE
READER PAPER TAPE
READER
280 Abetti, Caverly, Davis, Whepley—Project EHV Transmission System J U L Y 1 9 6 1
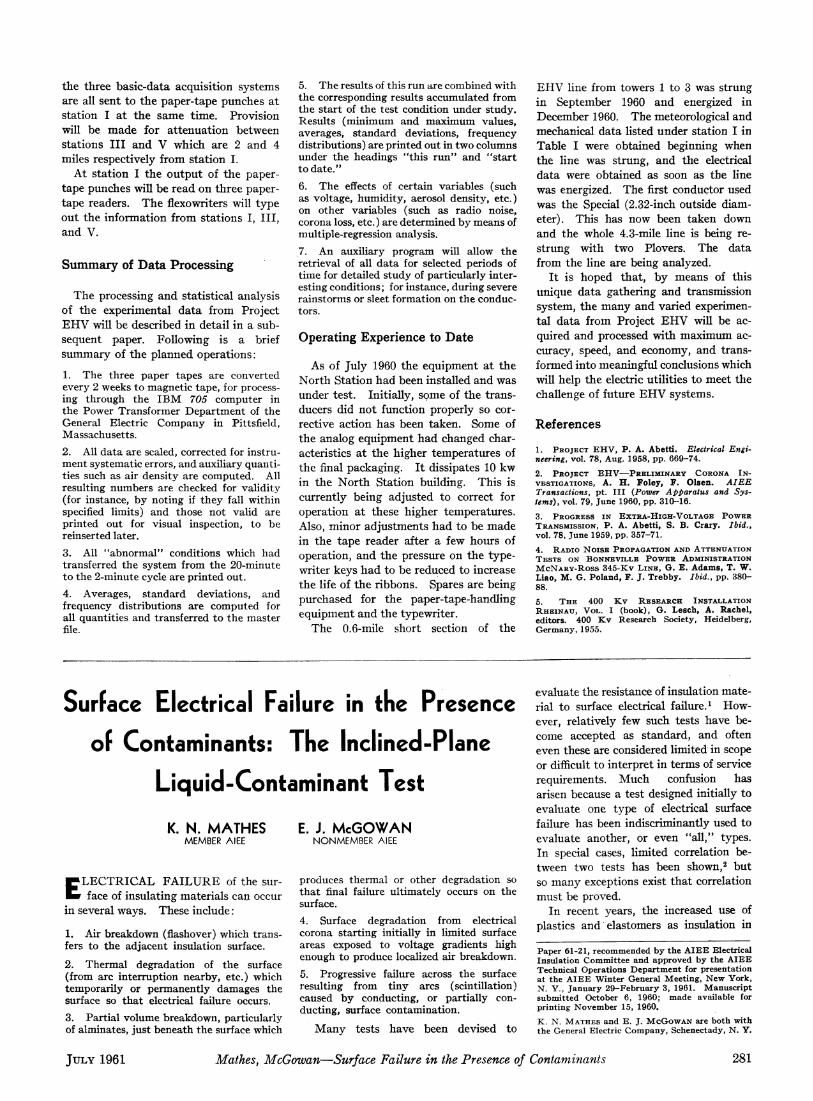
the three basic-data acquisition systems are all sent to t h e paper- tape punches a t stat ion I a t t he same t ime . Provision will be m a d e for a t t enua t ion between s ta t ions I I I and V which are 2 and 4 miles respectively from sta t ion I.
At s ta t ion I t he o u t p u t of t h e paper-tape punches will be read on th ree paper-tape readers. T h e flexowriters will t ype ou t t he information from s ta t ions I, I I I , and V.
Summary of Data Processing
T h e processing and stat ist ical analysis of t h e experimental d a t a from Project E H V will be described in detai l in a sub-sequent paper. Following is a brief summary of t he p lanned operat ions:
1. The three paper tapes are converted every 2 weeks to magnetic tape, for process-ing through the IBM 705 computer in the Power Transformer Department of the General Electric Company in Pittsfield, Massachusetts.
2. All data are scaled, corrected for instru-ment systematic errors, and auxiliary quanti-ties such as air density are computed. All resulting numbers are checked for validity (for instance, by noting if they fall within specified limits) and those not valid are printed out for visual inspection, to be reinserted later.
3. All "abnormal" conditions which had transferred the system from the 20-minute to the 2-minute cycle are printed out.
4. Averages, standard deviations, and frequency distributions are computed for all quantities and transferred to the master file.
Κ. N. MATHES MEMBER AIEE
L E C T R I C A L F A I L U R E of the sur-' face of insulating materials can occur
in several ways. These include:
1. Air breakdown (flashover) which trans-fers to the adjacent insulation surface.
2 . Thermal degradation of the surface (from arc interruption nearby, etc.) which temporarily or permanently damages the surface so tha t electrical failure occurs.
3. Partial volume breakdown, particularly of alminates, just beneath the surface which
5. The results of this run are combined with the corresponding results accumulated from the start of the test condition under study. Results (minimum and maximum values, averages, standard deviations, frequency distributions) are printed out in two columns under the headings "this run" and "s tar t to date ."
6. The effects of certain variables (such as voltage, humidity, aerosol density, etc.) on other variables (such as radio noise, corona loss, etc.) are determined by means of multiple-regression analysis.
7. An auxiliary program will allow the retrieval of all data for selected periods of time for detailed study of particularly inter-esting conditions; for instance, during severe rainstorms or sleet formation on the conduc-tors.
Operating Experience to Date
As of Ju ly 1960 the equipment a t t h e Nor th Stat ion had been installed and was under tes t . Initially, some of t he t rans-ducers did no t function properly so cor-rective action has been taken. Some of t he analog equipment h a d changed char-acteristics a t t he higher tempera tures of the final packaging. I t dissipates 10 kw in t h e N o r t h Stat ion building. Th i s is currently being adjusted to correct for operation a t these higher temperatures . Also, minor adjustments h a d to be m a d e in t he t ape reader after a few hours of operation, and t h e pressure on the type-writer keys h a d to be reduced to increase the life of t h e ribbons. Spares are being purchased for t he paper-tape-handling equipment and the typewriter .
T h e 0.6-mile short section of the
E. J. McGOWAN NONMEMBER AIEE
produces thermal or other degradation so tha t final failure ultimately occurs on the surface.
4. Surface degradation from electrical corona starting initially in limited surface areas exposed to voltage gradients high enough to produce localized air breakdown.
5. Progressive failure across the surface resulting from tiny arcs (scintillation) caused by conducting, or partially con-ducting, surface contamination.
M a n y tests have been devised to
E H V line from towers 1 to 3 was strung in September 1960 and energized in December 1960. The meteorological and mechanical da ta listed under station I in Table I were obtained beginning when the line was strung, and the electrical da ta were obtained as soon as the line was energized. The first conductor used was the Special (2.32-inch outside diam-eter) . This has now been taken down and the whole 4.3-mile line is being re-s t rung with two Plovers. The da ta from the line are being analyzed.
I t is hoped t ha t , by means of this unique da ta gathering and transmission system, t he m a n y and varied experimen-ta l da t a from Project E H V will be ac-quired and processed with maximum ac-curacy, speed, and economy, and t rans-formed into meaningful conclusions which will help t he electric uti l i t ies to meet the challenge of future E H V systems.
References
1. PROJECT E H V , P . A. Abetti . Electrical Engi-neering, vol . 78, Aug. 1958, pp. 669-74 .
2. PROJECT EHV—PRELIMINARY CORONA IN-VESTIGATIONS, A. H . Foley , F . Olsen . AIEE Transactions, pt . I l l (Power Apparatus and Sys-tems), vol. 79, June 1960, pp. 310-16 .
3. PROGRESS IN EXTRA-HIGH-VOLTAGE POWER TRANSMISSION, P . A. Abetti , S . B . Crary. Ibid., vol. 78, June 1959, pp. 3 5 7 - 7 1 .
4. RADIO NOISE PROPAGATION AND ATTENUATION TESTS ON BONNEVILLE POWER ADMINISTRATION MCNARY-ROSS 345-KV LINE, G . E . Adams , T. W . Liao, M. G . Poland, F. J . Trebby. Ibid., pp. 3 8 0 -88.
5. THE 400 K v RESEARCH INSTALLATION RHEINAU, VOL. I (book), G . Lesch, A. Rachel , editors. 400 K v Research Society, Heidelberg, Germany, 1955.
evaluate the resistance of insulation mate -rial to surface electrical failure. 1 How-ever, relatively few such tests have be-come accepted as s tandard, and often even these are considered limited in scope or difficult to interpret in t e rms of service requirements. Much confusion has arisen because a test designed initially to evaluate one type of electrical surface failure has been indiscriminantly used to evaluate another, or even "a l l , " types. In special cases, limited correlation be-tween two tests has been shown, 2 bu t so m a n y exceptions exist t h a t correlation mus t be proved.
In recent years, the increased use of plastics and elastomers as insulation in
Paper 61-21, recommended b y the A I E E Electrical Insulation Commit tee and approved b y the A I E E Technical Operations Department for presentation at the A I E E Winter General Meet ing , N e w York, Ν . Y. , January 29 -February 3, 1961. Manuscript submitted October 6, 1960; made available for printing November 15, 1960.
Κ . N . MATHES and E. J. MCGOWAN are both with the General Electric Company , Schenectady, Ν . Y.
Surface Electrical Failure in the Presence
of Contaminants: The Inclined-Plane
Liquid-Contaminant Test
J U L Y 1961 Mathes, McGowan—Surface Failure in the Presence of Contaminants 281