data management and role of big-data - wordpress.com · · 2016-02-16data management and role of...
TRANSCRIPT

Data Management and
Role of Big-datain Maritime Situational
Awareness
Jacob Wiegand Clausen
Marorka, Head of Advisory
12 Feb 2016, Helsinki

MARORKAFacts & Figures
We are the leading global provider of data-driven energy management solutions for the maritime industry.
Established in: 2002
Head office: Reykjavik, (IS)Global presence: Copenhagen (DK)
Hamburg (DE)Athens (GR)Singapore (SG)Dubai (AE)Busan (KOR)
Planning to open offices in Shanghai and Houston in 2016/2017.
No. of Data Systems installed: > 500 (since 2002)

HYPE CYCLE FOR EMERGING TECHNOLOGIES- BIG DATA IS ON EDGE OF INFLATED EXPECTATIONS …
Source: Gartner (August 2014)

BIG DATA IN MARITIME BUSINESS Data and analytics revolutionizing shipping

Development in using and analysing data
WHAT IS BIG DATA AND HOW DOES IT LOOK IN THE SHIPPING INDUSTRY?
2010 -
Very large, unstructured or fast-moving data
2005 - 2010
Focus on statistical and mathematical analysis for
decisions
1989 - 2005
Tools to support data driven decisions, with emphasis on reporting
1990 - 2000
Software for analyzing multidimensional data tables
1980 - 1990
Focus on data analysis for decisions by senior executives
1970 - 1985
Use of data analysis to support decision making
Sources: Davenport (2014) and IBM Institute for Business Value and the Saïd Business
School at the University of Oxford (2012)
Ad
va
nce
in
an
aly
tics Velocity
Vo
lum
e
BIG DATA
Volume
Velocity
Variety
Performance data = Big Data?
Shipping industry started collecting data
within Performance Management. The
solutions has developed from simple
noon reports to become realtime auto-
logged data.
Real-time or fast-
moving data need to
be analyzed quickly
Too large to store
and analyze using
traditional databases
Different types of
structured and
unstructured data
Noon-report Auto-logged
20-50 tags
10-100 kb/day
20-100 tags
1-8 MB/day
Daily report
24 h
Onboard
5-15 s
On shore
15 min
Manual
entries
Automation
systems,
Sensors,
Equipment
Performance data in shipping

DATA AND ANALYTICS
Regulations & Compliance Operational efficiency
Business decisionsMarket differentiator
Real-time Data
BWMC Speed
Real time data management & analytics are becoming an indispensable prerequisite
for maritime businesses to remain competitive under tightening market conditions.
.. is key for becoming leader in the maritime business

What is it all about?DATA DRIVEN ENERGY MANAGEMENT
Reduce energy/fuel consumption
Bring down cost & waste
Increase productivity,
Improve profitability
Enhance competitiveness.
Key benefits:
Trim optimization
Hull performance
Speed profile optimization
Propeller
performance
Efficient machinery operation
Optimized bunker, ROB
and emissions control
ENERGY MANAGEMENT encompasses all measures, processes and tools to improve energy efficiency of shipping operation

MARORKA SOLUTIONData, analytics and decision support

MARORKA SERVER
MARORKA SPM
DATA AQUISITION UNITS
MARORKA ONLINE SERVER
MARORKA ONLINE
MARORKA ONLINE ODATA API
MARORKA ONBOARD
DATA FLOWFrom sensor data to Marorka Online via Marorka Onboard
REMOTE CONNECTION
DASHBOARD +WALLBOARD
SHIPSSAT-COM
HOSTINGPARTNER
Automation System, Bridge System, Loading Computer, ECDIS, shaft meter, anemomenter, speed log, etc.

DATA INTEGRITYBuilding knowledge from data
Knowledge
Information
Operational Data
Data
Availability
Data
Reliability
Data
Accuracy
Performance System
Systems and processes must
be in place for proper data
collection and monitoring
Governance and leadership
Clear ownership, roles and
responsibilities to ensure
accountability for data quality
People and skills
Train people so they have
appropriate knowledge and
competencies for their role
Provide feedback from the data
Focus on data usage by
providing value from good data
and feedback from bad data

ONBOARD OPTIMIZATION APPLICATIONSEnhancing onboard decision to reduce emissions
Speed , Trim and Auxiliary optimization Propulsion optimization
Voyages optimization Engine optimization
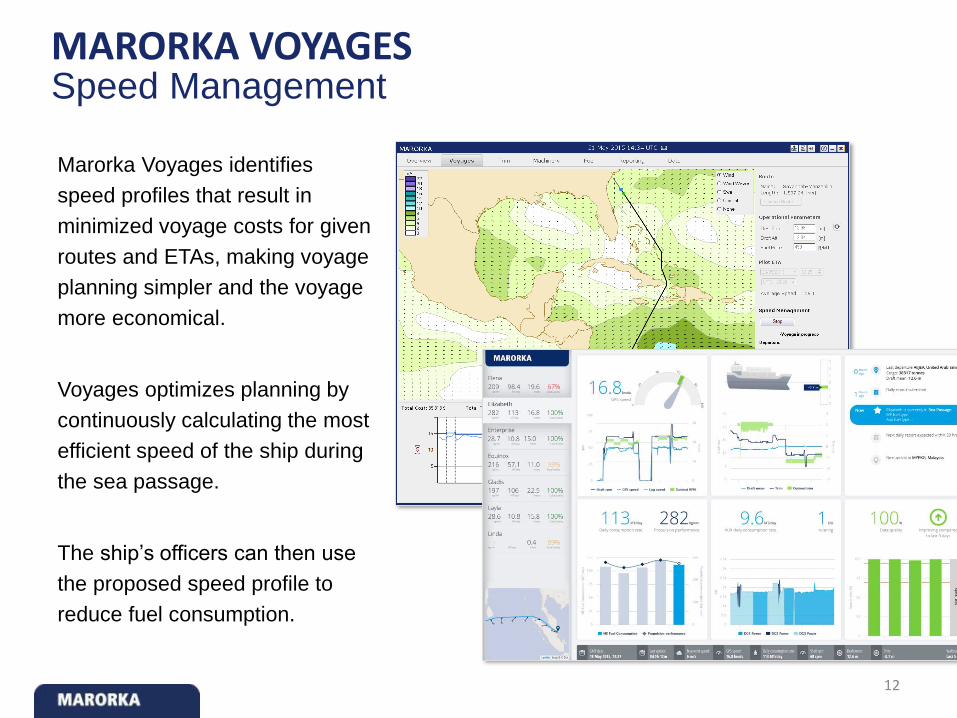
Marorka Voyages identifies
speed profiles that result in
minimized voyage costs for given
routes and ETAs, making voyage
planning simpler and the voyage
more economical.
Voyages optimizes planning by
continuously calculating the most
efficient speed of the ship during
the sea passage.
The ship’s officers can then use
the proposed speed profile to
reduce fuel consumption.
12
MARORKA VOYAGESSpeed Management

SPEED MANAGEMENTOptimizing speed profile for a given route, weather and sea state
Speed management involves the following objectives:
• Decreasing Speed Volatility: Minimize speed volatility by staying as close as possible to
target speed and thereby reducing speed fluctuations.
• Speed Profile Planning: Reducing speed on a given route when environmental loads
(wind, waves, swells and currents) are high and increased again during favourable
conditions to make up for lost time.
Marorka Voyages enables planning and execution of energy efficient voyage based
on mathematical models and forecasts for weather and sea state. The fuel
consumption and harmful emissions are consequently minimized.
Example: Simple speed profileExample: Speed-power in calm and adverse weather

PROPULSION MODELLINGUsing speed-power model for optimizing speed profile
Speed
Po
we
r
Empirical model
Creating speed-power model based on well-known marine engineering
expressions
𝑃𝑚𝑜𝑑𝑒𝑙 =𝑅𝑡𝑜𝑡 𝑉
𝜂, 𝑅𝑡𝑜𝑡 = 𝑓(𝑉,𝑤𝑖𝑛𝑑, 𝑤𝑎𝑣𝑒, 𝑑𝑟𝑎𝑢𝑔ℎ𝑡, 𝑑𝑒𝑝𝑡ℎ, … )
Statistical methods used to tune resistance components with collected data and
test records
min 𝑖=1
𝑛
𝐴𝐵𝑆(𝑃𝑖,𝑚𝑜𝑑𝑒𝑙 − 𝑃𝑖,𝑑𝑎𝑡𝑎) , 𝑃𝑖,𝑚𝑜𝑑𝑒𝑙 = 𝑓(𝑉,𝑤𝑖𝑛𝑑, 𝑤𝑎𝑣𝑒, 𝑑𝑟𝑎𝑢𝑔ℎ𝑡, 𝑑𝑒𝑝𝑡ℎ,… )
Speed
Po
we
r
Model tuning
with data
Optimizing fuel consumption over speed profile
Distance/Time
Sp
ee
d
Speed profile
optimization
min 𝑖=1
𝑛
𝐹𝐶(𝑡𝑖) , 𝐹𝐶(𝑡𝑖) = 𝑓(𝑉,𝑤𝑖𝑛𝑑, 𝑤𝑎𝑣𝑒, 𝑑𝑟𝑎𝑢𝑔ℎ𝑡, 𝑑𝑒𝑝𝑡ℎ,… )
𝑡𝐸𝑇𝐴 = σ𝑖=1𝑛 𝐷𝑖𝑠𝑡𝑖
𝑉𝑖
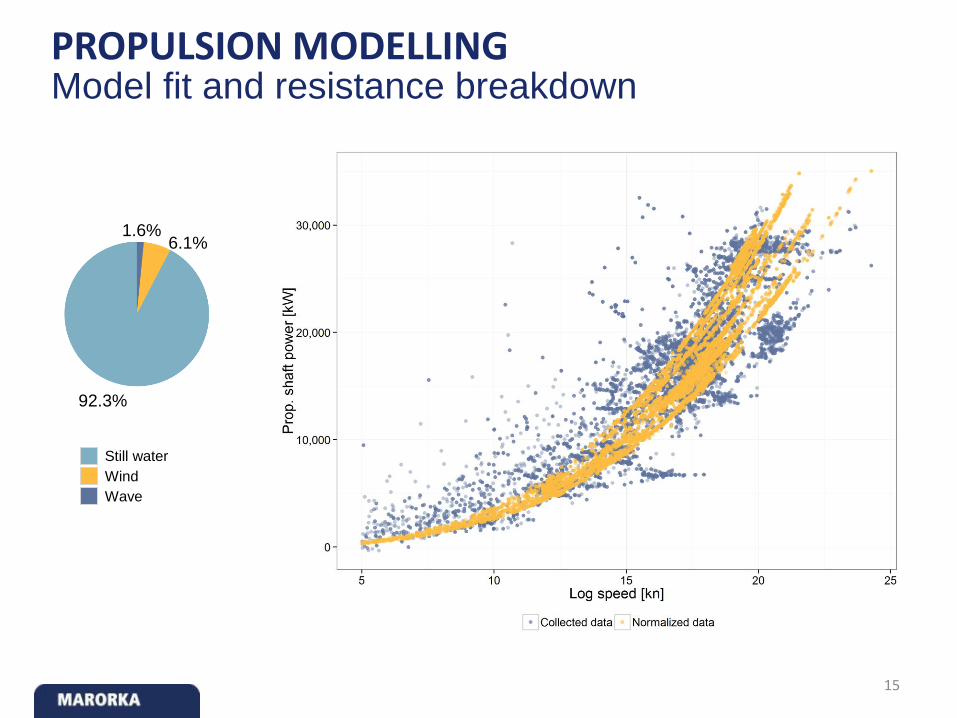
Using speed-power model fitted to actual data will provide most accurate decision
support recomemendation and real picture of fuel saving potential
15
PROPULSION MODELLINGModel fit and resistance breakdown
Still water
Wind
Wave
6.1%1.6%
92.3%

SPEED MANAGEMENTExample: Sprint-loitering
Ship Container
Date Feb 2015
Distance 2,271 nm
Draft 8.5 m
Actual speed Optimal speed Potential savings
345.6 MT 324.4 MT 21.2 MT
6%58.1 MT/24h 54.5 MT/24h 3.6 MT/24h

REGULATORY COMPLIANCE OVERVIEWPast, present and future challenges
2013
2014
2015
2016
2017
2018
2019
2020
2021
2022
2023
2024
2025
SEEMP &
EEDI
EEDI
10%
EEDI
20%
EEDI
30%
MRV
ECA
SOx
ECA
NOx EU
SOx
Global SOx
MBM ?
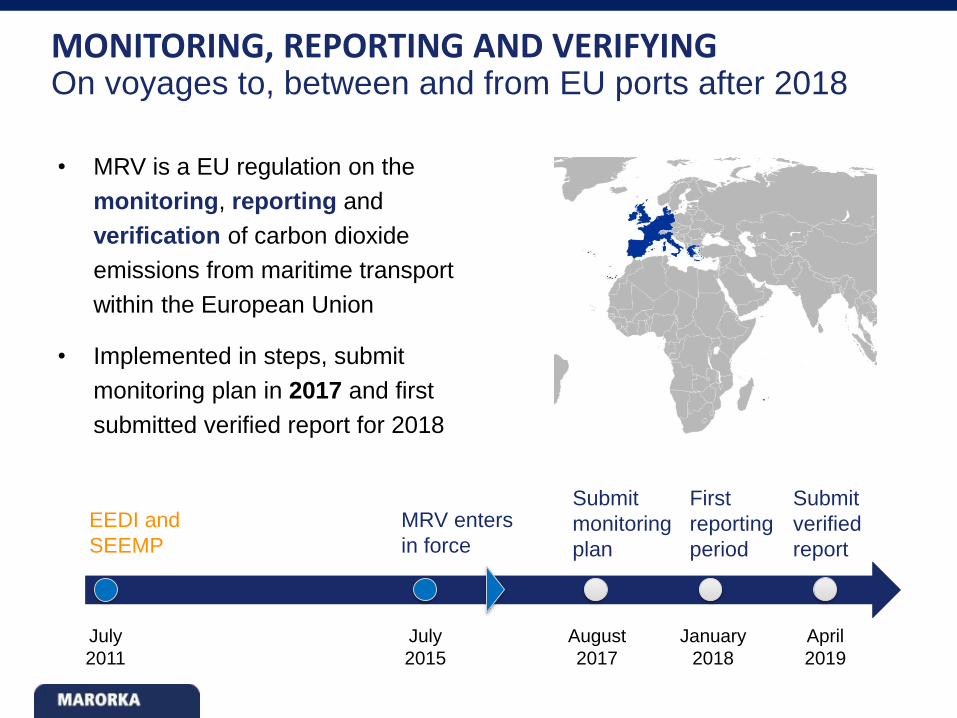
• MRV is a EU regulation on the
monitoring, reporting and
verification of carbon dioxide
emissions from maritime transport
within the European Union
• Implemented in steps, submit
monitoring plan in 2017 and first
submitted verified report for 2018
MONITORING, REPORTING AND VERIFYINGOn voyages to, between and from EU ports after 2018
July
2011
July
2015
August
2017
January
2018
April
2019
EEDI and
SEEMP
MRV enters
in force
Submit
monitoring
plan
First
reporting
period
Submit
verified
report

• MRV is a EU regulation to vessels* (larger than 5000 GT) on voyage to,
between or from ports in the EU.
• Shipping companies need to:
– Submit a monitoring plan describing procedures and methods for measuring
CO2 emissions.
– Monitor CO2 emissions on voyage and annual basis according monitoring plan.
– Report emissions on annual basis. This should include information on ship
particulars and also performance data and CO2 emissions on each voyage
departing and/or arriving at a port in EU member state and each EU port stay.
• Verifiers need to:
– Approve shipping company’s monitoring plan
– Verify annual emission report
REGULATION REQUIRING A LOT OF DATAMonitoring plan, report and submit verified report on annual basis
Monitoring Verification
Monitoring plan
Reporting
* excluding dredging, ice-breaking, pipe laying or offshore installation activities
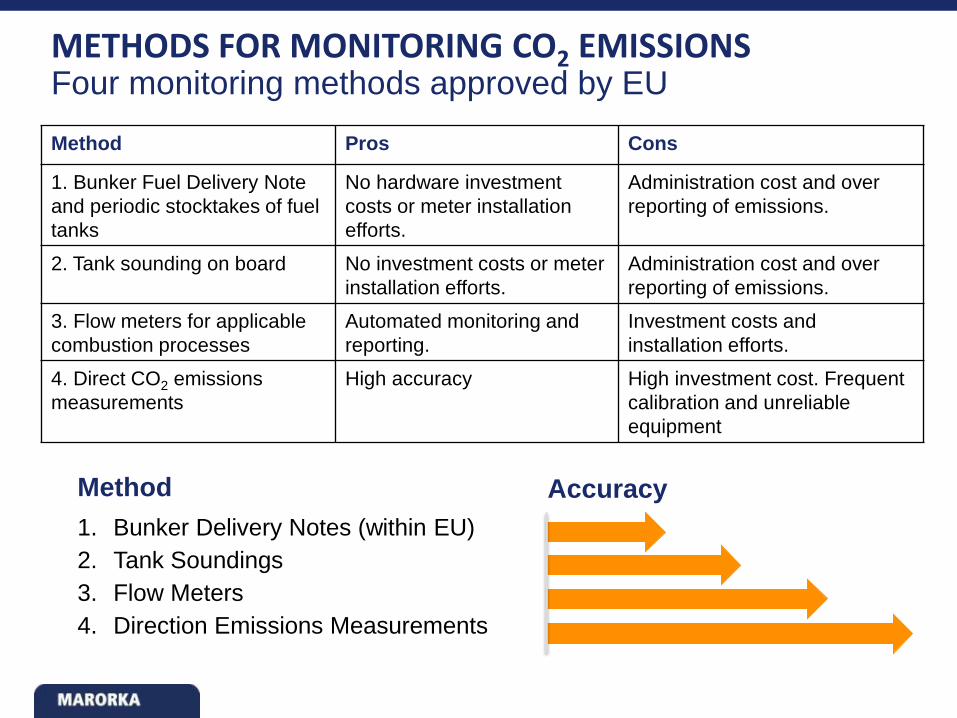
METHODS FOR MONITORING CO2 EMISSIONSFour monitoring methods approved by EU
Method Pros Cons
1. Bunker Fuel Delivery Note
and periodic stocktakes of fuel
tanks
No hardware investment
costs or meter installation
efforts.
Administration cost and over
reporting of emissions.
2. Tank sounding on board No investment costs or meter
installation efforts.
Administration cost and over
reporting of emissions.
3. Flow meters for applicable
combustion processes
Automated monitoring and
reporting.
Investment costs and
installation efforts.
4. Direct CO2 emissions
measurements
High accuracy High investment cost. Frequent
calibration and unreliable
equipment
Accuracy Method
1. Bunker Delivery Notes (within EU)
2. Tank Soundings
3. Flow Meters
4. Direction Emissions Measurements

EU MRV COMPLIANCE OPTIONSNoon reports vs. auto-logged data
Noon reports• Monitoring plan made in-house or via
consultant.
• Monitoring is based on BDN and
bunker fuel tank monitoring.
• Emissions report is constructed from
noon reports in-house or via
consultant.
Auto-logged data• Monitoring plan integrated in solution
and ready for verifier.
• Monitoring is based on flow meters
and bunker fuel tank monitoring.
• Emissions report is ready for verifier
approval and electronic template.
High transparency and awareness for
energy consumption and efficiency.
Low transparency and awareness for
energy consumption and efficiency

MARORKA ODATA APIEnabling sharing of data across organizations
Marorka Online OData API provides standardized method to access data from
Marorka Online from various software tools.
MARORKA ODATA API

Service coverage
23
MARORKA PERFORMANCE CENTERDeveloping performance management as a service
Dedicated team to monitoring performance and provide relevant feedback to your fleet on daily basis
Get immediate benefit through increased operational efficiency, reduced operating costs and enhanced reliability of your assets
Technical efficiency
Crew performance
Operational efficiency
Proactive performance monitoring and feedback

TECHNOLOGY OUTLOOKDeveloping tomorrows data-driven solutions
Go-Green Project
Marorka is partnering with Kongsberg to
deliver fully autonomous speed pilot for
UASC Ultra Large Container Carrier in order
for vessels to autonomously follow optimal
speed profile ensuring that energy savings
are realized.
Maritime Unmanned Navigation
though Intelligence in Networks
Marorka has been selected to participate in
the MUNIN project, an EU-funded initiative
lead by Fraunhofer which is investigating the
possibility of using unmanned ocean-going
ships for transportation.

25
Thank you for your attention!