data.com connect presents: andy paul - how to amp up your sales
TRANSCRIPT

© 2014 | PAGE 1
AMP Up Your Sales Data.com March 19, 2015

© 2014 | PAGE 2
How do you
differentiate and rise above the competition?
© 2014 | PAGE 2

© 2014 | PAGE 3
Amp Up Your Sales Strategy #1:
Sell Faster

© 2014 | PAGE 4
What is buying?
© 2014 | PAGE 4
© 2014 | PAGE 5
“Getting information pushes at the two constraints everyone faces: it takes time and costs money. Making sound decisions fast and at a low cost is a competitive advantage everywhere.” —GEOFFREY COLVIN, Talent is Overrated

© 2014 | PAGE 6
Buying Quickly gathering information to make informed purchase decisions at a low cost

© 2014 | PAGE 7
What is selling?
© 2014 | PAGE 8
“We don’t make money when we sell things; we make money when we help customers make purchase decisions.” —JEFF BEZOS, CEO, Amazon, Inc.
© 2014 | PAGE 9
Sales Helping customers make fast and favorable purchase decisions at a low cost
$

© 2014 | PAGE 10
Customers don’t buy you.
They buy what you can do for them.

© 2014 | PAGE 11
Two pre-requisites to sell faster
Well-defined & documented sales processes
1 Metrics for customer-facing sales processes
2

© 2014 | PAGE 12
72%
–ZERO-TIME SELLING; SALES PROCESS ASSESSMENT
of companies have not documented their sales process

© 2014 | PAGE 13
Document key sales processes Show all steps and duration of steps
Prospect
Prospect Prospect
email Social Inbound Phone
Marketing Reception Auto Attendant
Sales Admin
Sales Mgr.
Sales
Channel Sales Direct Sales Sales Mgr.
Sales
Sales Admin
Prospect Prospect
DAY 1
DAY 2
DAY 3
DAY 4
DAY 5 Resellers
Sales Mgr.

© 2014 | PAGE 14
To accelerate your sales you must measure what matters Lead follow-up
Responsiveness to all customer questions
Customer Support response
Voice mail response
Email response

© 2014 | PAGE 15
Homework #1: Map one sales process & metric
© 2014 | PAGE 16
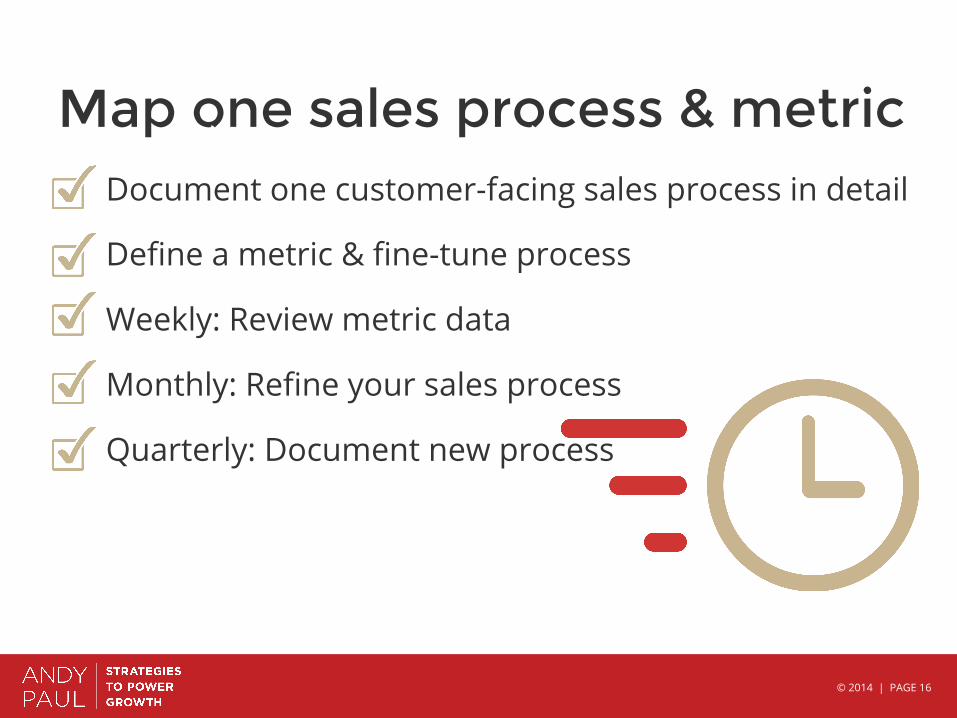
Map one sales process & metric Document one customer-facing sales process in detail
Define a metric & fine-tune process
Weekly: Review metric data
Monthly: Refine your sales process
Quarterly: Document new process

© 2014 | PAGE 17
Amp Up Your Sales Strategy #2:
Data driven planning
© 2014 | PAGE 18
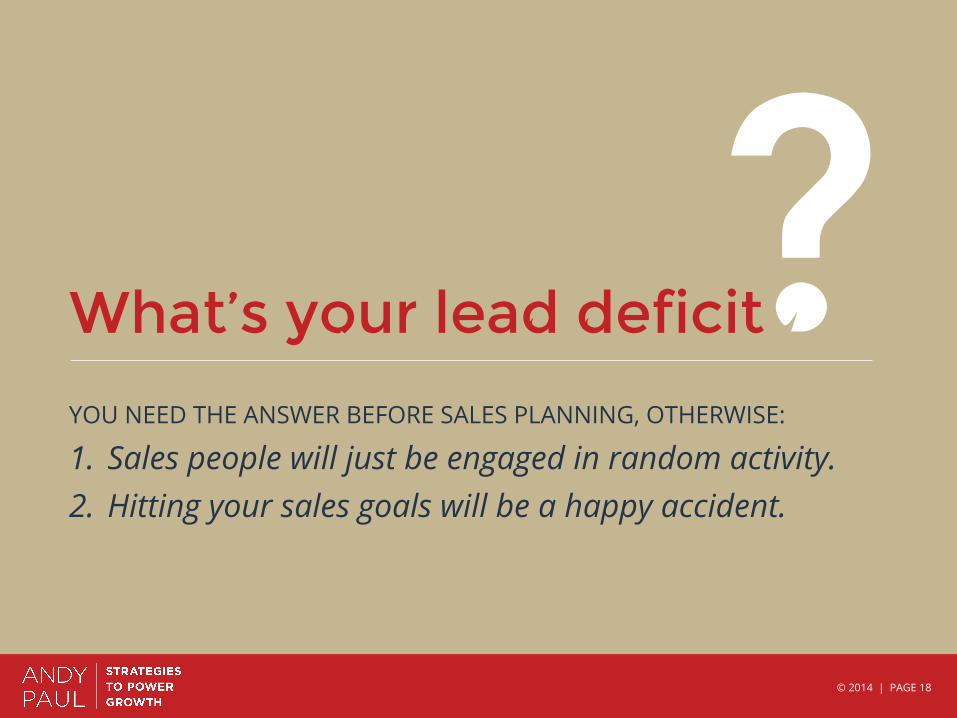
What’s your lead deficit YOU NEED THE ANSWER BEFORE SALES PLANNING, OTHERWISE: 1. Sales people will just be engaged in random activity. 2. Hitting your sales goals will be a happy accident.
?

© 2014 | PAGE 19
Collect your individual data points Annual quota
Conversion rate
Average order size
# of orders from existing customers
# of inbound leads received
© 2014 | PAGE 20
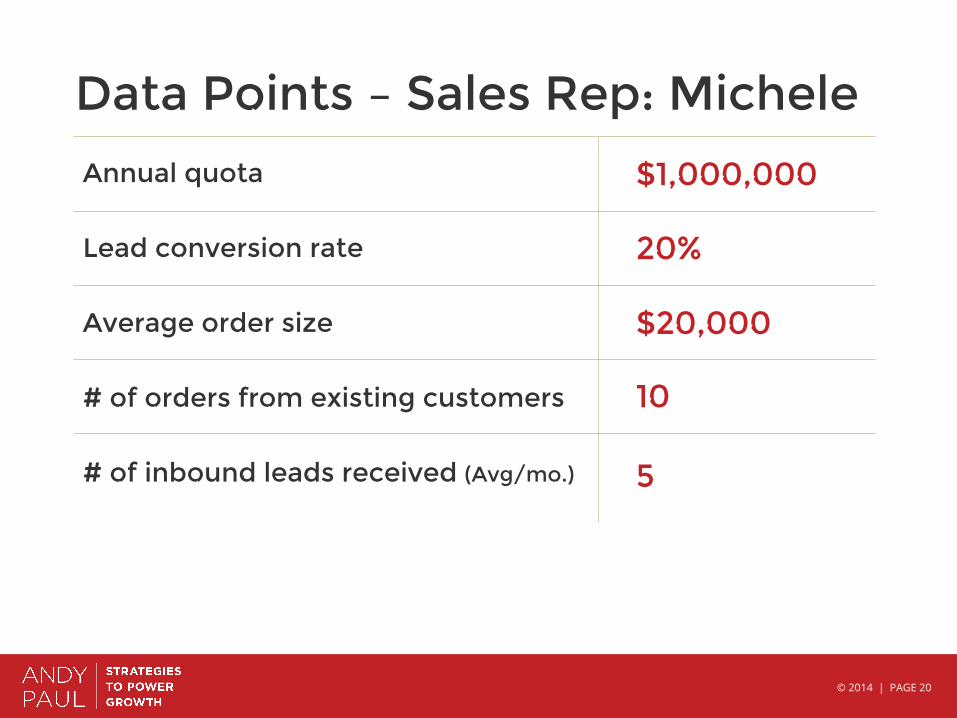
Data Points – Sales Rep: Michele
Annual quota
Lead conversion rate
Average order size
# of orders from existing customers
# of inbound leads received (Avg/mo.)
$1,000,000
20%
$20,000
10
5

© 2014 | PAGE 21
Divide the quota by the average order size
Michele will need 50 orders to meet her revenue goal
$1,000,000/$20,000 = 50
STEP
1

© 2014 | PAGE 22
Subtract Orders from Existing Customers
Michele will need 40 orders from new accounts to meet her revenue goal
50-10 = 40
STEP
2
© 2014 | PAGE 23
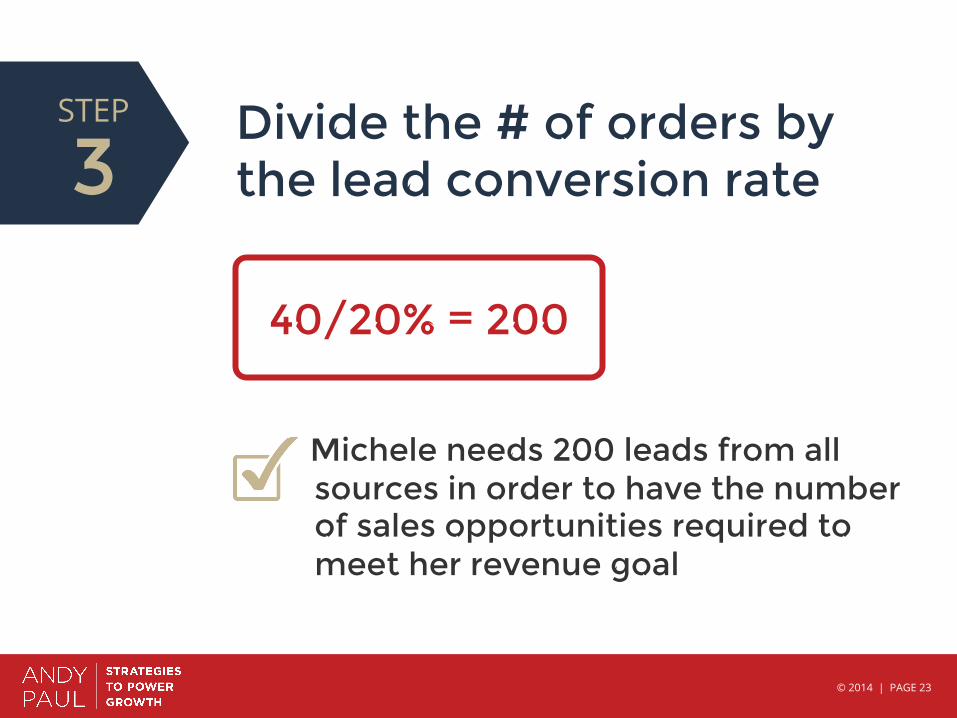
Divide the # of orders by the lead conversion rate
Michele needs 200 leads from all sources in order to have the number of sales opportunities required to meet her revenue goal
40/20% = 200
STEP
3

© 2014 | PAGE 24
Subtract # of expected inbound leads from total required sales leads.
Michele needs to proactively develop 140 new sales opportunities in order to
meet her revenue goal.
200-60 = 140
STEP
4
© 2014 | PAGE 25
Homework #2: Update your sales plan

© 2014 | PAGE 26
Calculate your Lead Deficit Collect your data
Calculate it as of Jan 1, 2015
Pro-rate Lead Deficit based on YTD orders
Now: Update your 90-day sales plan
Quarterly: Update your Lead Deficit

© 2014 | PAGE 27
Amp Up Your Sales Strategy #3:
Be the expert who can help the customer buy
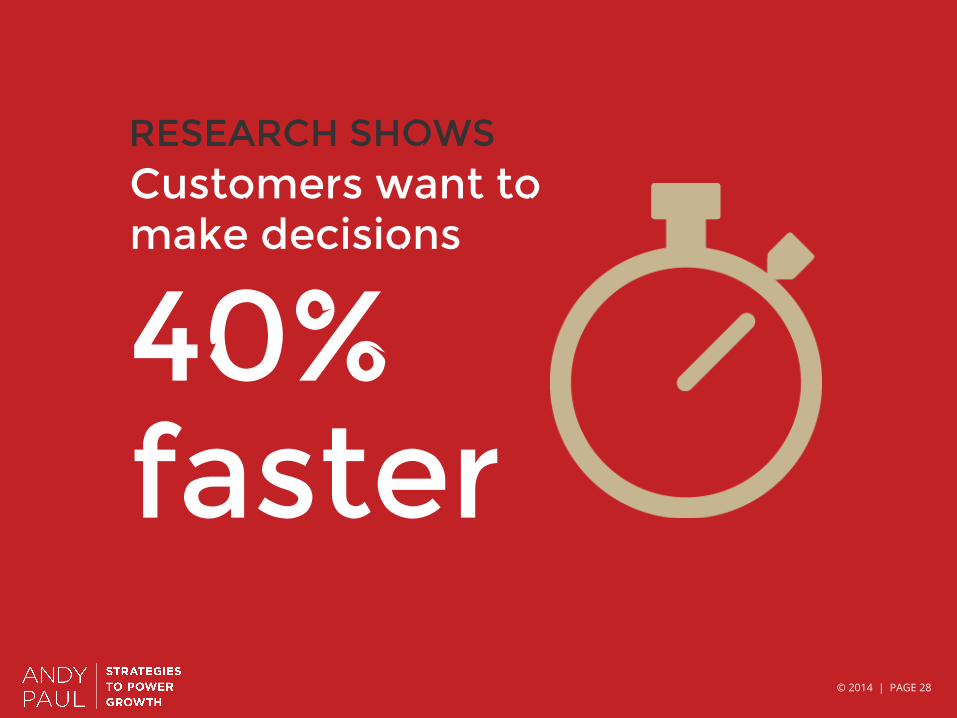
© 2014 | PAGE 28
Customers want to make decisions RESEARCH SHOWS
40% faster

© 2014 | PAGE 29
What buyers need from sellers:
Knowledge, insights, expertise & acumen

© 2014 | PAGE 30
What do buyers need to buy your product?
GENERALISTS
UNDERSTANDING
CON
TEXT
Facts
Value Prop
Expertise
Insights
SPECIALISTS
© 2014 | PAGE 31
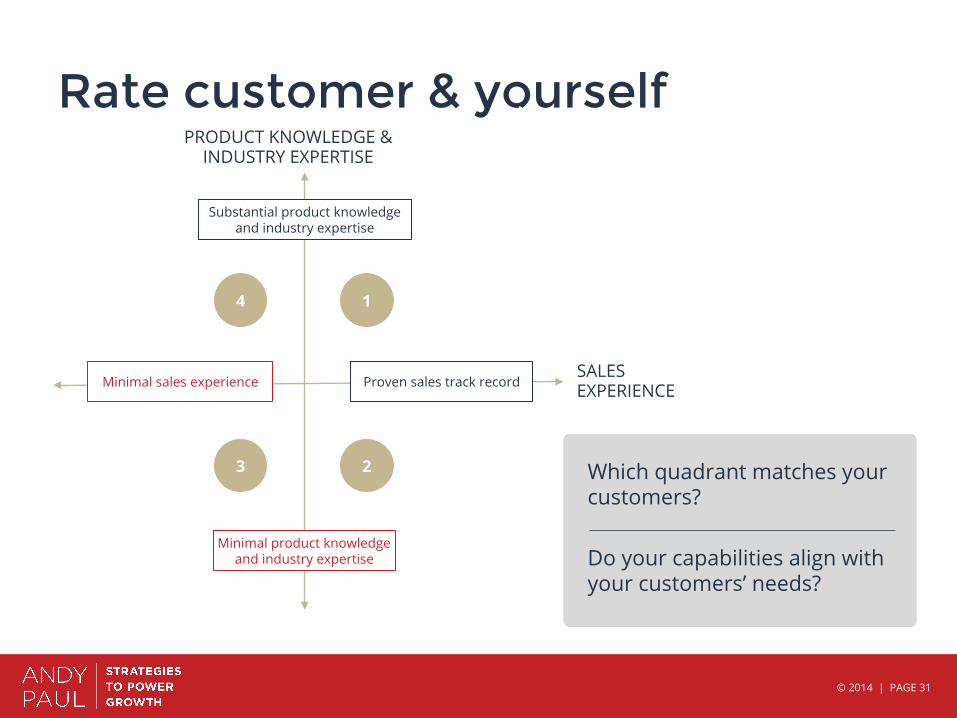
Rate customer & yourself
Which quadrant matches your customers? Do your capabilities align with your customers’ needs?
PRODUCT KNOWLEDGE & INDUSTRY EXPERTISE
SALES EXPERIENCE
1 4
2 3
Substantial product knowledge and industry expertise
Minimal product knowledge and industry expertise
Proven sales track record Minimal sales experience
© 2014 | PAGE 32
Homework #3: Personal Improvement Plan

© 2014 | PAGE 33
Personal Improvement Plan
Write your job description based on your buyers’ needs Identify where you are not aligned with buyer Invest 1 hour of your time per week (2.5%) Books, blogs, webinars Internal experts & resources

© 2014 | PAGE 34
Amp Up Your Sales Strategy #4: Execute a Value Plan for every sales touch.

© 2014 | PAGE 35
What is
in selling?

© 2014 | PAGE 36
Information that moves the prospect at least
one step forward in their buying process

© 2014 | PAGE 37
Examples of value
UNDERSTANDING
CON
TEXT
Data
Value Prop
Expertise
Insights
PRODUCT DATA
FEATURES & BENEFITS
VALUE PROPOSITION

© 2014 | PAGE 38
Examples of value
QUESTIONS: Defining the problem Shaping the buying vision CONTEXT: White papers Industry & market reports INSIGHTS: Case studies/sales stories Testimonials Independent experts
UNDERSTANDING
CON
TEXT
Data
Value Prop
Expertise
Insights
© 2014 | PAGE 39
Customers exchange their time
for value

© 2014 | PAGE 40
STOP Every sales touch must have a value plan. If it doesn’t, just don’t do it.
© 2014 | PAGE 41
Homework #4: Value Plan for every touch
© 2014 | PAGE 42
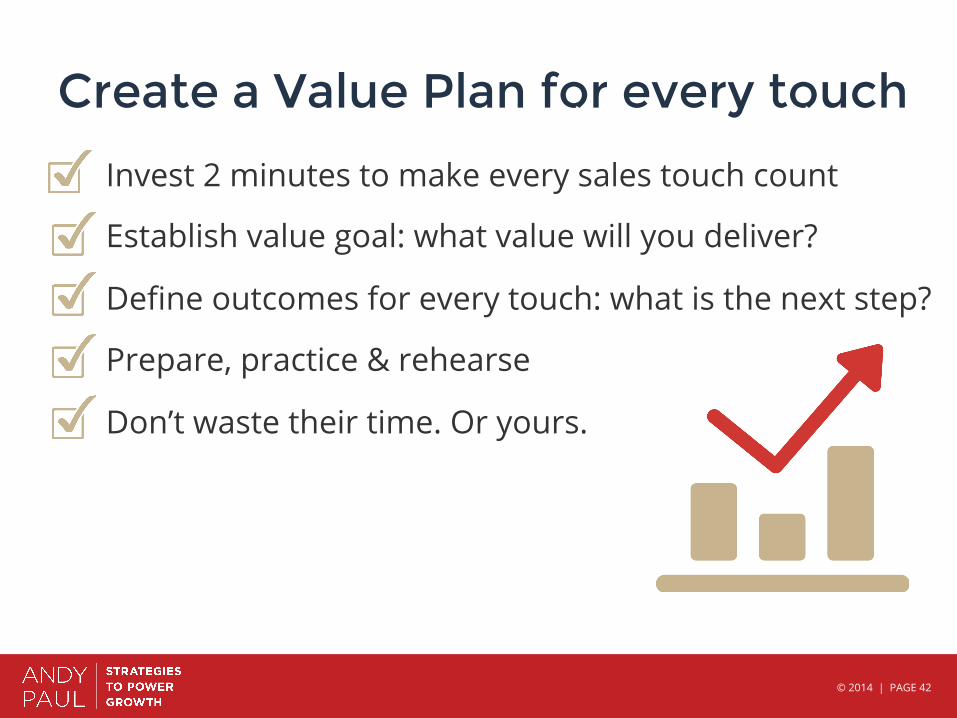
Create a Value Plan for every touch
Invest 2 minutes to make every sales touch count
Establish value goal: what value will you deliver?
Define outcomes for every touch: what is the next step?
Prepare, practice & rehearse
Don’t waste their time. Or yours.

© 2014 | PAGE 43
The Daily Question QUESTION TO ASK ABOUT EVERY QUALIFIED PROSPECT EVERY DAY:
What value can I deliver today that will help the prospect move at least one step closer to making a decision?
?

© 2014 | PAGE 44
Amp Up Your Sales Strategy #5:
Start small Reduce risk to increase win rate and compress decision cycles.
© 2014 | PAGE 45
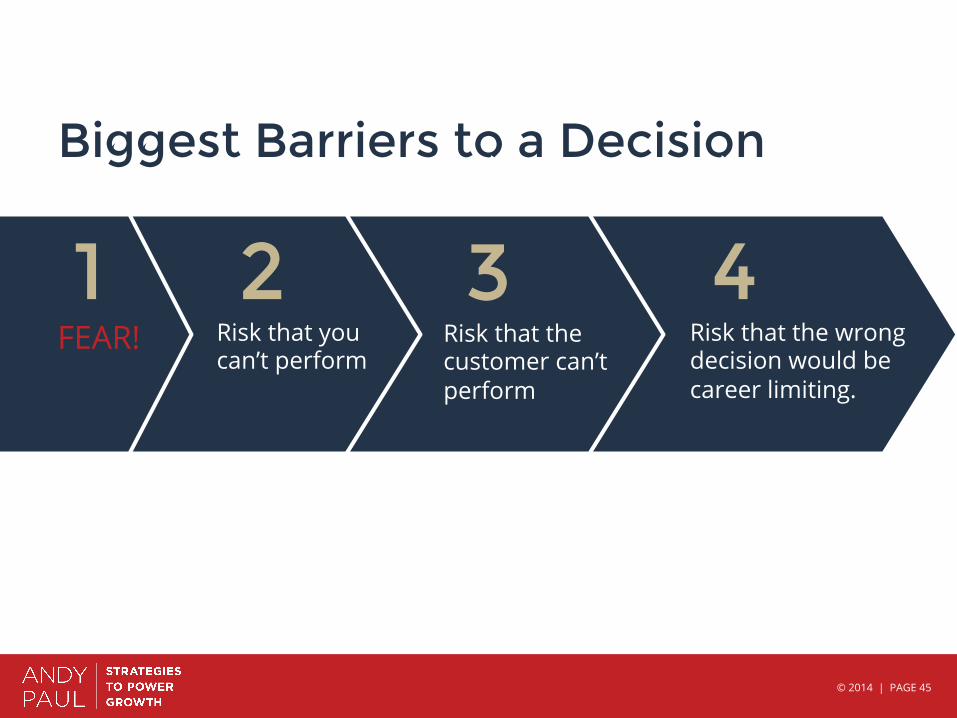
Biggest Barriers to a Decision
FEAR! Risk that you can’t perform
Risk that the customer can’t perform
Risk that the wrong decision would be career limiting.
4 3 2 1

© 2014 | PAGE 46
Start with the smallest (least risky) relationship possible

© 2014 | PAGE 47
Risk Assessment Quadrant
HIGH
LOW
1
SELLER EXECUTION RISK
CUSTOMER EXECUTION RISK
LOW
HIGH
2
3 4
© 2014 | PAGE 48
Homework #5: RAQ your pipeline
© 2014 | PAGE 49
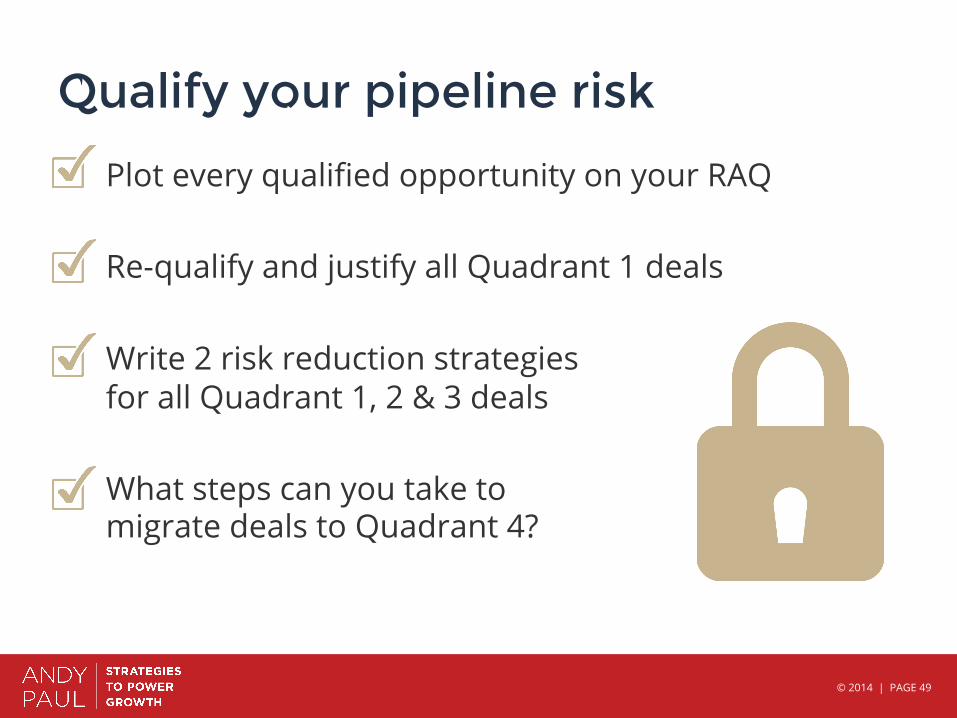
Qualify your pipeline risk
Plot every qualified opportunity on your RAQ Re-qualify and justify all Quadrant 1 deals Write 2 risk reduction strategies for all Quadrant 1, 2 & 3 deals What steps can you take to migrate deals to Quadrant 4?

© 2014 | PAGE 50
AMP Up Your Sales Checklist: Change your perspective on selling and buying
Document & measure your sales processes
Incorporate your Lead Deficit into your sales plan
Implement your Personal Improvement Plan
Defined a Value Plan for every sales touch
Qualify and reduce your pipeline risk

© 2014 | PAGE 51
SERVICES: Consulting, Workshops, Speaking -Strategic Sales Planning -Value-based Selling -Sales Process Development -Mgmt & Sales Coaching -Enhanced Sales Productivity CONTACT: [email protected] www.andypaul.com (619) 980-4002
AUTHOR SPEAKER
SALES EXPERT
© 2014 | PAGE 52
AUTHOR SPEAKER
SALES EXPERT
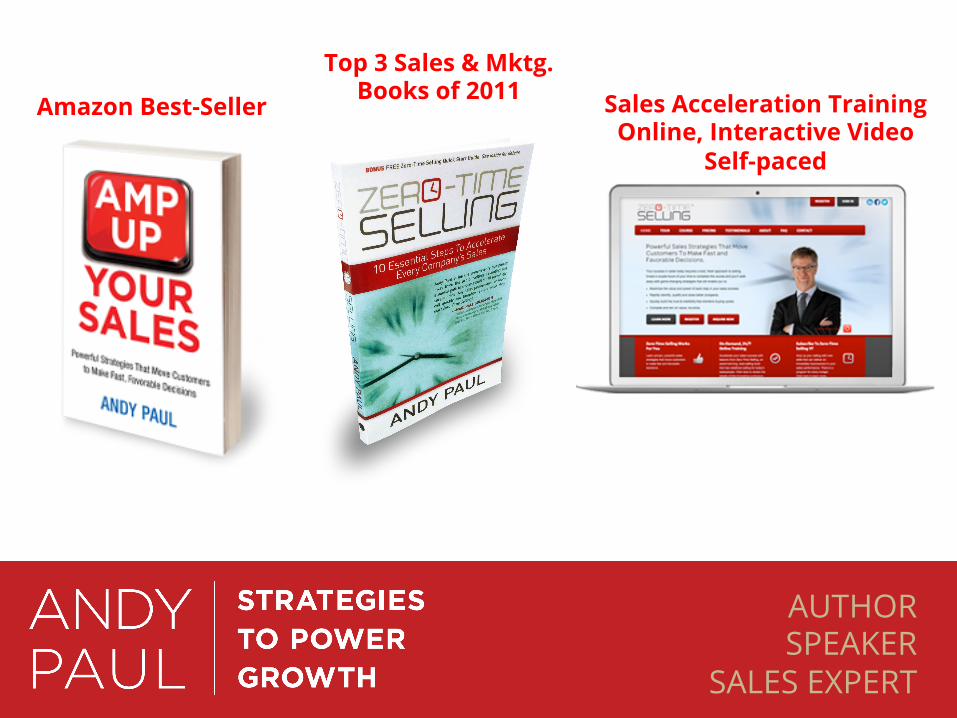
Amazon Best-Seller
Top 3 Sales & Mktg. Books of 2011 Sales Acceleration Training
Online, Interactive Video Self-paced