david fin ass 1
TRANSCRIPT

8/2/2019 David FIN Ass 1
http://slidepdf.com/reader/full/david-fin-ass-1 1/18
BBHM Managing Business Financial Performance Financial Ratio Analysis
WJT, DC, ARR 26th
March 2012 I
Financial Ratio Analysis International College of Hotel Management
Student Name : Tan Wee Jian, David Chan,
Azry Rasyeqa Binti Mohd Rafflee
ID Number : 000865887, 000864839, 000865888
Subject : BBHM Managing Business Financial Performance
Subject Code : BBHM 301
Due Date : 26th
March 2012
Lecture : Donald Peter

8/2/2019 David FIN Ass 1
http://slidepdf.com/reader/full/david-fin-ass-1 2/18
BBHM Managing Business Financial Performance Financial Ratio Analysis
WJT, DC, ARR 26th
March 2012 II
Table of Contents
1.0. Financial Ratio Analysis ...................................................................................... 1
2.0. Liquidity ratios ..................................................................................................... 2
2.1. Current Ratio .................................................................................................... 2
2.2. Quick (Acid Test) Ratio ................................................................................... 2
3.0. Activity Ratio ....................................................................................................... 3
3.1. Inventory Turnover ........................................................................................... 3
3.2. Average Collection Period ................................................................................ 3
3.3. Average Payment Period .................................................................................. 3
3.4. Total Asset Turnover ........................................................................................ 4
4.0. Debt Ratio ............................................................................................................ 5
4.1. Times Interest Earned Ratio ............................................................................. 5
4.2. Earnings per Share ............................................................................................ 5
5.0. Analyzing Profitability ......................................................................................... 6
5.1. Gross Profit Margin .......................................................................................... 6
5.2. Operating Profit Margin ................................................................................... 6
5.3. Net Profit Margin.............................................................................................. 6
5.4. Return on Total Assets (ROA) ......................................................................... 6
5.5. Return on Equity (ROE) ................................................................................... 7
5.6. Earnings per Share ............................................................................................ 7
5.7. DuPont System of Analysis .............................................................................. 7
Conclusion ...................................................................................................................... 8
Reference ........................................................................................................................ 9
Appendix

8/2/2019 David FIN Ass 1
http://slidepdf.com/reader/full/david-fin-ass-1 3/18
BBHM Managing Business Financial Performance Financial Ratio Analysis
WJT, DC, ARR 26th
March 2012 1
1.0. Financial Ratio Analysis
All information obtained from financial statements is vital and from the statement,
the organization will do an analysis to determine financial ratios as each stakeholder
requires the information for monitoring and knowledge of company’s growth.
It is an amalgamation of financial and operating data from an organization to
provide basic information. It consists of 15 categories financial ratios found in the
company the authors choose which McDonalds is.

8/2/2019 David FIN Ass 1
http://slidepdf.com/reader/full/david-fin-ass-1 4/18
BBHM Managing Business Financial Performance Financial Ratio Analysis
WJT, DC, ARR 26th
March 2012 2
2.0. Liquidity ratios
It is measured for short term obligations in assets which could be converted to cash
whenever necessary. Liquidity simply means to have cash in hand at all times, hence
when it is needed necessarily there is always cash prepared. (Pamela.P, 2012)
2.1. Current Ratio
From Appendix – E 1, the ratio improves from year 2009 to 2011 which proven that
McDonalds is not facing any financial difficulties and it has the ability to settle all
financial obligations. With this result, their profitability is secure as their target market is
high which makes their return of profit is high.
2.2. Quick (Acid Test) Ratio
From Appendix – E 2, inventory of the food items which is high in liquidity because their
inventory items perishability is high as the demand of fast food has grown all over the
world each year.

8/2/2019 David FIN Ass 1
http://slidepdf.com/reader/full/david-fin-ass-1 5/18
BBHM Managing Business Financial Performance Financial Ratio Analysis
WJT, DC, ARR 26th
March 2012 3
3.0. Activity Ratio
3.1. Inventory Turnover
Inventory Turnover is a ratio of cost of goods sold to inventory that indicates how many
times inventory is created and sold during the period (Drake, 2012) According to the
turnover rate (Appendix – E3) of McDonald shows that over the three years it has an
increasing from 131 times to 139 times turnover that is 8 times on the year 2011. Based
on research, McDonald’s opens more stores by using cash on hand and increasing the
advertising budget and buying back shares to push on their sales, thus the inventory
turnover rate is increasing in stability (Kennon, 2012).
3.2. Average Collection Period
Average Collection Period (Accounts Receivable Turnover) is the ratio of net credit sales
to accounts receivable that indicates how many times in the daily period credit sales have
been created and collected (Gitman, Juchau & Flanagan, 2011). McDonald’s has an
increasing higher turnover on account receivable over the three years based on the
calculation (Appendix – E4). The author assumed that McDonald’s does not indicate a
not strong management on credit collection department thus caused the lengthened period
of the credit collection.
3.3. Average Payment Period
Average Payment Period is the average age of accounts payable that indicates how many
times in the daily period payments relate to the credit term extension of the firm (Gitman,
Juchau & Flanagan, 2011). Based on the equation (Appendix-E5), McDonald’s has an
frustrating figure on the ratio for credit terms, from ratio of 16.64 increased to 23.86 and
yet dropped to 21.50 on the year 2011, this could be assumed that the firms has been
paying attention and building a good relation with the suppliers so that the frustration of
credit term is flexible and under control based on the financial circumstances of the firm.

8/2/2019 David FIN Ass 1
http://slidepdf.com/reader/full/david-fin-ass-1 6/18
BBHM Managing Business Financial Performance Financial Ratio Analysis
WJT, DC, ARR 26th
March 2012 4
3.4. Total Asset Turnover
The Total Asset Turnover indicates the efficiency with the uses all its assets to generate
sales. With the figure shows in the calculation for TAT (Appendix-E6), the frustration of
the turnover is basically has a poor productivity as on the year 2009, the asset turnover
was 6.66 times but on the year 2011 was a gap of 0.53 times, this proves that the amount
of assets that McDonald’s previously held was not been maximized to be productivity to
work out an increasing return of equity.
8/2/2019 David FIN Ass 1
http://slidepdf.com/reader/full/david-fin-ass-1 7/18
BBHM Managing Business Financial Performance Financial Ratio Analysis
WJT, DC, ARR 26th
March 2012 5
4.0. Debt Ratio
The debt ratio is also called the debt (or liabilities)-to-assets ratio. This measures a
company’s use of leverage: It notifies you the percentage of liabilities compared to
financial assets. The more liabilities compared to assets a company has, the more
leveraged it is and the riskier it is considered to be. In Appendix equation no.7, the debt
ratio had increased over the three years from 53.6% to 56.4% in McDonald. This doesn’t
mean the business at risk as McDonald is a large and well-established fast-food company,
and they’re able to take more risks/debts without losing any investors.
4.1. Times Interest Earned Ratio
This calculation is formulated by taking McDonald’s earnings before interest and taxes
(EBIT) and dividing total interest. This will show and indicates how many timesMcDonald can cover its interest charges on a pre-tax basis. Referring to Appendix
equation no.8, the percentage had slightly increased over the three years, but there’s
possibility that McDonald is facing financial problems and unable to settle outstanding
interests.
4.2. Earnings per Share
EPS is calculated over a number of years indicates whether the earning power of the
company has improved or deteriorated. By calculating EPS, it can determine a company’sprofitability. From 2009 till 2011, in Appendix equation no.14, the EPS of McDonald has
steadily increased. An increase in EPS is an important measure because it reveals the
amount of profit that McDonald is generating for the shareholders. This will attract more
investors as they always look for companies with steadily increasing earnings per share.
The higher the earnings per share with all else equal, the higher each share should be
worth.

8/2/2019 David FIN Ass 1
http://slidepdf.com/reader/full/david-fin-ass-1 8/18
BBHM Managing Business Financial Performance Financial Ratio Analysis
WJT, DC, ARR 26th
March 2012 6
5.0. Analyzing Profitability
The main purpose for McDonalds to have this information is too evaluating the earnings
gained from investment made and the earnings they made in the market as well as
generating financial return in terms of gaining back the assets invested in. (Spire Frame,
2012)
5.1. Gross Profit Margin
From Appendix – E 9, McDonalds gross profit margin are quite high and it increase
every year which concludes they made good profit and even after paid for their goods the
profit is up to 39 to 40% which is essential and excellent for the company.
5.2. Operating Profit Margin
It measures profit earn in sales before minus interest and taxes as shown in Appendix – E
10 the margin shows positive figures which is good for the organization as it proves that
their return rate is high and each cents spend on the company is worth it. They get to earn
their profit margin back in short period of time and it increases yearly.
5.3. Net Profit Margin
Is net profit gained after minus expenses and taxes, from Appendix – E 11 shows
increases from 20 % to 21% in year 2009 to 2010 however it decreases to 20% again in
2011 shows inconsistency for net profit gain. The impact on this situation will be
common as consumer’s preferences changes from time to time.
5.4. Return on Total Assets (ROA)
Simply means return on investment which measures the effectiveness in generating
profits which is shown in Appendix – E 12. For both years 2009 and 2010 was the same
rate but increases in 2011as economy downturn effects consumers from eating out
however once it is back on track they came back and demand for more.

8/2/2019 David FIN Ass 1
http://slidepdf.com/reader/full/david-fin-ass-1 9/18
BBHM Managing Business Financial Performance Financial Ratio Analysis
WJT, DC, ARR 26th
March 2012 7
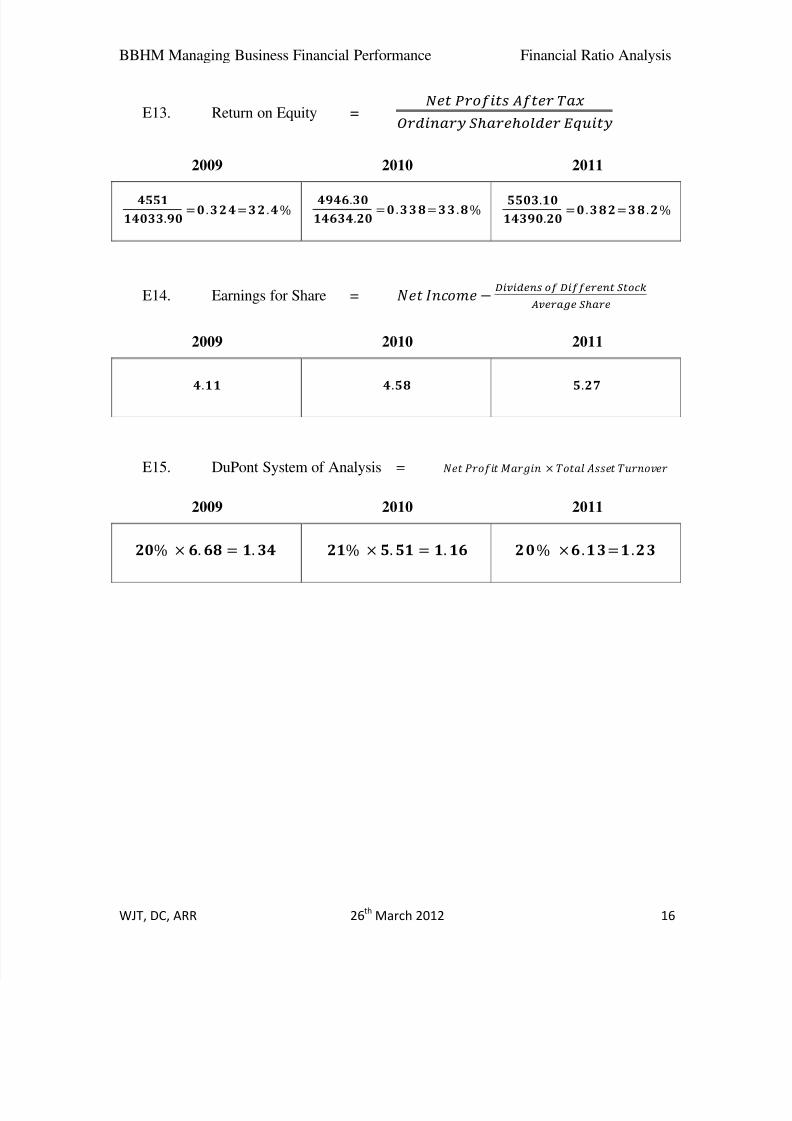
5.5. Return on Equity (ROE)
Measuring rate of return earned on shareholder’s investment for the organization as
shown in Appendix – E 13 it is calculated and result was positive. Each year, it increases
positively and the shareholders return earn is high and it definitely makes them feel worth
investing on McDonalds as the market segmentation is high and demand is there hence
each future year will be forecast high gaining as well.
5.6. Earnings per Share
EPS is calculated over a number of years indicates whether the earning power of the
company has improved or deteriorated. By calculating EPS, it can determine a company’s
profitability. From 2009 till 2011, in Appendix equation no.14, the EPS of McDonald has
steadily increased. An increase in EPS is an important measure because it reveals the
amount of profit that McDonald is generating for the shareholders. This will attract more
investors as they always look for companies with steadily increasing earnings per share.
The higher the earnings per share with all else equal, the higher each share should be
worth.
5.7. DuPont System of Analysis
The DuPont analysis system helps business owner’s to gain information about its
efficiency and how effective they are in utilising assets to generate revenue. To gain
higher return on assets requires business to boost its operating profit margin through
more efficient use of company assets, or to increase gross revenues through higher sales.
In McDonald’s case, base on Appendix equation no.15, we can determine that the
company isn’t really fully utilizing the assets as it declines from 1.34 in 2009 to 1.16 in
2010, but increased back to 1.26 in 2011.

8/2/2019 David FIN Ass 1
http://slidepdf.com/reader/full/david-fin-ass-1 10/18
BBHM Managing Business Financial Performance Financial Ratio Analysis
WJT, DC, ARR 26th
March 2012 8
Conclusion
This assignment is all about the financial ratio analysis of McDonald’s Company and
making assumptions and seeks for facts regarding what are the causes based on the figure
of the ratio. The financial ratio can be obtained from McDonald annual financial report,
then calculate the ratio that includes from current ratio to quick ratio, debt ratio, and
DuPont analysis. Overall, McDonald’s Company is doing well due to high sales volume.
Although McDonald’s Company is well-established and stable, maybe the management
can look into financial control and reduce their expenses not only just focusing on
marketing side.

8/2/2019 David FIN Ass 1
http://slidepdf.com/reader/full/david-fin-ass-1 11/18
BBHM Managing Business Financial Performance Financial Ratio Analysis
WJT, DC, ARR 26th
March 2012 9
Reference
Zacks.com (2012), MCDONALDS CORP (NYSE) - Annual Income Statement,
viewed 20th
Macrh 2012, <http://www.zacks.com/research/report.php?type=ais&t=MCD >
Zacks.com (2012), MCDONALDS CORP (NYSE) - Annual Balance Sheet,
viewed 20th
Macrh 2012, <http://www.zacks.com/research/report.php?type=abs&t=mcd >
Joshua Kennon (2012), McDonald's vs. Wendy's - A Case Study In Inventory on the
Balance Sheet, viewed 20th
March 2012,
<http://beginnersinvest.about.com/od/analyzingabalancesheet/a/mcdonalds-vs-
wendys.htm>
Lawrence J. Gitman, Roger Juchau & Jack Flanagan (2011), Principle of Managerial
Finance 6 th
Edition, Financial statements and analysis – Activity Ratios, pg 55 - 57,
Pearson.
Pamela Peterson Drake, 2012, Financial Ratio Analysis, viewed 20th March 2012,
< http://educ.jmu.edu/~drakepp/principles/module2/fin_rat.pdf>
Spire Frame, 2012, Measuring Profitability, viewed 20th
March 2012,
<http://www.spireframe.com/articles/>
Time Interest Earned Ratio, viewed 21st March 2012,
<http://timesinterestearnedratio.info/>
Lister, J 2012, ‘ How The DuPoint System of Analysis Breaks Down Return on Assets’
Earnings Per Share (EPS), viewed 21st
March 2012,
<http://investing-school.com/definition/earnings-per-share-eps/>
Analysing Debt Ratios 2012, viewed 21st March 2012,
<http://www.aaii.com/computerized-investing/article/fundamental-focus-analyzing-debt-
ratios.mobile>
Kennon J 2012, About.com Guide, ‘ Return On Equity (ROE)’

8/2/2019 David FIN Ass 1
http://slidepdf.com/reader/full/david-fin-ass-1 12/18
BBHM Managing Business Financial Performance Financial Ratio Analysis
WJT, DC, ARR 26th
March 2012 10
Appendix
McDonald’s Annual Balance SheetFiscal Year End for MCDONALDS CORP falls in the month of December.All items in Millions except Per Share data.
12/31/11 12/31/10 12/31/09
Cash & Equivalents 2,335.70 2,387 1,796
Receivables 1,334.70 1,179.10 1,060.40
Notes Receivable 0 0 0
Inventories 116.80 109.90 106.20
Other Current Assets 615.80 692.50 453.70
Total Current Assets 4,403 4,368.50 3,416.30
Net Property & Equipment 22,834.50 22,060.60 21,531.50
Investments & Advances 1,427 1,335.30 1,212.70
Other Non-Current Assets 0 0 0
Deferred Charges 0 0 0
Intangibles 2,653.20 2,586.10 2,425.20
Deposits & Other Assets 1,672.20 1,624.70 1,639.20
Total Assets 32,989.90 31,975.20 30,224.90
Notes Payable 0 0 0
Accounts Payable 961.30 943.90 636
Current Portion Long-Term Debt 366.60 8.30 18.10
Current Portion Capital Leases 0 0 0
Accrued Expenses 1,581 1,585.60 1,854.80
Income Taxes Payable 600.30 386.90 479.80
Other Current Liabilities 0 0 0
Total Current Liabilities 3,509.20 2,924.70 2,988.70
Mortgages 0 0 0

8/2/2019 David FIN Ass 1
http://slidepdf.com/reader/full/david-fin-ass-1 13/18
BBHM Managing Business Financial Performance Financial Ratio Analysis
WJT, DC, ARR 26th
March 2012 11
Deferred Taxes/Income 1,344.10 1,332.40 1,278.90
Convertible Debt 0 0 0
Long-Term Debt 12,133.80 11,497 10,560.30
Non-Current Capital Leases 0 0 0
Other Non-Current Liabilities 1,612.60 1,586.90 1,363.10
Minority Interest (Liabilities) 0 0 0
Total Liabilities 18,599.70 17,341 16,191
Preferred Stock 0 0 0
Common Stock (Par) 16.60 16.60 16.60
Capital Surplus 5,487.30 5,196.40 4,853.90
Retained Earnings 36,707.50 33,811.70 31,270.80
Other Equity 449.70 752.90 747.40
Treasury Stock 28,270.90 25,143.40 22,854.80
Total Shareholder's Equity 14,390.20 14,634.20 14,033.90
Total Liabilities & Shareholder's Equity 32,989.90 31,975.20 30,224.90
Total Common Equity 14,390.20 14,634.20 14,033.90
Shares Outstanding 1,023.20 1,056.50 1,079.10
Book Value Per Share 14.06 13.85 13.01

8/2/2019 David FIN Ass 1
http://slidepdf.com/reader/full/david-fin-ass-1 14/18
BBHM Managing Business Financial Performance Financial Ratio Analysis
WJT, DC, ARR 26th
March 2012 12
Annual Income StatementFiscal Year End for MCDONALDS CORP falls in the month of december.All items in Millions except EPS data.
12/31/11 12/31/10 12/31/09
Sales 27,006 24,074.60 22,744.70
Cost Of Goods 16,319.40 14,437.30 13,952.90
Gross Profit 10,686.60 9,637.30 8,791.80
Selling & Adminstrative & Depr. & AmortExpenses
2,156.90 2,164.20 1,950.80
Income After Depreciation &Amortization
8,529.70 7,473.10 6,841
Non-Operating Income -24.70 -21.90 119.20
Interest Expense 492.80 450.90 473.20
Pretax Income 8,012.20 7,000.30 6,487
Income Taxes 2,509.10 2,054 1,936
Minority Interest 0 0 0
Investment Gains/Losses 0 0 0
Other Income/Charges 0 0 0
Income From Cont. Operations 5,503.10 4,946.30 4,551
Extras & Discontinued Operations 0 0 0
Net Income 5,503.10 4,946.30 4,551
Income Before Depreciation & Amortization 9,944.70 8,749.30 8,057.20
Depreciation & Amortization (Cash Flow) 1,415 1,276.20 1,216.20
Income After Depreciation &Amortization
8,529.70 7,473.10 6,841
Average Shares 1,044.90 1,080.30 1,107.40
Diluted EPS Before Non-Recurring Items 5.27 4.59 3.98
Diluted Net EPS 5.27 4.58 4.11

8/2/2019 David FIN Ass 1
http://slidepdf.com/reader/full/david-fin-ass-1 15/18
BBHM Managing Business Financial Performance Financial Ratio Analysis
WJT, DC, ARR 26th
March 2012 13
Equations * All items in Millions
E1. Current Ratio =
2009 2010 2011
E2. Quick Acid Test =
2009 2010 2011
E3. Inventory Turnover =
2009 2010 2011
E4. Average Collection Period =
2009 2010 2011
(
)
(
)
(
)

8/2/2019 David FIN Ass 1
http://slidepdf.com/reader/full/david-fin-ass-1 16/18

8/2/2019 David FIN Ass 1
http://slidepdf.com/reader/full/david-fin-ass-1 17/18
BBHM Managing Business Financial Performance Financial Ratio Analysis
WJT, DC, ARR 26th
March 2012 15
E9. Gross Profit Margin =
2009 2010 2011
E10. Operating Profit Margin =
2009 2010 2011
E11. Net Profit Margin =
2009 2010 2011
E12. Return on Total Assets =
2009 2010 2011
8/2/2019 David FIN Ass 1
http://slidepdf.com/reader/full/david-fin-ass-1 18/18
BBHM Managing Business Financial Performance Financial Ratio Analysis
WJT, DC, ARR 26th
March 2012 16
E13. Return on Equity =
2009 2010 2011
E14. Earnings for Share =
2009 2010 2011
E15. DuPont System of Analysis =
2009 2010 2011