dcf pemex outlook 060102 i - political-analysis.com · dcf, january 2, 2006 5 pemex is the 9th...
TRANSCRIPT

DCF, January 2, 20061
PEMEX Outlook
January, 2006

DCF, January 2, 20062
• This presentation contains forward-looking statements. We may also make written or oral forward-looking statements in our periodic reports to the Mexican Banking and Securities Commission and theU.S. Securities and Exchange Commission (SEC), in our annual report, in our proxy statements, in our offering circulars and prospectuses, in press releases and other written materials and in oral statements made by our officers, directors or employees to third parties
• Statements that are not historical facts, including statements about our beliefs and expectations, are forward looking-statements. These are good faith statements based on current plans, estimates and projections and therefore you should not place undue reliance onthem. Forward-looking statements speak only as of the date they were made, and we undertake no obligation to update publicly any of them in light of new information or future events
• Forward-looking statements involve inherent risks and uncertainties. We caution you that a number of important factors could cause actual results to differ materially from those contained in any forward-looking statement
Forward-looking Statement

DCF, January 2, 20063
• The U.S. Securities and Exchange Commission (SEC) permits oil and gas companies, in their filings with the SEC, to disclose only proved reserves that a company has demonstrated by actual production orconclusive formation tests to be economically and legally producible under existing economic and operating conditions. We use certain terms in this document, such as total reserves, probable reserves and possible reserves, that the SEC's guidelines strictly prohibit us from including in filings with the SEC. Investors are urged to consider closely the disclosure in our Form 20-F, available from us at www.pemex.com or Marina Nacional 329 Floor 38 Col. Huasteca, Mexico City 11311 or at (52 55) 1944 9700. You can also obtain this Form from the SEC by calling 1-800-SEC-0330
• EBITDA, free cash-flow and discretionary cash-flow are non-GAAP measures. They are presented because PEMEX believes that they are useful for financial analysis
• The total debt calculation includes, in addition to documented debt, the items that are usually considered as debt by the financial markets
Cautionary Note

DCF, January 2, 20064
Agenda
PEMEX Highlights
Lines of Business
CAPEX and Financing Program
New Fiscal Regime
Looking Forward

DCF, January 2, 20065
PEMEX is the 9th Largest Integrated Oil Company in the World
Third largest producer of crude oil in the world(1)
Ninth largest integrated oil company in the world(1)
Proved reserves equivalent to 11 years of production(2)
Low cost producer vs. market average
Key supplier of crude oil to the US market
Mexico’s largest company with 2004 revenues of 69 billion dollars
Sole producer of crude oil, natural gas and refined products in Mexico
Sole marketer of refined products in Mexico
1) Based on PIW 2004 Rankings, December 2005, Petroleum Intelligence Weekly2) 2004 production levels and proved reserves in accordance with the definition under Rule 4.10(a) of
Regulation S-X under the U.S. Securities Act of 1933

DCF, January 2, 20066
Integrated Oil Majors
1
2
3
4
5
6
7
8
9
9
Source: PIW 2004 Rankings, December 2005, Petroleum Intelligence Weekly
Place Company Country Crude GasReserves
Crude GasProduction
Sales
Saudi Aramco
Exxon Mobil
PDVSA
NIOC
BP
RD Shell
Total
Chevron
PEMEX
PetroChina
Saudi Arabia
USA
Venezuela
Iran
UK
Netherlands and UK
France
USA
Mexico
China
1
13
5
2
18
25
22
19
10
14
4
13
5
2
15
17
21
24
29
16
1
5
4
2
6
8
15
11
3
9
7
2
11
5
4
3
9
12
14
19
9
1
8
12
3
2
6
4
14
13
CapacityRefining
9
1
3
14
5
2
6
10
13
12

DCF, January 2, 20067
Crude Oil and Natural Gas Reserves
• Long life of proved reserves of 11 years and 3P life of 29 years based on 2004 production(3)
• Reserves figures are certified by third parties
Reserves as of December 31, 2004MMMboe
1) In accordance with the definition of proved reserves under Rule 4.10(a) of Regulation S-X under the U.S. Securities Act of 1933. Probable and possible reserves were obtained through the difference between 3P reserves and proved reserves
2) The figure does not total due to rounding3) Reserves as of December 31, 2004 and based on 2004 production (average production of 4.4 MMboed)
17.6
15.8 46.9
13.4
Proved Probable Possible 3P(1) (2)

DCF, January 2, 20068
Production Profile
Crude oil production (MMbd)
Natural gas production (MMMcfd)
Refined products (MMbd)
• Crude oil production has grown steadily since 1999
• Refined products production has grown moderately
• The decreasing trend of natural gas production was reversed in 2003
3.02 3.01 3.13 3.18 3.37 3.38 3.402.913.07
3.48
1997 1998 1999 2000 2001 2002 2003 2004 2005E 2006E
5.24.8 4.8 4.94.64.54.44.54.74.5
1997 1998 1999 2000 2001 2002 2003 2004 2005E 2006E
1.61.5 1.5 1.61.61.61.51.51.41.5
1997 1998 1999 2000 2001 2002 2003 2004 2005E 2006E

DCF, January 2, 20069
Lifting Cost
Source: 2004 Annual Reports and 2004 20-F’s, (excluding PEMEX)
2004 Lifting CostUS$/boe
5.4 5.34.6
4.3 4.0 3.83.5 3.4
2.6
ChevronTexaco
ConocoPhillips
ExxonMobil
Petrobras RD Shell Statoil BP Total

DCF, January 2, 200610
Important Supplier of Crude Oil to the U.S.
(2) Source: Energy Information Administration (EIA)(1) Source: PEMEX
PEMEX’s exports by region 2004(1)
U.S. Importsby region 2004(2)
100% = 1.9 MMbd 100% = 10.0 MMbd
Saudi Arabia
Europe
Other Non-OPEC
VenezuelaOther OPEC
MexicoCanada
Rest of America
Far East USA 15%
16%
13%
16%
18%
22%
10%
2%9%
79%

DCF, January 2, 200611
EBITDA(1) of the Major Integrated Oil Companies
EBITDA 2004
MMMUS$
(1) Earnings before interests, taxes, depreciation and amortization.Source: Bloomberg, excluding PEMEX
45.6 45.0
32.629.6
25.2
19.517.0
13.4 13.3
ExxonMobil
BP Total RD Shell ChevronTexaco
ConocoPhillips
Statoil Petrobras

DCF, January 2, 200612
PEMEX EBITDA 2004
MMMUS$
(1) Special tax on production and services(2) Depreciation and amortization(3) Cost of the reserve for retirement payments, pensions and indemnities
Total sales
Total sales net of IEPS
Costs and expenses
Operating income net
of IEPS
Other revenues
D&A(2) EBITDACost of the reserve(3)
IEPS(1)
3.7
28.34.8
45.0
4.7
1.035.6
63.968.7
DCF, January 2, 200613
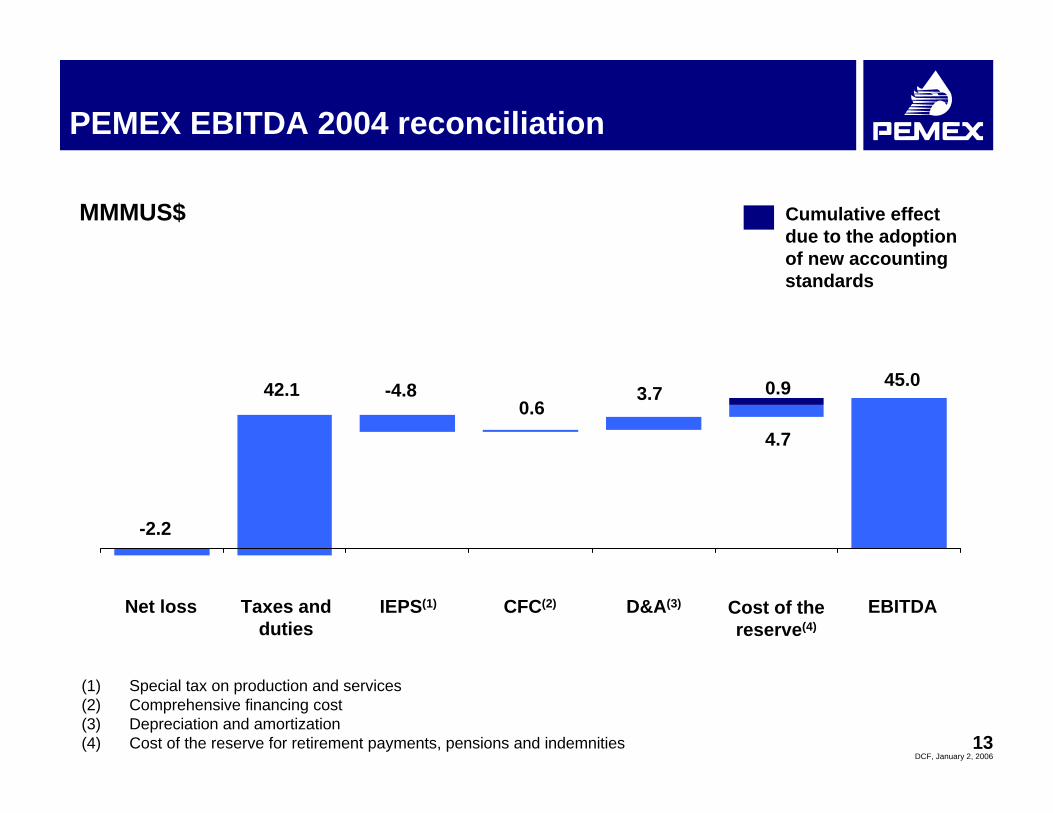
PEMEX EBITDA 2004 reconciliation
MMMUS$
(1) Special tax on production and services(2) Comprehensive financing cost(3) Depreciation and amortization(4) Cost of the reserve for retirement payments, pensions and indemnities
Net loss Taxes and duties
IEPS(1) CFC(2) D&A(3) EBITDACost of the reserve(4)
42.1 3.745.0
-2.2
-4.80.6
4.7
0.9
Cumulative effect due to the adoption of new accounting standards

DCF, January 2, 200614
Agenda
PEMEX Highlights
Lines of Business
CAPEX and Financing Program
New Fiscal Regime
Looking Forward

DCF, January 2, 200615
Untapped Exploration Potential
BasinsPEMEX has studied approximately 26% of Mexico’s prospective area
Approx. 55% of the prospective resources is found in the deep waters of the Gulf of Mexico
Approx. 33% of the prospective resources is found in southeast Mexico, where PEMEX currently holds a large amount of its operations
Mexico’shydrocarbons potential(MMMboe)
3P Reserves:
Total prospective resources(1) (mean):
Total remaining production potential in Mexico:
46.9
53.8
100.7
Prospective resources(MMMboe)
As a % of total prospective resources
Sabinas 1%0.3
Burgos 6%3.1
Tampico – Misantla 3%1.6
Veracruz 2%0.8
Sureste 33%17.7Golfo de México Profundo 55%29.3
Plataforma de Yucatán 1%0.3
(1) As of December 31, 2004. Stochastic addition, results may vary from an algebraic addition.

DCF, January 2, 200616
E&P Projects (1/2)
Reserves Development
(1) Proved and probable reserves as of December 31, 2004(2) Forecast based on portfolio 5.2E (3) Strategic Gas Program
OffshoreOnshore
1
43
7 2
5 6
1. Amatitlán (Chicontepec)2. Crudo Ligero Marino (SGP)(3)
3. Agua Fría (Chicontepec)4. Ayín-Alux5. San Manuel (SGP)(3)
6. Ixtal-Manik (SGP)(3)
7. Burgos
Project
Oil reserves(1)
(MMb)
Gas reserves(1)
(MMMcf)
1,740766357299214184
98
2,338906637
671,084
993,006
393230173
741155
-
202920072012201420062008
-
Oil peakproduction(2)
(Mbd) Year
Gas peakproduction(2)
(MMcfd) Year
439641191
19214
631,260
2029200720122014200620082009

DCF, January 2, 200617
E&P Projects (2/2)
OffshoreOnshore
9
11
8
10
8. Cantarell9. Ku-Maloob-Zaap10. Antonio J. Bermúdez11. Jujo-Tecominoacán12. Poza Rica13. Bellota Chinchorro14. Cactus Sitio Grande
Project
Oil reserves(1)
(MMb)
Gas reserves(1)
(MMMcf)
8,8844,3522,207
923670334308
2,3121,0482,4951,110
791532507
1,996794161
88515327
2006201020082008201120082010
Oil peakproduction(2)
(Mbd) Year
Gas peakproduction(2)
(MMcfd) Year
727324282
80567073
2006201020082008201120082010
Injection
N2N2N2N2
H2OPP(3)
PP(3)
(1) Proved and probable reserves as of December 31, 2004(2) Forecast based on portfolio 5.2E (3) Pneumatic pumping
12
13 14
Secondary / Enhanced Recovery

DCF, January 2, 200618
Refining System
Salamanca• 245 Mbd• 1,929 KEDC, C.I. = 8.8• Supplies fuels for central
and western areas• Base lubricant production
Madero• 195 Mbd• 2,996 KEDC, C.I. = 15.8• Supplies fuels for
Central and Gulf Areas
Tula• 320 Mbd• 3,408 KEDC, C.I. = 11.0• Supplies fuels for
MCMA(2), Morelos and Guerrero
Salina Cruz• 330 Mbd• 2,869 KEDC, C.I. = 8.8• Supplies fuels for Pacific Coast
Cadereyta• 275 Mbd• 3,313 KEDC, C.I. = 13.1• Supplies fuels for northern area
Refining System • KEDC(1): 2,675• Complexity Index (C.I.): 11.3
(1) K=1,000; EDC=Equivalent Distillation Capacity(2) MCMA = Mexico City’s Metropolitan Area
Salamanca
Madero
Tula
Salina Cruz
Cadereyta
Minatitlán
Minatitlán• 200 Mbd• 1,538 KEDC, C.I. = 7.7• Supplies fuels for southern
area and Yucatán Peninsula

DCF, January 2, 200619
Refining
Modernization of the refining system
Increase in heavy crude processing capacity
Raise output of high value added refined products
Meet international standards of quality in gasolines and diesel
Real time monitoring of the pipeline system
Main projects
Distribution (SCADA, maritime terminals modernization)Production facilities (Minatitlán revamping, residual conversion in Tula and Salamanca)Gasolines and diesel (improvements in quality by lower sulfur content)
Minatitlán refinery revamping is expected to be finished in 2009– Total estimated CAPEX:
MMMUS$2.4– Expected incremental production of
gasolines: 86 Mbd– Expected incremental production of
intermediate distillates: 47 Mbd

DCF, January 2, 200620
Natural Gas
Increase processing capacity
Enhance flexibility of the transportation system
Raise import-export capacity (currently, there are ten interconnections with the U.S.)
Capacity expansion of the processing system in northern Mexico to capture natural gas liquids (6 cryogenic plants: 2 started operations in 2004, 2 are under construction and 2 more are expected to be constructed in the following years)
New compression stations to increase the transport capacity in the Central and South Western Regions of Mexico
Step up processing and improve transportation
Main projects
Gas processing centers
Pipelines (km): 9,109Sweetening plantscapacity(1) (MMcfd): 4,503Liquids recovery plantscapacity(1) (MMcfd): 5,546
(1) 92% of the sweetening capacity and 69% of the liquids recovery capacity is located in Cd. Pemex, Cactus and Nuevo Pemex
nReynosa
n
Poza RicaCd Pemex
Nuevo PemexCactus
Matapionchenn
nn n
n
La VentanBurgosnArenque
Coatzacoalcos area(Cangrejera, Morelos, Pajaritos)

DCF, January 2, 200621
Petrochemicals
Invest in profitable petrochemical chains
Possible joint ventures with private sector in minority role companies to integrate the value chains
Capacity expansions on the ethane chain and the aromatic chain in order to meet domestic demand and reduce imports
Seize opportunities
Main projects
5
5
5
5
55
Camargo
Tula
San Martín Texmelucan
Pajaritos
Cosoleacaque Cangrejera
Morelos5
5
Escolín
Petrochemical centers
On September 15, 2004, a resolution was published in the Official Gazette of the Federation (Diario Oficial de la Federación) authorizing the Ministry of Energy to carry out the merger of the seven subsidiaries of Pemex-Petrochemicals. On September 15, 2005, the Ministry of Energy requested a 6 months extension
Pemex-Petrochemicals’ subsidiary companies consolidation

DCF, January 2, 200622
Agenda
PEMEX Highlights
Lines of Business
CAPEX and Financing Program
New Fiscal Regime
Looking Forward

DCF, January 2, 200623
SGP(2) (8%)
Burgos (10%)
KMZ(1) (6%)
A. J. Bermúdez (2%)
Cantarell (26%)
Others (28%)
CAPEX 2001-2005100% = MMMUS$ 40.5
Oil productionMbd
0
1,000
2,000
3,000
4,000
2001 2002 2003 2004 2005 2006 2007 2008 2009 2010
Chuc, Jujo yEl Golpe (4%)
Exploration (16%)
Natural gas productionMMcfd
0100020003000400050006000700080009000
2001 2002 2003 2004 2005 2006 2007 2008 2009 2010
Forecast
Forecast
Oil and Gas Production and E&P CAPEX
(1) Ku-Maloob-Zaap(2) Strategic Gas Program

DCF, January 2, 200624
Historical and Projected CAPEX
6.4 5.8
8.3
3.12.0 1.6 1.0 1.1 1.8 1.6 1.9 2.5 2.8 3.0
2.1 2.03.1 3.6 3.1 2.6 3.0 3.0 2.2 1.7 1.1 1.8
0.6 2.0 2.9
4.5 3.9 5.68.4 9.8
9.9
80 81 82 83 84 85 86 87 88 89 90 91 92 93 94 95 96 97 98 99 00 01 02 03 04 05E
MMMUS$ PIDIREGAS
Non - PIDIREGAS
PIDIREGAS: Long-term productive infrastructure projects(1) Authorized by the Ministry of Finance on May 20, 2005 (Adecuado III)
5.15.5
7.56.9
7.8
10.110.9
4.2
11.7
(1)

DCF, January 2, 200625
CAPEX 2005
11.7Total
0.1Others
0.2Petrochemicals
0.4Gas and Basic Petrochemicals
1.2Refining
9.8Exploration and Production
2005E (1) CAPEX 2005E100% = MMM US$11.7 (1)
(1) Authorized by the Ministry of Finance on May 20, 2005 (Adecuado III)
10%2%
84%
1% 3%
CAPEXMMM US$

DCF, January 2, 200626
EBITDA and Interest Coverage
15.9x15.2x
2003 2004
33.2
45.0
2003 2004
EBITDA / InterestEBITDA
Note: EBITDA net of sales taxes (IEPS). Interest expense does not include capitalized interest
MMMUS$ Times

DCF, January 2, 200627
Debt-to-Reserves Ratio vs. Peers
Source: Companies’ 2004 Annual Reports, 2004 20-F’s, 2004 Financial Results1) Audited financial statements and proved reserves data as of December 31, 2004. Debt is the sum of documented debt, notes
payable to contractors and sale of future account receivable
Debt / Proved reservesUS$ / boe
2.5
2.0 1.9 1.8
1.41.2
1.0 1.0
0.4
ConocoPhillips
BP Petrobras Stat Oil RD Shell Total ChevronTexaco
ExxonMobil
(1)

DCF, January 2, 200628
Credit Profile Relative to Integrated Majors
Source: Companies’ 2004 Annual Reports, 2004 20-F’s, 2004 Financial Results1) Data as of December 31, 2004, PEMEX’s proved reserves in accordance with the definition of proved reserves
under Rule 4.10(a) of Regulation S-X under the U.S. Securities Act of 1933
Senior Unsecured RatingsS&PMoody´sFitch
Operating DataProved Reserves (MMMboe) (1)
Production (MMboed)Proved Reserves Life (years)CAPEX (MMMUS$)
Exxon Mobil
BBBBaa1BBB-
17.64.4
11.010.9
Aa1
11.93.8
8.613.6
AA+Aa1AA+
14.64.0
10.014.5
AAAAaaAAA
22.04.2
14.314.9
AAAa2AA
11.12.6
11.811.8
AAAa2AA
11.32.5
12.38.3
A-A3A-
7.61.6
13.09.5
RD Shell
Total BP Chevron Texaco
ConocoPhillips
Ba1BB-
11.81.5
21.77.4
Petrobras
AAA2
4.31.1
10.67.0
Statoil(2)

DCF, January 2, 200629
Agenda
PEMEX Highlights
Lines of Business
CAPEX and Financing Program
New Fiscal Regime
Looking Forward

DCF, January 2, 200630
PEMEX’s New Fiscal Regime: Introduction
• The purpose of the new fiscal regime is to strengthen PEMEX’s competitiveness and contribute to improving its financial position
• The new fiscal regime is in effect since January 1, 2006
• On December 21, 2005, PEMEX’s new fiscal regime was published in the Official Gazette of the Federation (Diario Oficial de la Federación)
• Under the new structure, taxes and duties for E&P are established in the “LeyFederal de Derechos”. Taxes and duties for the rest of the subsidiary entities remain included in the “Ley de Ingresos de la Federación”(oil income tax)

DCF, January 2, 200631
Agenda
PEMEX Highlights
Lines of Business
CAPEX and Financing Program
New Fiscal Regime
Looking Forward

DCF, January 2, 200632
Looking Forward
• Implementing value management oriented to efficiency
• Implement corporate governance best practices
Looking forward

DCF, January 2, 200633
Implementing Value Management Oriented to Efficiency
• Process reengineering
• Implementing best practices in projects management
• Optimization of plants and pipelines
• Optimization of the procurement process
• Value management for corporate services (medical and telecom)
• Implementing compensation according to performance

DCF, January 2, 200634
Implement Corporate Governance Best Practices
• Lack of transparency and accountability of the management process
• PEMEX budget part of the federal budget
• Overburden and inefficient audit system
• Legal restrictions for joint ventures
• These “problems” are means of controls over the administration
• All firms face the problem of the separation of ownership from management
• The solution to this problem is “Best Practices”- Corporate Governance

DCF, January 2, 200635
Modernization of PEMEX
• New fiscal regime• Independence from the federal
budget• Issuance of quasi-shares
Financial flexibility
• More efficient audit system• New procurement laws• Joint ventures
Operational flexibility
• New corporate governance creates accountability and transparency
• Continue to incorporate best practices:– Independent board members– Board Committees– Prompt disclosure of
information– Compensation based on
performance– Clear mandate to create
value– OECD guidelines on the
corporate governance of state-owned enterprises

DCF, January 2, 200636
www.pemex.com
Contact information:
Investor Relations(52 55) 1944 9700