de la rue plcinvestors.delarue.com/.../prelim-presentation-2012.pdf2009 2010 2011 2012f (bn) paper...
TRANSCRIPT
© De La Rue 2012
Full Year Results
29 May 2012
De La Rue plc

© De La Rue 2012
Agenda
Group Headlines
Financial Results
Business and Markets
Delivering the Improvement Plan
Outlook
2
© De La Rue 2012
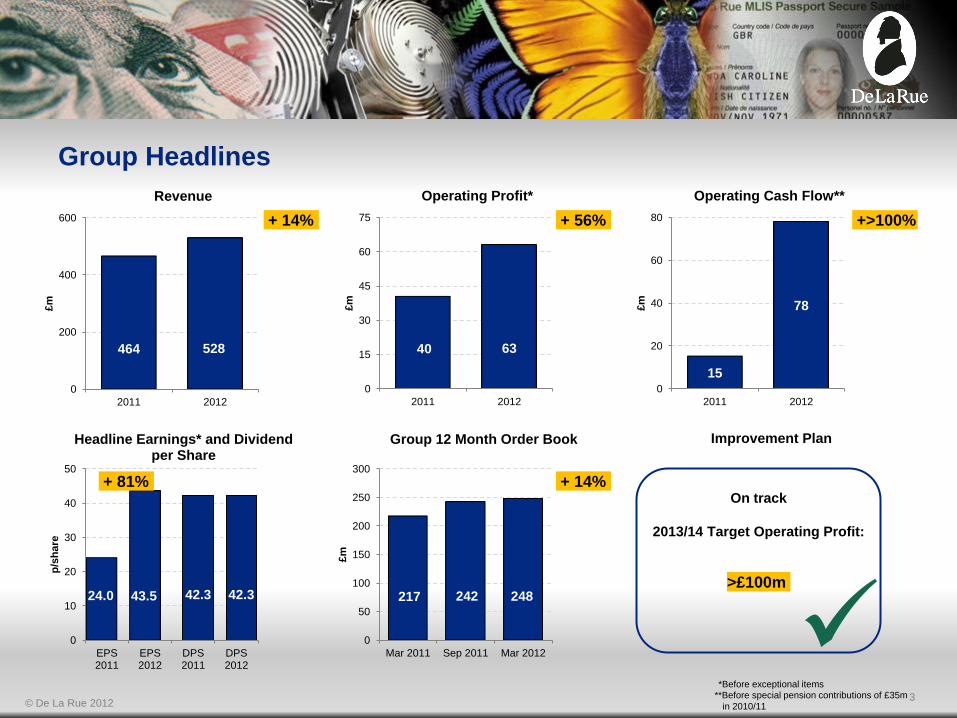
24.0 43.5 42.3 42.3
0
10
20
30
40
50
EPS 2011
EPS 2012
DPS 2011
DPS 2012
p/s
hare
Headline Earnings* and Dividend per Share
Group Headlines
15
78
0
20
40
60
80
2011 2012
£m
Operating Cash Flow**
217 242 248
0
50
100
150
200
250
300
Mar 2011 Sep 2011 Mar 2012
£m
Group 12 Month Order Book
40 63
0
15
30
45
60
75
2011 2012
£m
Operating Profit*
464 528
0
200
400
600
2011 2012
£m
Revenue
**Before special pension contributions of £35m
in 2010/11
*Before exceptional items
+ 14% + 56% +>100%
On track
2013/14 Target Operating Profit:
+ 81% + 14%
Improvement Plan
>£100m
3
© De La Rue 2012
Financial Results
Colin Child
Group Finance Director
© De La Rue 2012
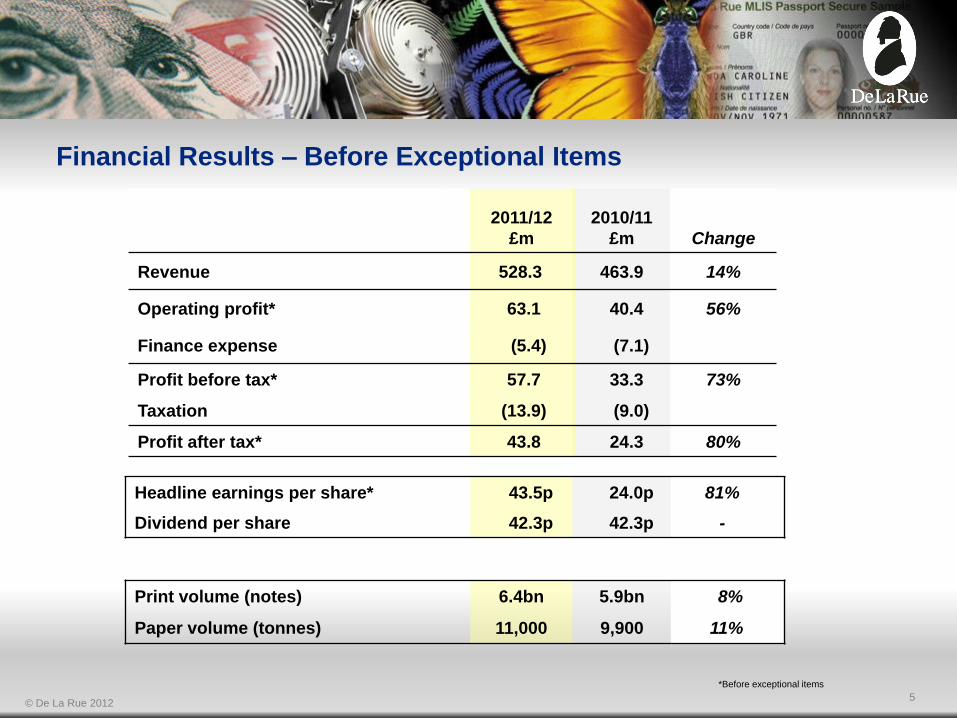
Print volume (notes) 6.4bn 5.9bn 8%
Paper volume (tonnes) 11,000 9,900 11%
Headline earnings per share* 43.5p 24.0p 81%
Dividend per share 42.3p 42.3p -
2011/12
£m
2010/11
£m Change
Revenue 528.3 463.9 14%
Operating profit* 63.1 40.4 56%
Finance expense (5.4) (7.1)
Profit before tax* 57.7 33.3 73%
Taxation (13.9) (9.0)
Profit after tax* 43.8 24.3 80%
Financial Results – Before Exceptional Items
5
*Before exceptional items

© De La Rue 2012
2011/12
£m
2010/11
£m
Improvement plan (24.1) -
Curtailment gain on closure of defined benefit pension
scheme - 16.0
Paper production quality issues (0.7) (29.0)
Corporate costs - (2.6)
Profit on sale of Camelot investment - 55.1
Total exceptional items (24.8) 39.5
Tax credit on exceptional items 13.2 3.6
Exceptional Items
6
© De La Rue 2012
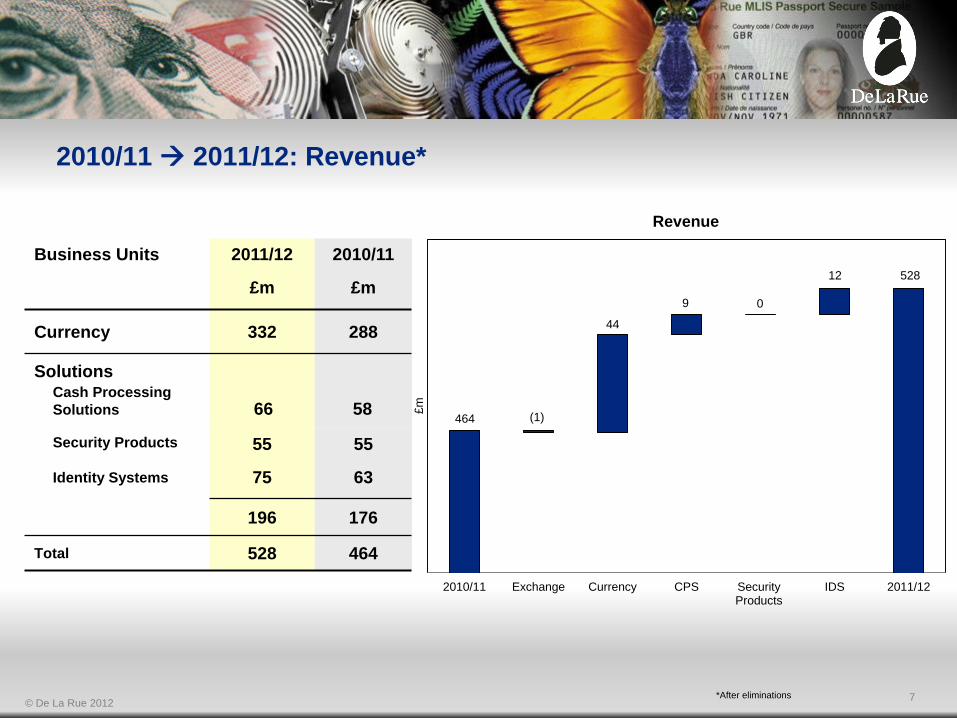
Business Units 2011/12
£m
2010/11
£m
Currency 332 288
Solutions Cash Processing
Solutions
Security Products
Identity Systems
55
75
55
63
196 176
Total 528 464
2010/11 Exchange Currency CPS Security Products
IDS 2011/12
£m
(1)
2010/11 2011/12: Revenue*
Revenue
464
44
9 0
12 528
7 *After eliminations
66 58

© De La Rue 2012
Business Units 2011/12
£m
2010/11
£m
Currency 45 28
Solutions Cash Processing
Solutions
Security Products
Identity Systems
7
9
9
3
18 12
Total 63 40
2010/11 Cotton Price
Exchange Improvement Plan
IDS Mix/Volume Other 2011/12
£m
2010/11 2011/12: Operating Profit*
Operating Profit*
40 (9)
(1)
5
8
(3)
63
23
8 *Before exceptional items
2 -

© De La Rue 2012
2011/12
£m
2010/11
£m
Operating profit before exceptional items 63.1 40.4
Depreciation 26.6 24.4
Working capital 11.9 (14.4)
Pension fund contributions (23.1) (7.5)
Other 3.6 (1.7)
Operating cash flow before special pension
contribution & operating exceptional items 82.1 41.2
Special pension fund contribution - (35.0)
Cash costs of exceptional items (3.7) (26.5)
Cash flow from operating activities 78.4 (20.3)
Operating Cash Flow
9
© De La Rue 2012
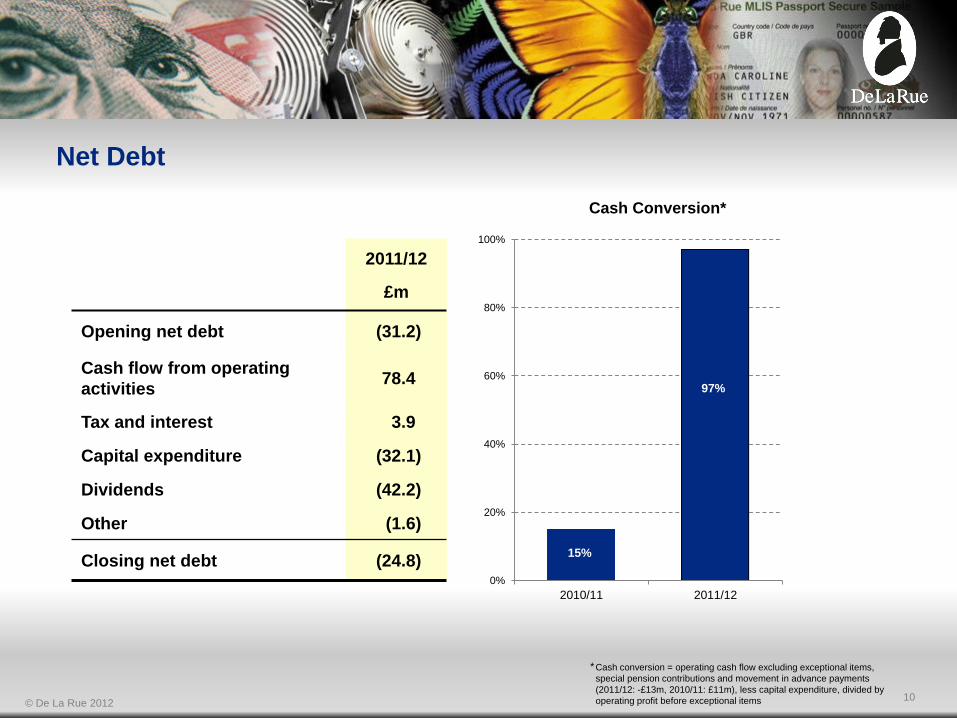
2011/12
£m
Opening net debt (31.2)
Cash flow from operating
activities 78.4
Tax and interest 3.9
Capital expenditure (32.1)
Dividends (42.2)
Other (1.6)
Closing net debt (24.8)
Net Debt
Cash conversion = operating cash flow excluding exceptional items,
special pension contributions and movement in advance payments
(2011/12: -£13m, 2010/11: £11m), less capital expenditure, divided by
operating profit before exceptional items
94%
15% 0%
20%
40%
60%
80%
100%
2010/11 2011/12
Cash Conversion*
97%
15%
*
10
© De La Rue 2012
Business and Markets
Tim Cobbold
Chief Executive

© De La Rue 2012
De La Rue Business Overview
Banknote substrates and security features
Design, origination and printing
High speed cash sorting and inspection
equipment
Service, maintenance and spares
Cash management solutions
Design, origination and printing of secure
products
Tax stamp and authentication solutions
Currency
Proportion of
Group 2011/12
63% 72%
12% 3%
11% 12%
14% 13%
Revenue Operating
Profit
So
luti
on
s
Cash
Processing
Solutions
Security
Products
Identity
Systems
Design, origination and printing of identity
documents
Personalisation solutions
12

© De La Rue 2012
0
40
80
120
160
200
2009 2010 2011 2012F 2015F
Ban
kn
ote
s (
bn
)
Global Banknote Issuance** - CAGR 4%
100
200
300
400
500
2001 2002 2003 2004 2005 2006 2007 2008 2009 2010
Ind
ex
Value of Cash in Circulation*
Currency Market – Robust Long Term Growth
supply
cash issued
withdrawn
cash
Destruction
Banknote
Supplier
Central
Bank
Stock
Cash Cycle
Cash
Centre
Nigeria
US
Brazil
UK
Global Banknote Issuance has 4% CAGR over the
past 20 years**
Malaysia
CAGR
13
17%
15%
5%
6%
9%
**Source: Estimates De La Rue
*Source: IMF, May 2012
© De La Rue 2012
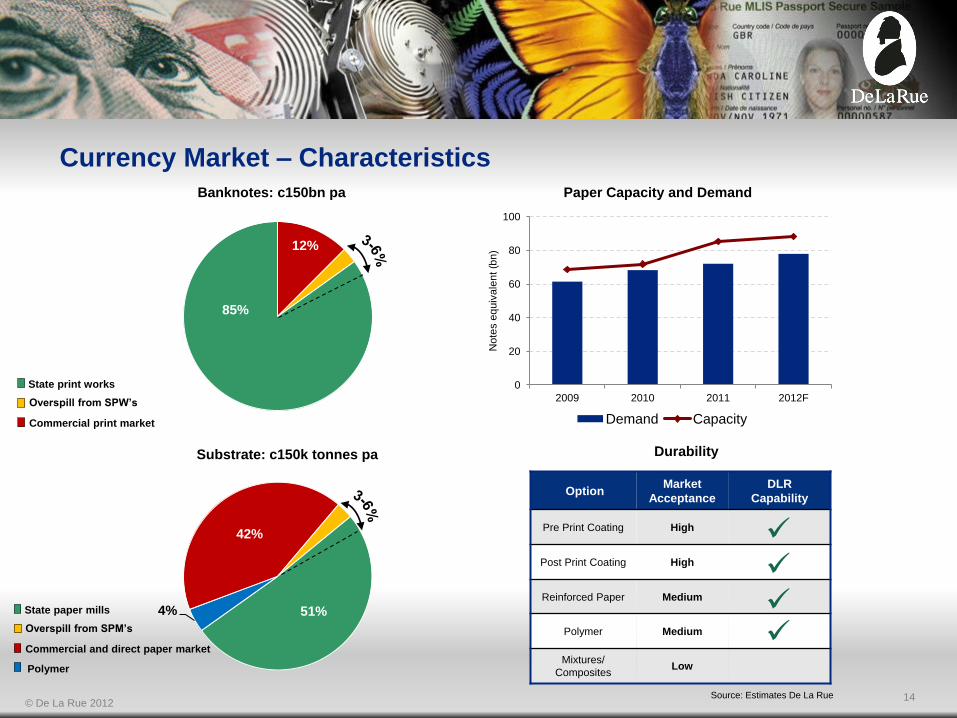
12%
85%
Banknotes: c150bn pa
42%
51% 4%
Substrate: c150k tonnes pa Durability
0
20
40
60
80
100
2009 2010 2011 2012F
No
tes e
quiv
ale
nt
(bn)
Paper Capacity and Demand
Demand Capacity
Currency Market – Characteristics
Option Market
Acceptance
DLR
Capability
Pre Print Coating High
Post Print Coating High
Reinforced Paper Medium
Polymer Medium
Mixtures/
Composites Low
Commercial print market
Overspill from SPW’s
State print works
Commercial and direct paper market
Overspill from SPM’s
State paper mills
Polymer
14 Source: Estimates De La Rue

© De La Rue 2012 Source: Estimates De La Rue
15
Integrated Presence – Print and Substrate
De La Rue
Oberthur
Other
De La Rue Distribution of
Currency Sales
UK & Ireland Central
&South
America
De La Rue
G&D
Arjo
Crane
Securency
Fabriano
Other
Print : Available Market Share
Middle East
Africa
Rest of
the World
Far East
& Asia
Substrate : Available Market Share
G&D

© De La Rue 2012
Integrated Presence – Technology & Design
Technology – Providing Security
Depth™ Thread
Holographic
Stripe
StarChrome®
colourshift
thread (red)
StarChrome®
colourshift thread
(green)
Watermark
Intaglio
Invisible
Fluorescent
Thread
backlit
Micro-printing
Design – Reflecting National Identity
De La Rue customer banknotes
have won every major industry
design award in the past five years.
16
© De La Rue 2012
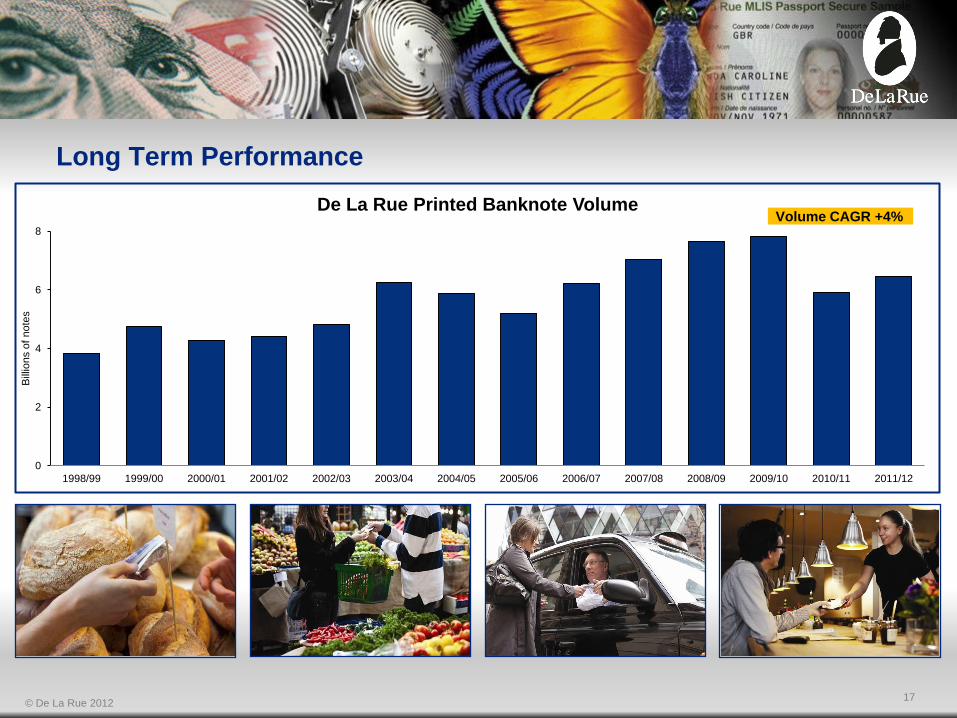
0
2
4
6
8
1998/99 1999/00 2000/01 2001/02 2002/03 2003/04 2004/05 2005/06 2006/07 2007/08 2008/09 2009/10 2010/11 2011/12
Bill
ions o
f note
s
De La Rue Printed Banknote Volume
Long Term Performance
Volume CAGR +4%
17
© De La Rue 2012
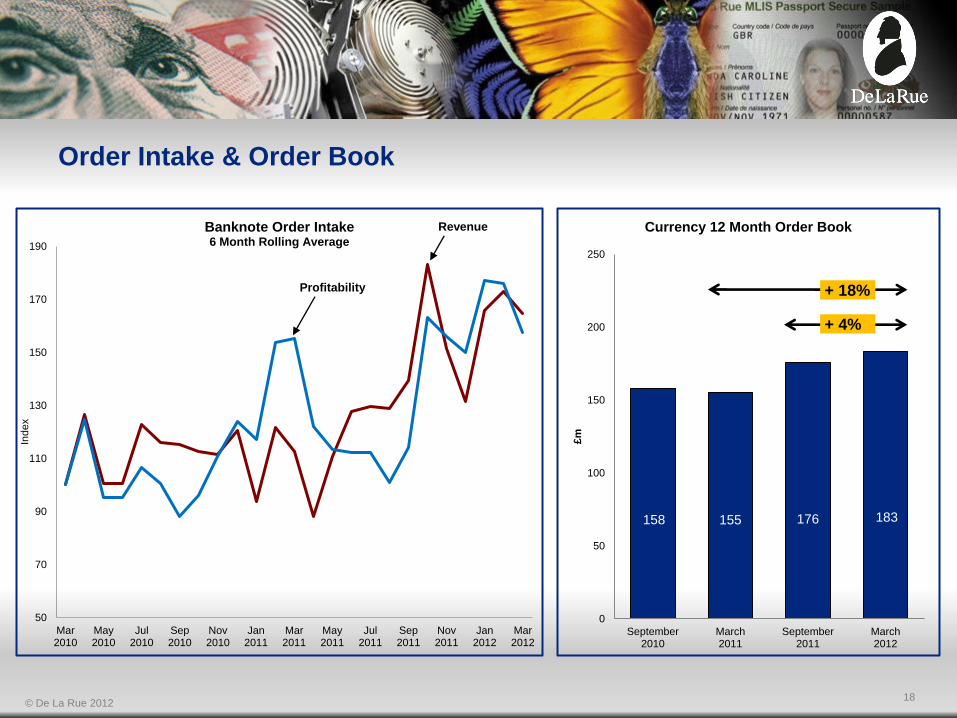
Order Intake & Order Book
50
70
90
110
130
150
170
190
Mar 2010
May 2010
Jul 2010
Sep 2010
Nov 2010
Jan 2011
Mar 2011
May 2011
Jul 2011
Sep 2011
Nov 2011
Jan 2012
Mar 2012
Ind
ex
Banknote Order Intake 6 Month Rolling Average
158 155 176 183
0
50
100
150
200
250
September 2010
March 2011
September 2011
March 2012
£m
Currency 12 Month Order Book
+ 18%
+ 4%
Revenue
Profitability
18

© De La Rue 2012
Solutions – Moving Forward
Pe
rfo
rman
ce
Ca
se S
tud
y
Cash Processing Solutions
40
50
60
70
2011 2012
£m
Revenue
0
5
10
2011 2012
£m
Operating Profit*
Security Products
50
55
60
2011 2012 £
m
Revenue
0
5
10
2011 2012
£m
Operating Profit*
50
60
70
80
2011 2012
£m
Revenue
Identity Systems
0
10
20
2011 2012
£m
Operating Profit*
Vaultex UK Ltd Long term partnership approach
Equipment & Business Intelligence
Software Solutions
UK Passport £400m contract over 10 years
Over 7 million books produced
Demanding service levels
Sh
are
d
Infr
as
tru
ctu
re
Sales & Pipeline Management
Solution Design & Project Management
Commercial Marketing
Finance
Service
Cameroon Tax Stamps Tobacco and Alcohol labels launched
Pharmaceutical labels to follow
Track and Trace system in final phase
Training of enforcement officers underway
*Before exceptional items
19

© De La Rue 2012
Delivering the Improvement Plan
Tim Cobbold
Chief Executive

© De La Rue 2012
Improvement Plan
Target: 2013/14 Operating Profit of >£100m
Opportunities Fundamental Strengths
Brand and reputation
Long standing customer relationships
Strong integrated competitive position
Record of innovation
High margin, cash generative model
Focus, focus, focus
Deepen and broaden „One De La Rue‟
Improve sales and marketing
effectiveness
Maximise technological capability
Develop supply chain
21
© De La Rue 2012
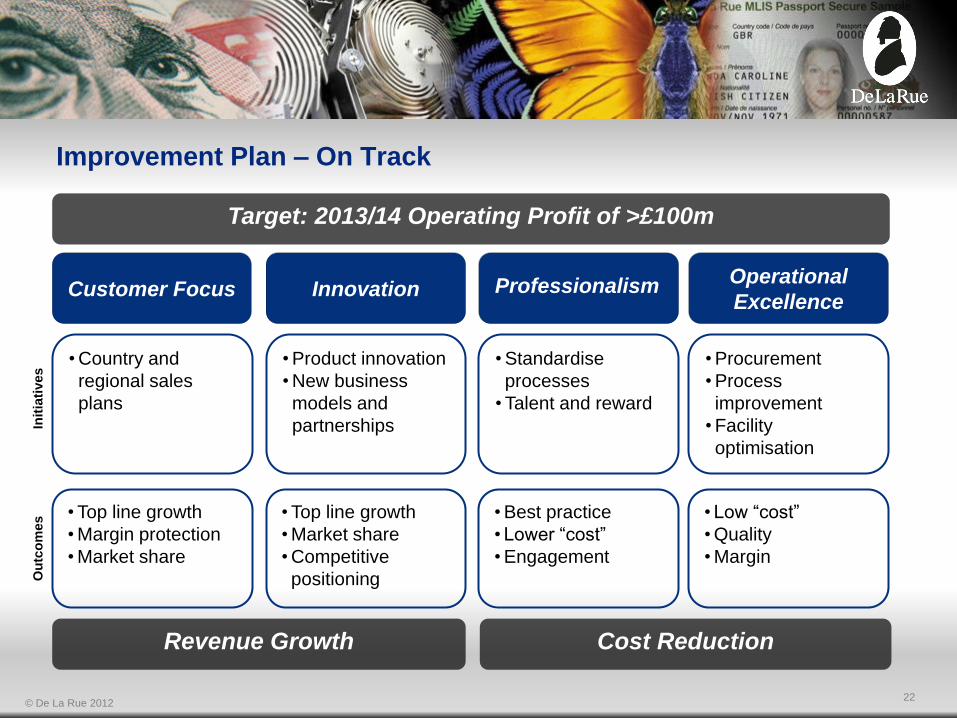
Improvement Plan – On Track
Revenue Growth
Innovation Operational
Excellence Customer Focus
• Product innovation
• New business
models and
partnerships
• Top line growth
• Market share
• Competitive
positioning
• Standardise
processes
• Talent and reward
• Best practice
• Lower “cost”
• Engagement
• Low “cost”
• Quality
• Margin
• Country and
regional sales
plans
• Top line growth
• Margin protection
• Market share
Init
iati
ve
s
Ou
tco
me
s
Cost Reduction
Target: 2013/14 Operating Profit of >£100m
Professionalism
• Procurement
• Process
improvement
• Facility
optimisation
22

© De La Rue 2012
New Structure & Organisation – Operational
Currency
£332m
Solutions
£196m
Currency
£332m
Cash Processing
Solutions £66m
Security Products
£55m
Identity Systems
£75m
Legal & Company
Secretarial
Finance
Human Resources
Currency
Solutions
Strategy & Business
Development
Business
Transformation Supply Chain
Customer Focus Innovation Professionalism
23
Operational
Excellence

© De La Rue 2012
Full Potential Country Plan
Stage III
Actions
identified and in
process
Stage I
Identify
opportunities
Customer Focus – Country Plans – Identifying Opportunities
Stage II
Set vision and
targets
„One De La Rue‟ approach
Technology led
Focus on partnerships
„Out of the box‟ thinking
Added value service and support COMPLETE
>40 Countries
COMPLETE
>40 Countries
COMPLETE
13 Countries
24
„A‟
„To partner with the
government for the supply
of high profile national
security documents;
passports, banknote paper,
sorters and tax stamp
solutions.’
<£1m pa <£4m pa
£20m pa £8m pa
‘To be the partner of choice
for the production of secure
documents and their
authentication solutions as
well as to develop access
to the commercial market
for sorting machines and
software.’
Country
Strategic
vision
Sales last
5 years
Full
potential
„B‟
© De La Rue 2012
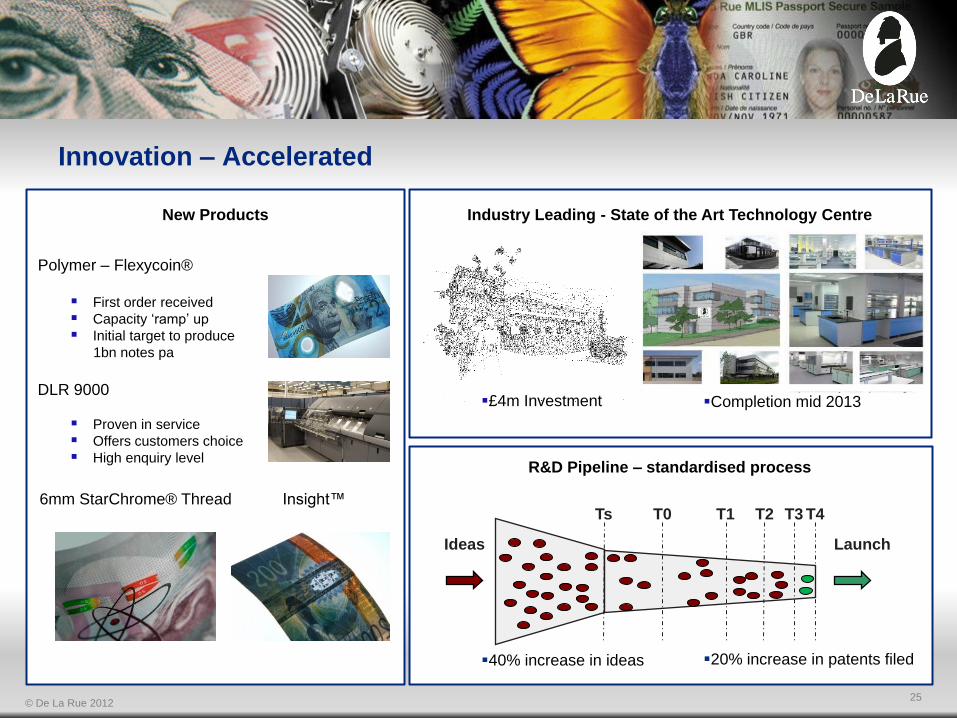
Innovation – Accelerated
New Products
Polymer – Flexycoin®
First order received
Capacity „ramp‟ up
Initial target to produce
1bn notes pa
DLR 9000
Proven in service
Offers customers choice
High enquiry level
Industry Leading - State of the Art Technology Centre
£4m Investment
Ideas Launch
Ts T0 T1 T2 T4 T3
Completion mid 2013
R&D Pipeline – standardised process
40% increase in ideas 20% increase in patents filed
6mm StarChrome® Thread Insight™
25
© De La Rue 2012
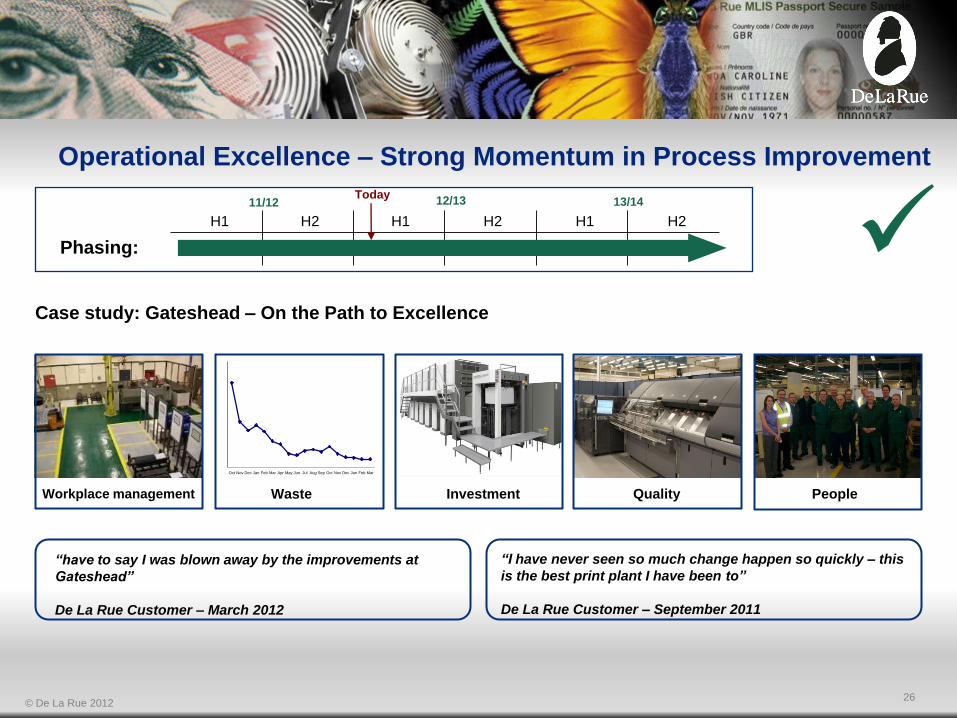
Operational Excellence – Strong Momentum in Process Improvement
0%
5%
10%
15%
20%
25%
30%
Oct Nov Dec Jan Feb Mar Apr May Jun Jul Aug Sep Oct Nov Dec Jan Feb Mar
Workplace management Waste Investment Quality People
Phasing:
13/14 11/12 12/13 Today
H2 H1 H2 H1 H2 H1
Case study: Gateshead – On the Path to Excellence
“I have never seen so much change happen so quickly – this
is the best print plant I have been to”
De La Rue Customer – September 2011
“have to say I was blown away by the improvements at
Gateshead”
De La Rue Customer – March 2012
26
© De La Rue 2012
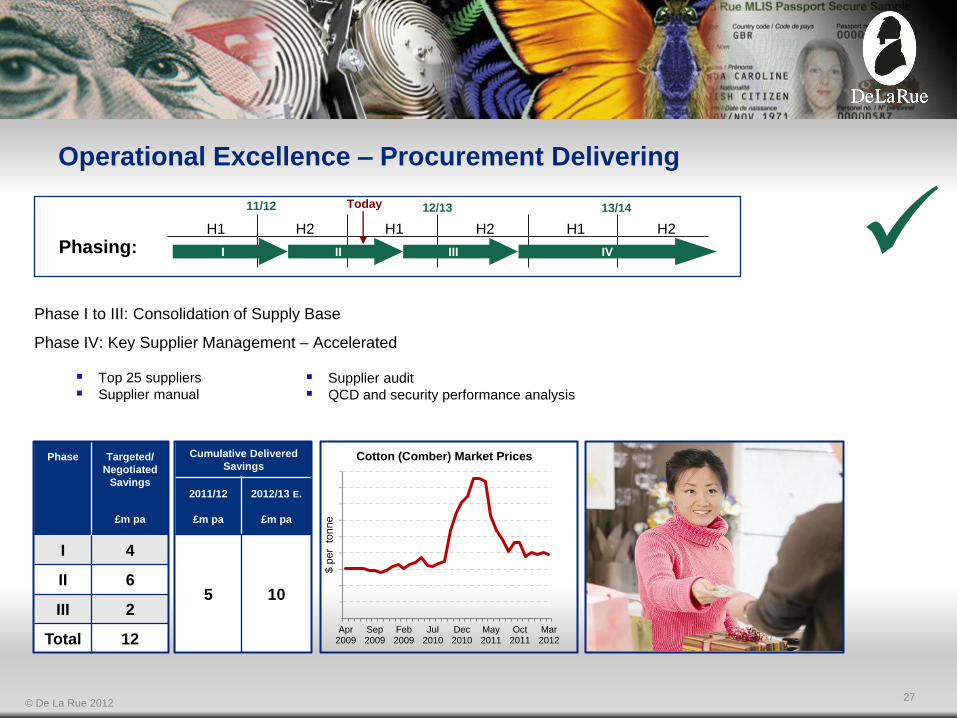
Phase
Targeted/
Negotiated
Savings
I 4
II 6
III 2
Total 12
Cumulative Delivered
Savings
2011/12
£m pa
2012/13 E.
£m pa
5 10
0
500
1000
1500
2000
2500
3000
3500
4000
4500
Apr 2009
Sep 2009
Feb 2009
Jul 2010
Dec 2010
May 2011
Oct 2011
Mar 2012
$ p
er
to
nn
e
Operational Excellence – Procurement Delivering
13/14 11/12 12/13
Phasing:
H2 H1 H2 H1 H2 H1
I III II IV Phase I to III: Consolidation of Supply Base
Phase IV: Key Supplier Management – Accelerated Top 25 suppliers
Supplier manual
Cotton (Comber) Market Prices
Supplier audit
QCD and security performance analysis
27
Today
£m pa
© De La Rue 2012
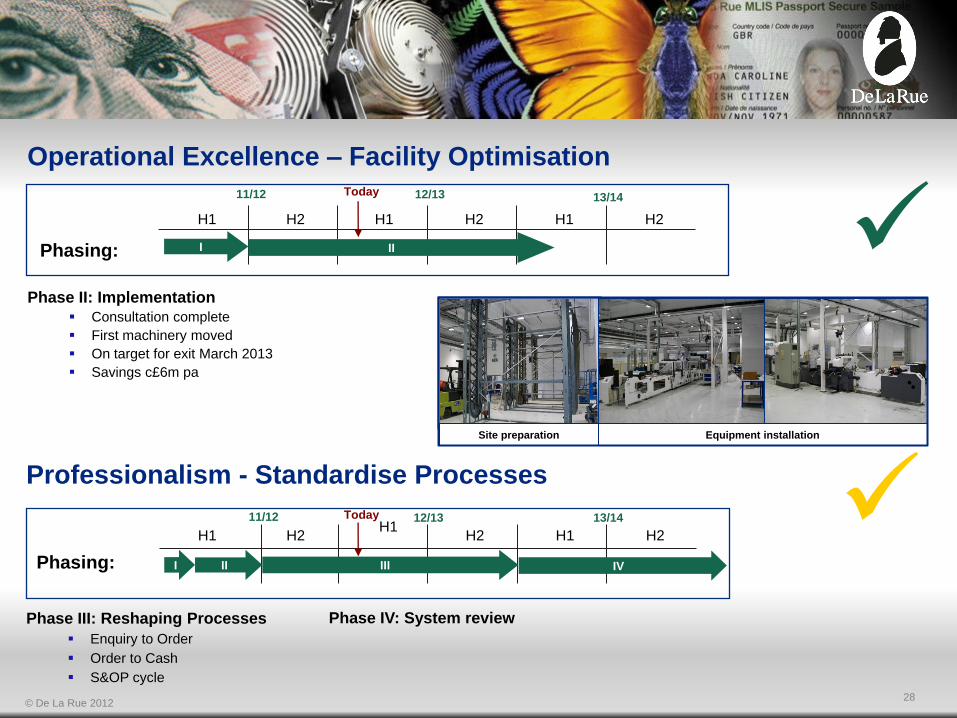
Professionalism - Standardise Processes
Phase III: Reshaping Processes
Enquiry to Order
Order to Cash
S&OP cycle
H2 H1
Phasing:
13/14 11/12 12/13
H2 H1 H2 H1
I III II IV
Phase II: Implementation
Consultation complete
First machinery moved
On target for exit March 2013
Savings c£6m pa
13/14 11/12 12/13
Phasing:
H2 H1 H2 H1 H2 H1
I II
Site preparation Equipment installation
Phase IV: System review
Operational Excellence – Facility Optimisation
28
Today
Today
© De La Rue 2012
Improvement Plan Generating Value for Shareholders
Target Historic revenue growth 4%
Cost reduction £30m
2013/14 Operating profit in excess of £100m
Investment Exceptional costs up to £35m
Capital expenditure phased towards
second and third years ~ £20m
Confidence in delivery
29
© De La Rue 2012
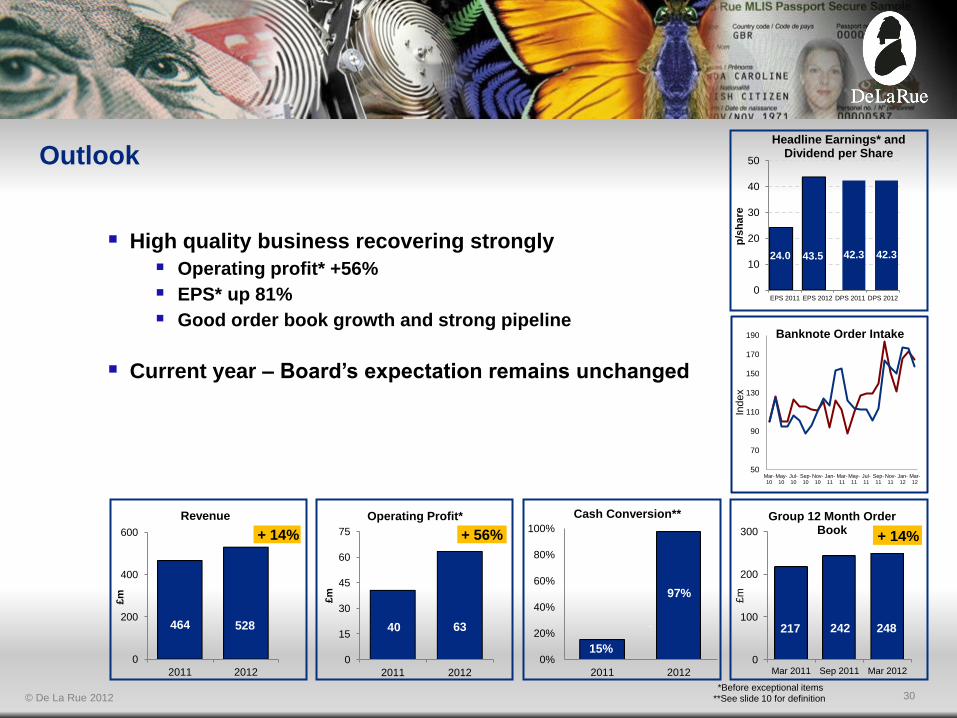
High quality business recovering strongly
Operating profit* +56%
EPS* up 81%
Good order book growth and strong pipeline
Current year – Board’s expectation remains unchanged
217 242 248
0
100
200
300
Mar 2011 Sep 2011 Mar 2012
£m
Group 12 Month Order Book
15%
97%
0%
20%
40%
60%
80%
100%
2011 2012
Cash Conversion**
9464 528
0
200
400
600
2011 2012
£m
Revenue
40 63
0
15
30
45
60
75
2011 2012
£m
Operating Profit*
+ 14% + 56% + 14%
50
70
90
110
130
150
170
190
Mar-10
May-10
Jul-10
Sep-10
Nov-10
Jan-11
Mar-11
May-11
Jul-11
Sep-11
Nov-11
Jan-12
Mar-12
Ind
ex
Banknote Order Intake
30
Outlook
24.0 43.5 42.3 42.3
0
10
20
30
40
50
EPS 2011 EPS 2012 DPS 2011 DPS 2012
p/s
hare
Headline Earnings* and Dividend per Share
**See slide 10 for definition
*Before exceptional items

© De La Rue 2012 31