de martini - eei strategic issues forum oct 19, 2013
TRANSCRIPT
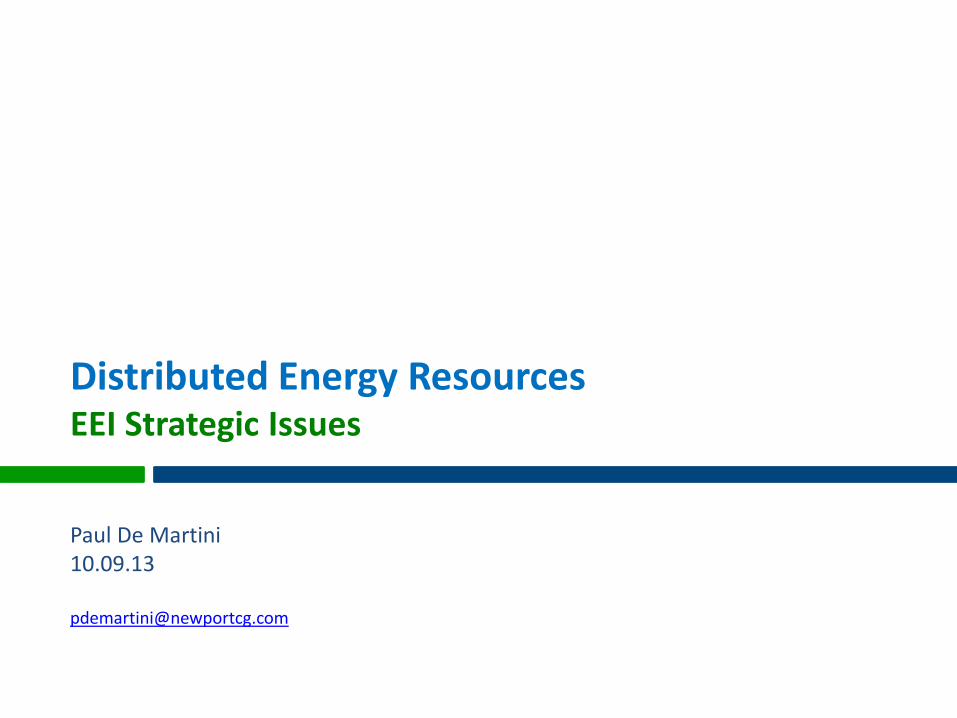
Distributed Energy ResourcesEEI Strategic Issues
Paul De Martini10.09.13
2
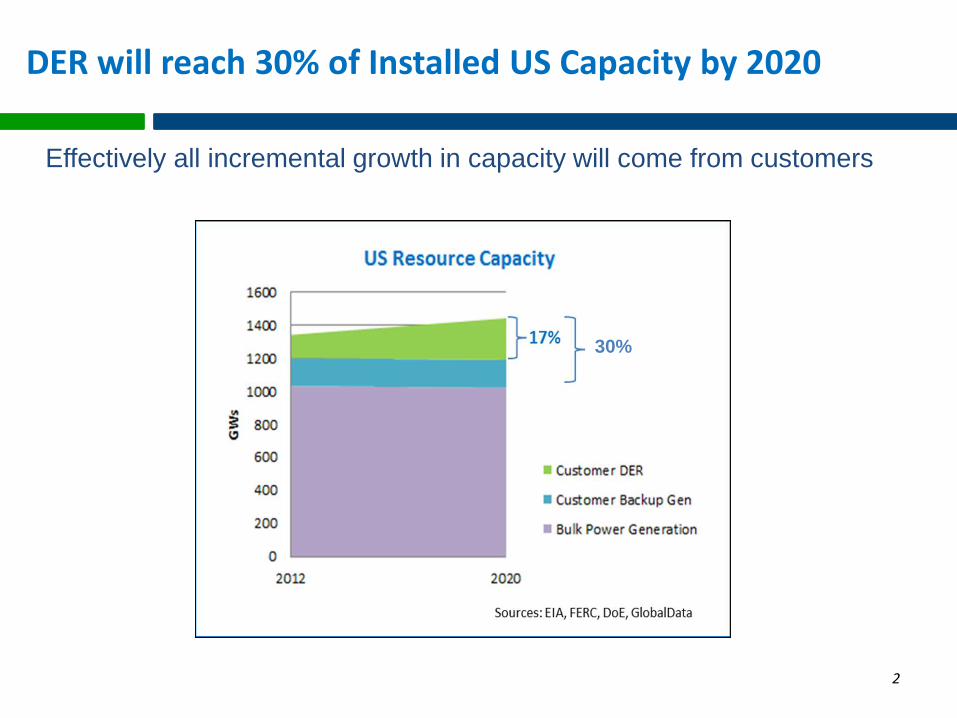
DER will reach 30% of Installed US Capacity by 2020
Effectively all incremental growth in capacity will come from customers
30%

3
Solar PV Reaching Tipping Point Across US
Solar PV system installed in US every 7 minutes in 2012Source: SEIA/GTM Research
“Over the next 20 years, distributed solar (and distributed natural gas fired gen) will do to grid power what cell phones have done to fixed line telephony over the past 20 years.”
David Crane, CEO NRG May, 2013
McKinsey & Co., 2012
Unsubsidized Solar PV(1no margins)
TippingPoint
3
Cost of CA Solarw/o subsidies
SCE Avg Rate16¢/kWh

4
CHP growth in US
White House targets 122 GWs of CHP by 2020
Source: Oak Ridge National Laboratories (ORNL), Dec 2008
CHP Technical Potential
= < 1,000 MW
= 1,000 – 3,000 MW
= 3,000 – 8,000 MW
= > 8,000 MW
CHP Remaining Technical Potential by State (MW)
The Shale Gas phenomenon is driving CHP growth in US
DOE & CHP Association extended their goals of 92 GW of CHP installations by 2010 to now target 241 GW by 2030
Source: Oak Ridge National Laboratories (ORNL), Dec 2008
4
5
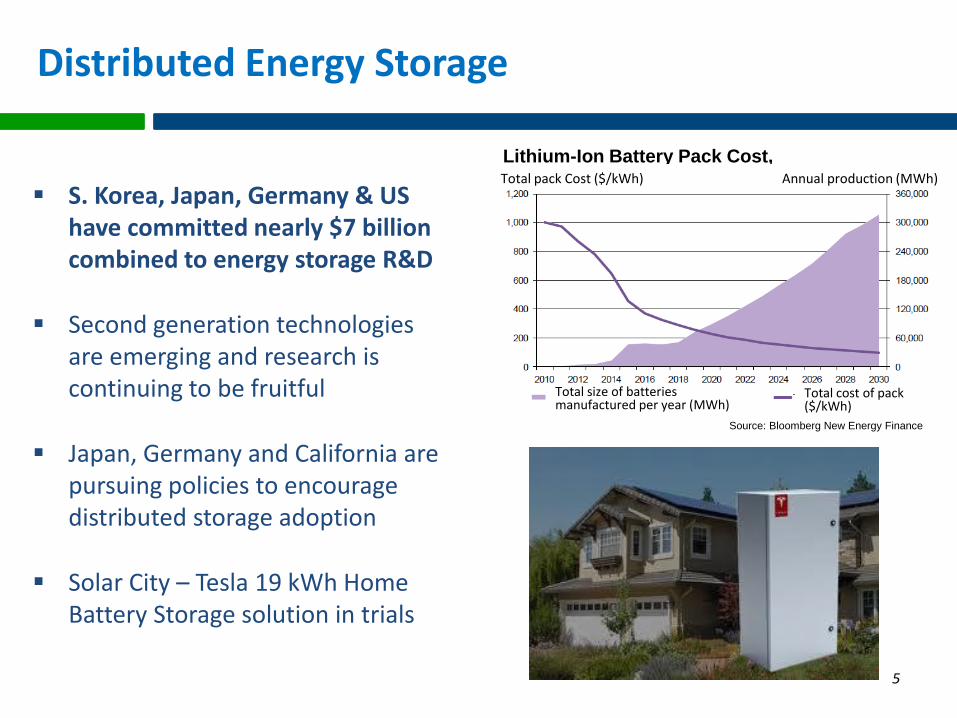
Distributed Energy Storage
S. Korea, Japan, Germany & US have committed nearly $7 billion combined to energy storage R&D
Second generation technologies are emerging and research is continuing to be fruitful
Japan, Germany and California are pursuing policies to encourage distributed storage adoption
Solar City – Tesla 19 kWh Home Battery Storage solution in trials
5
Lithium-Ion Battery Pack Cost, Total pack Cost ($/kWh) Annual production (MWh)
Total size of batteries manufactured per year (MWh)
Total cost of pack ($/kWh)
Source: Bloomberg New Energy Finance

6
Backup Generation
Carnegie Mellon’s Electricity Industry Center reports that there are about 12 million backup generators in the United States with over 200 GW of generating capacity (growing at ~5 GW per year)
US Market leader Generac reported 36% annual sales growth in 2011 and 48% growth in 2012
Buckeye Power Sales, an Ohio distributor, reported growth of 48% in 2011, 110% in 2012 and 50% over the same period in 2012 during Q1 2013

7
Traditional Operation
Controllable generation flowing power to deterministic aggregate loadGrid like a water system – larger wires cascading to smaller wire at the customer
7

8
Virtual Power Plant: 2007-2020
Advanced Automation: Multi-direction and variability of DER power flows drive circuit design changes, new grid components and control systems
8

9
Operational Evolution: 1978-2001Transactive: 2020+
Creation of local balancing & distributed markets to integrate customer DER
9

10
Customer – Grid Evolution
Business opportunities exist on both sides of the evolution curve that require technology based platforms for success
10

11
Telecom Lesson: BAU is not a good strategy
Market growth in mobile, ecommerce and related services

12
Electric Industry Competitive Landscape
Electric Landscape - 1998
NUGs
Marketers
REPs
Utilities
ESCOs
Electric Landscape - 2013
Integrated
ESPs
Non-Energy
SPs
Solar PV
ESCOs
ADT
REPs
Source: Newport Consulting
CSPs
13
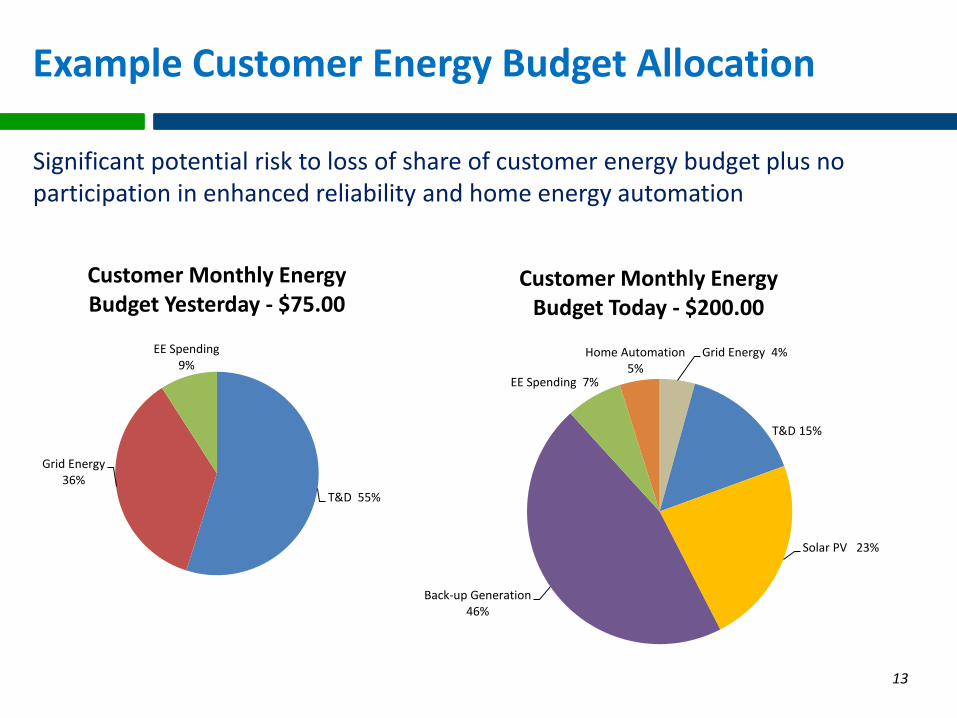
Significant potential risk to loss of share of customer energy budget plus no participation in enhanced reliability and home energy automation
Grid Energy 4%
T&D 15%
Solar PV 23%
Back-up Generation 46%
EE Spending 7%
Home Automation 5%
Customer Monthly Energy Budget Today - $200.00
T&D 55%
Grid Energy 36%
EE Spending 9%
Customer Monthly Energy Budget Yesterday - $75.00
Example Customer Energy Budget Allocation
13

14
Utility Economics Are Changing
Economies of Scope
Network Economics
Economies of Scale

15
Business Strategies
Customer relationship is very valuable – strong position with customer is essential to compete for customers’ total energy and related spend
Distribution is becoming the hub in a future hybrid electric network –distribution grid is a natural position for enabling and participating in incremental value related to physical bi-directional energy flows
Sustainable competitive advantages are key to future success
“The new clean energy business is not separate and distinct from conventional grid-based power system. The best companies will build the new and clean on the foundation of the old and reliable.” David Crane, 2012 Deutsche Bank Conference
15
Differentiated Energy Solutions
DER Market Facilitator
16
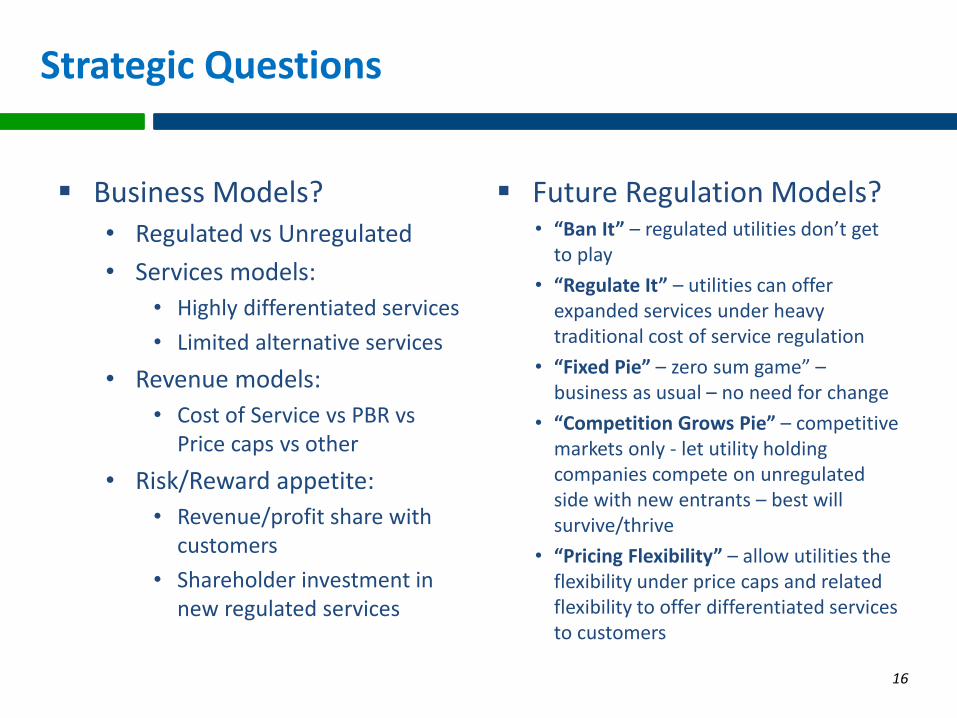
Strategic Questions
Business Models?• Regulated vs Unregulated
• Services models:
• Highly differentiated services
• Limited alternative services
• Revenue models:
• Cost of Service vs PBR vsPrice caps vs other
• Risk/Reward appetite:
• Revenue/profit share with customers
• Shareholder investment in new regulated services
Future Regulation Models?• “Ban It” – regulated utilities don’t get
to play
• “Regulate It” – utilities can offer expanded services under heavy traditional cost of service regulation
• “Fixed Pie” – zero sum game” –business as usual – no need for change
• “Competition Grows Pie” – competitive markets only - let utility holding companies compete on unregulated side with new entrants – best will survive/thrive
• “Pricing Flexibility” – allow utilities the flexibility under price caps and related flexibility to offer differentiated services to customers

17
Take Action
Understand the changing market landscape – distributed energy resource technologies, competitive offers and customer expectations
Identify preferred business opportunities and related models Focus on enabling & differentiating technology platforms
Define alternative regulatory models
Evaluate alternatives under potential market scenarios
Validate models through prototyping (pilots & partnerships)
Define a development and implementation roadmap