death-associated protein kinase 1 promotes growth of p53- … · death-associated protein kinase 1...
TRANSCRIPT

Death-associated protein kinase 1 promotes growth of p53-mutant cancers
Jing Zhao, … , Gordon B. Mills, Powel H. Brown
J Clin Invest. 2015;125(7):2707-2720. https://doi.org/10.1172/JCI70805.
Estrogen receptor–negative (ER-negative) breast cancers are extremely aggressive and associated with poor prognosis.In particular, effective treatment strategies are limited for patients diagnosed with triple receptor–negative breast cancer(TNBC), which also carries the worst prognosis of all forms of breast cancer; therefore, extensive studies have focused onthe identification of molecularly targeted therapies for this tumor subtype. Here, we sought to identify molecular targetsthat are capable of suppressing tumorigenesis in TNBCs. Specifically, we found that death-associated protein kinase 1(DAPK1) is essential for growth of p53-mutant cancers, which account for over 80% of TNBCs. Depletion or inhibition ofDAPK1 suppressed growth of p53-mutant but not p53-WT breast cancer cells. Moreover, DAPK1 inhibition limited growthof other p53-mutant cancers, including pancreatic and ovarian cancers. DAPK1 mediated the disruption of theTSC1/TSC2 complex, resulting in activation of the mTOR pathway. Our studies demonstrated that high DAPK1expression causes increased cancer cell growth and enhanced signaling through the mTOR/S6K pathway; evaluation ofmultiple breast cancer patient data sets revealed that high DAPK1 expression associates with worse outcomes inindividuals with p53-mutant cancers. Together, our data support targeting DAPK1 as a potential therapeutic strategy forp53-mutant cancers.
Research Article Oncology
Find the latest version:
https://jci.me/70805/pdf

The Journal of Clinical Investigation R e s e a R c h a R t i c l e
2 7 0 7jci.org Volume 125 Number 7 July 2015
IntroductionBreast cancer is the second most frequent cancer (excluding non-melanoma skin malignancy) and second most common cause of cancer-related death among women in the United States (1). Clinically, breast cancers are subtyped according to their estro-gen receptor (ER) status. The ER-negative subtype accounts for 30% to 40% of all breast cancers and is typically associ-ated with worse prognosis (2, 3). To date, few effective targeted treatments are available for ER-negative breast cancer, and in particular, cancers that are both ER-negative and progester-one receptor–negative (PR-negative) and Her2-negative (triple receptor-negative breast cancer [TNBC]). Multiple large-scale sequencing efforts have demonstrated that p53 is the most com-monly mutated gene in TNBCs, with up to 80% carrying muta-tions, predominantly nonsense and frame-shift mutations (4–6). To identify novel molecular targets for ER-negative breast can-cer, particularly the more aggressive TNBC, we previously con-ducted a human kinome screen to identify kinases differentially expressed in ER-positive and ER-negative breast cancers (7). Four subtypes of ER-negative disease were defined: cell-cycle checkpoint, MAPK, immunomodulatory, and S6 kinase groups. Of these 4 groups, the S6 kinase group of breast cancers has the worst prognosis. The death-associated protein kinase 1 (DAPK1) is one of the kinases most upregulated within the S6 kinase group. Because upregulation of a cell death–inducing gene was
paradoxically associated with ER-negative cancers, this gene was selected as the focus of the current study.
DAPK1 belongs to a family of kinases that includes DAPK2, DAPK3, DAP kinase–related apoptosis-inducing protein kinase 1 (DRAK1), and DRAK2 (8). DAPK1 is a calcium/calmodulin–regu-lated (CaM-regulated) protein kinase that activates death signal-ing in response to IFN-γ, TNF-α, and TGF-β, among others (9–11). Recent studies have shown that DAPK1 can transduce death sig-naling through p53-dependent pathways (12). Proteins such as p21 and p53 have been shown to serve as substrates for DAPK1 (13). In response to stimuli (e.g., apoptotic inducers, oncogenes), DAPK1 expression is increased, the protein is activated by desphosphor-ylation of Ser308, and activation of p53 occurs through the p14/p19ARF pathway, ultimately resulting in apoptosis (12, 14). In addi-tion to regulating apoptosis, DAPK1 has also been reported to be involved in autophagy, immune response to inflammatory signals (15, 16), and even proliferative signaling (17). However, the specif-ic role of DAPK1 in ER-negative and, particularly, in p53-mutant breast cancer has not been previously studied. We hypothesize that in the p53-WT setting, DAPK1 serves as a death-inducing factor, while in the p53-mutant background, this protein switches roles to function as a critical growth promoter.
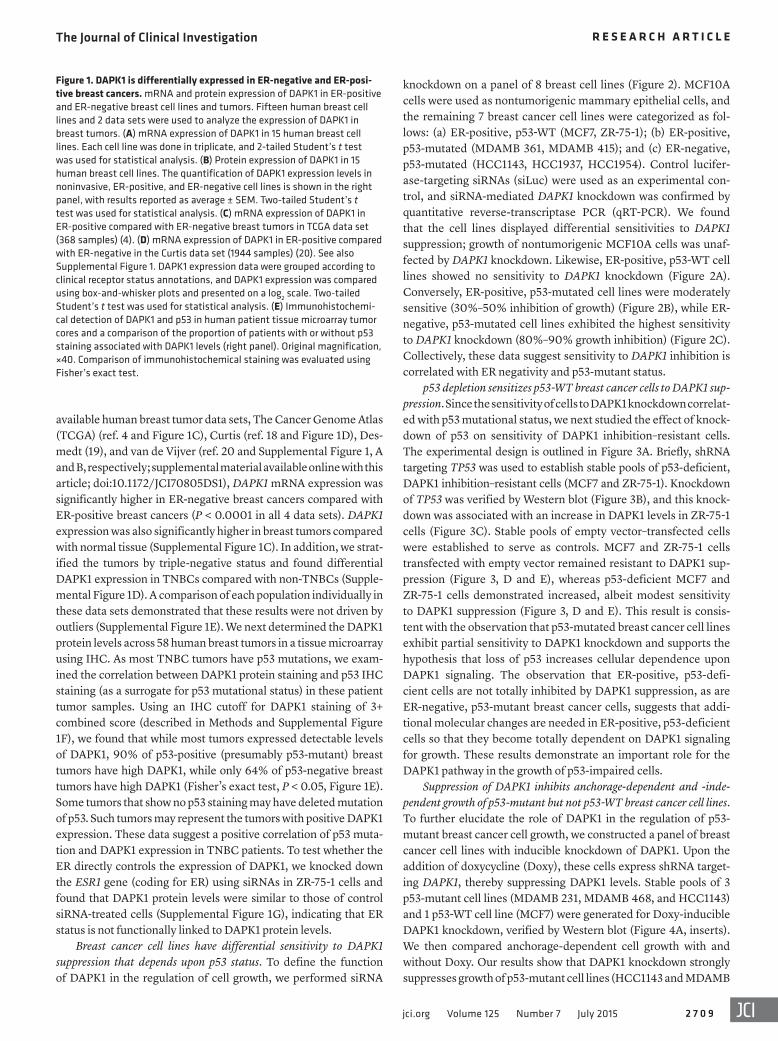
ResultsDAPK1 expression is significantly increased in ER-negative breast can-cer. To determine the spectrum of DAPK1 expression across breast cancers, we first compared DAPK1 RNA and protein levels in cell lines and in patient breast tumor expression data sets. As shown in Figure 1, A and B, ER-negative breast cancer cells tended to express higher levels of DAPK1 than ER-positive cell lines. In 4 publicly
Estrogen receptor–negative (ER-negative) breast cancers are extremely aggressive and associated with poor prognosis. In particular, effective treatment strategies are limited for patients diagnosed with triple receptor–negative breast cancer (TNBC), which also carries the worst prognosis of all forms of breast cancer; therefore, extensive studies have focused on the identification of molecularly targeted therapies for this tumor subtype. Here, we sought to identify molecular targets that are capable of suppressing tumorigenesis in TNBCs. Specifically, we found that death-associated protein kinase 1 (DAPK1) is essential for growth of p53-mutant cancers, which account for over 80% of TNBCs. Depletion or inhibition of DAPK1 suppressed growth of p53-mutant but not p53-WT breast cancer cells. Moreover, DAPK1 inhibition limited growth of other p53-mutant cancers, including pancreatic and ovarian cancers. DAPK1 mediated the disruption of the TSC1/TSC2 complex, resulting in activation of the mTOR pathway. Our studies demonstrated that high DAPK1 expression causes increased cancer cell growth and enhanced signaling through the mTOR/S6K pathway; evaluation of multiple breast cancer patient data sets revealed that high DAPK1 expression associates with worse outcomes in individuals with p53-mutant cancers. Together, our data support targeting DAPK1 as a potential therapeutic strategy for p53-mutant cancers.
Death-associated protein kinase 1 promotes growth of p53-mutant cancersJing Zhao,1,2 Dekuang Zhao,2 Graham M. Poage,2 Abhijit Mazumdar,2 Yun Zhang,2 Jamal L. Hill,2 Zachary C. Hartman,3 Michelle I. Savage,2 Gordon B. Mills,4 and Powel H. Brown1,2
1Department of Molecular and Cellular Biology, Baylor College of Medicine, Houston, Texas, USA. 2Department of Clinical Cancer Prevention, University of Texas MD Anderson Cancer Center,
Houston, Texas, USA. 3Department of Surgery, Duke University, Durham, North Carolina, USA. 4Department of Systems Biology, University of Texas MD Anderson Cancer Center, Houston, Texas, USA.
Conflict of interest: Powel H. Brown is on the Scientific Advisory Board of Susan G. Komen for the Cure.Submitted: February 3, 2015; Accepted: May 7, 2015.Reference information: J Clin Invest. 2015;125(7):2707–2720. doi:10.1172/JCI70805.

The Journal of Clinical Investigation R e s e a R c h a R t i c l e
2 7 0 8 jci.org Volume 125 Number 7 July 2015
The Journal of Clinical Investigation R e s e a R c h a R t i c l e
2 7 0 9jci.org Volume 125 Number 7 July 2015
knockdown on a panel of 8 breast cell lines (Figure 2). MCF10A cells were used as nontumorigenic mammary epithelial cells, and the remaining 7 breast cancer cell lines were categorized as fol-lows: (a) ER-positive, p53-WT (MCF7, ZR-75-1); (b) ER-positive, p53-mutated (MDAMB 361, MDAMB 415); and (c) ER-negative, p53-mutated (HCC1143, HCC1937, HCC1954). Control lucifer-ase-targeting siRNAs (siLuc) were used as an experimental con-trol, and siRNA-mediated DAPK1 knockdown was confirmed by quantitative reverse-transcriptase PCR (qRT-PCR). We found that the cell lines displayed differential sensitivities to DAPK1 suppression; growth of nontumorigenic MCF10A cells was unaf-fected by DAPK1 knockdown. Likewise, ER-positive, p53-WT cell lines showed no sensitivity to DAPK1 knockdown (Figure 2A). Conversely, ER-positive, p53-mutated cell lines were moderately sensitive (30%–50% inhibition of growth) (Figure 2B), while ER-negative, p53-mutated cell lines exhibited the highest sensitivity to DAPK1 knockdown (80%–90% growth inhibition) (Figure 2C). Collectively, these data suggest sensitivity to DAPK1 inhibition is correlated with ER negativity and p53-mutant status.
p53 depletion sensitizes p53-WT breast cancer cells to DAPK1 sup-pression. Since the sensitivity of cells to DAPK1 knockdown correlat-ed with p53 mutational status, we next studied the effect of knock-down of p53 on sensitivity of DAPK1 inhibition–resistant cells. The experimental design is outlined in Figure 3A. Briefly, shRNA targeting TP53 was used to establish stable pools of p53-deficient, DAPK1 inhibition–resistant cells (MCF7 and ZR-75-1). Knockdown of TP53 was verified by Western blot (Figure 3B), and this knock-down was associated with an increase in DAPK1 levels in ZR-75-1 cells (Figure 3C). Stable pools of empty vector–transfected cells were established to serve as controls. MCF7 and ZR-75-1 cells transfected with empty vector remained resistant to DAPK1 sup-pression (Figure 3, D and E), whereas p53-deficient MCF7 and ZR-75-1 cells demonstrated increased, albeit modest sensitivity to DAPK1 suppression (Figure 3, D and E). This result is consis-tent with the observation that p53-mutated breast cancer cell lines exhibit partial sensitivity to DAPK1 knockdown and supports the hypothesis that loss of p53 increases cellular dependence upon DAPK1 signaling. The observation that ER-positive, p53-defi-cient cells are not totally inhibited by DAPK1 suppression, as are ER-negative, p53-mutant breast cancer cells, suggests that addi-tional molecular changes are needed in ER-positive, p53-deficient cells so that they become totally dependent on DAPK1 signaling for growth. These results demonstrate an important role for the DAPK1 pathway in the growth of p53-impaired cells.
Suppression of DAPK1 inhibits anchorage-dependent and -inde-pendent growth of p53-mutant but not p53-WT breast cancer cell lines. To further elucidate the role of DAPK1 in the regulation of p53-mutant breast cancer cell growth, we constructed a panel of breast cancer cell lines with inducible knockdown of DAPK1. Upon the addition of doxycycline (Doxy), these cells express shRNA target-ing DAPK1, thereby suppressing DAPK1 levels. Stable pools of 3 p53-mutant cell lines (MDAMB 231, MDAMB 468, and HCC1143) and 1 p53-WT cell line (MCF7) were generated for Doxy-inducible DAPK1 knockdown, verified by Western blot (Figure 4A, inserts). We then compared anchorage-dependent cell growth with and without Doxy. Our results show that DAPK1 knockdown strongly suppresses growth of p53-mutant cell lines (HCC1143 and MDAMB
available human breast tumor data sets, The Cancer Genome Atlas (TCGA) (ref. 4 and Figure 1C), Curtis (ref. 18 and Figure 1D), Des-medt (19), and van de Vijver (ref. 20 and Supplemental Figure 1, A and B, respectively; supplemental material available online with this article; doi:10.1172/JCI70805DS1), DAPK1 mRNA expression was significantly higher in ER-negative breast cancers compared with ER-positive breast cancers (P < 0.0001 in all 4 data sets). DAPK1 expression was also significantly higher in breast tumors compared with normal tissue (Supplemental Figure 1C). In addition, we strat-ified the tumors by triple-negative status and found differential DAPK1 expression in TNBCs compared with non-TNBCs (Supple-mental Figure 1D). A comparison of each population individually in these data sets demonstrated that these results were not driven by outliers (Supplemental Figure 1E). We next determined the DAPK1 protein levels across 58 human breast tumors in a tissue microarray using IHC. As most TNBC tumors have p53 mutations, we exam-ined the correlation between DAPK1 protein staining and p53 IHC staining (as a surrogate for p53 mutational status) in these patient tumor samples. Using an IHC cutoff for DAPK1 staining of 3+ combined score (described in Methods and Supplemental Figure 1F), we found that while most tumors expressed detectable levels of DAPK1, 90% of p53-positive (presumably p53-mutant) breast tumors have high DAPK1, while only 64% of p53-negative breast tumors have high DAPK1 (Fisher’s exact test, P < 0.05, Figure 1E). Some tumors that show no p53 staining may have deleted mutation of p53. Such tumors may represent the tumors with positive DAPK1 expression. These data suggest a positive correlation of p53 muta-tion and DAPK1 expression in TNBC patients. To test whether the ER directly controls the expression of DAPK1, we knocked down the ESR1 gene (coding for ER) using siRNAs in ZR-75-1 cells and found that DAPK1 protein levels were similar to those of control siRNA-treated cells (Supplemental Figure 1G), indicating that ER status is not functionally linked to DAPK1 protein levels.
Breast cancer cell lines have differential sensitivity to DAPK1 suppression that depends upon p53 status. To define the function of DAPK1 in the regulation of cell growth, we performed siRNA
Figure 1. DAPK1 is differentially expressed in ER-negative and ER-posi-tive breast cancers. mRNA and protein expression of DAPK1 in ER-positive and ER-negative breast cell lines and tumors. Fifteen human breast cell lines and 2 data sets were used to analyze the expression of DAPK1 in breast tumors. (A) mRNA expression of DAPK1 in 15 human breast cell lines. Each cell line was done in triplicate, and 2-tailed Student’s t test was used for statistical analysis. (B) Protein expression of DAPK1 in 15 human breast cell lines. The quantification of DAPK1 expression levels in noninvasive, ER-positive, and ER-negative cell lines is shown in the right panel, with results reported as average ± SEM. Two-tailed Student’s t test was used for statistical analysis. (C) mRNA expression of DAPK1 in ER-positive compared with ER-negative breast tumors in TCGA data set (368 samples) (4). (D) mRNA expression of DAPK1 in ER-positive compared with ER-negative in the Curtis data set (1944 samples) (20). See also Supplemental Figure 1. DAPK1 expression data were grouped according to clinical receptor status annotations, and DAPK1 expression was compared using box-and-whisker plots and presented on a log2 scale. Two-tailed Student’s t test was used for statistical analysis. (E) Immunohistochemi-cal detection of DAPK1 and p53 in human patient tissue microarray tumor cores and a comparison of the proportion of patients with or without p53 staining associated with DAPK1 levels (right panel). Original magnification, ×40. Comparison of immunohistochemical staining was evaluated using Fisher’s exact test.

The Journal of Clinical Investigation R e s e a R c h a R t i c l e
2 7 1 0 jci.org Volume 125 Number 7 July 2015
We next investigated whether DAPK1 regulates anchorage-independent growth of breast cancer cell lines using induc-ible DAPK1 knockdown MDAMB 231, MDAMB 468, HCC1143, and MCF7 cells (Figure 4B). The addition of Doxy significant-ly suppressed anchorage-independent growth of HCC 1143, MDAMB 468, and MDAMB 231 cells (all p53-mutant), by 70%, while anchorage-independent growth of MCF7 (p53-WT) cells remained unaffected (Figure 4B). Soft agar assays of vector con-trol cell lines were also performed to eliminate potential effects of the vector backbone (Supplemental Figure 2, A and B, right panels). These results, combined with those shown in Figure 4A, indicate that suppression of DAPK1 inhibits growth of p53-
468 and, to a lesser extent, in MDAMB 231), but not of p53-WT cells (Figure 4A). As shown in Supplemental Figure 2, A and B, vector-transfected cell lines displayed no detectable difference in growth upon the addition of Doxy. To eliminate off-target effects of shRNA, we performed rescue experiments in the MDAMB 468–inducible knockdown cell line by overexpressing DAPK1 cDNA not targeted by the shRNA. The introduction of DAPK1 successfully rescues the growth-suppressive effect of shRNA, demonstrating the specificity of shRNA (Supplemental Figure 2, C and D). Col-lectively, these results demonstrate that DAPK1 suppression inhib-its anchorage-dependent growth of p53-mutant breast cancer cell lines but not the p53-WT line.
Figure 2. Breast cancer cell lines have differential sensitivity to DAPK1 suppression due to ER and p53 status. Cell growth was measured by manual counting. Knockdown efficiency of DAPK1 siRNA in each cell line is plotted in each panel (black). siRNA against luciferase was used as a control (gray). (A) Growth of ER-positive, p53-WT breast cancer cell lines upon DAPK1 knockdown by siRNA. MCF10A is not ER positive. (B) Growth of ER-positive, p53-mutated breast cancer cell lines upon DAPK1 knockdown. (C) Growth of ER-negative, p53-mutated breast cancer cell lines upon DAPK1 knockdown. DAPK1 knockdown and cell growth experiments were performed in triplicate, with results reported as average ± SEM. *P < 0.01; **P < 0.001, 2-tailed Student’s t test.

The Journal of Clinical Investigation R e s e a R c h a R t i c l e
2 7 1 1jci.org Volume 125 Number 7 July 2015
similar dose response (Supplemental Figure 2E). In contrast, p53-WT cell lines (MCF7, MDA175-VII) showed no growth suppression following addition of DAPK1 inhibitor (Figure 4C).
Inhibition of DAPK1 suppresses p53-mutant but not p53-WT breast cancer growth in vivo. Since suppression of DAPK1 inhibits both anchorage-dependent and -independent growth of p53-mutant breast cancer cell lines, we investigated whether suppression of DAPK1 inhibits xenograft growth in vivo using a nude mouse mod-el. For these experiments, we used inducible DAPK1 knockdown cell lines (MCF7, MDAMB 231, MDAMB 468) and their correspond-ing vector controls. Mice injected with the MCF7 cell line received estrogen pellets to support tumor growth. After tumors reached 20 to 50 mm3 in volume, mice were randomized into 2 groups, with one group receiving Doxy water and the other group (the control group) receiving Doxy-free water. As shown in Figure 4D, where tumor size is depicted as a function of time, comparison of tumor growth rates with and without Doxy in inducible DAPK1 knockdown MDAMB 231 and MDAMB 468 xenografts showed strong suppression asso-
mutant breast cancer cell lines in both anchorage-dependent and -independent contexts.
DAPK1 inhibitor specifically suppresses p53-mutant breast cancer growth. To further assess whether DAPK1 is a critical growth regu-lator of p53-mutant breast cancer cell lines, we blocked DAPK1 signaling in a panel of breast cancer cell lines using a DAPK1-spe-cific inhibitor and measured cell growth. We had tested the speci-ficity of this inhibitor using Invitrogen’s LanthaScreen TR-FRET Kinase Assay to determine the concentration of drug required for inhibition of 40 kinases. We found that this DAPK inhibitor is rela-tively specific for DAPK1, with an IC50 of 218 nM. Other enzymes inhibited by higher concentrations of this inhibitor include BRAF (IC50 668 nM), KDR(VEGFR2) (IC50 926 nM), and DAPK3 (IC50 1060 nM). The p53-mutant TNBC cell lines (HCC1143, HCC1937) showed dose-response suppression, with more than 50% growth suppression being observed with the addition of 1 μM DAPK1 inhibitor (Figure 4C). Several other p53-mutant breast cancer cell lines (HCC1954, MDAMB 231, and MDAMB 468) displayed a
Figure 3. p53 depletion sensitizes p53-WT breast cancer cells to DAPK1 knockdown. (A) Experimental design. In order to determine whether p53 status is relevant to cell line sensitivity to DAPK1 knockdown, we depleted p53 expression in 2 p53-WT cell lines (MCF7 and ZR-75-1) by constitutively expressing shRNA and comparing sensitivity to DAPK1 knockdown. (B) Shown is p53 protein expression in p53-WT and p53-depleted MCF7 (left panel) and ZR-75-1 (right panel) cells. (C) DAPK1 expression in p53-WT and p53-depleted ZR-75-1 cells. Western blot experiments were performed 3 times, and representative blots are shown. (D) Growth of MCF7 control (left panel) and MCF7 sh-p53 (MCF7 with p53 depleted; right panel) cells upon DAPK1 knockdown by siRNA. (E) Growth of ZR-75-1 control (left panel) and ZR-75-1 sh-p53 (ZR-75-1 with p53 depleted; right panel) upon DAPK1 knockdown by siRNA. DAPK1 knockdown and cell growth experiments were performed in tripli-cate, with results reported as average ± SEM. *P < 0.01; **P < 0.001, 2-tailed Student’s t test. sh-ctrl, MCF7 and ZR-75-1 cells transfected with empty vector; sh-p53, MCF7 and ZR-75-1 cells transfected with shRNA against p53 to make these cells p53 deficient.

The Journal of Clinical Investigation R e s e a R c h a R t i c l e
2 7 1 2 jci.org Volume 125 Number 7 July 2015
ciated with loss of DAPK1 (Figure 4D). Conversely, growth rates of vector control MDAMB 231, MDAMB 468, and MCF7 cell lines were not affected by Doxy treatment (Supplemental Figure 2, F–H, respectively). There was no significant difference in tumor growth rates observed in inducible DAPK1-knockdown MCF7 cells with or without Doxy (Figure 4D). These results are consistent with our in vitro studies and demonstrate that suppression of DAPK1 inhibits growth of p53-mutant breast tumors in vivo.
To assess the tumor-suppressive effect of the DAPK1 inhibitor in vivo, we utilized the p53-mutant MDAMB 231 xenograft model in nude mice. After injection of MDAMB 231 cells, mice were ran-
domized to receive vehicle or DAPK1 inhibitor (20 mg/kg) by i.p. injection when tumors reached 50 mm3. As shown in Figure 4E, comparison of tumor growth in vehicle and DAPK1 inhibitor (20 mg/kg) groups showed a significant reduction in tumor growth rate upon DAPK1 inhibition by the pharmacological inhibitor. This result is consistent with our in vitro kinase assays demonstrating that in vitro–synthesized DAPK1 is capable of phosphorylating itself and its known substrate MBP, while DAPK1 inhibitor blocks this phosphorylation (Supplemental Figure 2I).
DAPK1 inhibition suppresses growth of other cancer types that carry p53 mutations. Given the evidence that DAPK1 plays an
Figure 4. Suppression of DAPK1 expression inhibits the growth of p53-mutant breast cancer cells but not p53-WT MCF7 cells both in vitro and in vivo. (A) Anchorage-dependent growth of p53-WT MCF7, p53-mutant MDAMB 231, HCC1143, and MDAMB 468 cells after DAPK1 suppression. Western blot was performed 3 times. A representative Western blot is shown. (B) Anchorage-independent growth of MCF7, MDAMB 231, MDAMB 468, and HCC1143 cells after DAPK1 suppression. (C) Effect of DAPK1 inhibitor on the growth of p53-WT and p53-mutant breast cancer cell lines. For each experiment, the DMSO concentration was 0.1% in all treatment groups for inhibitor- or vehicle-treated cells. For in vitro cell growth experiments (A–C), each data point represents 3 technical replicates, with results reported as average ± SEM. (D) In vivo xenograft growth of MCF7, MDAMB 231, and MDAMB 468 cells after DAPK1 sup-pression. (E) Effect of DAPK1 inhibitor on MDAMB 231 xenograft growth in vivo. For mouse xenograft experiments (D–E), 10 mice of each group were used and tumor growth rates were compared by linear regression of log-transformed tumor volumes over time. *P < 0.01; ***P < 0.0001, 2-tailed Student’s t test. See also Supplemental Figure 2.

The Journal of Clinical Investigation R e s e a R c h a R t i c l e
2 7 1 3jci.org Volume 125 Number 7 July 2015
essential role in the growth regulation of p53-mutant breast can-cers, we next investigated whether DAPK1 is critical for the growth of other p53-mutant cancers, including pancreatic and ovarian cancers. Two p53-mutant cancer cell lines (PANC-1 [pancreatic] and SKOV-3 [ovarian]) and 1 p53-WT cancer cell line (H1650 [lung]) were used in this study to determine the effect of DAPK1 inhibition on growth. Two different strategies were used to inhib-it DAPK1 activity: siRNA knockdown and inhibition by a small molecule inhibitor. We found that the growth of p53-mutant cell lines (PANC-1 and SKOV-3) was suppressed by DAPK1-targeting siRNAs (Figure 5, B and C, respectively), while growth of the p53-WT cell line (H1650) was unaffected (Figure 5A). We also treated cancer cells with the DAPK1 inhibitor and measured cell growth. The p53-mutant cancer cell line PANC-1 showed dose-response growth suppression with a GI50 (half maximal inhibitory concen-tration) of 1 μM (Figure 5E). Conversely, the growth of the p53-WT cell line (H1650) was not suppressed by DAPK1 inhibitor (Fig-ure 5D). These results are generally correlated with the levels of DAPK1 expression across the cell lines (Figure 5F) and extend our previous findings in breast cancers, indicating a similar role for DAPK1 function in p53-mutant pancreatic and ovarian cancers. Collectively, these data show that different types of p53-mutant cancer cells are uniquely sensitive to DAPK1 inhibition, suggest-ing that DAPK1 is a promising target for the treatment of multiple cancer types that carry mutant p53.
DAPK1 suppression does not affect apoptosis in p53-mutant breast cancer cells. Given the evidence that depletion of DAPK1 suppresses growth of p53-mutant breast cancer cells, we inves-tigated the mechanism by which DAPK1 regulates cell growth. To determine whether inhibition of growth was due to increased
apoptosis of p53-mutant cancer cells upon suppression of DAPK1, we performed FACS analysis on the apoptotic rate of p53-mutant inducible knockdown cell lines (MDAMB 231, MDAMB 468, and HCC1143) before and after Doxy treatment. Our results showed no difference in apoptotic rates following DAPK1 suppression in all tested cell lines (Supplemental Figure 3), indicating that growth inhibition induced by the DAPK1 suppression in p53-mutant breast cancer cells is not a result of increased apoptosis. Due to its known role in activating autophagy (16), we also investigated whether DAPK1 could be acting as a negative regulator of autophagy in the setting of TNBC. However, knockdown of DAPK1 in these cells did not alter autophagy marker (LC3-II) levels in TNBC cells (data not shown). Since DAPK1 responds to death-inducing factors under normal conditions, we sought to determine whether p53 mutation alters cellular sensitivity to such agents. After 48 hours of exposure to the DAPK1 inducer, TNF-α, p53-WT MCF7 cells robustly acti-vated an apoptotic program (which is reversed by DAPK1 knock-down), while p53-mutant HCC143 cells did not (Figure 6I), indicat-ing that p53-mutant cells have uncoupled the DAPK1-associated death-signaling pathway from its growth-promoting function.
Reverse-phase protein array identifies downstream proteins regu-lated by DAPK1. We conducted reverse-phase protein array (RPPA) analysis using the inducible knockdown cell lines (MCF7 ind-shDAPK1 MDAMB 231 ind-shDAPK1, MDAMB 468 ind-shDAPK1, and HCC1143 ind-shDAPK1) before and after addition of Doxy to identify changes in proteins and phospho-proteins resulting from DAPK1 suppression (Supplemental Figure 4A and Supplemental Table 4). MCF7 was used as a DAPK1 inhibition–resistant con-trol. The expression of 161 protein and phospho-proteins before and after Doxy addition in MCF7-, HCC1143-, MDAMB 231–,
Figure 5. Suppression of DAPK1 expression specifically inhibits the growth of p53-mutant ovarian and pancreatic cancer cell lines in vitro. Knockdown efficiency of DAPK1 siRNA in each cell line is plotted in inserted panel (black). (A) Growth of p53-WT H1650 (lung) upon DAPK1 knockdown. (B) Growth of p53-mutated PANC-1 (pancreatic) upon DAPK1 knockdown. (C) Growth of p53-mutant SKOV-3 (ovarian) upon DAPK1 knockdown. (D) Effect of DAPK1 inhibitor in p53-WT H1650 (lung). (E) Effect of DAPK1 inhibitor in p53-mutated PANC-1 (pancreatic). (F) DAPK1 protein levels across cancer cell lines. West-ern blot was performed 3 times. A representative Western blot is shown. DAPK1 knockdown and cell growth experiments were performed in triplicate, with results reported as average ± SEM. *P < 0.01; **P < 0.001, 2-tailed Student’s t test.

The Journal of Clinical Investigation R e s e a R c h a R t i c l e
2 7 1 4 jci.org Volume 125 Number 7 July 2015

The Journal of Clinical Investigation R e s e a R c h a R t i c l e
2 7 1 5jci.org Volume 125 Number 7 July 2015
sclerosis complex 1 (TSC1), we found that shRNA-induced deple-tion of DAPK1 in HCC1143 cells increased interaction between TSC1 and TSC2 (Figure 6E), which form a complex that nega-tively regulates the mTOR pathway. Conversely, overexpression of DAPK1 in HCC1143 cells resulted in decreased interaction between TSC1 and TSC2 (Figure 6F) and thus activated mTOR sig-naling by suppressing inhibition of the mTOR pathway. Additional co-IP experiments conducted using TSC2 antibody produced similar results (Supplemental Figure 4, B and C). We next deter-mined whether DAPK1 can phosphorylate TSC2 directly in vitro. As shown in Figure 6G, the active kinase domain of DAPK1 can phosphorylate immunoprecipitated TSC2, while no phosphoryla-tion of TSC2 was detected without the addition of DAPK1 protein. It has been previously described that DAPK1 phosphorylates TSC2 in vitro (17); however, the precise residue of this posttranslational modification has not been elucidated. Therefore, we systematical-ly investigated the specific site of TSC2 that is phosphorylated by DAPK1 overexpressing in p53-mutant HCC1143 cells. As shown in Figure 6H, overexpression of DAPK1 increased phosphorylation of TSC2 at Ser939, which has been previously reported as destabi-lizing TSC1/TSC2 complex formation and activating downstream signaling (21, 22). DAPK1 overexpression did not affect TSC2 phosphorylation of other sites implicated in inactivation of TSC2 (Supplemental Figure 4D). Using this phosphorylation as read-out for DAPK1 activity, the overexpression of DAPK1 was found to be correlated to DAPK1 activity across the continuum of breast cancer cell lines and to associate with p53-mutant status (Supple-mental Figure 4E). Furthermore, phosphorylation of DAPK1 tar-gets was also downregulated within the first 5 minutes of DAPK1 inhibitor treatment in HCC1937 cells, indicating that this inhibi-tor has direct function on DAPK1 signaling (Supplemental Figure 4F). Collectively, these results show that DAPK1-induced destabi-lization of the TSC1/TSC2 complex occurs by direct phosphory-lation of TSC2 specifically at Ser939, which results in activation of the mTOR pathway. Our results also show that DAPK1 inhibi-tion suppresses p53-mutant, but not p53-WT, breast cancer cells by stabilizing the TSC1/TSC2 complex, which then destabilizes the mTORC1 complex and inhibits mTOR/S6K activation. Since mTOR inhibitors, such as everolimus, already are used in the clin-ic, we tested to determine whether combination treatment with the DAPK1 inhibitor would have an additional inhibitory effect on the growth of TNBC cell lines. Treatment of HCC1937 cells with 10 nM everolimus alone had a growth inhibitory effect similar to that of the DAPK1 inhibitor, and combination treatment did not yield additional growth inhibition (Supplemental Figure 4G).
High DAPK1 expression is associated with worse prognosis in patients with breast cancers that carry p53 mutations. Due to the high level of DAPK1 expression observed in ER-negative breast tumors, we investigated whether DAPK1 is a prognostic marker. We per-formed survival analyses in multiple breast tumor data sets for which both overall survival and DAPK1 RNA expression are avail-able. Using the van de Vijver (n = 295) (20) and Desmedt (n = 198) (19) data sets and grouping individuals based on tumor DAPK1 expression (with high and low DAPK1 groups reflecting expression above or below the median level, respectively), we investigated whether DAPK1 expression was associated with clinical outcome. As shown in Figure 7A, patients exhibiting high DAPK1 expression
and MDAMB 468–inducible knockdown cell lines was plotted as hierarchical clusters (Figure 6A). To compare changes in pro-tein expression and signaling in breast cancer cells upon DAPK1 knockdown, we calculated the change in expression for each pro-tein affected by Doxy treatment (depicted as a hierarchical clus-ter, Figure 6A). Those proteins whose expression significantly changed upon DAPK1 depletion in p53-mutant HCC1143 cells that were not changed (or inversely changed) in p53-WT MCF7 cells are listed in Supplemental Table 5.
DAPK1 regulates p53-mutant breast cancer tumorigenicity through the mTOR pathway. The phosphorylation of several pro-teins was found to be downregulated after DAPK1 depletion in p53-mutant breast cancer cells. These included phospho-S6 (at S235/236 and S240/244), phospho-S6K (at T389), and phospho-4EBP1 (at S65), all critical proteins in the mTOR-signaling path-way. Western blot detection of phospho-S6 and phospho-S6K in inducible DAPK1 knockdown cell lines confirmed that depletion of DAPK1 greatly reduced the levels of phospho-S6 at S235/236 and S240/244, and phospho-S6K at T389 in HCC1143 cells (Figure 6B), but did not affect phosphorylation of these proteins in MCF7 cells (Figure 6C). To assess whether DAPK1 stimulates growth in TNBCs, we established a DAPK1-overexpressing HCC1143 line and assessed anchorage-dependent growth capacity and downstream signaling events. As shown in Figure 6D, anchorage-dependent growth was stimulated after DAPK1 overexpression and phospho-S6 protein was elevated upon DAPK1 expression, indicating that DAPK1 can stimulate the growth of p53-mutant cancers through the S6 pathway.
To further examine the role of DAPK1-induced changes in mTOR signaling, we performed coimmunoprecipitation (co-IP) assays to identify the effect of DAPK1 on the interaction among mTOR pathway components. By immunoprecipitating tuberous
Figure 6. RPPA analysis identifies DAPK1 as a modulator of mTOR pathway. RPPA analysis was performed using triplicate samples of MCF7, HCC1143, MDAMB 231, and MDAMB 468 cells with inducible DAPK1 knockdown capacity. (A) Heat maps of protein level (left panel) and protein level change (middle panel) in cells before (–Doxy) and after (+Doxy) DAPK1 knockdown. (B) Level of phospho-S6 at Ser235/236 and Ser240/244 and of phospho-S6K at T389 before and after DAPK1 knockdown in HCC1143 cells. (C) Expression of phospho-S6 at Ser235/236 and Ser240/244 and of phospho-S6K at T389 before and after DAPK1 knockdown in MCF7 cells. (D) Growth and levels of phospho-S6 at Ser235/236 in HCC1143 ctrl and DAPK1 overexpression cell lines. Western blot analysis was done 3 times. A repre-sentative blot and quantification of phospho-S6/S6 ratio are shown. (E) Co-IP of TSC1/TSC2 complex using TSC1 antibody in HCC1143 before and after DAPK1 knockdown. This experiment was done 3 times. A represen-tative IP Western blot and quantification of TSC2/TSC1 ratio are shown. (F) Co-IP of TSC1/TSC2 complex using TSC1 antibody in HCC1143 before and after DAPK1 overexpression. This experiment was done 3 times. A representative IP Western blot is shown, and quantification of the TSC2/TSC1 ratio is shown. (G) Phosphorylation of TSC2 by DAPK1 in in vitro kinase assay. (H) Level of phospho-TSC2 at Ser939 in HCC1143 control and HCC1143 DAPK1 overexpression cell lines. All lysates were collected 4 days after treatment. Western blot was performed 3 times. A representative blot and quantification of phospho-TSC2/TSC2 are shown. (I) Fold induction of apoptosis in HCC1143 (p53-mutant) and MCF7 (p53-WT) cells treated with 50 ng/ml TNF-α for 48 hours, measured by FACS analysis of annexin V/PI staining. Cell lines were either shEmpty vector control or shDAPK1-induced, as indicated. Each data point represents 3 technical replicates, with results reported as average ± SEM. *P < 0.01; **P < 0.001, 2-tailed Student’s t test.

The Journal of Clinical Investigation R e s e a R c h a R t i c l e
2 7 1 6 jci.org Volume 125 Number 7 July 2015
scape of this subtype. Only 2 genes, TP53 and PIK3CA, have muta-tional frequencies above 6% (4, 5). In this study, we have discov-ered an unexpected role of DAPK1 in altering the growth of breast cancer cells in a p53-dependent context. In p53-WT cells, we con-firm that DAPK1 increases apoptosis in a p53-dependent manner (12). However, in p53-mutant breast cancer cells where DAPK1-induced apoptosis is compromised, DAPK1 increases growth of tumor cells by redirecting its activity through the mTOR/S6 path-way. Our results establish a link between p53-mutation status and cellular sensitivity to DAPK1 inhibition. Pharmacologic inhibition of DAPK1 in p53-mutant, but not WT, cancer cells decreases their growth in mouse xenografts, and DAPK1/p53-mutational status is an independent prognostic indicator in breast cancer patients, suggesting that DAPK1 should be explored as a target for the treat-ment of p53-mutant cancers, including TNBCs.
DAPK1 has gained notoriety as an established tumor sup-pressor, in part by acting as the prototypical gene for promoter DNA methylation-induced silencing. Indeed, DAPK1 expres-sion is downregulated in multiple cancer types (24, 25), and it is known to be an important mediator of death-inducing signals (8, 26–28). In particular, TNF-α and IFN-γ activate DAPK1-mediated cell death, possibly through inhibition of NF-κB (29). DAPK1 is reported to both directly transactivate p53 (30) and to be a tran-scriptional target of p53 (31). This cumulative evidence would suggest that DAPK1 serves as a growth-limiting factor; however, we have shown that in the setting of p53 mutation, DAPK1 has growth-promoting function. Our findings are supported by prior data in MCF7-matched p53-WT/p53-mutant cell lines showing that resistance to TNF-α–induced cell death is associated with p53 mutation (32). Additional studies have convincingly demon-strated that DAPK1 expression is capable of activating the surviv-al functions of the mTOR pathway (17, 33); however, the specific
in their tumors showed significantly lower overall survival times compared with those with low DAPK1 expression. We next pre-formed a subset analysis to determine whether DAPK1 expression correlated with prognosis specifically within ER-negative breast cancer patients. As shown in Supplemental Figure 5, A and B, ER-negative tumors with high DAPK1 expression carried a worse prognosis. However, the small sample size of ER-negative tumors within each data set did not allow the difference between the 2 DAPK1 expression groups to reach statistical significance (n = 69 and n = 64 for the van de Vijver and Desmedt data sets, respec-tively; refs. 19, 20). We also performed survival analyses of the publicly available Sørlie (n = 66) (23) and Curtis (n = 755) (18) data sets by stratifying the patients into 4 groups: p53-WT/low DAPK1, p53-WT/high DAPK1, p53-mutant/low DAPK1, and p53-mutant/high DAPK1. For each data set, we performed Kaplan-Meier analy-ses to determine the association between DAPK1 expression and p53-mutational status with clinical outcome. As shown in Figure 7B, patients with p53 mutations and high DAPK1 expression had worse prognoses compared with p53-mutant/low DAPK1 group or p53-WT cases, suggesting that DAPK1 is a strong prognostic indicator only for p53-mutant breast cancers. Since DAPK1 acti-vates mTOR signaling through S6K, we similarly examined the correlation between survival and a stratification of patients based on combined DAPK1 and S6K expression in the Curtis et al. data set (18) and found that tumors with high S6K/DAPK1 levels also resulted in a poor prognosis (Supplemental Figure 5C).
DiscussionThe identification of targeted therapies for the treatment of ER-negative breast cancers, particularly TNBCs, has been a focal point of breast cancer research for years, yet progress has been limited. This is largely due to the heterogeneous mutational land-
Figure 7. p53-mutant breast tumors with high DAPK1 expression are associated with worse clinical out-come. (A) Kaplan-Meier curves of overall survival as a function of DAPK1 expression using the van de Vijver (22) (left panel) and Desmedt (21) (right panel) data sets. DAPK1 low, DAPK1 expression lower than the median DAPK1 expression; DAPK1 high, DAPK1 expres-sion exceeding the median DAPK1 expression. (B) Kaplan-Meier curves of overall survival as a function of the combination of p53 status and DAPK1 expression in the Sørlie (25) and Curtis (20) data sets. p53-mut, p53-mutant. Number of patients in each data set is listed below each figure. For overall survival analysis, log-rank (Mantel-Cox) test was used to determine the statistical difference between stratified groups. P < 0.05 was considered statistically significant.

The Journal of Clinical Investigation R e s e a R c h a R t i c l e
2 7 1 7jci.org Volume 125 Number 7 July 2015
be the DAPK1 phosphorylation site) abrogate the growth-promot-ing activity of TORC1 (36). We propose that in p53-WT cells, the apoptotic-signaling pathway is dominant, with DAPK1 function-ing primarily as a death regulator within these cells. However, in breast cancer cells with mutant p53, DAPK1 expression is elevated and dysfunction of p53 prevents DAPK1 from inducing apoptosis. A potential caveat is that ER-positive cells appear less sensitive to the synthetic lethal effects of DAPK1 and p53 knockdown for unclear reasons, but this may be due to the known activation of the PI3K and mTOR pathway mediated by ER (37). Our study shows that elevated expression and activity of DAPK1 are critical for the growth and tumorigenicity of p53-mutant breast tumors. How-ever, the mechanism of DAPK1 upregulation remains unknown. Our results in ZR-75-1, ER-positive cells suggest that p53-WT may be repressing DAPK1 expression. In any case, elevation of DAPK1 and p53 dysfunction create a dependence on the DAPK1-mTOR axis for aberrant cellular growth. This DAPK1 dependence makes p53-mutant breast cancer cells sensitive to DAPK1 suppression. Thus, this model predicts our findings that DAPK1, previously categorized as a death-inducing kinase, also serves as a positive regulator of growth in p53-mutant breast cancers. Given that most TNBCs carry p53 mutations, our results suggest that DAPK1 inhibitors, alone or in combination with other standard therapies, should be explored as a synthetic lethal therapeutic target in p53-mutant breast cancer. Furthermore, a majority of all cancers have p53 pathway alterations. Thus, the clinical impact of the observa-tion that p53 mutation rewires DAPK1 signaling to promote tumor growth, as opposed to death, is greatly expanded and suggests that a significant percentage of all cancer patients would benefit from DAPK1-targeting pharmaceuticals.
MethodsReagents and plasmids. Primary antibodies for phospho-S6 (S235/236, catalog 2211), phospho-S6 (S240/244, catalog 2215), S6 (catalog 2317), phospho-S6K (T389, catalog 9205), S6K total (catalog 9202), TSC1 (cat-alog 6935), TSC2 (catalog 3990), phospho-TSC2 (S939, catalog 3615),
cellular context (i.e., p53 mutation) was not described. Here, we have established the links among apoptotic initiators, DAPK1-mediated survival, and p53 mutation.
TP53 is a frequently mutated tumor-suppressor gene in human breast cancer (34, 35), as evident from a recent TCGA report dem-onstrating that 37% of breast tumors harbor p53 mutations. How-ever, the mutation rate of p53 in TNBCs is enriched up to 80% (4). The majority of TNBC-associated p53 mutations are nonsense or frame-shift mutations. Therefore, therapeutic approaches that take advantage of a loss in p53 function are most likely to be effective and the development of such targeted options is critically needed. The low frequency of DAPK1 mutations in TNBC (<1%), our find-ings that DAPK1 expression is selectively elevated in p53-mutant breast cancers, and the fact that this overexpression correlates with sensitivity to DAPK1 inhibition all argue that small molecule inhib-itors targeting this protein could have significant clinical value.
In addition to breast cancer, DAPK1 expression is elevated in cancer types in which p53 mutations are prevalent, such as gastric, lung, neuroblastoma, ovarian, and pancreatic cancer cell lines (Sup-plemental Figure 6). As shown in Figure 5, p53-mutant pancreatic and ovarian cancer cells are sensitive to DAPK1 inhibition. Thus, our results suggest that multiple highly aggressive cancers with p53 mutations may be effectively treated with DAPK1 inhibitors.
Based on our findings, we propose the model depicted in Figure 8 and described here (Figure 8). In p53-WT cells, DAPK1 may have a dual role in breast cells, regulating both growth and apoptosis, depending upon which upstream stimuli are activated and the mutational status of TP53 (12). Following a cell death sig-nal, DAPK1 activation leads to p53 accumulation and subsequent activation of p53-target genes, ultimately inducing apoptosis. Our results and those of others (17) support a role for DAPK1 in activation of cell growth through the mTOR pathway. This occurs through phosphorylation of TSC2 by DAPK1 at Ser939, which inhibits TSC1/TSC2 complex formation, thus inhibiting mTOR signaling. These data are supported by previous literature demon-strating that TSC2 mutants lacking Ser939 (unknown at the time to
Figure 8. Proposed functional switch model of DAPK1 in p53-WT and p53-mutated breast cancer cells. DAPK1 can be activated by various factors, such as cellular stress and growth signaling. In p53-WT cells, DAPK1 can activate p53, leading to p53 target gene transcription and apopto-sis under death-related signaling. Simultaneously, DAPK1 can regulate cell growth by modulating TSC1/TSC2 com-plex formation in the mTOR pathway. Phosphorylation of TSC2 at Ser939 by DAPK1 reduces interaction between TSC1 and TSC2, leading to increased cell growth and protein synthesis and thereby maintaining a homeostatic balance between survival and death signaling. In con-trast, DAPK1 expression is elevated in p53-mutant cells. The dysfunction of p53 in these cells prevents DAPK1 from inducing apoptosis, thereby resulting in a shift of function from apoptosis toward activation of the growth pathways. Therefore, in p53-mutated cells, suppression of DAPK1 strongly suppresses tumor cell growth.

The Journal of Clinical Investigation R e s e a R c h a R t i c l e
2 7 1 8 jci.org Volume 125 Number 7 July 2015
viral infection using the pBABE-Hygro expression system (Cell Biolabs Inc.) and were followed by hygromycin selection (500 μg/ml).
Western blot analysis. Cells lysates were prepared as previously described (39). From 30 to 50 μg total protein extract was run on an 8% to 10% SDS-PAGE gel and transferred to a nitrocellulose mem-brane (GE Healthcare). Membranes were blocked in TBST with 5% BSA for phospho-specific antibodies and with 5% nonfat milk for oth-er primary antibodies. Primary antibodies were used at recommended dilutions according to the manufacturer’s instructions. After incuba-tion with a horseradish peroxidase–conjugated secondary antibody (1:5,000 dilution), detection was performed using a Chemilumines-cence Assay Kit (GE Healthcare). Band intensities were quantified by Bio-Rad Quantity One 1-D Analysis Software (Bio-Rad Life Sciences). See complete unedited blots in the Supplemental Material.
siRNA transfection and cell growth assays. siRNAs for DAPK1 were purchased from Sigma-Aldrich and pooled. Catalog numbers and sequences are given in Supplemental Table 2. siRNA transfection was performed at a final concentration of 20 nM using DharmaFECT1 Transfection Reagent (Dharmacon Inc.), according to the manufac-turer’s protocol. Transfected cells were plated in 48-well plates at 5,000 cells/well. Cell growth was measured by manual counting using a hemocytometer. Each data point represents 3 technical replicates, with results reported as average number ± SEM.
Drug treatment. For experiments using the DAPK1 inhibitor, cells were plated in 48-well plates at 5,000 cells/well and then treated with DAPK1 inhibitor at concentrations ranging from 1 to 1,000 nM (in media with 0.1% DMSO). Media alone with 0.1% DMSO was used as vehicle control. For experiments using the DAPK1 inhibitor and mTOR inhibitor, 1 μM DAPK1 and 10 nM everolimus were used alone or in combination. Cell growth was measured by manual counting using a hemocytometer after 5 days of drug treatment. Vehicle-treated cells were set at 100% growth, and other groups were normalized to vehicle control as percentage of growth of vehicle. Each data point represents 3 technical replicates, with results reported as average number ± SEM.
Cell growth assay of inducible knockdown cell lines. Cells were seed-ed in 6-well plates with or without treatment with Doxy for 2 days. Addition of Doxy induces DAPK1 shRNA expression. Cells were then plated in 48-well plates at 5,000 cells/well with or without Doxy. Cell growth was measured by manual counting. Each data point represents 3 technical replicates, with results reported as average number ± SEM.
RNA preparation and qRT-PCR. Total RNA was isolated using the RNeasy Kit (QIAGEN Inc.). A TaqMan assay was designed for DAPK1, and qRT-PCR was performed as previously described (40). Primers and probes are listed in Supplemental Table 3. Cyclophilin was used as an endogenous control. Data were reported as normalized quantity ± SEM.
Anchorage-independent growth assay. Anchorage-independent growth assays were performed as previously described (41). Briefly, 104 cells were suspended in 0.375% SeaPlaque GTG Agar (FMC) in DMEM or RPMI-1640 supplemented with 10% FBS and 1% penicil-lin-streptomycin. Suspended cells were layered over 0.75% agar base in the same medium. Colonies were counted 3 to 4 weeks after plat-ing by GelCount (Oxford Optronix). All experiments were performed in triplicate and repeated 3 times. Data reported represent average colony number ± SEM.
Nude mouse xenograft experiments. Xenograft experiments were performed as previously described (42). Briefly, 10 mice per group of BALB/c nude mice (Harlan Teklad) were used for xenograft experi-
phospho-TSC2 (S1387, catalog 5584), and phospho-TSC2 (T1462, catalog 3611) used in Western blot experiments were purchased from Cell Signaling Technology Inc. Antibody for DAPK1 (catalog 610290) was purchased from BD Transduction Laboratories. Antibody specific for β-actin (catalog A-5441) and DAPK1 (D1319) was purchased from Sigma-Aldrich. Antibodies for TSC2 (37-0500, Life Technology) and TSC1 (MAB4379, R&D Systems) were used in IP experiments. Anti-mouse (catalog NA931V) and anti-rabbit (catalog NA934V) secondary antibodies were obtained from GE Healthcare. IHC antibodies includ-ed DAPK1 (catalog SAB4500620, Sigma-Aldrich) and p53 (catalog sc-126, Santa Cruz Biotechnology Inc.). Recombinant human TNF-α (catalog PHC3015) was purchased from Life Technologies, and the DAPK inhibitor was obtained from EMD Millipore (catalog 324788). Individual pGIPZ lentiviral shRNAs for DAPK1 and p53 were pur-chased from Open Biosystems Inc. The shRNA oligonucleotide ID is provided in Supplemental Table 1. For the inducible RNAi experiments, shRNAs were subcloned individually into a pTRIPZ lentiviral expres-sion system (Open Biosystems Inc). For the inducible overexpression experiments, red fluorescent protein (RFP) was replaced with DAPK1 cDNA to generate an inducible overexpression system.
Cell culture. The MCF7 (HTB-22), MDAMB 231 (HTB-26), MDAMB 361 (HTB-27), MDAMB 415 (HTB-128), and MDAMB 468 (HTB-132) cell lines were purchased from ATCC and cultured in DMEM (Cellgro by Mediatech Inc.) supplemented with 10% FBS, 100 U/ml penicillin, and 100 mg/ml streptomycin. The ZR-75-1 (CRL-1500), HCC1143 (CRL-2321), HCC1937 (CRL-2336), and HCC1954 (CRL-2338) (ATCC) cell lines were cultured in RPMI-1640 (Cellgro by Mediatech, Inc.) supplemented with 10% FBS, 100 U/ml penicil-lin, and 100 mg/ml streptomycin. MCF10A cells (CRL-10317, ATCC) were cultured in DMEM/F12 (Cellgro; Mediatech Inc.) supplemented with 10 μg/ml insulin, 20 ng/ml human EGF, 0.5 μg/ml hydrocorti-sone, 100 ng/ml cholera toxin (Sigma-Aldrich), 5% horse serum (Gib-co Laboratories), 100 U/ml penicillin, and 100 mg/ml streptomycin. Human mammary epithelial cells (HMECs) (Lonza Walkersville Inc., CC-2551) were cultured in mammary epithelial cell growth medium (MEGM) (Lonza Inc.) supplemented with bullet kits. Pancreatic can-cer cell line PANC-1 and ovarian cancer cell line SKOV-3 were gifts from Xiangwei Wu, Qiang Shen, and Anil Sood (University of Texas MD Anderson Cancer Center). All cell lines were incubated at 37°C with 5% CO2. Cells were verified by morphology and DNA fingerprint-ing using the Cell Line Core Facility (38) and were tested for myco-plasma using PCR.
Virus production and generation of stable cell lines. Stocks containing lentiviral particles were generated by cotransfection using FuGENE 6 Transfection Reagent (Roche Applied Science) of HEK293T cells with lentiviral constructs and helping plasmids encoding VSV-G, Gag, Pol, and Tat. Medium overlaying the cells was harvested twice, at 48 and 72 hours after transfection, and was filtered through a 0.45-μm MEC filter. PEG precipitation was used to concentrate the virus. Concentrated virus was aliquoted and stored at –80°C. Stable p53 knockdown cell lines were generated by lentiviral infection using shRNA against p53 followed by puromycin selection. Stable cell lines expressing inducible shRNAs and cDNAs were generated by lentiviral infection using the pTRIPZ lentivi-ral expression system in the presence of 4 μg/ml polybrene, followed by puromycin selection (2 μg/ml). All pTRIPZ cell lines were maintained in media with Tet-safe Serum (Clontech Laboratories Inc.). Stable cell lines continuously expressing DAPK1 cDNA were generated by retro-

The Journal of Clinical Investigation R e s e a R c h a R t i c l e
2 7 1 9jci.org Volume 125 Number 7 July 2015
Life Technology) in 40 μl of kinase buffer supplemented with 20 μM ATP and 10 μCi of [γ-32P]ATP at 30°C for 45 minutes. Reactions were stopped by the addition of SDS sample buffer and resolved by gel electrophoresis. Bands were visualized using STORM840 phos-phoimager (GE Health Care).
Tissue microarray IHC. Patient tumor tissue microarrays con-taining 75 cases with 2 cores each were purchased from US Biomax Inc. (catalog BR1503b), and clinical annotations were provided by the manufacturer. We performed IHC as previously described (42), with overnight incubations of the DAPK1 antibody (1:400 dilution) and the p53 antibody (1:200 dilution). For our analyses, the 15 non-invasive cases were excluded. An additional 2 invasive carcinomas were excluded due to nonstaining by any immunohistochemical antibody (including those performed by the manufacturer, such as Ki-67). For the remaining 58 cases (116 cores) only, the first core was utilized for further analysis, although the second core was com-pared for concordance of staining. DAPK1 was scored by assigning a proportion and an intensity of staining, as outlined by Allred et al. (43), and a score threshold of greater than 2 was considered DAPK1 positive (Supplemental Figure 1F). Staining with p53 was used as a surrogate for p53 mutational status (44) and was scored using a simplified threshold value of 50% positively staining epithelial nuclei as p53 positive.
Data sets used for DAPK1 expression and survival analysis. Four pub-licly available human breast tumor data sets were used for these stud-ies: TCGA (4), Curtis (18), Desmedt (19), and van de Vijver (20). DAPK1 expression was grouped according to clinical receptor status annotations, and groups were compared using 2-tailed Student’s t test. For overall sur-vival analysis, the log-rank (Mantel-Cox) test or Kaplan-Meier analysis was used to determine the statistical differences among stratified groups in Curtis (18), Desmedt (19), van de Vijver (20), and Sørlie (23) data sets. A value of P < 0.05 was considered statistically significant.
Statistics. Statistically significant differences between groups of anchorage-independent growth were also determined by 2-tailed Student’s t test. Since tumor growth in vivo was approximately expo-nential, we compared tumor growth rates among different treatment groups by linear regression of log-transformed tumor volumes over time and compared these growth rates by Student’s t test. Immuno-histochemical staining resulted in breast cancer patients segregating into 1 of 4 groups. Comparison of the group proportions was evaluated using Fisher’s exact tests.
Study approval. Humane animal use procedures were approved by the University of Texas MD Anderson Institutional Animal Care and Use Committee under the protocol numbers 10-09-12432/06-13-05831 and overseen by the University of Texas MD Anderson Office of Research Administration.
AcknowledgmentsWe would like to thank Mien-Chie Hung, Xiangwei Wu, Qiang Shen, and Anil Sood for their helpful discussions and reagents. STR DNA fingerprinting was performed by the Characterized Cell Line Core Facility, funded by the Cancer Center Support Grant (CCSG) (CA16672). The functional proteomic analysis was performed by the RPPA core facility (CA16672). The remaining work support-ing this study was funded by a Susan G. Komen Promise grant (KG081694 to P.H. Brown), a Susan G. Komen Scientific Advisory Board (SAB) grant (SAB12-00006 to P.H. Brown), an MD Ander-
ments. Estrogen pellets (Innovative Research of America) were inject-ed into animals to stimulate growth of MCF7 xenografts. The next day, mice from each group were injected in the fat pad with approxi-mately 5 × 10⁶ cells of one of a range of cell lines (MCF7 ind-shDAPK1, MDAMB 231 ind-shDAPK1, MDAMB 468 ind-shDAPK1, MCF7 vector control, MDAMB 231 vector control, or MDAMB 468 vector control). After tumors developed and reached the size of 20 to 50 mm3, mice were randomized to receive Doxy-containing (200 μg/ml) or Doxy-free water to induce or suppress the expression of DAPK1 shRNA, respectively. For inhibitor study, 20 mice were injected with 2 × 10⁶ MDAMB 231 cells. After tumors reached the size of 50 mm3, mice were randomized to receive vehicle (sesame oil) or DAPK1 inhibitor (dose: 20 mg/kg) by i.p. injection. Tumor sizes were measured twice a week as previously described (42). Tumor growth rates of the different groups were compared by linear regression of log-transformed tumor volumes over time using 2-tailed Student’s t test. Mice were sacrificed after tumors reached 1,500 mm3.
Annexin V/DAPI assay for apoptosis. For annexin V/DAPI assays, cells were stained with FITC-conjugated annexin V and DAPI and evaluated for apoptosis by flow cytometry according to the manufac-turer’s protocol (eBioscience Inc.). Briefly, 1 × 10⁶ cells were washed with PBS and stained with 5 μl annexin V–FITC and 1 μl DAPI (1 mg/ml) in 1× binding buffer for 15 minutes in the dark at room tempera-ture. Apoptotic cells were determined using a Beckman Coulter Gal-lios Flow Cytometer. Both early apoptotic (annexin V positive, DAPI negative) and late apoptotic (annexin V positive, DAPI positive) cells were included in cell death determinations.
RPPA. Cells under different conditions were washed twice in ice-cold PBS, then lysed in 100 μl of RPPA lysis buffer (1% Triton X-100, pH 7.4, 150 mM NaCl, 100 mM NaF, 50 mM HEPES, 1.5 mM MgCl2, 1 mM EGTA, 10 mM Na pyrophosphate, 1 mM Na3VO4, 10% glycerol, freshly made protease, and phosphatase inhibitor) for 30 minutes on ice. Cell lysates were then centrifuged for 10 minutes at 18,500 g, and the super-natant was collected. Protein concentration was determined by BCA assay (Bio-Rad Laboratories) and adjusted to 1 mg/ml. 4× SDS sample buffer (40% glycerol, 8% SDS, 0.25 M Tris-HCL, pH 6.8; before use, add 2-mercaptoehtanol at 1/10 of the volume) was added to each sample and boiled at 95°C for 5 minutes. Samples were then submitted to RPPA core facility at the University of Texas MD Anderson Cancer Center.
Co-IP assay. Co-IP of both exogenously and endogenously expressed proteins was performed using HCC1143 cells. Cells were harvested in 0.5% NP40 lysis buffer. Precleared extracts were incu-bated overnight with anti-TSC2 (37-0500, Life Technology) and TSC1 (MAB4379, R&D Systems) antibodies. Protein G agarose or protein A agarose beads (Life Technologies) were used to pull down the protein-antibody complex. The resulting complexes were washed, denatured according to the manufacturer’s instructions, and submit-ted for Western blot.
In vitro kinase assay. TnT T7/T3 Coupled Reticulocyte Lysate System from Promega (L5010) was used to synthesize TSC2 pro-tein according to the manufacturer’s protocol. TSC2 was immuno-precipitated by anti-TSC2 (37-0500, Life Technology) and protein G agarose beads. The immunoprecipitates were then washed 3× with IP buffer and 2× with kinase buffer (10 mM HEPES, 50 mM β-glycerophosphate, 10 mM MgCl2, 10 mM MnCl2, 25 mM NaCl, 1 mM DTT). Immunoprecipitated TSC2 on beads was then subjected to a kinase assay using purified DAPK kinase domain (1 μg, PV3969,

The Journal of Clinical Investigation R e s e a R c h a R t i c l e
2 7 2 0 jci.org Volume 125 Number 7 July 2015
Address correspondence to: Powel H. Brown, The University of Texas MD Anderson Cancer Center, 1515 Holcombe Blvd., Unit Number: 1360, Room Number: CPB6.3468, Houston, Texas 77030, USA. Phone: 713.792.4509; E-mail: [email protected].
son Knowledge Gap Moonshot grant (to P.H. Brown), and the Breast Cancer Research Foundation (2014–2015 to P.H. Brown). We also thank Sam Short for assistance in preparing and submit-ting the manuscript.
1. Siegel R, Naishadham D, Jemal A. Cancer statis-tics, 2012. CA Cancer J Clin. 2012;62(1):10–29.
2. Carey LA, et al. Race, breast cancer subtypes, and survival in the Carolina Breast Cancer Study. JAMA. 2006;295(21):2492–2502.
3. van ‘t Veer LJ, et al. Gene expression profiling pre-dicts clinical outcome of breast cancer. Nature. 2002;415(6871):530–536.
4. Cancer Genome Atlas Network. Comprehensive molecular portraits of human breast tumours. Nature. 2002;490(7418):61–70.
5. Shah SP, et al. The clonal and mutational evolu-tion spectrum of primary triple-negative breast cancers. Nature. 2012;486(7403):395–399.
6. Børresen-Dale AL. TP53 breast cancer. Hum Mutat. 2003;21(3):292–300.
7. Speers C, et al. Identification of novel kinase targets for the treatment of estrogen receptor-negative breast cancer. Clin Cancer Res. 2009;15(20):6327–6340.
8. Shohat G, Shani G, Eisenstein M, Kimchi A. The DAP-kinase family of proteins: study of a novel group of calcium-regulated death-promoting kinases. Biochim Biophys Acta. 2002;1600(1–2):45–50.
9. Cohen O, et al. DAP-kinase participates in TNF-α- and Fas-induced apoptosis its function requires the death domain. J Cell Biol. 1999;146(1):141–148.
10. Jang CW, Chen CH, Chen CC, Chen JY, Su YH, Chen RH. TGF-β induces apoptosis through Smad-mediated expression of DAP-kinase. Nat Cell Biol. 2002;4(1):51–58.
11. Deiss LP1, Feinstein E, Berissi H, Cohen O, Kim-chi A. Identification of a novel serine/threonine kinase and a novel 15-kD protein as potential mediators of the γ interferon-induced cell death. Genes Dev. 1995;9(1):15–30.
12. Raveh T, Droguett G, Horwitz MS, DePinho RA, Kimchi A. DAP kinase activates a p19ARF/p53-mediated apoptotic checkpoint to sup-press oncogenic transformation. Nat Cell Biol. 2001;3(1):1–7.
13. Fraser JA, Hupp TR. Chemical genetics approach to identify peptide ligands that selectively stimulate DAPK-1 kinase activity. Biochemistry. 2007;46(10):2655–2673.
14. Jin Y, Blue EK, Gallagher PJ. Control of death-associated protein kinase (DAPK) activity by phosphorylation and proteasomal degradation. J Biol Chem. 2006;281(51):39033–39040.
15. Bradley JR. TNF-mediated inflammatory disease. J Pathol. 2008;214(2):149–160.
16. Inbal B, Bialik S, Sabanay I, Shani G, Kimchi A. DAP kinase and DRP-1 mediate membrane blebbing the formation of autophagic vesicles during programmed cell death. J Cell Biol. 2002;157(3):455–468.
17. Stevens C, et al. Peptide combinatorial librar-ies identify TSC2 as a death-associated protein kinase (DAPK) death domain-binding protein reveal a stimulatory role for DAPK in mTORC1 signaling. J Biol Chem. 2009;284(1):334–344.
18. Curtis C, et al. The genomic and transcriptomic architecture of 2,000 breast tumours reveals novel subgroups. Nature. 2012;486(7403):346–352.
19. Desmedt C, et al. Strong time dependence of the 76-gene prognostic signature for node-negative breast cancer patients in the TRANSBIG multi-center independent validation series. Clin Cancer Res. 2007;13(11):3207–3214.
20. van de Vijver MJ, et al. A gene-expression signa-ture as a predictor of survival in breast cancer. N Engl J Med. 2002;347(25):1999–2009.
21. Roux PP, Ballif BA, Anjum R, Gygi SP, Blenis J. Tumor-promoting phorbol esters and activated Ras inactivate the tuberous sclerosis tumor sup-pressor complex via p90 ribosomal S6 kinase. Proc Natl Acad Sci U S A. 2004;101(37):13489–13494.
22. Huang J, Manning BD. The TSC1-TSC2 complex: a molecular switchboard controlling cell growth. Biochem J. 2008;412(2):179–190.
23. Sørlie T, et al. Gene expression patterns of breast carcinomas distinguish tumor subclasses with clinical implications. Proc Natl Acad Sci U S A. 2001;98(19):10869–10874.
24. Kissil JL, et al. DAP-kinase loss of expression in various carcinoma and B-cell lymphoma cell lines: possible implications for role as tumor sup-pressor gene. Oncogene. 1997;15(4):403–407.
25. Raveh T, Kimchi A. DAP kinase — a proapoptotic gene that functions as a tumor suppressor. Exp Cell Res. 2001;264(1):185–192.
26. Anjum R, Roux PP, Ballif BA, Gygi SP, Blenis J. The tumor suppressor DAP kinase is a target of RSK-mediated survival signaling. Curr Biol. 2005;15(19):1762–1767.
27. Stevens C, Hupp TR. Novel insights into DAPK autophagic signalling using peptide aptamer combinatorial protein-interaction screens. Autophagy. 2008;4(4):531–533.
28. Cohen O, Feinstein E, Kimchi A. DAP-kinase is a Ca2+/calmodulin-dependent, cytoskeletal-asso-ciated protein kinase, with cell death-inducing functions that depend on its catalytic activity. EMBO J. 1997;16(5):998–1008.
29. Yoo HJ, Byun HJ, Kim BR, Lee KH, Park SY, Rho SB. DAPk1 inhibits NF-κB activation through TNF-α and INF-γ-induced apoptosis. Cell Signal. 2012;24(7):1471–1477.
30. Craig AL, et al. The MDM2 ubiquitination signal in the DNA-binding domain of p53 forms a dock-ing site for calcium calmodulin kinase superfami-ly members. Mol Cell Biol. 2007;27(9):3542–3555.
31. Martoriati A, Doumont G, Alcalay M, Bellefroid
E, Pelicci PG, Marine JC. dapk1, encoding an activator of a p19ARF-p53-mediated apoptotic checkpoint, is a transcription target of p53. Onco-gene. 2005;24(8):1461–1466.
32. Cai Z, et al. Resistance of MCF7 human breast carcinoma cells to TNF-induced cell death is associated with loss of p53 function. Oncogene. 1997;15(23):2817–2826.
33. Roux PP, et al. RAS/ERK signaling promotes site-specific ribosomal protein S6 phosphorylation via RSK stimulates cap-dependent translation. J Biol Chem. 2007;282(19):14056–14064.
34. Miller LD, et al. An expression signature for p53 status in human breast cancer predicts mutation status, transcriptional effects, patient survival. Proc Natl Acad Sci U S A. 2005;102(38):13550–13555.
35. Dancey JE, Bedard PL, Onetto N, Hudson TJ. The genetic basis for cancer treatment decisions. Cell. 2012;148(3):409–420.
36. Cai SL, et al. Activity of TSC2 is inhibited by AKT-mediated phosphorylation membrane par-titioning. J Cell Biol. 2006;173(2):279–289.
37. Miller TW, et al. Hyperactivation of phospha-tidylinositol-3 kinase promotes escape from hormone dependence in estrogen receptor-positive human breast cancer. J Clin Invest. 2010;120(7):2406–2413.
38. Banerji S, et al. Sequence analysis of mutations and translocations across breast cancer subtypes. Nature. 2012;486(7403):405–409.
39. Liu Y, Lu C, Shen Q, Munoz-Medellin D, Kim H, Brown PH. AP-1 blockade in breast cancer cells causes cell cycle arrest by suppressing G1 cyclin expression reducing cyclin-dependent kinase activity. Oncogene. 2004;23(50):8238–8246.
40. Kim HT, et al. Identification of biomarkers modu-lated by the rexinoid LGD1069 (bexarotene) in human breast cells using oligonucleotide arrays. Cancer Res. 2006;66(24):12009–12018.
41. Chen L, et al. Inhibition of the p38 kinase suppresses the proliferation of human ER-negative breast cancer cells. Cancer Res. 2009;69(23):8853–8861.
42. Liu Y, et al. Inhibition of AP-1 transcription factor causes blockade of multiple signal transduction pathways inhibits breast cancer growth. Onco-gene. 2002;21(50):7680–7689.
43. Allred DC, Harvey JM, Berardo M, Clark GM. Prognostic and predictive factors in breast cancer by immunohistochemical analysis. Mod Pathol. 1998;11(2):155–168.
44. Yemelyanova A, et al. Immunohistochemical staining patterns of p53 can serve as a surrogate marker for TP53 mutations in ovarian carcinoma: an immunohistochemical nucleotide sequencing analysis. Mod Pathol. 2011;24(9):1248–1253.