deep demand response: the case study of the citris ...culler/papers/peffer12diadr.pdfdeep demand...
TRANSCRIPT
Deep Demand Response: The Case Study of the CITRIS Building at the University of California-Berkeley
Therese Peffer, California Institute for Energy and Environment David Auslander, Domenico Caramagno, David Culler, Tyler Jones, Andrew Krioukov,
Michael Sankur, Jay Taneja, and Jason Trager, University of California-Berkeley Sila Kiliccote and Rongxin Yin, Lawrence Berkeley National Laboratory
Yan Lu and Prasad Mukka, Siemens Corporate Research
ABSTRACT
The goal of the Distributed Intelligent Automated Demand Response (DIADR) project at UC Berkeley is to reduce peak load of Sutardja Dai Hall by 30% while maintaining a healthy, comfortable, and productive environment for the occupants. The team consists of members from Siemens, UC Berkeley and Lawrence Berkeley National Laboratory.
This paper describes the work in progress of achieving this goal in the office portion of the building given an overcooled building not fully commissioned, grossly oversized chillers, and problems isolating the nanofabrication laboratory. Most of the reduction comes from HVAC: increasing supply air and zone temperatures and reducing ventilation rates. Other reductions involve dimming lights and turning off the tankless water heaters. Engaging the occupants of the building should provide further reduction. The web interface for the distributed load controller allows the prioritization of curtailable appliances and visualization of energy consumption. A web-based lighting controller allows the workers to easily control overhead lighting and encourages conservation.
Several new tools have facilitated this work, such as the grid-to-building gateway and the web-based lighting controller. In addition, an innovative data aggregator called sMAP allowed detailed analysis of the building systems operation. A smart phone application (RAP) facilitated an inventory of the building’s plug loads. Occupants were initially administered a survey on indoor environmental quality; short surveys during interventions assessed satisfaction with indoor temperature, light levels, and air quality.
We have made progress towards achieving deep demand response of 30% reduction of peak loads, and are establishing a new energy efficient baseline.
Introduction
The work described in this paper is primarily supported by an American Recovery and
Reinvestment Act contract through the U.S. Department of Energy. This project brought together Siemens Corporate Research (the building had a Siemens Apogee Building Automation System (BAS)), Lawrence Berkeley National Laboratory (leveraging their OpenADR, Auto-DR, and building modeling expertise), and UC Berkeley (related demand response research including distributed wireless control, and grid-to-building gateway development).
This two-year project begun in July 2010 proposed to develop a Distributed Intelligent Automated Demand Response (DIADR) system for Sutardja Dai Hall, a building first occupied in 2009 at UC Berkeley. This system would respond to a demand response signal by reducing the
peak load of the office portion of the building by 30% while maintaining a healthy, comfortable, and productive environment for the occupants.
Background
In the last ten years, much research has focused on fully automated demand response, or
Auto-DR, where a building management system automatically initiates energy saving strategies upon receipt of a signal (Piette et al. 2006). The OpenADR communication specification developed by LBNL is now used worldwide, has been adopted by many vendors, used in utility programs, and implemented in hundreds of commercial buildings (Kiliccote et al. 2010). Typical peak reductions are approximately 10%, with some buildings achieving as much as 20% (Piette et al. 2006). The vast majority of these reductions have been in HVAC and lighting systems.
However, in recent years, there has been increasing interest in controlling distributed loads, especially in the residential sector (Peffer 2009), and very recently the commercial sector (LeGrand 2012; Sator 2008). While distributed loads may be automatically controlled, there is growing interest in manual control encouraged through behavioral programs.
Another factor to coordinate with demand response is energy efficiency, as many of the building automation system controls for demand response can be used for energy efficiency (Goldman et al. 2010). In fact, the energy resource loading order established by California’s principal energy agencies calls for energy efficiency first, followed by demand response, renewables, distributed generation, and then clean fossil-fueled generation (((CEC) 2005).
The goal of the DIADR project is to bring together both central and distributed control to provide “deep” demand response1 at the appliance level of the building as well as typical lighting and HVAC applications. Additional submetering with data management helps in retro-commissioning the building, and exploring demand response scenarios. We anticipate that it could also provide needed feedback to the customer on system operation as well as cost-benefit analysis.
Research Design
This section describes the building and systems, the basic architecture of the project with
its components, the role of simulation models, load auditing and isolation, demand response algorithms, and the test plan. Building
Sutardja Dai Hall is the new headquarters for the Center for Information Technology
Research in the Interest of Society (CITRIS), which fosters collaboration among industry and faculty and students of four UC campuses. The 141,000 square foot building, occupied in 2009, includes both private and open plan office space, a few classrooms, light laboratories, café, auditorium, data center, and a nanofabrication laboratory; it also houses the Main Distribution Center (MDC) for the northeast quadrant of campus. For the purposes of this project, we did not include the loads of the energy-intensive nanofabrication laboratory nor the MDC. The building
1 Note that the University does not currently participate in a demand response program, but the Operational Excellence Energy Management program does provide a structure for bringing savings back to the departments.
has two 600 ton Trane chillers, controlled through the BAS. The absorption chiller was designed to use steam from April through October when steam on the UC Berkeley campus is not in high demand for heating. A centrifugal compressor chiller with hot gas bypass was designed to be used from November through March. The peak load of the building during mild weather is approximately 1000 kilowatts, with the centrifugal chiller adding approximately 100 kilowatts. DR strategies were considered for both chillers. Even though demand response events typically occur in the summer months in California when air conditioning contributes to peak loads, we wanted to consider strategies for the centrifugal fchiller since that is a more typical chiller.
The building has a Siemens Energy Management and Control System (EMCS) and Siemens Apogee Building Automation System (BAS). The WattStopper lighting system in the open plan offices (found on floors 4-7) has tri-level dimming capability and is on a timed schedule. The private offices have Lutron wall switches with dimming and occupancy sensor. Architecture
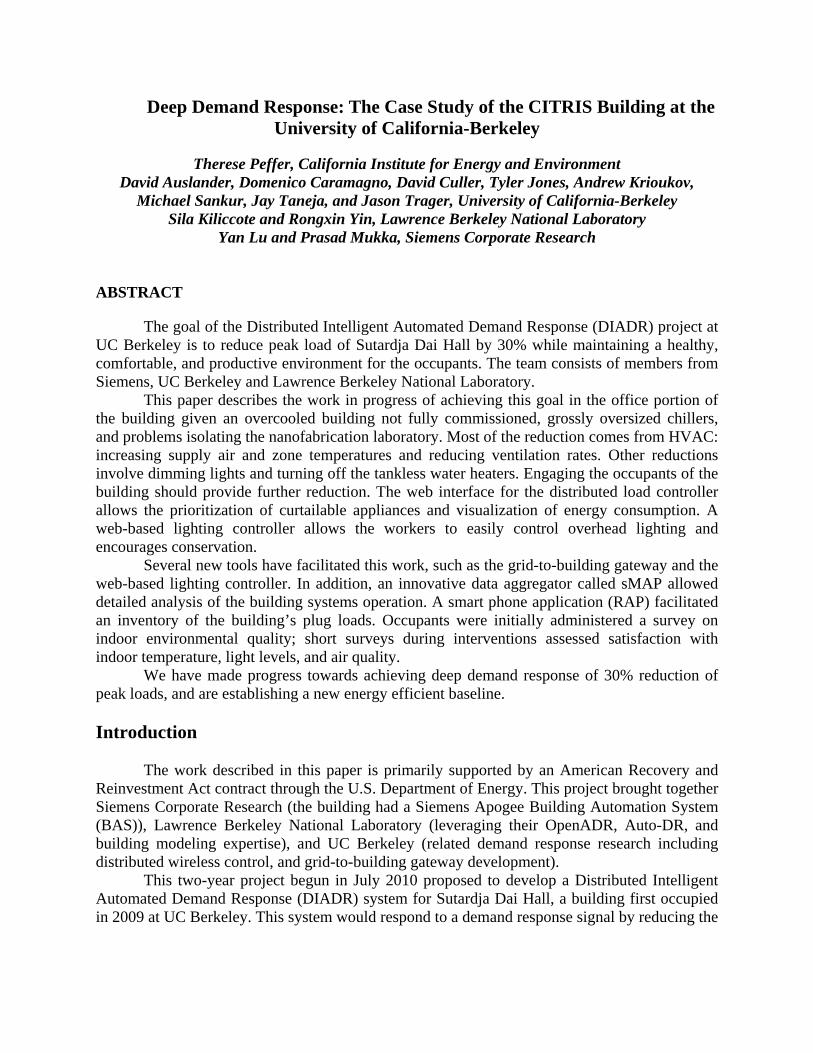
The overall architecture includes the building (Sutardja Dai Hall), the Demand Response
Automated Server at LBNL, a central controller (Smart Energy Box or web-based control), and gateways with a user interface. See Figure 1.
Figure 1. Overall Architecture of the DIADR Project
We explored two parallel means for interfacing with the controls: the Smart Energy Box
(SEB)2 and an open web-based interface that directly acted upon the BACnet points through a
2 Developed by Siemens Corporate Research, Princeton, NJ
secure server3 with its own supervisory control and optimizer (see Figure 2).4 Siemens developed SEB with the intent of commercialization. The web-based system was initially used for control during field testing. Following the spirit of open-source horizontal integration espoused by Professor David Culler and the LoCal group at UC Berkeley, it used the Simple Measurement and Actuation Profile (sMAP) developed on campus as a data source-agnostic aggregator (Dawson-Haggerty, Krioukov, and Culler 2011). The plan is to use and compare both systems.
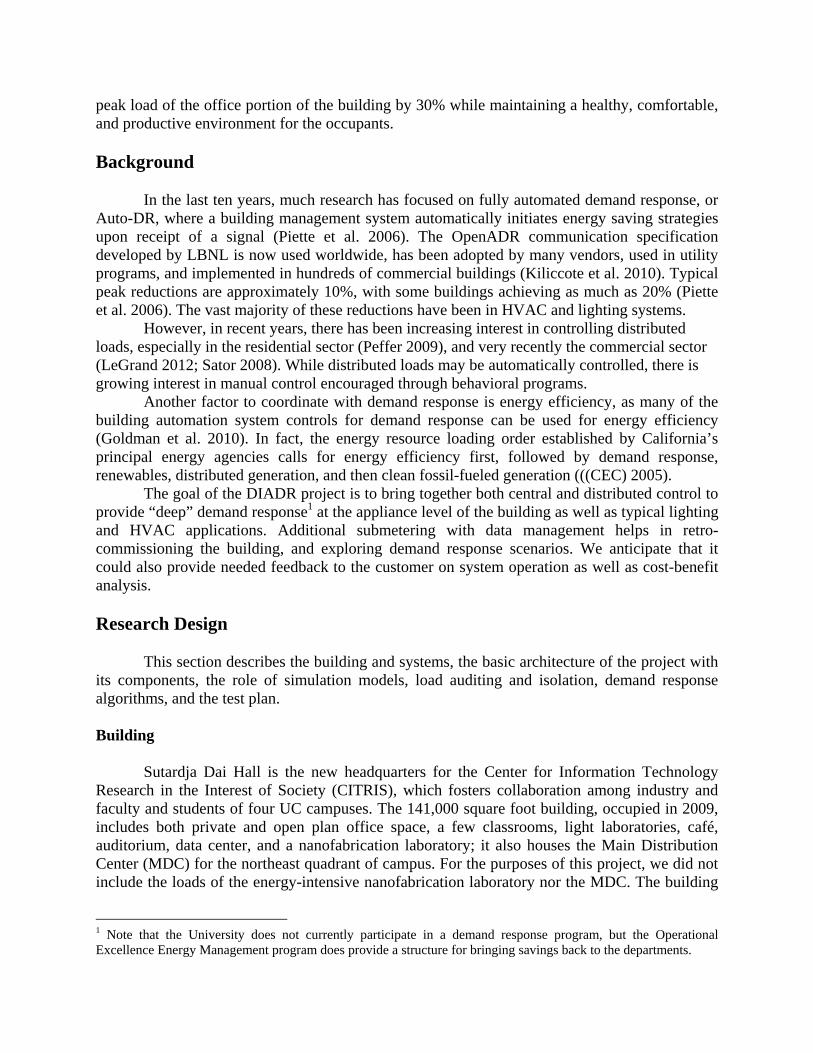
Figure 2. DR Controller Architecture (Jones)
A distributed load control gateway was developed for the project5, based on the
residential energy gateway developed at UC Berkeley ((Arnold 2011). These gateways use Raritan metered and switched plugstrips as well as wireless ACme receptacle meter and relays previously developed at UC Berkeley. The gateway also had a user interface through which a building occupant could add appliances, prioritize which appliance to curtail and override appliance and lighting curtailment during events. Simulation Models
We developed an extensive EnergyPlus model6, predictive load modeling for developing
a baseline from which to compare savings7, and a multiple gateway simulation model to extrapolate the effect of the distributed controllers on all the appliances in the building8
3 Developed by graduate student Andrew Krioukov, UC Berkeley 4 Developed by graduate students Jason Trager, Tyler Jones, and Rongxin Yin, UC Berkeley 5 Developed by graduate student Michael Sankur, UC Berkeley 6 Developed by graduate student and LBNL employee Rongxin Yin, UC Berkeley 7 Developed by graduate student Tyler Jones, UC Berkeley, (Jones and Auslander 2012) 8 Developed by Michael Sankur and Jason Trager (Trager et al. 2012)
Load Submetering, Auditing and Isolation
As Sutardja Dai Hall was intended to be a “living laboratory”, CITRIS invested over
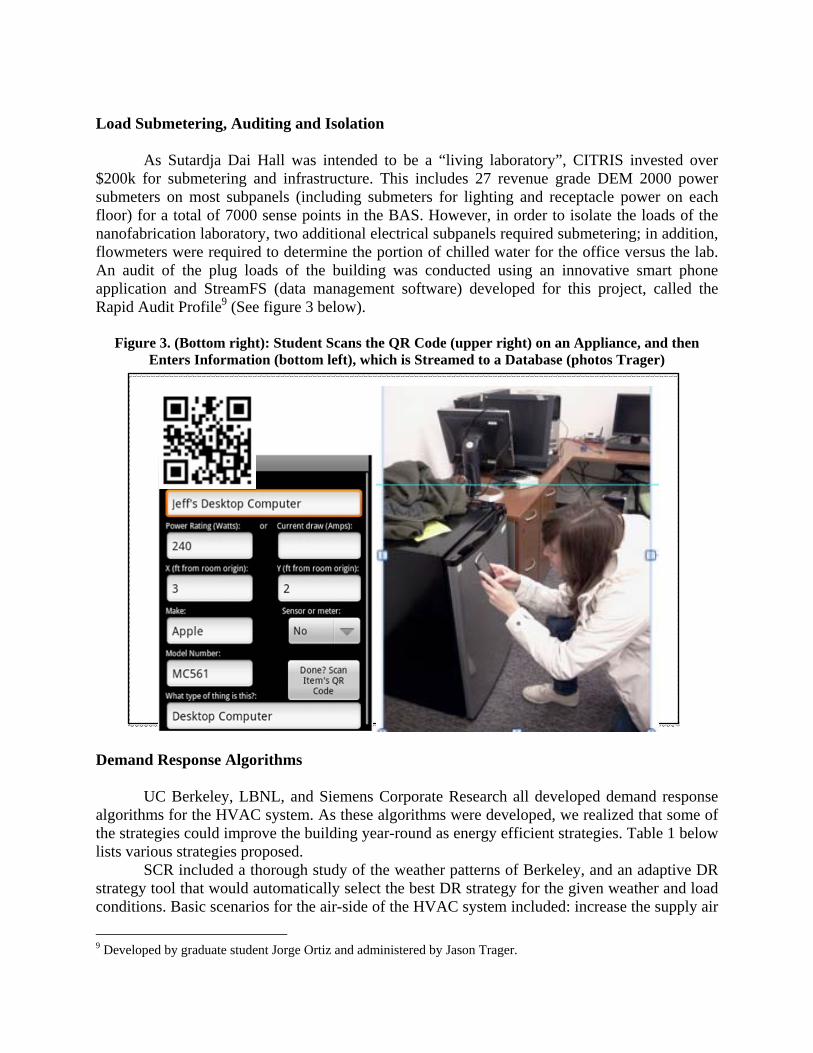
$200k for submetering and infrastructure. This includes 27 revenue grade DEM 2000 power submeters on most subpanels (including submeters for lighting and receptacle power on each floor) for a total of 7000 sense points in the BAS. However, in order to isolate the loads of the nanofabrication laboratory, two additional electrical subpanels required submetering; in addition, flowmeters were required to determine the portion of chilled water for the office versus the lab. An audit of the plug loads of the building was conducted using an innovative smart phone application and StreamFS (data management software) developed for this project, called the Rapid Audit Profile9 (See figure 3 below).
Figure 3. (Bottom right): Student Scans the QR Code (upper right) on an Appliance, and then
Enters Information (bottom left), which is Streamed to a Database (photos Trager)
Demand Response Algorithms UC Berkeley, LBNL, and Siemens Corporate Research all developed demand response
algorithms for the HVAC system. As these algorithms were developed, we realized that some of the strategies could improve the building year-round as energy efficient strategies. Table 1 below lists various strategies proposed.
SCR included a thorough study of the weather patterns of Berkeley, and an adaptive DR strategy tool that would automatically select the best DR strategy for the given weather and load conditions. Basic scenarios for the air-side of the HVAC system included: increase the supply air
9 Developed by graduate student Jorge Ortiz and administered by Jason Trager.
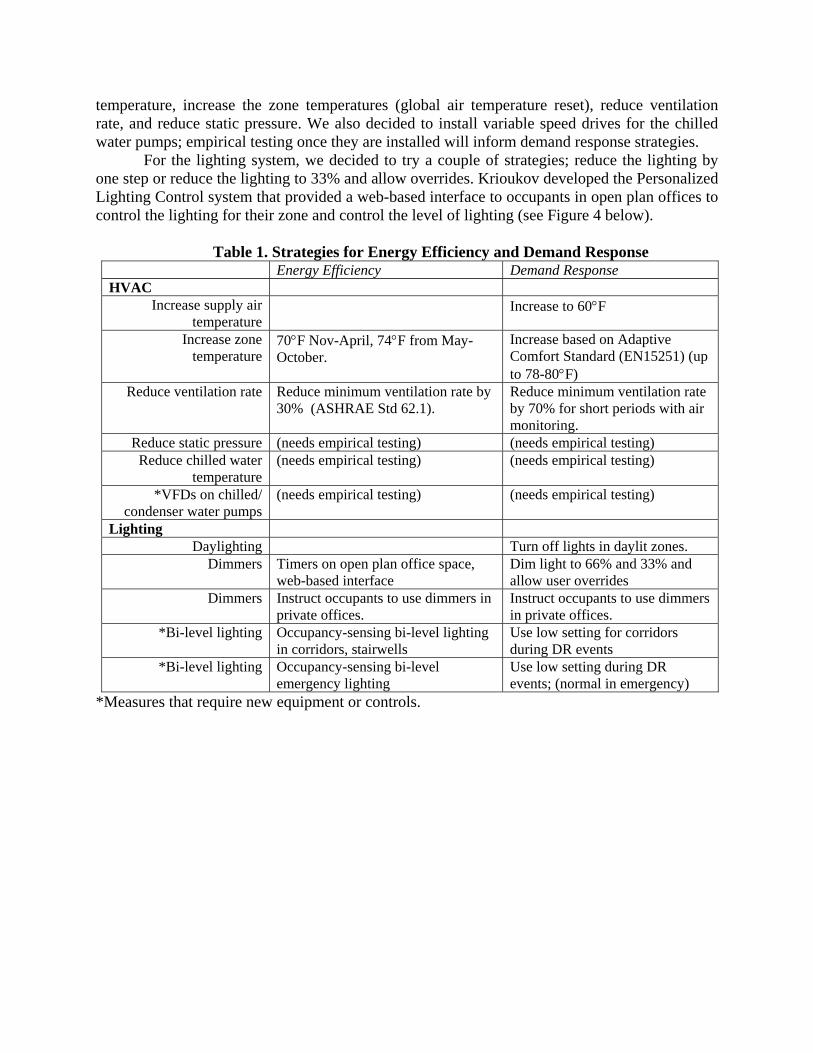
temperature, increase the zone temperatures (global air temperature reset), reduce ventilation rate, and reduce static pressure. We also decided to install variable speed drives for the chilled water pumps; empirical testing once they are installed will inform demand response strategies.
For the lighting system, we decided to try a couple of strategies; reduce the lighting by one step or reduce the lighting to 33% and allow overrides. Krioukov developed the Personalized Lighting Control system that provided a web-based interface to occupants in open plan offices to control the lighting for their zone and control the level of lighting (see Figure 4 below).
Table 1. Strategies for Energy Efficiency and Demand Response Energy Efficiency Demand Response HVAC
Increase supply air temperature
Increase to 60F
Increase zone temperature
70F Nov-April, 74F from May-October.
Increase based on Adaptive Comfort Standard (EN15251) (up to 78-80F)
Reduce ventilation rate Reduce minimum ventilation rate by 30% (ASHRAE Std 62.1).
Reduce minimum ventilation rate by 70% for short periods with air monitoring.
Reduce static pressure (needs empirical testing) (needs empirical testing) Reduce chilled water
temperature (needs empirical testing) (needs empirical testing)
*VFDs on chilled/ condenser water pumps
(needs empirical testing) (needs empirical testing)
Lighting Daylighting Turn off lights in daylit zones.
Dimmers Timers on open plan office space, web-based interface
Dim light to 66% and 33% and allow user overrides
Dimmers Instruct occupants to use dimmers in private offices.
Instruct occupants to use dimmers in private offices.
*Bi-level lighting Occupancy-sensing bi-level lighting in corridors, stairwells
Use low setting for corridors during DR events
*Bi-level lighting Occupancy-sensing bi-level emergency lighting
Use low setting during DR events; (normal in emergency)
*Measures that require new equipment or controls.
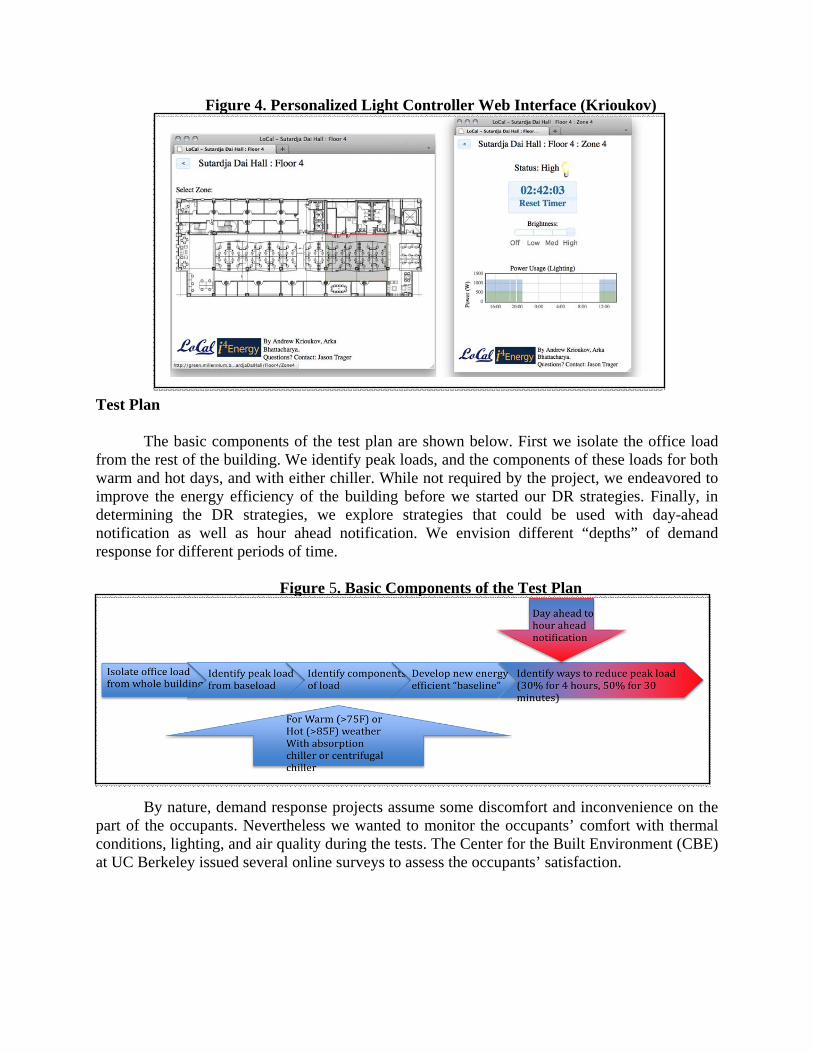
Figure 4. Personalized Light Controller Web Interface (Krioukov)
Test Plan
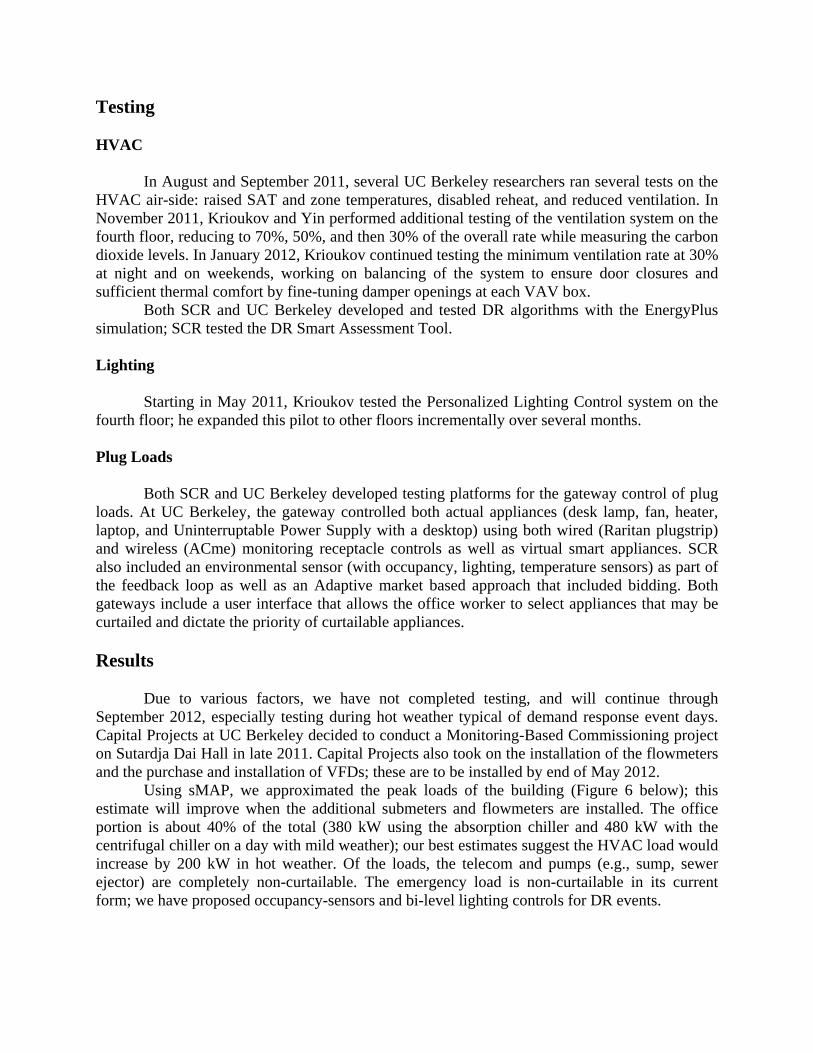
The basic components of the test plan are shown below. First we isolate the office load
from the rest of the building. We identify peak loads, and the components of these loads for both warm and hot days, and with either chiller. While not required by the project, we endeavored to improve the energy efficiency of the building before we started our DR strategies. Finally, in determining the DR strategies, we explore strategies that could be used with day-ahead notification as well as hour ahead notification. We envision different “depths” of demand response for different periods of time.
Figure 5. Basic Components of the Test Plan
By nature, demand response projects assume some discomfort and inconvenience on the part of the occupants. Nevertheless we wanted to monitor the occupants’ comfort with thermal conditions, lighting, and air quality during the tests. The Center for the Built Environment (CBE) at UC Berkeley issued several online surveys to assess the occupants’ satisfaction.
Testing
HVAC
In August and September 2011, several UC Berkeley researchers ran several tests on the HVAC air-side: raised SAT and zone temperatures, disabled reheat, and reduced ventilation. In November 2011, Krioukov and Yin performed additional testing of the ventilation system on the fourth floor, reducing to 70%, 50%, and then 30% of the overall rate while measuring the carbon dioxide levels. In January 2012, Krioukov continued testing the minimum ventilation rate at 30% at night and on weekends, working on balancing of the system to ensure door closures and sufficient thermal comfort by fine-tuning damper openings at each VAV box. Both SCR and UC Berkeley developed and tested DR algorithms with the EnergyPlus simulation; SCR tested the DR Smart Assessment Tool. Lighting
Starting in May 2011, Krioukov tested the Personalized Lighting Control system on the fourth floor; he expanded this pilot to other floors incrementally over several months.
Plug Loads
Both SCR and UC Berkeley developed testing platforms for the gateway control of plug
loads. At UC Berkeley, the gateway controlled both actual appliances (desk lamp, fan, heater, laptop, and Uninterruptable Power Supply with a desktop) using both wired (Raritan plugstrip) and wireless (ACme) monitoring receptacle controls as well as virtual smart appliances. SCR also included an environmental sensor (with occupancy, lighting, temperature sensors) as part of the feedback loop as well as an Adaptive market based approach that included bidding. Both gateways include a user interface that allows the office worker to select appliances that may be curtailed and dictate the priority of curtailable appliances.
Results
Due to various factors, we have not completed testing, and will continue through
September 2012, especially testing during hot weather typical of demand response event days. Capital Projects at UC Berkeley decided to conduct a Monitoring-Based Commissioning project on Sutardja Dai Hall in late 2011. Capital Projects also took on the installation of the flowmeters and the purchase and installation of VFDs; these are to be installed by end of May 2012.
Using sMAP, we approximated the peak loads of the building (Figure 6 below); this estimate will improve when the additional submeters and flowmeters are installed. The office portion is about 40% of the total (380 kW using the absorption chiller and 480 kW with the centrifugal chiller on a day with mild weather); our best estimates suggest the HVAC load would increase by 200 kW in hot weather. Of the loads, the telecom and pumps (e.g., sump, sewer ejector) are completely non-curtailable. The emergency load is non-curtailable in its current form; we have proposed occupancy-sensors and bi-level lighting controls for DR events.
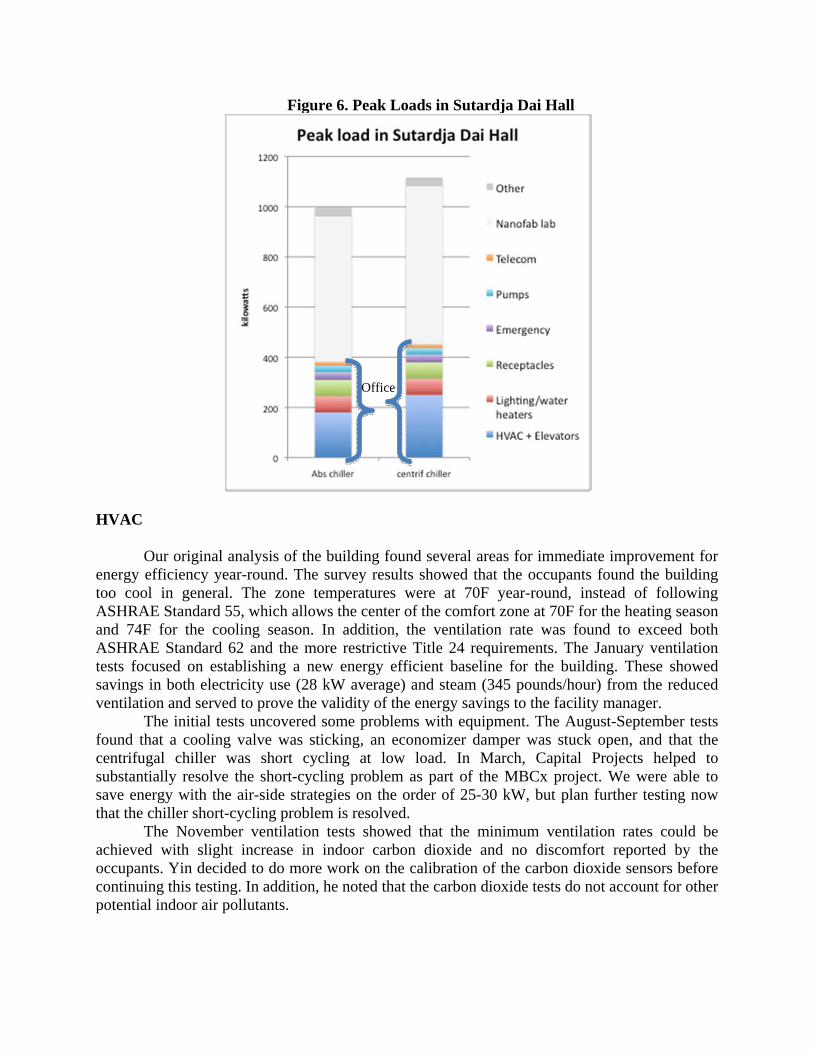
Figure 6. Peak Loads in Sutardja Dai Hall
HVAC Our original analysis of the building found several areas for immediate improvement for
energy efficiency year-round. The survey results showed that the occupants found the building too cool in general. The zone temperatures were at 70F year-round, instead of following ASHRAE Standard 55, which allows the center of the comfort zone at 70F for the heating season and 74F for the cooling season. In addition, the ventilation rate was found to exceed both ASHRAE Standard 62 and the more restrictive Title 24 requirements. The January ventilation tests focused on establishing a new energy efficient baseline for the building. These showed savings in both electricity use (28 kW average) and steam (345 pounds/hour) from the reduced ventilation and served to prove the validity of the energy savings to the facility manager.
The initial tests uncovered some problems with equipment. The August-September tests found that a cooling valve was sticking, an economizer damper was stuck open, and that the centrifugal chiller was short cycling at low load. In March, Capital Projects helped to substantially resolve the short-cycling problem as part of the MBCx project. We were able to save energy with the air-side strategies on the order of 25-30 kW, but plan further testing now that the chiller short-cycling problem is resolved.
The November ventilation tests showed that the minimum ventilation rates could be achieved with slight increase in indoor carbon dioxide and no discomfort reported by the occupants. Yin decided to do more work on the calibration of the carbon dioxide sensors before continuing this testing. In addition, he noted that the carbon dioxide tests do not account for other potential indoor air pollutants.
Office
Simulation studies conducted by Yin indicated a 75-110 kW potential reduction in the HVAC air-side depending on weather conditions (e.g., outdoor air temperature ranging from 85-95F) for the centrifugal chiller; this represents nearly two-thirds of the total target. Lighting
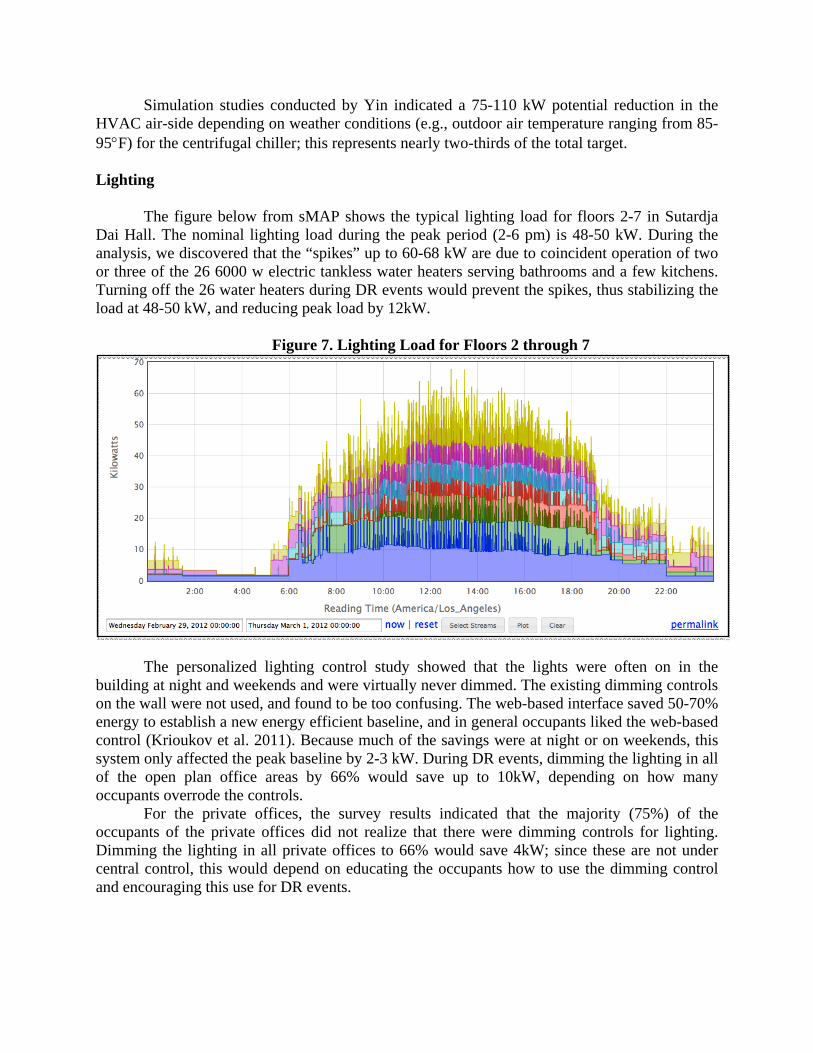
The figure below from sMAP shows the typical lighting load for floors 2-7 in Sutardja
Dai Hall. The nominal lighting load during the peak period (2-6 pm) is 48-50 kW. During the analysis, we discovered that the “spikes” up to 60-68 kW are due to coincident operation of two or three of the 26 6000 w electric tankless water heaters serving bathrooms and a few kitchens. Turning off the 26 water heaters during DR events would prevent the spikes, thus stabilizing the load at 48-50 kW, and reducing peak load by 12kW.
Figure 7. Lighting Load for Floors 2 through 7
The personalized lighting control study showed that the lights were often on in the
building at night and weekends and were virtually never dimmed. The existing dimming controls on the wall were not used, and found to be too confusing. The web-based interface saved 50-70% energy to establish a new energy efficient baseline, and in general occupants liked the web-based control (Krioukov et al. 2011). Because much of the savings were at night or on weekends, this system only affected the peak baseline by 2-3 kW. During DR events, dimming the lighting in all of the open plan office areas by 66% would save up to 10kW, depending on how many occupants overrode the controls.
For the private offices, the survey results indicated that the majority (75%) of the occupants of the private offices did not realize that there were dimming controls for lighting. Dimming the lighting in all private offices to 66% would save 4kW; since these are not under central control, this would depend on educating the occupants how to use the dimming control and encouraging this use for DR events.
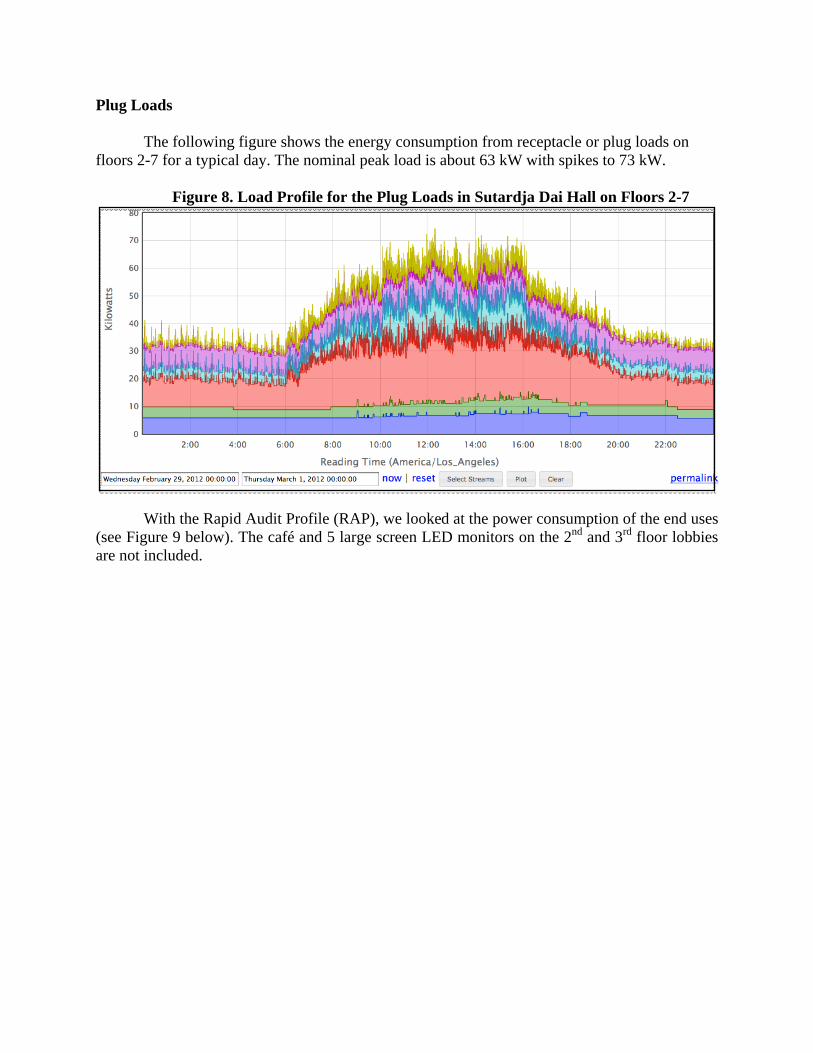
Plug Loads The following figure shows the energy consumption from receptacle or plug loads on
floors 2-7 for a typical day. The nominal peak load is about 63 kW with spikes to 73 kW.
Figure 8. Load Profile for the Plug Loads in Sutardja Dai Hall on Floors 2-7
With the Rapid Audit Profile (RAP), we looked at the power consumption of the end uses
(see Figure 9 below). The café and 5 large screen LED monitors on the 2nd and 3rd floor lobbies are not included.
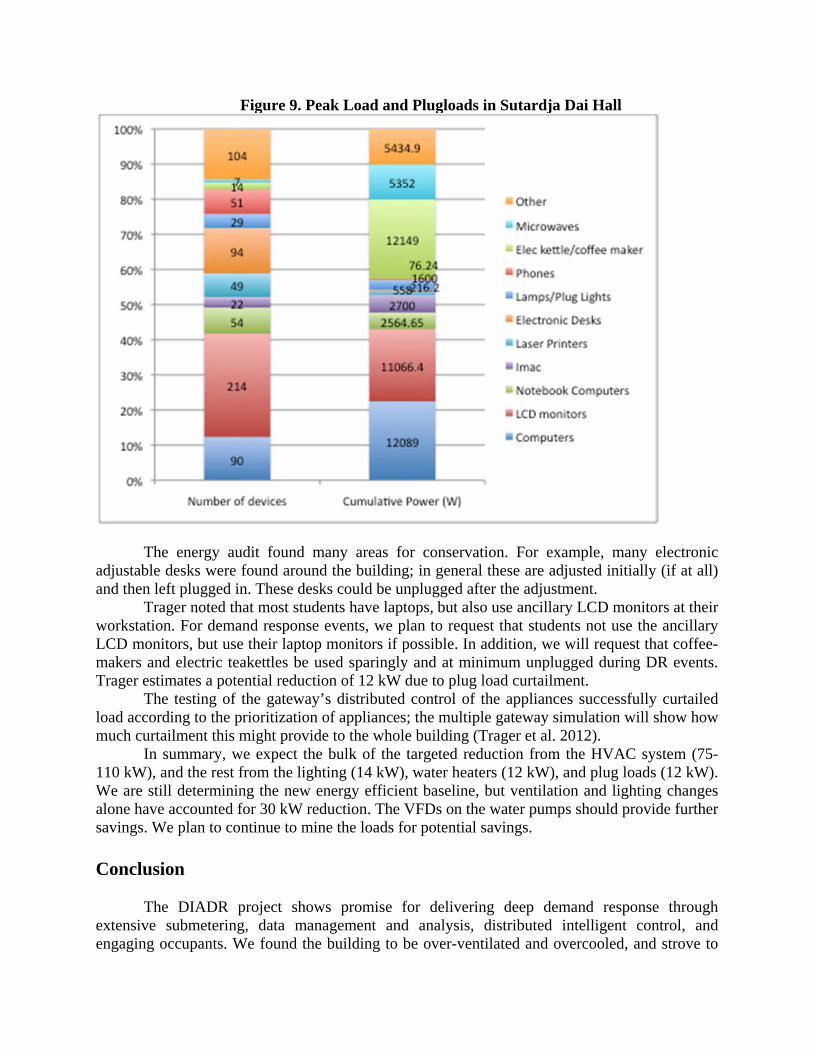
Figure 9. Peak Load and Plugloads in Sutardja Dai Hall
The energy audit found many areas for conservation. For example, many electronic adjustable desks were found around the building; in general these are adjusted initially (if at all) and then left plugged in. These desks could be unplugged after the adjustment.
Trager noted that most students have laptops, but also use ancillary LCD monitors at their workstation. For demand response events, we plan to request that students not use the ancillary LCD monitors, but use their laptop monitors if possible. In addition, we will request that coffee-makers and electric teakettles be used sparingly and at minimum unplugged during DR events. Trager estimates a potential reduction of 12 kW due to plug load curtailment.
The testing of the gateway’s distributed control of the appliances successfully curtailed load according to the prioritization of appliances; the multiple gateway simulation will show how much curtailment this might provide to the whole building (Trager et al. 2012).
In summary, we expect the bulk of the targeted reduction from the HVAC system (75-110 kW), and the rest from the lighting (14 kW), water heaters (12 kW), and plug loads (12 kW). We are still determining the new energy efficient baseline, but ventilation and lighting changes alone have accounted for 30 kW reduction. The VFDs on the water pumps should provide further savings. We plan to continue to mine the loads for potential savings. Conclusion
The DIADR project shows promise for delivering deep demand response through
extensive submetering, data management and analysis, distributed intelligent control, and engaging occupants. We found the building to be over-ventilated and overcooled, and strove to
correct problems and create a new energy efficient baseline through reduced ventilation and improved lighting controls. Initial demand response testing included increasing the supply air temperature, increasing the zone temperatures, disabling reheat, reducing the ventilation rate, and improving the lighting control interface. Combined with simulation results, we expect the majority of savings from the HVAC system, and incremental savings through light dimming. Involving occupants to turn off appliances and dim lights will also reduce load. The RAP plug load audit in the building enabled us to target specific appliances for occupant education and motivation for our DR events. The sMAP data aggregation system allowed for “deep” commissioning of the building as well as aiding the implementation of an open web-based control system. In addition, the data visualization provided by sMAP identified potential targets for load reduction, such as the tankless water heaters.
Acknowledgement
This material is based upon work supported by the Department of Energy under Award
Number DE-EE0003847
Disclaimer This report was prepared as an account of work sponsored by an agency of the United
States Government. Neither the United States Government nor any agency thereof, nor any of their employees, makes any warranty, express or implied, or assumes any legal liability or responsibility for the accuracy, completeness, or usefulness of any information, apparatus, product, or process disclosed, or represents that its use would not infringe privately owned rights. Reference herein to any specific commercial product, process, or service by trade name, trademark, manufacturer, or otherwise does not necessarily constitute or imply its endorsement, recommendation, or favoring by the United States Government or any agency thereof. The views and opinions of authors expressed herein do not necessarily state or reflect those of the United States Government or any agency thereof.
References
(CEC), California Energy Commission. 2005. Implementing California's Loading Order for
Electricity Resources, CEC-400-2005-043. Sacramento: California Energy Commission.
Arnold, Daniel. Residential Energy Gateway 2011. Available from http://mechatronics.berkeley.edu/gateway_research.htm.
Dawson-Haggerty, Stephen, Andrew Krioukov, and David Culler. 2011. Experiences Integrating Building Data with sMAP. UC Berkeley. Available from http://i4energy.org/index.php/projects/affiliate-projects/6-sutardja-dai-hall.
Jones, Tyler, and D. M. Auslander. 2012. "Improved Methods to Load Prediction in Commercial Buildings." 2012 ACEEE Summer Study on Energy Efficiency in Buildings 3. Washington, D.C.: American Council for an Energy-Efficient Economy.
Kiliccote, Sila, Mary Ann Piette, Johanna Mathieu, and Kristen Parrish. 2010. "Findings from 7 years of Automated Demand Response in Commercial Buildings." In ACEEE 2010 Summer Study on Energy Efficiency in Buildings. Washington, D.C.: American Council for an Energy-Efficient Economy.
Krioukov, Andrew, Stephen Dawson-Haggerty, Linda Lee, Omar Rehmane, and David Culler. 2011. "A Living Laboratory Study in Personalized Automated Lighting Controls." In BuildSys'11. Seattle, WA: ACM.
LeGrand. 2012. Managing Plug load is the Next Challenge for Energy Efficient Buildings. Available from http://www.legrand.us/wiremold-pages/wiremold-white-papers/plugload.aspx#.T0_VP8yaesU.
Peffer, T.E. 2009. California DREAMing: the Design of Residential Demand Responsive Technology with People in Mind, University of California Berkeley, Berkeley, CA.
Piette, Mary Ann, Dave Watson, Naoya Motegi, Sila Kiliccote, and Eric Linkugel. 2006. "Automated Demand Response Strategies and Commissioning Commerical Building Controls." In National Conference on Building Commissioning.
Sator, Spencer. Managing Office Plug Loads 2008. Available from www.cityofpaloalto.org/civica/filebank/blobdload.asp?BlobID...
Trager, Jason, Michael Sankur, Jorge Ortiz, Tyler Jones, Jay Taneja, D. M. Auslander, David Culler, and Paul Wright. 2012. "Rapidly Adaptable Plug-load Simulation for Evaluating Energy Curtailment Strategies." 2012 ACEEE Summer Study on Energy Efficiency in Buildings 7. Washington, D.C.: American Council for an Energy-Efficient Economy.