deep learning for inferring cause of data anomalies learning for inferring cause of data anomalies...
TRANSCRIPT
Deep learning for inferring cause of data anomalies
V. Azzolini1, M. Borisyak2,3, G. Cerminara4, D. Derkach2,3,G. Franzoni4, F. De Guio5, O. Koval6,3, M. Pierini4, A. Pol7, F.Ratnikov2,3, F. Siroky4, A. Ustyuzhanin2,3 and J-R. Vlimant8
1 Massachusetts Institute of Technology, Cambridge, USA2 National Research University Higher School of Economics, Moscow, Russia3 Yandex School of Data Analysis, Moscow, Russia4 CERN, European Organization for Nuclear Research, Geneva, Switzerland5 Texas Tech University, Lubbock, USA6 Skolkovo Institute of Science and Technology, Moscow, Russia7 University of Paris-Saclay, Paris, France8 California Institute of Technology, Pasadena, USA
E-mail: [email protected]
Abstract. Daily operation of a large-scale experiment is a resource consuming task,particularly from perspectives of routine data quality monitoring. Typically, data comes fromdifferent sub-detectors and the global quality of data depends on the combinatorial performanceof each of them. In this paper, the problem of identifying channels in which anomalies occurredis considered. We introduce a generic deep learning model and prove that, under reasonableassumptions, the model learns to identify ’channels’ which are affected by an anomaly. Suchmodel could be used for data quality manager cross-check and assistance and identifying goodchannels in anomalous data samples. The main novelty of the method is that the model doesnot require ground truth labels for each channel, only global flag is used. This effectivelydistinguishes the model from classical classification methods. Being applied to CMS datacollected in the year 2010, this approach proves its ability to decompose anomaly by separatechannels.
1. IntroductionData quality monitoring is a crucial task for every large scale high energy physics experiment.The challenge is driven by a huge amount of data. A considerable amount of person poweris required for monitoring and classification. Previously [1], we designed a system, whichautomatically classifies marginal cases in general: both of ’good’ and ’bad’ data, and use humanexpert decision to classify remaining ’grey area’ cases.
Typically, data comes from different sub-detectors or other subsystems, and the global dataquality depends on the combinatorial performance of each of them. In this work, we aim insteadto determine which sub-detector is responsible for anomaly in the detector behaviour, knowingonly global flag. For this study, we use data [2] acquired by CMS detector [3] at CERN LHC.A proposed system can indicate affected channels and draw the attention of human experts toother channels. Data from the channels, which are reconstructed relying primarily on normallyoperating sub-detectors, can be used for further specific physics analysis.
arX
iv:1
711.
0705
1v1
[ph
ysic
s.da
ta-a
n] 1
9 N
ov 2
017

2. Data and feature extractionData preprocessing procedure is the same as in the previous work [1], and described in detailesthere.
All data is divided into time quanta - LumiSections1, which are labelled as ’good’ or ’bad’.Physics object is a proxy for a particle recorded in the detector which is constructed fromrecorded raw data collected by several sub-detectors. The information coming from four channelsper each used LumiSection. These channels are equivalent to physics objects: muons, photons,particle flow jets (PF) or calorimeter jets (calo). Objects (equivalent to physics particles) arequantiled by their transverse momentum to have fixed number of features in each event. Thenevery selected object is characterized by its reconstructed physics properties: mass, spatiallocation, kinematics. And statistics for each feature for the entire lumisection is computed(5 percentiles, mean and variance). Additionally, features like instant luminosity, number ofparticles in event and others were also introduced.
In total we have almost 16k data points (LumiSections) 25% of which were labeled asanomalous. There are 267 features in muon, 232 in photon, 126 in PF, 266 in calo channel.We use 10% of data to validate our model during training. And the final test for our systemis a computing correlations between the method predictions and experts labels for CMS sub-detectors.
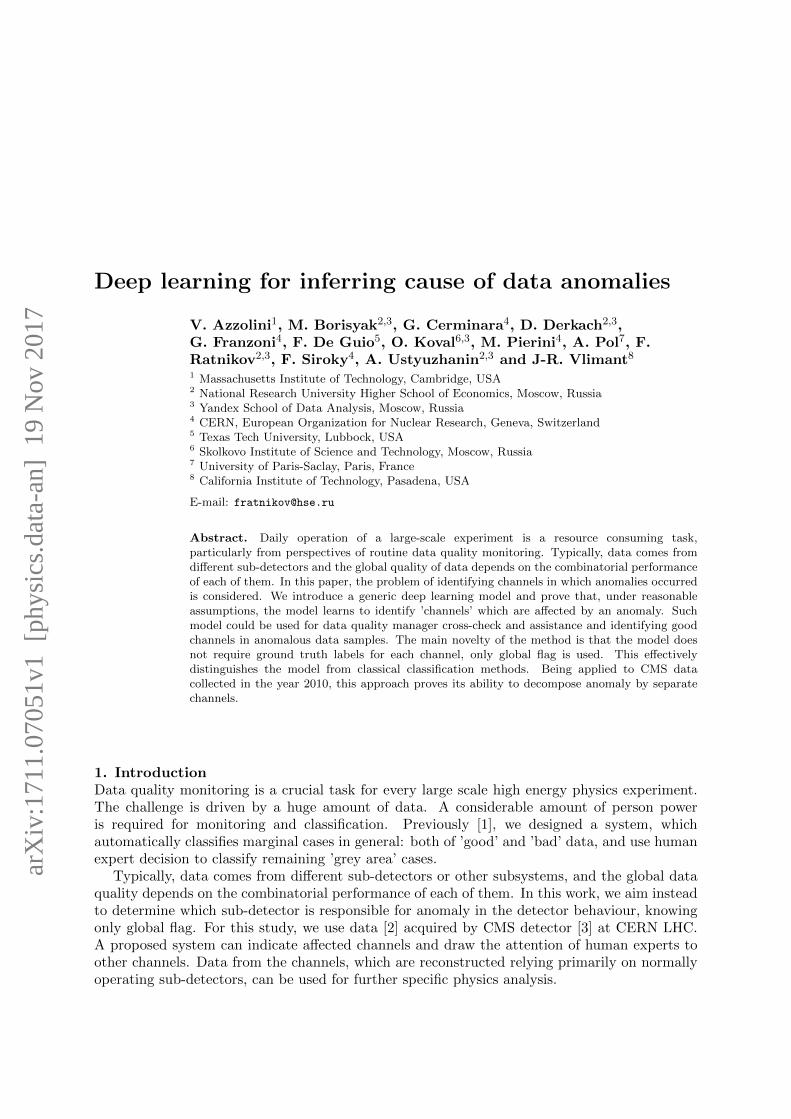
3. MethodIn order to predict a probability of anomaly in different channels separately we build a specialmulti-head neural network (NN) configuration presented in Fig. 1.
NN consist of four branches and each sub-networks has in input features from correspondingchannel. Each branch returns a score for its channel. At the end, sub-networks are connectedand the whole network is trained to recover global labels.
In this paper we present results when sub-networks are connected with kind of ’Fuzzy AND’operator:
exp
[4∑
i=1
(fi − 1)
](1)
where fi− is an output of the last layer of sub-networks.It is proved for this operator, that under reasonable assumptions, the model learns to identify
’channels’ which are affected by an anomaly.2 As network connection operator, logistic regressionand min operator with dropout could also be used.
The main benefit is that proposed approach uses only aggregated global quality tag fortraining, but allows to predict anomalies for separate channels.
In this way, each subnetwork returns score:
• close to 1 for good lumisections;
• close to 1 for anomalies invisible from subnetworks channel data, but visible to othersubnetworks channels in the NN method;
• close to 0 for anomalies visible from subnetworks channel data.
Thus NN decomposes anomalies by channels.’Fuzzy AND’ approach assumes that there are anomalies not seen from all channels. They
look like ’good’ data points in the channel, surrounded by them and are classified by this
1 Segment of data corresponding to 23 seconds of data taking2 Proof for ’Fuzzy AND’ operator decomposition properties and code of the systems with different operators fornetwork connection are available in https://github.com/yandexdataschool/cms-dqm/
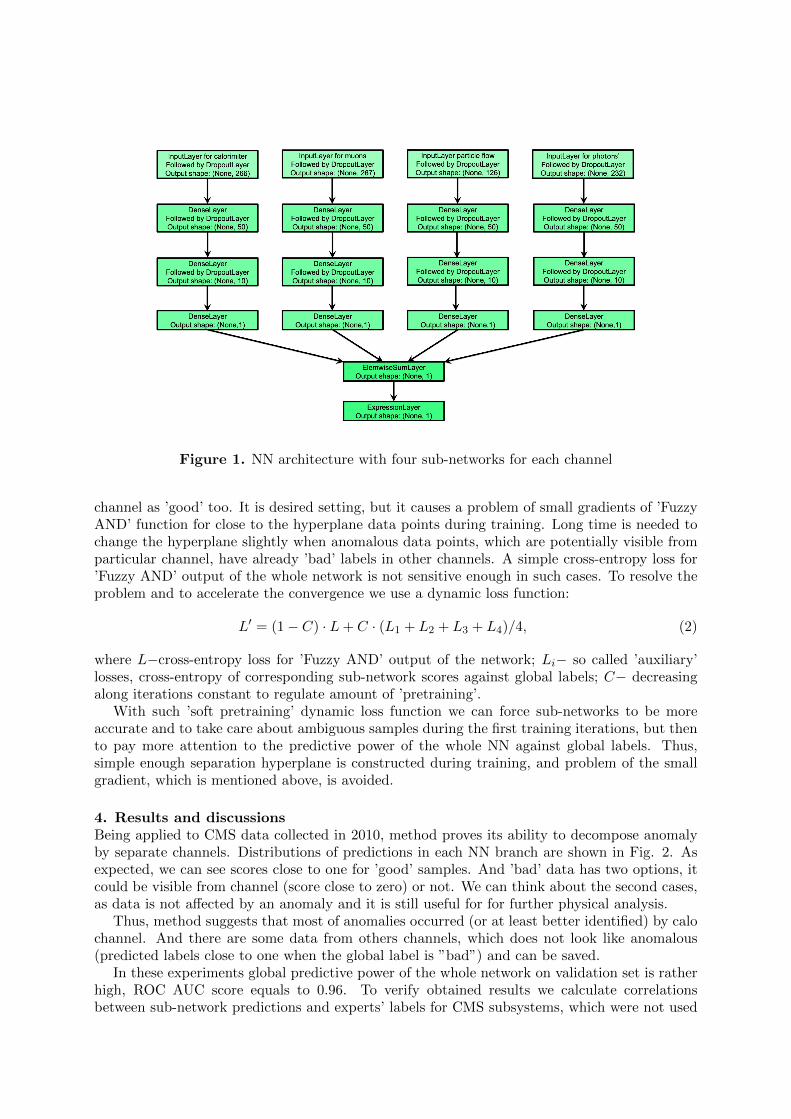
Figure 1. NN architecture with four sub-networks for each channel
channel as ’good’ too. It is desired setting, but it causes a problem of small gradients of ’FuzzyAND’ function for close to the hyperplane data points during training. Long time is needed tochange the hyperplane slightly when anomalous data points, which are potentially visible fromparticular channel, have already ’bad’ labels in other channels. A simple cross-entropy loss for’Fuzzy AND’ output of the whole network is not sensitive enough in such cases. To resolve theproblem and to accelerate the convergence we use a dynamic loss function:
L′ = (1 − C) · L + C · (L1 + L2 + L3 + L4)/4, (2)
where L−cross-entropy loss for ’Fuzzy AND’ output of the network; Li− so called ’auxiliary’losses, cross-entropy of corresponding sub-network scores against global labels; C− decreasingalong iterations constant to regulate amount of ’pretraining’.
With such ’soft pretraining’ dynamic loss function we can force sub-networks to be moreaccurate and to take care about ambiguous samples during the first training iterations, but thento pay more attention to the predictive power of the whole NN against global labels. Thus,simple enough separation hyperplane is constructed during training, and problem of the smallgradient, which is mentioned above, is avoided.
4. Results and discussionsBeing applied to CMS data collected in 2010, method proves its ability to decompose anomalyby separate channels. Distributions of predictions in each NN branch are shown in Fig. 2. Asexpected, we can see scores close to one for ’good’ samples. And ’bad’ data has two options, itcould be visible from channel (score close to zero) or not. We can think about the second cases,as data is not affected by an anomaly and it is still useful for for further physical analysis.
Thus, method suggests that most of anomalies occurred (or at least better identified) by calochannel. And there are some data from others channels, which does not look like anomalous(predicted labels close to one when the global label is ”bad”) and can be saved.
In these experiments global predictive power of the whole network on validation set is ratherhigh, ROC AUC score equals to 0.96. To verify obtained results we calculate correlationsbetween sub-network predictions and experts’ labels for CMS subsystems, which were not used

for training, as presented in Fig. 3. All ROC AUC scores a higher than 0.5. It means thatthere is a clear correlation between sub-networks outputs and corresponding subsystem labels(for example: Muons vs Tracking) or some of them are almost independent (Photons vs DTmuon chambers). But there is no anti-correlations, as it is expected.
a) b)
c) d)
Figure 2. Distributions of predictions returned by NN branches build on features from a)calorimiter, b) particle flow jets, c) muons, d) photons channels.
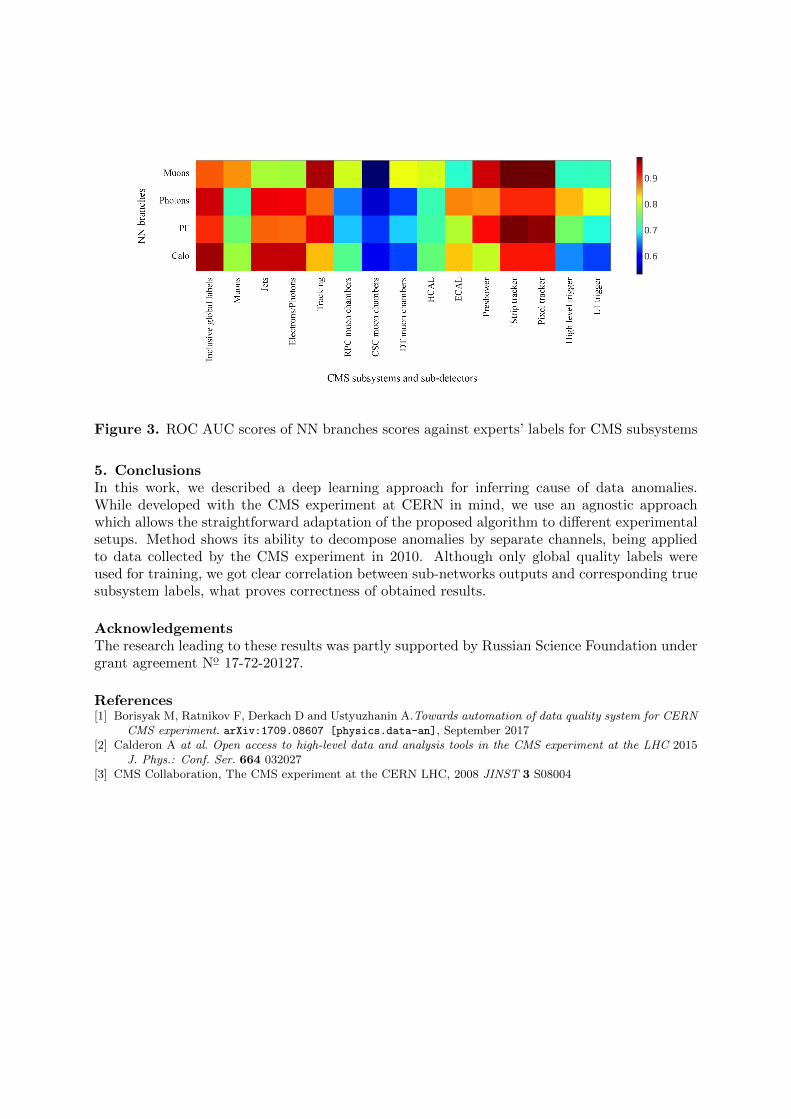
Figure 3. ROC AUC scores of NN branches scores against experts’ labels for CMS subsystems
5. ConclusionsIn this work, we described a deep learning approach for inferring cause of data anomalies.While developed with the CMS experiment at CERN in mind, we use an agnostic approachwhich allows the straightforward adaptation of the proposed algorithm to different experimentalsetups. Method shows its ability to decompose anomalies by separate channels, being appliedto data collected by the CMS experiment in 2010. Although only global quality labels wereused for training, we got clear correlation between sub-networks outputs and corresponding truesubsystem labels, what proves correctness of obtained results.
AcknowledgementsThe research leading to these results was partly supported by Russian Science Foundation undergrant agreement No 17-72-20127.
References[1] Borisyak M, Ratnikov F, Derkach D and Ustyuzhanin A.Towards automation of data quality system for CERN
CMS experiment. arXiv:1709.08607 [physics.data-an], September 2017[2] Calderon A at al. Open access to high-level data and analysis tools in the CMS experiment at the LHC 2015
J. Phys.: Conf. Ser. 664 032027[3] CMS Collaboration, The CMS experiment at the CERN LHC, 2008 JINST 3 S08004