deliberative democracy and the resource curse: a
TRANSCRIPT
Working Paper 548 September 2020
Deliberative Democracy and the Resource Curse: A Nationwide Experiment in Tanzania
Abstract
Oil and gas discoveries in developing countries are often associated with short-sighted economic policies and, in response, calls to insulate resource management from populist impulses. We report on a randomized experiment testing methods to overcome this apparent tension between sound resource governance and democratic politics. Soon after Tanzania’s discovery of major natural gas reserves, we invited a nationally representative sample of voters to an intensive public deliberation of policy options featuring nationally recognized experts and small-group discussions. Democratic deliberation reinforced the public’s strong preference for rapid spending of gas revenues, but also increased support for various prudential and economically orthodox measures, including independent oversight of gas revenues, limits on government borrowing, and selling gas abroad rather than subsidizing fuel at home. These effects were driven by deliberation per se, rather than a pure information treatment, and show no evidence of contamination by facilitator- or peer-effects in group deliberations.
www.cgdev.org
Justin Sandefur, Nancy Birdsall, James Fishkin, and Mujobu Moyo
Center for Global Development2055 L Street NW
Washington, DC 20036
202.416.4000(f) 202.416.4050
www.cgdev.org
The Center for Global Development works to reduce global poverty and improve lives through innovative economic research that drives better policy and practice by the world’s top decision makers. Use and dissemination of this Working Paper is encouraged; however, reproduced copies may not be used for commercial purposes. Further usage is permitted under the terms of the Creative Commons License.
The views expressed in CGD Working Papers are those of the authors and should not be attributed to the board of directors, funders of the Center for Global Development, or the authors’ respective organizations.
Deliberative Democracy and the Resource Curse: A Nationwide Experiment in Tanzania
Justin SandefurCenter for Global Development
Nancy BirdsallCenter for Global Development
James FishkinStanford University
Mujobu MoyoCenter for Global Development
We are grateful to Sam Wangwe, Abel Kinyondo and the members of the CGD-REPOA working group on natural gas for their guidance, to Economic Development Initiatives (EDI) who collected the polling data and organized the deliberative events, and to Alice Siu of Stanford and Bobby Fishkin of Reframe It for their help in the survey design. Jennifer Richmond and Faraz Haqqi provided excellent research assistance throughout design, implementation, and data analysis. All opinions and any errors are ours. Fieldwork was conducted under the Tanzania Commission for Science and Technology (COSTECH) permit number 2014-269-NA-2014-133 and registered in the AEA RCT registry, ID AEARCTR-0000689.
The Center for Global Development is grateful for contributions from the Bill & Melinda Gates Foundation (OPP1083297), the International Initiative for Impact Evaluation - 3ie (TW8.1001), the International Growth Centre (1-VCS-VTZA-VXXXX-40303), and Canada’s International Development Research Council in support of this work.
Justin Sandefur, Nancy Birdsall, James Fishkin, and Mujobu Moyo, 2020. “Deliberative Democracy and the Resource Curse: A Nationwide Experiment in Tanzania.” CGD Working Paper 548. Washington, DC: Center for Global Development. https://www.cgdev.org/publication/deliberative-democracy-resource-curse-nationwide-experiment-tanzania
The data used in this paper is available here: https://www.cgdev.org/sites/default/files/Sandefur-et-al-dem-gas-replication-files.zip. More information on CGD’s research data and code disclosure policy can be found here: www.cgdev.org/page/research-data-and-code-disclosure.
1 Introduction
The concept of deliberative democracy stresses the value of informed citizens collectively and
publicly weighing diverse arguments on their merits [Bessette, 1980, Fishkin, 1991, Gutmann
and Thompson, 1996]. To its proponents, this process of deliberation holds both epistemic
value in revealing informed public opinion [Nino, 1996] and, in some conceptions, constitutes
a necessary component of democratic legitimacy [Cohen, 1997].
This study seeks to test mechanisms to enact this ideal of deliberative democracy in a
particularly challenging setting, i.e., a low-income country in the midst of a resource boom.
In 2010, Tanzania discovered natural gas reserves off its southern coast which, at the time of
our experiment, were valued at roughly fifteen times the country’s GDP [Baunsgaard, April
11, 2014], raising a host of questions about the extraction, refinement, export, management,
and allocation of resource revenues.
Oil and gas discoveries are commonly associated with increased authoritarianism, dete-
riorating governance, and slow growth [Gelb, 1988, Van der Ploeg, 2011, Ross, 2013]. Some
scholars have gone so far as to argue that electoral democracy is not just a victim but a culprit
in this story, exacerbating the ‘resource curse’ through populism and clientelism [Collier and
Hoeffler, April 2009, Gyimah-Boadi and Prempeh, 2012]. Measures promoted by the IMF
and other international organizations to protect resource revenues from ‘political influence’
– such as sovereign wealth funds and policy rules [Poplawski Ribeiro et al., 2012, IWG, 2008]
– reflect this perceived tension between sound resource governance and democratic politics.
Is this aversion to democratic participation in resource-rich developing countries war-
ranted on economic grounds? We report on a two-day, nationally-representative deliberative
process and a longitudinal survey of 2,000 voting-age adults to examine how ordinary Tan-
zanians wanted to use the revenue windfall generated by the country’s recent natural gas
discovery. This deliberative exercise is couched within an experimental design that allows
us to measure its overall impact on public opinion, and to begin to disentangle the role of
receiving additional information from collective deliberation per se.
The overriding policy failure identified in the early literature on oil and gas booms in
developing countries was overly rapid and unsustainable fiscal expansion [Gelb, 1988]. On
this substantive question of whether deliberation moderates public pressure toward policy
choices that may contribute to profligate spending and a broader ‘resource curse’, our results
are mixed. We find that public opinion strongly supports spending rather than saving
2
Tanzania’s resource windfall, and a preferrence for recurrent expenditures in health and
education rather than physical infrastructure. These preferences appear not to stem from
a lack of information or failure to consider the implications of policy choices. Information
treatments and two days of intensive deliberation either leave these preferences unchanged
or reinforce them.
While even informed and considered public opinion in Tanzania supports spending rather
than saving resource revenues, voters are conservative or economically orthodox about most
other aspects of resource governance, and this orthodox stance is reinforced through deliber-
ation. Voters support the extraction and export of natural gas. They oppose fuel subsidies,
more so than a benchmark group of Tanzanian policy elites whom we polled separately. They
also support independent oversight of gas revenues and publishing gas contracts, measures
that were resisted by the government at the time of this study. Information and deliberation
reinforce all of these prudential tendencies.
Notably, deliberation turns citizens significantly against one specific measure proposed as
a remedy to the governance challenges stemming from resource rents: cash transfers. Sala-
i-Martin and Subramanian [2013] and Moss et al. [2015] suggest direct cash distribution of
resource revenues to households, similar to Alaska’s system of oil dividends, as a means to
break the state’s reliance on rents and heighten public awareness of the opportunity costs of
profligate spending decisions. At baseline, poll respondents in Tanzania express mixed views
on such proposals, but support declines dramatically in follow-up polling for respondents
assigned to the deliberation treatment – bringing citizens more closely into alignment with
Tanzanian elites’ opposition to cash transfers.1
Should the results of citizen deliberation – particularly with a less educated population
in a developing country – be taken seriously? We test experimentally a number of long-
standing concerns in the literature on democratic deliberation. First, Sanders [1997] raises
the possibility that men, the rich, and more educated participants will impose their views
through deliberation, a risk emphasized by more recent critiques such as Lupia and Norton
[2017], who caution that “inequality is always in the room.” A second and related concern
is that leaders (or “facilitators” in our terminology) will inevitably drive deliberation toward
1We focus here on the deliberation as a means to shape and elicit informed public opinion in a nationallyrepresentative sample. An additional role of deliberation in the context of new-found resource wealth, notaddressed here, may be to reduce local conflict over resource rents. In a parallel study in neighboringMozambique, which discovered natural gas around the same time as Tanzania, Armand et al. [forthcoming]find that local deliberative events led to a significant reduction in violent attacks by extremist groups.
3
their own preferences, as documented by Humphreys et al. [2006]. We find that these risks,
while certainly real as shown in other contexts and deliberative formats, can be overcome.
Exploiting our experimental design, we show that randomly assigned) groups with randomly
assigned facilitators do not gravitate toward the views of the initial majority, nor toward the
views held by male participants, identifiable social classes, or the group facilitator.
On the procedural question of how to enact deliberative democracy, we test a specific
model known as “Deliberative Polling” previously applied on numerous topics across dozens
of contexts, built on the presentation of balanced information briefs, question-and-answer
sessions with panels of topic experts, and moderated, small-group discussions without any
attempt to reach consensus or a collective verdict. The project is the first national “De-
liberative Polling” effort in Africa, and the first national experiment testing the effect of
deliberation (discussion plus information) on opinion change, as opposed to just informa-
tion. Further, it is in the context of an African country where much of the literature has
been skeptical about whether or not deliberation could be applied at all. We find this process
yields significant shifts in public opinion across diverse levels of wealth and general knowl-
edge. As noted, we demonstrate that these effects are driven by deliberation per se, and not
by the information treatments in isolation.
The following section motivates our key hypotheses in more detail, first about the design
and feasibility of deliberation in this context (Section 2.1) and second about its effect on the
substance of public opinion related to Tanzania’s resource windfall (Section 2.2). Section
3 explains the experimental design and data collection. Again, the results are divided into
two parts: Section 4 presents the main effects on public opinion, while Section 5 evaluates
the deliberative process itself by testing for heterogeneous effects, facilitator effects, and a
small follow-up experiment on the impact of disseminating the poll results on elite policy
preferences.
2 Conceptual framework and hypotheses
2.1 Implementing deliberative democracy in a low-income setting
Over the last two decades there has been an increasing movement toward participatory
consultation in development policy making. As noted in the World Bank’s Comprehensive
4
Development Framework, “Development goals and strategies should be ‘owned’ by the coun-
try, based on citizen participation in shaping them” [World Bank and IBRD, 2003]. Many
have supported this general idea. Joseph Stiglitz for example, views “development as a par-
ticipatory process” and argues that “participatory processes must entail open dialogue and
broadly active civic engagement, and it requires that individuals have a voice in the decisions
that affect them” [Stiglitz, 2002]. Amartya Sen similarly emphasizes the importance of dis-
cussion for the meaningful formation of preferences in his case for participation: “We cannot,
in general, take preferences as given independently of public discussion, that is, irrespective
of whether open debates and interchanges are permitted or not” [Sen, 2000].
These considerations point in the direction of some form of consultation that combines
participation with deliberation by the public as an input to policy making. But how is this
to be done in the context of developing countries? One influential model that attempts to
achieve this combination is “participatory budgeting” which has spread to many countries
including some in Sub-Saharan Africa [Shah, 2007]. But as first developed in Porto Ale-
gre, Brazil, the self-selected design engages unrepresentative samples of the public who are
mobilized to bring home specific and often pre-determined benefits for their neighborhoods
[World Bank and IBRD, 2003]. Is it possible to apply a model in developing countries that
is both more representative and deliberative?
A great deal of recent work has employed the general idea of a deliberating “mini-public”
chosen by random sampling [Gronlund et al., 2014]. Random sampling is meant to make
the deliberators representative of the relevant population. The deliberations then take place
according to a design that facilitates thoughtful and informed discussion. These models for
mini-publics vary in the size of the samples and in what kind of data is collected. Some are
closer to juries (citizens’ juries), some seek consensus (consensus conferences). “Deliberative
Polling” is a design for a mini-public that employs confidential questionnaires before and after
deliberations in moderated small group discussions and plenary sessions in which the groups
pose questions to competing experts. Unlike the citizens juries and consensus conferences
the samples are large enough for statistically meaningful evaluation of the attitudinal and
demographic representativeness of the deliberators as well as the opinion changes that might
come with deliberation.2 Because the opinions are solicited only in response to confidential
questionnaire, the social pressure of a shared verdict, as in a jury, is avoided. Because the
2Deliberative Polling R© is a registered trademark of James S. Fishkin. The trademark is used to supportresearch at the Stanford Center for Deliberative Democracy.
5
small groups are typically recorded there is also the possibility of qualitative data in the
evaluation.
Can this kind of design be applied in low-income countries in Sub-Saharan Africa, and
particularly to an extremely complex policy issue such as natural gas revenue management?
First, a challenge facing the application of deliberative democracy to developing coun-
tries is the low literacy and educational levels, especially in many low-income countries
in Sub-Saharan Africa. Privately, Tanzanian policymakers expressed skepticism that rural
subsistence farmers could deliberate in a meaningful way about complex natural gas policy
questions. Our results provide evidence that they could: after watching informational videos
about the natural gas discovery and other countries’ experience with extractive industries,
respondents’ scores on a knowledge test about natural gas policy improved significantly;
participation in deliberation significantly altered respondents’ preferences over gas policy in
a number of dimensions; treatment effects were uniform across knowledge and wealth levels;
and these effects were often in a direction we characterize as prudential or conservative.
Our study is closely related to the literature on clientelism, and specifically to experimen-
tal work on the question of whether polities in low-income democracies such as Tanzania will
inevitably tend toward rapid, zero-sum distribution of public rents. In a seminal experiment
on this topic, Wantchekon [April 2003] shows that candidates espousing clientelist policies
in Benin reap electoral advantages. Building on this work, Fujiwara and Wantchekon [2013]
show that town hall meetings with voters in Benin can significantly dull the impact of clien-
telism, maintaining voter turnout while reducing vote shares for candidates campaigning
within their regional stronghold. Homing in on the role of deliberation per se, Wantchekon
et al. [2018] randomizes congressional candidates in the Philippines to a ‘one-way’ campaign
style involving distribution of information and campaign promises, versus a ‘two-way’ inter-
active town hall with the candidate and voters, holding policy platforms constant. The more
deliberative approach generates a significant positive return in candidate vote shares, as well
as movement in voters’ support for policy platforms.3
3Another literature, very related in topic and geographic focus to our paper but with a different theoreticalinterest, explores the implications of resource discoveries for the state’s capacity to tax, and the potentialto break the link between taxation and political accountability. In recent work in Tanzania related to thesame natural gas discovery that we study, Cappelen et al. [February 2016] show that information treatmentsrelated to gas increase expectations of corruption but do not change attitudes about taxation. This is in linewith earlier survey experiments in Ghana and Uganda, e.g., de la Cuesta et al. [2019] who find no evidencethat citizens are more inclined to hold politicians accountable for management of tax revenue than resourcerevenue. Paler [2013] finds a similar lack of difference between tax and resource revenues in citizen concernconditional on reports of misuse of funds in Indonesia, but greater willingness to take preventative actionthrough monitoring to prevent misuse of tax revenues.
6
Second, the results of democratic deliberation may be conflated with the simple effect of
exposure to more information. Given the high cost of conducting large public gatherings with
a nationwide sample, is it really necessary to meet together and discuss the issues, rather than
passively absorb information? Might simple exposure to an information briefing be enough
for citizens to come to considered judgments? We present results from two experimental
treatments: information only, and information plus deliberation. The former group was
invited to the same pre-deliberation meeting as the latter, where the documentary video
about natural gas was screened. Impacts on gas knowledge are statistically indistinguishable
between the two treatment arms, while opinion changes are significantly greater for the
deliberation treatment group (and indistinguishable from zero across all dimensions for the
information-only group).4
Within the large literature testing information treatments on voters, a subset of papers
has explored these issues in the context of low-income democracies characterized by clien-
telism and ethnic voting blocks. For instance, Casey et al. [2020] find that information
treatments around policy platforms in Sierra Leone can significantly reduce ethnic voting.
Third, previous research has cast doubt on the true participatory nature of group delib-
erations, suggesting results may be driven by group facilitators or privileged social groups.
Perhaps the closest previous study to ours, Humphreys et al. [2006], found that deliberation
over the use of oil revenue in Sao Tome and Prıncipe were primarily driven by group lead-
ers. We attempted to both minimize and test for these effects. To minimize them, group
facilitators were instructed to play a mostly passive role, encouraging participants to speak
up without expressing their own opinion whatsoever; and groups were not instructed to
vote or reach any type of consensus. To test for the effect of facilitators and other privileged
groups, we randomly assigned participants to small groups for deliberation, including random
matching with facilitators. We show no association between facilitators’ initial policy views
and movements in participants’ opinions. Ex post, we also asked facilitators to subjectively
characterize the sentiment of the group, and – by comparing these reports to participants’
post-treatment poll responses – found no tendency for them to distort respondents’ actual
views in the direction of their own preferences.
A fourth, related concern is that deliberation may simply reinforce majority opinion, lead-
ing to group polarization, as groups on either side of an issue move further apart. Sunstein
4This result confirms earlier findings from [Farrar et al., 2010] who disaggregate information and delib-eration effects, albeit in a rich-country context where voters access to, and ability to independently processinformation may differ greatly from ours.
7
[June 2002] predicts that deliberation will “move groups, and the individuals who compose
them, toward a more extreme point in the direction indicated by their own pre deliberation
judgments.” Because the deliberation groups were relatively small (fifteen people), random
assignment to groups resulted in some variance in majority opinion across groups at baseline.
We find no evidence, however, that majority opinion affected individual’s opinion changes
through the process of deliberation.
2.2 Public opinion about natural resource management
In preparation for this study, we collaborated with a Tanzanian think tank, REPOA, to
convene a high-level group of experts and political leaders in Dar es Salaam for several
rounds of discussion to build a list of six broad policy questions related to natural gas
management, based loosely on the “natural resource charter” Collier and Venables [2011]
ratified by Tanzania. Those six topics became the foundation for our public opinion polling.
For each topic we developed a public opinion index, combining several polling questions,
which constitute the main outcome variables in the experimental analysis. For example, the
question or topic area that we label “sell” (i.e., sell gas abroad, rather than subsidize cheap
energy at home), is an index reflecting responses to five survey questions. The following
sections describe these six topics areas, and we provide the survey questions which comprise
each of the corresponding indices in the appendix.
2.2.1 Support for extracting and exporting natural gas
Our first policy index measures public support for extracting gas, processing it into LNG, and
exporting it, and opposition to fuel subsidies or a focus on prioritizing domestic consumption
of gas. Expert judgment by professional economists is that Tanzania would benefit econom-
ically from gas exports.5 However, Tanzanian politicians have emphasized the importance
of exploiting the gas discovery to provide cheap fuel to Tanzanians, or to supply domestic
electricity generation and stimulate power supply. Fuel and energy subsidies take up a siz-
able share of public expenditures in many developing countries, particularly in resource-rich
economies [Ebeke and Ngouana, May 2015].
5This statement is based on private meetings with economists in Dar es Salaam from the IMF, WorldBank, Bank of Tanzania, local universities, and think tanks.
8
2.2.2 Support for saving rather than spending gas revenue
The standard “IMF view” of managing natural resource revenues is to follow some form of
rule inspired by the Permanent Income Hypothesis (PIH). All resources are saved (i.e., held
in assets that pay a financial return) and spending is set at a level that is sustainable over
an infinite time horizon [Baunsgaard, April 11, 2014].
More recently, the consensus around the PIH rule has softened. Many analysts, including
some within the IMF, advocate “front loading” spending given low initial consumption levels
and the potential for fast consumption growth in a resource-rich developing economy [Collier
et al., 2009]. Others have pushed to broaden the definition of savings to include onshore
assets, and in some cases illiquid assets that do not pay a financial return [Gelb et al., 2014].
Circa 2015, the government of Tanzania planned to create a sovereign wealth fund, but the
structure of this fund had yet to be determined, and such questions as whether such a fund
would be “offshore” and legislatively ring-fenced, or not, had not been widely discussed.
Case studies from other countries that illustrate previous experiences with varied fund
structures were used as background information for participants in the treatment group to
inform their deliberation on questions of saving versus spending.
2.2.3 Support for direct distribution of rents versus government spending
Experience from other countries has shown that discovery of natural resource wealth con-
tributes to a number of bad governance syndromes (see Ross [2015] for a useful review),
including increased corruption (e.g. Vicente [2010] for Sao Tome, and Caselli and Michaels
[2013] for Brazil), increased risk of civil war (e.g. Besley and Persson [2011], Dube and
Vargas [2013]), and reduced democratic accountability and tax compliance (e.g. McGuirk
[2013] for several African countries, and Paler [2013] for Indonesia). Many of these studies
link governance failures to the existence of sovereign rents, which decouple control of the
budget from the need to tax citizens.
One proposal to overcome these governance pitfalls – a variant of which was supported
by both of Tanzania’s major opposition parties at the time – is direct cash distribution of gas
revenues to citizens. Precedents for cash distribution include the growing wave of conditional
and unconditional cash transfer programs for social protection across the developing world,
including the TASAF program in Tanzania [Evans et al., 2014], as well as limited experiments
9
with distribution of resource rents, as in the case of the U.S. state of Alaska [Moss, 2012].
Initial polling data from an independent source suggested a sizable minority of Tanzanians
support some form of direct distribution, though a plurality support government management
of the funds in some form [Morisset et al., 2014].
2.2.4 Preference for government spending on social services versus infrastruc-
ture, transport, and industry
As noted above, the question of saving versus immediate spending of gas revenues spills
over into a debate about the distinction between saving and investment, and the boundaries
of investment. Few economists advocate rapid expenditure of revenues from oil and gas
discoveries on “consumption”, but many debate which expenditures constitute consumption
versus long-term investments. An orthodox view has traditionally been that saving should
be liquid, generate a financial return, and, in the case of resource-rich economies, be located
offshore to combat Dutch disease. Once this constraint is relaxed – as advocated by [Collier
et al., 2009], and embraced by some sovereign wealth funds which now invest onshore, and
by some Tanzanian policymakers in private conversations – debate turns to whether roads
and infrastructure hold a special place in the category of investment, or whether recurrent
expenditures on health and education might reasonably constitute a long-term investment
in human capital.6
The point here is simple: elite discussion of policy rules to avoid Dutch disease often goes
beyond technical macroeconomic management and encroaches on broader policy priorities
among health, education, infrastructure, and other uses of public expenditure. This makes
it hard to justify exclusion of public participation from these debates.
2.2.5 Support for transparency and oversight of gas revenues
Transparency creates greater opportunity for the citizenry to hold elected officials account-
able to a standard of responsible management of natural gas revenues. The government can
increase its transparency regarding the natural gas sub-sector by publicly releasing contract
agreements between natural gas companies and the government as well as permits, concession
agreements, signing bonus agreements, and tax auditing reports.
6The textbook case is that these latter expenditures are more likely to be inflationary, since they ncreasespending on local inputs including personnel, and thus can cause Dutch disease.
10
There are a number of key issues to discuss. Should the government publicly release
all contractual agreements, even if these may contain sensitive information? Is the media
free and open to report balanced information to Tanzanian citizens? What is the best
medium to share transparent information about construction, development, and revenue
management associated with the natural gas sub-sector? Should this information be released
on a government website, announced by village leaders, released on state television or state
newspapers, or all of the above?
2.2.6 Knowledge of the natural gas discovery
Finally, deliberative democracy is premised on the participation of informed citizen deliber-
ators. A core concern in the background of our experiment that ordinary voters have little
or no information about the natural gas sector, potential revenue flows, and policy options
to manage these revenues. We measure this knowledge before and after treatment in a short
quiz about Tanzania’s gas discovery (including when and where it occurred, and the rough
magnitude of projected revenues).
Each of the above six outcomes is measured by the mean of the standardized responses
to several survey questions. The components of each index are listed in Table 9 in the
appendix. Full question wording and variable names from the micro data are available in
the pre-analysis plan uploaded to the American Economic Association’s RCT registry prior
to the deliberative event and follow-up data collection.
We also test heterogeneous effects on each of these outcomes along four dimensions:
general knowledge about politics, current events, and geography.; per capita household con-
sumption (‘wealth’); trust in government; and gender. The components of the first three
measures of heterogeneity are also described in the appendix, Table 10. For general knowl-
edge, the index is a weighted average of correct answers on a short quiz. For ‘wealth’, we
use a predicted consumption measure, based on the coefficients on a regression of household
consumption on survey items in Tanzania’s National Panel Survey that overlap with our
questionnaire, including household amenities and, notably, schooling (these items were in-
cluded in the questionnaire verbatim from the government’s national survey for this purpose).
See Appendix III: Measuring household socio-economic status for detailed methodology of
the household per capita consumption measure. For trust in government, we use a simple
mean effects index of the relevant items in the questionnaire, as listed in our pre-analysis
plan.
11
3 Experimental design and data
3.1 Interventions
The experiment includes two interventions: an information treatment administered to a
random subset of individuals in a random subset of clusters immediately after baseline sur-
veying, and a deliberation treatment to which a sub-set of the information treatment group
were invited.
In the information treatment, poll respondents received detailed information about the
natural gas discovery, and the pros and cons of various gas policy options. The information
was provided in the form of a roughly thirty-minute video, screened in the field by survey
teams after the baseline poll (i.e., in group viewings in 200 separate survey clusters). The
video aims to provide a balanced view of controversial alternatives, and is based on a script
written with input and approval from a panel of researchers, Tanzanian industry representa-
tives, civil society leaders, and politicians spanning all three major political parties as well
as relevant government agencies.
The deliberation treatment is considerably more intensive. A randomly drawn subset of
individuals who received the information treatment were invited to a national deliberative
event. The event was held over two days in April 2015, in Dar es Salaam, with travel and
accommodation provided by the project. At the event, poll respondents participated in an
alternating sequence of small group deliberations on specific gas policy issues, followed by
question and answer sessions with experts.
3.2 Sampling and random assignment
A nationally representative baseline poll asked a target sample of 2,000 adult Tanzanians in
200 rural and urban clusters spread across twenty districts about their knowledge and policy
preferences regarding Tanzania’s recent natural gas discovery and the use of any future
revenues.
Sampling was done in multiple stages. Twenty districts were randomly selected using
probability proportional to size (PPS) sampling based on district population from the 2012
Tanzania Population and Housing Census (see Figure 1). Within each district, ten clusters
were selected, also by PPS sampling. In rural areas, clusters are defined as a sub-village
12
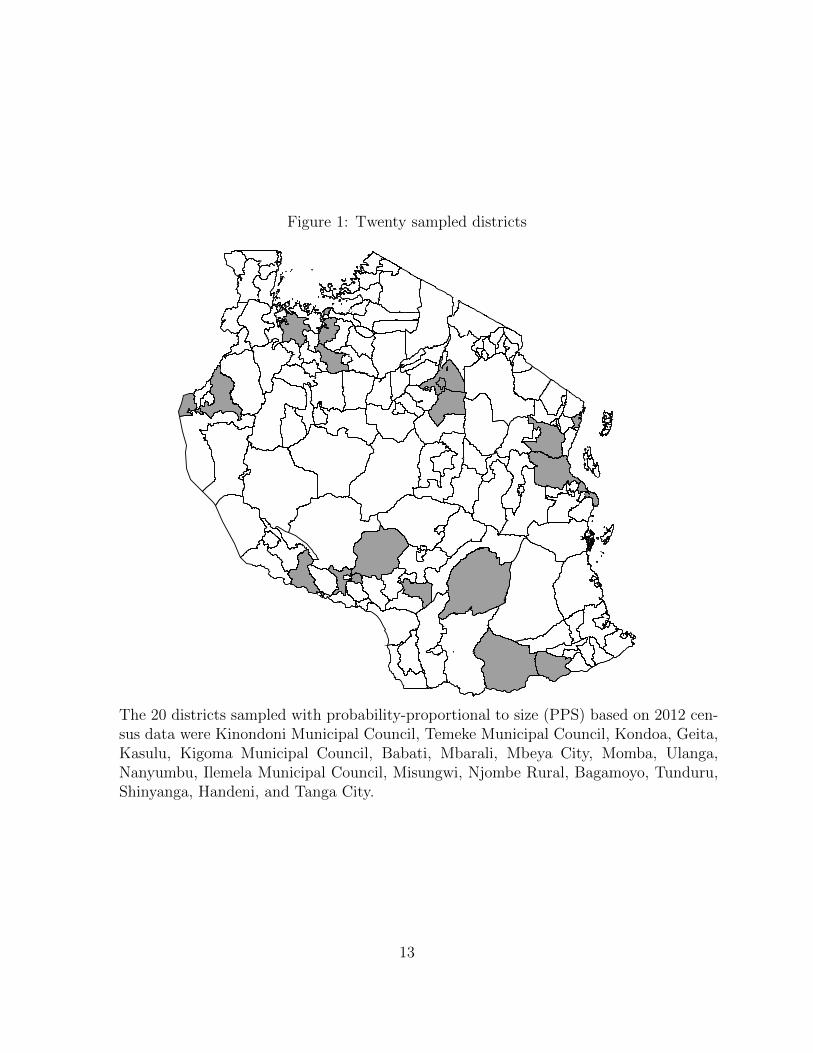
Figure 1: Twenty sampled districts
The 20 districts sampled with probability-proportional to size (PPS) based on 2012 cen-sus data were Kinondoni Municipal Council, Temeke Municipal Council, Kondoa, Geita,Kasulu, Kigoma Municipal Council, Babati, Mbarali, Mbeya City, Momba, Ulanga,Nanyumbu, Ilemela Municipal Council, Misungwi, Njombe Rural, Bagamoyo, Tunduru,Shinyanga, Handeni, and Tanga City.
13
or hamlet (kitongoji). In urban areas, clusters are defined as a block or sub-ward (mtaa).
Within each cluster, ten households were selected using a random walk method. Within
households, one adult respondent was chosen from the household roster; this respondent was
randomly selected electronically within the survey software on mobile computers in the field.
All respondents received a free mobile phone to enable follow-up polling by phone.
In each of 100 randomly selected survey clusters, 7 of 10 respondents were invited to view
a documentary video presenting pros and cons of various gas policy options (the information
treatment). Of the 702 respondents who were invited to the information treatment, all
complied. Of these, 401 individuals were invited to a democratic deliberation about the use
of the natural gas. The experimental design is summarized in Figure 2.
Of the 401 individuals invited to the deliberation, 370 complied and traveled to the event
in Dar es Salaam. The 370 participants were divided into 25 randomly assigned small groups
to discuss a sequence of gas policy options. The discussions were broken into four rounds, and
groups were randomly reassigned after the second of four rounds. The random assignment
of facilitators to deliberative groups is implicit in this design.
Follow-up polling measured the medium term (i.e., weeks rather than hours after treat-
ment) impact of information and deliberation on respondents’ knowledge and policy prefer-
ences. Follow-up polling was conducted by phone and broken into multiple interviews with
each respondent, due to limitations on respondents’ attention span on the phone. Overall,
93% of baseline respondents were re-interviewed by phone after the deliberation. Section 4.2
examines this attrition in more detail.
3.3 Baseline correlations
Before turning to the experimental results, we examine correlations between citizens’ policy
preferences at baseline and four covariates: gender, general knowledge, wealth, and trust
in government. The results are presented in Table 1. Each column reports a separate
multivariate regression, where each of our six main outcome indices is separately regressed
on all four covariate indices.
Conditional on the other covariates, we find few differences in baseline responses by
gender, with the exception that men are more supportive of using gas revenues for social-
sector sector spending (relative to alternative uses, such as infrastructure).
14
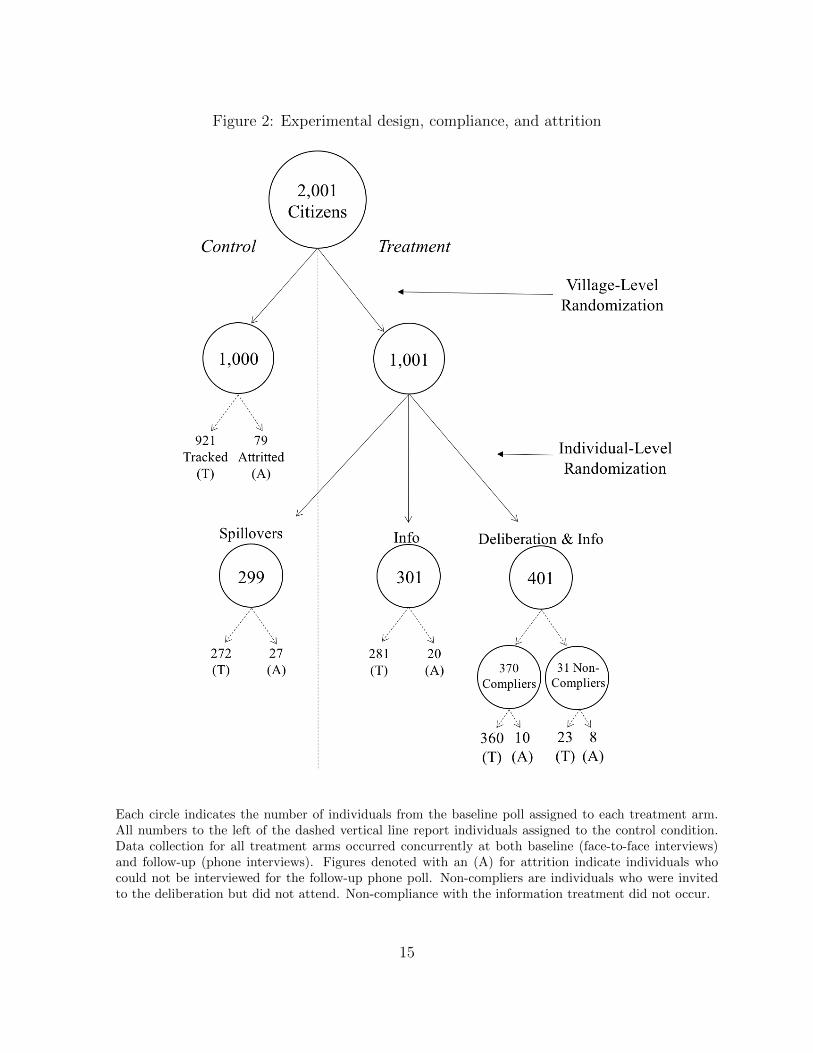
Figure 2: Experimental design, compliance, and attrition
Each circle indicates the number of individuals from the baseline poll assigned to each treatment arm.All numbers to the left of the dashed vertical line report individuals assigned to the control condition.Data collection for all treatment arms occurred concurrently at both baseline (face-to-face interviews)and follow-up (phone interviews). Figures denoted with an (A) for attrition indicate individuals whocould not be interviewed for the follow-up phone poll. Non-compliers are individuals who were invitedto the deliberation but did not attend. Non-compliance with the information treatment did not occur.
15
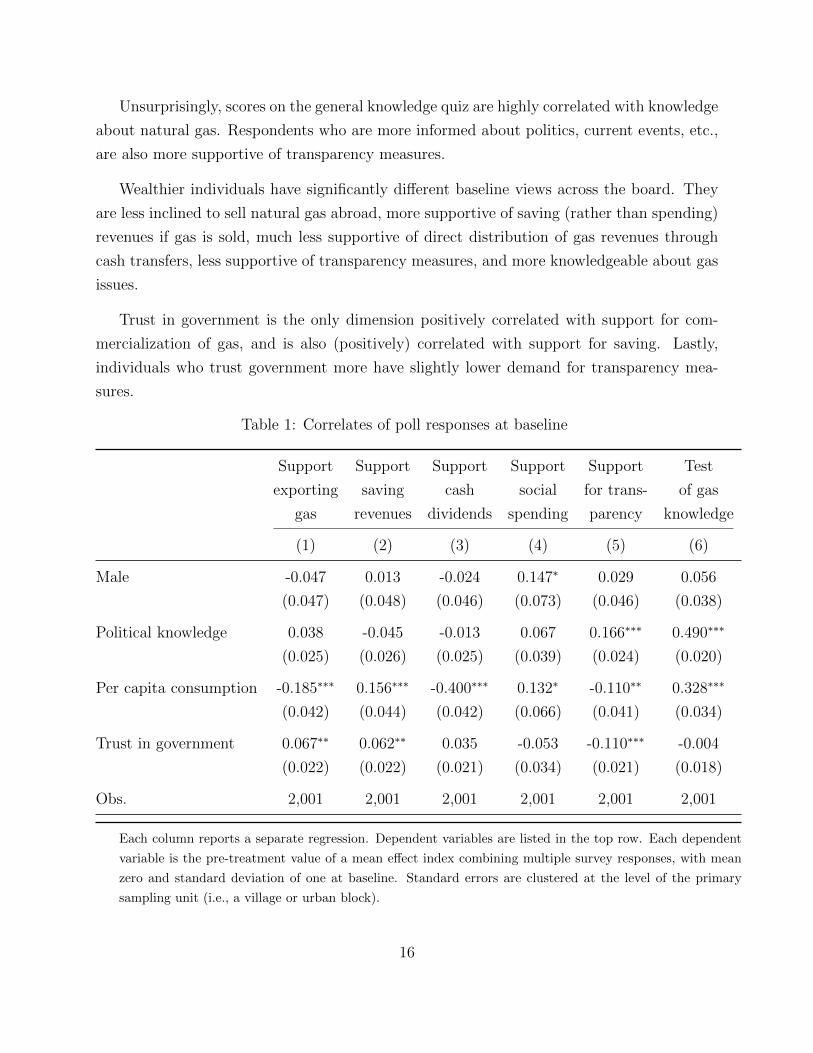
Unsurprisingly, scores on the general knowledge quiz are highly correlated with knowledge
about natural gas. Respondents who are more informed about politics, current events, etc.,
are also more supportive of transparency measures.
Wealthier individuals have significantly different baseline views across the board. They
are less inclined to sell natural gas abroad, more supportive of saving (rather than spending)
revenues if gas is sold, much less supportive of direct distribution of gas revenues through
cash transfers, less supportive of transparency measures, and more knowledgeable about gas
issues.
Trust in government is the only dimension positively correlated with support for com-
mercialization of gas, and is also (positively) correlated with support for saving. Lastly,
individuals who trust government more have slightly lower demand for transparency mea-
sures.
Table 1: Correlates of poll responses at baseline
Support Support Support Support Support Test
exporting saving cash social for trans- of gas
gas revenues dividends spending parency knowledge
(1) (2) (3) (4) (5) (6)
Male -0.047 0.013 -0.024 0.147∗ 0.029 0.056
(0.047) (0.048) (0.046) (0.073) (0.046) (0.038)
Political knowledge 0.038 -0.045 -0.013 0.067 0.166∗∗∗ 0.490∗∗∗
(0.025) (0.026) (0.025) (0.039) (0.024) (0.020)
Per capita consumption -0.185∗∗∗ 0.156∗∗∗ -0.400∗∗∗ 0.132∗ -0.110∗∗ 0.328∗∗∗
(0.042) (0.044) (0.042) (0.066) (0.041) (0.034)
Trust in government 0.067∗∗ 0.062∗∗ 0.035 -0.053 -0.110∗∗∗ -0.004
(0.022) (0.022) (0.021) (0.034) (0.021) (0.018)
Obs. 2,001 2,001 2,001 2,001 2,001 2,001
Each column reports a separate regression. Dependent variables are listed in the top row. Each dependent
variable is the pre-treatment value of a mean effect index combining multiple survey responses, with mean
zero and standard deviation of one at baseline. Standard errors are clustered at the level of the primary
sampling unit (i.e., a village or urban block).
16
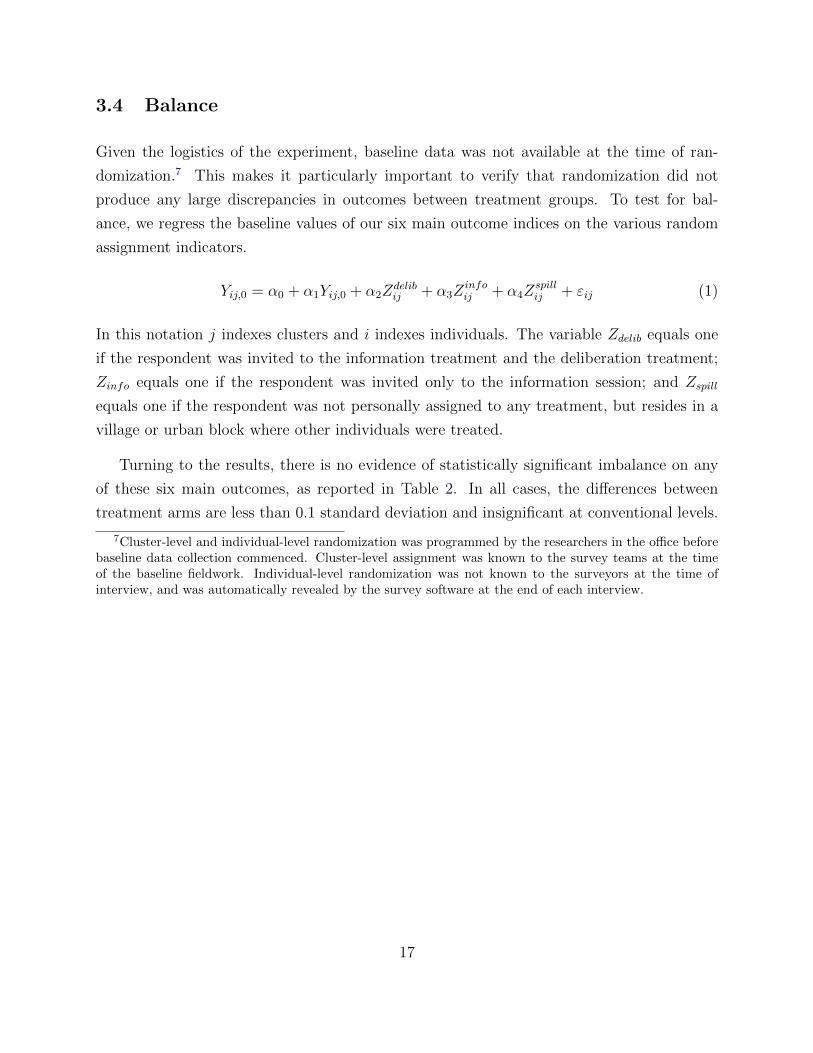
3.4 Balance
Given the logistics of the experiment, baseline data was not available at the time of ran-
domization.7 This makes it particularly important to verify that randomization did not
produce any large discrepancies in outcomes between treatment groups. To test for bal-
ance, we regress the baseline values of our six main outcome indices on the various random
assignment indicators.
Yij,0 = α0 + α1Yij,0 + α2Zdelibij + α3Z
infoij + α4Z
spillij + εij (1)
In this notation j indexes clusters and i indexes individuals. The variable Zdelib equals one
if the respondent was invited to the information treatment and the deliberation treatment;
Zinfo equals one if the respondent was invited only to the information session; and Zspill
equals one if the respondent was not personally assigned to any treatment, but resides in a
village or urban block where other individuals were treated.
Turning to the results, there is no evidence of statistically significant imbalance on any
of these six main outcomes, as reported in Table 2. In all cases, the differences between
treatment arms are less than 0.1 standard deviation and insignificant at conventional levels.
7Cluster-level and individual-level randomization was programmed by the researchers in the office beforebaseline data collection commenced. Cluster-level assignment was known to the survey teams at the timeof the baseline fieldwork. Individual-level randomization was not known to the surveyors at the time ofinterview, and was automatically revealed by the survey software at the end of each interview.
17
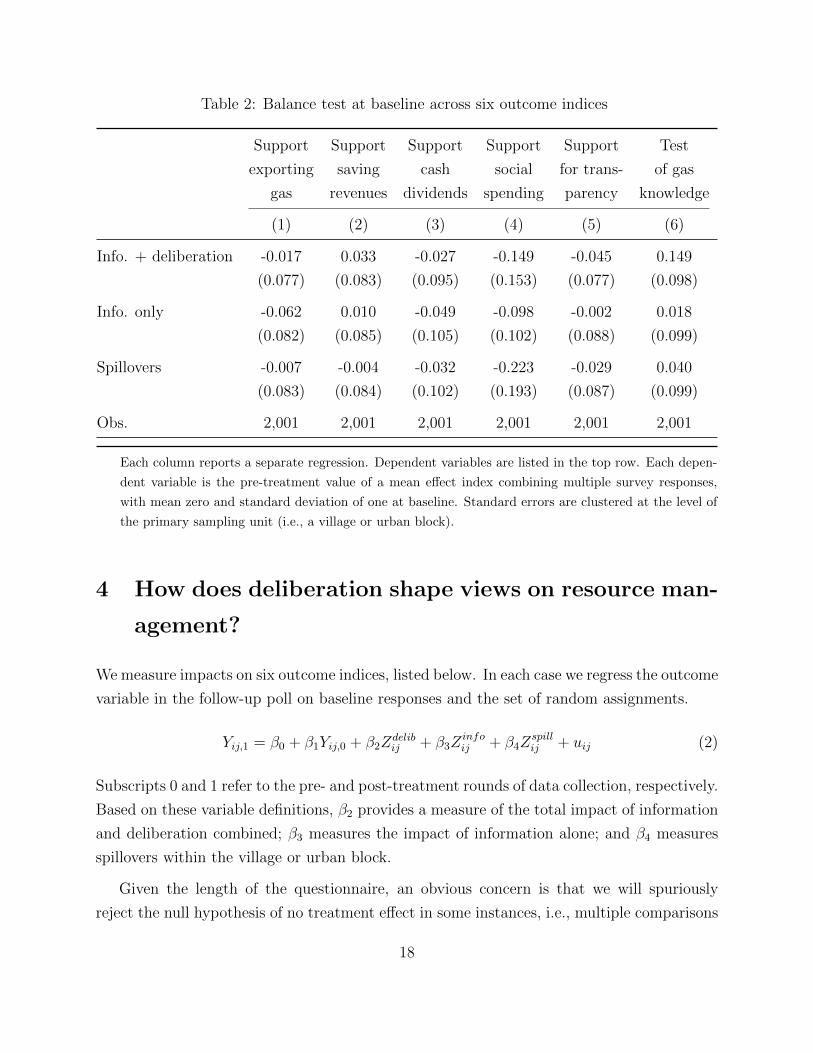
Table 2: Balance test at baseline across six outcome indices
Support Support Support Support Support Test
exporting saving cash social for trans- of gas
gas revenues dividends spending parency knowledge
(1) (2) (3) (4) (5) (6)
Info. + deliberation -0.017 0.033 -0.027 -0.149 -0.045 0.149
(0.077) (0.083) (0.095) (0.153) (0.077) (0.098)
Info. only -0.062 0.010 -0.049 -0.098 -0.002 0.018
(0.082) (0.085) (0.105) (0.102) (0.088) (0.099)
Spillovers -0.007 -0.004 -0.032 -0.223 -0.029 0.040
(0.083) (0.084) (0.102) (0.193) (0.087) (0.099)
Obs. 2,001 2,001 2,001 2,001 2,001 2,001
Each column reports a separate regression. Dependent variables are listed in the top row. Each depen-
dent variable is the pre-treatment value of a mean effect index combining multiple survey responses,
with mean zero and standard deviation of one at baseline. Standard errors are clustered at the level of
the primary sampling unit (i.e., a village or urban block).
4 How does deliberation shape views on resource man-
agement?
We measure impacts on six outcome indices, listed below. In each case we regress the outcome
variable in the follow-up poll on baseline responses and the set of random assignments.
Yij,1 = β0 + β1Yij,0 + β2Zdelibij + β3Z
infoij + β4Z
spillij + uij (2)
Subscripts 0 and 1 refer to the pre- and post-treatment rounds of data collection, respectively.
Based on these variable definitions, β2 provides a measure of the total impact of information
and deliberation combined; β3 measures the impact of information alone; and β4 measures
spillovers within the village or urban block.
Given the length of the questionnaire, an obvious concern is that we will spuriously
reject the null hypothesis of no treatment effect in some instances, i.e., multiple comparisons
18
will generate false discovery. We deal with this multiple comparisons problem two ways,
following standard practice in the social science experimental literature. First, we group
outcomes into indices based on a priori judgments to reduce the total number of statistical
tests. The definition of these six indices was pre-registered before the deliberation treatment
and follow-up data collection. We calculate the indices following Kling et al. [2007] by
(i) rescaling each indicator so that higher values indicate support for the hypothesis, (ii)
computing z-scores for each indicator, (iii) averaging the indicators within an index, and (iv)
creating z-scores for this composite index.
Second, because our analysis still involves at least six comparisons for each component
of the experiment, we control the false discovery rate (FDR) using the procedure suggested
by Anderson [2008] to calculate Benjamini et al. [2006] q-values, which we report in lieu of
naive p-values where relevant.
4.1 Main effects: information, deliberation, and policy prefer-
ences
The full deliberation treatment significantly alters public opinion about natural gas use on
three of five dimensions, as well as raising scores on the index of gas knowledge, as seen in
Table 3. On the first dimension, selling natural gas versus subsidizing power generation or
leaving it in the ground, the combination of deliberation and information increased support
for extracting and selling the gas by nearly 0.3 standard deviations. Looking at the sub-
components of the index in Table 9 in the appendix, this result is driven primarily by support
for selling gas abroad over using gas for energy generation, rather than explicit opposition
to fuel subsidies.
Deliberation did not affect support for saving gas revenues whatsoever. Citizens began
and remained strongly supportive of spending. Deliberation did reduce support, however,
for direct cash distribution of gas revenues by roughly 0.3 standard deviations. This effect
operated consistently across a range of question formats, though it is worth noting that
support began (and remained) highest for proposals that targeted transfers to the needy, or
were framed as individual savings accounts.
19
While deliberation reduced support for cash transfers, it increased support for spend-
ing on social services rather than infrastructure by about 0.3 standard deviations. It also
increased support for transparency and oversight by just 0.14 standard deviations. 8
Notably, information alone has no significant effect on public opinion about any dimension
of gas policy, as seen in in Table 3. Even on dimensions where the effect of deliberation is large
and significant, such as selling gas or distributing revenues as cash transfers, the treatment
effect of information alone is insignificant and point estimates are close to zero. The only
outcome where we see a significant effect of information is on knowledge of the natural gas
discovery, where information alone raised scores by 0.13 standard deviations and information
plus deliberation raised scores by over 0.3 standard deviations.
Finally, while our design allows us to measure spillovers from either treatment, in practice
we find no such effects. That is, we see no evidence that participants in the information or
deliberation treatments shared information or influenced their neighbors within the village.
8Examining the q-values at the bottom of Table 3, the correction for multiple comparisons does notsubstantively affect our conclusions: effects on selling gas, cash distribution, social services, and knowledgeremain significant at the 1% level, while effects on transparency remain significant at the 5% level.
20
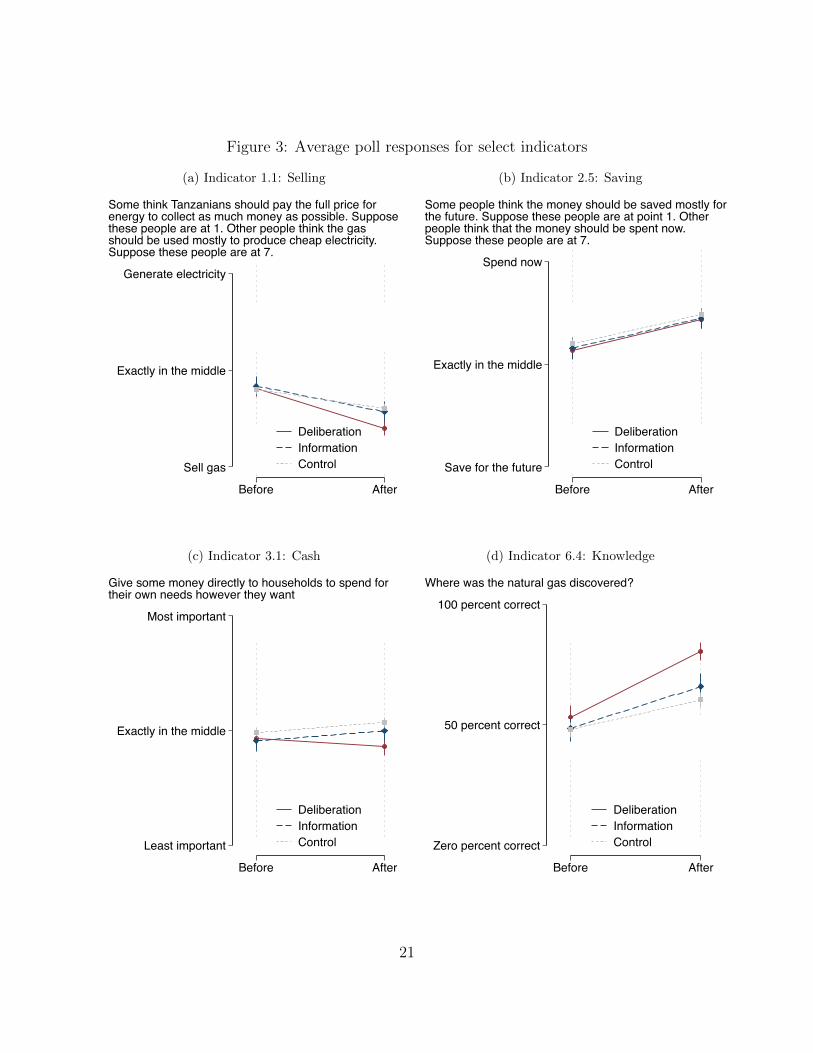
Figure 3: Average poll responses for select indicators
(a) Indicator 1.1: Selling
Sell gas
Exactly in the middle
Generate electricity
Before After
DeliberationInformationControl
Some think Tanzanians should pay the full price forenergy to collect as much money as possible. Supposethese people are at 1. Other people think the gasshould be used mostly to produce cheap electricity.Suppose these people are at 7.
(b) Indicator 2.5: Saving
Save for the future
Exactly in the middle
Spend now
Before After
DeliberationInformationControl
Some people think the money should be saved mostly forthe future. Suppose these people are at point 1. Otherpeople think that the money should be spent now.Suppose these people are at 7.
(c) Indicator 3.1: Cash
Least important
Exactly in the middle
Most important
Before After
DeliberationInformationControl
Give some money directly to households to spend fortheir own needs however they want
(d) Indicator 6.4: Knowledge
Zero percent correct
50 percent correct
100 percent correct
Before After
DeliberationInformationControl
Where was the natural gas discovered?
21
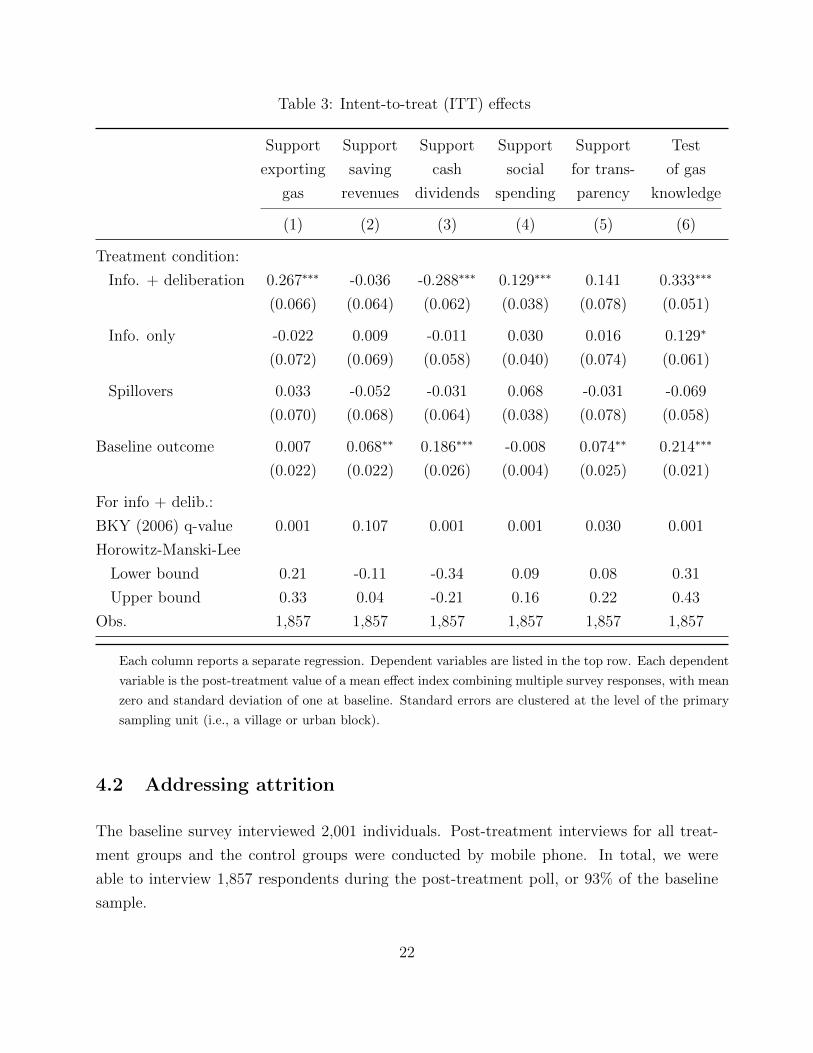
Table 3: Intent-to-treat (ITT) effects
Support Support Support Support Support Test
exporting saving cash social for trans- of gas
gas revenues dividends spending parency knowledge
(1) (2) (3) (4) (5) (6)
Treatment condition:
Info. + deliberation 0.267∗∗∗ -0.036 -0.288∗∗∗ 0.129∗∗∗ 0.141 0.333∗∗∗
(0.066) (0.064) (0.062) (0.038) (0.078) (0.051)
Info. only -0.022 0.009 -0.011 0.030 0.016 0.129∗
(0.072) (0.069) (0.058) (0.040) (0.074) (0.061)
Spillovers 0.033 -0.052 -0.031 0.068 -0.031 -0.069
(0.070) (0.068) (0.064) (0.038) (0.078) (0.058)
Baseline outcome 0.007 0.068∗∗ 0.186∗∗∗ -0.008 0.074∗∗ 0.214∗∗∗
(0.022) (0.022) (0.026) (0.004) (0.025) (0.021)
For info + delib.:
BKY (2006) q-value 0.001 0.107 0.001 0.001 0.030 0.001
Horowitz-Manski-Lee
Lower bound 0.21 -0.11 -0.34 0.09 0.08 0.31
Upper bound 0.33 0.04 -0.21 0.16 0.22 0.43
Obs. 1,857 1,857 1,857 1,857 1,857 1,857
Each column reports a separate regression. Dependent variables are listed in the top row. Each dependent
variable is the post-treatment value of a mean effect index combining multiple survey responses, with mean
zero and standard deviation of one at baseline. Standard errors are clustered at the level of the primary
sampling unit (i.e., a village or urban block).
4.2 Addressing attrition
The baseline survey interviewed 2,001 individuals. Post-treatment interviews for all treat-
ment groups and the control groups were conducted by mobile phone. In total, we were
able to interview 1,857 respondents during the post-treatment poll, or 93% of the baseline
sample.
22
The attrition of the remaining 7% of the sample introduces the possibility of bias in our
experimental estimates. To examine this possibility, we first measure the observable corre-
lates of attrition in our baseline data. Results in Table 6 show that we were no more likely to
interview respondents in treatment villages (i.e., the “spillover” group) or respondents who
received the information treatment. However, respondents who were invited to the deliber-
ation were nearly 3 percentage points more likely to be interviewed post-treatment relative
to control individuals.
Baseline covariates show some significant correlations with attrition. Individuals who
are more knowledgeable, wealthier, and less trusting of government are more likely to be
included in the post-treatment sample.
These results cannot be definitive as to whether attrition introduces bias in our treatment
effect estimates, as attriters may also differ on unobserved dimensions. To address this
possibility, we estimate non-parametric bounds a la Horowitz and Manski [2000] and Lee
[2009] on our main treatment effects. These bounds are reported at the bottom of Table
3. We focus on bounding the total effect of information and deliberation combined, as this
is the only treatment arm where we find large and robust treatment effects across multiple
outcome measures.
23
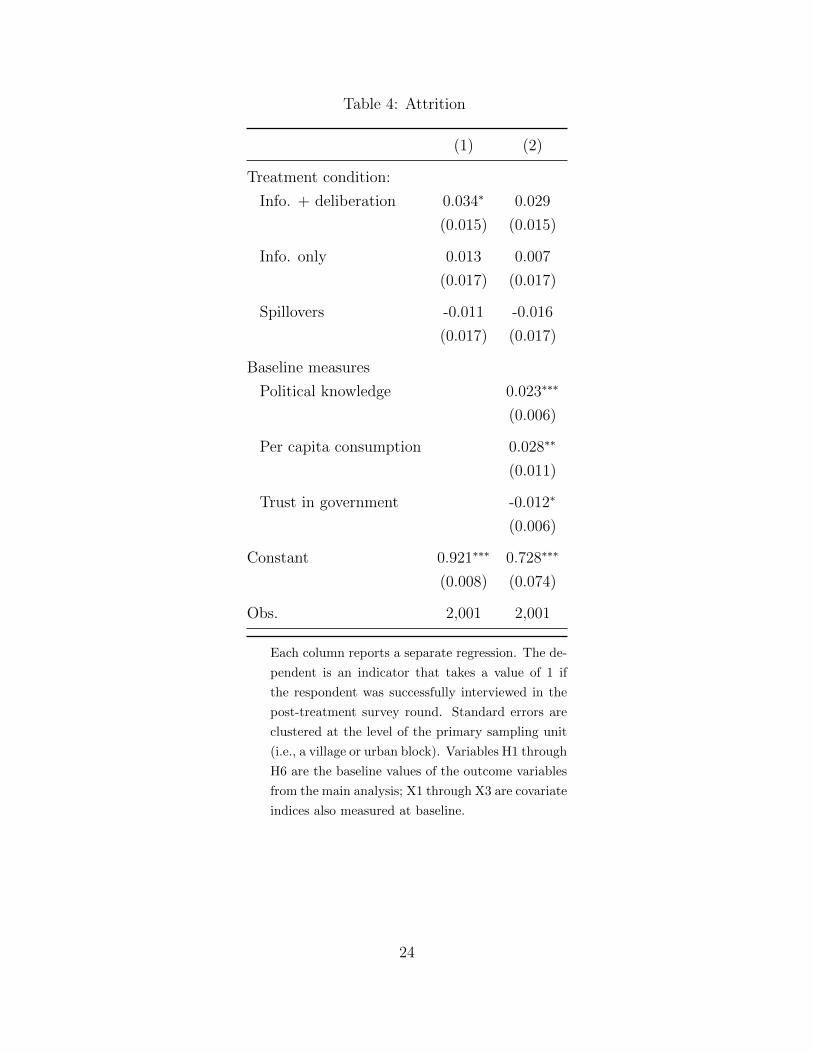
Table 4: Attrition
(1) (2)
Treatment condition:
Info. + deliberation 0.034∗ 0.029
(0.015) (0.015)
Info. only 0.013 0.007
(0.017) (0.017)
Spillovers -0.011 -0.016
(0.017) (0.017)
Baseline measures
Political knowledge 0.023∗∗∗
(0.006)
Per capita consumption 0.028∗∗
(0.011)
Trust in government -0.012∗
(0.006)
Constant 0.921∗∗∗ 0.728∗∗∗
(0.008) (0.074)
Obs. 2,001 2,001
Each column reports a separate regression. The de-
pendent is an indicator that takes a value of 1 if
the respondent was successfully interviewed in the
post-treatment survey round. Standard errors are
clustered at the level of the primary sampling unit
(i.e., a village or urban block). Variables H1 through
H6 are the baseline values of the outcome variables
from the main analysis; X1 through X3 are covariate
indices also measured at baseline.
24
5 Evaluating the deliberative process
Does the fact that deliberation changes people’s minds imply any normative assessment?
One approach to this question is to assess whether deliberation moves citizen views in the
direction of some pre-established set of “right” answers. In the previous section we noted
deliberation moves opinion in the direction of economic orthodoxy about natural resource
management in some, but not all cases. In Section 5.4 we test whether deliberation moves
citizens in the direction of elite opinion, which may or may not reflect economic orthodoxy
in Tanzania.
A second approach, which we explore in this section, is to examine the dynamics of the
deliberative process itself, in hopes of gaining insights about its procedural integrity. We
divide the issue of social group interactions in deliberation into two parts, looking at how
different social groups affect others and how they are affected by others. In more econometric
language, we use a heterogeneous treatment effects approach to examine whether deliberation
has differential effects on different groups. Separately, we also test a peer effects framework
where peers are divided into sub-groups to examine the question of whether deliberation
promotes the views of certain social groups. Finally, we examine the role of group facilitators
during deliberation in shaping participants’ views.
5.1 Do social groups respond differently to deliberation? Hetero-
geneous treatment effects
Skeptics of deliberative democracy in developing countries question the ability of illiterate
voters with limited information to grapple in meaningful ways with complex policy issues. If
this is true in general, we might expect it to be particularly true for the least informed voters,
or for the poorest voters in our sample. Concretely, we might expect smaller treatment effects
from deliberation on these groups.
In practice, we find little evidence of differences in treatment effects across groups, as
seen in the bottom rows of Table 5 which show the interaction terms between deliberation
and group dummies. There are a few exceptions though. While men and women show no
significant differences in opinion about saving gas revenues or support for transparency mea-
sures at baseline, deliberation moves men further in support of these measures. That effect
25
is canceled out by a countervailing movement for women on savings, but not on transparency
measures.
While deliberation reduces support for direct distribution of gas revenues overall, that
effect is attenuated for richer participants – who were already less supportive of this policy at
baseline.9 To take just one poll question as an illustration, average support for cash transfers
(see full phrasing for question 4.1 in the appendix) is shown at each point of the household
consumption distribution in Figure 4, for both deliberation participants and the pure control
group at endline. The control group shows the same baseline (negative) correlation between
wealth (proxied by our index of per capita consumption) and support for cash transfers, and
as noted, deliberation has a heterogeneous effect which attenuates this correlation. But the
strongest effect is the simple average treatment effect, reducing support for cash transfers.
We also investigate whether baseline trust in government is associated with differential
receptivity to the information and deliberation treatment. As shown in Table 1, trust in gov-
ernment is associated with stronger support for selling natural gas, saving revenues, as well
as opposition to transparency and governance measures. However, we find no relationship
between trust in government and treatment effects in Table 5.
9It is debatable whether a multiple comparisons correction should be used here, in which case the p-valueon this effect would fall outside normal significance levels.
26
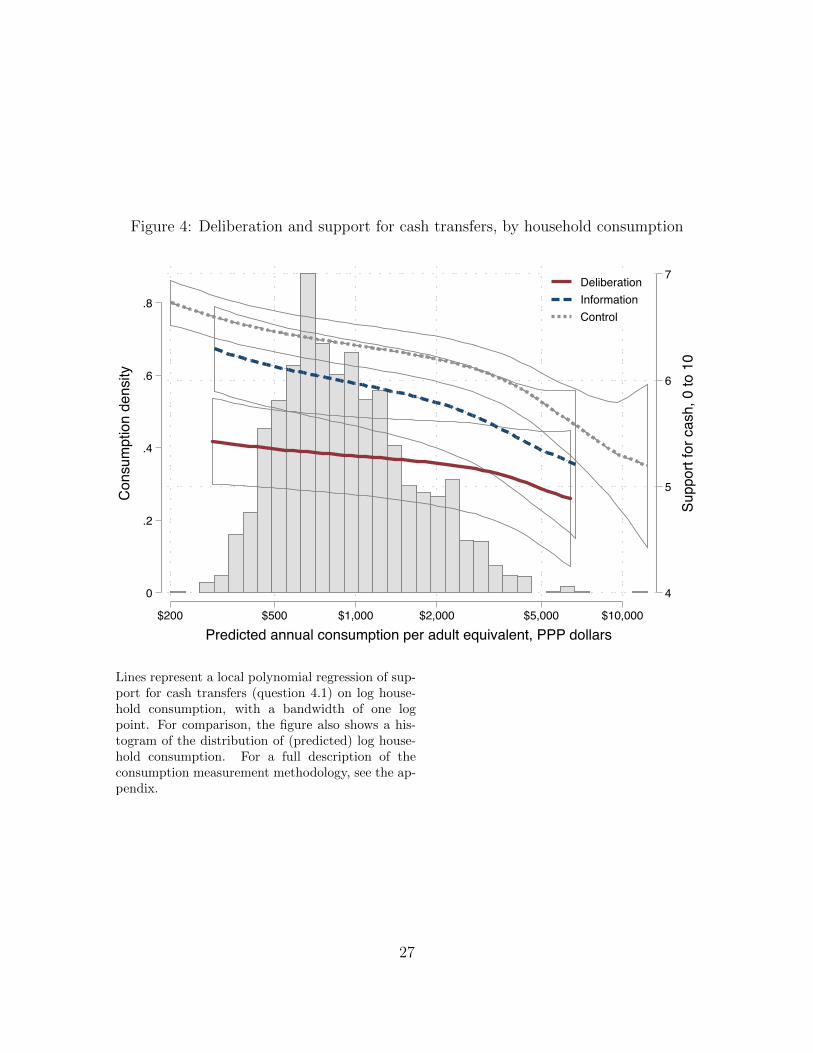
Figure 4: Deliberation and support for cash transfers, by household consumption
4
5
6
7
Supp
ort f
or c
ash,
0 to
10
0
.2
.4
.6
.8
Con
sum
ptio
n de
nsity
$200 $500 $1,000 $2,000 $5,000 $10,000Predicted annual consumption per adult equivalent, PPP dollars
DeliberationInformationControl
Lines represent a local polynomial regression of sup-port for cash transfers (question 4.1) on log house-hold consumption, with a bandwidth of one logpoint. For comparison, the figure also shows a his-togram of the distribution of (predicted) log house-hold consumption. For a full description of theconsumption measurement methodology, see the ap-pendix.
27
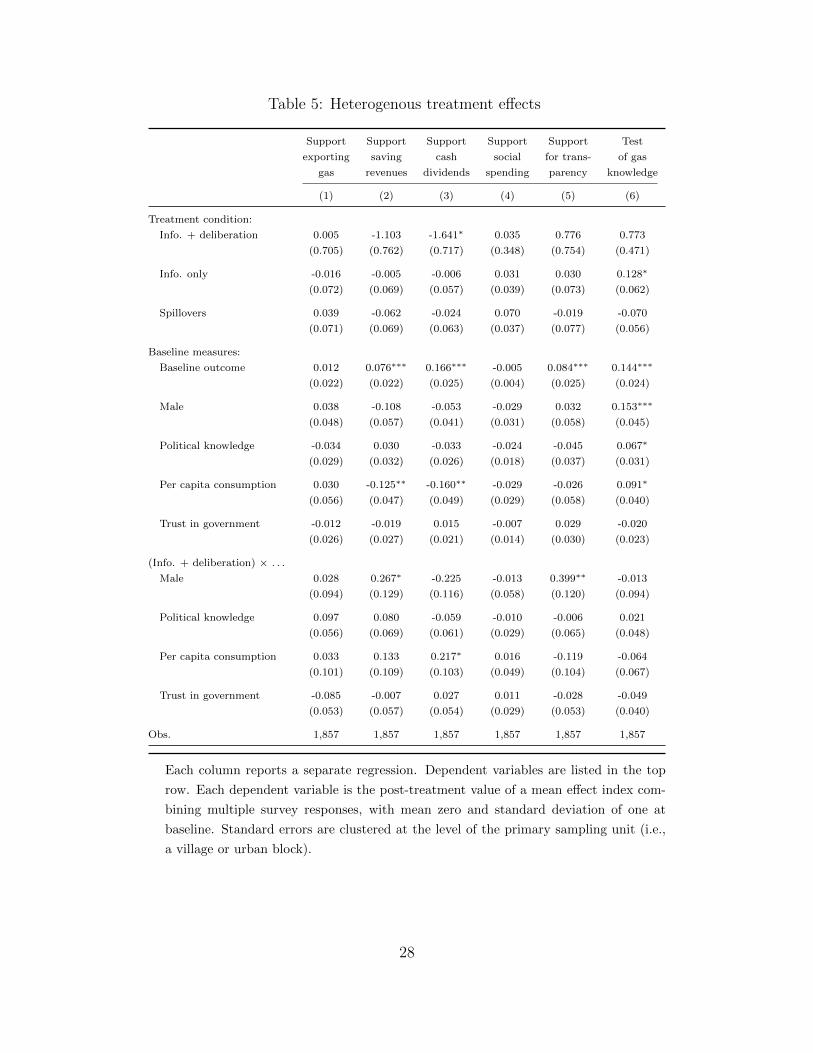
Table 5: Heterogenous treatment effects
Support Support Support Support Support Test
exporting saving cash social for trans- of gas
gas revenues dividends spending parency knowledge
(1) (2) (3) (4) (5) (6)
Treatment condition:
Info. + deliberation 0.005 -1.103 -1.641∗ 0.035 0.776 0.773
(0.705) (0.762) (0.717) (0.348) (0.754) (0.471)
Info. only -0.016 -0.005 -0.006 0.031 0.030 0.128∗
(0.072) (0.069) (0.057) (0.039) (0.073) (0.062)
Spillovers 0.039 -0.062 -0.024 0.070 -0.019 -0.070
(0.071) (0.069) (0.063) (0.037) (0.077) (0.056)
Baseline measures:
Baseline outcome 0.012 0.076∗∗∗ 0.166∗∗∗ -0.005 0.084∗∗∗ 0.144∗∗∗
(0.022) (0.022) (0.025) (0.004) (0.025) (0.024)
Male 0.038 -0.108 -0.053 -0.029 0.032 0.153∗∗∗
(0.048) (0.057) (0.041) (0.031) (0.058) (0.045)
Political knowledge -0.034 0.030 -0.033 -0.024 -0.045 0.067∗
(0.029) (0.032) (0.026) (0.018) (0.037) (0.031)
Per capita consumption 0.030 -0.125∗∗ -0.160∗∗ -0.029 -0.026 0.091∗
(0.056) (0.047) (0.049) (0.029) (0.058) (0.040)
Trust in government -0.012 -0.019 0.015 -0.007 0.029 -0.020
(0.026) (0.027) (0.021) (0.014) (0.030) (0.023)
(Info. + deliberation) × . . .
Male 0.028 0.267∗ -0.225 -0.013 0.399∗∗ -0.013
(0.094) (0.129) (0.116) (0.058) (0.120) (0.094)
Political knowledge 0.097 0.080 -0.059 -0.010 -0.006 0.021
(0.056) (0.069) (0.061) (0.029) (0.065) (0.048)
Per capita consumption 0.033 0.133 0.217∗ 0.016 -0.119 -0.064
(0.101) (0.109) (0.103) (0.049) (0.104) (0.067)
Trust in government -0.085 -0.007 0.027 0.011 -0.028 -0.049
(0.053) (0.057) (0.054) (0.029) (0.053) (0.040)
Obs. 1,857 1,857 1,857 1,857 1,857 1,857
Each column reports a separate regression. Dependent variables are listed in the top
row. Each dependent variable is the post-treatment value of a mean effect index com-
bining multiple survey responses, with mean zero and standard deviation of one at
baseline. Standard errors are clustered at the level of the primary sampling unit (i.e.,
a village or urban block).
28
5.2 Do social groups have disparate influence on deliberation?
Peer effects and marginalized groups
Does deliberation help people form reasoned opinions or reinforce group think and marginal-
ization? The hypothesis that information and deliberation shape citizens’ policy preferences
is somewhat distinct from saying that people conform to their peers’ views when exposed to
them through group discussion. Of particular concern is the possibility that certain social
groups dominate these interactions, making the results of deliberation unrepresentative of
popular opinion.
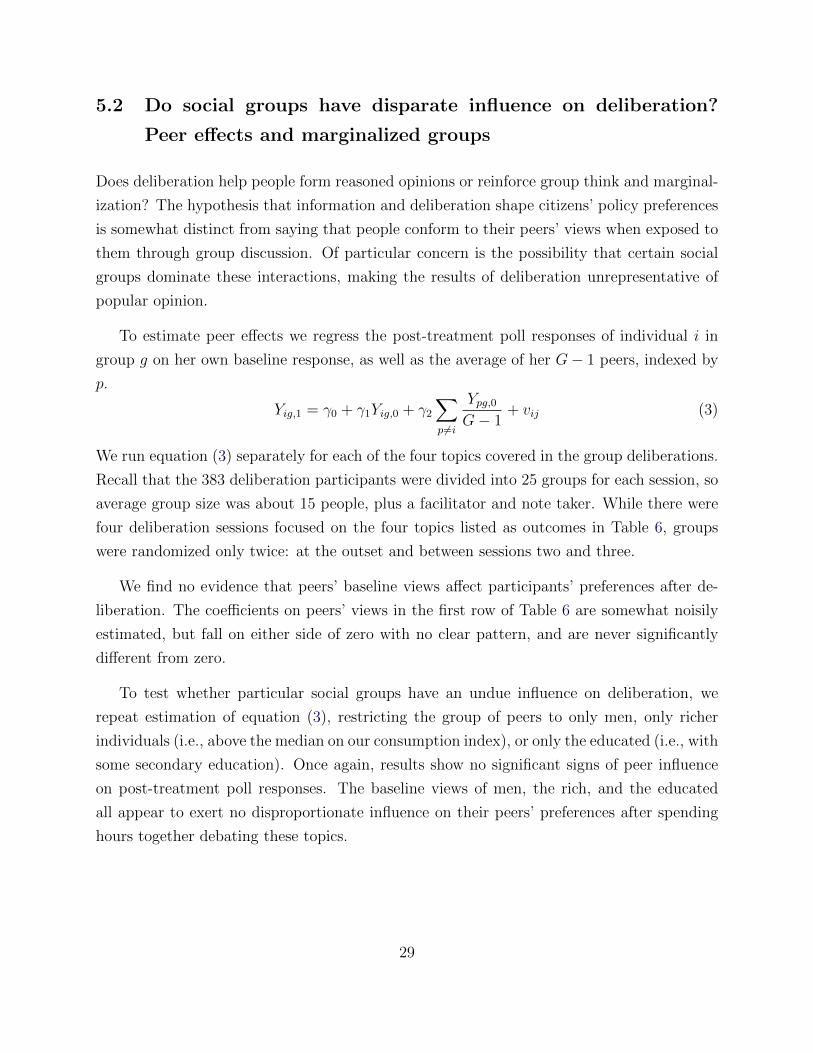
To estimate peer effects we regress the post-treatment poll responses of individual i in
group g on her own baseline response, as well as the average of her G− 1 peers, indexed by
p.
Yig,1 = γ0 + γ1Yig,0 + γ2
∑p6=i
Ypg,0G− 1
+ vij (3)
We run equation (3) separately for each of the four topics covered in the group deliberations.
Recall that the 383 deliberation participants were divided into 25 groups for each session, so
average group size was about 15 people, plus a facilitator and note taker. While there were
four deliberation sessions focused on the four topics listed as outcomes in Table 6, groups
were randomized only twice: at the outset and between sessions two and three.
We find no evidence that peers’ baseline views affect participants’ preferences after de-
liberation. The coefficients on peers’ views in the first row of Table 6 are somewhat noisily
estimated, but fall on either side of zero with no clear pattern, and are never significantly
different from zero.
To test whether particular social groups have an undue influence on deliberation, we
repeat estimation of equation (3), restricting the group of peers to only men, only richer
individuals (i.e., above the median on our consumption index), or only the educated (i.e., with
some secondary education). Once again, results show no significant signs of peer influence
on post-treatment poll responses. The baseline views of men, the rich, and the educated
all appear to exert no disproportionate influence on their peers’ preferences after spending
hours together debating these topics.
29
Table 6: Peer effects during deliberation
Support Support Support Supportexporting saving cash social
gas revenues dividends spending
AllLeave-out mean -0.096 -0.193 0.137 -0.021
(0.206) (0.210) (0.221) (0.189)
Obs. 360 360 360 357BKY (2006) q-value 1.000 1.000 1.000 1.000
Men onlyLeave-out mean 0.078 -0.200 0.086 -0.055
(0.158) (0.154) (0.123) (0.147)
Obs. 360 360 360 357BKY (2006) q-value 1.000 1.000 1.000 1.000
Rich onlyLeave-out mean 0.023 -0.138 -0.003 0.109
(0.118) (0.131) (0.134) (0.141)
Obs. 360 360 360 357BKY (2006) q-value 1.000 1.000 1.000 1.000
Educated onlyLeave-out mean -0.052 -0.219 0.074 -0.025
(0.116) (0.141) (0.124) (0.137)
Obs. 360 360 360 357BKY (2006) q-value 1.000 1.000 1.000 1.000
Each column and each panel is a separate regression. Dependent vari-ables are measured post-treatment and are listed in the top row. Peereffects are calculated using peers’ baseline responses. The leave-outmean is the average of the dependent variable for individual i’s group,ignoring his or her own value. Leave-out means for men, the rich, andthe educated are constructed using values for those sub-sets of groupmembers (where rich and educated are defined as being above the me-dian for the overall sample). All regressions include controls for theindividual’s own baseline response and a constant (not reported).
30
5.3 Do facilitators drive deliberation results?
Given Humphreys et al’s 2006 conclusion that deliberation about the use of oil rents in Sao
Tome was not truly participatory, but driven by the will of the leaders or facilitators, we
designed our experiment and collected additional data to test for “facilitator effects”. We
hypothesize that careful training and supervision of facilitators, as well as the structure of
the deliberative process used here – involving presentation of balanced briefing materials,
no requirement to come to consensus, and individual “secret ballot” rather than collective
reporting of post-treatment preferences – should mitigate these facilitator effects.
Humphreys et al. [2006] enumerate three mechanisms by which facilitators may skew re-
sults. In the first scenario, labeled “suasion”, facilitators intervene in deliberations to sway
participants’ views in the direction of facilitators’ own pre-treatment preferences. Random
assignment of participants to groups allows us to identify these effects experimentally. To
increase power, we pool responses from all four topics that were deliberated in small groups,
and include indicator variables for the topic. Table 7 shows that there is no significant rela-
tionship between facilitators’ baseline views on a given topic and participants post-treatment
poll responses (column 1), controlling for their baseline views in an ANCOVA specification.
Note that because facilitators lead only one session on each topic, we cannot isolate the
role of suasion through facilitator fixed effects as in Humphreys et al. [2006]. However, it
is notable that the group fixed effects in a regression of post-treatment poll responses are
not jointly significant. These fixed effects should incorporate both suasion and peer effects
discussed above, which may (or may not) point in the same direction.
The second scenario in which facilitator effects may arise is self-censorship, in which
participants’ opinions expressed during deliberation will conform to facilitators’ views. To
test this hypothesis we asked independent note takers to observe each deliberative session,
and report on the tone of the discussion on each of our polling topics. Note takers were
asked a sub-set of the same poll questions as participants, but asked to respond on behalf
of the group, relaying what they understood to be the gist of the debate in the group they
observed.10 If self-censorship is at play and participants conform to facilitators’ views, we
would anticipate the note-takers’ summary of the discussion to be at least partially explained
by facilitators’ views. As seen in Table 7 (column 2), we find no such relationship; being
10The items included in this subset are questions 1.1, 1.2, 2.1, 2.5, 2.6, 3.6, 4.1, and 4.6. See the appendixfor full question phrasing.
31
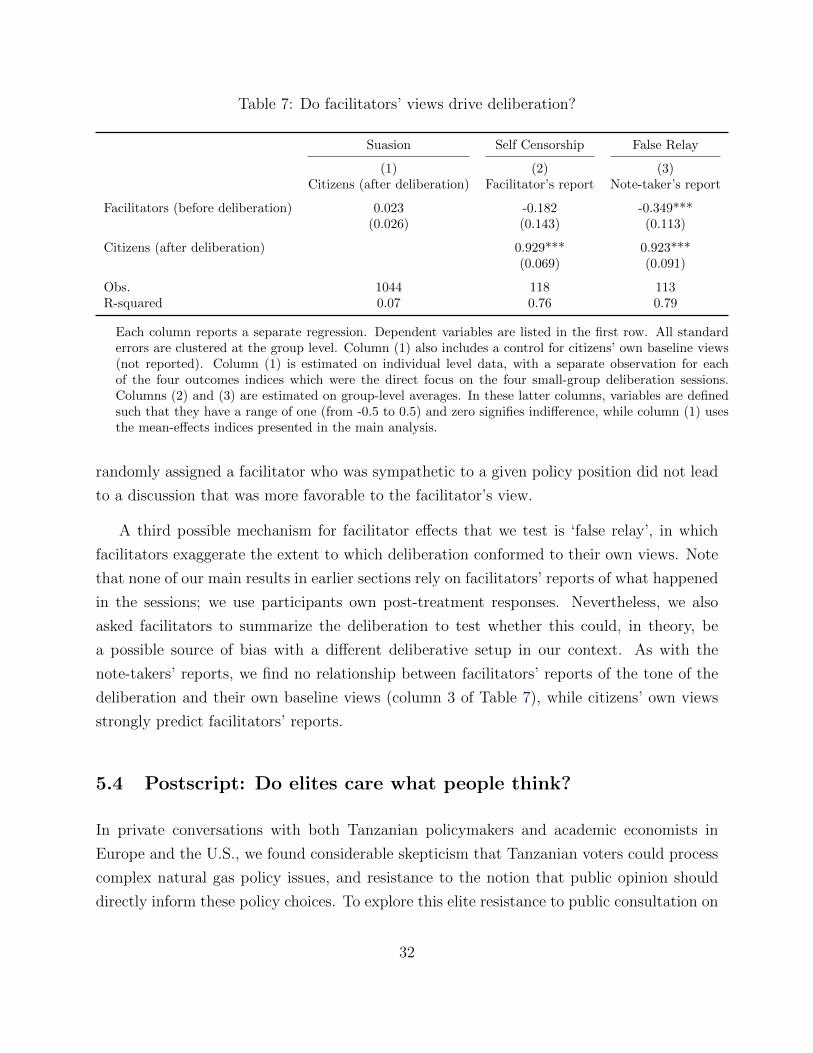
Table 7: Do facilitators’ views drive deliberation?
Suasion Self Censorship False Relay
(1) (2) (3)Citizens (after deliberation) Facilitator’s report Note-taker’s report
Facilitators (before deliberation) 0.023 -0.182 -0.349***(0.026) (0.143) (0.113)
Citizens (after deliberation) 0.929*** 0.923***(0.069) (0.091)
Obs. 1044 118 113R-squared 0.07 0.76 0.79
Each column reports a separate regression. Dependent variables are listed in the first row. All standarderrors are clustered at the group level. Column (1) also includes a control for citizens’ own baseline views(not reported). Column (1) is estimated on individual level data, with a separate observation for eachof the four outcomes indices which were the direct focus on the four small-group deliberation sessions.Columns (2) and (3) are estimated on group-level averages. In these latter columns, variables are definedsuch that they have a range of one (from -0.5 to 0.5) and zero signifies indifference, while column (1) usesthe mean-effects indices presented in the main analysis.
randomly assigned a facilitator who was sympathetic to a given policy position did not lead
to a discussion that was more favorable to the facilitator’s view.
A third possible mechanism for facilitator effects that we test is ‘false relay’, in which
facilitators exaggerate the extent to which deliberation conformed to their own views. Note
that none of our main results in earlier sections rely on facilitators’ reports of what happened
in the sessions; we use participants own post-treatment responses. Nevertheless, we also
asked facilitators to summarize the deliberation to test whether this could, in theory, be
a possible source of bias with a different deliberative setup in our context. As with the
note-takers’ reports, we find no relationship between facilitators’ reports of the tone of the
deliberation and their own baseline views (column 3 of Table 7), while citizens’ own views
strongly predict facilitators’ reports.
5.4 Postscript: Do elites care what people think?
In private conversations with both Tanzanian policymakers and academic economists in
Europe and the U.S., we found considerable skepticism that Tanzanian voters could process
complex natural gas policy issues, and resistance to the notion that public opinion should
directly inform these policy choices. To explore this elite resistance to public consultation on
32
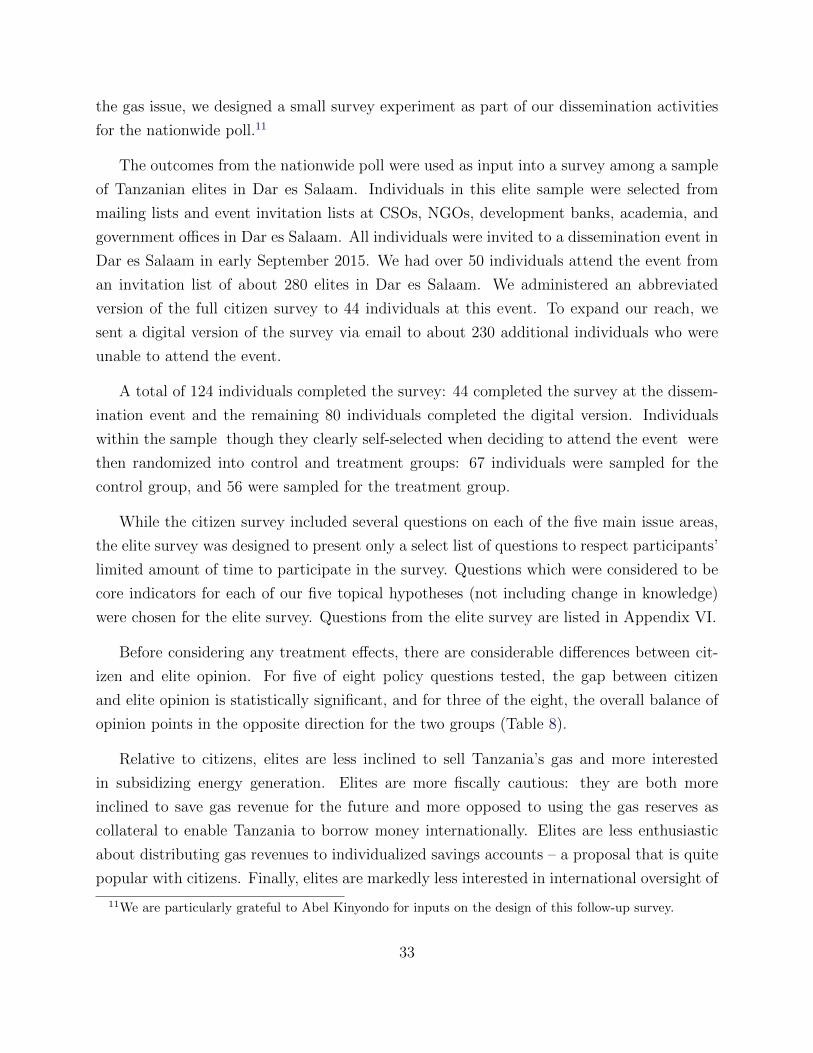
the gas issue, we designed a small survey experiment as part of our dissemination activities
for the nationwide poll.11
The outcomes from the nationwide poll were used as input into a survey among a sample
of Tanzanian elites in Dar es Salaam. Individuals in this elite sample were selected from
mailing lists and event invitation lists at CSOs, NGOs, development banks, academia, and
government offices in Dar es Salaam. All individuals were invited to a dissemination event in
Dar es Salaam in early September 2015. We had over 50 individuals attend the event from
an invitation list of about 280 elites in Dar es Salaam. We administered an abbreviated
version of the full citizen survey to 44 individuals at this event. To expand our reach, we
sent a digital version of the survey via email to about 230 additional individuals who were
unable to attend the event.
A total of 124 individuals completed the survey: 44 completed the survey at the dissem-
ination event and the remaining 80 individuals completed the digital version. Individuals
within the sample though they clearly self-selected when deciding to attend the event were
then randomized into control and treatment groups: 67 individuals were sampled for the
control group, and 56 were sampled for the treatment group.
While the citizen survey included several questions on each of the five main issue areas,
the elite survey was designed to present only a select list of questions to respect participants’
limited amount of time to participate in the survey. Questions which were considered to be
core indicators for each of our five topical hypotheses (not including change in knowledge)
were chosen for the elite survey. Questions from the elite survey are listed in Appendix VI.
Before considering any treatment effects, there are considerable differences between cit-
izen and elite opinion. For five of eight policy questions tested, the gap between citizen
and elite opinion is statistically significant, and for three of the eight, the overall balance of
opinion points in the opposite direction for the two groups (Table 8).
Relative to citizens, elites are less inclined to sell Tanzania’s gas and more interested
in subsidizing energy generation. Elites are more fiscally cautious: they are both more
inclined to save gas revenue for the future and more opposed to using the gas reserves as
collateral to enable Tanzania to borrow money internationally. Elites are less enthusiastic
about distributing gas revenues to individualized savings accounts – a proposal that is quite
popular with citizens. Finally, elites are markedly less interested in international oversight of
11We are particularly grateful to Abel Kinyondo for inputs on the design of this follow-up survey.
33
Tanzania’s management of its gas revenue than are citizens (bear in mind, some of these elite
respondents are themselves the government officials who would be subject to hypothetical
oversight).
The effect of showing citizen poll results to elites is statistically significant for just three
out of eight of the poll questions tested. This includes dampening elite support for sav-
ing for the future, and strengthening their existing support for spending revenues on public
services rather than investments in capital infrastructure. Notably one of these three signif-
icant effects is in the ‘wrong’ direction, i.e., elites move further way from public opinion on
international borrowing, though both groups remain opposed to borrowing on average after
treatment.
On the whole, our judgment is that the combination of our citizen and elite treatments
goes some way toward bridging the gap between the two samples, even though several of
these results are insignificant due to our small sample size in the elite survey. For six out of
eight indicators, the point estimate on the citizen-elite gap narrows due to the combination
of treatments.
6 Conclusion
A key question in the literature on deliberative democracy is whether ordinary citizens,
particularly among a less educated population in a developing country, can reach meaningful
conclusions about complex policy topics – or, instead, whether deliberative outcomes will be
determined by the interests of powerful social groups and the framing imposed by facilitators.
We tested these hypotheses in the context of a nationally-representative deliberation in
Tanzania, in the wake of a large natural gas discovery that poses unprecendted questions
for Tanzanian policymakers about the exploitation and use of a new natural resource. Key
features of this deliberation included the presentation of balanced information briefs (as
adjudicated by a multi-party advisory group) to a representative cross-section of Tanzanian
adults, question-and-answer sessions with panels of topic experts, and moderated, small-
group discussions without any attempt to reach consensus or a collective verdict.
Results from a randomized experiment within our nationwide polling sample show that
deliberation meaningfully changed public opinion, and that these changes were dispropor-
tionately not driven by the prior views of men, the educated, the rich, or group facilitators.
34
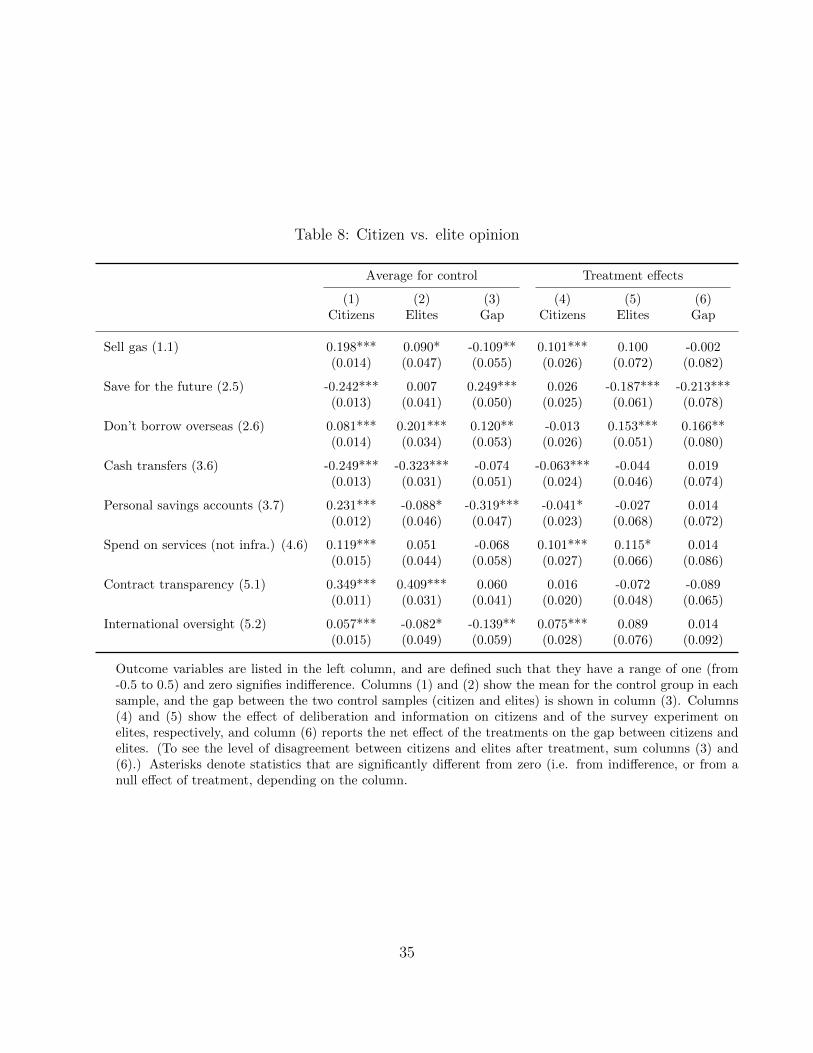
Table 8: Citizen vs. elite opinion
Average for control Treatment effects
(1) (2) (3) (4) (5) (6)Citizens Elites Gap Citizens Elites Gap
Sell gas (1.1) 0.198*** 0.090* -0.109** 0.101*** 0.100 -0.002(0.014) (0.047) (0.055) (0.026) (0.072) (0.082)
Save for the future (2.5) -0.242*** 0.007 0.249*** 0.026 -0.187*** -0.213***(0.013) (0.041) (0.050) (0.025) (0.061) (0.078)
Don’t borrow overseas (2.6) 0.081*** 0.201*** 0.120** -0.013 0.153*** 0.166**(0.014) (0.034) (0.053) (0.026) (0.051) (0.080)
Cash transfers (3.6) -0.249*** -0.323*** -0.074 -0.063*** -0.044 0.019(0.013) (0.031) (0.051) (0.024) (0.046) (0.074)
Personal savings accounts (3.7) 0.231*** -0.088* -0.319*** -0.041* -0.027 0.014(0.012) (0.046) (0.047) (0.023) (0.068) (0.072)
Spend on services (not infra.) (4.6) 0.119*** 0.051 -0.068 0.101*** 0.115* 0.014(0.015) (0.044) (0.058) (0.027) (0.066) (0.086)
Contract transparency (5.1) 0.349*** 0.409*** 0.060 0.016 -0.072 -0.089(0.011) (0.031) (0.041) (0.020) (0.048) (0.065)
International oversight (5.2) 0.057*** -0.082* -0.139** 0.075*** 0.089 0.014(0.015) (0.049) (0.059) (0.028) (0.076) (0.092)
Outcome variables are listed in the left column, and are defined such that they have a range of one (from-0.5 to 0.5) and zero signifies indifference. Columns (1) and (2) show the mean for the control group in eachsample, and the gap between the two control samples (citizen and elites) is shown in column (3). Columns(4) and (5) show the effect of deliberation and information on citizens and of the survey experiment onelites, respectively, and column (6) reports the net effect of the treatments on the gap between citizens andelites. (To see the level of disagreement between citizens and elites after treatment, sum columns (3) and(6).) Asterisks denote statistics that are significantly different from zero (i.e. from indifference, or from anull effect of treatment, depending on the column.
35
The combination of information and extended, structured, participatory deliberation gener-
ated (i) a measurable increase in knowledge of the gas sector; (ii) increased support for sale
of natural gas and reduced support for energy subsidies; (iii) no change in support for saving
versus spending gas revenues; (iv) a sharp decline in support for direct cash distribution of
resource rents to citizens; (v) increased support for spending on social services as opposed
to infrastructure; and (vi) a marginally significant increase in support for transparency and
oversight measures.
In short, even after deliberation, Tanzanians remain impatient to spend resource revenues
quickly, but deliberation otherwise leaves them more prudential about resource management.
Furthermore, we find that deliberation ‘works’ in a procedural sense, even with an extremely
low-income, low-information population like rural Tanzanian voters.
Unlike previous polls of this type conducted in low-income countries (cf Fishkin et al.
[2017] and Chirawurah et al. [2017] on local or regional polls in Uganda and Ghana), our
Tanzania results draw from a larger and more diverse population, and the findings are based
on a controlled experiment allowing clean causal inference about the impact of deliberation,
as well as allowing us to unpack the role of information and deliberation. Democratic de-
liberation appears to be the key to changes in policy preferences; the information treatment
alone produced no significant impacts, and impacts did not spill over onto individuals in the
same community who did not participate in deliberation.
An obvious limitation of our results is our inability to say whether any change in public
opinion will translate into a change in policy or an improvement in natural resource gover-
nance. Multiple steps in this chain may fail that are far beyond the scope of this experiment.
We only measure impacts on stated policy preferences, rather than political action. However,
in a survey experiment based on the dissemination of our findings we do find modest support
for the hypothesis that Tanzanian elites adapt their own policy preferences in response to
public opinion data of this sort.
Future work could explore the impact of deliberation on costly political behavior, be-
ginning with voting. Given the high cost and intensity of our deliberation treatment, it is
difficult to imagine replicating this exact procedure at a much larger scale. Our method is a
sample-based technique for measuring public opinion, as opposed to a mechanism for mass
participation in deliberation or to shape views at the population level. Future work could
explore cheaper, “lighter touch” mechanisms that adhere to similar deliberative principles
and could be extended to a broader population. For the time being, we interpret our results
36
as proof of concept for a practical mechanism for measuring the public’s representative and
informed views on complex issues, even those involving difficult trade-offs and even in the
challenging context of a low-income country in the midst of a resource boom.
References
Michael L Anderson. Multiple inference and gender differences in the effects of early
intervention: A reevaluation of the abecedarian, perry preschool, and early training
projects. Journal of the American Statistical Association, 103(484), 2008. doi: https:
//doi.org/10.1198/016214508000000841.
Alex Armand, Alexander Coutts, Pedro C Vicente, and Ines Vilela. Does information
break the political resource curse? Experimental evidence from Mozambique. American
Economic Review, forthcoming.
Thomas Baunsgaard. United Republic of Tanzania, April 11, 2014. URL https://www.imf.
org/external/pubs/ft/scr/2014/cr14121.pdf. International Monetary Fund, The African
Department.
Yoav Benjamini, Abba M Krieger, and Daniel Yekutieli. Adaptive linear step-up procedures
that control the false discovery rate. Biometrika, 93(3):491–507, 2006. doi: https://doi.
org/10.1093/biomet/93.3.491.
Timothy Besley and Torsten Persson. The logic of political violence. The Quarterly Journal
of Economics, 126(3):1411–1445, 2011. doi: https://doi.org/10.1093/qje/qjr025.
J.M. Bessette. Deliberative democracy: The majority principle in republican government,
1980. R.A. Goldwin and W.A. Schambra (Ed) How Democratic Is the Constitution?
Washington: American Enterprise Institute for Public Policy Research.
Alexander Cappelen, Odd-Helge Fjeldstad, Cornel Jahari, Donald Mmari, Ingrid Sjursen,
and Bertil Tungodden. Not so great expectations: Gas revenue, corruption and willingness
to pay tax in Tanzania, February 2016. URL https://open.cmi.no/cmi-xmlui/handle/
11250/2475129. Chr. Michelsen Institute (CMI) Brief, Volume 15, No. 4.
Francesco Caselli and Guy Michaels. Do oil windfalls improve living standards? Evidence
from Brazil. American Economic Journal: Applied Economics, 5(1):208–238, 2013. doi:
https://doi.org/10.1257/app.5.1.208.
37
Katherine E Casey, Rachel Glennerster, and Kelly Bidwell. Debates: The impact of voter
knowledge initiatives in Sierra Leone. 128(8), 2020. doi: https://doi.org/10.1086/706862.
Dennis Chirawurah, James Fishkin, Niagia Santuah, Alice Siu, Ayaga Bawah, Gordana
Kranjac-Berisavljevic, , and Kathleen Giles. Deliberation for Development: Ghanas First
Deliberative Poll. Journal of Public Deliberation, 15(1), 2017. doi: https://doi.org/10.
16997/jdd.314.
Joshua Cohen. Deliberation and democratic legitimacy, 1997.
Paul Collier and Anke Hoeffler. Testing the Neocon Agenda: Democracy in Resource-Rich
Societies. European Economic Review, 53(3):293–308, April 2009. doi: https://doi.org/
10.1016/j.euroecorev.2008.05.006.
Paul Collier and Anthony J Venables. Plundered nations? Successes and failures in natural
resource extraction. Palgrave Macmillan, 2011.
Paul Collier, Rick Van Der Ploeg, Michael Spence, and Anthony J Venables. Man-
aging resource revenues in developing economies. IMF Staff Papers, 57(1):84–
118, 2009. URL https://www.elibrary.imf.org/abstract/IMF024/10478-9781589069114/
10478-9781589069114/10478-9781589069114 A004.xml.
Brandon de la Cuesta, Helen V Milner, Daniel L Nielson, and Stephen F Knack. Oil and
aid revenue produce equal demands for accountability as taxes in ghana and uganda.
Proceedings of the National Academy of Sciences, 116(36):17717–17722, 2019. doi: https:
//doi.org/10.1073/pnas.1903134116.
Oeindrila Dube and Juan F Vargas. Commodity price shocks and civil conflict: Evidence
from Colombia. The Review of Economic Studies, 80(4):1384–1421, 2013. doi: https:
//doi.org/10.1093/restud/rdt009.
Christian Ebeke and Constant Lonkeng Ngouana. Energy sub-
sidies and public social spending: Theory and evidence, May
2015. URL https://www.imf.org/en/Publications/WP/Issues/2016/12/31/
Energy-Subsidies-and-Public-Social-Spending-Theory-and-Evidence-42901. Interna-
tional Monetary Fund, Working paper 15/101, Downloaded on July 20, 2017 at
https://www.imf.org/external/pubs/ft/wp/2015/wp15101.pdf.
38
David K. Evans, Stephanie Hausladen, Katrina Kosec, and Natasha Reese.
Community-based Conditional Cash Transfers in Tanzania: Results from a Randomized
Trial. World Bank, 2014. doi: https://doi.org/10.1596/978-1-4648-0141-9.
Cynthia Farrar, James S Fishkin, Donald P Green, Christian List, Robert C Luskin, and
Elizabeth Levy Paluck. Disaggregating deliberation’s effects: An experiment within a
deliberative poll. British Journal of Political Science, 40(2):333–347, 2010. doi: https:
//doi.org/10.1017/S0007123409990433.
James S Fishkin. Democracy and deliberation: New directions for democratic reform. Yale
University Press, 1991.
James S Fishkin, Roy William Mayega, Lynn Atuyambe, Nathan Tumuhamye, Julius
Ssentongo, Alice Siu, and William Bazeyo. Applying deliberative democracy in Africa:
Uganda’s first deliberative polls. Daedalus, 146(3):140–154, 2017. doi: https://doi.org/
10.1162/DAED a 00453.
Thomas Fujiwara and Leonard Wantchekon. Can informed public deliberation overcome
clientelism? Experimental evidence from Benin. American Economic Journal: Applied
Economics, 5(4):241–255, 2013. doi: https://doi.org/10.1257/app.5.4.241.
Alan Gelb. Oil windfalls: Blessing or curse? Oxford University Press, 1988. World Bank.
Alan Gelb, Silvana Tordo, Havard Halland, Noora Arfaa, and Gregory Smith. Sovereign
wealth funds and long-term development finance risks and opportunities, 2014. World
Bank.
Kimmo Gronlund, Andre Bachtiger, and Maija Setala. Deliberative mini-publics: Involving
citizens in the democratic process, 2014. ECPR – studies in European political science.
Amy Gutmann and Dennis Thompson. Democracy and Disagreement. Harvard University
Press, 1996.
Emmanuel Gyimah-Boadi and H Kwasi Prempeh. Oil, politics, and Ghana’s democracy.
Journal of Democracy, 23(3):94–108, 2012. doi: https://doi.org/10.1353/jod.2012.0042.
Joel L Horowitz and Charles F Manski. Nonparametric analysis of randomized experiments
with missing covariate and outcome data. Journal of the American Statistical Association,
95(449):77–84, 2000. doi: https://doi.org/10.1080/01621459.2000.10473902.
39
Macartan Humphreys, William A Masters, and Martin E Sandbu. The role of leaders in
democratic deliberations: Results from a field experiment in Sao Tome and Prıncipe.
World Politics, 58(04):583–622, 2006. doi: https://doi.org/10.1353/wp.2007.0008.
IWG. Sovereign wealth funds: Generally accepted principles and practices: “Santi-
ago Principles”, 2008. International Working Group of Sovereign Wealth Funds, URL
https://www.ifswf.org/santiago-principles-landing/santiago-principles.
Jeffrey R Kling, Jeffrey B Liebman, and Lawrence F Katz. Experimental analysis of neighbor-
hood effects. Econometrica, 75(1):83–119, 2007. doi: https://doi.org/10.1111/j.1468-0262.
2007.00733.x.
David S Lee. Training, wages, and sample selection: Estimating sharp bounds on treatment
effects. The Review of Economic Studies, 76(3):1071–1102, 2009. doi: https://doi.org/10.
1111/j.1467-937X.2009.00536.x.
Arthur Lupia and Anne Norton. Inequality is always in the room: language & power in
deliberative democracy. Daedalus, 146(3):64–76, 2017. doi: https://doi.org/10.1162/
DAED a 00447.
Eoin F McGuirk. The illusory leader: Natural resources, taxation and accountability. Public
Choice, pages 1–29, 2013. doi: https://doi.org/10.1007/s11127-011-9820-0.
Jacques Morisset, Isis Gaddis, Youdi Schipper, and Elvis Mushi. Managing natural resources:
What do citizens say?, 2014. URL https://www.twaweza.org/go/sauti-resources-en. World
Bank and Twaweza.
Todd Moss. The Governor’s Solution: How Alaska’s Oil Dividend Could Work in Iraq and
Other Oil-Rich Countries. Center for Global Development, 2012.
Todd Moss, Caroline Lambert, and Stephanie Majerowicz. Oil to Cash: Fighting the
Resource Curse with Cash Transfers. Center for Global Development, Brookings Insti-
tution Press, 2015. URL http://www.cgdev.org/sites/default/files/21771 CGD cx Proof.
pdf.
C.S. Nino. The constitution of deliberative democracy, 1996. New Haven, CT: Yale University
Press.
40
Laura Paler. Keeping the public purse: An experiment in windfalls, taxes, and the incentives
to restrain government. American Political Science Review, 107(04):706–725, 2013. doi:
https://doi.org/10.1017/S0003055413000415.
Marcos Poplawski Ribeiro, Mauricio Villafuerte, Thomas Baunsgaard, and Christine J. Rich-
mond. Fiscal frameworks for resource rich developing countries. IMF Staff Discussion
Notes 2012/004, International Monetary Fund, 2012. URL http://www.imf.org/external/
pubs/cat/longres.aspx?sk=25902.
Michael L Ross. The Oil Curse: How Petroleum Wealth Shapes the Development of Nations.
Princeton University Press, 2013.
Michael L Ross. What have we learned about the resource curse? Annual Review of Political
Science, 18:239–259, 2015. doi: https://doi.org/10.1146/annurev-polisci-052213-040359.
Xavier Sala-i-Martin and Arvind Subramanian. Addressing the natural resource curse: An
illustration from Nigeria, 2013. doi: https://doi.org/10.1093/jae/ejs033.
Lynn M Sanders. Against deliberation. Political theory, 25(3):347–376, 1997. doi: https:
//doi.org/10.1177/0090591797025003002.
Amartya Sen. Development as freedom, 2000.
Anwar Shah. Participatory budgeting, 2007. International Bank for Reconstruction and
Development and the World Bank, URL https://goo.gl/h94z3D.
Joseph Stiglitz. Participation and development: Perspectives from the comprehensive de-
velopment paradigm. Review of Development Economics, page 165, 2002. doi: https:
//doi.org/10.1111/1467-9361.00148.
Cass R. Sunstein. The law of group polarization. The Journal of Political Philosophy, 10
(2):175–195, June 2002. doi: https://doi.org/10.1111/1467-9760.00148.
Frederick Van der Ploeg. Natural resources: Curse or blessing? Journal of Economic
Literature, 49(2):366–420, June 2011. doi: https://doi.org/10.1257/jel.49.2.366.
Pedro C Vicente. Does oil corrupt? Evidence from a natural experiment in West Africa.
Journal of Development Economics, 92(1):28–38, 2010. doi: https://doi.org/10.1016/j.
jdeveco.2009.01.005.
41
Leonard Wantchekon. Clientelism and Voting Behavior: Evidence from a Field Experiment
in Benin. World Politics, pages 399–422, April 2003. doi: https://doi.org/10.1353/wp.
2003.0018.
Leonard Wantchekon, Gabriel Lopez-Moctezuma, Thomas Fujiwara, Cecilia Pe Lero, and
Daniel Rubenson. Policy Deliberation and Voter Persuasion: Experimental Evidence
from an Election in the Philippines. 2018. URL https://www.povertyactionlab.org/sites/
default/files/publications/Policy-Deliberation-and-Voter-Persuasion Wantchekon-et-al.
Dec2018.pdf.
World Bank and IBRD. Toward country-led development: A multi-partner evaluation of the
comprehensive development framework, 2003. URL http://documents1.worldbank.org/
curated/en/542401468152957109/pdf/271540PAPER0Country1led0synthesis.pdf. Pub-
lished by the International Bank for Reconstruction and Development and the World
Bank.
42
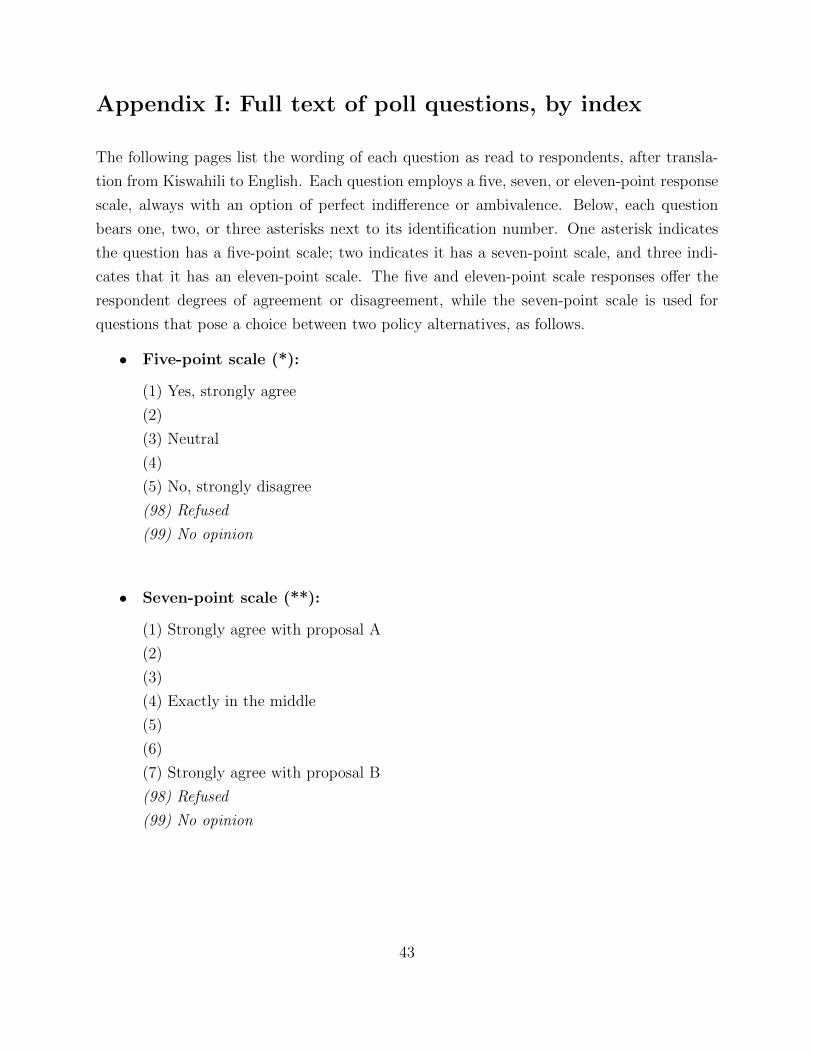
Appendix I: Full text of poll questions, by index
The following pages list the wording of each question as read to respondents, after transla-
tion from Kiswahili to English. Each question employs a five, seven, or eleven-point response
scale, always with an option of perfect indifference or ambivalence. Below, each question
bears one, two, or three asterisks next to its identification number. One asterisk indicates
the question has a five-point scale; two indicates it has a seven-point scale, and three indi-
cates that it has an eleven-point scale. The five and eleven-point scale responses offer the
respondent degrees of agreement or disagreement, while the seven-point scale is used for
questions that pose a choice between two policy alternatives, as follows.
• Five-point scale (*):
(1) Yes, strongly agree
(2)
(3) Neutral
(4)
(5) No, strongly disagree
(98) Refused
(99) No opinion
• Seven-point scale (**):
(1) Strongly agree with proposal A
(2)
(3)
(4) Exactly in the middle
(5)
(6)
(7) Strongly agree with proposal B
(98) Refused
(99) No opinion
43
• Eleven-point scale (***):
(0) Extremely unimportant
(1)
(2)
(3)
(4)
(5) Exactly in the middle
(6)
(7)
(8)
(9)
(10) Extremely important
(98) Refused
(99) No opinion
Index 1: Support for extracting and exporting the gas
H1 1***
Use the gas to reduce the price of fuel.
H1 2**
Some people think that Tanzania should use the gas for fuel for Tanzanians. Suppose
these people are at 1 on the scale. Other people think Tanzania should sell the gas to
earn money. Suppose these people are at 7 on the scale. Those who are exactly in the
middle are at 4. Where would you place yourself?
H1 3**
Some people think that Tanzania should leave the natural gas in the ground, to save for
the future and avoid trouble. Suppose these people are at 1 on the scale. Other people
think the gas should be extracted to provide fuel and make money. Suppose these people
are at 7 on the scale. Those who are exactly in the middle are at 4. Where would you
place yourself?
44
H1 4**
Some people think that Tanzanians should pay the full price for energy so that the
earnings from selling natural gas can be used for roads, schools, clinics, and electricity
lines. Suppose these people are at 1 on the scale. Other people think the gas should be
used mostly to produce electricity so that electricity would be very cheap for all
Tanzanians. Suppose these people are at 7 on the scale. Those who are exactly in the
middle are at 4. Where would you place yourself?
H1 5**
Some people think that all of the gas should be sold at the highest possible price to get
the most money for Tanzania. Suppose these people are 1 on the scale. Other people
think that some of the gas should be discounted to help local industry grow, even if this
means that Tanzania receives less money from the sale of gas. Suppose these people are
at 7 on the scale. Those who are exactly in the middle are at 4. Where would you place
yourself?
Index 2: Support for saving rather than spending gas revenue
H2 1**
Some countries, such as Norway, place strict limits on the amount of money that can be
spent each year from oil and gas revenues so that the money can be used over a longer
period of time. Suppose these countries are at 1 on the scale. Other countries, such as
Ghana, have very loose limits on how much money is spent from oil and gas revenues
so that more money can be spent immediately to help Ghana’s economy. Suppose these
countries are at 7 on the scale. Those who are exactly in the middle are at 4. What
do you think is the right solution for Tanzania? Strict limits on spending like Norway
or loose limits like Ghana or somewhere in between? Please choose a number between 1
and 7 if 1 is for very strict limits and 7 is for very loose limits.
H2 2***
Spend some money on building things for the people, such as roads and the electricity
system
H2 3***
Spend some of the money on public services, such as health care and education
45
H2 4***
Save some of the money for future generations
H2 5**
Some people think the money should be saved mostly for the future even if that means
there is not much of an increase in spending now. Suppose these people are at point 1
on the scale. Other people think that the money should be spent now even if that means
that in the future there will be nothing left. Suppose these people are at point 7 on the
scale. Those who are exactly in the middle are at 4. Where would you place yourself?
H2 6**
Rather than waiting for the money from oil and gas to begin flowing, Tanzania should
use the expected money from gas to borrow money from overseas and start spending
sooner, even though the government will need to repay more than the original amount
borrowed.
H2 7**
Some people think the money should be spent by the government on building things
the people need, such as roads or the electricity system even if that means there will be
no extra money for public services. Suppose these people are at point 1 on the scale.
Other people think the money should be spent on improving public services such as
health care and education even if that means there will be no extra money for building
things such as roads or the electricity system. Suppose these people are at 7. Those who
are exactly in the middle are at 4. Where would you place yourself?
Index 3: Support for government spending versus direct distribu-
tion
H3 1***
Give some money directly to households to spend for their own needs however they want
H3 2***
Give some money directly to those households with children or the elderly
46
H3 3***
Giving most of the money directly to households will fight poverty and hunger
H3 4***
Giving most of the money directly to the people will help children in poor families have
better nutrition and a greater chance of doing well in school
H3 5***
Giving most of the money directly to households will make the government more
accountable for the amount people expect each year
H3 6**
Some people think that the money should be given directly to households even if that
means there will be no increased money for the government to spend on what the public
needs. Suppose these people are at 1 on a scale from 1 to 7. Other people think that
the money should be spent by the government for what the public needs even if that
means there will be no extra money to give directly to the people. Suppose these people
are at 7 on the scale. Those who are exactly in the middle are at 4. Where would you
place yourself?
H3 7*
What if some money is put into a savings account for every child at birth with each child
having access to the resulting money at age 18?
H3 8*
What if some money is put into a savings account for every adult starting at age 40 with
each adult having access to the resulting money at age 60?
Index 4: Support for government spending on social services ver-
sus
infrastructure, transport, and industry
H4 1***
Using most of the money to build things such as roads and the electricity system will
create jobs
47
H4 2***
Using most of the money to build things such as roads and the electricity system will
help the economy grow much faster
H4 3***
Spending most of the money on services such as health care and education will help poor
people
H4 4***
Spending most of the money on services such as health care and education will help the
economy grow much faster
H4 5*
Some people say that when the government increases spending on roads and schools a
lot of money is wasted during these projects.
H4 6**
Some people think the money should be spent by the government on building things
the people need, such as roads or the electricity system even if that means there will be
no extra money for public services. Suppose these people are at point 1 on the scale.
Other people think the money should be spent on improving public services such as
health care and education even if that means there will be no extra money for building
things such as roads or the electricity system. Suppose these people are at 7. Those who
are exactly in the middle are at 4. Where would you place yourself?
Index 5: Support for transparency and oversight of gas revenues,
or additional restrictions on their use
H5 1**
Some people think that the government should be able to keep the oil and gas contracts
with companies private and not allow citizens access to them so that sensitive information
between companies and the government is kept private. Suppose these people are at 1
on the scale. Other people think that all oil and gas contracts should be published
for citizens to access them so that citizens know how much money the government is
48
receiving from oil and gas companies. Suppose these people are at 7 on the scale. Those
who are exactly in the middle are at 4. Where would you place yourself?
H5 2**
Some people think the government should decide how to spend most of the money from
natural gas over the years since the government is elected by the people. Suppose these
people are at 1 on the scale. Other people think most of the money should be managed
by an independent and international group of experts appointed by government, to help
ensure the money is not wasted or stolen over the years. Suppose these people are at 7.
Those who are exactly in the middle are at 4. Where would you place yourself?
H5 3***
Entrusting most of the money to the national government will ensure it is spent where
it is most needed
H5 4
What, if anything, have you heard about Tanzania’s recent natural gas discoveries?
Tanzania has. . .
Answer choices:
(1) Not begun extracting or exporting the gas, (2) Begun extracting the gas but not
exporting it, (3) Begun extracting and exporting the gas, (4) I haven’t heard anything
about the natural gas, (99) DON’T KNOW
H5 5
Where was the natural gas discovered?
Answer choices:
(1) Near Arusha, (2) Under Lake Victoria, (3) Offshore near Mtwara, (4) Morogoro,
(-96) OTHER, (SPECIFY), (-99) DON’T KNOW
Index 6: Knowledge of the natural gas discovery
H6 1
During whose presidency were recent offshore natural gas discoveries made?
49
Answer choices:
(1) During Nyerere’s presidency, (2) During Mwinyi’s presidency, (3) During Mkapa’s
presidency, (4) During Kikwete’s presidency, (-96) OTHER (SPECIFY), (-99) DON’T
KNOW
H6 2
Do you think that the government has started receiving revenues from the recent
discoveries of natural gas?
Answer choices:
(1) Yes, they have begun receiving a small portion of revenues, (2) Yes, they have begun
receiving a large portion of revenues, (3) No, they have not begun receiving any revenues,
(-99) DON’T KNOW
H6 3
The cost of building a new regional hospital?
Answer choices:
(1) More, (2) Less, (-99) DON’T KNOW
H6 4
The cost of building 10 new regional hospitals?
Answer choices:
(1) More, (2) Less, (-99) DON’T KNOW
H6 5
The size of the entire national government budget?
Answer choices:
(1) More, (2) Less, (-99) DON’T KNOW
H6 6
The size of the whole national economy
50
Answer choices:
(1) More, (2) Less, (-99) DON’T KNOW
H6 7
If it was divided evenly among all Tanzanians, how much natural gas revenue do you
think there will be each year for each person? (TSh)
Answer choices:
(1) Less than 1,000 shillings, (2) 1,000 to 10,000 shillings, (3) 10,000 to 100,000 shillings,
(4) 100,000 to 1m shillings, (5) Over TSh 1m, (-99) DON’T KNOW
51
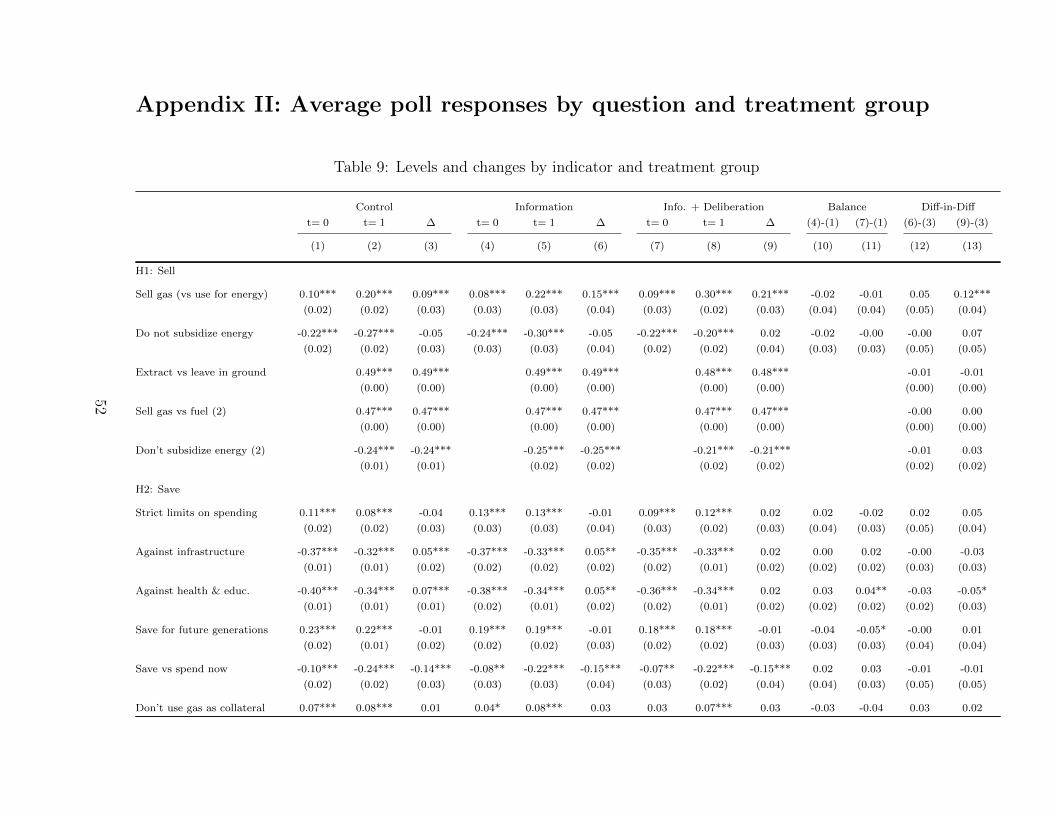
Appendix II: Average poll responses by question and treatment group
Table 9: Levels and changes by indicator and treatment group
Control Information Info. + Deliberation Balance Diff-in-Diff
t= 0 t= 1 ∆ t= 0 t= 1 ∆ t= 0 t= 1 ∆ (4)-(1) (7)-(1) (6)-(3) (9)-(3)
(1) (2) (3) (4) (5) (6) (7) (8) (9) (10) (11) (12) (13)
H1: Sell
Sell gas (vs use for energy) 0.10*** 0.20*** 0.09*** 0.08*** 0.22*** 0.15*** 0.09*** 0.30*** 0.21*** -0.02 -0.01 0.05 0.12***
(0.02) (0.02) (0.03) (0.03) (0.03) (0.04) (0.03) (0.02) (0.03) (0.04) (0.04) (0.05) (0.04)
Do not subsidize energy -0.22*** -0.27*** -0.05 -0.24*** -0.30*** -0.05 -0.22*** -0.20*** 0.02 -0.02 -0.00 -0.00 0.07
(0.02) (0.02) (0.03) (0.03) (0.03) (0.04) (0.02) (0.02) (0.04) (0.03) (0.03) (0.05) (0.05)
Extract vs leave in ground 0.49*** 0.49*** 0.49*** 0.49*** 0.48*** 0.48*** -0.01 -0.01
(0.00) (0.00) (0.00) (0.00) (0.00) (0.00) (0.00) (0.00)
Sell gas vs fuel (2) 0.47*** 0.47*** 0.47*** 0.47*** 0.47*** 0.47*** -0.00 0.00
(0.00) (0.00) (0.00) (0.00) (0.00) (0.00) (0.00) (0.00)
Don’t subsidize energy (2) -0.24*** -0.24*** -0.25*** -0.25*** -0.21*** -0.21*** -0.01 0.03
(0.01) (0.01) (0.02) (0.02) (0.02) (0.02) (0.02) (0.02)
H2: Save
Strict limits on spending 0.11*** 0.08*** -0.04 0.13*** 0.13*** -0.01 0.09*** 0.12*** 0.02 0.02 -0.02 0.02 0.05
(0.02) (0.02) (0.03) (0.03) (0.03) (0.04) (0.03) (0.02) (0.03) (0.04) (0.03) (0.05) (0.04)
Against infrastructure -0.37*** -0.32*** 0.05*** -0.37*** -0.33*** 0.05** -0.35*** -0.33*** 0.02 0.00 0.02 -0.00 -0.03
(0.01) (0.01) (0.02) (0.02) (0.02) (0.02) (0.02) (0.01) (0.02) (0.02) (0.02) (0.03) (0.03)
Against health & educ. -0.40*** -0.34*** 0.07*** -0.38*** -0.34*** 0.05** -0.36*** -0.34*** 0.02 0.03 0.04** -0.03 -0.05*
(0.01) (0.01) (0.01) (0.02) (0.01) (0.02) (0.02) (0.01) (0.02) (0.02) (0.02) (0.02) (0.03)
Save for future generations 0.23*** 0.22*** -0.01 0.19*** 0.19*** -0.01 0.18*** 0.18*** -0.01 -0.04 -0.05* -0.00 0.01
(0.02) (0.01) (0.02) (0.02) (0.02) (0.03) (0.02) (0.02) (0.03) (0.03) (0.03) (0.04) (0.04)
Save vs spend now -0.10*** -0.24*** -0.14*** -0.08** -0.22*** -0.15*** -0.07** -0.22*** -0.15*** 0.02 0.03 -0.01 -0.01
(0.02) (0.02) (0.03) (0.03) (0.03) (0.04) (0.03) (0.02) (0.04) (0.04) (0.03) (0.05) (0.05)
Don’t use gas as collateral 0.07*** 0.08*** 0.01 0.04* 0.08*** 0.03 0.03 0.07*** 0.03 -0.03 -0.04 0.03 0.02
52
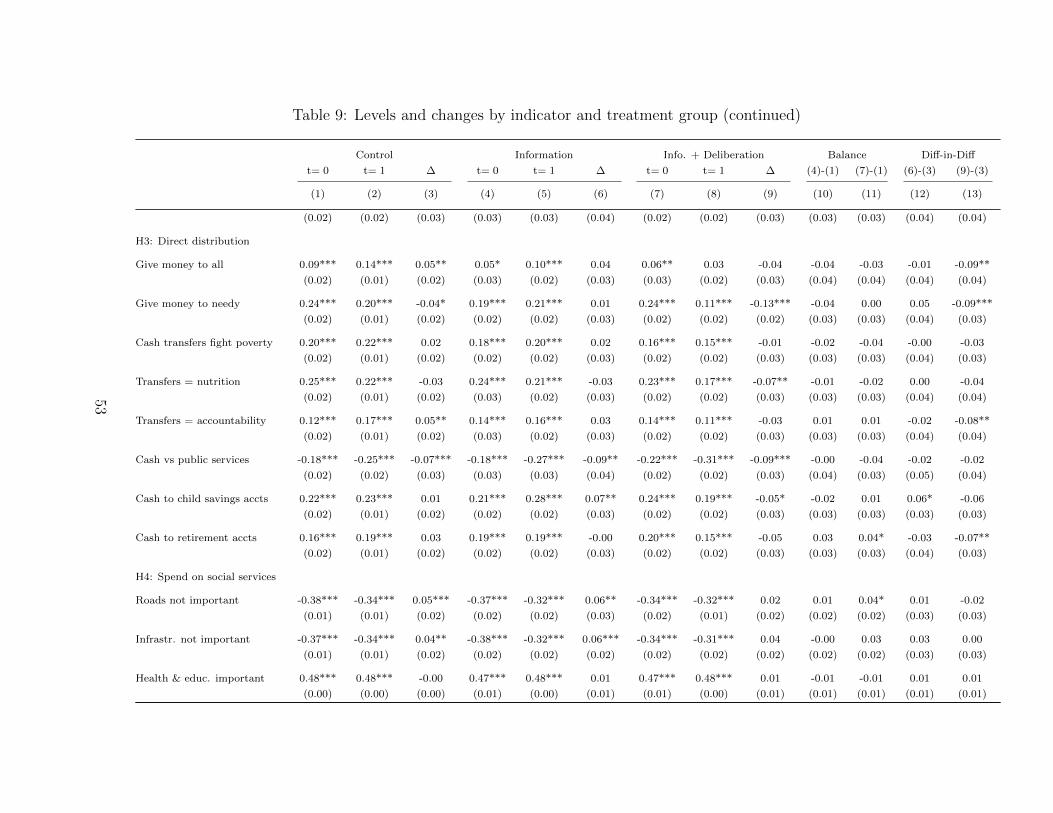
Table 9: Levels and changes by indicator and treatment group (continued)
Control Information Info. + Deliberation Balance Diff-in-Diff
t= 0 t= 1 ∆ t= 0 t= 1 ∆ t= 0 t= 1 ∆ (4)-(1) (7)-(1) (6)-(3) (9)-(3)
(1) (2) (3) (4) (5) (6) (7) (8) (9) (10) (11) (12) (13)
(0.02) (0.02) (0.03) (0.03) (0.03) (0.04) (0.02) (0.02) (0.03) (0.03) (0.03) (0.04) (0.04)
H3: Direct distribution
Give money to all 0.09*** 0.14*** 0.05** 0.05* 0.10*** 0.04 0.06** 0.03 -0.04 -0.04 -0.03 -0.01 -0.09**
(0.02) (0.01) (0.02) (0.03) (0.02) (0.03) (0.03) (0.02) (0.03) (0.04) (0.04) (0.04) (0.04)
Give money to needy 0.24*** 0.20*** -0.04* 0.19*** 0.21*** 0.01 0.24*** 0.11*** -0.13*** -0.04 0.00 0.05 -0.09***
(0.02) (0.01) (0.02) (0.02) (0.02) (0.03) (0.02) (0.02) (0.02) (0.03) (0.03) (0.04) (0.03)
Cash transfers fight poverty 0.20*** 0.22*** 0.02 0.18*** 0.20*** 0.02 0.16*** 0.15*** -0.01 -0.02 -0.04 -0.00 -0.03
(0.02) (0.01) (0.02) (0.02) (0.02) (0.03) (0.02) (0.02) (0.03) (0.03) (0.03) (0.04) (0.03)
Transfers = nutrition 0.25*** 0.22*** -0.03 0.24*** 0.21*** -0.03 0.23*** 0.17*** -0.07** -0.01 -0.02 0.00 -0.04
(0.02) (0.01) (0.02) (0.03) (0.02) (0.03) (0.02) (0.02) (0.03) (0.03) (0.03) (0.04) (0.04)
Transfers = accountability 0.12*** 0.17*** 0.05** 0.14*** 0.16*** 0.03 0.14*** 0.11*** -0.03 0.01 0.01 -0.02 -0.08**
(0.02) (0.01) (0.02) (0.03) (0.02) (0.03) (0.02) (0.02) (0.03) (0.03) (0.03) (0.04) (0.04)
Cash vs public services -0.18*** -0.25*** -0.07*** -0.18*** -0.27*** -0.09** -0.22*** -0.31*** -0.09*** -0.00 -0.04 -0.02 -0.02
(0.02) (0.02) (0.03) (0.03) (0.03) (0.04) (0.02) (0.02) (0.03) (0.04) (0.03) (0.05) (0.04)
Cash to child savings accts 0.22*** 0.23*** 0.01 0.21*** 0.28*** 0.07** 0.24*** 0.19*** -0.05* -0.02 0.01 0.06* -0.06
(0.02) (0.01) (0.02) (0.02) (0.02) (0.03) (0.02) (0.02) (0.03) (0.03) (0.03) (0.03) (0.03)
Cash to retirement accts 0.16*** 0.19*** 0.03 0.19*** 0.19*** -0.00 0.20*** 0.15*** -0.05 0.03 0.04* -0.03 -0.07**
(0.02) (0.01) (0.02) (0.02) (0.02) (0.03) (0.02) (0.02) (0.03) (0.03) (0.03) (0.04) (0.03)
H4: Spend on social services
Roads not important -0.38*** -0.34*** 0.05*** -0.37*** -0.32*** 0.06** -0.34*** -0.32*** 0.02 0.01 0.04* 0.01 -0.02
(0.01) (0.01) (0.02) (0.02) (0.02) (0.03) (0.02) (0.01) (0.02) (0.02) (0.02) (0.03) (0.03)
Infrastr. not important -0.37*** -0.34*** 0.04** -0.38*** -0.32*** 0.06*** -0.34*** -0.31*** 0.04 -0.00 0.03 0.03 0.00
(0.01) (0.01) (0.02) (0.02) (0.02) (0.02) (0.02) (0.02) (0.02) (0.02) (0.02) (0.03) (0.03)
Health & educ. important 0.48*** 0.48*** -0.00 0.47*** 0.48*** 0.01 0.47*** 0.48*** 0.01 -0.01 -0.01 0.01 0.01
(0.00) (0.00) (0.00) (0.01) (0.00) (0.01) (0.01) (0.00) (0.01) (0.01) (0.01) (0.01) (0.01)
53
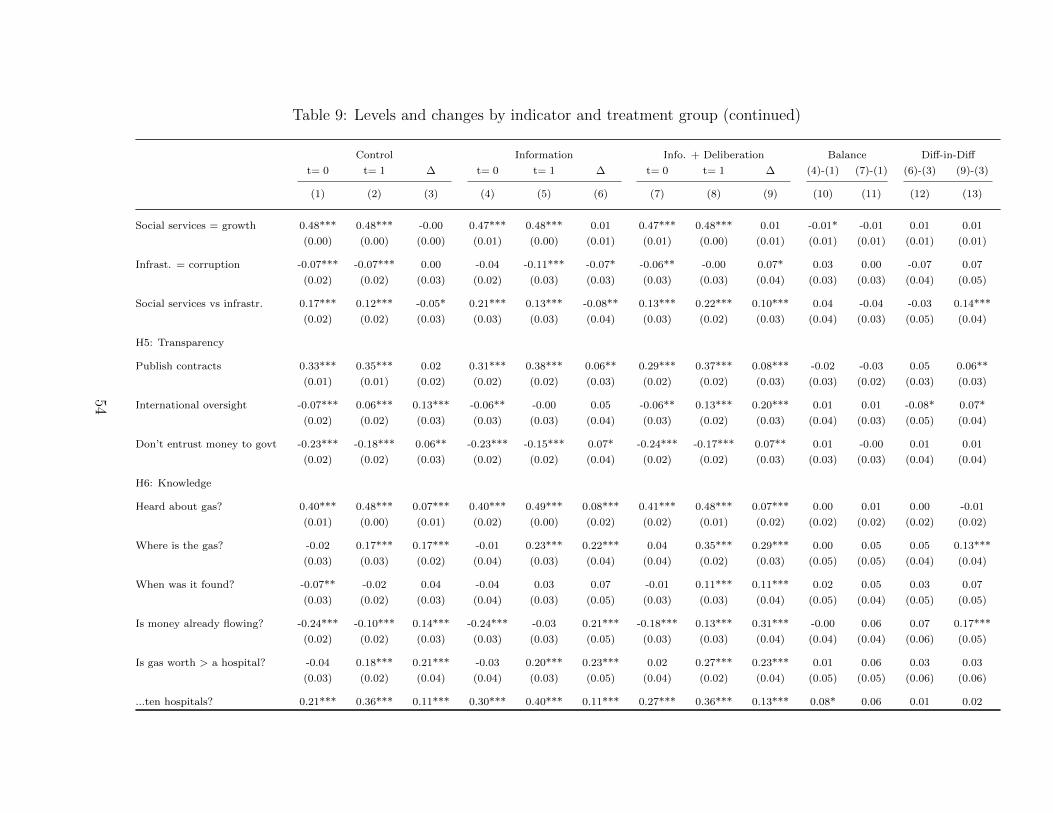
Table 9: Levels and changes by indicator and treatment group (continued)
Control Information Info. + Deliberation Balance Diff-in-Diff
t= 0 t= 1 ∆ t= 0 t= 1 ∆ t= 0 t= 1 ∆ (4)-(1) (7)-(1) (6)-(3) (9)-(3)
(1) (2) (3) (4) (5) (6) (7) (8) (9) (10) (11) (12) (13)
Social services = growth 0.48*** 0.48*** -0.00 0.47*** 0.48*** 0.01 0.47*** 0.48*** 0.01 -0.01* -0.01 0.01 0.01
(0.00) (0.00) (0.00) (0.01) (0.00) (0.01) (0.01) (0.00) (0.01) (0.01) (0.01) (0.01) (0.01)
Infrast. = corruption -0.07*** -0.07*** 0.00 -0.04 -0.11*** -0.07* -0.06** -0.00 0.07* 0.03 0.00 -0.07 0.07
(0.02) (0.02) (0.03) (0.02) (0.03) (0.03) (0.03) (0.03) (0.04) (0.03) (0.03) (0.04) (0.05)
Social services vs infrastr. 0.17*** 0.12*** -0.05* 0.21*** 0.13*** -0.08** 0.13*** 0.22*** 0.10*** 0.04 -0.04 -0.03 0.14***
(0.02) (0.02) (0.03) (0.03) (0.03) (0.04) (0.03) (0.02) (0.03) (0.04) (0.03) (0.05) (0.04)
H5: Transparency
Publish contracts 0.33*** 0.35*** 0.02 0.31*** 0.38*** 0.06** 0.29*** 0.37*** 0.08*** -0.02 -0.03 0.05 0.06**
(0.01) (0.01) (0.02) (0.02) (0.02) (0.03) (0.02) (0.02) (0.03) (0.03) (0.02) (0.03) (0.03)
International oversight -0.07*** 0.06*** 0.13*** -0.06** -0.00 0.05 -0.06** 0.13*** 0.20*** 0.01 0.01 -0.08* 0.07*
(0.02) (0.02) (0.03) (0.03) (0.03) (0.04) (0.03) (0.02) (0.03) (0.04) (0.03) (0.05) (0.04)
Don’t entrust money to govt -0.23*** -0.18*** 0.06** -0.23*** -0.15*** 0.07* -0.24*** -0.17*** 0.07** 0.01 -0.00 0.01 0.01
(0.02) (0.02) (0.03) (0.02) (0.02) (0.04) (0.02) (0.02) (0.03) (0.03) (0.03) (0.04) (0.04)
H6: Knowledge
Heard about gas? 0.40*** 0.48*** 0.07*** 0.40*** 0.49*** 0.08*** 0.41*** 0.48*** 0.07*** 0.00 0.01 0.00 -0.01
(0.01) (0.00) (0.01) (0.02) (0.00) (0.02) (0.02) (0.01) (0.02) (0.02) (0.02) (0.02) (0.02)
Where is the gas? -0.02 0.17*** 0.17*** -0.01 0.23*** 0.22*** 0.04 0.35*** 0.29*** 0.00 0.05 0.05 0.13***
(0.03) (0.03) (0.02) (0.04) (0.03) (0.04) (0.04) (0.02) (0.03) (0.05) (0.05) (0.04) (0.04)
When was it found? -0.07** -0.02 0.04 -0.04 0.03 0.07 -0.01 0.11*** 0.11*** 0.02 0.05 0.03 0.07
(0.03) (0.02) (0.03) (0.04) (0.03) (0.05) (0.03) (0.03) (0.04) (0.05) (0.04) (0.05) (0.05)
Is money already flowing? -0.24*** -0.10*** 0.14*** -0.24*** -0.03 0.21*** -0.18*** 0.13*** 0.31*** -0.00 0.06 0.07 0.17***
(0.02) (0.02) (0.03) (0.03) (0.03) (0.05) (0.03) (0.03) (0.04) (0.04) (0.04) (0.06) (0.05)
Is gas worth > a hospital? -0.04 0.18*** 0.21*** -0.03 0.20*** 0.23*** 0.02 0.27*** 0.23*** 0.01 0.06 0.03 0.03
(0.03) (0.02) (0.04) (0.04) (0.03) (0.05) (0.04) (0.02) (0.04) (0.05) (0.05) (0.06) (0.06)
...ten hospitals? 0.21*** 0.36*** 0.11*** 0.30*** 0.40*** 0.11*** 0.27*** 0.36*** 0.13*** 0.08* 0.06 0.01 0.02
54
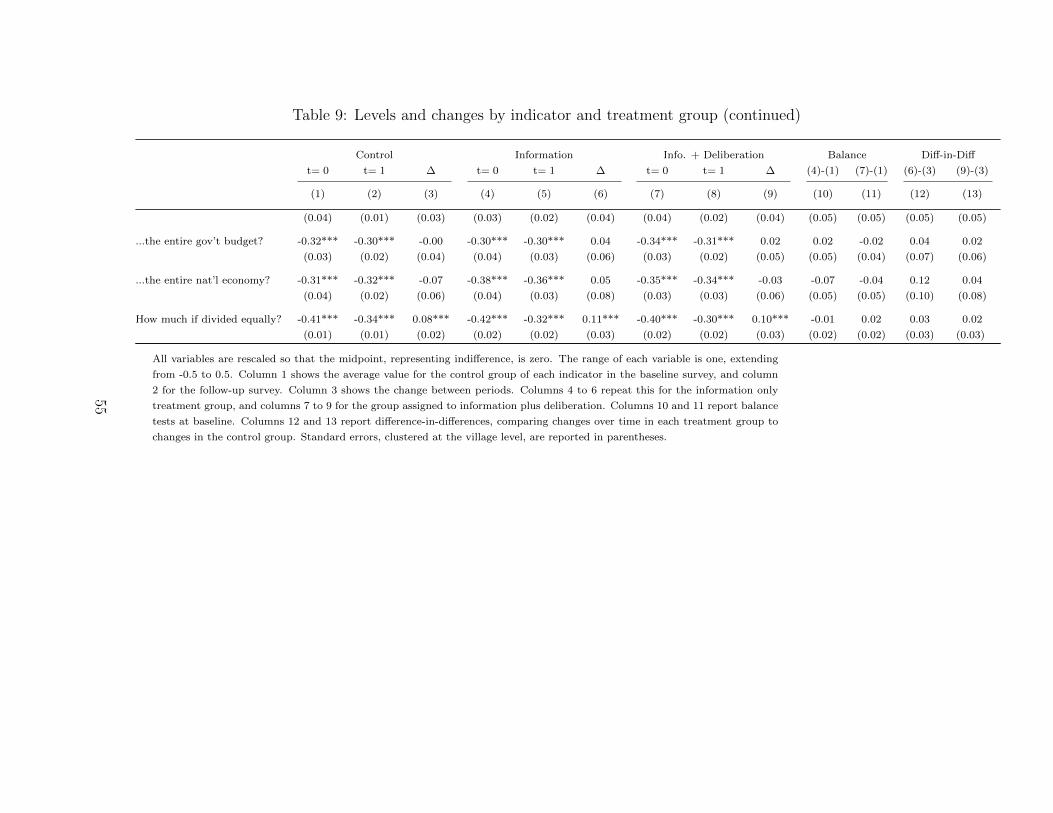
Table 9: Levels and changes by indicator and treatment group (continued)
Control Information Info. + Deliberation Balance Diff-in-Diff
t= 0 t= 1 ∆ t= 0 t= 1 ∆ t= 0 t= 1 ∆ (4)-(1) (7)-(1) (6)-(3) (9)-(3)
(1) (2) (3) (4) (5) (6) (7) (8) (9) (10) (11) (12) (13)
(0.04) (0.01) (0.03) (0.03) (0.02) (0.04) (0.04) (0.02) (0.04) (0.05) (0.05) (0.05) (0.05)
...the entire gov’t budget? -0.32*** -0.30*** -0.00 -0.30*** -0.30*** 0.04 -0.34*** -0.31*** 0.02 0.02 -0.02 0.04 0.02
(0.03) (0.02) (0.04) (0.04) (0.03) (0.06) (0.03) (0.02) (0.05) (0.05) (0.04) (0.07) (0.06)
...the entire nat’l economy? -0.31*** -0.32*** -0.07 -0.38*** -0.36*** 0.05 -0.35*** -0.34*** -0.03 -0.07 -0.04 0.12 0.04
(0.04) (0.02) (0.06) (0.04) (0.03) (0.08) (0.03) (0.03) (0.06) (0.05) (0.05) (0.10) (0.08)
How much if divided equally? -0.41*** -0.34*** 0.08*** -0.42*** -0.32*** 0.11*** -0.40*** -0.30*** 0.10*** -0.01 0.02 0.03 0.02
(0.01) (0.01) (0.02) (0.02) (0.02) (0.03) (0.02) (0.02) (0.03) (0.02) (0.02) (0.03) (0.03)
All variables are rescaled so that the midpoint, representing indifference, is zero. The range of each variable is one, extending
from -0.5 to 0.5. Column 1 shows the average value for the control group of each indicator in the baseline survey, and column
2 for the follow-up survey. Column 3 shows the change between periods. Columns 4 to 6 repeat this for the information only
treatment group, and columns 7 to 9 for the group assigned to information plus deliberation. Columns 10 and 11 report balance
tests at baseline. Columns 12 and 13 report difference-in-differences, comparing changes over time in each treatment group to
changes in the control group. Standard errors, clustered at the village level, are reported in parentheses.
55
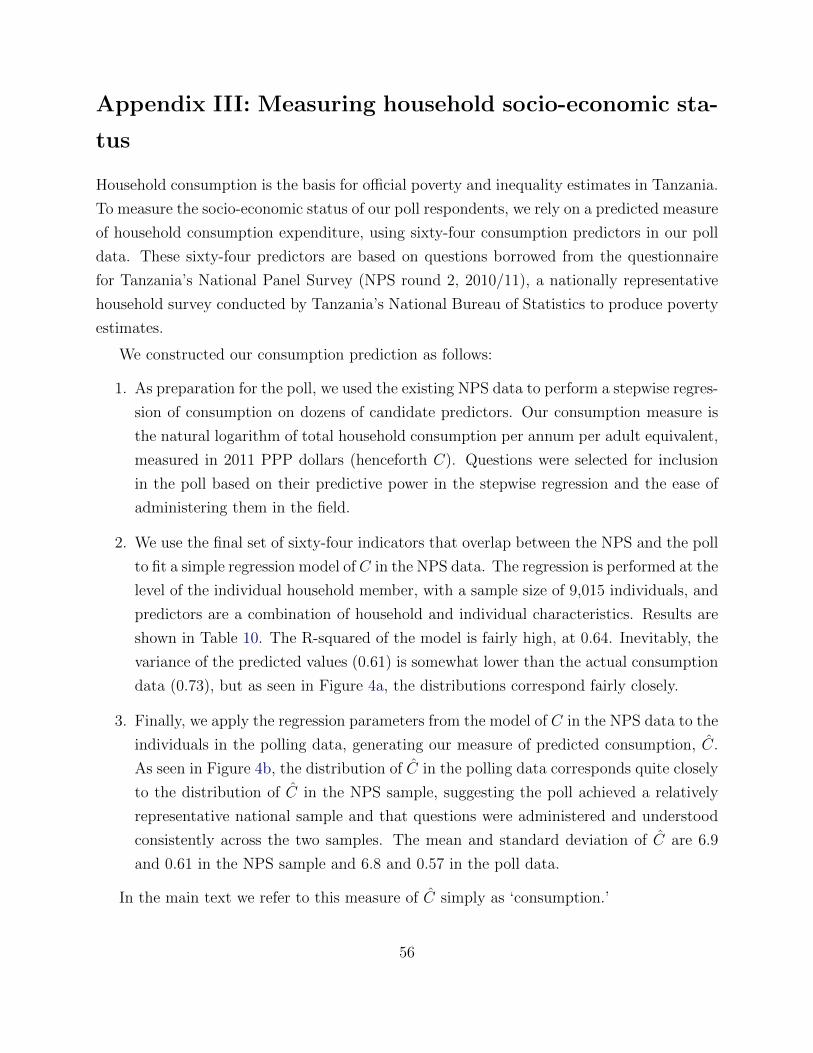
Appendix III: Measuring household socio-economic sta-
tus
Household consumption is the basis for official poverty and inequality estimates in Tanzania.
To measure the socio-economic status of our poll respondents, we rely on a predicted measure
of household consumption expenditure, using sixty-four consumption predictors in our poll
data. These sixty-four predictors are based on questions borrowed from the questionnaire
for Tanzania’s National Panel Survey (NPS round 2, 2010/11), a nationally representative
household survey conducted by Tanzania’s National Bureau of Statistics to produce poverty
estimates.
We constructed our consumption prediction as follows:
1. As preparation for the poll, we used the existing NPS data to perform a stepwise regres-
sion of consumption on dozens of candidate predictors. Our consumption measure is
the natural logarithm of total household consumption per annum per adult equivalent,
measured in 2011 PPP dollars (henceforth C). Questions were selected for inclusion
in the poll based on their predictive power in the stepwise regression and the ease of
administering them in the field.
2. We use the final set of sixty-four indicators that overlap between the NPS and the poll
to fit a simple regression model of C in the NPS data. The regression is performed at the
level of the individual household member, with a sample size of 9,015 individuals, and
predictors are a combination of household and individual characteristics. Results are
shown in Table 10. The R-squared of the model is fairly high, at 0.64. Inevitably, the
variance of the predicted values (0.61) is somewhat lower than the actual consumption
data (0.73), but as seen in Figure 4a, the distributions correspond fairly closely.
3. Finally, we apply the regression parameters from the model of C in the NPS data to the
individuals in the polling data, generating our measure of predicted consumption, C.
As seen in Figure 4b, the distribution of C in the polling data corresponds quite closely
to the distribution of C in the NPS sample, suggesting the poll achieved a relatively
representative national sample and that questions were administered and understood
consistently across the two samples. The mean and standard deviation of C are 6.9
and 0.61 in the NPS sample and 6.8 and 0.57 in the poll data.
In the main text we refer to this measure of C simply as ‘consumption.’
56
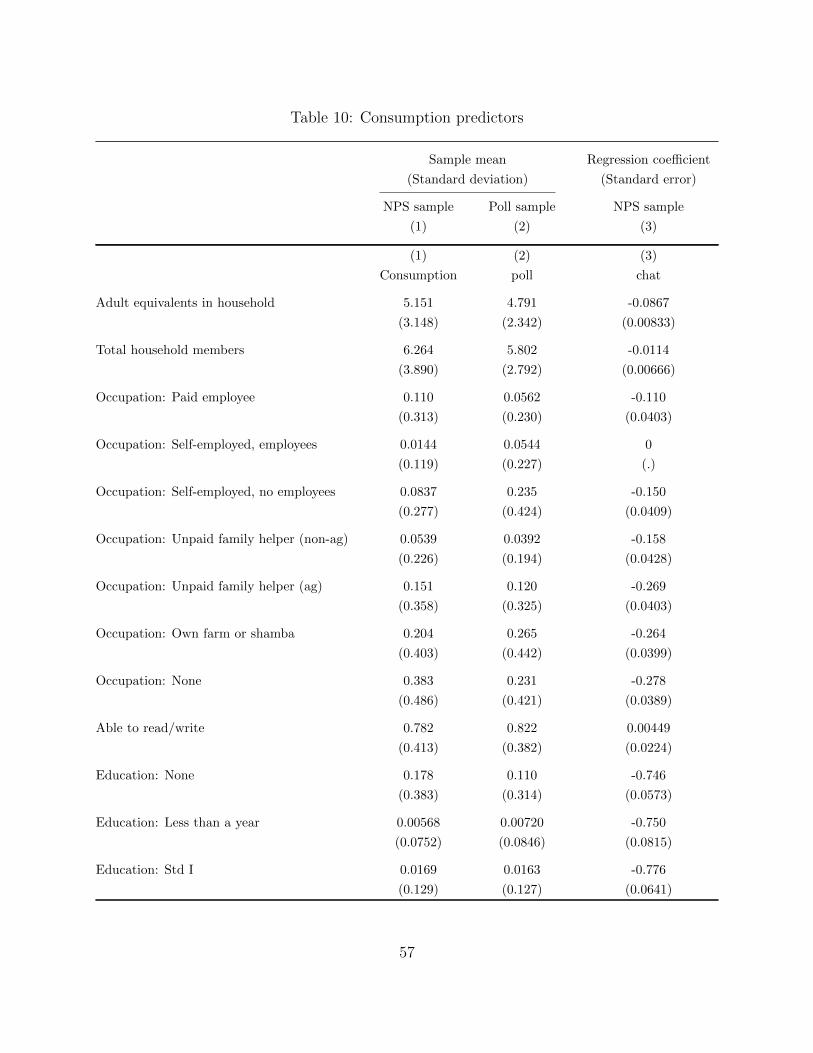
Table 10: Consumption predictors
Sample mean Regression coefficient
(Standard deviation) (Standard error)
NPS sample Poll sample NPS sample
(1) (2) (3)
(1) (2) (3)
Consumption poll chat
Adult equivalents in household 5.151 4.791 -0.0867
(3.148) (2.342) (0.00833)
Total household members 6.264 5.802 -0.0114
(3.890) (2.792) (0.00666)
Occupation: Paid employee 0.110 0.0562 -0.110
(0.313) (0.230) (0.0403)
Occupation: Self-employed, employees 0.0144 0.0544 0
(0.119) (0.227) (.)
Occupation: Self-employed, no employees 0.0837 0.235 -0.150
(0.277) (0.424) (0.0409)
Occupation: Unpaid family helper (non-ag) 0.0539 0.0392 -0.158
(0.226) (0.194) (0.0428)
Occupation: Unpaid family helper (ag) 0.151 0.120 -0.269
(0.358) (0.325) (0.0403)
Occupation: Own farm or shamba 0.204 0.265 -0.264
(0.403) (0.442) (0.0399)
Occupation: None 0.383 0.231 -0.278
(0.486) (0.421) (0.0389)
Able to read/write 0.782 0.822 0.00449
(0.413) (0.382) (0.0224)
Education: None 0.178 0.110 -0.746
(0.383) (0.314) (0.0573)
Education: Less than a year 0.00568 0.00720 -0.750
(0.0752) (0.0846) (0.0815)
Education: Std I 0.0169 0.0163 -0.776
(0.129) (0.127) (0.0641)
57
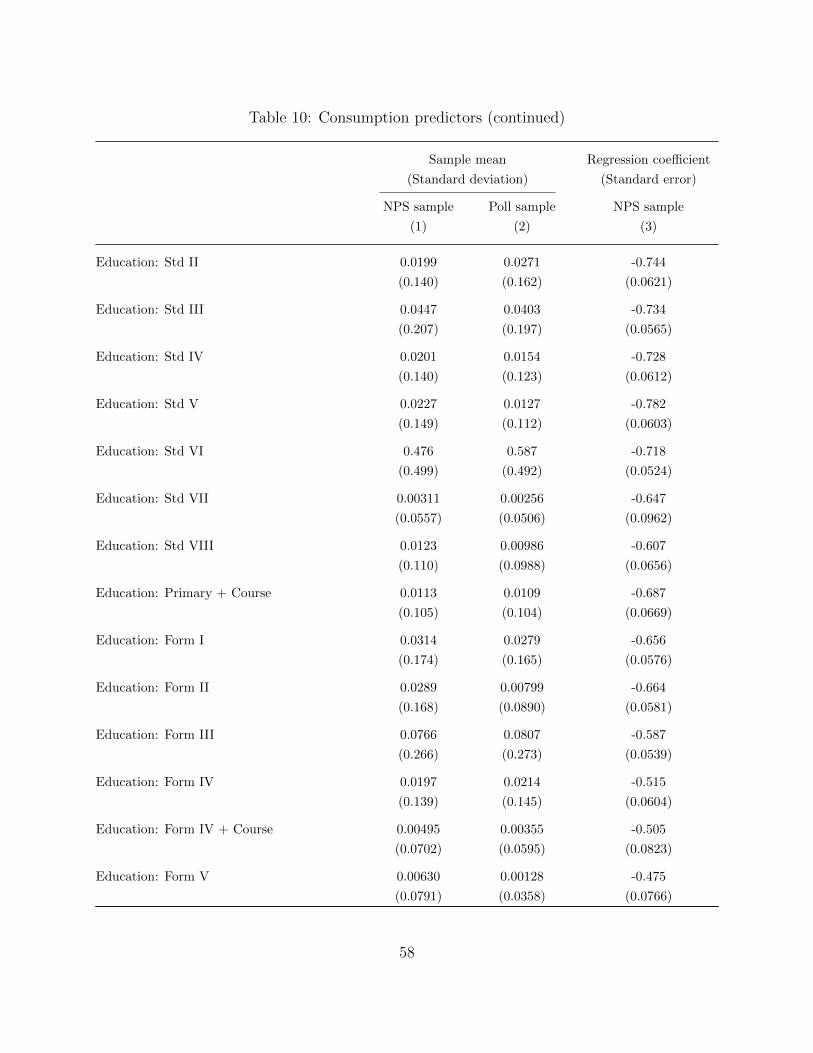
Table 10: Consumption predictors (continued)
Sample mean Regression coefficient
(Standard deviation) (Standard error)
NPS sample Poll sample NPS sample
(1) (2) (3)
Education: Std II 0.0199 0.0271 -0.744
(0.140) (0.162) (0.0621)
Education: Std III 0.0447 0.0403 -0.734
(0.207) (0.197) (0.0565)
Education: Std IV 0.0201 0.0154 -0.728
(0.140) (0.123) (0.0612)
Education: Std V 0.0227 0.0127 -0.782
(0.149) (0.112) (0.0603)
Education: Std VI 0.476 0.587 -0.718
(0.499) (0.492) (0.0524)
Education: Std VII 0.00311 0.00256 -0.647
(0.0557) (0.0506) (0.0962)
Education: Std VIII 0.0123 0.00986 -0.607
(0.110) (0.0988) (0.0656)
Education: Primary + Course 0.0113 0.0109 -0.687
(0.105) (0.104) (0.0669)
Education: Form I 0.0314 0.0279 -0.656
(0.174) (0.165) (0.0576)
Education: Form II 0.0289 0.00799 -0.664
(0.168) (0.0890) (0.0581)
Education: Form III 0.0766 0.0807 -0.587
(0.266) (0.273) (0.0539)
Education: Form IV 0.0197 0.0214 -0.515
(0.139) (0.145) (0.0604)
Education: Form IV + Course 0.00495 0.00355 -0.505
(0.0702) (0.0595) (0.0823)
Education: Form V 0.00630 0.00128 -0.475
(0.0791) (0.0358) (0.0766)
58
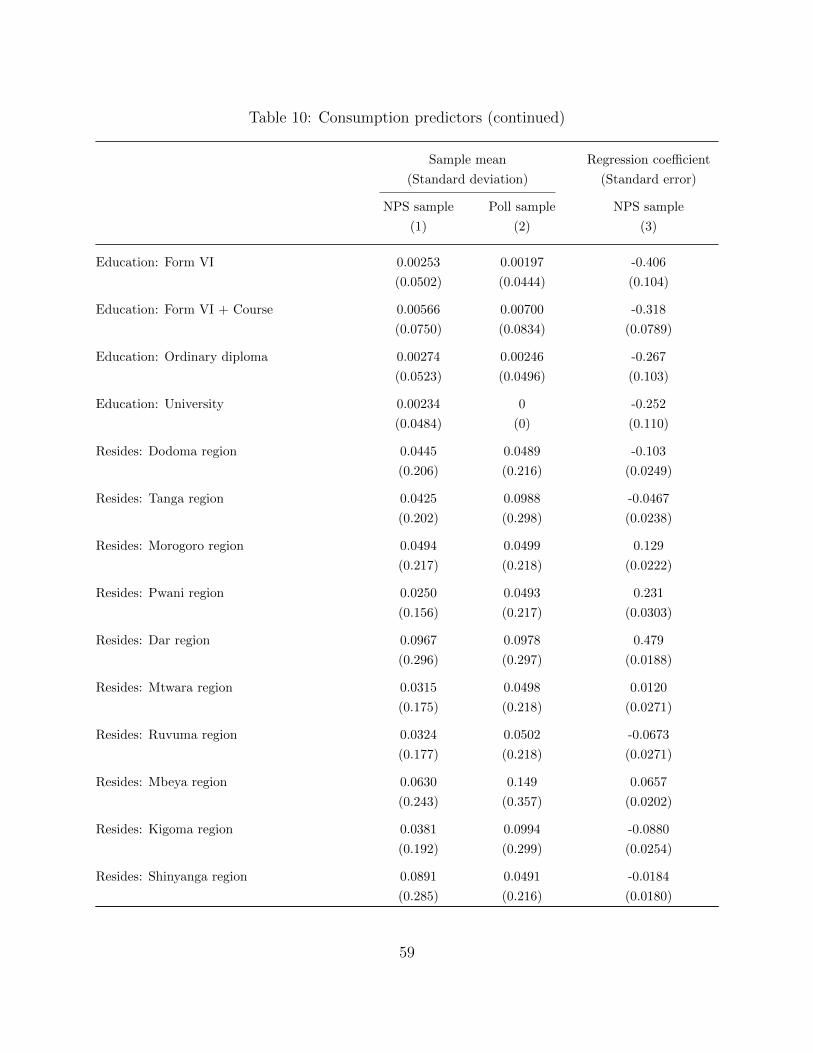
Table 10: Consumption predictors (continued)
Sample mean Regression coefficient
(Standard deviation) (Standard error)
NPS sample Poll sample NPS sample
(1) (2) (3)
Education: Form VI 0.00253 0.00197 -0.406
(0.0502) (0.0444) (0.104)
Education: Form VI + Course 0.00566 0.00700 -0.318
(0.0750) (0.0834) (0.0789)
Education: Ordinary diploma 0.00274 0.00246 -0.267
(0.0523) (0.0496) (0.103)
Education: University 0.00234 0 -0.252
(0.0484) (0) (0.110)
Resides: Dodoma region 0.0445 0.0489 -0.103
(0.206) (0.216) (0.0249)
Resides: Tanga region 0.0425 0.0988 -0.0467
(0.202) (0.298) (0.0238)
Resides: Morogoro region 0.0494 0.0499 0.129
(0.217) (0.218) (0.0222)
Resides: Pwani region 0.0250 0.0493 0.231
(0.156) (0.217) (0.0303)
Resides: Dar region 0.0967 0.0978 0.479
(0.296) (0.297) (0.0188)
Resides: Mtwara region 0.0315 0.0498 0.0120
(0.175) (0.218) (0.0271)
Resides: Ruvuma region 0.0324 0.0502 -0.0673
(0.177) (0.218) (0.0271)
Resides: Mbeya region 0.0630 0.149 0.0657
(0.243) (0.357) (0.0202)
Resides: Kigoma region 0.0381 0.0994 -0.0880
(0.192) (0.299) (0.0254)
Resides: Shinyanga region 0.0891 0.0491 -0.0184
(0.285) (0.216) (0.0180)
59
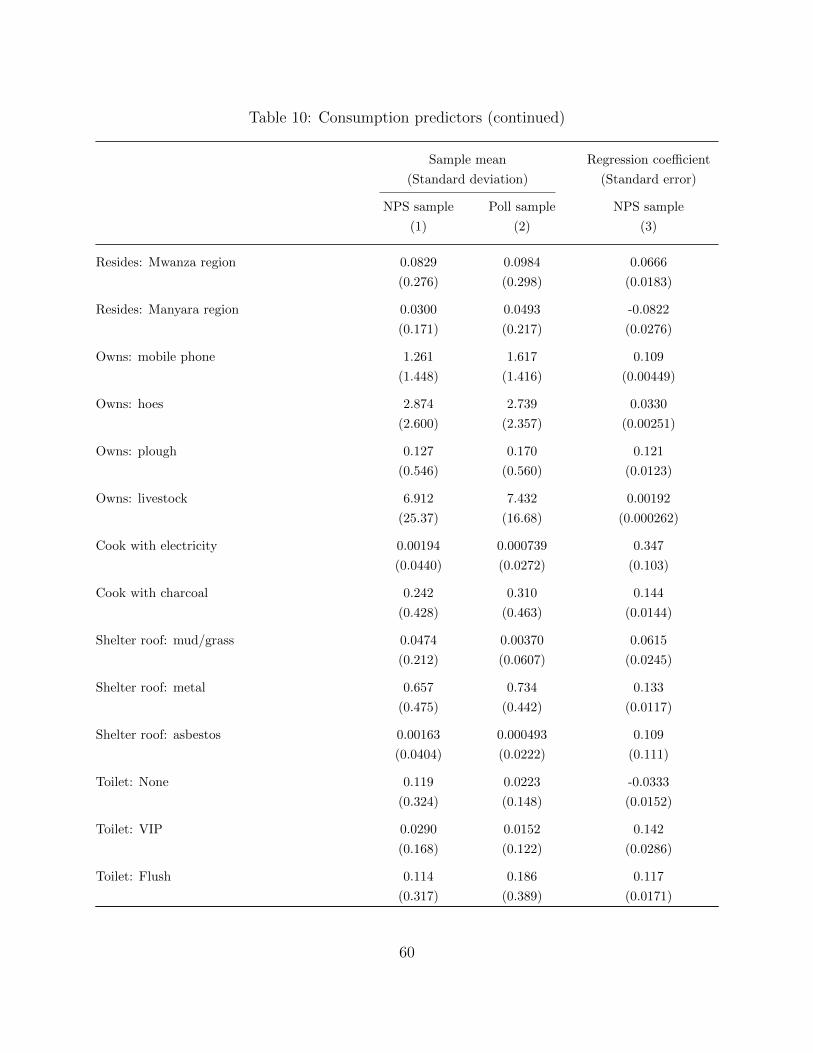
Table 10: Consumption predictors (continued)
Sample mean Regression coefficient
(Standard deviation) (Standard error)
NPS sample Poll sample NPS sample
(1) (2) (3)
Resides: Mwanza region 0.0829 0.0984 0.0666
(0.276) (0.298) (0.0183)
Resides: Manyara region 0.0300 0.0493 -0.0822
(0.171) (0.217) (0.0276)
Owns: mobile phone 1.261 1.617 0.109
(1.448) (1.416) (0.00449)
Owns: hoes 2.874 2.739 0.0330
(2.600) (2.357) (0.00251)
Owns: plough 0.127 0.170 0.121
(0.546) (0.560) (0.0123)
Owns: livestock 6.912 7.432 0.00192
(25.37) (16.68) (0.000262)
Cook with electricity 0.00194 0.000739 0.347
(0.0440) (0.0272) (0.103)
Cook with charcoal 0.242 0.310 0.144
(0.428) (0.463) (0.0144)
Shelter roof: mud/grass 0.0474 0.00370 0.0615
(0.212) (0.0607) (0.0245)
Shelter roof: metal 0.657 0.734 0.133
(0.475) (0.442) (0.0117)
Shelter roof: asbestos 0.00163 0.000493 0.109
(0.0404) (0.0222) (0.111)
Toilet: None 0.119 0.0223 -0.0333
(0.324) (0.148) (0.0152)
Toilet: VIP 0.0290 0.0152 0.142
(0.168) (0.122) (0.0286)
Toilet: Flush 0.114 0.186 0.117
(0.317) (0.389) (0.0171)
60
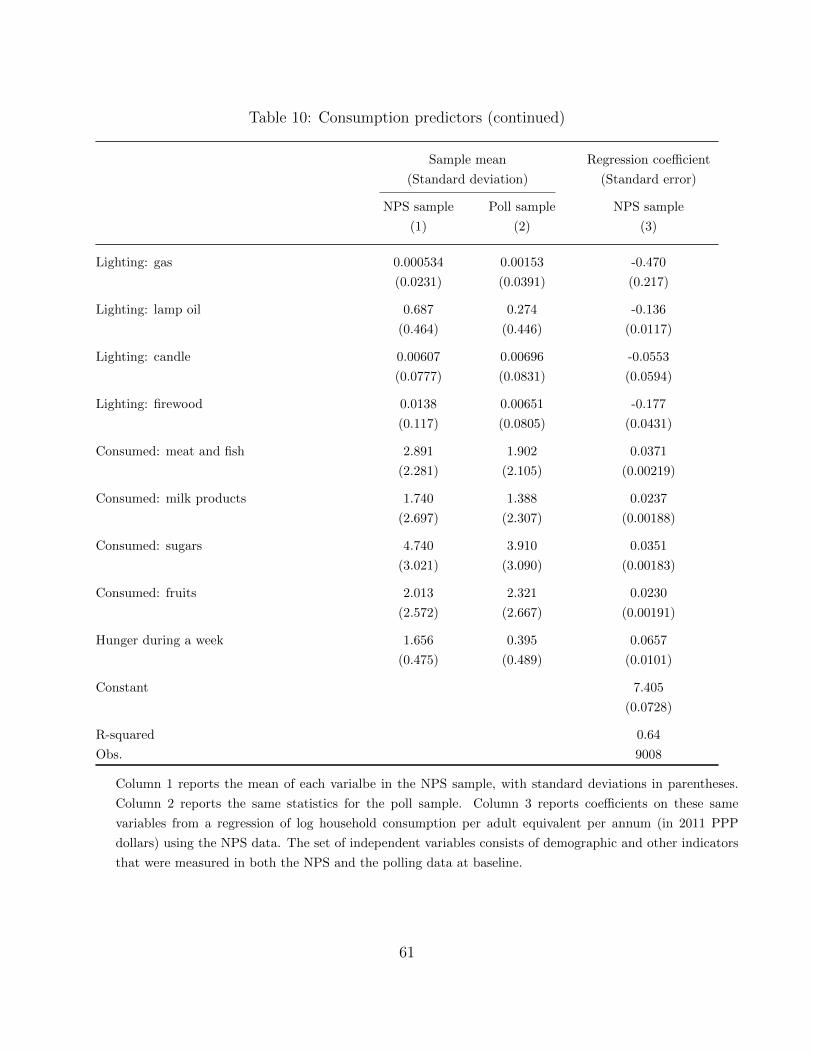
Table 10: Consumption predictors (continued)
Sample mean Regression coefficient
(Standard deviation) (Standard error)
NPS sample Poll sample NPS sample
(1) (2) (3)
Lighting: gas 0.000534 0.00153 -0.470
(0.0231) (0.0391) (0.217)
Lighting: lamp oil 0.687 0.274 -0.136
(0.464) (0.446) (0.0117)
Lighting: candle 0.00607 0.00696 -0.0553
(0.0777) (0.0831) (0.0594)
Lighting: firewood 0.0138 0.00651 -0.177
(0.117) (0.0805) (0.0431)
Consumed: meat and fish 2.891 1.902 0.0371
(2.281) (2.105) (0.00219)
Consumed: milk products 1.740 1.388 0.0237
(2.697) (2.307) (0.00188)
Consumed: sugars 4.740 3.910 0.0351
(3.021) (3.090) (0.00183)
Consumed: fruits 2.013 2.321 0.0230
(2.572) (2.667) (0.00191)
Hunger during a week 1.656 0.395 0.0657
(0.475) (0.489) (0.0101)
Constant 7.405
(0.0728)
R-squared 0.64
Obs. 9008
Column 1 reports the mean of each varialbe in the NPS sample, with standard deviations in parentheses.
Column 2 reports the same statistics for the poll sample. Column 3 reports coefficients on these same
variables from a regression of log household consumption per adult equivalent per annum (in 2011 PPP
dollars) using the NPS data. The set of independent variables consists of demographic and other indicators
that were measured in both the NPS and the polling data at baseline.
61
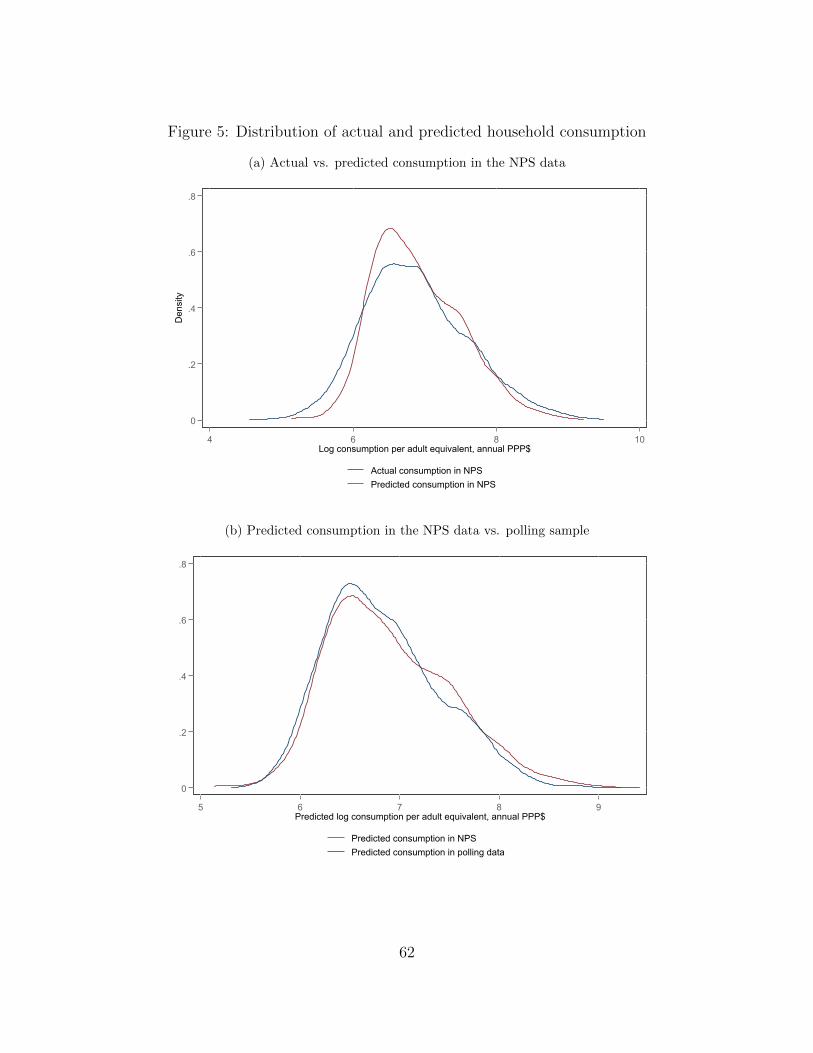
Figure 5: Distribution of actual and predicted household consumption
(a) Actual vs. predicted consumption in the NPS data
0
.2
.4
.6
.8
Den
sity
4 6 8 10Log consumption per adult equivalent, annual PPP$
Actual consumption in NPSPredicted consumption in NPS
(b) Predicted consumption in the NPS data vs. polling sample
0
.2
.4
.6
.8
5 6 7 8 9Predicted log consumption per adult equivalent, annual PPP$
Predicted consumption in NPSPredicted consumption in polling data
62