deliverable 3.3: laboratory test report - tut.fi · laboratory test report due date of deliverable:...
TRANSCRIPT
IDE4L is a project co-funded by the European Commission
Project no: TREN/07/FP6EN/S07.73164/038533 /CONS
Project acronym: IDE4L
Project title: IDEAL GRID FOR ALL
Deliverable 3.3:
Laboratory Test Report
Due date of deliverable: 01.05.2016
Actual submission date: 28.05.2016
Start date of project: 01.09.2013 Duration: 36 months
Authors: RWTH
Contributors: IREC, TUT, KTH
Project co-funded by the European Commission within the Seventh Framework Programme (2013-2016)
Dissemination level
PU Public
PP Restricted to other programme participants (including the Commission Services)
RE Restricted to a group specified by the consortium (including the Commission Services)
CO Confidential, only for members of the consortium (including the Commission Services)
IDE4L Deliverable 3.3
2 IDE4L is a project co-funded by the European Commission
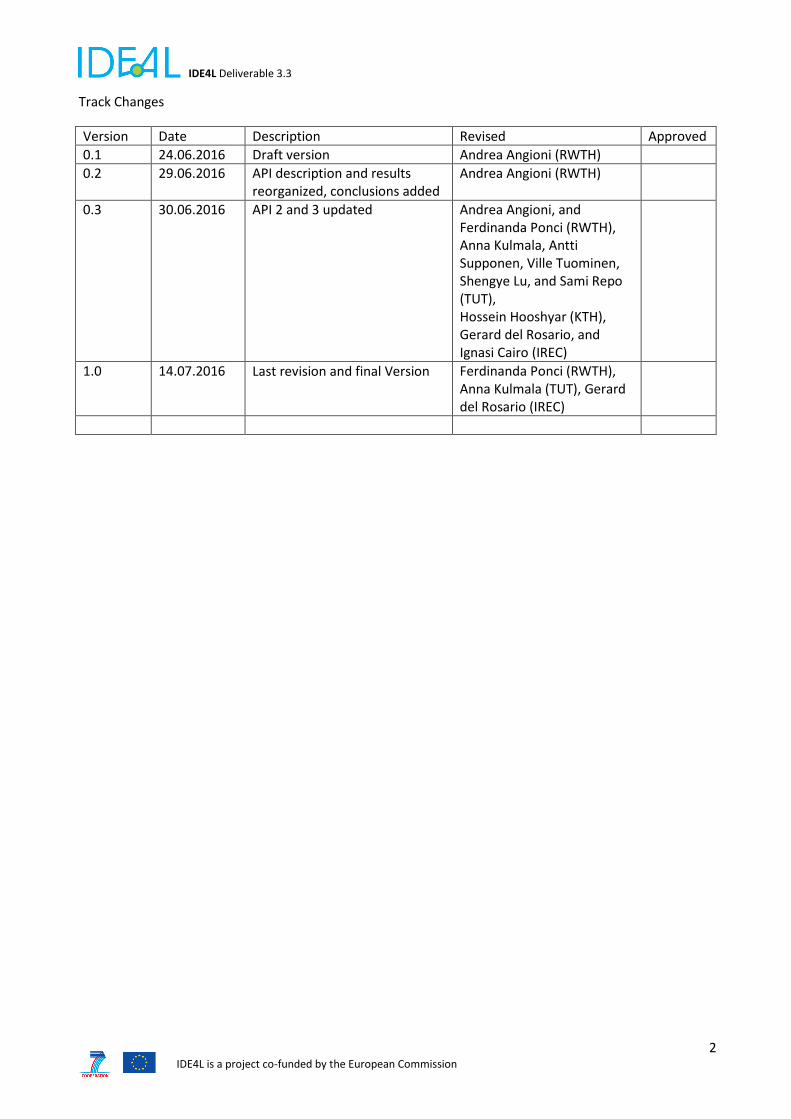
Track Changes
Version Date Description Revised Approved
0.1 24.06.2016 Draft version Andrea Angioni (RWTH)
0.2 29.06.2016 API description and results reorganized, conclusions added
Andrea Angioni (RWTH)
0.3 30.06.2016 API 2 and 3 updated Andrea Angioni, and Ferdinanda Ponci (RWTH), Anna Kulmala, Antti Supponen, Ville Tuominen, Shengye Lu, and Sami Repo (TUT), Hossein Hooshyar (KTH), Gerard del Rosario, and Ignasi Cairo (IREC)
1.0 14.07.2016 Last revision and final Version Ferdinanda Ponci (RWTH), Anna Kulmala (TUT), Gerard del Rosario (IREC)
IDE4L Deliverable 3.3
3 IDE4L is a project co-funded by the European Commission
TABLE OF CONTENTS:
Executive Summary ........................................................................................................................................... 5
1. Introduction ............................................................................................................................................... 6
2.1 Architecture introduction ........................................................................................................................ 6
2.2 Methodology for architecture evaluation ............................................................................................... 6
2.3 Evaluation framework (APIs, business requirements and SGAM portion assessed) .............................. 7
2. API complete description ........................................................................................................................ 12
API 1.Cost of architecture ............................................................................................................................ 12
API 2. Profit/savings due to automation architecture ................................................................................. 13
API 3. Increased generation capacity (hosting capacity) ............................................................................. 15
API 4. Actors innovation .............................................................................................................................. 15
API 5. Functions innovation ......................................................................................................................... 15
API 6. Information exchange innovation ..................................................................................................... 15
API 7. Communication infrastructure innovation: ...................................................................................... 16
API 8. Integration of existing standard ........................................................................................................ 16
API 9. Distribution and hierarchy of automation architecture .................................................................... 16
API 10. Scalability of automation architecture ............................................................................................ 16
API 11. Architecture robustness to communication issues ......................................................................... 16
API 12. Architecture robustness to automation actor failure ..................................................................... 17
API 13. Impact of distribution automation on the transmission system .................................................... 17
3. API Results ............................................................................................................................................... 18
API 1. Cost of IDE4L architecture ................................................................................................................. 18
API 2. Profit/savings due to automation architecture ................................................................................. 32
API 3. Increased generation capacity (hosting capacity) ............................................................................. 38
API 4. Actors innovation .............................................................................................................................. 42
API 5. Functions innovation ......................................................................................................................... 48
API 6. Information exchange innovation ..................................................................................................... 53
API 7. Communication infrastructure innovation........................................................................................ 58
API 8. Integration of existing standards: ..................................................................................................... 62
API 9. Distribution and hierarchy of automation architecture .................................................................... 64
API 10. Scalability of automation architecture ............................................................................................ 65
API 11. Architecture robustness to communication issues ......................................................................... 68
API 12. Architecture robustness to automation actor failure ..................................................................... 70

IDE4L Deliverable 3.3
4 IDE4L is a project co-funded by the European Commission
API 13. Impact of distribution automation on the transmission system .................................................... 72
Conclusions ...................................................................................................................................................... 76
References ....................................................................................................................................................... 77
IDE4L Deliverable 3.3
5 IDE4L is a project co-funded by the European Commission
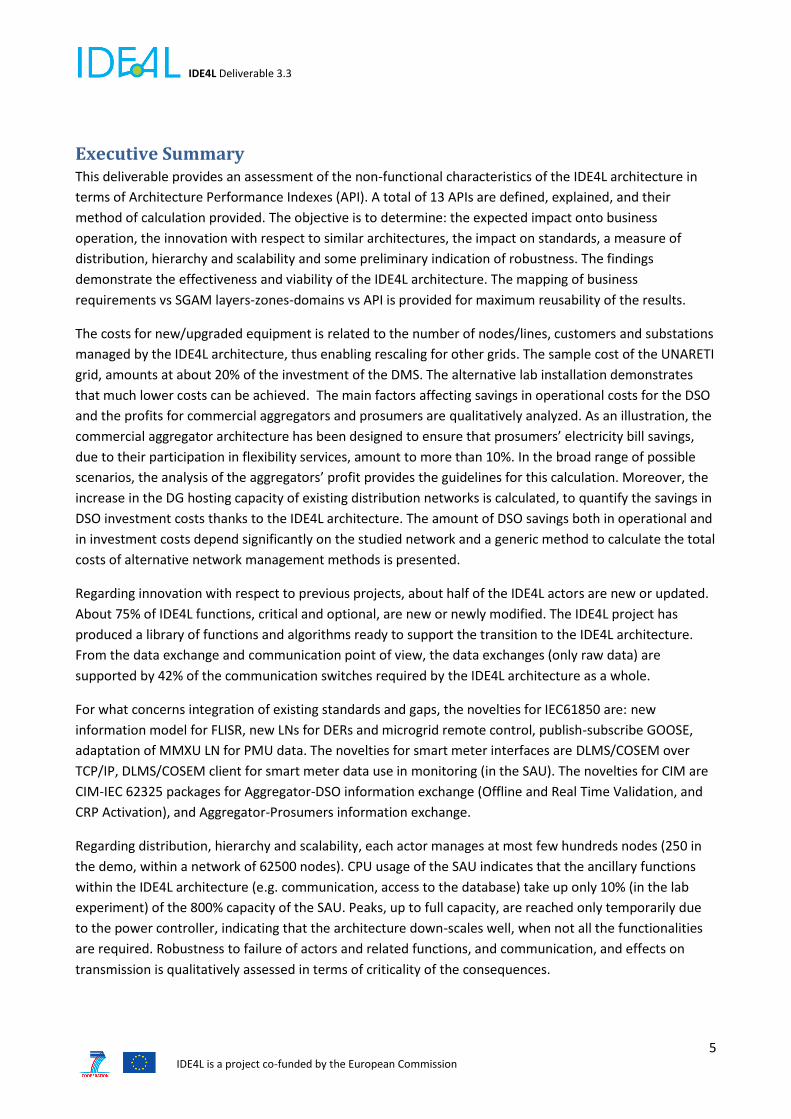
Executive Summary This deliverable provides an assessment of the non-functional characteristics of the IDE4L architecture in
terms of Architecture Performance Indexes (API). A total of 13 APIs are defined, explained, and their
method of calculation provided. The objective is to determine: the expected impact onto business
operation, the innovation with respect to similar architectures, the impact on standards, a measure of
distribution, hierarchy and scalability and some preliminary indication of robustness. The findings
demonstrate the effectiveness and viability of the IDE4L architecture. The mapping of business
requirements vs SGAM layers-zones-domains vs API is provided for maximum reusability of the results.
The costs for new/upgraded equipment is related to the number of nodes/lines, customers and substations
managed by the IDE4L architecture, thus enabling rescaling for other grids. The sample cost of the UNARETI
grid, amounts at about 20% of the investment of the DMS. The alternative lab installation demonstrates
that much lower costs can be achieved. The main factors affecting savings in operational costs for the DSO
and the profits for commercial aggregators and prosumers are qualitatively analyzed. As an illustration, the
commercial aggregator architecture has been designed to ensure that prosumers’ electricity bill savings,
due to their participation in flexibility services, amount to more than 10%. In the broad range of possible
scenarios, the analysis of the aggregators’ profit provides the guidelines for this calculation. Moreover, the
increase in the DG hosting capacity of existing distribution networks is calculated, to quantify the savings in
DSO investment costs thanks to the IDE4L architecture. The amount of DSO savings both in operational and
in investment costs depend significantly on the studied network and a generic method to calculate the total
costs of alternative network management methods is presented.
Regarding innovation with respect to previous projects, about half of the IDE4L actors are new or updated.
About 75% of IDE4L functions, critical and optional, are new or newly modified. The IDE4L project has
produced a library of functions and algorithms ready to support the transition to the IDE4L architecture.
From the data exchange and communication point of view, the data exchanges (only raw data) are
supported by 42% of the communication switches required by the IDE4L architecture as a whole.
For what concerns integration of existing standards and gaps, the novelties for IEC61850 are: new
information model for FLISR, new LNs for DERs and microgrid remote control, publish-subscribe GOOSE,
adaptation of MMXU LN for PMU data. The novelties for smart meter interfaces are DLMS/COSEM over
TCP/IP, DLMS/COSEM client for smart meter data use in monitoring (in the SAU). The novelties for CIM are
CIM-IEC 62325 packages for Aggregator-DSO information exchange (Offline and Real Time Validation, and
CRP Activation), and Aggregator-Prosumers information exchange.
Regarding distribution, hierarchy and scalability, each actor manages at most few hundreds nodes (250 in
the demo, within a network of 62500 nodes). CPU usage of the SAU indicates that the ancillary functions
within the IDE4L architecture (e.g. communication, access to the database) take up only 10% (in the lab
experiment) of the 800% capacity of the SAU. Peaks, up to full capacity, are reached only temporarily due
to the power controller, indicating that the architecture down-scales well, when not all the functionalities
are required. Robustness to failure of actors and related functions, and communication, and effects on
transmission is qualitatively assessed in terms of criticality of the consequences.

IDE4L Deliverable 3.3
6 IDE4L is a project co-funded by the European Commission
As an example of the broader impact of applications within the IDE4L architecture, the attachment to this
deliverable (Attachment to D3.3) demonstrate the improvement of power quality.
1. Introduction This chapter provides a brief overview of IDE4L architecture, and the methodology for its assessment. The
synthetic indexes are presented, together with the business requirements that they demonstrate.
2.1 Architecture introduction The IDE4L architecture has been developed from use cases and conceptualized in deliverable D3.1 [1].
Consequently the SGAM architecture has been implemented in D3.2 [2]. The SGAM architecture [4], [5], [6]
leverages on a 3D structure where the x and y axis are the zones and domains of the smart grid plane and
the z axis are the five layers (business, function, component, information and communication layers).
Figure 1 The SGAM architecture.
Each layer has been characterized following the SGAM model and further information have been added in
order to narrow the gap with the implementation phase in demonstration. The information exchanges have
been specified following IEC 61850 and CIM standards. Communication requirements have been classified
following the directions of standard IEC 61850-5 and the use case specifications. A generic set of interfaces
and the database structure for Substation Automation Unit (SAU), Intelligent Electronic Devices (IEDs) and
Distribution Management System (DMS) have been defined in order to satisfy the requirements for
information exchange and storage of the use cases. The architecture was specified up to a “technology
neutral” level, starting from which, several installations/implementation may be applied.
2.2 Methodology for architecture evaluation The scope of the current deliverable is the evaluation of the architecture as a whole or in form of 3D
subsections (subset of the aforementioned “architecture space” defined by axes x,y,z) . With “evaluation of
architecture” the following is considered:
Comparison of IDE4L architecture with state of the art for automation architectures, and other’s EU
projects on smart grids;
Evaluation of robustness of the architecture vs failure of communication and components;

IDE4L Deliverable 3.3
7 IDE4L is a project co-funded by the European Commission
Evaluation of the initial investment for implementation of the automation architecture and the
profit/savings.
The metrics chosen to evaluate the architecture are here named Architecture Performance Indexes (APIs).
APIs may be obtained from:
observation/calculation of parameters, topologies and generic features of the SGAM architecture
model;
merging of key performance indexes from WP7 field and lab demonstrations (defined in deliverable
7.1 [3]);
Combination of the previous two points.
Eventually, based on the API results, conclusions on the effectiveness of the architecture for automation,
the scalability, robustness and novelties are drawn.
The API concept has been developed in IDE4L with the following intent: “Understanding what are the
business actors in IDE4L architecture and developing indexes to tests how well the architecture enable their
business goals”. In a nutshell, business actors, such as Distribution System Operator (DSO), prosumers,
regulators have various goals in automation of distribution grids, such as reducing power quality issue,
increase renewable energy installed power, reducing average cost of energy, that may be enabled or
enhanced through the IDE4L architecture; the APIs are defined in order to understand how well the
architecture may satisfy such goals.
Therefore the steps for the evaluation of the architecture are the following:
Quantitative definition of applicable metrics: API concept
Business requirements mapped to API
Description of the part of architecture tested with API
In the phase of evaluation however the following considerations have to be done.
IDE4L architecture defines requirements and not technologies. The technologies (hardware,
software and infrastructures) chosen to implement the architecture may significantly affect the
investment and therefore the payback period.
Different grids may benefit differently from the IDE4L architecture. For instance strong networks with few renewable energy resources, may not need power or voltage control. Therefore the advantages of the IDE4L architecture may not be quantified unambiguously for all distribution grids. This deliverable aims, instead, at defining which parts of architecture are required for each type of use cases, so that the business actors may select actors/functions that are required for their case. This point highlighted also the need to standardize indexes to define uniquely the power networks, collecting in synthetic numeric values information on topology, lines’ parameters and load/generation penetration. Such indexes may permit to assign a certain grid index to certain architecture requirements (such as control or monitoring requirements). This deliverable also presents a generic method to determine whether the IDE4L architecture is advantageous in a particular network or not.
2.3 Evaluation framework (APIs, business requirements and SGAM portion
assessed) In this chapter the APIs are presented with a “short description”, consequently the main business actors
and stakeholders for IDE4L architecture are then defined and mapped to APIs. Eventually the parts of the
IDE4L Deliverable 3.3
8 IDE4L is a project co-funded by the European Commission
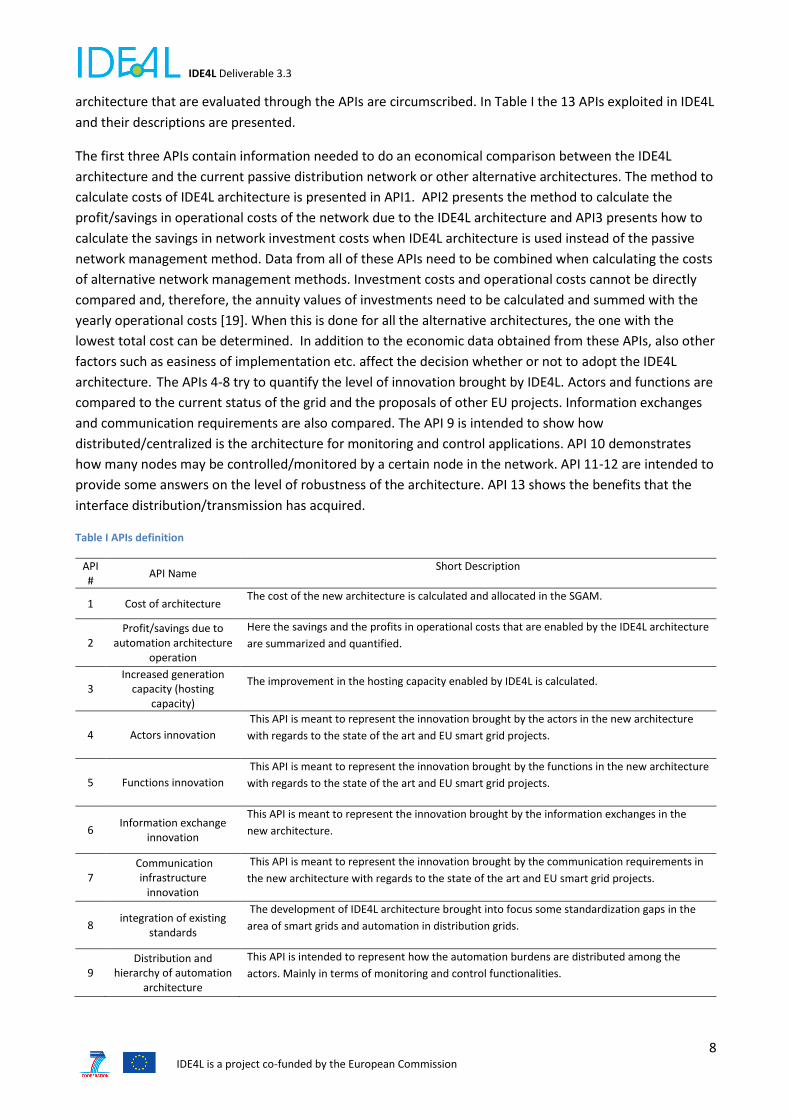
architecture that are evaluated through the APIs are circumscribed. In Table I the 13 APIs exploited in IDE4L
and their descriptions are presented.
The first three APIs contain information needed to do an economical comparison between the IDE4L
architecture and the current passive distribution network or other alternative architectures. The method to
calculate costs of IDE4L architecture is presented in API1. API2 presents the method to calculate the
profit/savings in operational costs of the network due to the IDE4L architecture and API3 presents how to
calculate the savings in network investment costs when IDE4L architecture is used instead of the passive
network management method. Data from all of these APIs need to be combined when calculating the costs
of alternative network management methods. Investment costs and operational costs cannot be directly
compared and, therefore, the annuity values of investments need to be calculated and summed with the
yearly operational costs [19]. When this is done for all the alternative architectures, the one with the
lowest total cost can be determined. In addition to the economic data obtained from these APIs, also other
factors such as easiness of implementation etc. affect the decision whether or not to adopt the IDE4L
architecture. The APIs 4-8 try to quantify the level of innovation brought by IDE4L. Actors and functions are
compared to the current status of the grid and the proposals of other EU projects. Information exchanges
and communication requirements are also compared. The API 9 is intended to show how
distributed/centralized is the architecture for monitoring and control applications. API 10 demonstrates
how many nodes may be controlled/monitored by a certain node in the network. API 11-12 are intended to
provide some answers on the level of robustness of the architecture. API 13 shows the benefits that the
interface distribution/transmission has acquired.
Table I APIs definition
API #
API Name Short Description
1 Cost of architecture The cost of the new architecture is calculated and allocated in the SGAM.
2 Profit/savings due to
automation architecture operation
Here the savings and the profits in operational costs that are enabled by the IDE4L architecture
are summarized and quantified.
3 Increased generation
capacity (hosting capacity)
The improvement in the hosting capacity enabled by IDE4L is calculated.
4 Actors innovation
This API is meant to represent the innovation brought by the actors in the new architecture
with regards to the state of the art and EU smart grid projects.
5 Functions innovation
This API is meant to represent the innovation brought by the functions in the new architecture
with regards to the state of the art and EU smart grid projects.
6 Information exchange
innovation
This API is meant to represent the innovation brought by the information exchanges in the
new architecture.
7 Communication
infrastructure innovation
This API is meant to represent the innovation brought by the communication requirements in
the new architecture with regards to the state of the art and EU smart grid projects.
8 integration of existing
standards
The development of IDE4L architecture brought into focus some standardization gaps in the
area of smart grids and automation in distribution grids.
9 Distribution and
hierarchy of automation architecture
This API is intended to represent how the automation burdens are distributed among the
actors. Mainly in terms of monitoring and control functionalities.

IDE4L Deliverable 3.3
9 IDE4L is a project co-funded by the European Commission
10 Scalability of
automation architecture
This API is intended to evaluate how the architecture performs depending on the number of
nodes to be aggregated in monitoring use cases and coordinate in control use cases.
11 Architecture robustness
to communication issues
The requirements for communication exchange in IDE4L architecture are evaluated in order to
understand which communication link requires more investments for reliability.
12 Architecture robustness
to component failure
This API aims at evaluating the effect of failure of hardware or software components which
perform monitoring, control or protection functions.
13 Impact of distribution
automation on the transmission system
This API evaluates the impact of the information exchange between DSOs and TSOs, as well as
the effect on transmission of the more efficient automation strategies in distribution.
The study on the business requirements on IDE4L architecture has been structured starting from: the
definition of business actors, which may have interest or may exploit IDE4L architecture, the evaluation of
the business goals connected to the topic of smart grids and the constraints (electrical and regulatory) that
they have to respect. For instance (with reference to Table II), b2 has the same business goal as b1 but a
different constraint. This makes business requirements b1 and b2 different. Eventually it is possible to
realize the mapping of such business goals onto the aforementioned APIs. In Table II the business
requirements on architecture are detailed in terms of business actors, goals and constraints. The business
actors are divided between the ones taking actions and participating to automation (prosumers, DSOs,
TSOs, retailers and commercial aggregator), already defined and characterized in the business layer in D3.2
[2], and the ones having more indirect impact (EU community, commission and regulators). The business
goals are connected to the purchase of energy and flexibility, monitoring the network to identify critical
situations, reducing CO2 emissions and reducing energy costs. Constraints are the quality of services and
the limit of the number of control operation (over a certain number the control components degrades their
performances or fails).
Table II Business requirements
Business requirement #
Business actor Business goal
Constraints
b1
Prosumer
Maximize income from buying/selling energy
Acceptable PQ at asset connection; this includes PQ that has direct effect (supply interruptions) or indirect 8e.g. damage of asset due to interharmonics)
b2 Maximum number of control operations
b3
DSO
Monitor/control grid to avoid damages due to congestions.
Acceptable PQ at asset connection
b4 Maximum number of control operations
b5 Monitor/control grid to avoid damages due to poor PQ (this include damage at its own assets and at the assets of customers that bring indirect costs due to fines)
Acceptable PQ at asset connection
b6
Maximum number of control operations
b7 Monitor PQ where required by regulation
b8 TSO
Monitor/control grid to avoid damages from PQ.
Acceptable PQ at asset connection
b9 Maximum number of control operations
b10 Monitor PQ where required by regulation
b11 Retailer/CA Maximize income from energy portfolio Maximum number of control operations
b12 Service Provider
Sell forecasts of market price, weather, generation etc.
b13
EU Community
Reduce impact of pollution and CO2 emissions due to energy conversion
Acceptable PQ at asset connection and robustness of the system
IDE4L Deliverable 3.3
10 IDE4L is a project co-funded by the European Commission
b14 Lower price of electrical energy (considering the impact on the purchase of goods)
Acceptable PQ at asset connection and robustness of the system
b15 EU commission and regulators
Bring significance innovation with automation architecture
Acceptable PQ at asset connection and robustness of the system
b16 Optimize investments and costs of the distribution network
Acceptable PQ at asset connection and robustness of the system
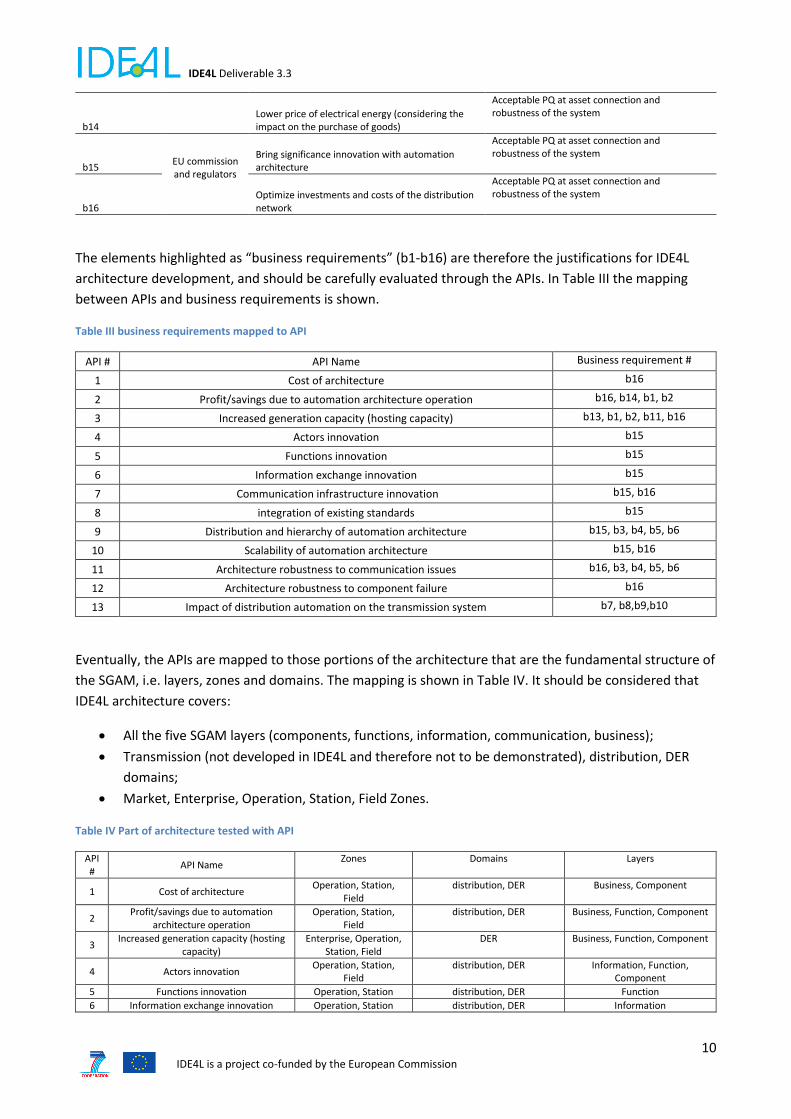
The elements highlighted as “business requirements” (b1-b16) are therefore the justifications for IDE4L
architecture development, and should be carefully evaluated through the APIs. In Table III the mapping
between APIs and business requirements is shown.
Table III business requirements mapped to API
API # API Name Business requirement #
1 Cost of architecture b16
2 Profit/savings due to automation architecture operation b16, b14, b1, b2
3 Increased generation capacity (hosting capacity) b13, b1, b2, b11, b16
4 Actors innovation b15
5 Functions innovation b15
6 Information exchange innovation b15
7 Communication infrastructure innovation b15, b16
8 integration of existing standards b15
9 Distribution and hierarchy of automation architecture b15, b3, b4, b5, b6
10 Scalability of automation architecture b15, b16
11 Architecture robustness to communication issues b16, b3, b4, b5, b6
12 Architecture robustness to component failure b16
13 Impact of distribution automation on the transmission system b7, b8,b9,b10
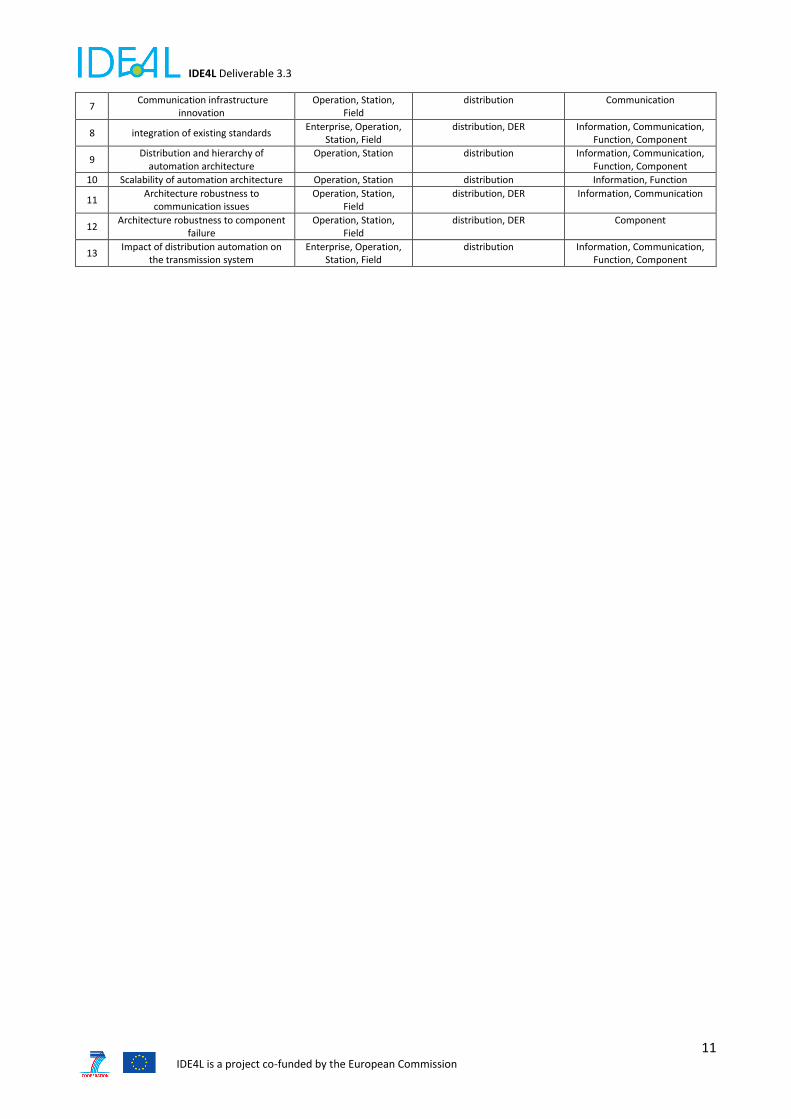
Eventually, the APIs are mapped to those portions of the architecture that are the fundamental structure of
the SGAM, i.e. layers, zones and domains. The mapping is shown in Table IV. It should be considered that
IDE4L architecture covers:
All the five SGAM layers (components, functions, information, communication, business);
Transmission (not developed in IDE4L and therefore not to be demonstrated), distribution, DER
domains;
Market, Enterprise, Operation, Station, Field Zones.
Table IV Part of architecture tested with API
API #
API Name Zones Domains Layers
1 Cost of architecture Operation, Station,
Field distribution, DER Business, Component
2 Profit/savings due to automation
architecture operation Operation, Station,
Field distribution, DER Business, Function, Component
3 Increased generation capacity (hosting
capacity) Enterprise, Operation,
Station, Field DER Business, Function, Component
4 Actors innovation Operation, Station,
Field distribution, DER Information, Function,
Component
5 Functions innovation Operation, Station distribution, DER Function
6 Information exchange innovation Operation, Station distribution, DER Information
IDE4L Deliverable 3.3
11 IDE4L is a project co-funded by the European Commission
7 Communication infrastructure
innovation Operation, Station,
Field distribution Communication
8 integration of existing standards Enterprise, Operation,
Station, Field distribution, DER Information, Communication,
Function, Component
9 Distribution and hierarchy of
automation architecture Operation, Station distribution Information, Communication,
Function, Component
10 Scalability of automation architecture Operation, Station distribution Information, Function
11 Architecture robustness to
communication issues Operation, Station,
Field distribution, DER Information, Communication
12 Architecture robustness to component
failure Operation, Station,
Field distribution, DER Component
13 Impact of distribution automation on
the transmission system Enterprise, Operation,
Station, Field distribution Information, Communication,
Function, Component
IDE4L Deliverable 3.3
12 IDE4L is a project co-funded by the European Commission
2. API complete description In this chapter the APIs are presented and fully described and their use and interpretation provided. Their
description includes the data collected, the calculations and the assumption required. The API results
(numerical, tables etc.) and details of the calculations are reported in Section 3.
API 1.Cost of architecture IDE4L architecture defines actors, functions, communication requirements and information exchanges that
could be implemented through different technology instances. Indeed IDE4L architecture could be
considered flexible under the following point of views:
The actors may be implemented in several hardware and software instances when they satisfy the
requirements for interfaces, databases and algorithms of the IDE4L actors.
The communication infrastructure may exploit different communication media and protocols to
deliver a certain piece of information. It only requires to satisfy the communication requirements
such as bandwidth and maximum delay
The number and type of measurement devices as well as control unit may vary in a certain range
without compromising the effectiveness of the use cases. However a minimum number of
measurement/control units may be needed depending on the algorithm installed (e.g. some
algorithm of state estimation may be more sensitive than others in the number of measurement
devices and similarly power control algorithms may need a minimum number of control unit in
each controlled area).
In a nutshell IDE4L defines functions, actors, information exchanges and their requirements; the developers
may decide their optimal implementation in the field. However, without defining the technology instances
it is complicated to define a total cost. Nevertheless, in the following section a tentative on the evaluation
of IDE4L automation cost is performed clarifying the assumptions done with regards to the previous three
points. The intent is to map clearly the cost to some indexes, partially quantitatively and partially
qualitatively, in order to allow heterogeneous implementations, to determine the total cost in a similar
way.
The qualitative mapping, allocates the components of the IDE4L architecture to:
Business actors that manage or own the components or in general the automation actors. For
instances IEDs are owned/managed by DSOs, Control Centers by DSO and Home Energy
Management Systems (HEMSs) by Prosumers.
Object classes, that is the definition of components as computers, devices, software or human
machine interfaces.
Domains and Zones of Smart Grid Plane. For instance which components belong to distribution or
DER domains and which components belong to station or operation zones.
Role in the architecture. Critical, if it is specifically required for the accomplishments of at least one
use case); optional, if it allows to improve the performance of at least one use case but is not
strictly necessary; supplementary, if it has been allowed into IDE4L architecture, because already
IDE4L Deliverable 3.3
13 IDE4L is a project co-funded by the European Commission
present from previous automation systems; e.g., SCADA systems or management of systems that
are not necessary related to smart grid, e.g. Automatic meter management that are normally
exploited for energy bills).
Use cases in which the components may take part. The checking of the role of the actors may be
therefore extended and detailed to use case level.
Costs are then allocated among the aforementioned cross-domains and therefore may be mapped on
various distribution networks, not just the demos of IDE4L.
The steps for a proper mapping are the following: select a business actor, select the components associated
to it, given its business role. For instance, if a DSO wants to replicate the part of architecture included in
Distribution and DERs domains and operation, station and field zone, it may consider the same cost
associated to the components included in IDE4L in the corresponding Smart Grid “surface” and apply to its
own network. Among the IDE4L components thus identified, the business actor may select which object
classes it wants to install or to update, and consider whether to install only the critical ones, the optional
ones or also the supplementary components. The business actor may also decide which use cases to
implement, and consequently select the required components. At this point, the business actor may have a
preliminary knowledge of the components to be be updated/installed and can go forward to the
quantitative mapping.
The quantitative mapping allocates the components of the IDE4L architecture to ranges included between a
minimum and maximum number of
Electrical nodes or alternatively electrical feeders
Customers (or more in general prosumers)
Electrical substations
In this way the business actor, may obtain a significant evaluation of the costs based on the number of
nodes/lines, customers or substations managed.
API 2. Profit/savings due to automation architecture The architecture is expected to bring profits to the Commercial Aggregators (CAs) and Prosumers and
savings to DSOs and Prosumers. Such evaluation is intended to provide an understanding on how the costs
of the architecture may be paid over the next years.
The analysis provided here focuses on two aspects of the grid operation with the IDE4L Architecture: the
contribution to congestion management of the flexibility activated by CAs, and the Secondary Control.
Contribution of flexibility act ivated by CAs
In order to provide an evaluation of the profit/savings due to the contribution of flexibility from CA to the
congestion management scheme, two network cases have been defined for a peak load winter scenario
(UNARETI MV and LV networks) in [20] and have also been considered in the methodology to estimate
API2:

IDE4L Deliverable 3.3
14 IDE4L is a project co-funded by the European Commission
Table V Main differences among scenarios and cases.
Winter scenario
Base case CA No
DSO Market Agent
Curtailed users MV users
IDE4L case CA Yes
DSO Market Agent
Curtailed users MV users + aggregated LV users Performing and non-performing emulated microgrid
As shown in Table V, the base case assumes that the grid operation architecture does not allow CAs
participate in the Market Agent (see [21] for more details), i.e. only units and loads directly connected to
MV nodes can activate CRP flexibility. On the other hand, the IDE4L case assumes that the full IDE4L
architecture is implemented, thus not only MV-connected units and loads participate but also CAs.
The analysis is based on a new metric which calculates the main actors’ profits or savings caused by the
activation of flexibility from CAs by the MA, i.e. (i) CAs, (ii) Prosumers and (iii) DSOs. In all cases, the metric
used involves the comparison of the profit/savings in the “IDE4L case” and the “base case” for all the three
actors:
Commercial Aggregators. Since no CAs participate in the Market Agent (MA) in the base case, no
profit exists for these type of actor. On the other hand, the IDE4L case is the framework to evaluate
the conditions for the CA to make a profit with flexibility activation.
Flexible Prosumers/Consumers. Prosumers and consumers may choose to offer their flexibility to
CAs in order to reduce their electricity bills. However, the savings per customer depend on its
flexibility potential, and calculations need be distinguished among different clusters.
DSOs. The activation of flexibility to help eliminate congestions in the distribution network is
market-based and the tool developed in IDE4L is the MA. The price that DSOs finally pay for
flexibility activation depends on market competition, and such competition might be positive with
the volume increase of flexibility bids and offers from CAs.
Given the wide topic and the difficulty to quantify all the previous aspects with a unique set of tests, we
focus on some instances, which provide an understanding of the type of savings/profits enabled by IDE4L.
Savings in DSO operational costs due to secondary control
Both the secondary and the tertiary control affect the operational costs of the DSO. The following DSO
costs need to be taken into account when evaluating the savings obtained through using the IDE4L
architecture: the cost of losses and the cost of control actions. The cost of control actions consists of
different factors depending on the available controllable resources and include for instance the costs of
generation curtailment, load control, tap changer operations, reactive power control and changing the
network switching state. The DSO savings have to be calculated on a yearly basis to be able to combine the
investment and operational costs which in turn enables comparing the total costs of alternative
architectures.
IDE4L Deliverable 3.3
15 IDE4L is a project co-funded by the European Commission
API 3. Increased generation capacity (hosting capacity) This API is intended to evaluate the effects of the IDE4L automation architecture to the capacity of
generation that can be connected to an existing distribution network i.e. hosting capacity. Both the
secondary and the tertiary control increase the hosting capacity.
The hosting capacity calculations evaluate how much new distributed generation can be added to the
existing network before the decreased voltage quality or network overloading becomes an issue. In the
calculations, generation in the network is gradually increased until voltage or current is out-of-bounds. The
same calculation is conducted using the passive network approach and with control algorithms proposed in
IDE4L.
Determining the increase in the hosting capacity requires load flow calculations of the network operation
for the whole year. If real power control (generation curtailment and load control) is not utilized in network
control, the hosting capacity with the automation architecture is the largest generation capacity that can be
connected to the network without exceeding acceptable operational limits of the network (voltages and
currents) at any time of the year. If generation curtailment is utilized in control, a maximum limit for
curtailed energy of generation has to be set. Calculations can be done with different maximum values for
curtailment, e.g. 1% and 5%. If load control is used, time limits for continuous control of a load need to be
included in the simulations. When the increase in hosting capacity has been calculated, the measures to
obtain the same hosting capacity for a passive network are determined. Economic benefits of active
congestion management instead of passive network reinforcements is evaluated by comparing the network
values of current network structure to a reinforced passive network that can handle the same amount of
additional generation as the current network with active control.
API 4. Actors innovation This API is meant to represent the novelty brought by the automation actors in IDE4L. The comparison is
perpetuated with regards to the state of the art in distribution grids and other EU research projects on
similar topics. In particular, it is evaluated which actors are completely new, which actors will be to be
updated (software or new functionalities) or installed in a greater number and which actor are already
present. Six indexes are eventually calculated representing the ratio (in percentage) of actors to be
updated, added or already present in the current distribution grids and in other EU research projects with
regards to the total number of IDE4L actors.
API 5. Functions innovation This API is meant to represent the novelty brought in the functions for automation in IDE4L. The
comparison is perpetuated with regards to the state of the art in distribution grids and other EU research
projects on similar topics. In particular, it is evaluated which functions are completely new, which functions
will have to be updated (new algorithms or new goals) and which functions are already present. Six indexes
are eventually calculated representing the ratio (in percentage) of functions to be updated, added or
already present in the current distribution grids and in other EU research projects with regards to the total
number of IDE4L functions.
API 6. Information exchange innovation This API is meant to represent the novelty brought in the information exchange for automation in IDE4L.
Given the complexity in compering such contribution with other projects (many do not reach the same
IDE4L Deliverable 3.3
16 IDE4L is a project co-funded by the European Commission
level of details as IDE4L) only IDE4L case will be presented. The readers may, therefore, take into
consideration and compare with their own case each piece of information.
API 7. Communication infrastructure innovation: API 7 is meant to represent the innovation brought by the new architecture in terms of communication
interconnection (from here generally named communication switch) required between actors. It is
obtained by comparing the areas covered by the IDE4L communication infrastructure with those of the
state-of-the-art (for example A2A) and INTEGRIS project.
This API Communication infrastructure innovation (CII) is calculated by comparing the number of
communication switches, as detailed below:
CII = (number of new communication switches in IDE4L compared to that of INTEGRIS/UNARETI) / (total
number of communication switches in IDE4L) * 100
This API is expressed in %. It can be inferred from the formula that the higher this API is, the more
innovative the IDE4L communication infrastructure is.
API 8. Integration of existing standard Some standard gap or some standard modification or standards that have not been implemented yet in
other architectures can emerge in the proposed architecture and it can then represent an important
outcome. This API summarizes the main novelty in the area of standardization for smart grids brought by
IDE4L.
API 9. Distribution and hierarchy of automation architecture IDE4L architecture proposes to share the burden of data concentration and monitoring applications (state
estimation and forecast) as well as power control and protection among several actors. This API calculates
the number of nodes to be controlled by each actors and the number of nodes’ information that should be
concentrated by a single actor for a generic distribution network.
API 10. Scalability of automation architecture IDE4L actors may control/monitor a certain number of nodes. Software and hardware limits tend to limit
this number given that monitor applications run on fixed intervals. This API calculates how many nodes and
quantities may be monitored or controlled in real time with IDE4L architecture with given hardware and
software limits. The metric is 1) Number of buses (and/or IEDs and/or lines and/or customer) per SAU and
per DMS. Computation, bandwidth used. API=1/(T)*Σ(Ci*ti), where T is the duration of one whole
operating cycle of the SAU, Ci is a discrete CPU capacity usage level and ti is the duration of each discrete
CPU usage level within one operating cycle of the SAU. The API is in percentage and the closer to 100% it is
the closer to the scalability limit the system is. By proportioning this value to the actual size of the system
(number of IEDs, nodes ...) it is possible to check the throughput of the system and see its development
with different system sizes and possibly limitations for automation architecture scalability.
API 11. Architecture robustness to communication issues In some cases communication quality may be poor bringing degradation in the performance of the
automation functionalities. Among the main issues are the average communication delay and the packet
loss. Of course the reliability of the communication infrastructure versus long failure is critical. In this API
the communication exchanged of IDE4L architecture are characterized in terms of criticality and the effects

IDE4L Deliverable 3.3
17 IDE4L is a project co-funded by the European Commission
on the performance of the automation. From this, evaluations on the robustness of the architecture may
be drawn.
API 12. Architecture robustness to automation actor failure This API aims at evaluating the effect of failure of hardware or software components which perform some
critical functions in IDE4L architecture. The failures are classified as database, applications /algorithms,
communication interfaces and HW failures. Considerations are given on the probability of failure and the
consequences that this may have on the use case operation and the network status. A map of the main
reasons causing a failure in the architecture is finally obtained.
API 13. Impact of distribution automation on the transmission system This API aims at showing the importance of IDE4L architecture in reducing the amount of data that TSO
needs to handle in order to have the added knowledge, represented in KPIs of D7.1 [3] : 1) Voltage stability
of electricity system, 2) TSO's visibility of distribution network.
The API is calculated as follows:
API = (amount of processed data sent to TSO through IDE4L architecture to realize the KPIs)/(amount of
raw data that had to be sent to TSO to realize the same KPIs if there was no IDE4L architecture) x 100
It can be inferred from the formula that the smaller the API is, the more effective the IDE4L architecture is.

IDE4L is a project co-funded by the European Commission
3. API Results
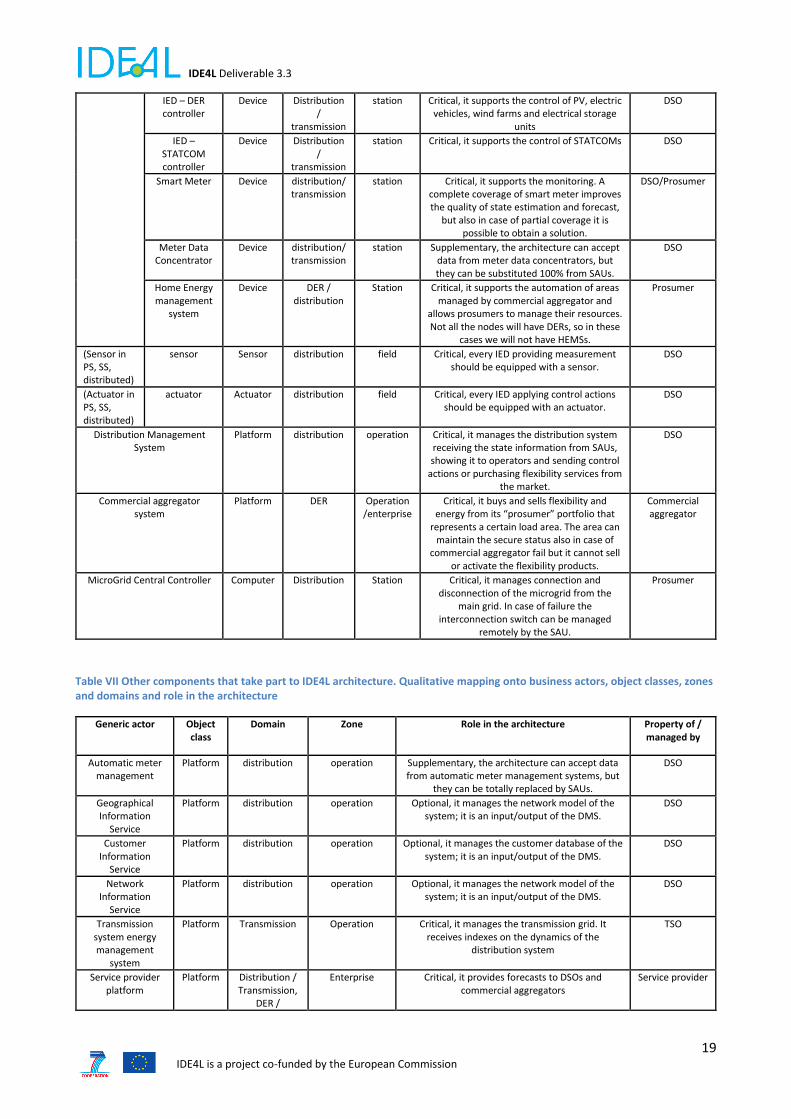
API 1. Cost of IDE4L architecture As previously mentioned , the first mapping of architecture cost, is done based on qualitative indexes, as
the business actors who own or managed them, the type of component (object classes), domains and zones
of smart grid plan and role in the architecture. Table VI, describes the aforementioned mapping for the
main components in IDE4L architecture. Table VII defines the same mapping for components referred to
automation actors that have not been developed in IDE4L but have an active role in the architecture. Table
VIII defines the same mapping for communication technologies needed by IDE4L architecture and Table IX
for the human machine interfaces required by the architecture. Consequently the components are mapped
to use cases, in Table X, where 1 x indicates that the component has a “supplementary” or “optional” role,
whereas two x indicate that the component as a critical role. In this way it will be possible for the reader to
identify which functionalities are enable from which actors, and which one require additional measures to
guarantee enough reliability for the secure operation of the network. The description of use cases is
available in deliverable 3.2 [2].
Table VI Main IDE4L components. Qualitative mapping onto business actors, object classes, zones and domains and role in the architecture
Generic Component
Instance of component
Object class
Domain Zone Role in the architecture Property of / managed by
Substation Automation Unit
PSAU Computer distribution station Critical, for the management of its MV piece of grid. If fails it can be controlled by the
upper level automation unit (DMS)
DSO
SSAU Computer distribution station Critical, for the management of its LV piece of grid. If fails it can be controlled by the
upper level automation unit (PSAU)
DSO
IED (SSIED, PSIED, DIED)
IED – generic device
Device Distribution /
transmission
station Optional, it represents an instance of IED for collection of measurement and application
of control actions. It can be replaced by other devices or not be present at all. Its
presence improves the quality of automation.
DSO
IED - Remote Terminal Unit
Device Distribution /
transmission
station Optional, it represents an instance of IED for collection of measurement and application
of control actions. It can be replaced by other devices or not be present at all. Its
presence improves the quality of automation. It is similar to the generic IED, but it communicates with SCADA systems.
DSO
IED - Phasor Measurement
Unit
Device Distribution /
transmission
station Optional. It improves the quality of monitoring and state estimation. It helps
obtaining dynamic indexes of the distribution grid.
DSO
IED - Breaker controller
Device Distribution /
transmission
station Critical, it supports the fault location isolation and service restoration. Not all substation or feeders will have a switch.
DSO
IED - Switch controller
Device Distribution /
transmission
station Critical, it supports the fault location isolation and service restoration. Not all
substation or feeders will have a breaker.
DSO
IED - Automatic
voltage controller
Device Distribution /
transmission
station Critical, it supports the control of On Load Tap Changers. Not all substation or feeders
will have an OLTC.
DSO
IDE4L Deliverable 3.3
19 IDE4L is a project co-funded by the European Commission
IED – DER controller
Device Distribution /
transmission
station Critical, it supports the control of PV, electric vehicles, wind farms and electrical storage
units
DSO
IED – STATCOM controller
Device Distribution /
transmission
station Critical, it supports the control of STATCOMs DSO
Smart Meter Device distribution/ transmission
station Critical, it supports the monitoring. A complete coverage of smart meter improves the quality of state estimation and forecast,
but also in case of partial coverage it is possible to obtain a solution.
DSO/Prosumer
Meter Data Concentrator
Device distribution/ transmission
station Supplementary, the architecture can accept data from meter data concentrators, but they can be substituted 100% from SAUs.
DSO
Home Energy management
system
Device DER / distribution
Station Critical, it supports the automation of areas managed by commercial aggregator and
allows prosumers to manage their resources. Not all the nodes will have DERs, so in these
cases we will not have HEMSs.
Prosumer
(Sensor in PS, SS, distributed)
sensor Sensor distribution field Critical, every IED providing measurement should be equipped with a sensor.
DSO
(Actuator in PS, SS, distributed)
actuator Actuator distribution field Critical, every IED applying control actions should be equipped with an actuator.
DSO
Distribution Management System
Platform distribution operation Critical, it manages the distribution system receiving the state information from SAUs, showing it to operators and sending control
actions or purchasing flexibility services from the market.
DSO
Commercial aggregator system
Platform DER Operation /enterprise
Critical, it buys and sells flexibility and energy from its “prosumer” portfolio that
represents a certain load area. The area can maintain the secure status also in case of
commercial aggregator fail but it cannot sell or activate the flexibility products.
Commercial aggregator
MicroGrid Central Controller Computer Distribution Station Critical, it manages connection and disconnection of the microgrid from the
main grid. In case of failure the interconnection switch can be managed
remotely by the SAU.
Prosumer
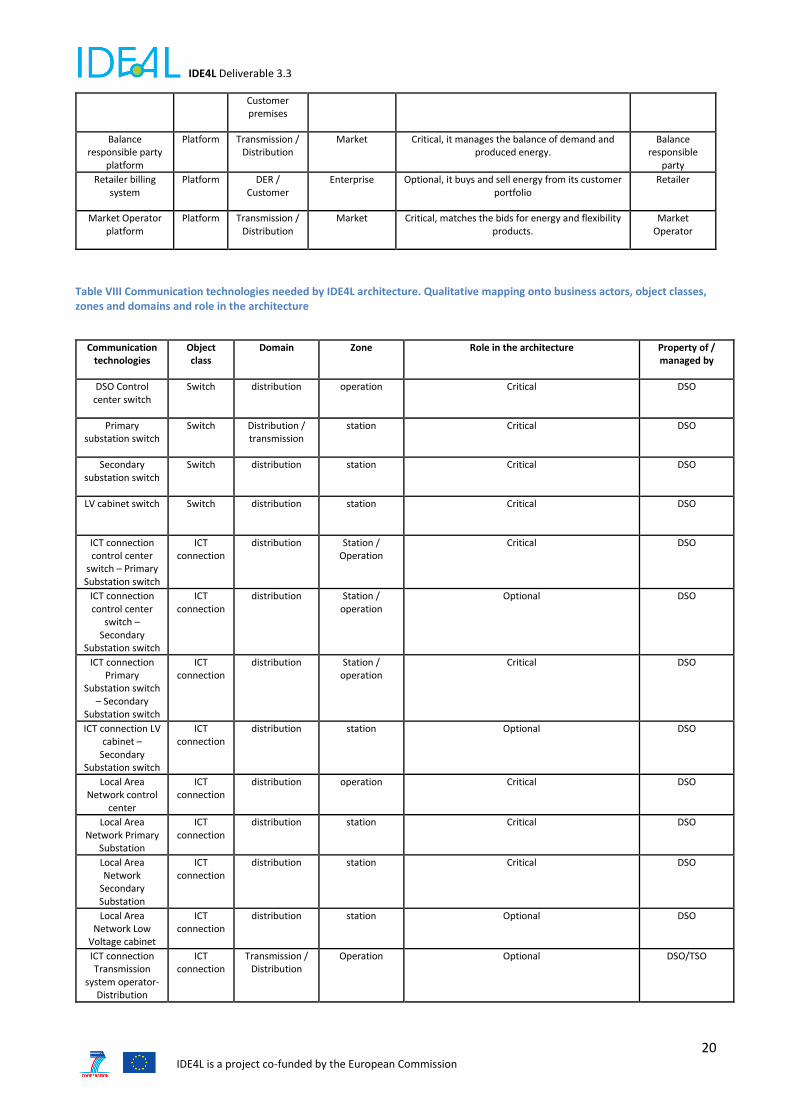
Table VII Other components that take part to IDE4L architecture. Qualitative mapping onto business actors, object classes, zones and domains and role in the architecture
Generic actor Object class
Domain Zone Role in the architecture Property of / managed by
Automatic meter management
Platform distribution operation Supplementary, the architecture can accept data from automatic meter management systems, but
they can be totally replaced by SAUs.
DSO
Geographical Information
Service
Platform distribution operation Optional, it manages the network model of the system; it is an input/output of the DMS.
DSO
Customer Information
Service
Platform distribution operation Optional, it manages the customer database of the system; it is an input/output of the DMS.
DSO
Network Information
Service
Platform distribution operation Optional, it manages the network model of the system; it is an input/output of the DMS.
DSO
Transmission system energy management
system
Platform Transmission Operation Critical, it manages the transmission grid. It receives indexes on the dynamics of the
distribution system
TSO
Service provider platform
Platform Distribution / Transmission,
DER /
Enterprise Critical, it provides forecasts to DSOs and commercial aggregators
Service provider
IDE4L Deliverable 3.3
20 IDE4L is a project co-funded by the European Commission
Customer premises
Balance responsible party
platform
Platform Transmission / Distribution
Market Critical, it manages the balance of demand and produced energy.
Balance responsible
party
Retailer billing system
Platform DER / Customer
Enterprise Optional, it buys and sell energy from its customer portfolio
Retailer
Market Operator platform
Platform Transmission / Distribution
Market Critical, matches the bids for energy and flexibility products.
Market Operator
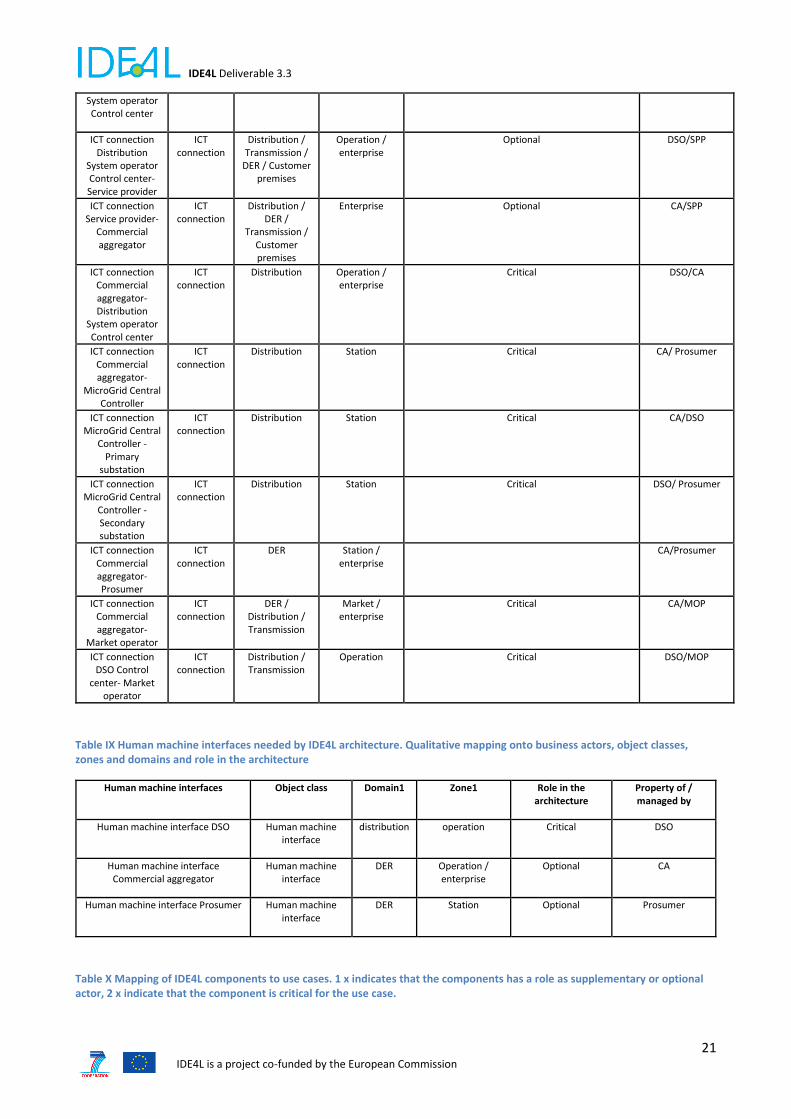
Table VIII Communication technologies needed by IDE4L architecture. Qualitative mapping onto business actors, object classes, zones and domains and role in the architecture
Communication technologies
Object class
Domain Zone Role in the architecture Property of / managed by
DSO Control center switch
Switch distribution operation Critical DSO
Primary substation switch
Switch Distribution / transmission
station Critical DSO
Secondary substation switch
Switch distribution station Critical DSO
LV cabinet switch Switch distribution station Critical DSO
ICT connection control center
switch – Primary Substation switch
ICT connection
distribution Station / Operation
Critical DSO
ICT connection control center
switch – Secondary
Substation switch
ICT connection
distribution Station / operation
Optional DSO
ICT connection Primary
Substation switch – Secondary
Substation switch
ICT connection
distribution Station / operation
Critical DSO
ICT connection LV cabinet –
Secondary Substation switch
ICT connection
distribution station Optional DSO
Local Area Network control
center
ICT connection
distribution operation Critical DSO
Local Area Network Primary
Substation
ICT connection
distribution station Critical DSO
Local Area Network
Secondary Substation
ICT connection
distribution station Critical DSO
Local Area Network Low
Voltage cabinet
ICT connection
distribution station Optional DSO
ICT connection Transmission
system operator- Distribution
ICT connection
Transmission / Distribution
Operation Optional DSO/TSO
IDE4L Deliverable 3.3
21 IDE4L is a project co-funded by the European Commission
System operator Control center
ICT connection Distribution
System operator Control center- Service provider
ICT connection
Distribution / Transmission /
DER / Customer premises
Operation / enterprise
Optional DSO/SPP
ICT connection Service provider-
Commercial aggregator
ICT connection
Distribution / DER /
Transmission / Customer premises
Enterprise Optional CA/SPP
ICT connection Commercial aggregator- Distribution
System operator Control center
ICT connection
Distribution Operation / enterprise
Critical DSO/CA
ICT connection Commercial aggregator-
MicroGrid Central Controller
ICT connection
Distribution Station Critical CA/ Prosumer
ICT connection MicroGrid Central
Controller - Primary
substation
ICT connection
Distribution Station Critical CA/DSO
ICT connection MicroGrid Central
Controller - Secondary substation
ICT connection
Distribution Station Critical DSO/ Prosumer
ICT connection Commercial aggregator- Prosumer
ICT connection
DER Station / enterprise
CA/Prosumer
ICT connection Commercial aggregator-
Market operator
ICT connection
DER / Distribution / Transmission
Market / enterprise
Critical CA/MOP
ICT connection DSO Control
center- Market operator
ICT connection
Distribution / Transmission
Operation Critical DSO/MOP
Table IX Human machine interfaces needed by IDE4L architecture. Qualitative mapping onto business actors, object classes, zones and domains and role in the architecture
Human machine interfaces Object class Domain1 Zone1 Role in the architecture
Property of / managed by
Human machine interface DSO Human machine interface
distribution operation Critical DSO
Human machine interface Commercial aggregator
Human machine interface
DER Operation / enterprise
Optional CA
Human machine interface Prosumer Human machine interface
DER Station Optional Prosumer
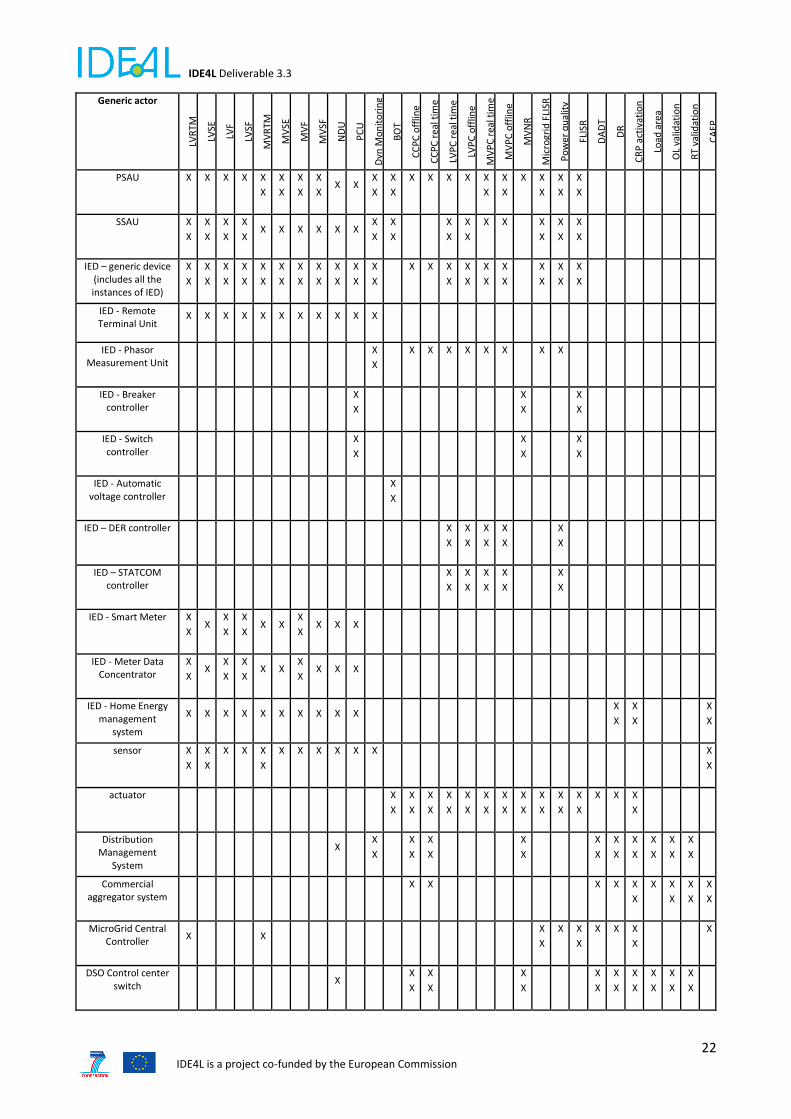
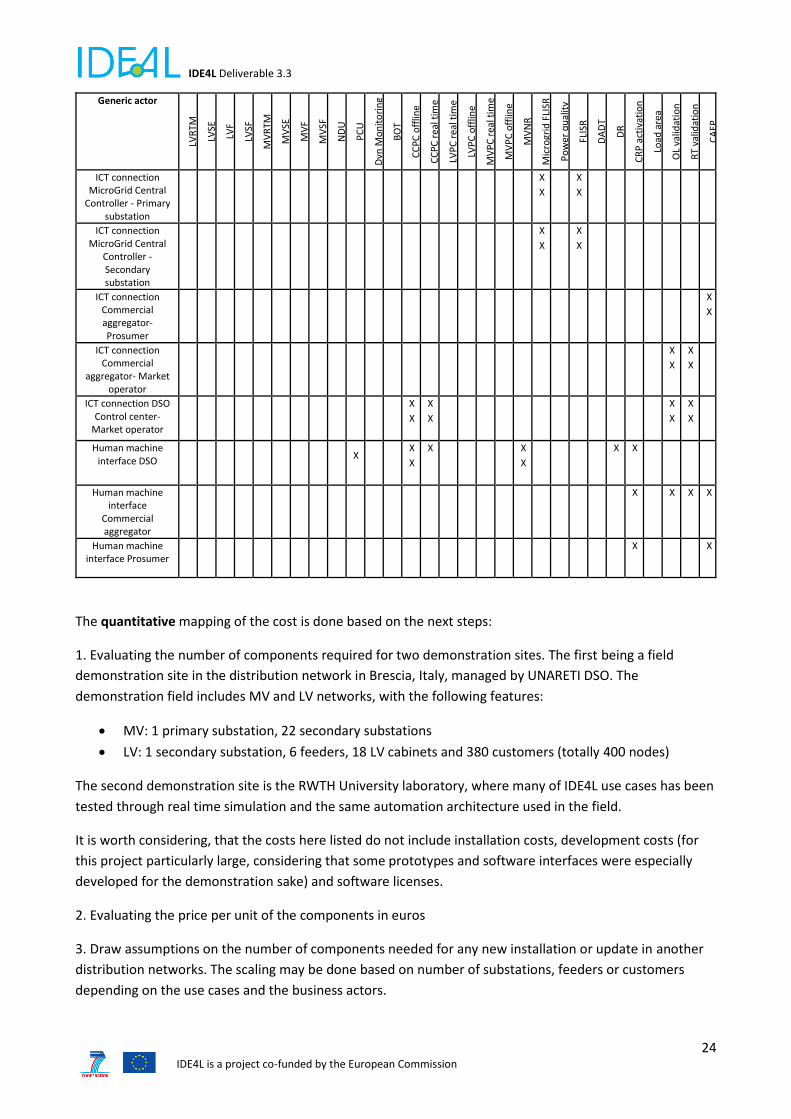
Table X Mapping of IDE4L components to use cases. 1 x indicates that the components has a role as supplementary or optional actor, 2 x indicate that the component is critical for the use case.
IDE4L Deliverable 3.3
22 IDE4L is a project co-funded by the European Commission
Generic actor
LVR
TM
LVSE
LVF
LVSF
MV
RTM
MV
SE
MV
F
MV
SF
ND
U
PC
U
Dyn
Mo
nit
ori
ng
BO
T
CC
PC
off
line
CC
PC
rea
l tim
e
LVP
C r
eal t
ime
LVP
C o
fflin
e
MV
PC
rea
l tim
e
MV
PC
off
line
MV
NR
Mic
rogr
id F
LISR
Po
wer
qu
alit
y
FLIS
R
DA
DT
DR
CR
P a
ctiv
atio
n
Load
are
a
OL
valid
atio
n
RT
valid
atio
n
CA
EP
PSAU X X X X X
X X
X X
X X
X X X
X
X
X
X
X X X X X
X X
X X X
X X
X X
X
SSAU X
X X
X
X
X
X
X X X X X X X
X
X
X
X
X
X
X
X
X X X
X
X
X
X
X
IED – generic device (includes all the instances of IED)
X
X
X
X
X
X
X
X
X
X
X
X
X
X
X
X
X
X
X
X
X
X
X X X
X
X
X
X
X
X
X X
X
X
X
X
X
IED - Remote Terminal Unit
X X X X X X X X X X X
IED - Phasor Measurement Unit
X
X
X X X X X X X X
IED - Breaker controller
X
X
X
X
X
X
IED - Switch controller
X
X
X
X
X
X
IED - Automatic voltage controller
X
X
IED – DER controller
X
X
X
X
X
X
X
X
X
X
IED – STATCOM controller
X
X
X
X
X
X
X
X
X
X
IED - Smart Meter X
X X
X
X
X
X X X
X
X X X X
IED - Meter Data Concentrator
X
X X
X
X
X
X X X
X
X X X X
IED - Home Energy management
system
X X X X X X X X X X X
X
X
X
X
X
sensor X
X
X
X
X X X
X
X X X X X X X
X
actuator
X
X
X
X X
X X
X X
X X
X X
X X
X X
X X
X X
X X X X
X
Distribution Management
System
X X
X
X
X X
X X
X
X
X X
X X
X X
X X
X X
X
Commercial aggregator system
X X X X X
X
X X
X
X
X
X
X
MicroGrid Central Controller
X X X
X
X X
X
X X X
X
X
DSO Control center switch
X X
X
X
X
X
X
X
X X
X X
X X
X X
X X
X

IDE4L Deliverable 3.3
23 IDE4L is a project co-funded by the European Commission
Generic actor
LVR
TM
LVSE
LVF
LVSF
MV
RTM
MV
SE
MV
F
MV
SF
ND
U
PC
U
Dyn
Mo
nit
ori
ng
BO
T
CC
PC
off
line
CC
PC
rea
l tim
e
LVP
C r
eal t
ime
LVP
C o
fflin
e
MV
PC
rea
l tim
e
MV
PC
off
line
MV
NR
Mic
rogr
id F
LISR
Po
wer
qu
alit
y
FLIS
R
DA
DT
DR
CR
P a
ctiv
atio
n
Load
are
a
OL
valid
atio
n
RT
valid
atio
n
CA
EP
Primary substation switch
X X X X X
X X X X X X
X
X
X
X
X
X X
X X X X
X X
X X
X
X
X
X
X
X
X
Secondary substation switch
X
X
X
X
X
X
X
X X X X X X X
X
X
X
X
X X X
X
X
X
X X X
X
X
X
X
X
LV cabinet switch X X X X X X X X X X
ICT connection control center
switch – Primary Substation switch
X X X X X X
X
X
X
X
X
X X X
X
X X
ICT connection control center
switch – Secondary Substation switch
X X X X X X
X
X X X X
ICT connection Primary Substation switch – Secondary Substation switch
X X X X X X X X X
X
X
X
X
X X X X X X X
ICT connection LV cabinet – Secondary
Substation switch
X X X X X X X X X
Local Area Network control center
X X X
X
X
X
X
X
X
X
X
X
X
X X
X X
X
Local Area Network Primary Substation
X X
X X X X X X
X X
X
X X X
X
X
X
X
X
X
X
X
X
X
X
X X
Local Area Network Secondary Substation
X
X X X X X
X
X
X
X
X
X
X
X
X
X
X
X
X X
Local Area Network Low Voltage cabinet
X X X X X X X
ICT connection Transmission
system operator- Distribution System
operator Control center
X X
X
ICT connection Distribution System
operator Control center- Service
provider
X X X X X X
X X
ICT connection Service provider-
Commercial aggregator
X
ICT connection Commercial aggregator-
Distribution System operator Control
center
X X X X X X
ICT connection Commercial aggregator-
MicroGrid Central Controller
X
X
IDE4L Deliverable 3.3
24 IDE4L is a project co-funded by the European Commission
Generic actor
LVR
TM
LVSE
LVF
LVSF
MV
RTM
MV
SE
MV
F
MV
SF
ND
U
PC
U
Dyn
Mo
nit
ori
ng
BO
T
CC
PC
off
line
CC
PC
rea
l tim
e
LVP
C r
eal t
ime
LVP
C o
fflin
e
MV
PC
rea
l tim
e
MV
PC
off
line
MV
NR
Mic
rogr
id F
LISR
Po
wer
qu
alit
y
FLIS
R
DA
DT
DR
CR
P a
ctiv
atio
n
Load
are
a
OL
valid
atio
n
RT
valid
atio
n
CA
EP
ICT connection MicroGrid Central
Controller - Primary substation
X
X
X
X
ICT connection MicroGrid Central
Controller - Secondary substation
X
X
X
X
ICT connection Commercial aggregator- Prosumer
X
X
ICT connection Commercial
aggregator- Market operator
X
X
X
X
ICT connection DSO Control center-
Market operator
X
X
X
X
X
X
X
X
Human machine interface DSO
X X
X
X X
X
X X
Human machine interface
Commercial aggregator
X X X X
Human machine interface Prosumer
X X
The quantitative mapping of the cost is done based on the next steps:
1. Evaluating the number of components required for two demonstration sites. The first being a field
demonstration site in the distribution network in Brescia, Italy, managed by UNARETI DSO. The
demonstration field includes MV and LV networks, with the following features:
MV: 1 primary substation, 22 secondary substations
LV: 1 secondary substation, 6 feeders, 18 LV cabinets and 380 customers (totally 400 nodes)
The second demonstration site is the RWTH University laboratory, where many of IDE4L use cases has been
tested through real time simulation and the same automation architecture used in the field.
It is worth considering, that the costs here listed do not include installation costs, development costs (for
this project particularly large, considering that some prototypes and software interfaces were especially
developed for the demonstration sake) and software licenses.
2. Evaluating the price per unit of the components in euros
3. Draw assumptions on the number of components needed for any new installation or update in another
distribution networks. The scaling may be done based on number of substations, feeders or customers
depending on the use cases and the business actors.

IDE4L Deliverable 3.3
25 IDE4L is a project co-funded by the European Commission
In Table XI the quantitative mapping is shown for UNARETI and RWTH field demonstrators. The readers
may exploit Table XIII, where the use cases tested by UNARETI and RWTH are defined, and therefore extend
properly to their own cases, the choice of components to be updated/installed. Conclusions on the
required investments for IDE4L architecture are drawn, using the total cost, calculated in Table XII.
Table XI Quantitative mapping of components onto UNARETI and RWTH demonstration sites.

IDE4L Deliverable 3.3
26 IDE4L is a project co-funded by the European Commission
Generic component
Name/type of component
used/installed in UNARETI
Number of
components A2A
Price per unit
UNARETI (euro)
Notes A2A Name/type of component
used/installed in RWTH
Number of
components
RWTH
Price per unit RWT
H (euro
)
Notes RWTH
MV
LV
PSAU Industrial Linux PC
1 750 Industrial PC installed in substation
Standard Linux PC 1 500 This can be a virtual Linux machine, therefore operate in the same HW with other virtual machine
SSAU Industrial Linux PC
1 750 Industrial PC installed in substation
Standard Linux PC 1 500 This can be a virtual Linux machine, therefore operate in the same HW with other virtual machine
IED – generic device
- - - - A2A has several IED installed, they will be presented in the following rows as particular instances -of IEDs.
Standard Linux PC 1 500 This can be a virtual Linux machine, therefore operate in the same HW with other virtual machine
IED - Remote Terminal Unit
- 8 - - The Remote Terminal Unit corresponds to the switch and breaker controllers, in the following rows.
- - - -
IED - Phasor Measurement
Unit
- - - - - ALSTOM PMUs P84712BB6M0720
K
4 4000 Phasor Measurement Unit with IEEE C37.118 Interface, 16 inputs and 8 outputs. It includes also the GPS synchronization module
IED - Breaker controller
Schneider/TRV0
0210
10 1200 It is a low voltage breaker. It includes also two gateways Modbus-61850.
- - - -
IED - Switch controller
(protection device)
Telvent/HU_AF(
RTU)
3 2250 The IED is made by a central unit (named HU_AF) and several modules (AB_AC), each for any medium voltage line to be measured and protected. Unareti has the following configuration, cabinet 1: 1 HU_AF and 2 AB_AC; cabinet 2: 1HU_AF and 3 AB_AC; Cabinet 3: 1HU_AF and 3 AB_AC. The AB_AC units cost between 600-1000€.
- - - -
Telvent/ AB_AC
(RTU)
8 600 - - - -
IED - Automatic voltage
controller
- - - - - Standard Linux PC 1 500 (*) This computer can be replaced by a virtual Linux machine, therefore operate in the same HW with other virtual machine
IED – DER controller
"prototype" 1 10000 Prototype developed for a previous research project. Therefore the high cost is justified by the high development cost. It is connected single phase.
Standard Linux PC 1 500 (*)
Fronius/Galvo 6 700 This IED comes with an inbuilt actuator. Its application is on PV units. The nominal power is 1.5 kVA.
- - - -

IDE4L Deliverable 3.3
27 IDE4L is a project co-funded by the European Commission
IED – STATCOM controller
"prototype" 4 2000 Prototype developed for a previous research project. Therefore the high cost is justified by the high development cost. This IED has already the actuator included.
Standard Linux PC 1 500 (*)
IED - Smart Meter
INDRA/EMIEL 40
+
14
300 (250) 40 Smart Meters are connected at the Point of Delivery of some electricity users. 14 Smart Meters are connected at the point of connection of PV units. The cost is 300 euros for the houses with two meters (PoD +PV) and 250 euros for the case with only one meter. The module is a prototype, which is the reason of the high cost.
EMH Smart Meter 2 215 Smart Meter with single phase and three phases input. Measurements are produced in DLMS/COSEM and read periodically by the SAU
IED - Meter Data
Concentrator
- - - - - - - - -
IED - Home Energy
management system
- - - - - - - - -
sensor Altea/CVS 24-
06-16, thytronic
24 - 480+250 * The type of sensor may vary depending on the type of measurements required. The zero sequence sensors represent only the ones needed in UNARETI demonstration site. The ALTEA/CVS sensors (to supply the protection device previously described) are one for each phase for 8 feeders starting from a secondary substation. The cost is 480 euros for each single phase sensor plus the power supply (250 euros) for the whole set of sensors.
Altea 3-Phase
Current Converter
16 730 The sensors are needed to connect the analog output of the simulation environment with the PMUs analog input. In real distribution grid some alternative sensors may be needed
Altea 3-Phase
Voltage Converter
4 680
Zero sequence
sensor
8 - 530
actuator MV switch 8 5000 For the LV switch the actuators are integrated in the IED cost.
Simulated actuators
N* N* is the number of nodes in the network. For RWTH case the actuator are emulated inside the RTDS
Distribution Management
System
Selta SCADA - 1 1000000 The cost is hardly definable as the installation has been done on several steps and still the DMS is continuously upgraded. The cost is in the range of few millions of euros.
Standard Linux PC 1 500 (*)
Commercial aggregator
system
- - - - - Standard Linux PC 1 500 (*)
MicroGrid Central
Controller
- - - - - - - - -
DSO Control center switch
- - - - Included in the control center generic costs.
Laboratory switch 1 50 (**) The computers that run SAUs, DMS or IEDs are connected to the same switch in RWTH laboratory
Primary substation
switch
- 2 - 1200 MV-BPL coupler (but not used in IDE4L) + 1 switch for every feeder
Laboratory switch 1 50 (**)

IDE4L Deliverable 3.3
28 IDE4L is a project co-funded by the European Commission
Secondary substation
switch
- - - - - Laboratory switch 1 50 (**)
LV cabinet switch
LV-BPL coupler - 29 100 This coupler connects the Smart meters with the substation automation units. Each Smart Meter has at least (therefore the number of LV-BPL coupler is slightly less than the number of smart meter) one LV-BPL coupler. Some smart meters share the communication devices.
Laboratory switch 1 50 (**)
ICT connection control center
switch – Primary
Substation switch
- - - - The technologies are heterogeneous in the same DSO. In A2A some primary substations are connected though connections ring in fiber optics, whereas some other primary substation units are autonomous. The cost is therefore hardly definable.
Local Area Network (LAN)
laboratory
1 500 (***) The same laboratory internet network is used to
exchange information for the IDE4L
demonstration
ICT connection control center
switch – Secondary Substation
switch
- - - - - LAN laboratory 1 500 (***)
ICT connection Primary
Substation switch –
Secondary Substation
switch
MV-BPL modem or fiber optic
ring
- 21 2500 2500 is a generic cost for a fiber optic connection.
The cost may vary depending on the
distance among the substations.
LAN laboratory 1 500 (***)
ICT connection LV cabinet – Secondary Substation
switch
LV-BPL coupler - 2 500 This represents an instance of substation switch technology. The power line communication coupler permits to read the values from the smart meters.
LAN laboratory 1 500 (***)
Local Area Network control
center
- - - - - LAN laboratory 1 500 (***)
Local Area Network Primary
Substation
- - - - - LAN laboratory 1 500 (***)
Local Area Network
Secondary Substation
- - - - - LAN laboratory 1 500 (***)
Local Area Network Low
Voltage cabinet
- - - - - LAN laboratory 1 500 (***)
ICT connection Transmission
system operator-
Distribution System
operator Control center
- - - - - - - - -
ICT connection Distribution
System operator
Control center- Service provider
- - - - - - - - -
ICT connection Service
provider- Commercial aggregator
- - - - - - - - -

IDE4L Deliverable 3.3
29 IDE4L is a project co-funded by the European Commission
ICT connection Commercial aggregator- Distribution
System operator
Control center
- - - - - LAN laboratory 1 500 (***)
ICT connection Commercial aggregator- MicroGrid
Central Controller
- - - - - - - - -
ICT connection MicroGrid
Central Controller -
Primary substation
- - - - - - - - -
ICT connection MicroGrid
Central Controller - Secondary substation
- - - - - - - - -
ICT connection Commercial aggregator- Prosumer
- - - - - LAN laboratory 1 500 (***)
ICT connection Commercial aggregator-
Market operator
- - - - - - - - -
ICT connection DSO Control
center- Market operator
- - - - - - - - -
Human machine interface DSO
- - - - The cost is included in the general SCADA cost
PC-HMI 1 100 (****) A generic desktop computer screen is used for visualization and setting of automation parameters.
Human machine interface
Commercial aggregator
- - - - - PC-HMI 1 100 (***)
Human machine interface Prosumer
- - - - - PC-HMI 1 100 (***)
Table XII Total costs analysis
Object class Total cost A2A (euro)
Notes Cost RWTH Notes
Platform/computers in control center (includes DMs, NIS, GIS …) ≈ 1 000 000
The cost of the control center, in this case, already installed is about 5 times the amount of the new investment required to complete IDE4L architecture
500
In RWTH Lab the DMS is represented by a standard PC
Platform / Computers outside control center (includes SAUs, CASs) 1500
The automation units in the SAU are a small fraction of the total new investement costs.
1500
Devices (includes IEDs, SMs, sensors and actuators)
≈ 115 000
Such costs may be optimized, deciding to target a particular family of IEDs or SMs and then reducing the investement on large scales of products
≈ 33000
High costs are mainly due to PMUs and the related laboratory sensors , whose cost is still very high for distribution networks
ICT connections
≈ 100 000
Similarly to the previous point, some communication technologies, may reduce on large scale the overall investments (e.g. wireless communication) 5200
Human machine interfaces 0
The only HMI is the one at the control center, already included in the overall costs of the DMS. 300
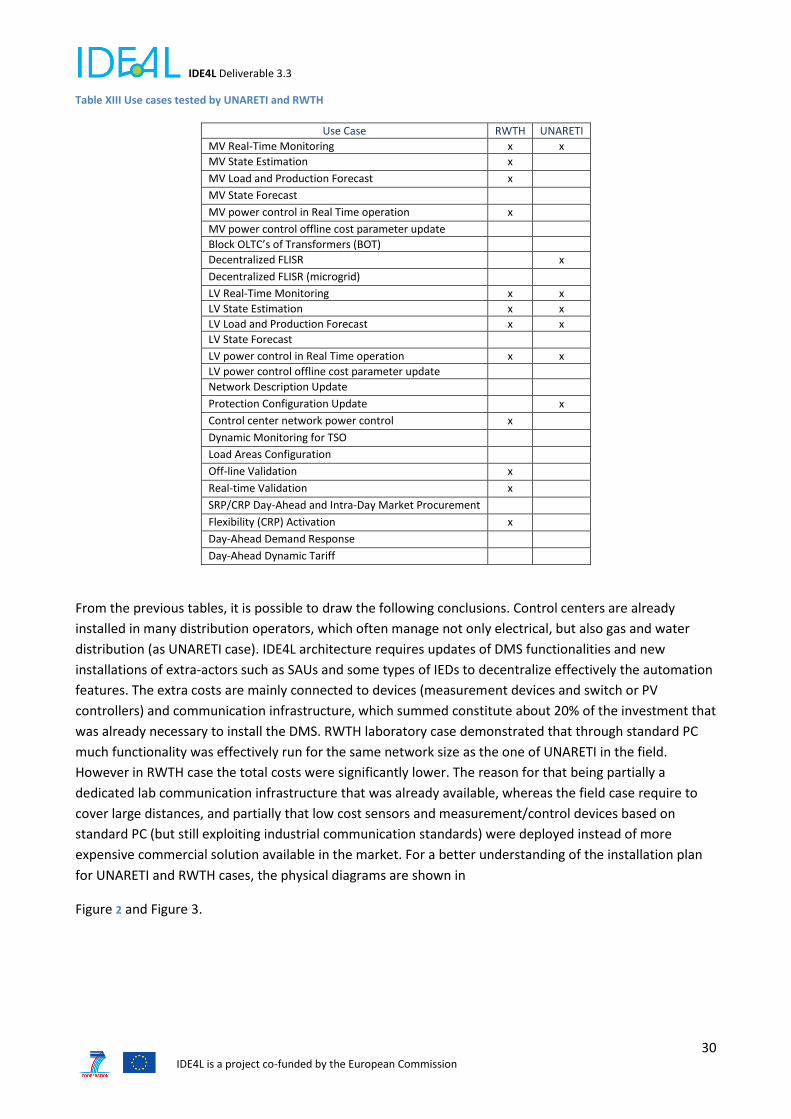
IDE4L Deliverable 3.3
30 IDE4L is a project co-funded by the European Commission
Table XIII Use cases tested by UNARETI and RWTH
Use Case RWTH UNARETI
MV Real-Time Monitoring x x
MV State Estimation x MV Load and Production Forecast x MV State Forecast MV power control in Real Time operation x MV power control offline cost parameter update
Block OLTC’s of Transformers (BOT)
Decentralized FLISR x
Decentralized FLISR (microgrid) LV Real-Time Monitoring x x
LV State Estimation x x
LV Load and Production Forecast x x
LV State Forecast LV power control in Real Time operation x x
LV power control offline cost parameter update
Network Description Update Protection Configuration Update x
Control center network power control x Dynamic Monitoring for TSO Load Areas Configuration Off-line Validation x Real-time Validation x SRP/CRP Day-Ahead and Intra-Day Market Procurement Flexibility (CRP) Activation x Day-Ahead Demand Response Day-Ahead Dynamic Tariff
From the previous tables, it is possible to draw the following conclusions. Control centers are already
installed in many distribution operators, which often manage not only electrical, but also gas and water
distribution (as UNARETI case). IDE4L architecture requires updates of DMS functionalities and new
installations of extra-actors such as SAUs and some types of IEDs to decentralize effectively the automation
features. The extra costs are mainly connected to devices (measurement devices and switch or PV
controllers) and communication infrastructure, which summed constitute about 20% of the investment that
was already necessary to install the DMS. RWTH laboratory case demonstrated that through standard PC
much functionality was effectively run for the same network size as the one of UNARETI in the field.
However in RWTH case the total costs were significantly lower. The reason for that being partially a
dedicated lab communication infrastructure that was already available, whereas the field case require to
cover large distances, and partially that low cost sensors and measurement/control devices based on
standard PC (but still exploiting industrial communication standards) were deployed instead of more
expensive commercial solution available in the market. For a better understanding of the installation plan
for UNARETI and RWTH cases, the physical diagrams are shown in
Figure 2 and Figure 3.

IDE4L Deliverable 3.3
31 IDE4L is a project co-funded by the European Commission
Figure 2 Physical Diagram UNARETI
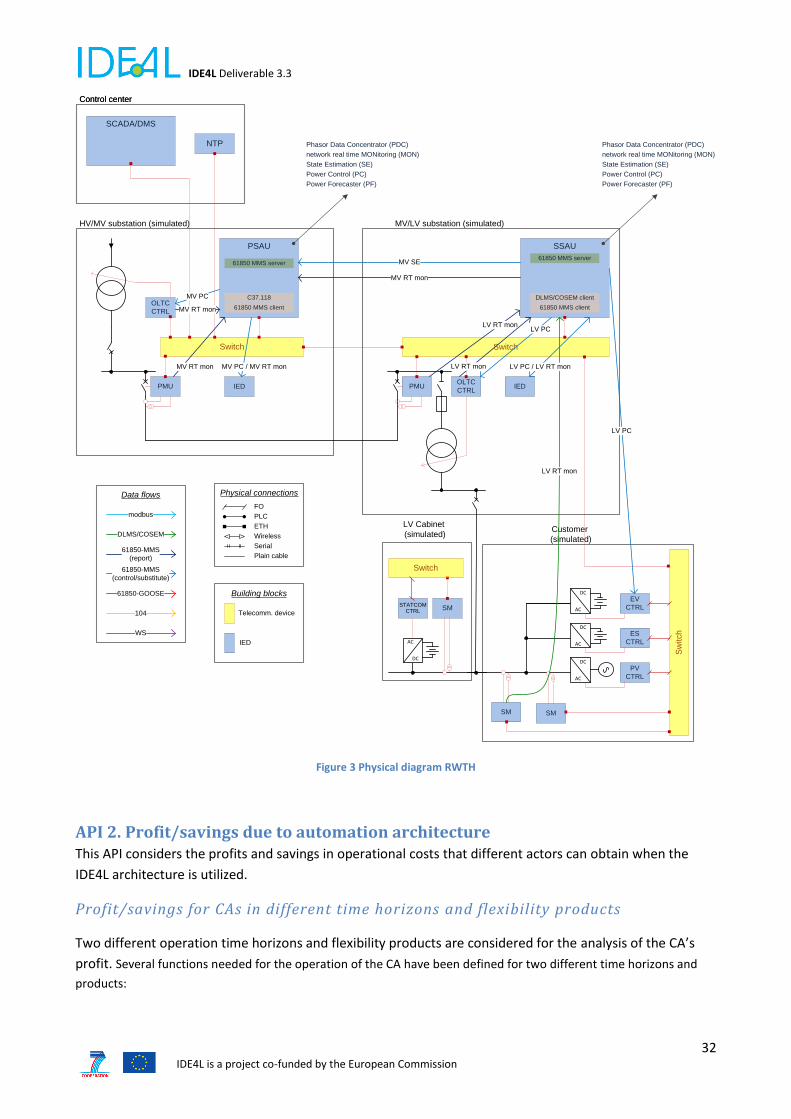
IDE4L Deliverable 3.3
32 IDE4L is a project co-funded by the European Commission
Figure 3 Physical diagram RWTH
API 2. Profit/savings due to automation architecture This API considers the profits and savings in operational costs that different actors can obtain when the
IDE4L architecture is utilized.
Profit/savings for CAs in different time horizons and flexibility products
Two different operation time horizons and flexibility products are considered for the analysis of the CA’s
profit. Several functions needed for the operation of the CA have been defined for two different time horizons and
products:
Switch
LV Cabinet
(simulated)
MV/LV substation (simulated)
PMUOLTC
CTRL
Switch
HV/MV substation (simulated)
PMU
OLTC
CTRL
SSAU
61850 MMS client
61850 MMS server
DLMS/COSEM client
NTP
SCADA/DMS
Control center
Sw
itch
AC
DC
AC
DC
AC
DC
SM
ES
CTRL
PV
CTRL
EV
CTRL
Customer
(simulated)
PSAU
61850 MMS client
61850 MMS server
network real time MONitoring (MON)
State Estimation (SE)
Power Control (PC)
SM
LV RT mon
LV RT mon
MV RT mon
MV RT mon
LV RT mon
LV PC
LV PC
MV PC
MV SE
MV RT mon
SMSTATCOM
CTRL
AC
DC
Switch
C37.118
Phasor Data Concentrator (PDC)
Telecomm. device
IED
Building blocks
modbus
DLMS/COSEM
61850-MMS
(report)
61850-MMS
(control/substitute)
61850-GOOSE
104
WS
Data flows
FO
PLC
ETH
Wireless
Serial
Plain cable
Physical connections
Control center
Power Forecaster (PF)
IED
MV PC / MV RT mon
IED
LV PC / LV RT mon
network real time MONitoring (MON)
State Estimation (SE)
Power Control (PC)
Phasor Data Concentrator (PDC)
Power Forecaster (PF)
IDE4L Deliverable 3.3
33 IDE4L is a project co-funded by the European Commission
Day ahead and intraday time horizon, SRP products (T6.2): the activation of this type of flexibility is
mandatory according to day ahead and intraday market results. Profit/savings for CAs regarding the trading
of SRP products depend on different aspects, which mainly are price incentives to the different
prosumer/consumer clusters, market prices, and commercial margin of CAs.
Real-time horizon, CRP products (T6.4): the activation of this type of flexibility is conditional and depends on
the flexibility buyer decision. However, prosumers/consumers are paid for the procurement of this type of
flexibility, regardless of its final activation or not. Profit/savings for CAs regarding the trading of CRP products
depend on two components: a fix cost/benefit, which is related to the CRP product procurement, and a
variable cost/benefit, which mainly depends on the outcome of the Market Agent.
The following sections in Chapter 4 provide details on data collected, calculations and assumptions required
for the profit/savings related to the activation of CRP products (real-time horizon). Other methodologies
would apply to SRP product trading and activations.
Profit/savings for customers and prosumers belonging to CA’s portfolio
Profit/savings for the customers and prosumers belonging to CA’s portfolio described in the next
paragraphs.
Customers and prosumers are clustered by CA according to the type of devices they connect at their
premises:
Prosumers with HEMSs coordinating energy storage systems (ESSs), photovoltaics (PV) and
residential load (heating, ventilation and air conditioning (HVAC) is assumed controllable, the rest
of residential load is non-controllable).
Prosumers with HEMSs coordinating photovoltaics (PV) and residential load (heating, ventilation
and air conditioning (HVAC) is assumed controllable, the rest of residential load is non-
controllable).
Prosumers with HEMSs coordinating residential load (heating, ventilation and air conditioning
(HVAC) is assumed controllable, the rest of residential load is non-controllable).
Profit/savings should be quantified per cluster but electricity bill savings accounting for more than 10% is
granted using the proposed methodology.
On the other hand, two different operation time horizons and flexibility products are considered.
Prosumers/consumers manage HEMSs which interact with CAs in two different time horizons (day
ahead/intraday, and real-time) and are able to manage up to two different flexibility products (SRP and
CRP), as already explained. From individual customer/prosumer point of view, it is suggested to divide
profit/savings due to HEMSs operation into two categories:
Day ahead and intraday time horizon, SRP products: HEMSs receive energy price signals from CAs
which depend on the result of flexibility and day-ahead markets. Such price signals are indeed a
modification of the price signals that HEMSs would have received if they just had a contract with
conventional retailers (without CA functionalities). Individual prosumer/customer profit/savings are
estimated as the difference between yearly energy purchases at the interconnection (point of
common coupling) of the facilities in both scenarios.

IDE4L Deliverable 3.3
34 IDE4L is a project co-funded by the European Commission
Real-time horizon, CRP products (T6.4): HEMSs receive volume price signals from CAs which depend
on the result of the Market Agent. Such volume signals are indeed a modification of the individual
schedules of controllable devices that provide power modulation for the CRP product delivery to
the power system. Individual prosumer/customer profit/savings are estimated as the difference
between yearly energy purchases at the interconnection (point of common coupling) of the
facilities in both cases, i.e. case without any CRP product activation from CAs (“base case”) against
counterfactual case with CRP activations from CAs that might take place (“IDE4L case”).
In order to illustrate the methodology and tools used to calculate the profit/savings for customers and
prosumers, an example of flexibility delivered by and individual prosumer caused by CRP product activated
from the CA is here presented.
Figure 11 shows a screenshot of the graphical user interface (GUI) of the HEMS of an individual prosumer
with one PV unit, one home battery (ESS unit) and conventional residential load connected at its premises
Figure. The prosumer has negotiated CRP flexibility products with a CA for at least one year. In this case,
one 15-minute block is activated and the home battery DC/AC inverter is issued for the delivery of 0, 5 kW
“upwards” flexibility (power increase at the interconnection point from 15:06 to 15:21).
In the upper right plot of Figure 11, named “Inverter vs. Commands (Real Time)”, the home battery inverter
active power set points and measurements are shown (labeled “Real Time Commands (Inverter)” and
“Inverter”, respectively). Additionally, the active power set points that the HEMS would have generated in
the counterfactual case without contracted CRP product flexibility are also plotted with orange color
(“Optimization Commands (Inverter)”). The area comprised between the “Real Time Commands (Inverter)”
and the “Optimization Commands (Inverter)” is the energy that has been activated from this individual
prosumer.
Figure 4 Screenshot of the GUI of the HEMS of a prosumer delivering CRP product flexibility to a CA.
The methodology to estimate the profit/savings of each type of prosumer/consumer (according to the
clustering) would include one-year simulation of each clustered prosumer/consumer in the two cases
already described (“base case” and “IDE4L case”). Tools like the aforementioned GUI could be used as input
IDE4L Deliverable 3.3
35 IDE4L is a project co-funded by the European Commission
for the PROFIT/SAVINGS metric regarding the variable component of the CRP product specification, which
depends on the energy curtailment delivered as flexibility.
Profit/savings for DSOs due to CA’s participation in the Market Agent
The MA is the trading platform where flexibilities from different eligible flexibility resources are pooled in
real time scales. Possible resources include relatively large DERs/distributed generators and
industrial/commercial loads as well as CAs. The flexibility buyer is the DSO, who uses such flexibility for
technical purposes, i.e. it removes congestions that could not be eliminated with more cost-effective
methods.
The MA (or other similar DSO functionalities for the optimal purchase of flexibility) is assumed to be
implemented either with or without the participation of CAs. However, the introduction of CAs in such type
of trading platforms would possibly push flexibility prices down as competition tends to increase with more
MA participants.
In the two compared cases (“base case” and “IDE4L case”), the costs associated to the purchase of
flexibility by DSOs depend on the price resulting from the MA. In case CAs are competitive enough
compared to other existing medium DER/DG or industrial/commercial loads bidding in the MA, costs
incurred by DSO in the MA would be lowered.
Savings from losses reduction in the grid due to CA’s flexibility activation
Remarks on the methodology to calculate losses reduction in the grid due to automation architecture
operation are detailed in this section.
Active power losses in the distribution network negatively impact on the power needed to be generated by
conventional bulk power units as well as generating DERs and DGs. Hence, the reduction of active power
losses in the distribution grid has a positive impact on the efficiency of the power system.
Regarding flexibility delivered by CA’s resources portfolio, they are connected to low voltage (LV) networks,
whereas the remaining flexibility resources are units directly connected to the MV distribution network. On
the other hand, the MA has been defined as a tool to help remove grid constraints at MV level. The winter
scenario “IDE4L case” has been tested in T6.4 where it is demonstrated that flexibility activated by CA’s
resources at LV level are efficient since the equivalent aggregated load curtailed at MV level is greater than
the summation of the individual contribution from each prosumer/consumer. The reason for that outcome
is that LV-level losses reduce with the reduction of load flowing through LV branches as a side-effect of
flexibility delivery.
In IDE4L, DSOs have the role of technical aggregators and are entities that naturally manage detailed
network information. However, customer information related to flexibility is not fully accessible for them
for regulatory reasons. The load area (LA) information may facilitate the task for the DSO to reasonably
estimate the effect that network losses changes caused by LV flexible resources might have at MV level.
With such piece of information, DSOs are able to include the positive (or negative) effect of those losses in
the algorithms run by the MA, specifically in the network-related restrictions of the optimization models.
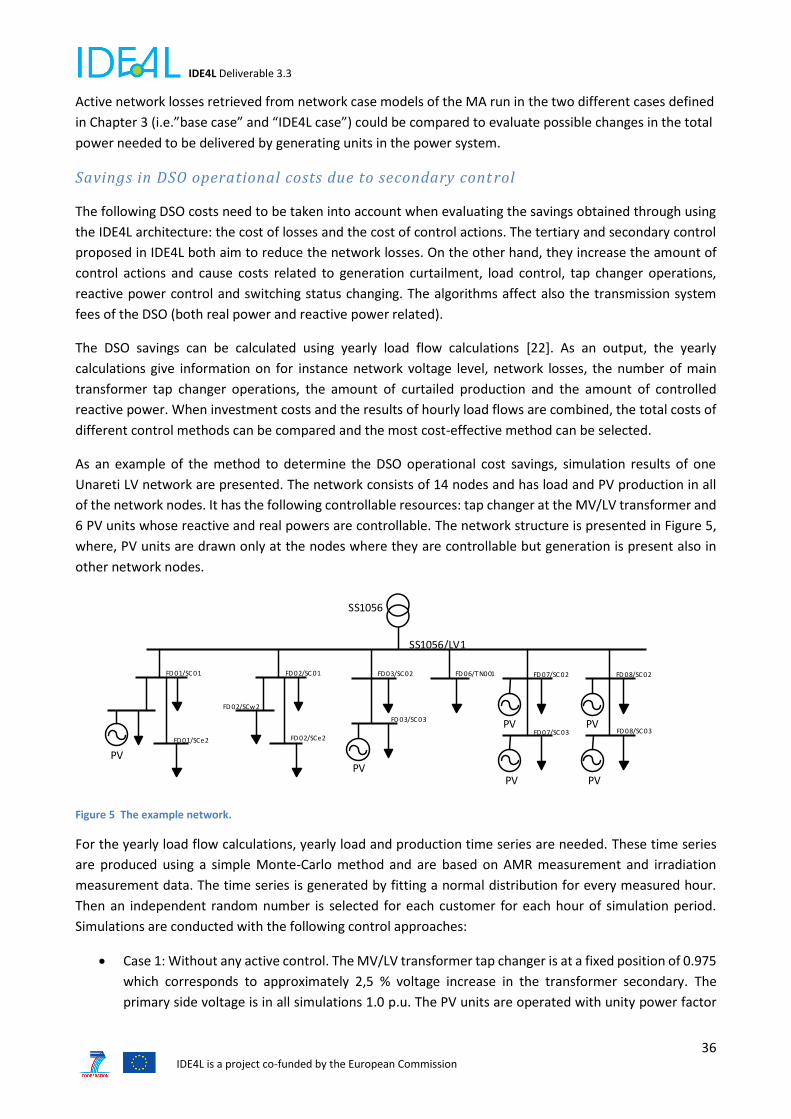
IDE4L Deliverable 3.3
36 IDE4L is a project co-funded by the European Commission
Active network losses retrieved from network case models of the MA run in the two different cases defined
in Chapter 3 (i.e.”base case” and “IDE4L case”) could be compared to evaluate possible changes in the total
power needed to be delivered by generating units in the power system.
Savings in DSO operational costs due to secondary cont rol
The following DSO costs need to be taken into account when evaluating the savings obtained through using
the IDE4L architecture: the cost of losses and the cost of control actions. The tertiary and secondary control
proposed in IDE4L both aim to reduce the network losses. On the other hand, they increase the amount of
control actions and cause costs related to generation curtailment, load control, tap changer operations,
reactive power control and switching status changing. The algorithms affect also the transmission system
fees of the DSO (both real power and reactive power related).
The DSO savings can be calculated using yearly load flow calculations [22]. As an output, the yearly
calculations give information on for instance network voltage level, network losses, the number of main
transformer tap changer operations, the amount of curtailed production and the amount of controlled
reactive power. When investment costs and the results of hourly load flows are combined, the total costs of
different control methods can be compared and the most cost-effective method can be selected.
As an example of the method to determine the DSO operational cost savings, simulation results of one
Unareti LV network are presented. The network consists of 14 nodes and has load and PV production in all
of the network nodes. It has the following controllable resources: tap changer at the MV/LV transformer and
6 PV units whose reactive and real powers are controllable. The network structure is presented in Figure 5,
where, PV units are drawn only at the nodes where they are controllable but generation is present also in
other network nodes.
SS1056
PV
FD 01/SC 01 FD 02/SC 01 FD 06/TN001 FD 07/SC 02
FD 07/SC 03FD 01/SCe2 FD 02/SCe2
FD 02/SCw2
PV
SS1056/LV1
FD 03/SC 02
FD 03/SC 03
PVPV
PV
FD 08/SC 02
PVFD 08/SC 03
Figure 5 The example network.
For the yearly load flow calculations, yearly load and production time series are needed. These time series
are produced using a simple Monte-Carlo method and are based on AMR measurement and irradiation
measurement data. The time series is generated by fitting a normal distribution for every measured hour.
Then an independent random number is selected for each customer for each hour of simulation period.
Simulations are conducted with the following control approaches:
Case 1: Without any active control. The MV/LV transformer tap changer is at a fixed position of 0.975
which corresponds to approximately 2,5 % voltage increase in the transformer secondary. The
primary side voltage is in all simulations 1.0 p.u. The PV units are operated with unity power factor
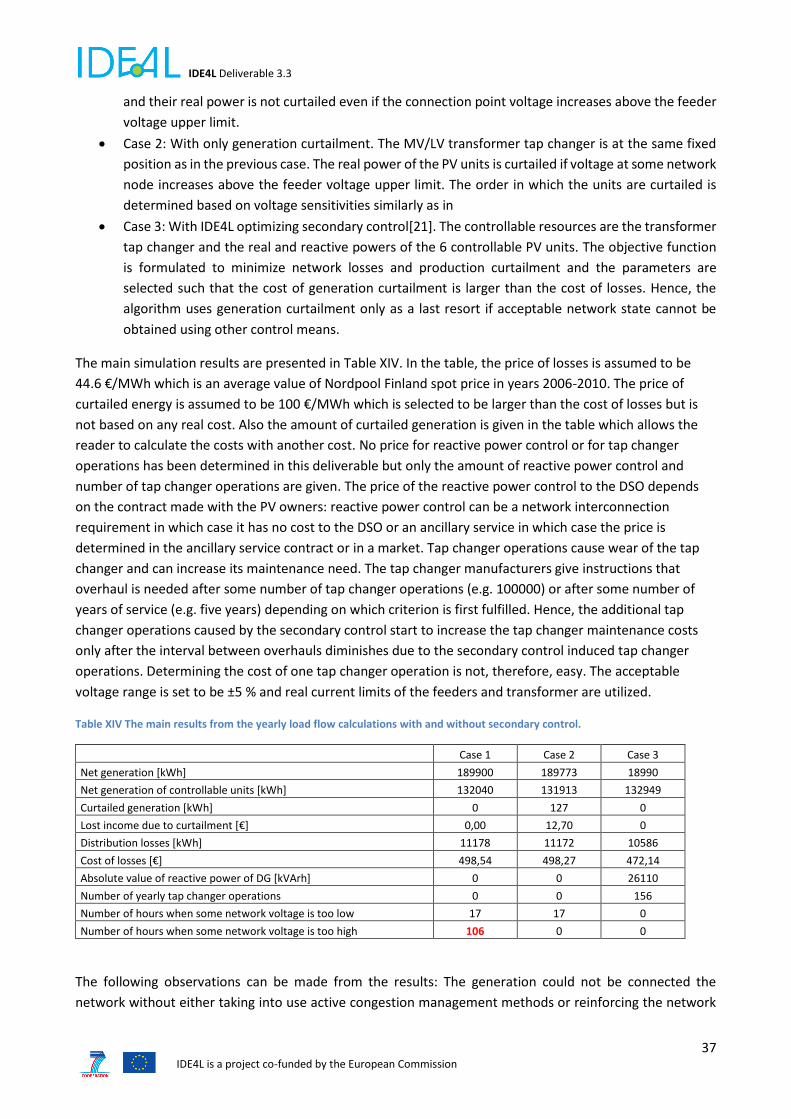
IDE4L Deliverable 3.3
37 IDE4L is a project co-funded by the European Commission
and their real power is not curtailed even if the connection point voltage increases above the feeder
voltage upper limit.
Case 2: With only generation curtailment. The MV/LV transformer tap changer is at the same fixed
position as in the previous case. The real power of the PV units is curtailed if voltage at some network
node increases above the feeder voltage upper limit. The order in which the units are curtailed is
determined based on voltage sensitivities similarly as in
Case 3: With IDE4L optimizing secondary control[21]. The controllable resources are the transformer
tap changer and the real and reactive powers of the 6 controllable PV units. The objective function
is formulated to minimize network losses and production curtailment and the parameters are
selected such that the cost of generation curtailment is larger than the cost of losses. Hence, the
algorithm uses generation curtailment only as a last resort if acceptable network state cannot be
obtained using other control means.
The main simulation results are presented in Table XIV. In the table, the price of losses is assumed to be
44.6 €/MWh which is an average value of Nordpool Finland spot price in years 2006-2010. The price of
curtailed energy is assumed to be 100 €/MWh which is selected to be larger than the cost of losses but is
not based on any real cost. Also the amount of curtailed generation is given in the table which allows the
reader to calculate the costs with another cost. No price for reactive power control or for tap changer
operations has been determined in this deliverable but only the amount of reactive power control and
number of tap changer operations are given. The price of the reactive power control to the DSO depends
on the contract made with the PV owners: reactive power control can be a network interconnection
requirement in which case it has no cost to the DSO or an ancillary service in which case the price is
determined in the ancillary service contract or in a market. Tap changer operations cause wear of the tap
changer and can increase its maintenance need. The tap changer manufacturers give instructions that
overhaul is needed after some number of tap changer operations (e.g. 100000) or after some number of
years of service (e.g. five years) depending on which criterion is first fulfilled. Hence, the additional tap
changer operations caused by the secondary control start to increase the tap changer maintenance costs
only after the interval between overhauls diminishes due to the secondary control induced tap changer
operations. Determining the cost of one tap changer operation is not, therefore, easy. The acceptable
voltage range is set to be ±5 % and real current limits of the feeders and transformer are utilized.
Table XIV The main results from the yearly load flow calculations with and without secondary control.
Case 1 Case 2 Case 3
Net generation [kWh] 189900 189773 18990
Net generation of controllable units [kWh] 132040 131913 132949
Curtailed generation [kWh] 0 127 0
Lost income due to curtailment [€] 0,00 12,70 0
Distribution losses [kWh] 11178 11172 10586
Cost of losses [€] 498,54 498,27 472,14
Absolute value of reactive power of DG [kVArh] 0 0 26110
Number of yearly tap changer operations 0 0 156
Number of hours when some network voltage is too low 17 17 0
Number of hours when some network voltage is too high 106 0 0
The following observations can be made from the results: The generation could not be connected the
network without either taking into use active congestion management methods or reinforcing the network
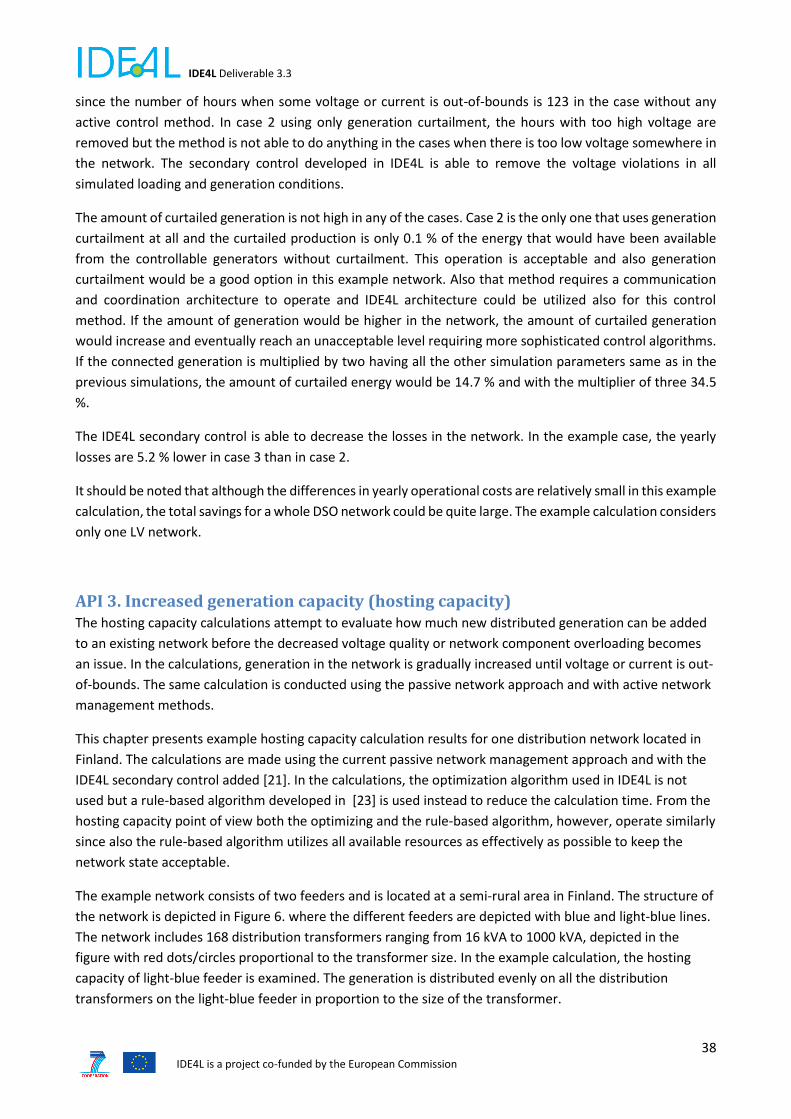
IDE4L Deliverable 3.3
38 IDE4L is a project co-funded by the European Commission
since the number of hours when some voltage or current is out-of-bounds is 123 in the case without any
active control method. In case 2 using only generation curtailment, the hours with too high voltage are
removed but the method is not able to do anything in the cases when there is too low voltage somewhere in
the network. The secondary control developed in IDE4L is able to remove the voltage violations in all
simulated loading and generation conditions.
The amount of curtailed generation is not high in any of the cases. Case 2 is the only one that uses generation
curtailment at all and the curtailed production is only 0.1 % of the energy that would have been available
from the controllable generators without curtailment. This operation is acceptable and also generation
curtailment would be a good option in this example network. Also that method requires a communication
and coordination architecture to operate and IDE4L architecture could be utilized also for this control
method. If the amount of generation would be higher in the network, the amount of curtailed generation
would increase and eventually reach an unacceptable level requiring more sophisticated control algorithms.
If the connected generation is multiplied by two having all the other simulation parameters same as in the
previous simulations, the amount of curtailed energy would be 14.7 % and with the multiplier of three 34.5
%.
The IDE4L secondary control is able to decrease the losses in the network. In the example case, the yearly
losses are 5.2 % lower in case 3 than in case 2.
It should be noted that although the differences in yearly operational costs are relatively small in this example
calculation, the total savings for a whole DSO network could be quite large. The example calculation considers
only one LV network.
API 3. Increased generation capacity (hosting capacity) The hosting capacity calculations attempt to evaluate how much new distributed generation can be added
to an existing network before the decreased voltage quality or network component overloading becomes
an issue. In the calculations, generation in the network is gradually increased until voltage or current is out-
of-bounds. The same calculation is conducted using the passive network approach and with active network
management methods.
This chapter presents example hosting capacity calculation results for one distribution network located in
Finland. The calculations are made using the current passive network management approach and with the
IDE4L secondary control added [21]. In the calculations, the optimization algorithm used in IDE4L is not
used but a rule-based algorithm developed in [23] is used instead to reduce the calculation time. From the
hosting capacity point of view both the optimizing and the rule-based algorithm, however, operate similarly
since also the rule-based algorithm utilizes all available resources as effectively as possible to keep the
network state acceptable.
The example network consists of two feeders and is located at a semi-rural area in Finland. The structure of
the network is depicted in Figure 6. where the different feeders are depicted with blue and light-blue lines.
The network includes 168 distribution transformers ranging from 16 kVA to 1000 kVA, depicted in the
figure with red dots/circles proportional to the transformer size. In the example calculation, the hosting
capacity of light-blue feeder is examined. The generation is distributed evenly on all the distribution
transformers on the light-blue feeder in proportion to the size of the transformer.
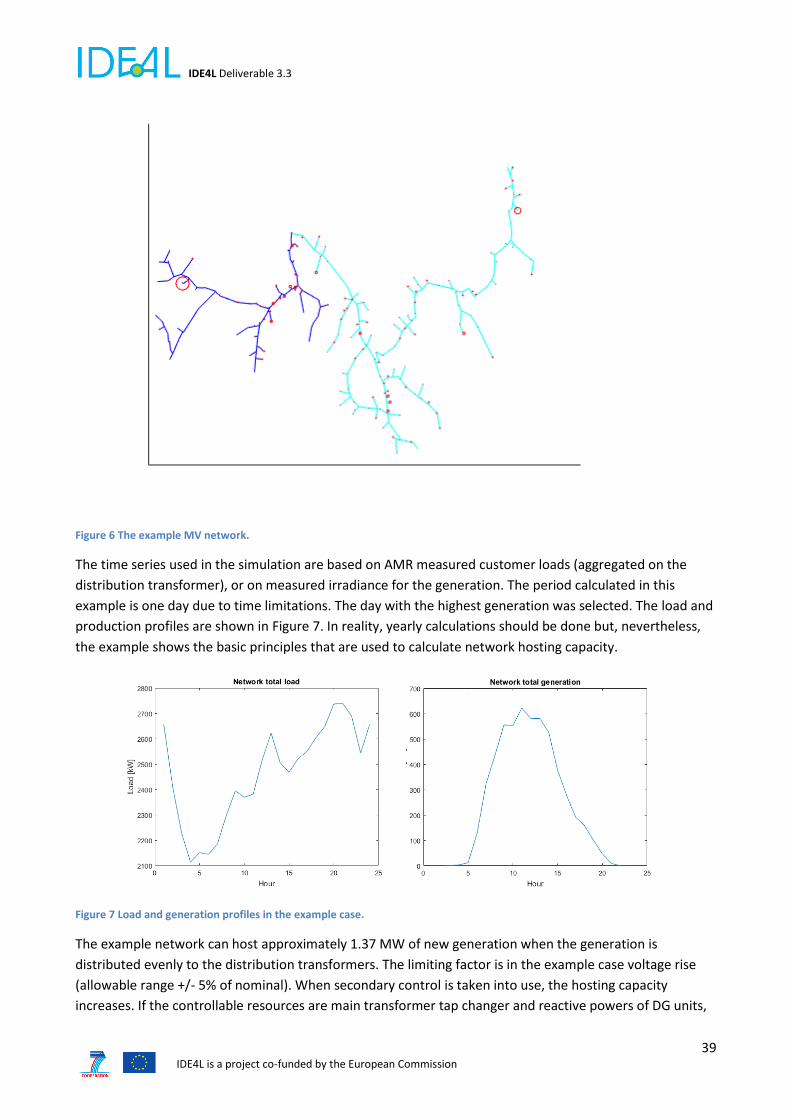
IDE4L Deliverable 3.3
39 IDE4L is a project co-funded by the European Commission
Figure 6 The example MV network.
The time series used in the simulation are based on AMR measured customer loads (aggregated on the
distribution transformer), or on measured irradiance for the generation. The period calculated in this
example is one day due to time limitations. The day with the highest generation was selected. The load and
production profiles are shown in Figure 7. In reality, yearly calculations should be done but, nevertheless,
the example shows the basic principles that are used to calculate network hosting capacity.
Figure 7 Load and generation profiles in the example case.
The example network can host approximately 1.37 MW of new generation when the generation is
distributed evenly to the distribution transformers. The limiting factor is in the example case voltage rise
(allowable range +/- 5% of nominal). When secondary control is taken into use, the hosting capacity
increases. If the controllable resources are main transformer tap changer and reactive powers of DG units,

IDE4L Deliverable 3.3
40 IDE4L is a project co-funded by the European Commission
the network can host approximately 2.36 MW of new generation without voltage violations i.e. the hosting
capacity increases 72 % compared to the passive network case. When also generation curtailment is
allowed and the maximum amount of curtailment is set to 5 % in daily delivered energy, the network can
host approximately 3.7 MW of new generation i.e. the hosting capacity increases 170 % compared to the
passive network case and 57 % compared to the active network management without generation
curtailment. Figure 8 depicts the operation of the calculation method.
Figure 8 Hosting capacity calculation principle. The generation in the network is gradually increased as the calculation proceeds and the hosting capacity limits for the different control alternatives are shown with the horizontal lines.
Economic benefits of secondary control instead of passive network reinforcements is evaluated by
comparing the network values of current network structure to a reinforced passive network that can
handle the same amount of additional generation as the current network with the secondary control. This
approach assumes that the required hosting capacity must be achieved in a certain time, due to the
increased generation in the grid, and that the generation increase can be modelled in a similar manner as
load increase in the network is modelled today. Moreover, in these calculations it is assumed that the
network loading does not change during the investigation period. The network values are depicted in Figure
9 and are calculated by using the component unit prices by Finnish Energy Authority.
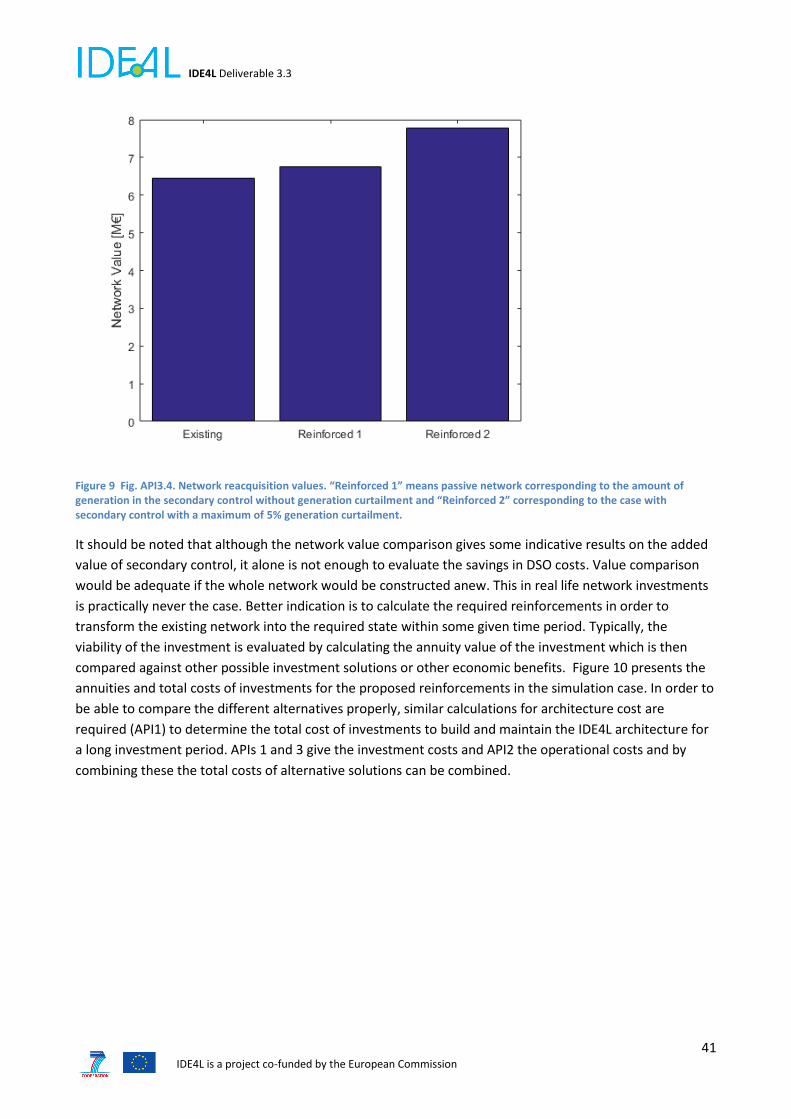
IDE4L Deliverable 3.3
41 IDE4L is a project co-funded by the European Commission
Figure 9 Fig. API3.4. Network reacquisition values. “Reinforced 1” means passive network corresponding to the amount of generation in the secondary control without generation curtailment and “Reinforced 2” corresponding to the case with secondary control with a maximum of 5% generation curtailment.
It should be noted that although the network value comparison gives some indicative results on the added
value of secondary control, it alone is not enough to evaluate the savings in DSO costs. Value comparison
would be adequate if the whole network would be constructed anew. This in real life network investments
is practically never the case. Better indication is to calculate the required reinforcements in order to
transform the existing network into the required state within some given time period. Typically, the
viability of the investment is evaluated by calculating the annuity value of the investment which is then
compared against other possible investment solutions or other economic benefits. Figure 10 presents the
annuities and total costs of investments for the proposed reinforcements in the simulation case. In order to
be able to compare the different alternatives properly, similar calculations for architecture cost are
required (API1) to determine the total cost of investments to build and maintain the IDE4L architecture for
a long investment period. APIs 1 and 3 give the investment costs and API2 the operational costs and by
combining these the total costs of alternative solutions can be combined.
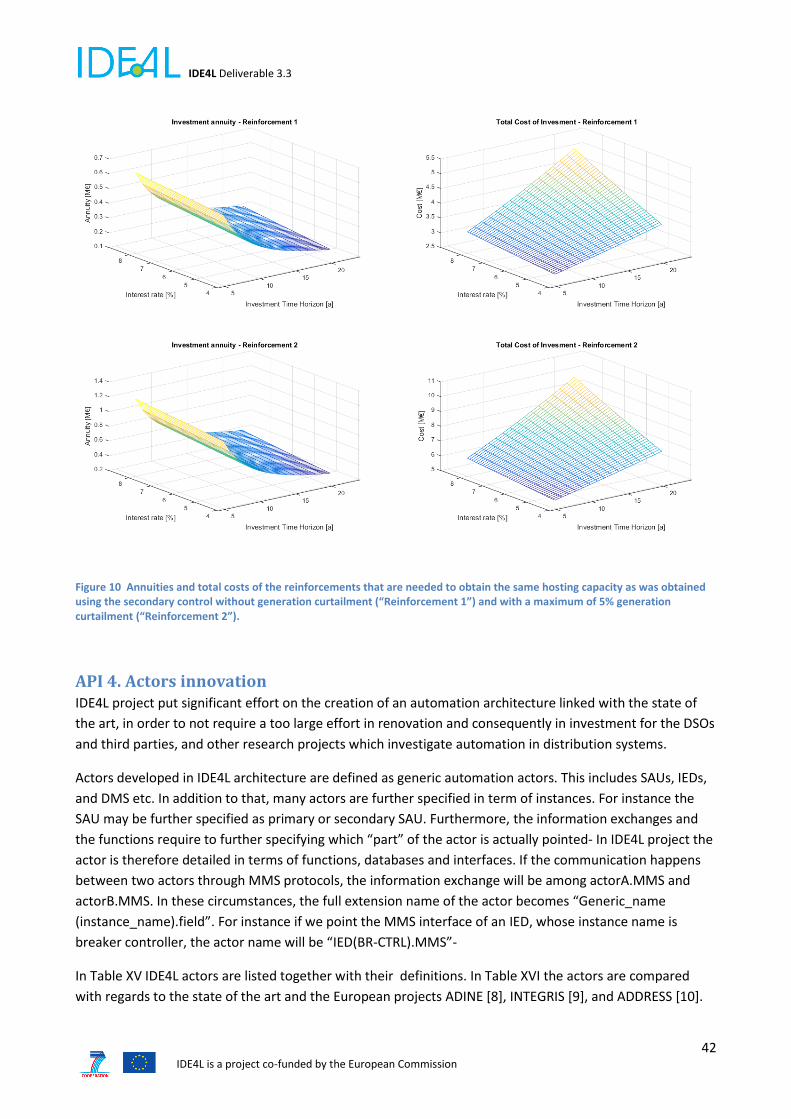
IDE4L Deliverable 3.3
42 IDE4L is a project co-funded by the European Commission
Figure 10 Annuities and total costs of the reinforcements that are needed to obtain the same hosting capacity as was obtained using the secondary control without generation curtailment (“Reinforcement 1”) and with a maximum of 5% generation curtailment (“Reinforcement 2”).
API 4. Actors innovation IDE4L project put significant effort on the creation of an automation architecture linked with the state of
the art, in order to not require a too large effort in renovation and consequently in investment for the DSOs
and third parties, and other research projects which investigate automation in distribution systems.
Actors developed in IDE4L architecture are defined as generic automation actors. This includes SAUs, IEDs,
and DMS etc. In addition to that, many actors are further specified in term of instances. For instance the
SAU may be further specified as primary or secondary SAU. Furthermore, the information exchanges and
the functions require to further specifying which “part” of the actor is actually pointed- In IDE4L project the
actor is therefore detailed in terms of functions, databases and interfaces. If the communication happens
between two actors through MMS protocols, the information exchange will be among actorA.MMS and
actorB.MMS. In these circumstances, the full extension name of the actor becomes “Generic_name
(instance_name).field”. For instance if we point the MMS interface of an IED, whose instance name is
breaker controller, the actor name will be “IED(BR-CTRL).MMS”-
In Table XV IDE4L actors are listed together with their definitions. In Table XVI the actors are compared
with regards to the state of the art and the European projects ADINE [8], INTEGRIS [9], and ADDRESS [10].
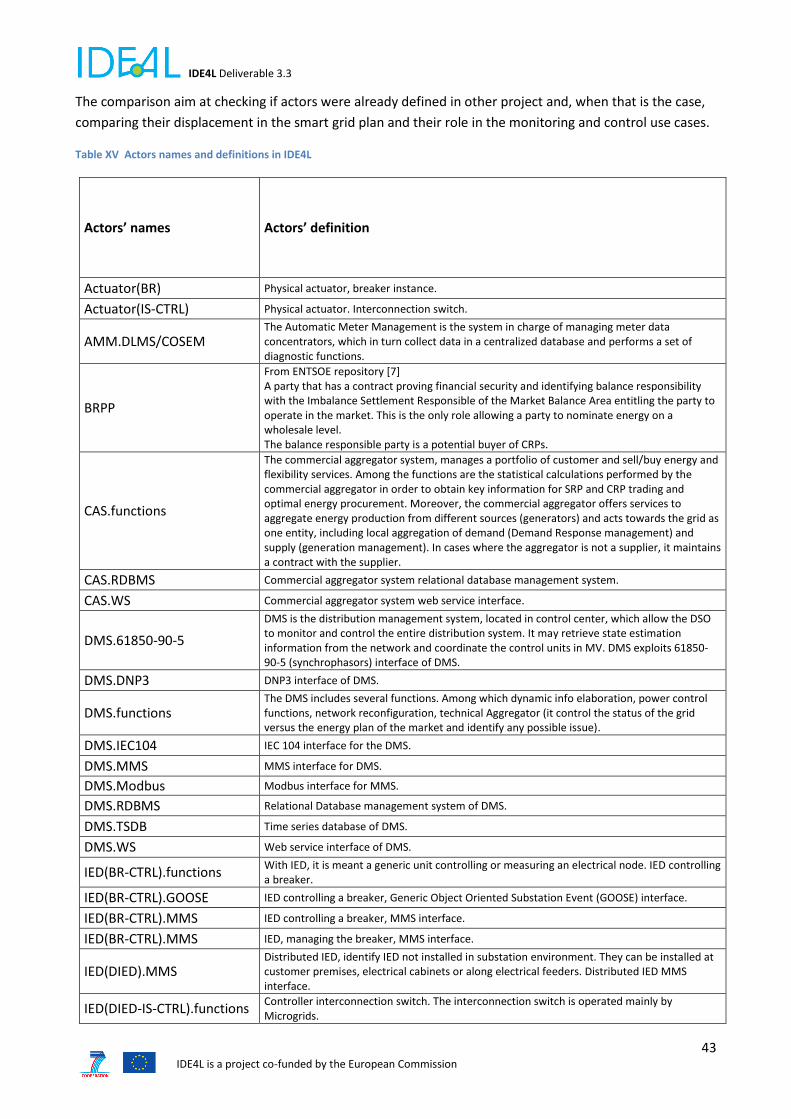
IDE4L Deliverable 3.3
43 IDE4L is a project co-funded by the European Commission
The comparison aim at checking if actors were already defined in other project and, when that is the case,
comparing their displacement in the smart grid plan and their role in the monitoring and control use cases.
Table XV Actors names and definitions in IDE4L
Actors’ names Actors’ definition
Actuator(BR) Physical actuator, breaker instance.
Actuator(IS-CTRL) Physical actuator. Interconnection switch.
AMM.DLMS/COSEM The Automatic Meter Management is the system in charge of managing meter data concentrators, which in turn collect data in a centralized database and performs a set of diagnostic functions.
BRPP
From ENTSOE repository [7] A party that has a contract proving financial security and identifying balance responsibility with the Imbalance Settlement Responsible of the Market Balance Area entitling the party to operate in the market. This is the only role allowing a party to nominate energy on a wholesale level. The balance responsible party is a potential buyer of CRPs.
CAS.functions
The commercial aggregator system, manages a portfolio of customer and sell/buy energy and flexibility services. Among the functions are the statistical calculations performed by the commercial aggregator in order to obtain key information for SRP and CRP trading and optimal energy procurement. Moreover, the commercial aggregator offers services to aggregate energy production from different sources (generators) and acts towards the grid as one entity, including local aggregation of demand (Demand Response management) and supply (generation management). In cases where the aggregator is not a supplier, it maintains a contract with the supplier.
CAS.RDBMS Commercial aggregator system relational database management system.
CAS.WS Commercial aggregator system web service interface.
DMS.61850-90-5
DMS is the distribution management system, located in control center, which allow the DSO to monitor and control the entire distribution system. It may retrieve state estimation information from the network and coordinate the control units in MV. DMS exploits 61850-90-5 (synchrophasors) interface of DMS.
DMS.DNP3 DNP3 interface of DMS.
DMS.functions The DMS includes several functions. Among which dynamic info elaboration, power control functions, network reconfiguration, technical Aggregator (it control the status of the grid versus the energy plan of the market and identify any possible issue).
DMS.IEC104 IEC 104 interface for the DMS.
DMS.MMS MMS interface for DMS.
DMS.Modbus Modbus interface for MMS.
DMS.RDBMS Relational Database management system of DMS.
DMS.TSDB Time series database of DMS.
DMS.WS Web service interface of DMS.
IED(BR-CTRL).functions With IED, it is meant a generic unit controlling or measuring an electrical node. IED controlling a breaker.
IED(BR-CTRL).GOOSE IED controlling a breaker, Generic Object Oriented Substation Event (GOOSE) interface.
IED(BR-CTRL).MMS IED controlling a breaker, MMS interface.
IED(BR-CTRL).MMS IED, managing the breaker, MMS interface.
IED(DIED).MMS Distributed IED, identify IED not installed in substation environment. They can be installed at customer premises, electrical cabinets or along electrical feeders. Distributed IED MMS interface.
IED(DIED-IS-CTRL).functions Controller interconnection switch. The interconnection switch is operated mainly by Microgrids.

IDE4L Deliverable 3.3
44 IDE4L is a project co-funded by the European Commission
IED(DIED-IS-CTRL).Modbus Controller interconnection switch, Modbus interface
IED(DIED-PMU).61850-90-5 61850-90-5 interface of PMU.
IED(DIED-SM).DLMS/COSEM The Smart Meter is a Meter with additional functionalities one of which is data communication. It is used mainly for energy bills, but its functionalities could be extended in order to support grid automation. DLMS/COSEM interface.
IED(DIED-SM).functions Smart meter functions are mainly related to measurement calculations.
IED(HEMS).WS Home energy management system. It is the unit allowing customers or prosumer to control the DERs based on the energy price and the relation with the commercial aggregator. Web services interfaces.
IED(PSIED).functions IED installed in primary substation environment. Among the functions are the calculation of measurements and primary control.
IED(PSIED).MMS MMS interface Intelligent Electronic Device (IED) of primary substation.
IED(PSIED-AVC-CTRL).MMS Automatic Voltage Controller of Primary Substation IED.
IED(PSIED-PMU).61850-90-5 61850-90-5 (synchrophasors) interface of PMU at primary substation.
IED(PSIED-RTU).DNP3
RTU instance of primary substation IED. A remote terminal unit is a microprocessor-controlled electronic device that Interfaces objects in the physical world to a distributed control System or SCADA by transmitting telemetry data to the System, and by using Messages from the supervisory. DNP3 interface.
IED(SSIED).functions IED of secondary substation. Among the functions are the calculation of measurements and primary control.
IED(SSIED).MMS IED of secondary substation, MMS interface.
IED(SSIED-AVC-CTRL).MMS Automatic Voltage Controller of Secondary Substation IED.
IED(SSIED-MDC).DLMS/COSEM
Meter Data Concentrator (MDC) instance of secondary substation IED. MDC is a party responsible for meter reading and quality control of the reading.
IED(SSIED-PMU).61850-90-5 IED of secondary substation, 61850-90-5 interface of PMU. Phasor Measurements Unit (PMU) is a device that produces synchrophasors of electrical quantities such as voltage and current.
IED(SSIED-RTU).DNP3 RTU instance of secondary substation IED. DNP3 interface.
IED(SW-CTRL).functions IED controlling a switch, functions.
IED(SW-CTRL).GOOSE IED controlling a switch, GOOSE interface.
IED(SW-CTRL).MMS IED controlling a switch, MMS interface.
IED.GOOSE IED goose interface.
IED.MMS IED, MMS interface.
IED.MMS Intelligent Electronic Device, MMS Interface.
MGCC.Functions
Microgrid central controller, is the actor that aims at managing the microgrid in order to perform the connection/reconnection protocol in presence of fault in the main grid. The functions include monitoring the state of the microgrid and the connection/reconnection protocols.
MGCC.MMS Microgrid central controller, MMS interface.
MGCC.MMS MGCC, MMS interface.
MGCC.Modbus Centralized microgrid controller aimed to manage the microgrid to perform the reconnection protocol.Modbus interface.
MGCC.RDBMS MGCC, Database.
MOP
Market Operator Platform. The unique power exchange of trades for the actual delivery of energy that receives the bids from the Balance Responsible Parties that have a contract to bid. The market operator determines the market energy price for the market balance area after applying technical constraints from the system operator. It may also establish the price for the reconciliation within a metering grid area.
SAU(PSAU).61850-90-5 The SAU is a unit that performs monitoring and control tasks at substation level. Primary SAU instance, 61850-90-5 (synchrophasor) interface.

IDE4L Deliverable 3.3
45 IDE4L is a project co-funded by the European Commission
SAU(PSAU).Functions Primary Substation Automation Unit. Functions: State estimation function; State forecast; topology manager functionality; Protection System Configurator; Power Control Offline Cost Parameter Update; Block OLTC’s of Transformers; Power Control.
SAU(PSAU).IEC 104 PSAU, IEC 104 interface.
SAU(PSAU).MMS PSAU, MMS interface.
SAU(PSAU).Modbus PSAU, Modbus Interface.
SAU(PSAU).RDBMS PSAU, Relational Database Management System.
SAU(PSAU).TSDB PSAU, Time series Database
SAU(SSAU).61850-90-5 Secondary SAU 61850-90-5 (synchrophasors) interface.
SAU(SSAU).DLMS/COSEM SSAU data exchange platform for DLMS/COSEM protocol
SAU(SSAU).Functions Secondary substation automation unit (SSAU). Functions: Statistical calculation; State estimation function; Forecaster function; topology manager functionality ; Power Control; Power Control Offline Cost Parameter Update
SAU(SSAU).IEC104 SSAU, IEC 104 interface
SAU(SSAU).MMS SSAU, MMS interface
SAU(SSAU).RDBMS SSAU, Relational Database Management System .
SAU(SSAU).TSDB SSAU, Time series database.
Sensor It is a generic sensor such as voltage sensor, current sensor, state sensor, etc. which can be acquired by a generic IED (RTU, PD, etc.)
SPP Service provider platform. It provides the following information: Wheatear data provider, Energy prices for the next day and intraday; forecast of DERs and demand for the area of the CA for next day and intraday; charging hours of electric vehicles.
TSOEMS
Transmission system energy management system. The TSO is according to the Article 2.4 of the Electricity Directive 2009/72/EC (Directive): "a natural or legal person responsible for operating, ensuring the maintenance of and, if necessary, developing the transmission system in a given area and, where applicable, its interconnections with other systems, and for ensuring the long-term ability of the system to meet reasonable demands for the transmission of electricity". Moreover, the TSO is responsible for connection of all grid users at the transmission level and connection of the DSOs within the TSO control area.
In Table XVI, IDE4L actors are compared with the state of the art architecture (in particular, the UNARETI,
OSKRAFT and UFD distribution grids is taken as reference) and other’s smart grid EU projects, such as
ADINE, ADDRESS and INTEGRIS.
ADINE deals with the generic development of active distribution networks, in particular SCADA, DMS and
advanced metering infrastructures. The comparison will be consistent with the part of IDE4L architecture
dealing with control and monitoring. INTEGRIS deals with the development of communication
infrastructure for smart grids. Also INTEGRIS had put many efforts on the improvement of monitoring and
control use cases. ADDRESS dealt with the development of the aggregator, therefore will enrich the
comparison of business use cases. All of the three projects here mentioned applied the SGAM methodology
for the development of the architecture. Of course every project makes several assumptions that permit to
simplify the process of description of the architecture; therefore the comparison among actors (and later
functions, information exchange and communication) is not always 100% consistent. In the comparison of
automation actors, only the generic name of the actor is considered, not the particular instance neither the
specification in terms of interface, database and application. This is done because IDE4L was the first to
introduce such specification of actor, and therefore a proper term of comparison was not available.
In Table XVI, “Y” indicates that the actor is present, “N” indicates that the actor is not present, “U” indicates
that the actor requires technology updates or new installations; further details for each actor are provided
in the column “notes”
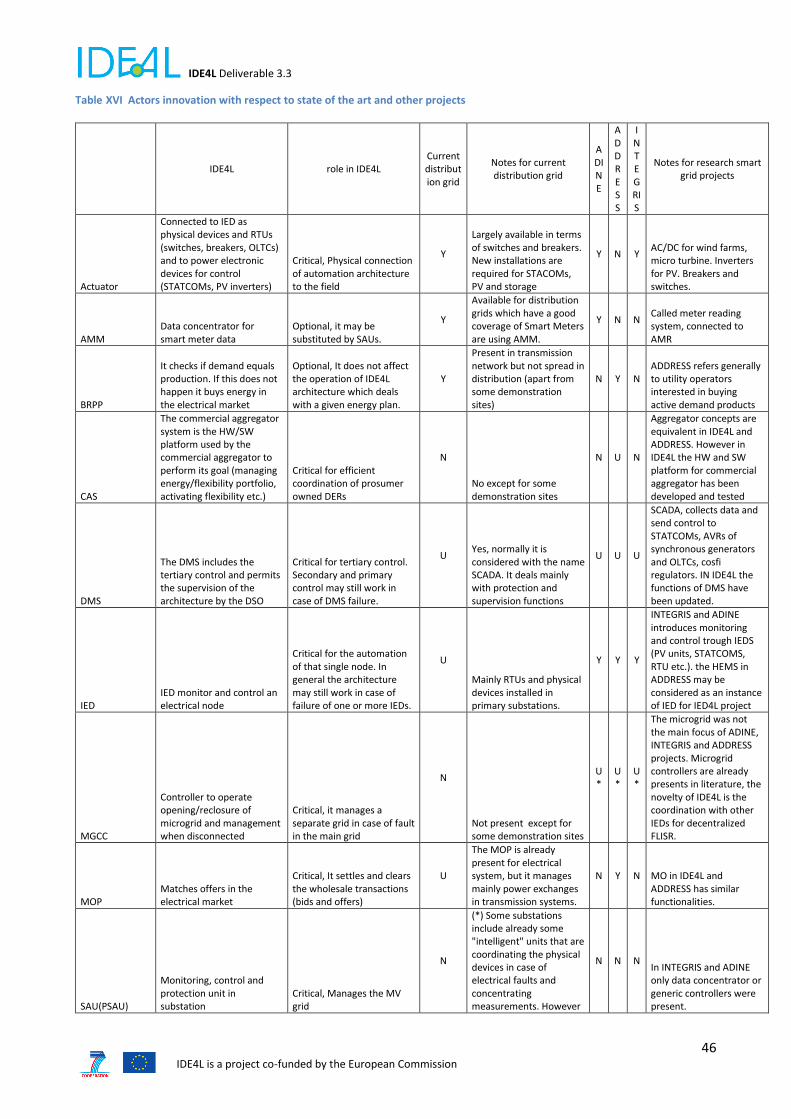
IDE4L Deliverable 3.3
46 IDE4L is a project co-funded by the European Commission
Table XVI Actors innovation with respect to state of the art and other projects
IDE4L role in IDE4L Current distribution grid
Notes for current distribution grid
ADINE
ADDRESS
INTEGRIS
Notes for research smart grid projects
Actuator
Connected to IED as physical devices and RTUs (switches, breakers, OLTCs) and to power electronic devices for control (STATCOMs, PV inverters)
Critical, Physical connection of automation architecture to the field
Y
Largely available in terms of switches and breakers. New installations are required for STACOMs, PV and storage
Y N Y AC/DC for wind farms, micro turbine. Inverters for PV. Breakers and switches.
AMM Data concentrator for smart meter data
Optional, it may be substituted by SAUs.
Y
Available for distribution grids which have a good coverage of Smart Meters are using AMM.
Y N N Called meter reading system, connected to AMR
BRPP
It checks if demand equals production. If this does not happen it buys energy in the electrical market
Optional, It does not affect the operation of IDE4L architecture which deals with a given energy plan.
Y
Present in transmission network but not spread in distribution (apart from some demonstration sites)
N Y N ADDRESS refers generally to utility operators interested in buying active demand products
CAS
The commercial aggregator system is the HW/SW platform used by the commercial aggregator to perform its goal (managing energy/flexibility portfolio, activating flexibility etc.)
Critical for efficient coordination of prosumer owned DERs
N
No except for some demonstration sites
N U N
Aggregator concepts are equivalent in IDE4L and ADDRESS. However in IDE4L the HW and SW platform for commercial aggregator has been developed and tested
DMS
The DMS includes the tertiary control and permits the supervision of the architecture by the DSO
Critical for tertiary control. Secondary and primary control may still work in case of DMS failure.
U Yes, normally it is considered with the name SCADA. It deals mainly with protection and supervision functions
U U U
SCADA, collects data and send control to STATCOMs, AVRs of synchronous generators and OLTCs, cosfi regulators. IN IDE4L the functions of DMS have been updated.
IED IED monitor and control an electrical node
Critical for the automation of that single node. In general the architecture may still work in case of failure of one or more IEDs.
U
Mainly RTUs and physical devices installed in primary substations.
Y Y Y
INTEGRIS and ADINE introduces monitoring and control trough IEDS (PV units, STATCOMS, RTU etc.). the HEMS in ADDRESS may be considered as an instance of IED for IED4L project
MGCC
Controller to operate opening/reclosure of microgrid and management when disconnected
Critical, it manages a separate grid in case of fault in the main grid
N
Not present except for some demonstration sites
U*
U*
U*
The microgrid was not the main focus of ADINE, INTEGRIS and ADDRESS projects. Microgrid controllers are already presents in literature, the novelty of IDE4L is the coordination with other IEDs for decentralized FLISR.
MOP Matches offers in the electrical market
Critical, It settles and clears the wholesale transactions (bids and offers)
U
The MOP is already present for electrical system, but it manages mainly power exchanges in transmission systems.
N Y N MO in IDE4L and ADDRESS has similar functionalities.
SAU(PSAU)
Monitoring, control and protection unit in substation
Critical, Manages the MV grid
N
(*) Some substations include already some "intelligent" units that are coordinating the physical devices in case of electrical faults and concentrating measurements. However
N N N In INTEGRIS and ADINE only data concentrator or generic controllers were present.

IDE4L Deliverable 3.3
47 IDE4L is a project co-funded by the European Commission
the SAU includes some high level algorithms as forecasts and state estimation
SAU(SSAU)
Monitoring, control and protection unit in substation Critical, manages the LV grid
N (*) N N N
Sensor
Transformers and transducers connected to measurement devices at substation (IEDs, PMUs or RTUs) and point of connection of electrical users (SMs)
Critical, physical connection of automation architecture to the field
Y
Already present in distribution systems to supply protection devices and RTU measurements. New installation are needed to supply PMUs and SMs
Y Y Y
SPP Y
TSOs and partially DSOs and BRPP already exploit external forecast services and repository for geographic and customer information
N N N
TSOEMS Management of transmission grid
Y Present in all transmission systems
Y Y Y
CIS Optional, they provide additional information for grid automation
Y It is a HW/SW at control center level
N N N Not focus of the projects
GIS Optional, they provide additional information for grid automation
Y It is a HW/SW at control center level
N N N Not focus of the projects
NIS Optional, they provide additional information for grid automation
Y It is a HW/SW at control center level
N N N Not focus of the projects
A tentative of formulating a quantitative index is the weight of new actors with respect to the state of the
art and with respect to other research projects. This index does not assume to completely define the level
of novelty but only to provide a generic idea. For a complete comprehension we suggest to read ADINE [8],
ADDRESS [10], INTEGRIS [9] and IDE4L [1], [2] deliverable regarding the architecture.
The first index (Index Actor (IA)1) is the percentage of actors that do not require any new installation or
update with regards to the automation actors already present in many distribution grids.
𝐼𝐴1 = 100 ∙𝑁𝑢𝑚𝑏𝑒𝑟 𝑎𝑐𝑡𝑜𝑟𝑠 𝑎𝑙𝑟𝑒𝑎𝑑𝑦 𝑝𝑟𝑒𝑠𝑒𝑛𝑡 𝑖𝑛 𝑓𝑖𝑒𝑙𝑑
𝑇𝑜𝑡𝑎𝑙 𝑛𝑢𝑚𝑏𝑒𝑟 𝐼𝐷𝐸4𝐿 𝑎𝑐𝑡𝑜𝑟𝑠[%] = 100 ∙
9
16[%] = 56,25 %
The second index 𝐼𝐴2 is the percentage of actors that require some new installation or update with regards
to the automation actors already present in many distribution grids.
𝐼𝐴2 = 100 ∙𝑁𝑢𝑚𝑏𝑒𝑟 𝑎𝑐𝑡𝑜𝑟𝑠 𝑡𝑜 𝑏𝑒 𝑢𝑝𝑑𝑎𝑡𝑒𝑑 𝑖𝑛 𝑓𝑖𝑒𝑙𝑑
𝑇𝑜𝑡𝑎𝑙 𝑛𝑢𝑚𝑏𝑒𝑟 𝐼𝐷𝐸4𝐿 𝑎𝑐𝑡𝑜𝑟𝑠[%] = 100 ∙
3
16[%] = 18,75 %
The third index 𝐼𝐴3 is the percentage of actors that are at the moment not present in many distribution
grids.
𝐼𝐴3 = 100 ∙𝑁𝑢𝑚𝑏𝑒𝑟 𝑎𝑐𝑡𝑜𝑟𝑠 𝑛𝑜𝑡 𝑖𝑛 𝑓𝑖𝑒𝑙𝑑
𝑇𝑜𝑡𝑎𝑙 𝑛𝑢𝑚𝑏𝑒𝑟 𝐼𝐷𝐸4𝐿 𝑎𝑐𝑡𝑜𝑟𝑠[%] = 100 ∙
4
16[%] = 25 %
Similarly, three other indexes may be defined for the comparison of IDE4L automation actors with other EU
research projects on smart grids.
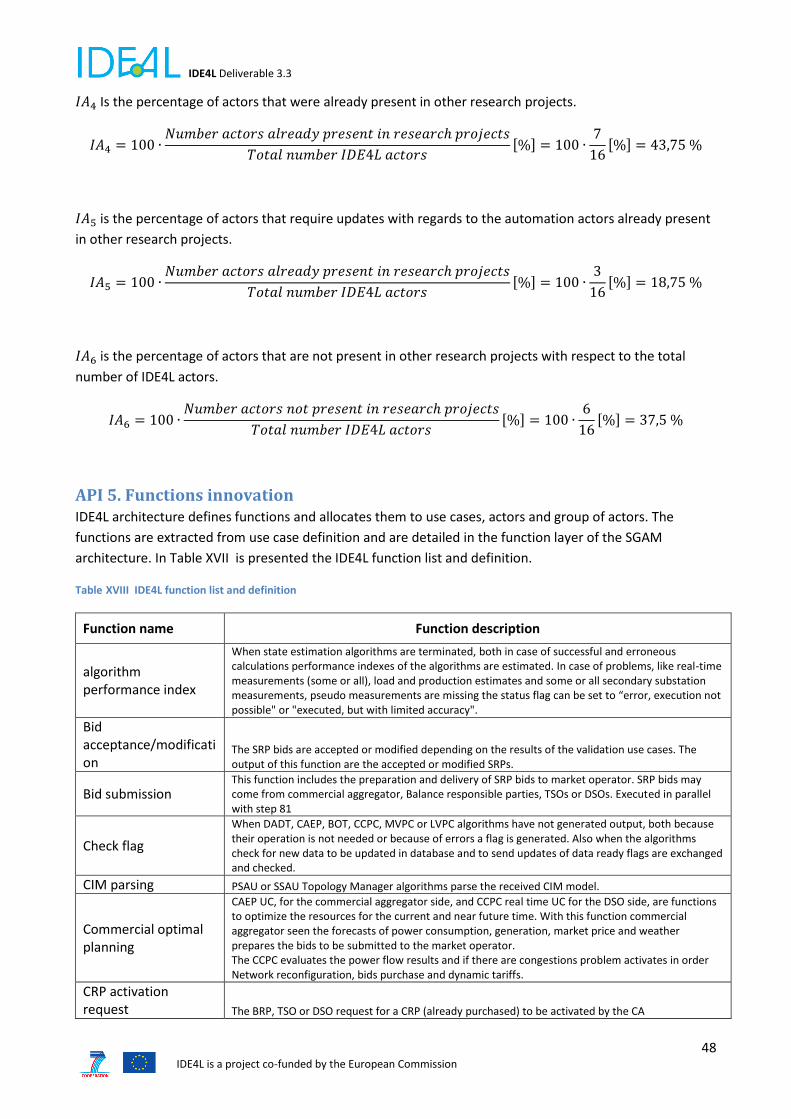
IDE4L Deliverable 3.3
48 IDE4L is a project co-funded by the European Commission
𝐼𝐴4 Is the percentage of actors that were already present in other research projects.
𝐼𝐴4 = 100 ∙𝑁𝑢𝑚𝑏𝑒𝑟 𝑎𝑐𝑡𝑜𝑟𝑠 𝑎𝑙𝑟𝑒𝑎𝑑𝑦 𝑝𝑟𝑒𝑠𝑒𝑛𝑡 𝑖𝑛 𝑟𝑒𝑠𝑒𝑎𝑟𝑐ℎ 𝑝𝑟𝑜𝑗𝑒𝑐𝑡𝑠
𝑇𝑜𝑡𝑎𝑙 𝑛𝑢𝑚𝑏𝑒𝑟 𝐼𝐷𝐸4𝐿 𝑎𝑐𝑡𝑜𝑟𝑠[%] = 100 ∙
7
16[%] = 43,75 %
𝐼𝐴5 is the percentage of actors that require updates with regards to the automation actors already present
in other research projects.
𝐼𝐴5 = 100 ∙𝑁𝑢𝑚𝑏𝑒𝑟 𝑎𝑐𝑡𝑜𝑟𝑠 𝑎𝑙𝑟𝑒𝑎𝑑𝑦 𝑝𝑟𝑒𝑠𝑒𝑛𝑡 𝑖𝑛 𝑟𝑒𝑠𝑒𝑎𝑟𝑐ℎ 𝑝𝑟𝑜𝑗𝑒𝑐𝑡𝑠
𝑇𝑜𝑡𝑎𝑙 𝑛𝑢𝑚𝑏𝑒𝑟 𝐼𝐷𝐸4𝐿 𝑎𝑐𝑡𝑜𝑟𝑠[%] = 100 ∙
3
16[%] = 18,75 %
𝐼𝐴6 is the percentage of actors that are not present in other research projects with respect to the total
number of IDE4L actors.
𝐼𝐴6 = 100 ∙𝑁𝑢𝑚𝑏𝑒𝑟 𝑎𝑐𝑡𝑜𝑟𝑠 𝑛𝑜𝑡 𝑝𝑟𝑒𝑠𝑒𝑛𝑡 𝑖𝑛 𝑟𝑒𝑠𝑒𝑎𝑟𝑐ℎ 𝑝𝑟𝑜𝑗𝑒𝑐𝑡𝑠
𝑇𝑜𝑡𝑎𝑙 𝑛𝑢𝑚𝑏𝑒𝑟 𝐼𝐷𝐸4𝐿 𝑎𝑐𝑡𝑜𝑟𝑠[%] = 100 ∙
6
16[%] = 37,5 %
API 5. Functions innovation IDE4L architecture defines functions and allocates them to use cases, actors and group of actors. The
functions are extracted from use case definition and are detailed in the function layer of the SGAM
architecture. In Table XVII is presented the IDE4L function list and definition.
Table XVIII IDE4L function list and definition
Function name Function description
algorithm performance index
When state estimation algorithms are terminated, both in case of successful and erroneous calculations performance indexes of the algorithms are estimated. In case of problems, like real-time measurements (some or all), load and production estimates and some or all secondary substation measurements, pseudo measurements are missing the status flag can be set to “error, execution not possible" or "executed, but with limited accuracy".
Bid acceptance/modification
The SRP bids are accepted or modified depending on the results of the validation use cases. The output of this function are the accepted or modified SRPs.
Bid submission This function includes the preparation and delivery of SRP bids to market operator. SRP bids may come from commercial aggregator, Balance responsible parties, TSOs or DSOs. Executed in parallel with step 81
Check flag
When DADT, CAEP, BOT, CCPC, MVPC or LVPC algorithms have not generated output, both because their operation is not needed or because of errors a flag is generated. Also when the algorithms check for new data to be updated in database and to send updates of data ready flags are exchanged and checked.
CIM parsing PSAU or SSAU Topology Manager algorithms parse the received CIM model.
Commercial optimal planning
CAEP UC, for the commercial aggregator side, and CCPC real time UC for the DSO side, are functions to optimize the resources for the current and near future time. With this function commercial aggregator seen the forecasts of power consumption, generation, market price and weather prepares the bids to be submitted to the market operator. The CCPC evaluates the power flow results and if there are congestions problem activates in order Network reconfiguration, bids purchase and dynamic tariffs.
CRP activation request The BRP, TSO or DSO request for a CRP (already purchased) to be activated by the CA
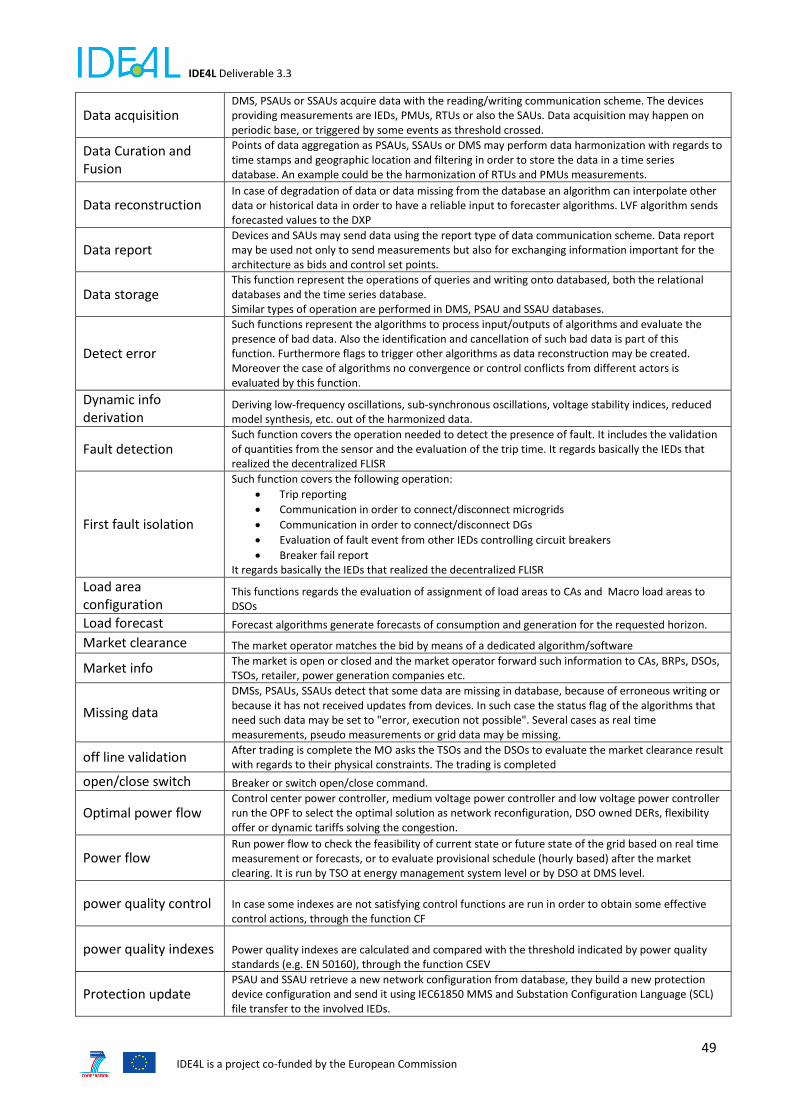
IDE4L Deliverable 3.3
49 IDE4L is a project co-funded by the European Commission
Data acquisition DMS, PSAUs or SSAUs acquire data with the reading/writing communication scheme. The devices providing measurements are IEDs, PMUs, RTUs or also the SAUs. Data acquisition may happen on periodic base, or triggered by some events as threshold crossed.
Data Curation and Fusion
Points of data aggregation as PSAUs, SSAUs or DMS may perform data harmonization with regards to time stamps and geographic location and filtering in order to store the data in a time series database. An example could be the harmonization of RTUs and PMUs measurements.
Data reconstruction In case of degradation of data or data missing from the database an algorithm can interpolate other data or historical data in order to have a reliable input to forecaster algorithms. LVF algorithm sends forecasted values to the DXP
Data report Devices and SAUs may send data using the report type of data communication scheme. Data report may be used not only to send measurements but also for exchanging information important for the architecture as bids and control set points.
Data storage This function represent the operations of queries and writing onto databased, both the relational databases and the time series database. Similar types of operation are performed in DMS, PSAU and SSAU databases.
Detect error
Such functions represent the algorithms to process input/outputs of algorithms and evaluate the presence of bad data. Also the identification and cancellation of such bad data is part of this function. Furthermore flags to trigger other algorithms as data reconstruction may be created. Moreover the case of algorithms no convergence or control conflicts from different actors is evaluated by this function.
Dynamic info derivation
Deriving low-frequency oscillations, sub-synchronous oscillations, voltage stability indices, reduced model synthesis, etc. out of the harmonized data.
Fault detection Such function covers the operation needed to detect the presence of fault. It includes the validation of quantities from the sensor and the evaluation of the trip time. It regards basically the IEDs that realized the decentralized FLISR
First fault isolation
Such function covers the following operation:
Trip reporting
Communication in order to connect/disconnect microgrids
Communication in order to connect/disconnect DGs
Evaluation of fault event from other IEDs controlling circuit breakers
Breaker fail report It regards basically the IEDs that realized the decentralized FLISR
Load area configuration
This functions regards the evaluation of assignment of load areas to CAs and Macro load areas to DSOs
Load forecast Forecast algorithms generate forecasts of consumption and generation for the requested horizon.
Market clearance The market operator matches the bid by means of a dedicated algorithm/software
Market info The market is open or closed and the market operator forward such information to CAs, BRPs, DSOs, TSOs, retailer, power generation companies etc.
Missing data
DMSs, PSAUs, SSAUs detect that some data are missing in database, because of erroneous writing or because it has not received updates from devices. In such case the status flag of the algorithms that need such data may be set to "error, execution not possible". Several cases as real time measurements, pseudo measurements or grid data may be missing.
off line validation After trading is complete the MO asks the TSOs and the DSOs to evaluate the market clearance result with regards to their physical constraints. The trading is completed
open/close switch Breaker or switch open/close command.
Optimal power flow Control center power controller, medium voltage power controller and low voltage power controller run the OPF to select the optimal solution as network reconfiguration, DSO owned DERs, flexibility offer or dynamic tariffs solving the congestion.
Power flow Run power flow to check the feasibility of current state or future state of the grid based on real time measurement or forecasts, or to evaluate provisional schedule (hourly based) after the market clearing. It is run by TSO at energy management system level or by DSO at DMS level.
power quality control In case some indexes are not satisfying control functions are run in order to obtain some effective control actions, through the function CF
power quality indexes Power quality indexes are calculated and compared with the threshold indicated by power quality standards (e.g. EN 50160), through the function CSEV
Protection update PSAU and SSAU retrieve a new network configuration from database, they build a new protection device configuration and send it using IEC61850 MMS and Substation Configuration Language (SCL) file transfer to the involved IEDs.
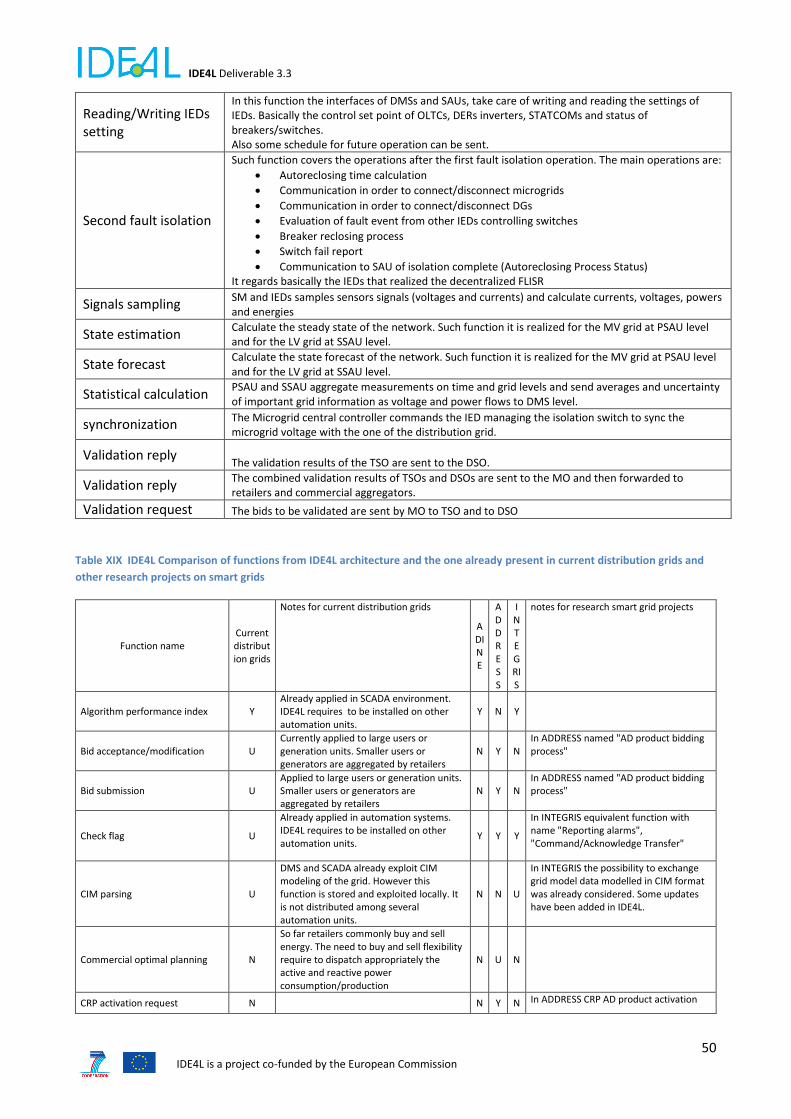
IDE4L Deliverable 3.3
50 IDE4L is a project co-funded by the European Commission
Reading/Writing IEDs setting
In this function the interfaces of DMSs and SAUs, take care of writing and reading the settings of IEDs. Basically the control set point of OLTCs, DERs inverters, STATCOMs and status of breakers/switches. Also some schedule for future operation can be sent.
Second fault isolation
Such function covers the operations after the first fault isolation operation. The main operations are:
Autoreclosing time calculation
Communication in order to connect/disconnect microgrids
Communication in order to connect/disconnect DGs
Evaluation of fault event from other IEDs controlling switches
Breaker reclosing process
Switch fail report
Communication to SAU of isolation complete (Autoreclosing Process Status) It regards basically the IEDs that realized the decentralized FLISR
Signals sampling SM and IEDs samples sensors signals (voltages and currents) and calculate currents, voltages, powers and energies
State estimation Calculate the steady state of the network. Such function it is realized for the MV grid at PSAU level and for the LV grid at SSAU level.
State forecast Calculate the state forecast of the network. Such function it is realized for the MV grid at PSAU level and for the LV grid at SSAU level.
Statistical calculation PSAU and SSAU aggregate measurements on time and grid levels and send averages and uncertainty of important grid information as voltage and power flows to DMS level.
synchronization The Microgrid central controller commands the IED managing the isolation switch to sync the microgrid voltage with the one of the distribution grid.
Validation reply The validation results of the TSO are sent to the DSO.
Validation reply The combined validation results of TSOs and DSOs are sent to the MO and then forwarded to retailers and commercial aggregators.
Validation request The bids to be validated are sent by MO to TSO and to DSO
Table XIX IDE4L Comparison of functions from IDE4L architecture and the one already present in current distribution grids and
other research projects on smart grids
Function name Current distribution grids
Notes for current distribution grids
ADINE
ADDRESS
INTEGRIS
notes for research smart grid projects
Algorithm performance index Y Already applied in SCADA environment. IDE4L requires to be installed on other automation units.
Y N Y
Bid acceptance/modification U Currently applied to large users or generation units. Smaller users or generators are aggregated by retailers
N Y N In ADDRESS named "AD product bidding process"
Bid submission U Applied to large users or generation units. Smaller users or generators are aggregated by retailers
N Y N In ADDRESS named "AD product bidding process"
Check flag U
Already applied in automation systems. IDE4L requires to be installed on other automation units.
Y Y Y
In INTEGRIS equivalent function with name "Reporting alarms", "Command/Acknowledge Transfer"
CIM parsing U
DMS and SCADA already exploit CIM modeling of the grid. However this function is stored and exploited locally. It is not distributed among several automation units.
N N U
In INTEGRIS the possibility to exchange grid model data modelled in CIM format was already considered. Some updates have been added in IDE4L.
Commercial optimal planning N
So far retailers commonly buy and sell energy. The need to buy and sell flexibility require to dispatch appropriately the active and reactive power consumption/production
N U N
CRP activation request N N Y N In ADDRESS CRP AD product activation

IDE4L Deliverable 3.3
51 IDE4L is a project co-funded by the European Commission
Data acquisition U
SCADA systems, already well spread in many distribution grids perform data acquisition from RTUs. This functionality will have to be extended to SAUs.
N N Y
In INTEGRIS Data collection and Data “intermediate” collection
Data Curation and Fusion U
Already done in SCADA. In IDE4L this function will include PMU data.
U N U
In INTEGRIS "Data “intermediate” collection" and Averaged measurements. However it did not include synchrophasors.
Data reconstruction N
State estimation, forecasts and other new functionalities are not present yet in distribution, exception made for some demonstration sites.
N N U
In INTEGRIS "Data “intermediate” collection" and Averaged measurements
Data report U
Data report from Smart Meters is already spread in distribution grids and substation IEDs. In IDE4L SAUs will also subscribe to measurement devices’ reports.
N N U
In INTEGRIS Data collection and Data “intermediate” collection and "Report of measured values"
Data storage Y
Y Y Y
In INTEGRIS Data Acquisition for SE or equivalent functions.
Detect error N
This function includes the detection of erroneous measurements or grid data.
Y*
Y*
Y*
* Not the main focus of the other research projects, but well defined in literature.
Dynamic info derivation N
PMU are poorly spread in distribution. Furthermore the calculation of dynamic indexes to be forwarded to transmission operators is not implemented yet.
N N N
Fault detection N
In distribution grid it is mainly implemented through relays.
N N U
In INTEGRIS named "Data of the fault" , "Info of faulty area" and "Fault monitoring". However the function has been updated in the decentralized FLISR use case
Fault isolation N
In distribution grid it is mainly implemented through relays.
N N U
In INTEGRIS "Switch control" and "Reasons for fault". However the function has been updated in the decentralized FLISR use case
Load area configuration N
N Y N
In ADDRESS named "Macro Load area configuration" and "assignment each consumer to a load area"
Load forecast N
Load forecast is performed mainly at transmission level. When is performed at distribution it is normally at global level and not for each MV and LV area
Y*
Y*
Y*
* Not the main focus of the other research projects, but well defined in literature.
Market clearance Y Already present in electrical market. N Y N
Market info Y Already present in electrical market. N y N
Missing data Y Already present in electrical market. N Y N
Non-convergence detection N
This function includes the detection of non-convergence of state estimation/forecast and power control functions.
Y*
Y*
Y*
* Not the main focus of the other research projects, but well defined in literature.
open/close switch Y Y N Y In INTEGRIS named "Switch control"
Optimal power flow N So far this is performed only in transmission, except for some demonstration sites in distribution
N U U in ADDRESS Technical feasibility evaluation; In INTEGRIS "MPFV Algorithm"
power flow U It is already spread, but not implemented in substation automation units.
Y N Y
power quality control N
In distribution this PQ control may be done, but only locally (for single nodes). IDE4L includes also control of OLTC and DERs in order to reduce PQ issues and extend this also to secondary substations.
N N N
power quality indexes U The current EU regulation [] asks to monitor each MV feeder at the primary substation.
N N U In INTEGRIS PQ measurements are defined.
Protection update N Communication exchange to update protection parameters is yet not present
N N N

IDE4L Deliverable 3.3
52 IDE4L is a project co-funded by the European Commission
algorithm performance index N N N N
Reading/Writing IEDs setting Y
Y Y Y In INTEGRIS with names Substation Command Transfer, DER Control, DG Control
Second fault isolation N This function is peculiar of the decentralized FLISR
N N N
Signals sampling Y Y Y Y In INTEGRIS "Measuring"
State estimation N Scarcely present in distribution grids, unless the few cases for research demonstration.
N N Y In INTEGRIS named "SE Algorithm"
State forecast N Scarcely present in distribution grids, unless the few cases for research demonstration.
Y*
Y*
Y*
* Not the main focus of the other research projects, but well defined in literature.
Statistical calculation Y
Measurements are already summarized in statistical indexes over certain periods of time
Y Y Y
In INTEGRIS named "averaged measurements"
Synchronization N PMU and GPS time reference are currently not exploited, unless for demonstration cases, in distribution
N N N
Validation reply N
Distribution system operators are able to visualize the status of the network and perform protection schemes or power flow redirection in case of congestions. However it still does not reply to energy market plans to avoid current or future congestions.
N Y N
in IDE4L, the new schedule, obtained after the validation process, is sent to the aggregator. In ADDRESS, it generally means the exchange of tables among TSOs, DSOs and aggregator.
Validation request N N Y N
A tentative of formulating a quantitative index is the weight of new functions with respect to the state of
the art and with respect to other research projects. This index does not assume to completely define the
level of novelty but only to provide a generic idea. For a complete comprehension we suggest to read
ADINE [8], ADDRESS [10], INTEGRIS [9] and IDE4L [1],[2] deliverables regarding the architecture.
The first index (Index Function (IF)1) is the percentage of functions that do not require any new
installation or update with regards to the functions already present in many distribution grids.
𝐼𝐹1 = 100 ∙𝑁𝑢𝑚𝑏𝑒𝑟 𝑓𝑢𝑛𝑐𝑡𝑖𝑜𝑛𝑠 𝑎𝑙𝑟𝑒𝑎𝑑𝑦 𝑝𝑟𝑒𝑠𝑒𝑛𝑡 𝑖𝑛 𝑓𝑖𝑒𝑙𝑑
𝑇𝑜𝑡𝑎𝑙 𝑛𝑢𝑚𝑏𝑒𝑟 𝐼𝐷𝐸4𝐿 𝑓𝑢𝑛𝑐𝑡𝑖𝑜𝑛𝑠[%] = 100 ∙
9
38[%] = 23,68 %
The second index 𝐼𝐹2 is the percentage of functions that require some new installation or update with
regards to the automation functions already present in many distribution grids.
𝐼𝐹2 = 100 ∙𝑁𝑢𝑚𝑏𝑒𝑟 𝑓𝑢𝑛𝑐𝑡𝑖𝑜𝑛𝑠 𝑡𝑜 𝑏𝑒 𝑢𝑝𝑑𝑎𝑡𝑒𝑑 𝑖𝑛 𝑓𝑖𝑒𝑙𝑑
𝑇𝑜𝑡𝑎𝑙 𝑛𝑢𝑚𝑏𝑒𝑟 𝐼𝐷𝐸4𝐿 𝑓𝑢𝑛𝑐𝑡𝑖𝑜𝑛𝑠 [%] = 100 ∙
9
38[%] = 23,68 %
The third index 𝐼𝐹3 is the percentage of functions that are at the moment not present in many distribution
grids.
𝐼𝐹3 = 100 ∙𝑁𝑢𝑚𝑏𝑒𝑟 𝑓𝑢𝑛𝑐𝑡𝑖𝑜𝑛𝑠 𝑛𝑜𝑡 𝑖𝑛 𝑓𝑖𝑒𝑙𝑑
𝑇𝑜𝑡𝑎𝑙 𝑛𝑢𝑚𝑏𝑒𝑟 𝐼𝐷𝐸4𝐿 𝑓𝑢𝑛𝑐𝑡𝑖𝑜𝑛𝑠 [%] = 100 ∙
20
38[%] = 52,64 %
Similarly, three other indexes may be defined for the comparison of IDE4L automation functions with other
EU research projects on smart grids.
𝐼𝐹4 is the percentage of actors that were already present in other research projects.

IDE4L Deliverable 3.3
53 IDE4L is a project co-funded by the European Commission
𝐼𝐹4 = 100 ∙𝑁𝑢𝑚𝑏𝑒𝑟 𝑓𝑢𝑛𝑐𝑡𝑖𝑜𝑛𝑠 𝑎𝑙𝑟𝑒𝑎𝑑𝑦 𝑝𝑟𝑒𝑠𝑒𝑛𝑡 𝑖𝑛 𝑟𝑒𝑠𝑒𝑎𝑟𝑐ℎ 𝑝𝑟𝑜𝑗𝑒𝑐𝑡𝑠
𝑇𝑜𝑡𝑎𝑙 𝑛𝑢𝑚𝑏𝑒𝑟 𝐼𝐷𝐸4𝐿 𝑓𝑢𝑛𝑐𝑡𝑖𝑜𝑛𝑠 [%] = 100 ∙
24
38[%] = 63,16 %
𝐼𝐹5 is the percentage of functions that require updates with regards to the automation functions already
present in other research projects.
𝐼𝐹5 = 100 ∙𝑁𝑢𝑚𝑏𝑒𝑟 𝑓𝑢𝑛𝑐𝑡𝑖𝑜𝑛𝑠 𝑎𝑙𝑟𝑒𝑎𝑑𝑦 𝑝𝑟𝑒𝑠𝑒𝑛𝑡 𝑖𝑛 𝑟𝑒𝑠𝑒𝑎𝑟𝑐ℎ 𝑝𝑟𝑜𝑗𝑒𝑐𝑡𝑠
𝑇𝑜𝑡𝑎𝑙 𝑛𝑢𝑚𝑏𝑒𝑟 𝐼𝐷𝐸4𝐿 𝑓𝑢𝑛𝑐𝑡𝑖𝑜𝑛𝑠 [%] = 100 ∙
9
38[%] = 23,68 %
𝐼𝐹6 is the percentage of functions that are not present in other research projects with respect to the total
number of IDE4L functions,
𝐼𝐴6 = 100 ∙𝑁𝑢𝑚𝑏𝑒𝑟 𝑓𝑢𝑛𝑐𝑡𝑖𝑜𝑛𝑠 𝑛𝑜𝑡 𝑝𝑟𝑒𝑠𝑒𝑛𝑡 𝑖𝑛 𝑟𝑒𝑠𝑒𝑎𝑟𝑐ℎ 𝑝𝑟𝑜𝑗𝑒𝑐𝑡𝑠
𝑇𝑜𝑡𝑎𝑙 𝑛𝑢𝑚𝑏𝑒𝑟 𝐼𝐷𝐸4𝐿 𝑓𝑢𝑛𝑐𝑡𝑖𝑜𝑛𝑠 [%] = 100 ∙
5
38[%] = 13,16 %
API 6. Information exchange innovation IDE4L projects defined the information exchange among actors in use cases in terms of information
content, communication requirements and communication protocol. These set of information is hardly
comparable with other projects that rarely arrived to such level of details and therefore, the API on the
information exchange will not include any comparison with state of the art and other projects on smart
grids. The regular and event-based information exchanges have been clustered and defined in terms of
Information Producer (IP), Information Receiver (IR), Information Exchange (IE), the Amount of Data (AD) to
be exchanged and the Reporting Rate (RR) required for the regular information and the Maximum Transfer
Time (MTT) for event-base information exchange.
Automation actors exchange information on regular base or in case of events; these two cases lead
different requirements on the HW and SW interfaces and on the communication infrastructure. Events that
may trigger unexpected information exchange may be electrical faults, line congestions, estimated or
forecasted issues in the state of the grid. The amount of data to be exchanged is calculated under the
assumption that the DSO, through its DMS manages a total of 10 primary substations, each one having MV
grids with 250 buses. Each MV bus has a secondary substation with a LV grid of 250 buses.
Such assumption is realistic for the EU distribution networks and in particular for the demo site UNARETI.
Therefore, there will be a total of 250 primary and secondary SAUs. Moreover, it is assumed to have a
generic measurement device (IED or a SM) in each node of MV and LV.
It is assumed that a PMU is installed at each substation, both primary and secondary, and in each feeder.
Considering an average of three feeders, both in MV and LV grid, there will be totally 4 PMUs providing
measurements to each PSAU and SSAU. The assumption on the number of IEDs and PMU does not
represent a requirement for any of IDE4L functionalities but is intended to represent a worst case scenario
from the point of view of communication burden.
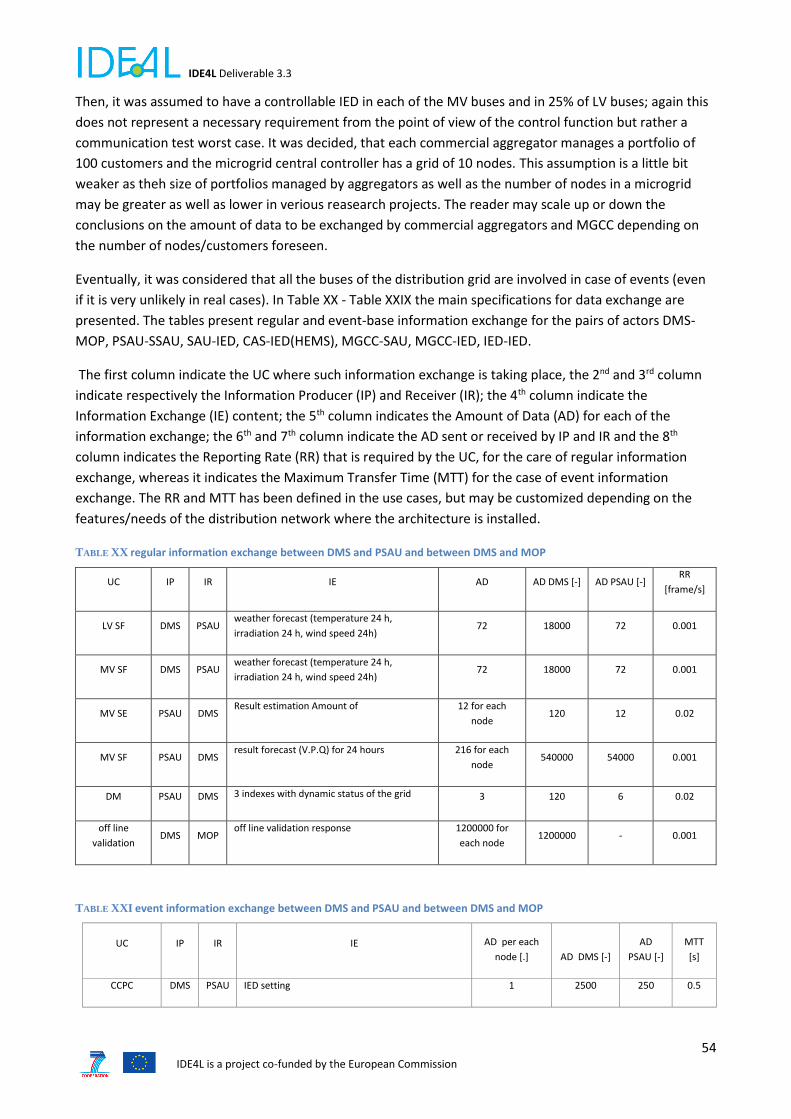
IDE4L Deliverable 3.3
54 IDE4L is a project co-funded by the European Commission
Then, it was assumed to have a controllable IED in each of the MV buses and in 25% of LV buses; again this
does not represent a necessary requirement from the point of view of the control function but rather a
communication test worst case. It was decided, that each commercial aggregator manages a portfolio of
100 customers and the microgrid central controller has a grid of 10 nodes. This assumption is a little bit
weaker as theh size of portfolios managed by aggregators as well as the number of nodes in a microgrid
may be greater as well as lower in verious reasearch projects. The reader may scale up or down the
conclusions on the amount of data to be exchanged by commercial aggregators and MGCC depending on
the number of nodes/customers foreseen.
Eventually, it was considered that all the buses of the distribution grid are involved in case of events (even
if it is very unlikely in real cases). In Table XX - Table XXIX the main specifications for data exchange are
presented. The tables present regular and event-base information exchange for the pairs of actors DMS-
MOP, PSAU-SSAU, SAU-IED, CAS-IED(HEMS), MGCC-SAU, MGCC-IED, IED-IED.
The first column indicate the UC where such information exchange is taking place, the 2nd and 3rd column
indicate respectively the Information Producer (IP) and Receiver (IR); the 4th column indicate the
Information Exchange (IE) content; the 5th column indicates the Amount of Data (AD) for each of the
information exchange; the 6th and 7th column indicate the AD sent or received by IP and IR and the 8th
column indicates the Reporting Rate (RR) that is required by the UC, for the care of regular information
exchange, whereas it indicates the Maximum Transfer Time (MTT) for the case of event information
exchange. The RR and MTT has been defined in the use cases, but may be customized depending on the
features/needs of the distribution network where the architecture is installed.
TABLE XX regular information exchange between DMS and PSAU and between DMS and MOP
UC IP IR IE AD AD DMS [-] AD PSAU [-] RR
[frame/s]
LV SF DMS PSAU weather forecast (temperature 24 h,
irradiation 24 h, wind speed 24h) 72 18000 72 0.001
MV SF DMS PSAU weather forecast (temperature 24 h,
irradiation 24 h, wind speed 24h) 72 18000 72 0.001
MV SE PSAU DMS Result estimation Amount of 12 for each
node 120 12 0.02
MV SF PSAU DMS result forecast (V.P.Q) for 24 hours 216 for each
node 540000 54000 0.001
DM PSAU DMS 3 indexes with dynamic status of the grid 3 120 6 0.02
off line
validation DMS MOP
off line validation response 1200000 for
each node 1200000 - 0.001
TABLE XXI event information exchange between DMS and PSAU and between DMS and MOP
UC IP IR IE AD per each
node [.] AD DMS [-]
AD
PSAU [-]
MTT
[s]
CCPC DMS PSAU IED setting 1 2500 250 0.5

IDE4L Deliverable 3.3
55 IDE4L is a project co-funded by the European Commission
LV Mon. DMS PSAU SWI-BRE status move to event 3 7500 187.5 300
MV Mon. DMS PSAU SWI-BRE status 1 2500 62.5 300
LV Mon. PSAU DMS SWI-BRE status 3 7500 187.5 300
MV Mon. PSAU DMS SWI-BRE status 1 2500 62.5 300
CCPC DMS MOP flexibility demand bill day ahead market (power,
flexibility band, time of activation, price) 1200000 3000000000 - 86400
CCPC DMS MOP flexibility demand bill infra day market (power,
flexibility band, time of activation, price) 12500 31250000 - 900
real time
validation DMS MOP
real time validation response 12500 31250000 - 900
real time
validation MOP DMS
real time validation request 12500 31250000 - 900
TABLE XXII regular information exchange between PSAU and SSAU
UC IP IR IE AD AD PSAU [-] AD SSAU [-] RR[frame/s]
MV SE PSAU SSAU Estimation at point of connection (V.P.Q) 9 2250 9 0.02
LV SF PSAU SSAU weather forecast (temperature 24 h, irradiation 24 h, wind speed 24h) 72 18000 72 0.001
MV SF PSAU SSAU Forecast point of connection for 24 hours 216 54000 216 0.001
LV SE SSAU PSAU Estimation at point of connection (V.P.Q) 9 2250 9 0.02
LV SF SSAU PSAU Forecast point of connection for 24 hours 216 54000 216 0.001
DM SSAU PSAU 3 indexes with dynamic status of the grid 3 6 3 0.02
TABLE XXIII event information exchange between PSAU and SSAU
UC IP IR IE
AD per
each node
[.]
AD PSAU [-] AD SSAU [-] MTT [s]
LV Mon. PSAU SSAU SWI-BRE status 3 46875 187.5 300
LV Mon. SSAU PSAU SWI-BRE status 3 46875 187.5 300
TABLE XXIV regular information exchange between PSAU and IED and between SSAU and IED
UC IP IR IE AD AD SAU [-] AD IED [-
]
RR
[frame/s]
LV Mon. IED SSAU 3ph V RMS. P. Q measurements and connection status 12 for each node 3000 12 0.02
MV
Mon. IED PSAU 3ph V RMS. P. Q measurements and connection status 12 for each node 3000 12 0.02
DM IED. PMU SSAU 3ph V and I. phasor 12 for each node 24 12 50

IDE4L Deliverable 3.3
56 IDE4L is a project co-funded by the European Commission
DM IED. PMU PSAU 3ph V and I. phasor 12 for each node 48 12 50
TABLE XXV event information exchange between PSAU and IED and between SSAU and IED
UC IP IR IE AD per each
node [.] AD SAU [-]
AD IED [-
] MTT [s]
FLISR PSAU IED switch-breaker control 1 250 1 0.1
FLISR SSAU IED switch-breaker control 3 187.5 3 0.1
FLISR IED PSAU switch-breaker status 1 250 1 0.1
FLISR IED SSAU switch-breaker status 3 187.5 3 0.1
MVPC PSAU IED IED setting (single phase) 1 250 1 0.5
MVPC IED PSAU IED status 1 250 1 0.5
LVPC SSAU IED IED setting 3 187.5 3 0.5
LVPC IED SSAU IED status 3 187.5 3 0.5
CCPC PSAU IED IED setting 1 250 1 0.5
CCPC IED PSAU IED status 1 250 1 0.5
TABLE XXVI regular information exchange between CAS and IED(HEMS)
UC IP IR IE AD AD IED [-]
AD
CAAS
[-]
RR
[frame/s]
CAEP CAS IED.HEMS Energy plan to be activated (power set point, time tag, flexibility, for 15 minutes rage for 24 h)
480
for
each
node
480 48000 0.001
TABLE XXVII event information exchange between CAS and IED(HEMS)
UC IP IR IE AD per each
node [.] AD IED [-] AD CAAS [-] MTT [s]
CAEP CAS IED(HEMS) Energy plan to be activated (power set
point time tag, flexibility, for 15 minutes rage
for 24 h)
5 5 500 300
TABLE XXVIII event information exchange between SAU and MGCC
UC IP IR IE AD per each
node [.]
AD
SAU[-] AD MGCC [-] MTT [s]
FLISR PSAU MGCC switch-breaker control 1 10 1 0.1
FLISR SSAU MGCC switch-breaker control 3 30 3 0.1
FLISR MGCC PSAU switch-breaker status 1 10 1 0.1
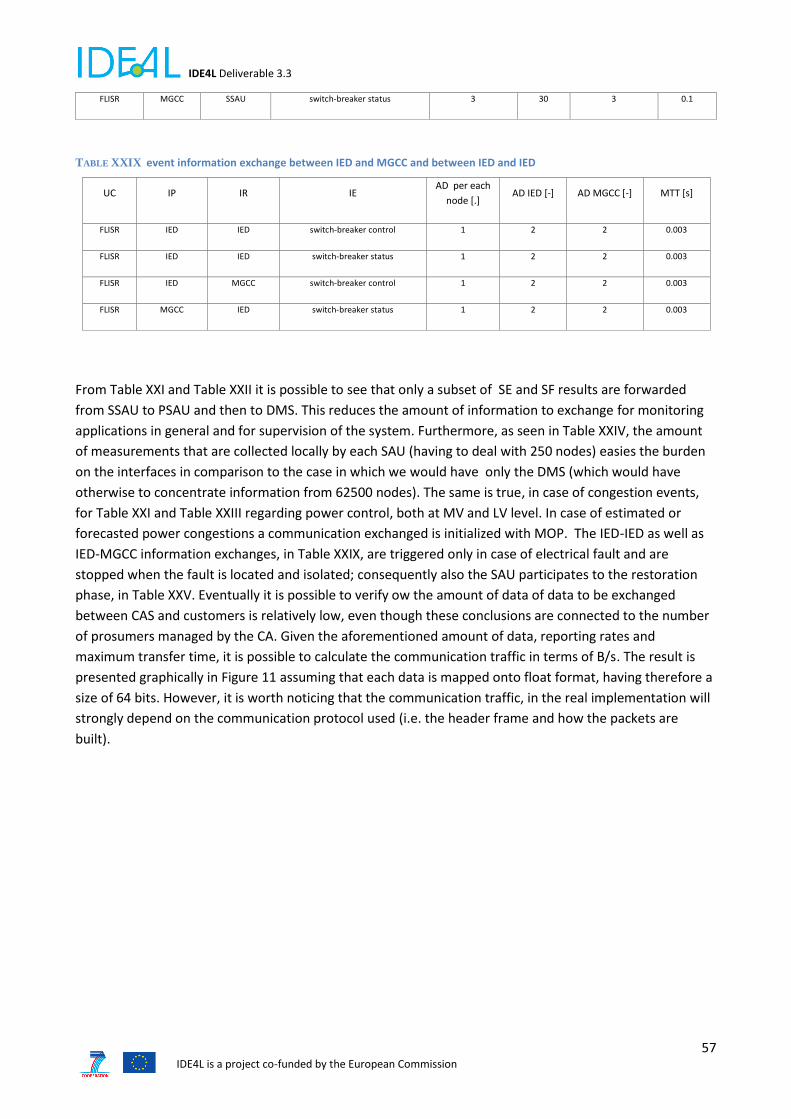
IDE4L Deliverable 3.3
57 IDE4L is a project co-funded by the European Commission
FLISR MGCC SSAU switch-breaker status 3 30 3 0.1
TABLE XXIX event information exchange between IED and MGCC and between IED and IED
UC IP IR IE AD per each
node [.] AD IED [-] AD MGCC [-] MTT [s]
FLISR IED IED switch-breaker control 1 2 2 0.003
FLISR IED IED switch-breaker status 1 2 2 0.003
FLISR IED MGCC switch-breaker control 1 2 2 0.003
FLISR MGCC IED switch-breaker status 1 2 2 0.003
From Table XXI and Table XXII it is possible to see that only a subset of SE and SF results are forwarded
from SSAU to PSAU and then to DMS. This reduces the amount of information to exchange for monitoring
applications in general and for supervision of the system. Furthermore, as seen in Table XXIV, the amount
of measurements that are collected locally by each SAU (having to deal with 250 nodes) easies the burden
on the interfaces in comparison to the case in which we would have only the DMS (which would have
otherwise to concentrate information from 62500 nodes). The same is true, in case of congestion events,
for Table XXI and Table XXIII regarding power control, both at MV and LV level. In case of estimated or
forecasted power congestions a communication exchanged is initialized with MOP. The IED-IED as well as
IED-MGCC information exchanges, in Table XXIX, are triggered only in case of electrical fault and are
stopped when the fault is located and isolated; consequently also the SAU participates to the restoration
phase, in Table XXV. Eventually it is possible to verify ow the amount of data of data to be exchanged
between CAS and customers is relatively low, even though these conclusions are connected to the number
of prosumers managed by the CA. Given the aforementioned amount of data, reporting rates and
maximum transfer time, it is possible to calculate the communication traffic in terms of B/s. The result is
presented graphically in Figure 11 assuming that each data is mapped onto float format, having therefore a
size of 64 bits. However, it is worth noticing that the communication traffic, in the real implementation will
strongly depend on the communication protocol used (i.e. the header frame and how the packets are
built).
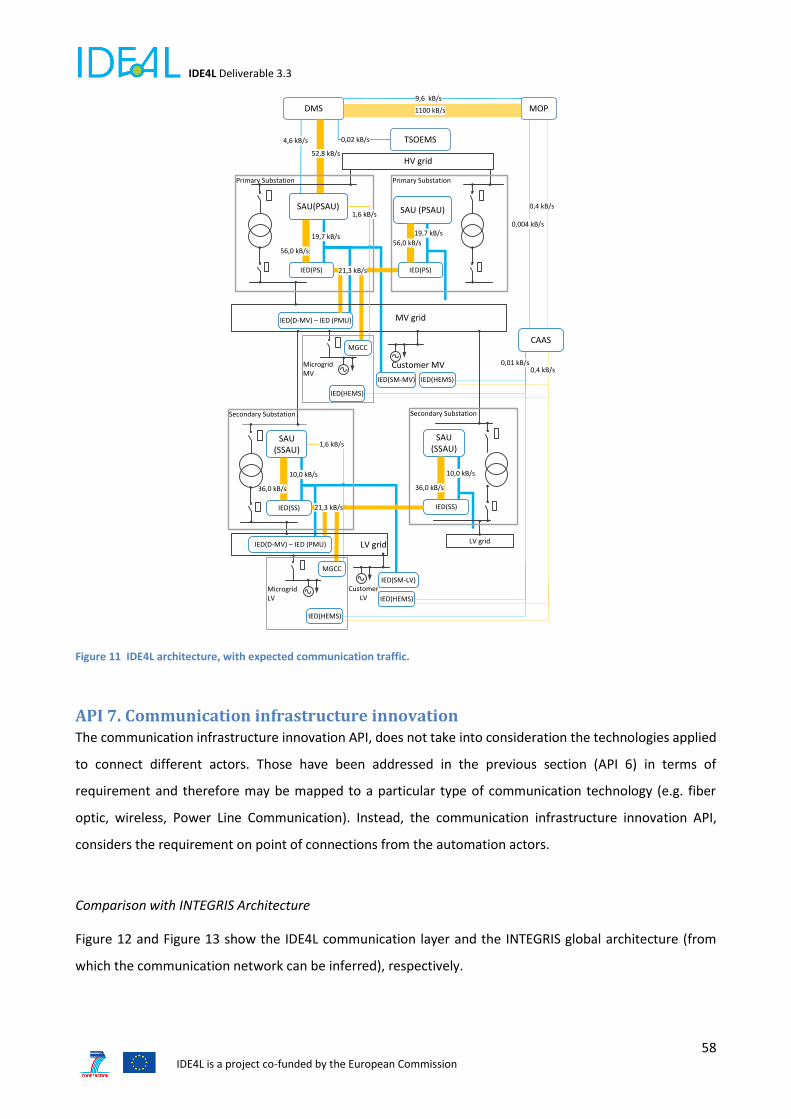
IDE4L Deliverable 3.3
58 IDE4L is a project co-funded by the European Commission
Figure 11 IDE4L architecture, with expected communication traffic.
API 7. Communication infrastructure innovation The communication infrastructure innovation API, does not take into consideration the technologies applied
to connect different actors. Those have been addressed in the previous section (API 6) in terms of
requirement and therefore may be mapped to a particular type of communication technology (e.g. fiber
optic, wireless, Power Line Communication). Instead, the communication infrastructure innovation API,
considers the requirement on point of connections from the automation actors.
Comparison with INTEGRIS Architecture
Figure 12 and Figure 13 show the IDE4L communication layer and the INTEGRIS global architecture (from
which the communication network can be inferred), respectively.
Customer LV
IED(PS)
SAU (PSAU)
19,7 kB/s
56,0 kB/s
IED(PS)
SAU(PSAU)
19,7 kB/s
56,0 kB/s
IED(D-MV) – IED (PMU)
IED(SM-MV)
4,6 kB/s
DMS
52,8 kB/s
MGCC
21,3 kB/s
IED(SS)
SAU (SSAU)
10,0 kB/s
36,0 kB/s
IED(SS)
SAU (SSAU)
10,0 kB/s
36,0 kB/s
IED(D-MV) – IED (PMU)
MGCC
1,6 kB/s
IED(SM-LV)
IED(HEMS)
IED(HEMS)
21,3 kB/s
IED(HEMS)
IED(HEMS)
CAAS
0,4 kB/s0,01 kB/s
MOP1100 kB/s
9,6 kB/s
0,4 kB/s
0,004 kB/s
TSOEMS
LV gridLV grid
HV grid
Customer MV
MV grid
Primary Substation
Microgrid MV
MicrogridLV
Primary Substation
Secondary SubstationSecondary Substation
0,02 kB/s
1,6 kB/s

IDE4L Deliverable 3.3
59 IDE4L is a project co-funded by the European Commission
Table XXX lists the switches incorporated in the IDE4L communication network, divided into two sections:
those which are in common with the INTEGRIS architecture and those which are specific to IDE4L
architecture.
Table XXX Switches used in IDE4L communication network vs INTEGRIS network
In Common with INTEGRIS Architecture Specific to IDE4L Architecture
TSO (Transmission System operator)
Retailer
DSO (Distribution System Operator)
PS (Primary Substation)
SS (Secondary Substation)
LV Cabinet
Prosumer (HEMS: Home Energy
Management System)
MO (Market Operator)
BRP (Balance Responsible Party)
SP (Service Provider)
CA (Commercial Aggregator)
MGCC (Microgrid Control Center)
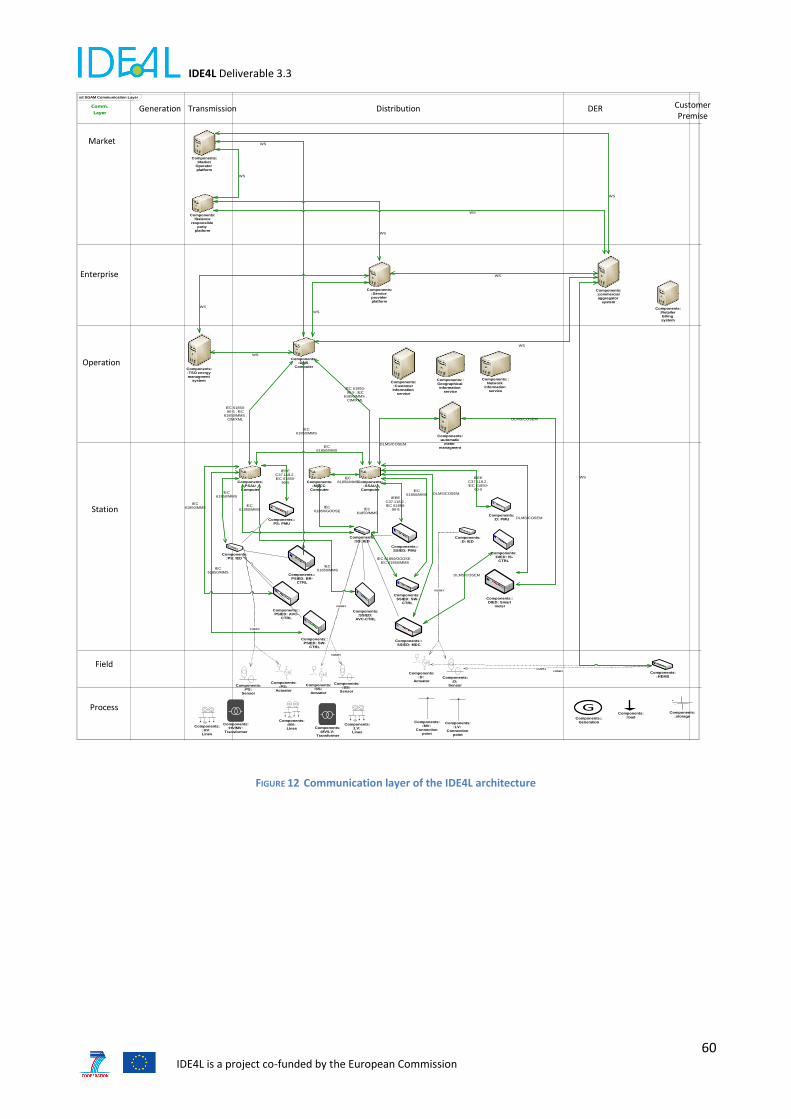
IDE4L Deliverable 3.3
60 IDE4L is a project co-funded by the European Commission
Generation Transmission Distribution DER Customer Premise
Market
Enterprise
Operation
Station
Field
Process
sd SGAM Communication Layer
Comm.
Layer
Components::D: IED
Components::PS: IED
Components::PSAU
Computer
Components::SSAU
Computer
Components::DMS
Computer
Components::commercial aggregator
system
+
-
Components::storage
Components::HV: Lines
Components::HV/MV:
Transformer
Components::LV: Lines
Components::MV: Lines Components:
:MV/LV: Transformer
Components::SS:
Sensor
Components::SS:
Actuator
Components::SS: IED
Components::D:
ActuatorComponents:
:D: Sensor
Components::PS:
Actuator
Components::PS:
Sensor
Components::load
Components::LV:
Connection point
Components::MV:
Connection point
GComponents::
Generation
Components::HEMS
Components::MGCC
Computer
Components::Market
Operator platform
Components::TSO energy managment
system
Components::Service provider platform
Components::D: PMU
Components::DIED: IS-
CTRL
Components::DIED: Smart
meter
Components::SSIED: MDC
Components::SSIED: SW-
CTRL
Components::SSIED:
AVC-CTRL
Components::SSIED: PMU
Components::PSIED: BR-
CTRL
Components::PSIED: SW-
CTRL
Components::PSIED: AVC-
CTRL
Components::PS: PMU
Components::Retailer
billing system
Components::Customer Information
service
Components::Geographical information
service
Components::Network
information service
Components::automatic
meter managment
Components::Balance
responsible party
platform
IEC61850/GOOSE
«use»
IEC61850/MMS
IEC61850/MMS
IEEEC37.118.2 ,IEC 61850-
90-5
IEC61850/MMS
WS
IEC61850/MMS
IEC61850/MMS
WS
IEC61850/MMS
«use»
WS
DLMS/COSEM
«use»
IEEEC37.118.2 ,IEC 61850-
90-5
«use»
DLMS/COSEM
WS
«use»
IEC61850/MMS
IEC61850/MMS
IEC61850/MMS
DLMS/COSEM
IEC61850/MMS
IEC 61850-90-5 , IEC
61850/MMS ,CIM/XML
«use»
IEC 61850-90-5 , IEC
61850/MMS ,CIM/XML
WS
WS
WS
«use»
WS
WS
WS
DLMS/COSEM
IEEEC37.118.2 ,IEC 61850-
90-5
WS
«use»
IEC 61850/GOOSE ,IEC 61850/MMS
DLMS/COSEM
FIGURE 12 Communication layer of the IDE4L architecture
IDE4L Deliverable 3.3
61 IDE4L is a project co-funded by the European Commission
FIGURE 13 GLOBAL ARCHITECTURE OF INTEGRIS
Using the list of switches, mentioned in Table 1, the API can be obtained as:
𝐶𝐼𝐼 = 100 5
12[%] ≅ 42 %
Comparison with UNARETI Communication Network
UNARETI physical model may be found in Figure 2. It is possible to infer the communication switch already
present and compare to the IDE4L architecture case, as shown in Table XXXI.
Table XXXI Switches used in IDE4L communication network vs UNARETI network
In Common with UNARETI architecture Specific to IDE4L Architecture
DSO (Distribution System Operator)
PS (Primary Substation)
SS (Secondary Substation)
LV Cabinet
Prosumer (HEMS: Home Energy
Management System)
MO (Market Operator)
BRP (Balance Responsible Party)
SP (Service Provider)
CA (Commercial Aggregator)
MGCC (Microgrid Control Center)
TSO (Transmission System operator)
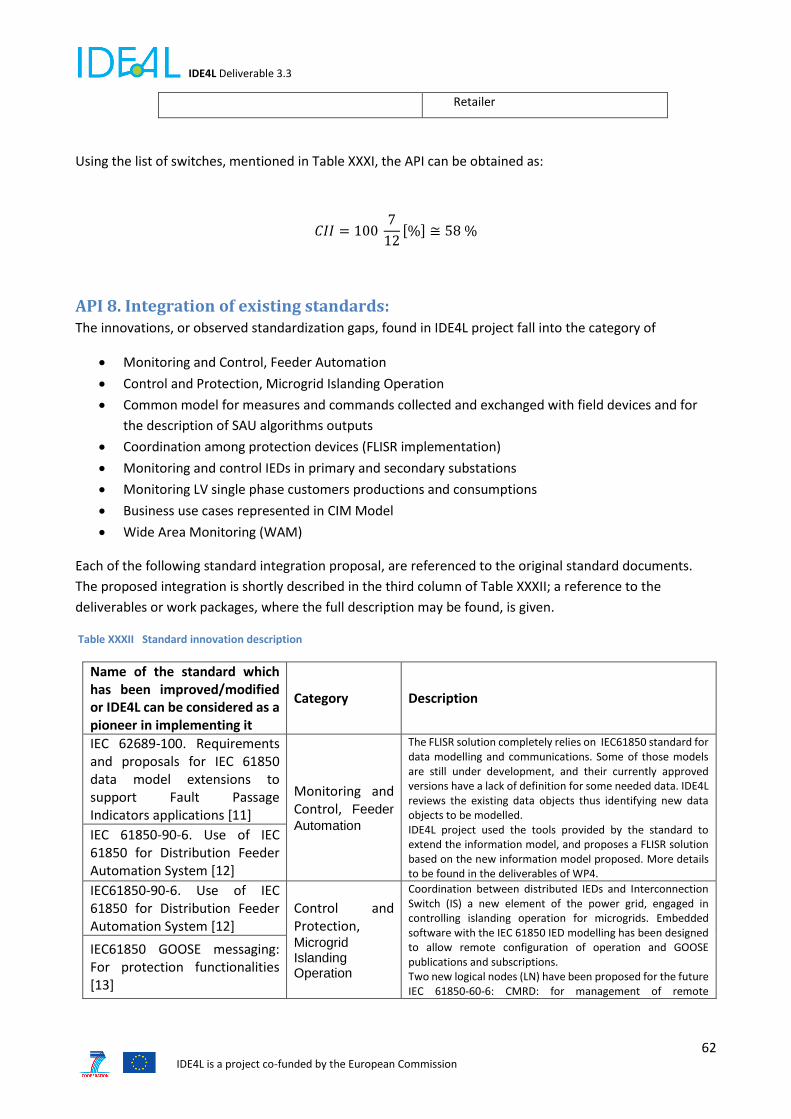
IDE4L Deliverable 3.3
62 IDE4L is a project co-funded by the European Commission
Retailer
Using the list of switches, mentioned in Table XXXI, the API can be obtained as:
𝐶𝐼𝐼 = 100 7
12[%] ≅ 58 %
API 8. Integration of existing standards: The innovations, or observed standardization gaps, found in IDE4L project fall into the category of
Monitoring and Control, Feeder Automation
Control and Protection, Microgrid Islanding Operation
Common model for measures and commands collected and exchanged with field devices and for
the description of SAU algorithms outputs
Coordination among protection devices (FLISR implementation)
Monitoring and control IEDs in primary and secondary substations
Monitoring LV single phase customers productions and consumptions
Business use cases represented in CIM Model
Wide Area Monitoring (WAM)
Each of the following standard integration proposal, are referenced to the original standard documents.
The proposed integration is shortly described in the third column of Table XXXII; a reference to the
deliverables or work packages, where the full description may be found, is given.
Table XXXII Standard innovation description
Name of the standard which has been improved/modified or IDE4L can be considered as a pioneer in implementing it
Category Description
IEC 62689-100. Requirements and proposals for IEC 61850 data model extensions to support Fault Passage Indicators applications [11]
Monitoring and Control, Feeder
Automation
The FLISR solution completely relies on IEC61850 standard for data modelling and communications. Some of those models are still under development, and their currently approved versions have a lack of definition for some needed data. IDE4L reviews the existing data objects thus identifying new data objects to be modelled. IDE4L project used the tools provided by the standard to extend the information model, and proposes a FLISR solution based on the new information model proposed. More details to be found in the deliverables of WP4.
IEC 61850-90-6. Use of IEC 61850 for Distribution Feeder Automation System [12]
IEC61850-90-6. Use of IEC 61850 for Distribution Feeder Automation System [12]
Control and Protection, Microgrid Islanding Operation
Coordination between distributed IEDs and Interconnection Switch (IS) a new element of the power grid, engaged in controlling islanding operation for microgrids. Embedded software with the IEC 61850 IED modelling has been designed to allow remote configuration of operation and GOOSE publications and subscriptions. Two new logical nodes (LN) have been proposed for the future IEC 61850-60-6: CMRD: for management of remote
IEC61850 GOOSE messaging: For protection functionalities [13]
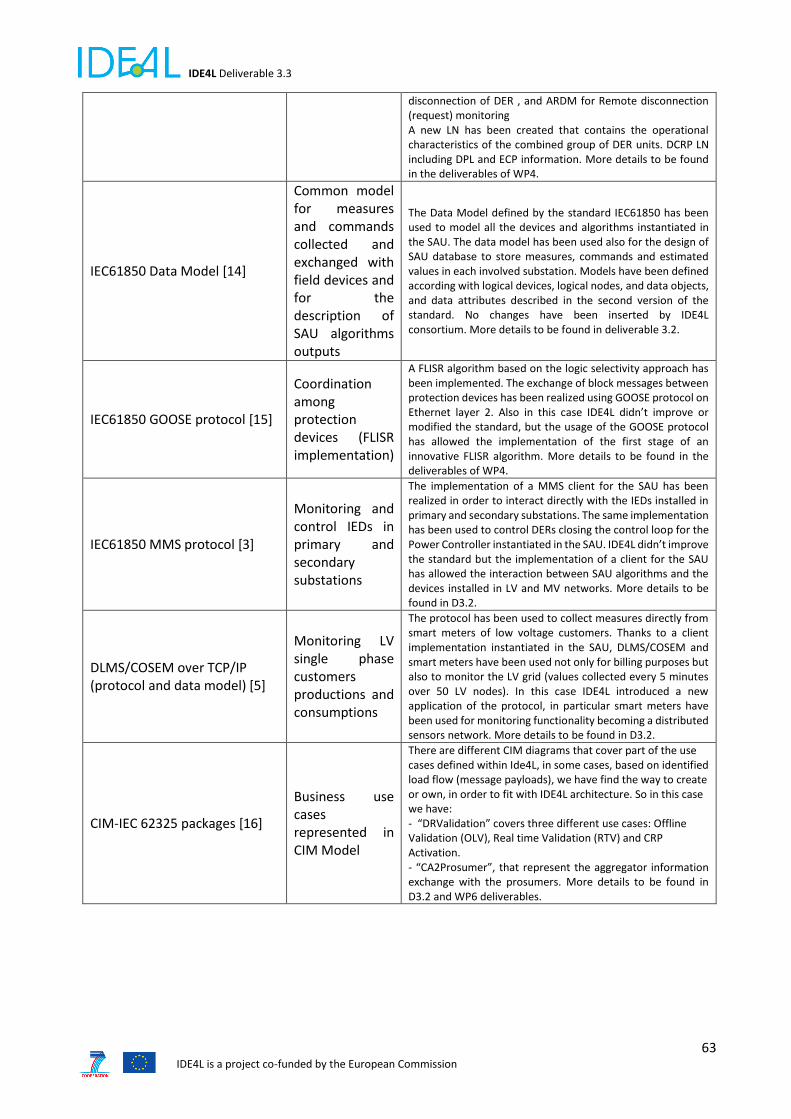
IDE4L Deliverable 3.3
63 IDE4L is a project co-funded by the European Commission
disconnection of DER , and ARDM for Remote disconnection (request) monitoring A new LN has been created that contains the operational characteristics of the combined group of DER units. DCRP LN including DPL and ECP information. More details to be found in the deliverables of WP4.
IEC61850 Data Model [14]
Common model for measures and commands collected and exchanged with field devices and for the description of SAU algorithms outputs
The Data Model defined by the standard IEC61850 has been used to model all the devices and algorithms instantiated in the SAU. The data model has been used also for the design of SAU database to store measures, commands and estimated values in each involved substation. Models have been defined according with logical devices, logical nodes, and data objects, and data attributes described in the second version of the standard. No changes have been inserted by IDE4L consortium. More details to be found in deliverable 3.2.
IEC61850 GOOSE protocol [15]
Coordination among protection devices (FLISR implementation)
A FLISR algorithm based on the logic selectivity approach has been implemented. The exchange of block messages between protection devices has been realized using GOOSE protocol on Ethernet layer 2. Also in this case IDE4L didn’t improve or modified the standard, but the usage of the GOOSE protocol has allowed the implementation of the first stage of an innovative FLISR algorithm. More details to be found in the deliverables of WP4.
IEC61850 MMS protocol [3]
Monitoring and control IEDs in primary and secondary substations
The implementation of a MMS client for the SAU has been realized in order to interact directly with the IEDs installed in primary and secondary substations. The same implementation has been used to control DERs closing the control loop for the Power Controller instantiated in the SAU. IDE4L didn’t improve the standard but the implementation of a client for the SAU has allowed the interaction between SAU algorithms and the devices installed in LV and MV networks. More details to be found in D3.2.
DLMS/COSEM over TCP/IP (protocol and data model) [5]
Monitoring LV single phase customers productions and consumptions
The protocol has been used to collect measures directly from smart meters of low voltage customers. Thanks to a client implementation instantiated in the SAU, DLMS/COSEM and smart meters have been used not only for billing purposes but also to monitor the LV grid (values collected every 5 minutes over 50 LV nodes). In this case IDE4L introduced a new application of the protocol, in particular smart meters have been used for monitoring functionality becoming a distributed sensors network. More details to be found in D3.2.
CIM-IEC 62325 packages [16]
Business use cases represented in CIM Model
There are different CIM diagrams that cover part of the use cases defined within Ide4L, in some cases, based on identified load flow (message payloads), we have find the way to create or own, in order to fit with IDE4L architecture. So in this case we have: - “DRValidation” covers three different use cases: Offline Validation (OLV), Real time Validation (RTV) and CRP Activation. - “CA2Prosumer”, that represent the aggregator information exchange with the prosumers. More details to be found in D3.2 and WP6 deliverables.
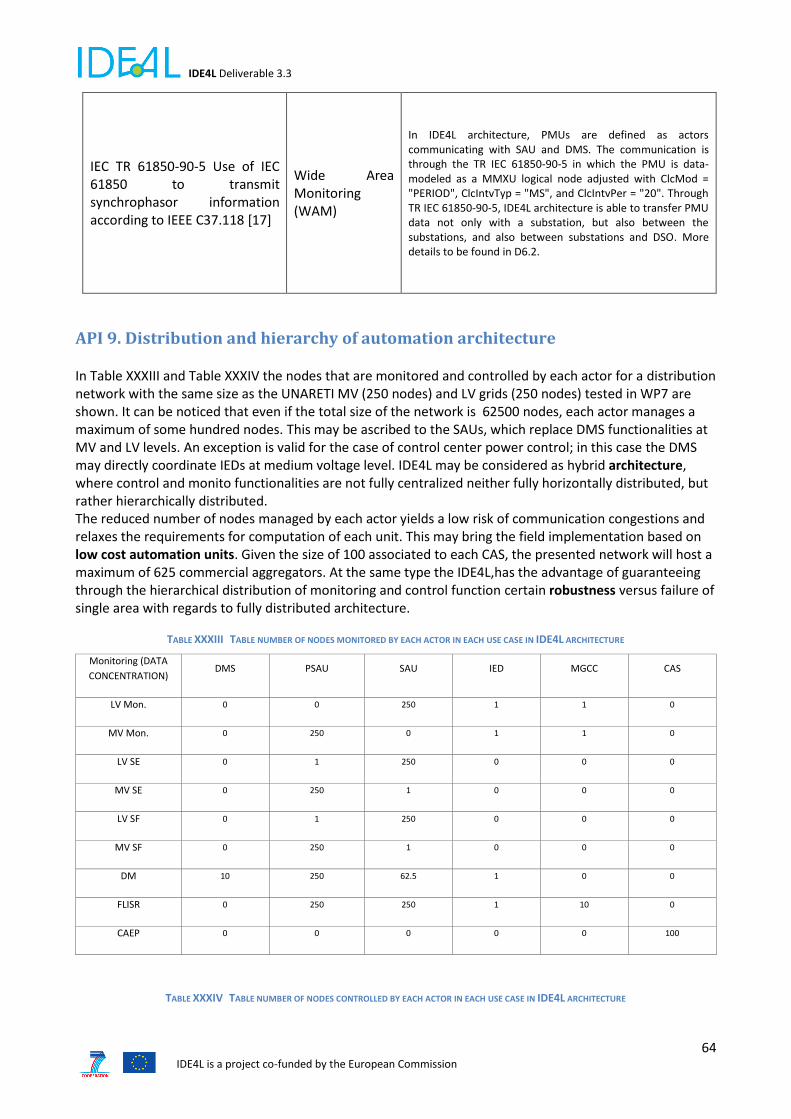
IDE4L Deliverable 3.3
64 IDE4L is a project co-funded by the European Commission
IEC TR 61850-90-5 Use of IEC 61850 to transmit synchrophasor information according to IEEE C37.118 [17]
Wide Area Monitoring (WAM)
In IDE4L architecture, PMUs are defined as actors communicating with SAU and DMS. The communication is through the TR IEC 61850-90-5 in which the PMU is data-modeled as a MMXU logical node adjusted with ClcMod = "PERIOD", ClcIntvTyp = "MS", and ClcIntvPer = "20". Through TR IEC 61850-90-5, IDE4L architecture is able to transfer PMU data not only with a substation, but also between the substations, and also between substations and DSO. More details to be found in D6.2.
API 9. Distribution and hierarchy of automation architecture
In Table XXXIII and Table XXXIV the nodes that are monitored and controlled by each actor for a distribution network with the same size as the UNARETI MV (250 nodes) and LV grids (250 nodes) tested in WP7 are shown. It can be noticed that even if the total size of the network is 62500 nodes, each actor manages a maximum of some hundred nodes. This may be ascribed to the SAUs, which replace DMS functionalities at MV and LV levels. An exception is valid for the case of control center power control; in this case the DMS may directly coordinate IEDs at medium voltage level. IDE4L may be considered as hybrid architecture, where control and monito functionalities are not fully centralized neither fully horizontally distributed, but rather hierarchically distributed. The reduced number of nodes managed by each actor yields a low risk of communication congestions and relaxes the requirements for computation of each unit. This may bring the field implementation based on low cost automation units. Given the size of 100 associated to each CAS, the presented network will host a maximum of 625 commercial aggregators. At the same type the IDE4L,has the advantage of guaranteeing through the hierarchical distribution of monitoring and control function certain robustness versus failure of single area with regards to fully distributed architecture.
TABLE XXXIII TABLE NUMBER OF NODES MONITORED BY EACH ACTOR IN EACH USE CASE IN IDE4L ARCHITECTURE
Monitoring (DATA
CONCENTRATION) DMS PSAU SAU IED MGCC CAS
LV Mon. 0 0 250 1 1 0
MV Mon. 0 250 0 1 1 0
LV SE 0 1 250 0 0 0
MV SE 0 250 1 0 0 0
LV SF 0 1 250 0 0 0
MV SF 0 250 1 0 0 0
DM 10 250 62.5 1 0 0
FLISR 0 250 250 1 10 0
CAEP 0 0 0 0 0 100
TABLE XXXIV TABLE NUMBER OF NODES CONTROLLED BY EACH ACTOR IN EACH USE CASE IN IDE4L ARCHITECTURE
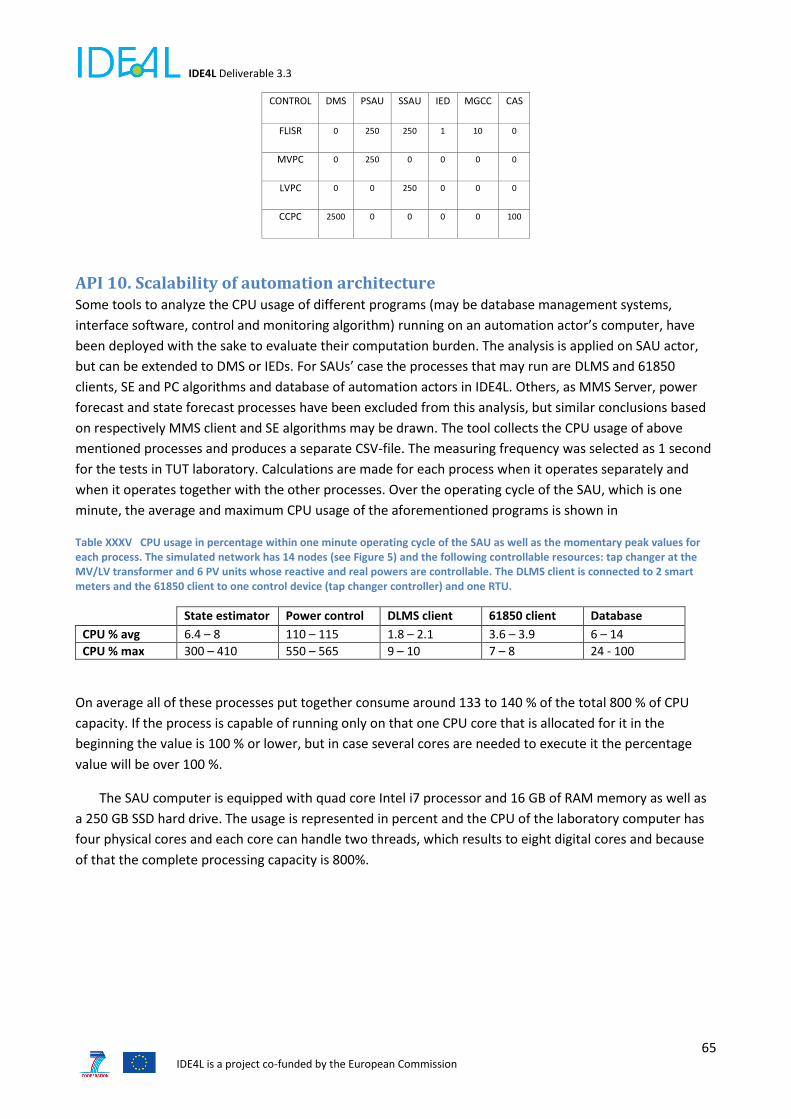
IDE4L Deliverable 3.3
65 IDE4L is a project co-funded by the European Commission
CONTROL DMS PSAU SSAU IED MGCC CAS
FLISR 0 250 250 1 10 0
MVPC 0 250 0 0 0 0
LVPC 0 0 250 0 0 0
CCPC 2500 0 0 0 0 100
API 10. Scalability of automation architecture Some tools to analyze the CPU usage of different programs (may be database management systems,
interface software, control and monitoring algorithm) running on an automation actor’s computer, have
been deployed with the sake to evaluate their computation burden. The analysis is applied on SAU actor,
but can be extended to DMS or IEDs. For SAUs’ case the processes that may run are DLMS and 61850
clients, SE and PC algorithms and database of automation actors in IDE4L. Others, as MMS Server, power
forecast and state forecast processes have been excluded from this analysis, but similar conclusions based
on respectively MMS client and SE algorithms may be drawn. The tool collects the CPU usage of above
mentioned processes and produces a separate CSV-file. The measuring frequency was selected as 1 second
for the tests in TUT laboratory. Calculations are made for each process when it operates separately and
when it operates together with the other processes. Over the operating cycle of the SAU, which is one
minute, the average and maximum CPU usage of the aforementioned programs is shown in
Table XXXV CPU usage in percentage within one minute operating cycle of the SAU as well as the momentary peak values for each process. The simulated network has 14 nodes (see Figure 5) and the following controllable resources: tap changer at the MV/LV transformer and 6 PV units whose reactive and real powers are controllable. The DLMS client is connected to 2 smart meters and the 61850 client to one control device (tap changer controller) and one RTU.
State estimator Power control DLMS client 61850 client Database
CPU % avg 6.4 – 8 110 – 115 1.8 – 2.1 3.6 – 3.9 6 – 14 CPU % max 300 – 410 550 – 565 9 – 10 7 – 8 24 - 100
On average all of these processes put together consume around 133 to 140 % of the total 800 % of CPU
capacity. If the process is capable of running only on that one CPU core that is allocated for it in the
beginning the value is 100 % or lower, but in case several cores are needed to execute it the percentage
value will be over 100 %.
The SAU computer is equipped with quad core Intel i7 processor and 16 GB of RAM memory as well as
a 250 GB SSD hard drive. The usage is represented in percent and the CPU of the laboratory computer has
four physical cores and each core can handle two threads, which results to eight digital cores and because
of that the complete processing capacity is 800%.
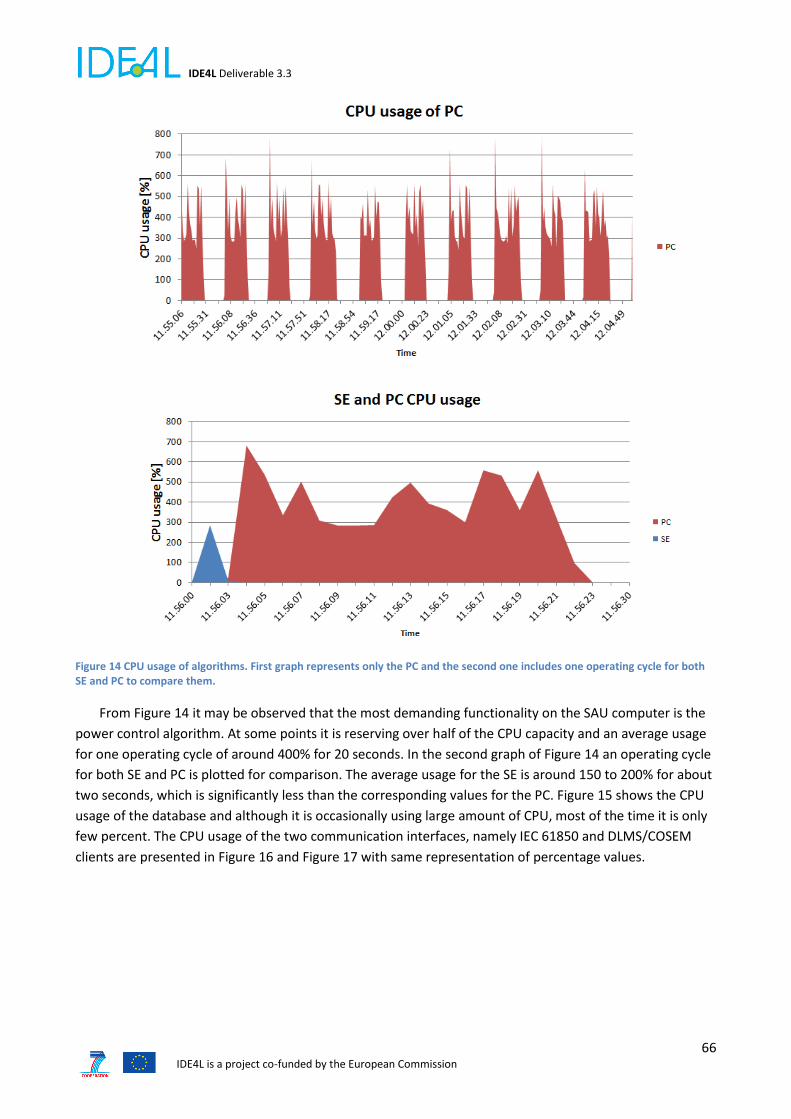
IDE4L Deliverable 3.3
66 IDE4L is a project co-funded by the European Commission
Figure 14 CPU usage of algorithms. First graph represents only the PC and the second one includes one operating cycle for both SE and PC to compare them.
From Figure 14 it may be observed that the most demanding functionality on the SAU computer is the
power control algorithm. At some points it is reserving over half of the CPU capacity and an average usage
for one operating cycle of around 400% for 20 seconds. In the second graph of Figure 14 an operating cycle
for both SE and PC is plotted for comparison. The average usage for the SE is around 150 to 200% for about
two seconds, which is significantly less than the corresponding values for the PC. Figure 15 shows the CPU
usage of the database and although it is occasionally using large amount of CPU, most of the time it is only
few percent. The CPU usage of the two communication interfaces, namely IEC 61850 and DLMS/COSEM
clients are presented in Figure 16 and Figure 17 with same representation of percentage values.
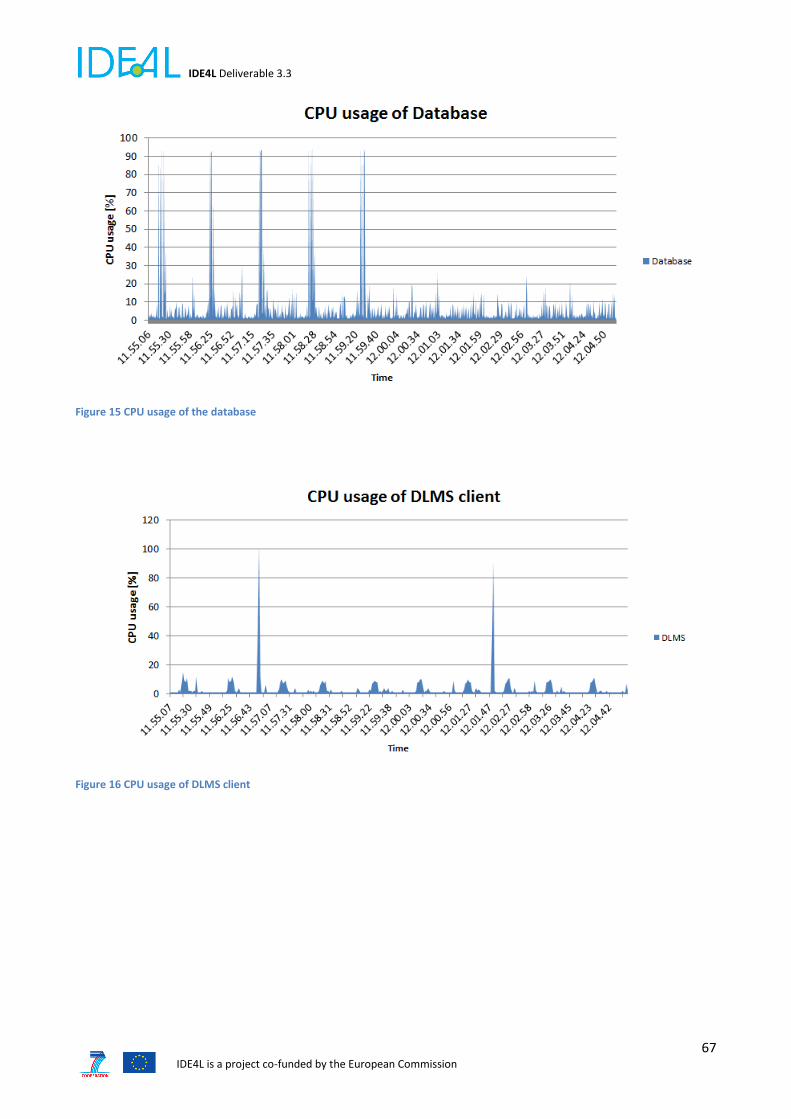
IDE4L Deliverable 3.3
67 IDE4L is a project co-funded by the European Commission
Figure 15 CPU usage of the database
Figure 16 CPU usage of DLMS client

IDE4L Deliverable 3.3
68 IDE4L is a project co-funded by the European Commission
Figure 17 CPU usage of 61850 client
Both clients are very light to process once they are initialized and operating normally. Without
considering the two high spikes appearing in the graph of the DLMS/COSEM client the computational need
is very low at around 10% maximum. The IEC 61850 clients CPU usage is on average only about four
percent of the total 800% of the CPU capacity.
The analysis of the CPU usage of algorithms, database and communication interfaces at the SAU
revealed that most of the instances running on the computer are not using more than 10% out of the
available 800% of CPU capacity. Both SE and PC algorithms on the other hand reserve most of the
processing capacity when they are running and PC is by far the most demanding process with average
usage of half of the processing power for about 20 seconds during every run cycle and peaking
momentarily close to 800%.
API 11. Architecture robustness to communication issues Communication failure may disable or degrade use case functionalities. For instance state estimation
accuracy may worsen due to missing measurements and control use cases may not be issued in case of
failing communication link to control units. In Table XXXVI the information exchanges among groups of
automation actors have been defined in terms of role in the architecture. The reader may, therefore,
identify the most demanding, in terms of required availability, communication links and provide more
reliability for it. In D3.2 [2] each IE has been mapped with an availability requirement (Very High, High,
Medium, Low) corresponding to a certain probability of information availability in percentage required by
the use cases in which the information exchange take place.
Table XXXVI Roles of Information exchanges in IDE4L architecture
Use case IP IR IE Role in architecture
LV SF DMS
PSAU
weather forecast (temperature 24 h, irradiation 24 h, wind speed 24h)
Needed for forecast, but may be updated on slow rates (hours)
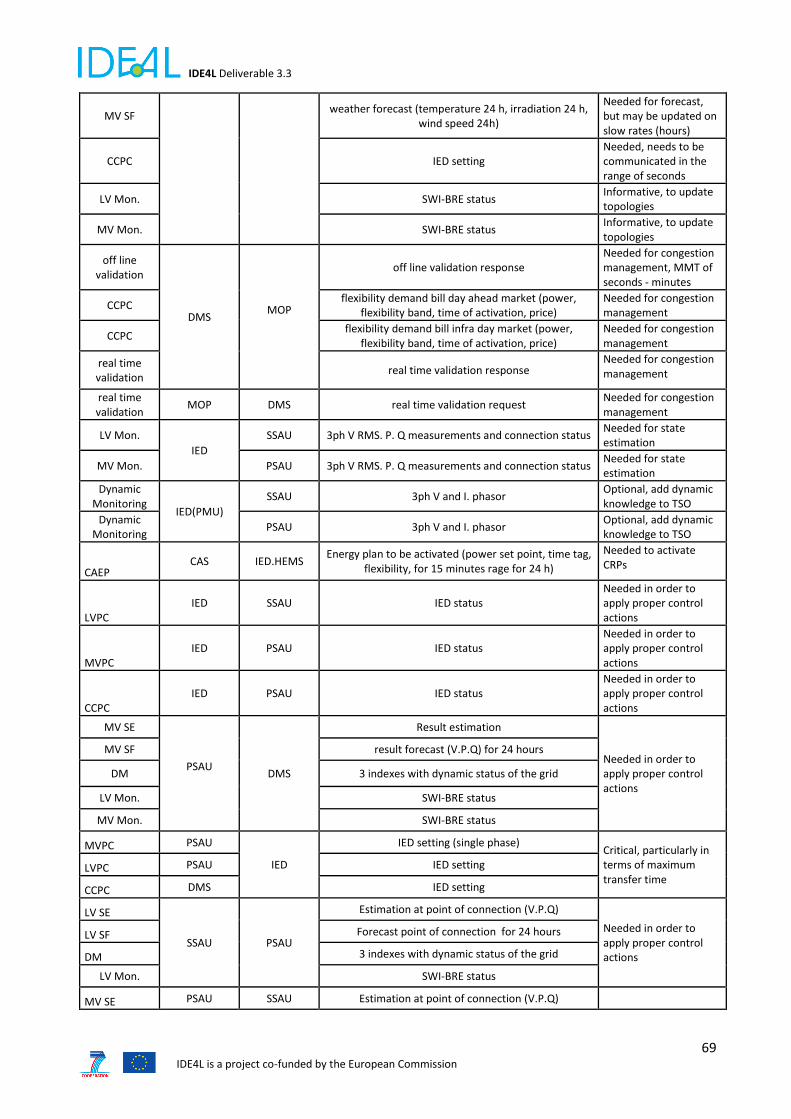
IDE4L Deliverable 3.3
69 IDE4L is a project co-funded by the European Commission
MV SF weather forecast (temperature 24 h, irradiation 24 h,
wind speed 24h)
Needed for forecast, but may be updated on slow rates (hours)
CCPC IED setting Needed, needs to be communicated in the range of seconds
LV Mon. SWI-BRE status Informative, to update topologies
MV Mon. SWI-BRE status Informative, to update topologies
off line validation
DMS MOP
off line validation response Needed for congestion management, MMT of seconds - minutes
CCPC flexibility demand bill day ahead market (power,
flexibility band, time of activation, price) Needed for congestion management
CCPC flexibility demand bill infra day market (power,
flexibility band, time of activation, price) Needed for congestion management
real time validation
real time validation response Needed for congestion management
real time validation
MOP DMS real time validation request Needed for congestion management
LV Mon.
IED
SSAU 3ph V RMS. P. Q measurements and connection status Needed for state estimation
MV Mon. PSAU 3ph V RMS. P. Q measurements and connection status Needed for state estimation
Dynamic Monitoring
IED(PMU)
SSAU 3ph V and I. phasor Optional, add dynamic knowledge to TSO
Dynamic Monitoring
PSAU 3ph V and I. phasor Optional, add dynamic knowledge to TSO
CAEP CAS IED.HEMS
Energy plan to be activated (power set point, time tag, flexibility, for 15 minutes rage for 24 h)
Needed to activate CRPs
LVPC IED SSAU IED status
Needed in order to apply proper control actions
MVPC IED PSAU IED status
Needed in order to apply proper control actions
CCPC IED PSAU IED status
Needed in order to apply proper control actions
MV SE
PSAU
DMS
Result estimation
Needed in order to apply proper control actions
MV SF result forecast (V.P.Q) for 24 hours
DM 3 indexes with dynamic status of the grid
LV Mon. SWI-BRE status
MV Mon. SWI-BRE status
MVPC PSAU
IED
IED setting (single phase) Critical, particularly in terms of maximum transfer time
LVPC PSAU IED setting
CCPC DMS IED setting
LV SE
SSAU PSAU
Estimation at point of connection (V.P.Q)
Needed in order to apply proper control actions
LV SF Forecast point of connection for 24 hours
DM 3 indexes with dynamic status of the grid
LV Mon. SWI-BRE status
MV SE PSAU SSAU Estimation at point of connection (V.P.Q)

IDE4L Deliverable 3.3
70 IDE4L is a project co-funded by the European Commission
LV SF weather forecast (temperature 24 h, irradiation 24 h,
wind speed 24h) Needed in order to apply proper control actions
MV SF Forecast point of connection for 24 hours
LV Mon. SWI-BRE status
FLISR SAU IED switch-breaker control
Critical in terms of maximum transfer time.
FLISR IED IED switch-breaker control
FLISR IED SAU switch-breaker status
FLISR MGCC SAU switch-breaker status
FLISR SAU MGCC switch-breaker control
FLISR MGCC MGCC switch-breaker control
FLISR IED MGCC switch-breaker status
FLISR MGCC IED switch-breaker status
The following conclusions may be inferred on requirements for communication exchange robustness:
DMS to MOP and DMS to CAS information exchanges are requested in order to issue or activate
flexibility. Delays or packet loss may therefore have direct consequences on network state.
LVPC and MVPC control actions from SAUs to IEDs. Delays or packet loss will mean delayed or
missing control operations bringing issues in the network status
SE, Forecast and monitoring information exchange among PSAU and SSAU and among PSAU and
DMS. Given that such information are the base on which control actions are taken, any degradation
bring to failure of observability and therefore no input to MVPC and LVPC controllers or bad quality
input which may trigger control actions when not needed or may not trigger control actions when
needed.
FLISR communication exchange for FLISR applications: Delay or missing data may ring the FLISR to
degradation or failure.
API 12. Architecture robustness to automation actor failure The evaluation of architecture robustness to automation actor failure is done based on observation of the
architecture and knowledge of the use cases. Many issues are at the moment not foreseeable and may
depend on the particular technology implementation and therefore may be highlighted from laboratory or
field testing.
In Table XXXVII each actor of IDE4L is characterized by its role in the architecture, the consequences of its
failure and the type of failure that may yield to failure, namely database, applications or algorithms,
communication interfaces and hardware.
Table XXXVII Automation actor failure, consequences of failure on the network, notes and considerations on probability of
occurrence
Actor name
role in IDE4L
Consequences failure Notes on probability of
occurrence Failure
DB
Failure applicati
ons /algorith
ms
Failure communication interfac
es
HW failure
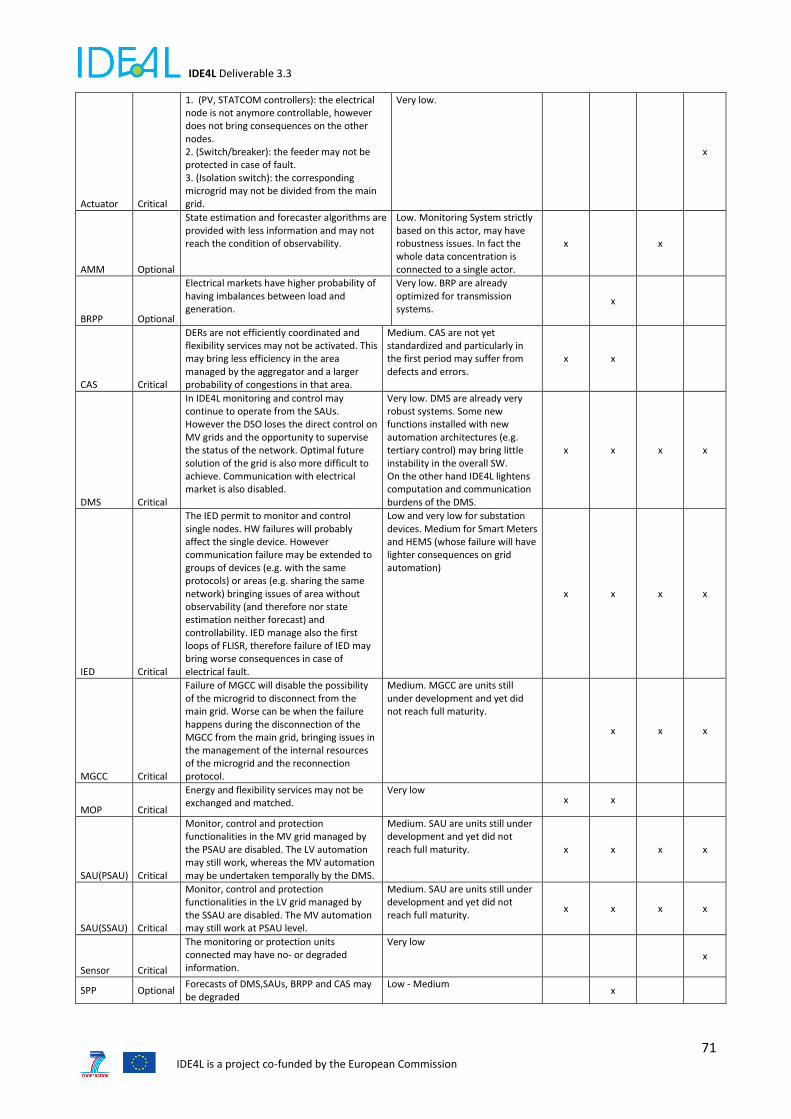
IDE4L Deliverable 3.3
71 IDE4L is a project co-funded by the European Commission
Actuator Critical
1. (PV, STATCOM controllers): the electrical node is not anymore controllable, however does not bring consequences on the other nodes. 2. (Switch/breaker): the feeder may not be protected in case of fault. 3. (Isolation switch): the corresponding microgrid may not be divided from the main grid.
Very low.
x
AMM Optional
State estimation and forecaster algorithms are provided with less information and may not reach the condition of observability.
Low. Monitoring System strictly based on this actor, may have robustness issues. In fact the whole data concentration is connected to a single actor.
x x
BRPP Optional
Electrical markets have higher probability of having imbalances between load and generation.
Very low. BRP are already optimized for transmission systems.
x
CAS Critical
DERs are not efficiently coordinated and flexibility services may not be activated. This may bring less efficiency in the area managed by the aggregator and a larger probability of congestions in that area.
Medium. CAS are not yet standardized and particularly in the first period may suffer from defects and errors.
x x
DMS Critical
In IDE4L monitoring and control may continue to operate from the SAUs. However the DSO loses the direct control on MV grids and the opportunity to supervise the status of the network. Optimal future solution of the grid is also more difficult to achieve. Communication with electrical market is also disabled.
Very low. DMS are already very robust systems. Some new functions installed with new automation architectures (e.g. tertiary control) may bring little instability in the overall SW. On the other hand IDE4L lightens computation and communication burdens of the DMS.
x x x x
IED Critical
The IED permit to monitor and control single nodes. HW failures will probably affect the single device. However communication failure may be extended to groups of devices (e.g. with the same protocols) or areas (e.g. sharing the same network) bringing issues of area without observability (and therefore nor state estimation neither forecast) and controllability. IED manage also the first loops of FLISR, therefore failure of IED may bring worse consequences in case of electrical fault.
Low and very low for substation devices. Medium for Smart Meters and HEMS (whose failure will have lighter consequences on grid automation)
x x x x
MGCC Critical
Failure of MGCC will disable the possibility of the microgrid to disconnect from the main grid. Worse can be when the failure happens during the disconnection of the MGCC from the main grid, bringing issues in the management of the internal resources of the microgrid and the reconnection protocol.
Medium. MGCC are units still under development and yet did not reach full maturity.
x x x
MOP Critical
Energy and flexibility services may not be exchanged and matched.
Very low x x
SAU(PSAU) Critical
Monitor, control and protection functionalities in the MV grid managed by the PSAU are disabled. The LV automation may still work, whereas the MV automation may be undertaken temporally by the DMS.
Medium. SAU are units still under development and yet did not reach full maturity. x x x x
SAU(SSAU) Critical
Monitor, control and protection functionalities in the LV grid managed by the SSAU are disabled. The MV automation may still work at PSAU level.
Medium. SAU are units still under development and yet did not reach full maturity.
x x x x
Sensor Critical
The monitoring or protection units connected may have no- or degraded information.
Very low
x
SPP Optional Forecasts of DMS,SAUs, BRPP and CAS may be degraded
Low - Medium x

IDE4L Deliverable 3.3
72 IDE4L is a project co-funded by the European Commission
TSOEMS Critical Transmission systems, and indirectly distribution system operation will be affected.
Very low x x x
CIS Optional Customer information may be degraded Low x
GIS Optional Geographic information may be degraded Low x
NIS Optional Network information may be degraded Low x
From Table XXXVII it may be classified which type of failure brings more issues in IDE4L architecture. The
results are summarized in Table XXXVIII.
Table XXXVIII Summary on type of automation actors’ failures
Failure DB
Failure applicati
ons /algorith
ms
Failure communication interfac
es
HW failure
11 10 7 7
API 13. Impact of distribution automation on the transmission system IDE4L introduced the possibility of DSO to provide dynamic information of the distribution network to TSOs.
This allows TSOs to improve the stability of the system bringing indirectly advantages to the DSOs. In
particular, the information required by TSO is about voltage stability of electricity system and visibility of
distribution network. Figure 18 shows the least PMU data required to extract key information of model
synthesis and voltage stability analysis, described in the KPIs illustrated in chapter 3. More details can be
found in Chapters 5 and 7 of the Deliverable 6.2 [18].
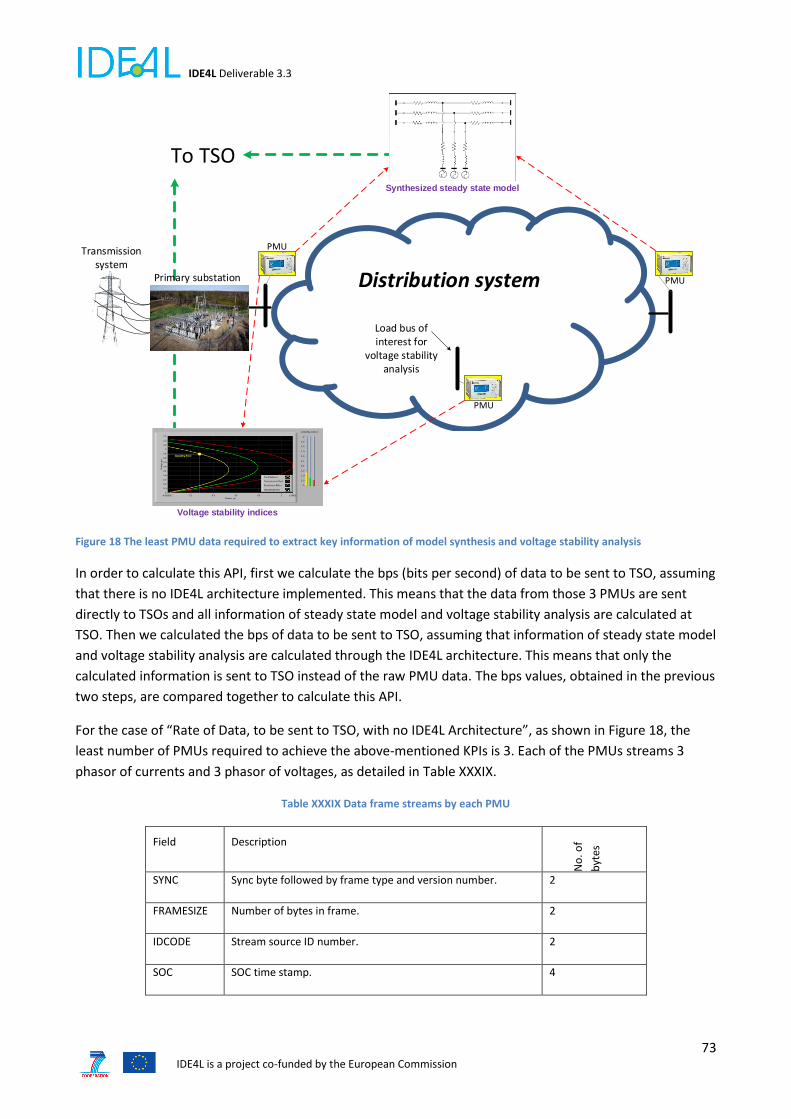
IDE4L Deliverable 3.3
73 IDE4L is a project co-funded by the European Commission
Primary substation
Transmission system
Distribution system
To TSO
PMU
PMU
Load bus of interest for
voltage stability analysis
PMU
Synthesized steady state model
Voltage stability indices
Figure 18 The least PMU data required to extract key information of model synthesis and voltage stability analysis
In order to calculate this API, first we calculate the bps (bits per second) of data to be sent to TSO, assuming
that there is no IDE4L architecture implemented. This means that the data from those 3 PMUs are sent
directly to TSOs and all information of steady state model and voltage stability analysis are calculated at
TSO. Then we calculated the bps of data to be sent to TSO, assuming that information of steady state model
and voltage stability analysis are calculated through the IDE4L architecture. This means that only the
calculated information is sent to TSO instead of the raw PMU data. The bps values, obtained in the previous
two steps, are compared together to calculate this API.
For the case of “Rate of Data, to be sent to TSO, with no IDE4L Architecture”, as shown in Figure 18, the
least number of PMUs required to achieve the above-mentioned KPIs is 3. Each of the PMUs streams 3
phasor of currents and 3 phasor of voltages, as detailed in Table XXXIX.
Table XXXIX Data frame streams by each PMU
Field Description
No
. of
byt
es
SYNC Sync byte followed by frame type and version number. 2
FRAMESIZE Number of bytes in frame. 2
IDCODE Stream source ID number. 2
SOC SOC time stamp. 4

IDE4L Deliverable 3.3
74 IDE4L is a project co-funded by the European Commission
FRACSEC Fraction of second and time quality. 4
STAT Bit-mapped flags. 2
PHASORS 3 Phasors of phase currents and 3 phasors of L-G voltages in
floating-point format. 6 x 8 = 48
FREQ Frequency in floating-point format. 4
DFREQ ROCOF in floating-point format. 4
CHK CRC-CCITT 2
Total number of bytes 74
As shown in Table XXXIX, data frame streamed by each PMU takes 74 bytes. Assuming that the reporting
rate of the PMUs is 50 frame/second, the data rate of each PMU will be equal to 74 x 50 = 3700 bytes/s =
29600 bps. Since we have 3 PMUs, the total data rate to be sent to TSO will be equal to 29600 x 3 = 88800
bps
For the case of “Rate of Data, to be Sent to TSO, through IDE4L Architecture”, as detailed in Deliverable 7.1,
the KPI “TSO's visibility of distribution network” measures improvement in models that a TSO has for its
downstream distribution grids. For this purpose, the KPI analyses the Steady State Model Synthesis
application, extensively discussed in Chapter 5 of the Deliverable 6.2. The synthesized steady state model
of the distribution system contains 4 variables of R, X, E, and delta (per phase), each of which takes 4 bytes
as they are in floating point format. This means that the output data frame of this application will take 4 x 4
x 3 (phases) = 48 bytes. As the application produces 1 output data frame per 2 seconds, the streamed bps
will be equal to 48 x (1/2) x 8 = 192 bps.
Similar to the above-mentioned KPI, the KPI “Voltage stability of electricity system” measures improvement
in TSO’s awareness of voltage stability issues in their downstream distribution grids. For this purpose, the
KPI analyses the Voltage Stability Analysis application, described in Chapter 7 of the Deliverable 6.2. This
application produces three VISI (voltage instability indices) for each phase, each of which takes 4 bytes as
they are in floating point format. This means that the output data frame of this application will take 3 x 4 x
3 (phases) = 36 bytes. As the application produces 1 output data frame per 2 seconds, the streamed bps will
be equal to 36 x (1/2) x 8 = 144 bps.
Hence, the total data rate to be sent to TSO will be equal to 192 + 144 = 336 bps.
Using the bps values obtained in the previous sections, the API can be calculated following the defined
formula as: 100336
88800= 0.38 %

IDE4L Deliverable 3.3
75 IDE4L is a project co-funded by the European Commission
Another way to interpret this API is that the IDE4L architecture has reduced 100 - 0.38 = 99.62 % of the data
sent to TSO for realization of those two KPIs.
Note that the communication media (TCP/IP, UDP/IP, etc.) used for data transfer in each of the above-
mentioned cases (with or without IDE4L architecture) will add overhead on the bps values. However since
the overhead is dependent to the utilized media and it is the same for both cases, it has not been
considered in these calculations.

IDE4L Deliverable 3.3
76 IDE4L is a project co-funded by the European Commission
Conclusions The first set of conclusions concerns the initial investment and payback resources.
The SAU unit may be allocated to low cost devices and therefore constitutes a small percentage of
the initial investments
Devices and communication infrastructure constitute the largest part of the investment. Adequate
customization based on the condition of the grid for instance depending on the geographical
distribution of customers, may yield to significant optimization of the initial investments
The DSOs, Prosumers and CASs are the main actors able to gain from the architecture in terms of
savings and profits. The DSO savings consist of savings in investment costs and reduced losses.
The IDE4L architecture is able to increase the DG hosting capacity of existing distribution networks.
The amount of increase depends significantly on the network and the benefits are larger in weak
networks.
The following conclusions may be drawn on the level of novelty brought by IDE4l
About 25% of IDE4L actors are to be installed in current distribution grids and about 19% to be
updated. Similarly about 52% of IDE4L functions are to be installed and 23% to be updated.
About 58% of IDE4L communication access points have to be updated or newly installed in current
distribution networks.
Similar conclusions have been drawn with regards to other research EU fp7 projects.
9 integrations to smart grids standards have been proposed.
The following conclusions may be drawn on the distribution and hierarchy of IDE4L architecture
Four hierarchical control/monitor level are highlighted, namely DMS, PSAU, SSAU and IEDs/MGCC.
The IEDs/MGCC control 1/10 nodes, the SAUs about 250 nodes and the DMS some tens of nodes.
IDE4L architecture shows to reduce the burden for communication and computation.
Some tests on the scalability of IDE4L architecture shows that a SAU computer managing 14 nodes
demonstrated to deal perfectly with the CPU and memory average burden
The following conclusions may be drawn on the robustness of the architecture in presence of components
or communication failure
Failures of delivery control set point or protection related information may bring immediate
degradation in the status of the system.
Missing monitoring related information may not permit a proper running of control algorithms or
may bring degradations in their output
Component failures show to be highly correlated to database issues or application errors and less
correlated to communication interface and hardware issues.
Eventually the study on the improvements brought in the distribution-transmission cooperation for
automation, showed that calculation of dynamic indexes performed locally for each distribution network,
permit to reduce the amount of information to be stream by TSOs by about 99%.

IDE4L Deliverable 3.3
77 IDE4L is a project co-funded by the European Commission
References [1] Deliverable 3.1, Distribution automation concept, IDE4L fp7 project. Available online:
http://webhotel2.tut.fi/units/set/ide4l/D3.1_Final.pdf [2] Deliverable 3.2, Architecture design and implementation, IDE4L fp7 project. Available online:
http://webhotel2.tut.fi/units/set/ide4l/D3.2/ide4l-d3.2-final.pdf [3] Deliverable D7.1, KPI Definition, IDE4L fp7 project. Available online:
http://webhotel2.tut.fi/units/set/ide4l/D3.1_Final.pdf [4] European Commission: M/490 Standardization Mandate to European Standardization Organizations
(ESOs) to support European Smart Grid deployment (2011) [5] Smart Grid Coordination Group, “Smart Grid Reference Architecture,” CEN-CENELEC-ETSI, Tech. Rep.,
2012 [6] Smart Grid Coordination Group, “Sustainable Processes,” CEN-CENELEC-ETSI, Tech. Rep., 2012 [7] European Network of Transmission System Operators for Electricity (ENTSO-E), repository. Available online
https://emr.entsoe.eu/glossary/bin/view/Main/ [8] ADINE fp7 EU project. Available online http://cordis.europa.eu/project/rcn/85682_en.html [9] INTEGRIS fp7 project. Available online http://fp7integris.eu/index.php [10] ADDRESS fp7 project. Available online http://www.addressfp7.org/ [11] Current and Voltage sensors or detectors, to be used for fault passage indication purposes - Part 100:
Requirements and proposals for IEC 61850 data model extensions to support Fault Passage Indicators applications, IEC/TR 62689-100 Ed. 1.0, Jan. 2016.
[12] Use of IEC 61850 for distribution automation systems, 61850-90-6 Ed. 1.0, Oct. 2013. [13] Communication networks and systems for power utility automation - Part 8-1, IEC 61850-8-1, 2011. [14] Communication networks and systems for power utility automation - Part 7-4, IEC 61850-7-4, 2010. [15] Electricity metering data exchange - The DLMS/COSEM suite, IEC 62056-4-7, 2013-16. [16] Framework for energy market communications, IEC 62325, 2014-16. [17] Communication networks and systems for power utility automation - Part 90-5: Use of IEC 61850 to
transmit synchrophasor information according to IEEE C37.118, IEC TR 61850-90-5, 2012. [18] Deliverable 6.2, Distribution Network Dynamics Monitoring, Control, and Protection Solutions including
their Interface to TSOs. Available online http://webhotel2.tut.fi/units/set/ide4l/ide4l-wp6-d6.2-Summary--v-0.2.pdf [19] E. Lakervi and E. J. Holmes, Electricity Distribution Network Design, 2nd ed. London, UK: The Institution
of Electrical Engineers, 1995, 325 p [20] IDE4L, deliverable 6.3 “Results and analysis of the aggregator system emulation” 2016. Available online:
http://ide4l.eu/results/ [21] IDE4L, deliverable 5.2/3 “Congestion Management in Distribution Networks,” 2015. Available online:
http://ide4l.eu/results/ [22] A. Kulmala, S. Repo and P. Järventausta, "Using statistical distribution network planning for voltage
control method selection," in Proc. IET Conf. on Renewable Power Generation, Edinburgh, UK, Sept. 2011.
[23] A. Kulmala, S. Repo, and P. Järventausta, “Coordinated voltage control in distribution networks including several distributed energy resources,” IEEE Trans. Smart Grid, vol. 5, pp. 2010-2020, July 2014.