demystifying big data in official statistics – it is not ... · 2. use of big data in the...
TRANSCRIPT

Eurostat
Demystifying big data in official statistics – it is not rocket science!
Jens Mehrhoff, Eurostat6th Methodological SeminarLuxembourg, 14 November 2017

Structure of the presentation
1. Definition of big data2. Use of big data in the production of official statistics3. Other potential uses of big data4. Discussion and outlook
'But the "big data" that interests many companies is what we might call "found data", the digital exhaust of web searches, credit card payments and mobiles pinging the nearest phone mast.'Tim Harford, Financial Times, 28 March 2014.
2

1. Definition of big data
• Gartner's (2001) '3 Vs':• Volume: amount of data ('found/organic' data)• Velocity: speed of data in and out (real time)• Variety: range of data types and sources ('data lake')
• (Veracity: quality of data (inconsistency))• Big data usually includes data sets with sizes
beyond the ability of commonly used software tools to capture, curate, manage, and process data within a tolerable elapsed time.
3

1. Definition of big data
• The Square Kilometre Array (SKA) radio telescope will ultimately be the largest scientific instrument on Earth, both in physical scale and in terms of volume of data it will generate.
• Just in its first phase, the telescope will produce some 160 terabytes of raw data per second –more than 4 times the 2016 global internet traffic.
4

1. Definition of big data
• This is a massive amount of data.• If a byte of data is equivalent to a small grain
of rice, 160 terabytes per second would take• 1 second to cover Luxembourg City 10 cm high in
rice,• 1 day to cover the entire European Union 10 cm
high in rice,• 3½ weeks to cover the whole surface of the
Atlantic Ocean 10 cm high in rice, and• 2 millennia to fill up the Atlantic Ocean with rice
from its seabed to the surface.
5

1. Definition of big data
• Four possible interpretations of big data –at least:• 'Data science': e.g. linking micro data• New data sources: e.g. Google or social media• IT architecture: e.g. distributed computing• Large data sets: e.g. granular/administrative data
• More often than not, big data in official statistics are simply large data sets or the IT architecture handling them.
6

2. Use of big data in the production of official statistics
• Case study: Electronic transactions data ('scanner data') for measuring the average change in prices large but structured data set1. Classification of individual products into
homogeneous groups: supervised machine learning2. Treatment of re-launches: probabilistic record
linkage (fuzzy matching)3. Index calculation: multilateral methods (here: time-
product dummy)
7

2. Use of big data in the production2.1 Classification of individual products
• Machine learning (Mitchell, 1997): 'A computer program is said to learn from experience E with respect to some class of tasks T and performance measure P if its performance at tasks in T, as measured by P, improves with experience E.'• Task T: classification of individual products into
homogeneous groups• Performance measure P: accuracy, i.e. the proportion
of automatically correctly classified products• Experience E: training data (supervised learning)
8

2. Use of big data in the production2.1 Classification of individual products
• Supervised learning: The computer is presented with example inputs and their desired outputs and the goal is to learn a general rule that maps inputs to outputs.• Classification: identifying to which of a set of categories a
new observation belongs, on the basis of a training set
• Unsupervised learning: No labels are given to the learning algorithm, leaving it on its own to find structure in its input.• Clustering: grouping a set of objects in such a way that
objects in the same group are more similar to each other than to those in other groups
9
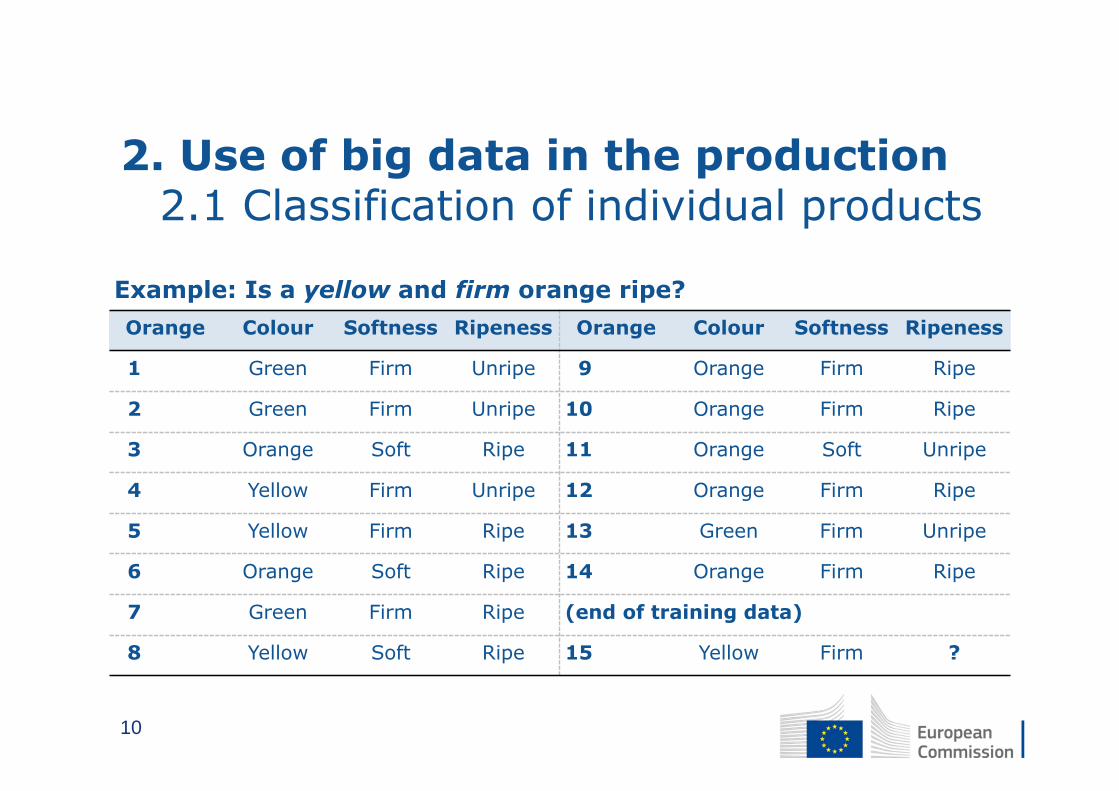
2. Use of big data in the production2.1 Classification of individual products
Example: Is a yellow and firm orange ripe?
Orange Colour Softness Ripeness Orange Colour Softness Ripeness
1 Green Firm Unripe 9 Orange Firm Ripe
2 Green Firm Unripe 10 Orange Firm Ripe
3 Orange Soft Ripe 11 Orange Soft Unripe
4 Yellow Firm Unripe 12 Orange Firm Ripe
5 Yellow Firm Ripe 13 Green Firm Unripe
6 Orange Soft Ripe 14 Orange Firm Ripe
7 Green Firm Ripe (end of training data)
8 Yellow Soft Ripe 15 Yellow Firm ?
10

2. Use of big data in the production2.1 Classification of individual products
• Naïve Bayes classification:
P ripe|yellow,firmP yellow,firm|ripe ∙ P ripe
P yellow,firm
P yellow|ripe ∙ P firm|ripe ∙ P ripeP yellow ∙ P firm
• Relies on the assumption that every feature being classified is independent of all other features.
11

2. Use of big data in the production2.1 Classification of individual products
Cross-tabulation of colour and ripeness
Colour Ripe Unripe Total
Green
Yellow P yellow|ripe P yellow
Orange
NB: P(ripe) = proportion of ripe oranges (independent of colour and softness).
Cross-tabulation of softness and ripeness
Softness Ripe Unripe Total
Soft
Firm P firm|ripe P firm
12

2. Use of big data in the production2.1 Classification of individual products
Cross-tabulation of colour and ripeness
Colour Ripe Unripe Total
Green 1/9 3/5 4/14
Yellow 2/9 1/5 3/14
Orange 6/9 1/5 7/14
NB: P(ripe) = 9/14.
Cross-tabulation of softness and ripeness
Softness Ripe Unripe Total
Soft 3/9 1/5 4/14
Firm 6/9 4/5 10/14
13

2. Use of big data in the production2.1 Classification of individual products
• Naïve Bayes classification:
P ripe|yellow,firmP yellow|ripe ∙ P firm|ripe ∙ P ripe
P yellow ∙ P firm2/9 ∙ 6/9 ∙ 9/14
3/14 ∙ 10/14
2845
0.62
14

2. Use of big data in the production2.1 Classification of individual products
• The accuracy of supervised machine learning, i.e. the proportion of automatically correctly classified products, is around 80% for supermarket scanner data. That means that one out of five products is misclassified.
• Hence, while machine learning can give reasonable suggestions for the classification, it eventually needs to be assisted by human beings; it is no panacea!
15

2. Use of big data in the production2.2 Treatment of re-launches
• Re-launch: A new attempt to sell a product or service, often by advertising it in a different way or making it available in a different form, e.g. different packaging different GTIN.
• Record linkage: The task of finding records in a data set that refer to the same entity across entities that may not share a common identifier.• Entity: product or service; Identifier: GTIN ('barcode')
16
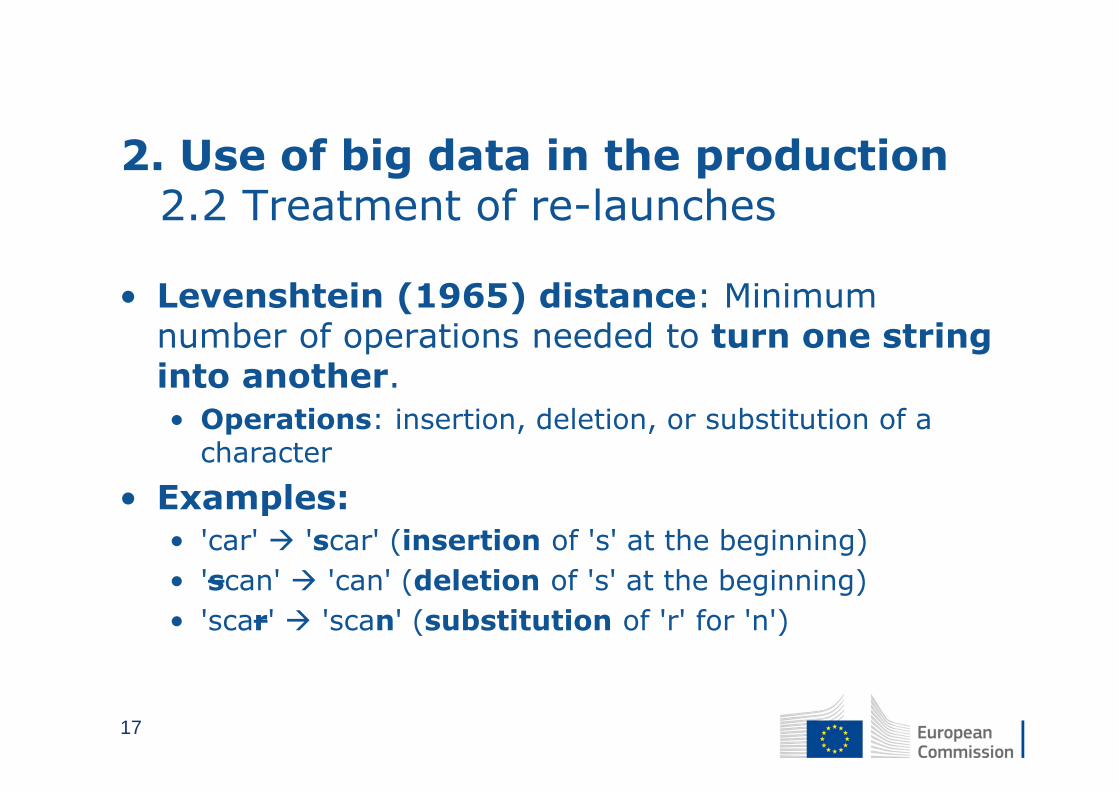
2. Use of big data in the production2.2 Treatment of re-launches
• Levenshtein (1965) distance: Minimum number of operations needed to turn one string into another.• Operations: insertion, deletion, or substitution of a
character
• Examples:• 'car' 'scar' (insertion of 's' at the beginning)• 'scan' 'can' (deletion of 's' at the beginning)• 'scar' 'scan' (substitution of 'r' for 'n')
17
2. Use of big data in the production2.2 Treatment of re-launches
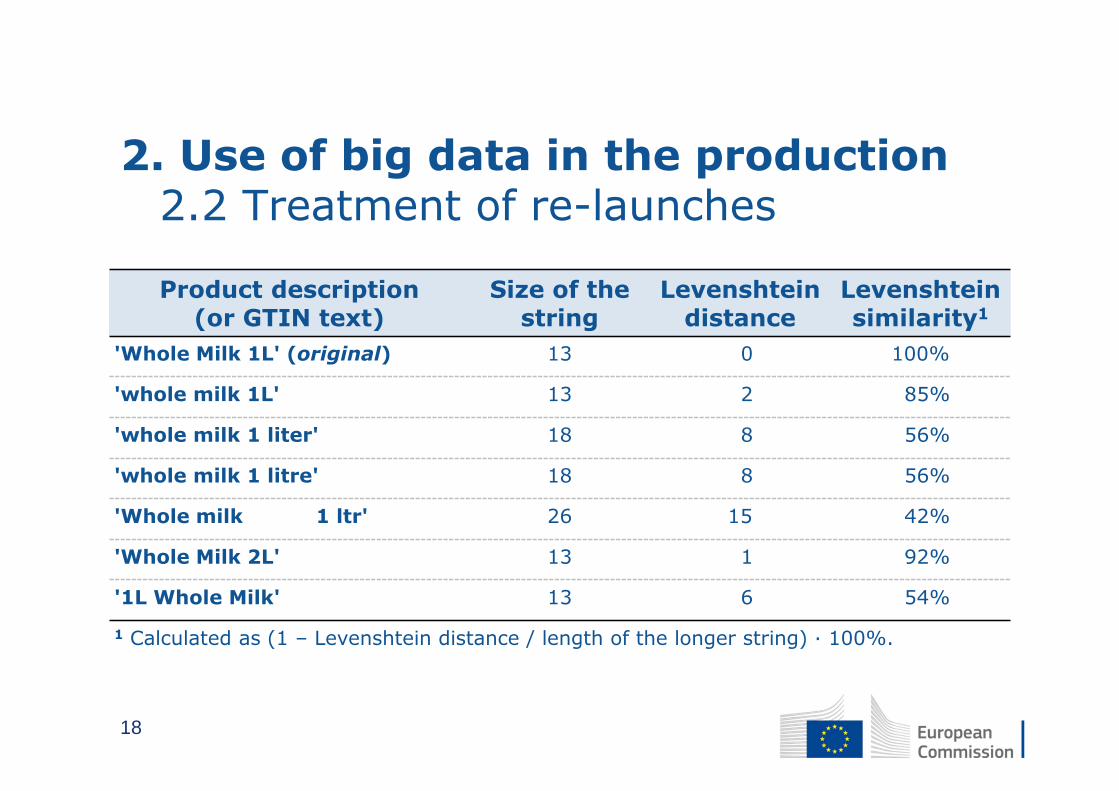
Product description(or GTIN text)
Size of the string
Levenshteindistance
Levenshteinsimilarity1
'Whole Milk 1L' (original) 13 0 100%
'whole milk 1L' 13 2 85%
'whole milk 1 liter' 18 8 56%
'whole milk 1 litre' 18 8 56%
'Whole milk 1 ltr' 26 15 42%
'Whole Milk 2L' 13 1 92%
'1L Whole Milk' 13 6 54%
1 Calculated as (1 – Levenshtein distance / length of the longer string) ∙ 100%.
18

2. Use of big data in the production2.2 Treatment of re-launches
• The last string leads to horrible results because language allows us to swap the order of words.• There are still plenty of other ways to improve:
capitalisation, trimming, character encoding, et cetera.
• However, 1 litre of milk is different from 2 litres; while '1L', '1 liter', '1 litre', and '1 ltr' are all the same.• Hence, do not trust the results blindly! They would
be the input into a user interface, for a computer-assisted classification – so use them as suggestions.
19

2. Use of big data in the production2.3 Index calculation
• Purpose: measuring the average rate of change in consumer prices going from a base period 0 to a comparison period t
• Bilateral: P[0,t] = P[p(0),p(t),s(0),s(t)] – biased• Multilateral: P[0,t] = P[p(0),…,p(t),s(0),…,s(t)]• Time-product dummy: P[0,t] = exp δ t from
weighted regression with time and product
dummies lnpit ∑ tDi
tT
t 1∑ iDi
N 1
i 1 it
20

2. Use of big data in the production2.3 Index calculation
• Example: Dominick's Finer Food1 (now defunct Chicago-area grocery store chain) –electronic transactions data for 93 stores and 398 weeks from September 1989 to May 1997• 98 884 285 observations (after cleansing)• 13 845 products (excluding re-launches)• 29 categories (from analgesics to toothpastes)
• Monthly aggregation at the category level.
1 James M. Kilts Center, University of Chicago Booth School of Business
21

2. Use of big data in the production2.3 Index calculation
22

2. Use of big data in the production2.3 Index calculation
• New and disappearing products: 'dynamic' universe due to product churn
• Just 5% of products are available in all 91 months; 2½% are available in a single month, only; the average availability is 34 months.
• Within-category average duration of products ranges from 27 months (30%) for 'cigarettes' to 51 months (56%) for 'canned soup'.
23
3. Other potential uses of big data
• IMF Staff Discussion Note 17/06 reflects on the potential, challenges and statistical implications of big data.(http://www.imf.org/~/media/files/publications/sdn/2017/sdn1706-bigdata.ashx)
• What is the potential of big data?1. Answering new questions and producing new indicators
(e.g. 'week @ the beach' index)2. Bridging time lags in the availability of official statistics and
supporting the timelier forecasting of existing indicators(e.g. using SWIFT to monitor global financial flows)
3. Innovative data source in the production of official statistics(e.g. mobile positioning data as a data source for international travel service statistics)
• What challenges come with big data?• Data quality concerns, difficulties with access, and new required
skills and technologies
24

3. Other potential uses of big data3.1 Now/forecasting
• Case study: now/forecasting consumer prices using AMADEUS booking data for package holidays in Germany
• Package holidays have a comparatively high weight and prices show pronounced volatility.• National sub-index contributes up to a tenth of a
percentage point to euro area all-items inflation.• On the other hand, analysis and forecasting are
hampered by the lack of a further breakdown.
25

3. Other potential uses of big data3.1 Now/forecasting
• While the prices enter the consumer price index only in the month when the travel commences, booking data contain actual transactions for departures in the future.• For example, in March already more than half of the
expected journeys in Summer (July/August).• Enables forecast to be based on hard data rather
than time series models alone.• Also higher level of disaggregation possible.
26

3. Other potential uses of big data3.1 Now/forecasting
In-sample forecast evaluation (Jan 2014 – Feb 2017)
Book time, in months 0 1 2 3 4 5 6
Mean error,in percentage points
+0.01 +0.01 0.00 0.00 –0.01 –0.01 –0.01
Mean absolute error,in percentage points
0.82 0.81 0.78 0.76 0.85 0.78 0.83
Standard deviation of error,in percentage points
1.07 1.06 1.03 1.01 1.06 1.03 1.04
Reliability of sign,as a percentage
78.95 73.68 78.95 86.84 84.21 86.84 86.84
Signal-to-noise ratio(relative to mean absolute error)
2.97 2.99 3.12 3.18 2.85 3.13 2.92
Gain(relative to seasonal ARIMA model)
1.31 1.31 1.35 1.39 1.31 1.35 1.34
27

3. Other potential uses of big data3.1 Now/forecasting
• According to the gain, the root mean square error can be lowered by30 to 40%.
• Still, there are some singular but large forecast errors of2 to 3 percentage points remaining.
• Delineation of turning points versus outliers proves to be particularly challenging in real time.
28

3. Other potential uses of big data3.2 New/complementary indicators
• Example: offer-based price index for housing• The following aspects are relevant for real estate
market analysis:• How long is an object offered?• How has the price changed over the course of time?
• A short marketing period and low price concessions could be indicators for a tense property market.
• But it would also be important to know the margin between the offer price and the transaction price.
• This is another link of big data to digitalisation.
29

4. Discussion and outlook
• The future direction, after the hype, is more like big data will be supplementing rather than replacing official statistics; a genuine change in paradigm is rather doubtful in the short to medium term.
• This has to been seen not least against the background of the lower quality (keyword: coverage bias) of such experimental statistics.
• Just one question: Will the lower production costs outweigh the potentially considerably higher non-monetary costs of misguided policy decisions? (Others include governance and resource issues.)
30

4. Discussion and outlook4.1 Statistical paradises and paradoxes
• Let us consider a case where we have an administrative record covering percent of the population, and a simple random sample (SRS) from the same population which only covers percent, where ≪ .
• How large should ⁄ be before an estimator from the administrative record dominates the corresponding one from the SRS, say in terms of MSE?
Source: Meng, X.L. (2016), 'Statistical paradises and paradoxes in big data,' RSS Annual Conference.
31
4. Discussion and outlook4.1 Statistical paradises and paradoxes
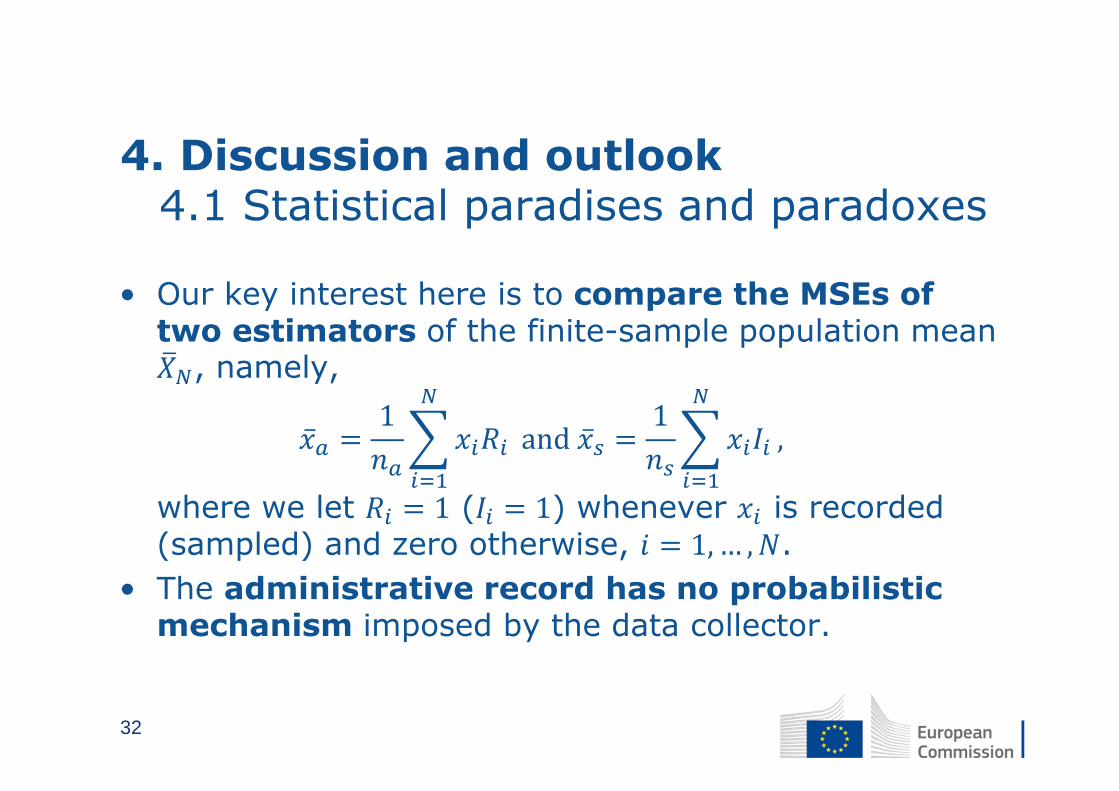
• Our key interest here is to compare the MSEs of two estimators of the finite-sample population mean
, namely,̅ 1 and ̅ 1 ,where we let 1 ( 1) whenever is recorded (sampled) and zero otherwise, 1,… , .
• The administrative record has no probabilistic mechanism imposed by the data collector.
32

4. Discussion and outlook4.1 Statistical paradises and paradoxes
• Expressing the exact error, where ⁄ :̅ EE E Cov ,E , ∙ ∙ 1 .• Given that ̅ is unbiased, its MSE is the same as
its variance.
33

4. Discussion and outlook4.1 Statistical paradises and paradoxes
• The MSE of ̅ is more complicated, mostly because depends on :MSE ̅ E , ∙ ∙ 1 .
• For biased estimators resulting from a large self-selected sample, the MSE is dominated (and bounded below) by the squared bias term, which is controlled by the relativesample size .
34

4. Discussion and outlook4.1 Statistical paradises and paradoxes
• To guarantee MSE ̅ Var ̅ , we must require (ignoring the finite population correction 1 ),1 , ,orequivalently1 1, , .
• A key message here is that, as far as statistical inference goes, what makes a 'big data' set big is typically not its absolute size, but its relative size to its population.
35

4. Discussion and outlook4.1 Statistical paradises and paradoxes
• Therefore, the question which data set one should trust more is unanswerable without knowing .
• But the general message is the same: when dealing with self-reported data sets, do not be fooled by their apparent large sizes.
• This reconfirms the power of probabilistic sampling and reminds us of the danger in blindly trusting that 'big data' must give us better answers.
• Lesson learned: What matters most is the quality, not the quantity.
36

• Imagine that we are given a SRS with 400:• If , 0.05 and our intended
population is the USA, then 320,000,000, and hence we will need 50% or160,000,000 to place more trust in ̅ than in ̅ .
• If , 0.1, we will need 80%or 256,000,000 to dominate 400.
• If , 0.5, we will need over 99% of the population to beat a SRS with 400.
4. Discussion and outlook4.1 Statistical paradises and paradoxes
37

4. Discussion and outlook4.2 One way forward for official statistics
• What is the difference between 'data' and 'information'?
• We are entering a world where data will be the cheapest commodity around, simply because the society has created systems that automatically track transactions of all sorts.
• Collectively, the society is assembling data on massive amounts of its behaviours.
• Indeed, if you think of these processes as an ecosystem, it is self-measuring in increasingly broad scope.
• Indeed, we might label these data as 'organic', a now-natural feature of this ecosystem.
38

4. Discussion and outlook4.2 One way forward for official statistics
• Information is produced from data by uses. Data streams have no meaning until they are used.
• The user finds meaning in data by bringing questions to the data and finding their answers in the data.
• An old quip notes that a thousand monkeys at typewriters will eventually produce the complete works of Shakespeare.
• The monkeys produce 'data' with every keystroke. Only we, as 'users', identify the Shakespearian content.
• Data without a user are merely the jumbled-together shadows of a past reality.
39

4. Discussion and outlook4.2 One way forward for official statistics
• What has this got to do with official statistics? For decades, official statistics has created 'designed data' in contrast to 'organic data'.
• The questions we ask of businesses and households create data with a pre-specified purpose, with a use in mind.
• Indeed, designed data through surveys and censuses are often created by the users.
• This means that the ratio of information to data (for those uses) is very high, relative to much organic data.
• Direct estimates are made from each data item – no need to search for a Shakespearian sonnet within the masses of data.
40

4. Discussion and outlook4.2 One way forward for official statistics
• What has changed is that the volume of organic data produced now swamps the volume of designed data. The risk of confusing data with information has grown exponentially.
• We must collectively figure out the role of organic data in extracting useful information about the society.
• The challenge is to discover how to combine designed data with organic data, to produce resources with the most efficient information-to-data ratio.
• This means we need to learn how surveys and censuses can be designed to incorporate transaction data continuously produced by the internet and other systems in useful ways.
41

4. Discussion and outlook4.2 One way forward for official statistics
• Combining data sources to produce new information not contained in any single source is the future. The biggest payoff will lie in new combinations of designed data and organic data, not in one type alone.
• To continue the monkey-typewriter metaphor, the internet and other computer systems are like typewriters that have an unknown set of keys disabled.
• Some keys are missing but we do not know which ones are missing. They are not capturing all behaviours in the society, just some.
42

4. Discussion and outlook4.2 One way forward for official statistics
• The Shakespearian library may or may not be result of the monkeys pounding on the keys. In contrast to the beauty of the bard's words, we may only find pedestrian jingles and conclude that is as good as it gets.
• We need designed data for the missing keys; then we need to piece them together with the masses of organic data from the present keys.
• The combination of designed data with organic data is the ticket to the future.
Source: Grooves, R.M. (2016), 'One Way Forward for Official Statistics in the New Data World,' IARIW General Conference.
43

Contact
JENS MEHRHOFF
European CommissionDirectorate-General EurostatPrice statistics. Purchasing power parities. Housing statistics
BECH A2/0385, Rue Alphonse WeickerL-2721 Luxembourg+352 [email protected]
44