departement statistiek en aktuariële wetenskap department
TRANSCRIPT
Departement Statistiek en Aktuariële WetenskapDepartment of Statistics and Actuarial Science
Nuusbrief | NewsletterDecember 2018
IN THIS ISSUE
PAGE 10
PAGE 6
PAGE 2
STAFF MATTERSDepartment appoints � rst female full professor 2Inaugural lecture: Essential Data Science maps to safely navigate potholes 3News from the 2018 SASA Conference 5
INTERNATIONALISATIONResearch showcased internationally 6ISPS Handa World Blind Championships 2018 6
STUDENT ACHIEVEMENTSNumbers tell the success story of the 2018 Schumann medal recipient 7Academic bursaries awarded to students 8Students win big in Schroders essay competition 9Meet the class of 2018 10Honours presentations 2018 11SU student receives ASSA prize for best honours project in 2017 12
MEET AN ALUMNUSMr Lusani Mulaudzi 13
UPCOMING SEMINARSSeminar Program: First Semester 2019 15The � rst CARME conference in Africa 15

2
STAFF MATTERS
Department appoints � rst female full professorProf Sugnet Lubbe, the � rst female full professor in the Department of Statistics and
Actuarial Science, discovered the subject Mathematical Statistics in her second year as a student at Stellenbosch University (SU) and never looked back.
“I love the practical application of mathematics to analyse data,” she says.
She obtained all her degrees in Mathematical Statistics – undergraduate as well as postgraduate – at SU and completed her PhD under supervision of Prof Niël le Roux, emeritus professor of Statistics. After completing her doctoral studies, she continued her research activities while working as a statistician for British American Tobacco (BAT) in Stellenbosch.
“I continued doing research with Prof Le Roux, not with the goal of returning to the academic world but because I love research. Maybe I always knew that this is where I belong.”
Before applying for the position of professor at Stellenbosch University, Prof Lubbe was an associate professor in the Department of Statistical Sciences at UCT for more than seven years. Becoming a full professor was one of her goals after returning to the academic fold, and she is happy and proud to be the � rst female full professor in the Department.
She presents Mathematical Statistics to second-year students as well as two master’s modules on multi-dimensional scaling. She also assists the Faculty of Engineering with a Statistics module.
According to Prof Lubbe, graduates with a background in Statistics are in high demand.
“The � eld is exploding. People are calling it Data Science – no-one is sure what exactly it means but everyone more or less agrees that Statistics is an important component.”
She referred to the de� nition of this term in her inaugural lecture “Essential Data Science maps to safely navigate potholes”.
“So much data is being generated and there is a huge need for people to analyse and extract information from this data. A love for mathematics as well as problem-solving and analytical skills are important attributes for young people interested in this � eld.”
Prof Lubbe is passionate about research and would like to obtain a B rating from the National Research Foundation. She currently has a C rating, which indicates that she is an established researcher. B ratings are awarded to internationally acclaimed researchers.
“There are so many research ideas and only 24 hours in a day. The scope for research is huge,” she adds.
Apart from teaching and research, networking is also very important. This year, Prof Lubbe delivered presentations at the BRICS mathematics conference in Brazil as well as at the International Conference on Computational Statistics (COMPSTAT) in Romania. She serves as chairperson of the South African Statistical Association’s Multivariate Data Analysis Group (MDAG) as well as treasurer of the International Federation of Classi� cation Societies.
MDAG will host the � rst Correspondence Analysis and Related Methods (CARME) conference outside of Europe in Stellenbosch next year, and Prof Lubbe is serving as head of the local organising committee for this event.
“It is important to make a contribution,” she believes.
– See P3 for her inaugural lecture.
Prof Sugnet Lubbe (right) and Prof Ingrid Woolard, Dean of the Faculty of Economic and Management Sciences (left).

3
STAFF MATTERS
Inaugural lecture: Essential Data Science maps to safely navigate potholes
Professor Sugnet Lubbe gave her inaugural lecture on 21 June 2018. The title of her talk was: “Essential Data Science maps to safely navigate potholes”. It was a very signi� cant day for the Department of Statistics and Actuarial Science as Prof Lubbe is the � rst female full professor
appointed in the Department. The following is a shortened version of her presentation.
What is Data Science?Before turning to Data Science maps, let us � rst look at the question: “What is Data Science?” To answer the question, I turned to an internet search. The instinctive choice would be to go to Google, but Google uses Data Science to personalise the search results according to my speci� c search history. To obtain a just answer we need an unbiased sample of websites. The solution is DuckDuckGo (Buys, 2010) since it is an internet search engine that emphasises the protection of a searcher’s privacy and avoids the � lter bubble of personalised search results. The instruction I gave the search engine was ‘what is data science’. I then used the � rst three pages of results. By page three I encountered less relevant results such as newsletters, the de� nition of data, etc.
Key words were extracted, cleaned and tabulated. In the cleaning step concepts such as analysis and analyse are combined. A two-way frequency table of 153 concepts and 47 websites summarised the number of times each concept appeared on each site. A Data Science map is shown in Figure 1. The map is the result of a correspondence analysis on the two-way frequency table. The websites are indicated in black and the concepts in red. The font size of the concepts indicates the overall number of times each appeared in the web search. All in all, Data Science is a blend of many different aspects. Despite the many features of Data Science, there are many websites with similar de� nitions as indicated by the close proximity of most website names in Figure 1, to such an extent that some names need to be annotated on the side of the map. We also note from Figure 1 that the concept “visualize” appear at the core of Data Science. Visualisations with Data Science maps will be our topic of interest.
visualizebusinessbbbbbbbbbbbbbbbbbbbbbbbbbbbbbbbbbbbbbbbbbbbbbbbbbusiiiness
wikipedia
berkeley
datajobsdatascientists
doingds
springboard
techopedia
ucsd.potentialucsd.frontiers
ucsd.curriculum
ucsd.thinkingucsd.foundationsdatadiversitydsc.analytic
dsctechniques
dsc.uses
dsc.systems
dsc.stat
whatds
dscentralyoutube
oreilly
automate big datablend
clustering
computation
data mining
indexing
inference
patterns
prediction
processes
simulation
structure
wranglers
algorithm
predictive analyticsmastersds
dsc.vertical
decisivedatahbr
edxpriceomonics
quora
dsjobskills kdnuggets
wisconsin
ucsd.donohoucsd.berkeley
dscdsc.typesdsc.test
dsc.modern
dsc.deep
dsc.tips
dsc.curse
dsc.analystinnoarchitechstanford
ucsd.technical
dsc.engcoursera
domain expertise
Figure 1: Data Science map
Data Science mapsSo, where did it all start? The origin of these Data Science maps can be traced to Ruben Gabriel’s 1971 paper “The biplot graphic display of matrices with application to principal component analysis”. For me, my � rst encounter with a Data Science map was during my honours studies.
The data matrix
is represented in the biplot by decomposing it into the two matrices

4
Jan00Feb00
Mar00
Apr00
May00
Jun00
Jul00
Aug00
Sep00
Oct00Nov00
Dec00Jan01
Feb01
Mar01
X1
49
50
X2
79
0.8
0.85
0.9
1
1.05
1.1
1.15
1.2
X4
1.4
1.5
1.7
1.8
X5 X9
20.521
22
X12
12
14
16
18
X13
56
60
62
64
66
X10
2.5
3
3.5
4.5
X626 27
29
30
X7 43
45
X14
4.6
5
5.2
5.4
5.6
X11
20
20.5
21
X15
14.2
14.3
14.5
X8
29.5
31
31.5
32
32.5
X3
TARGET30.5
O. kenyensis (7)O. bullata (20) O. porosa (10)
Vessel diameter
60
80
100
120
140
160
180
Vessel length
300
400
Fiber length
10001200
14001600
1800
on the right of the equation. The � rst matrix (A) represents the rows of X while the second matrix (B) represents the columns. The value “-3” in row 2 column 3 of X is represented by the so-called inner product of a2 and b3. The inner product is given by the length of b3
times the length of the orthogonal projection of a2 unto b3. In my opinion, this sounds nearly impossible to “see” from the plot.
Luckily, the watershed moment came in 1996 with the publication of Biplots by John Gower and David Hand. According to the Gower and Hand philosophy, biplots can be viewed as the multivariate analogue of scatterplots as shown in Figure 2. The biplot provides a single view of a multidimensional data set, representing samples, variables and the relationship between samples and variables. In the example in Figure 2, further information is added by colouring the background according to the values associated with each point in the biplot.
Figure 2: Principal component analysis biplot according to the Gower and Hand (1996) philosophy.
A data set usually consists of rows × columns and is typically high dimensional, meaning we have many (more than two) rows and columns. For visualisation with maps, we are restricted to the 3D world we are living in. Graphical visualisations of the data are obtained as the best 2D (sometimes 3D) representation of the data. This means the map approximates the multidimensional data set. How to � nd the “best” representation depends on the function of the speci� c map. The pre� x “bi-” in biplots refer to the simultaneous representation of the rows and columns of the data set.
My � rst practical application in the usefulness of these biplot maps to guide decision making came in discriminating between stinkwood (Ocotea bullata) and imbuia (Ocotea porosa) used for old Cape furniture. The question posed to us was whether we can use statistics to distinguish amongst microscopic measurements of three different wood subspecies - stinkwood, imbuia and Ocotea kenyensis which is not used for furniture. The map in Figure 3 shows clear separation between the groups. When a controversial chair had to be auctioned and therefore classi� ed as either stinkwood or imbuia the map could assist in the decision-making process. Measuring the three relevant variables on a small piece of wood from the chair, the data point could be added to the map and clearly the star in Figure 3 suggests that the chair is imbuia and not stinkwood.
Figure 3: Canonical variate analysis biplot of Ocotea data, separating three subspecies.
In conclusionA variety of different Data Science maps can be constructed, depending on the data set and visualisation aim. In addition to principal component biplots which provide an overall map of the data and canonical variate analysis biplots which separate groups of observations, analysis of distance biplots and a classi� cation triplot can be constructed for more general analyses of groups in data. Different dissimilarity measures lead to different multidimensional scaling biplots while categorical data is represented with correspondence analysis of categorical principal component biplots. Three-way data, compositional data and longitudinal data all lead to further extensions of the basic biplot methodology.
Potholes?So where are the potholes to look out for? When practising good Data Science, one should be aware of not selectively reporting just the surprising results because they draw attention. Statistics is based on probabilities and it could be that this one result is in fact the one in twenty times (p-value < 0.05) that the conclusion is erroneous. Furthermore, analyses and results should be put into the proper context. This is where Data Science maps play an important role: The well-known saying “A picture is worth a thousand words” is explained by Wikipedia (2018) as implying that a complex idea can be conveyed with just a single still image. Equivalently in Data Science, a well-chosen graph can map out a multivariate complex data-story in a single map. These maps guide the way to sound decision making and often suggest suitable questions to ask from the analyses. All in all, biplots are essential maps to safely navigate potholes in the Data Science environment.
ReferencesBuys, J (2010). DuckDuckGo: A New Search Engine Built from Open Source. https://web.archive.org/web/20110317053629/http://ostatic.com/blog/duckduckgo-a-new-search-engine-built-from-open-sourceGower, J.C. and Hand, D.J. (1996) Biplots. Chapman & Hall.Wikipedia. (2018). https://en.wikipedia.org/wiki/A_picture_is_worth_a_thousand_words.
5
STAFF MATTERS
News from the 2018 SASA Conference
Staff in the Department of Statistics and Actuarial Science
Prof Tertius de Wet received the prestigious Thought Leader award, sponsored by SAS International, at the South African Statistical Association (SASA) 2018 Conference in Johannesburg.“A thought leader is a person who has made an impact within the South African statistical community across a wide range of activities and has made signi� cant contributions in academia, industry, government and elsewhere. The criteria include contributions and impacts made in leadership, knowledge generation, human capital development, impact of the work and research, and attracting funding.”
Prof Tertius de Wet
1st row: Prof T De Wet, Me HM Cilliers, Prof PJ Mostert, Me L Rhode, Prof PG Slattery
2nd row: Me S Loggenberg, Mr CJ Van der Merwe, Prof M Kidd, Dr H Viljoen, Me H Randall, Dr T Sandrock, Prof S Lubbe, Me E Huysamen
3rd row: Mnr SJ Burgess, Mr D Corubolo, Prof DG Nel, Dr S Bierman, Prof SJ Steel, Mr DR Loggenberg, Mr L Steyn
4th row: Prof WJ Conradie, Dr R Lötter, Dr CJB Muller, Dr MMC Lamont, Dr J Harvey, Mr RJ Clover, Dr D Hofmeyr, Prof DW Uys, Mr M Coxon, Dr F Kamper
PHOTO CREDIT: Anton Jordaan (SSFD/SCPS)
It is with great pleasure that we announce that Prof Niël le Roux has been elected as honorary member of the South African Statistical Association (SASA). An honorary member of SASA is a person who has made an extraordinary contribution to the knowledge of Statistics or to the advancement of the association as such and who has retired from his/her ordinary position.
Prof Niël le Roux
Dr Trudie Sandrock has been elected as member of the SASA Executive Committee responsible for the portfolio of Newsletter editor.
Dr Trudie Sandrock
6
INTERNATIONALISATION
Prof Niël le Roux was responsible for organising two special sessions on dimension reduction and visualisation for classi� cation at the 5th European Conference on Data Analysis (ECDA) in Paderborn, Germany, in July. Of the 12 presentations in these two sessions, members from the Department of Statistics and Actuarial Science contributed the following: - ‘Forward Stagewise Linear Regression for Ensemble Methods’ by Daniel Uys; - ‘Visualising Incomplete Data with Subset Multiple Correspondence Analysis’
by Johané Nienkemper-Swanepoel, Niël le Roux and Sugnet Gardner-Lubbe; - ‘Model Selection for Projected Divisive Clustering’ by David Hofmeyr and
Nicos Pavlidis; - ‘Unravelling Black Box Machine Learning Technique Predictions using Biplots’
by Adriaan Rowan, Sugnet Gardner-Lubbe and Francesca Little; - ‘A Biplot based on a Principal Surface’ by Raeesa Ganey and Sugnet
Gardner-Lubbe; and - ‘Computing Neural Reliability from EEG Recordings’ by Pieter Schoonees
and Niël le Roux.
The ECDA took place in the Heinz Nixdorf MuseumsForum, the world’s largest computer museum.
Prof Le Roux also went on a study visit to Prof John Gower at Open University, UK, in April 2018. The main purpose of the visit was to work on a book on Canonical Variate Analysis.
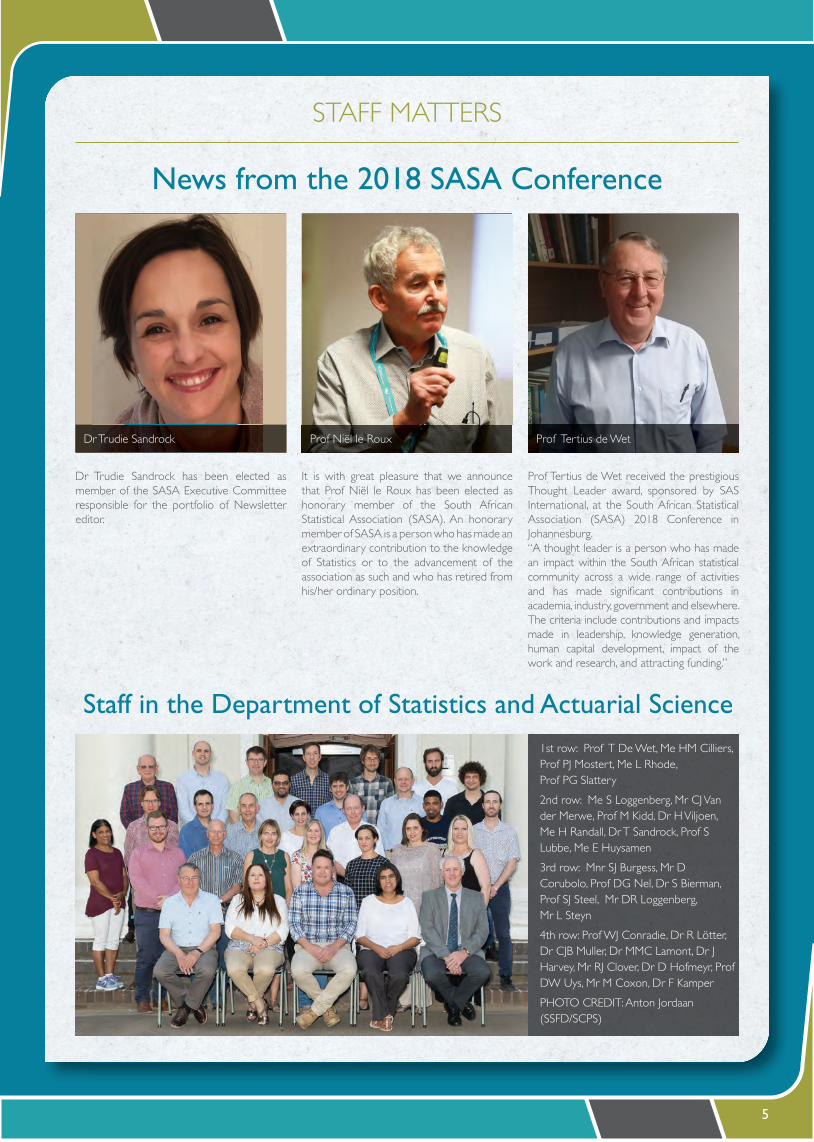
ISPS Handa World Blind Championships 2018Prof Garrett Slattery, head of Actuarial Science, recently returned from participating in the 2018 ISPS Handa World Blind Golf Championships and Italian Blind Golf Open, held in Rome in October. He was part of the SA Protea Team participating in the event, which included � ve players and their guides.
The SA team included: Garrett Slattery (player), Erich Kliem (guide); Johan Kotze (player), Henk Oberholzer (guide); Ernst Conradie (player), Jurie Maré (guide); Leon Strydom (player), Lizell Muller (guide); and Morné Els (player), Charl Enslin (guide).
The course was an impressive 18-hole (par 72) layout. The primary hazard on the golf course was its numerous water hazards, including some island greens, lakes and rivers.
The SA players did very well. Prof Slattery (who had won his 10th SA Championship earlier in the year) placed 4th (gross) in both the Italian Open and in the World Championships and 2nd (net) in the Italian Open in his sight category. Morné Els (based in the Eastern Cape), representing SA for the � rst time, � nished as runner-up (net) in the World Championships.
Prof Slattery, who has been a member of the International Blind Golf Association’s Board of Directors since 2012, has now been elected as vice-chairman. South Africa won the bid to host the next World Championships in 2020.
Some of Stellenbosch University delegates at the 5th ECDA: Profs Niël le Roux and Danie Uys in the back row and Johané Nienkemper-Swanepoel in the front row (middle).
Research showcased internationally
Members of the SA Protea Team

7
STUDENT ACHIEVEMENTS
Numbers tell the success story of the 2018 Schumann medal recipient
A gold medal – known as the CGW Schumann medal – is awarded annually by the Faculty of Economic and Management Sciences to an exceptional student who obtained an honours or master’s degree in that particular year. Candidates must have completed their undergraduate studies at Stellenbosch University too, in order to ensure a fair comparison of achievements. The award’s aim is to acknowledge academic excellence, but an attempt is also made to determine whether the candidate’s personality and conduct
are indeed such that he/she will be a worthy recipient of the Faculty’s highest accolade.
When Gerben Draaijer – recipient of the 2018 CGW Schumann medal for the best postgraduate student in the Faculty of Economic and Management Sciences – had to decide what he wanted to study, he knew it “had to be something to do with numbers and � gures”. And numbers also tell the success story of his time as a student in the Department of Statistics and Actuarial Science at Stellenbosch University (SU).
According to Prof Garrett Slattery, head of Actuarial Science, Gerben’s academic performance in his four years of study, during which he obtained both his undergraduate (2016) and honours degrees (2017) cum laude, was truly exceptional.
“While it is not uncommon for exceptional students to score over 90% for some modules, Mr Draaijer scored over 90% for most modules in his Bachelor’s degree, with his average mark being in the mid-90s and with several module marks of 100%.
“He was the top student in his honours year and was recommended for all of the available exemptions from the examinations of the Actuarial Society of South Africa based on performance in equivalent university modules.”
“Since 2000 we have had only three other students who performed at a level comparable to that of Mr Draaijer, two of whom were recipients of the Chancellor’s Medal,” Prof Slattery wrote in his motivation.
Gerben maintains there is only one way to do well academically and that is to work hard. “It is also important to have a plan and to be outset-orientated rather than time-orientated.”
Gerben did, however, not spend his whole university career in front of his books. He was a member of the house committee of Dagbreek men’s residence as well as the class representative of the Actuarial Science honours class in 2017. He also served on the management team of the Dempers Meyer mentorship programme for grade 11 learners from previously disadvantaged backgrounds between 2015 and 2017. In 2016 he travelled to Transkei as part of an outreach team to present a winter school for matric learners.
“I feel it is important to try and give something back because I realise that not everybody has the same opportunities. It is also rewarding to have an impact on people’s lives. At the end of the day you always get more than you give, though. This keeps you humble and makes you realise the value of relationships.”
One of his ambitions for the future is to make a positive difference in South Africa.
Gerben, who is currently working at KPMG in Cape Town, considers it a great privilege to have been awarded the Schumann Medal – named after the faculty’s � rst dean and awarded annually since 1986. His father Attie, mother Carina, sister Lize, and girlfriend Chané attended the event hosted on 27 July with him.
“Each of them made an important contribution towards this achievement, so it was very special to be able to share it with all of them,” he said.
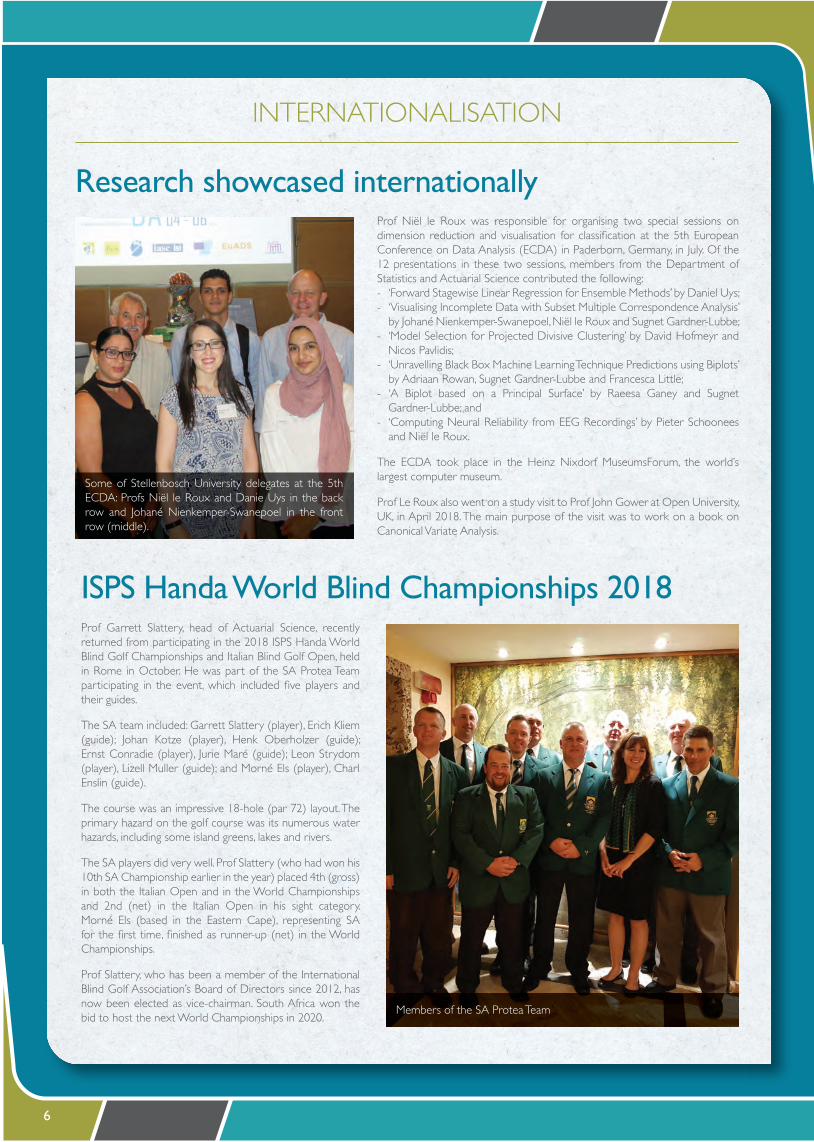
Prof Paul Mostert (chairperson of the Department of Statistics and Actuarial Science), Prof Ingrid Woolard (Dean: Faculty of Economic and Management Sciences), Gerben Draaijer, Prof Ronel du Preez (Vice-Dean: Teaching), and Prof Garrett Slattery (Head: Actuarial Science).

8
STUDENT ACHIEVEMENTS
Academic bursaries awarded to students
Faantjie and Lettie Pretorius bursary for undergraduate students: The heirs of Prof Faantjie Pretorius, the � rst professor of Statistics at Stellenbosch University and founder of the Department of Statistics and Actuarial Science, donated a substantial amount of money to the University. The return of this investment is used to award bursaries to deserving students in the Department every year. In 2018, Marli de Villiers and Albertus Louw shared the bursary from this fund.
Validus bursary for a Financial Risk Management student: Validus Risk Management Limited based in Windsor, UK, is an international institution that provides � nancial risk management advisory services. The � rm offers risk identi� cation and measurement, risk management strategy designing, risk reporting and monitoring, scenario analysis, and � nancial market analysis services. Mr Francois Scheepers, an alumnus of the Department of Statistics and Actuarial Science, is a partner and head of technology at Validus. A bursary agreement between Validus and the Department of Statistics and Actuarial Science was � nalised at the beginning of 2018. According to this agreement a substantial bursary will be awarded annually to a third-year or honours student in Financial Risk Management. In 2018 the bursary of R70 000 was awarded to Karla Vetten, a third-year BCom (Mathematical Sciences) student with focal area: Financial Risk Management.
Novare bursaries for Financial Risk Management students: The Department of Statistics and Actuarial Science has maintained a very good professional working relationship with Novare since the independent investment advisory business was founded in South Africa in 2000. It has since expanded into Africa. Mr Derrick Roper, a quali� ed actuary and alumnus of the Department is one of the founding directors of Novare. Through the years, Novare has supported the Financial Risk Management programme substantially in the form of signi� cant � nancial contributions. This year’s donation was used to award bursaries to six third-year students in Financial Risk Management. They are: Daniel de Kock, Brittany Robinson, Jozua Marais, Shannon Roseveare, Nathan Gounder and Guillame Giliomee.
Fltr : Daniel de Kock, Brittany Robinson, Jozua Marais, Shannon Roseveare, Nathan Gounder and Guillame Giliomee
Karla Vetten
Marli de Villiers (left) and Albertus Louw(right)

9
STUDENT ACHIEVEMENTS
Students win big in Schroders essay competitionThe � eld of Data Science is becoming more and more prominent and it was therefore appropriate that a Data Science topic was included in the annual Schroders essay competition, organised by the Department of Statistics and Actuarial Science at Stellenbosch University (SU).
The essay competition forms part of a joint investment research initiative that stems from an agreement signed between the Department and the global asset management � rm Schroders in November 2015.
The competition, now in its third year, was open to postgraduate students from the Departments of Statistics and Actuarial Science, Business Management and Economics on topics proposed by Schroders and Correlation Risk Partners. Each topic was assigned to a mentor by Schroders and Correlation Risk Partners, who were available via Skype to give advice and practical insight.
The winners – Jacob Kenyon (Optimising advertisement placement on television: A count regression approach); Jannes Reddig (Life
insurance TV advertising: a Data Science approach); Michael Hamman (Negative interest rate policy and monetary transmission: the European experience); Clio von Petersdorff (Negative interest rate policy); Kesley Kaps (The future of robo-investing: fact or fad?); Sechaba Mokobane (The future of robo-investing: fact or fad?); Daniela Grif� ths (Is climate change a real threat to � nancial stability?); Bianca Peters (The impact of environmental and social risk on future returns); James Njuguma (De� ning and measuring investment risk) and David Rodwell (De� ning and measuring risk) – walked away with R20 000 each.
Jacob, a master’s student in Statistics, was one of � ve students who decided to tackle the Data Science topic. He appreciated the opportunity to work on real-world data and said that he had to think outside the scope of what he’s learned in class to address the problem.
“It required signi� cant time and effort and it is very satisfying to receive a reward. It was de� nitely worth-while,” he added.
Prof Andrie Schoombee (Department of Economics), Prof Niel Krige, Mr Carel van der Merwe (Department of Statistics and Actuarial Science), Kesley Kaps, Prof Ingrid Woolard (Dean: Faculty of Economic and Management Sciences), Jacob Kenyon, Sechaba Mokobane, Jannes Reddig, James Njuguma, Daniella Grif� ths, Bianca Peters, David Rodwell, Clio von Petersdorff, Michael Hamman, Mr Doug Abbott (Schroders) and Prof Willie Conradie (Department of Statistics and Actuarial Science). Photo credit: Anton Jordaan

10
STUDENT ACHIEVEMENTS
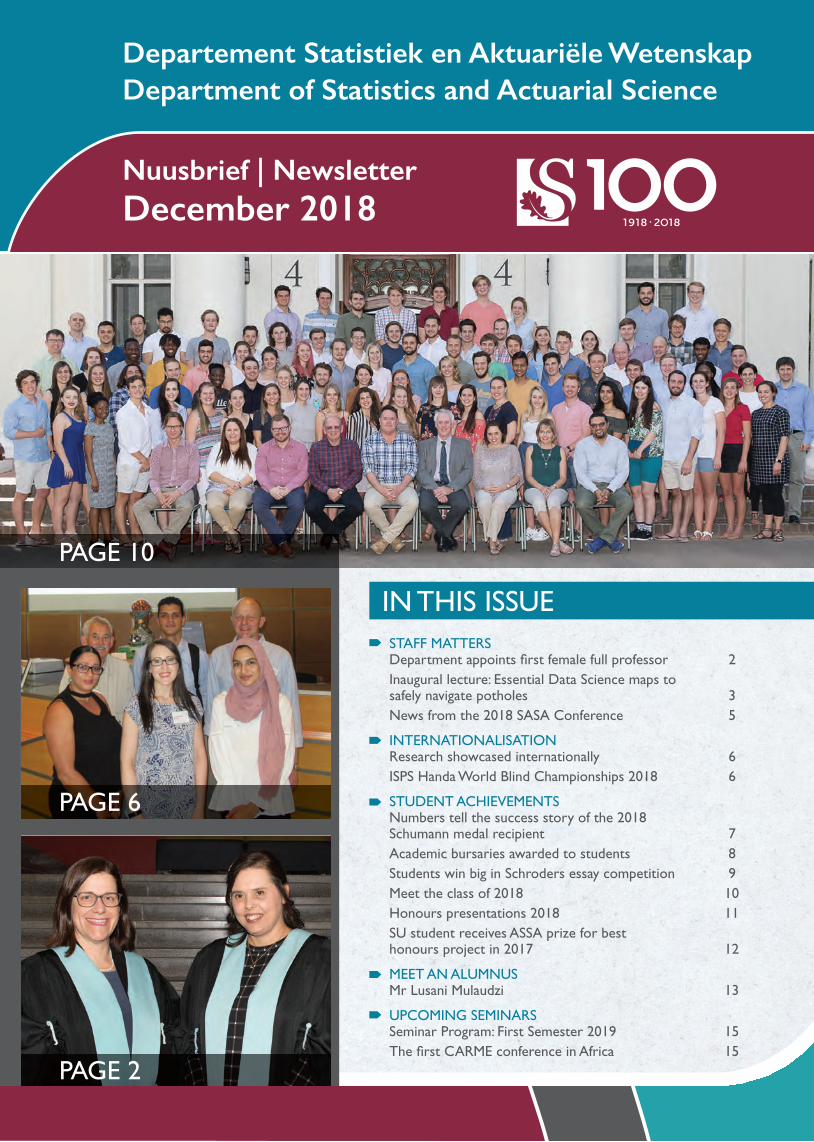
Meet the class of 2018The Department of Statistics and Actuarial Science is proud of its third-year and postgraduate students.
These students have come a long way and we wish them well for the future.
Third-year students and lecturers
Postgraduate students and lecturers
PHOTO CREDIT: Anton Jordaan (SSFD/SCPS)
PHOTO CREDIT: Anton Jordaan (SSFD/SCPS)

11
STUDENT ACHIEVEMENTS
Honours presentations 2018Each year, the honours students in the Department of Statistics and Actuarial Science have an opportunity to present their honours projects to the Department and other students. This year the presentations took
place in October. Below follows a summary of all the sessions as described by the various chairs.
Financial Risk Management honours students
Monday 8 October 2018 (Statistics and Mathematical Statistics)Chair: Dr C Muller
The true multi-disciplinary nature of Statistics and its application in a myriad of � elds was on display during the annual honours project presentations.
In one session a more theoretical project, using an amended form of the SIMEX method and simulated data to investigate measurement error in the explanatory variables when using a retrospective survey design, was sandwiched between two more practical projects. The one explored the use of statistical parametric maps (SPMs) and posterior probability maps (PPMs) when analysing Functional Magnetic Resonance Imaging (fMRI) images of the brain. The second, a multi-label classi� cation project, showcased the � eld of music information retrieval and how multi-label classi� cation using support vector machines, boosted trees and k-nearest neighbours can be used to classify a piece of music into several emotion labels.
Tuesday 9 October 2018 (Statistics and Mathematical Statistics)Chair: Prof D Uys
The � rst project considered the total monthly vehicle sales in South Africa from January 1994 to January 2018. An intervention took place in October 2008 with the global recession affecting vehicle sales. The pre-intervention time series was investigated by using Holt-Winters Exponential smoothing models and SARIMA models, while the full-time series was investigated using an intervention analysis. The different methods were compared by considering their forecast accuracy.
In the second project, a statistical analysis of � rst-year academic performance in the module Theory of Interest was conducted. The aims of this project were to analyse which variables could potentially in� uence academic performance and to build a model that can be used to predict a student’s class mark and � nal mark. Statistical modelling techniques such as multiple linear regression, decision trees, bagging and random forests were � tted to the data.
The third project performed a time series analysis on wind data in order to create a warning system for wind turbines. The automated time series function auto.arima available in the R-software forecast package was implemented to achieve this objective.
Tuesday 9 October 2018 (Financial Risk Management)Chair: Mr CJ van der Merwe
During the � rst Financial Risk Management session, � ve groups presented their work. A wide variety of topics was covered, all applicable to quantitative � nance.
The � rst group presented methods of estimating a � oor for the values cryptocurrencies. Their presentation started by explaining the core mechanics of cryptocurrencies after which they showed how they expanded on current research within the � eld by applying it to altcoins.
The second group presented on style diversi� cation in portfolio management and showed how, during certain � nancial cycles, certain investments styles would outperform others.
The following group showed how they created an easily understood method of how to visualise multidimensional � nancial data through biplots.
The fourth group compared different portfolio optimisation methods with the aim of determining strategic asset-allocation models that improve upon the portfolio optimisation techniques de� ned under Modern Portfolio Theory.
The � nal group showed how various models can be applied in the South African context to see if defaults of large institutions can be predicted earlier than traditional probabilities of defaults obtained from third parties.

12
Thursday 11 October 2018 (Statistics and Mathematical Statistics)Chair: Prof S Lubbe
Three project teams presented their work on Data Science problems presented by Capitec Bank. The work centred around binary classi� cation – either to predict credit card uptake or credit risk for loan applicants with limited credit history. All students agreed that the practical application of their theoretical knowledge to a “real-world” problem was an eye opener. Speci� cally, the amount of effort and time needed for data preparation was reiterated repeatedly.
The methods applied ranged from logistic regression with lasso-type penalties to random forests and gradient boosting descent. Each group managed to provide a model which signi� cantly improves classi� cation for informed decision making. Both the Department of Statistics and Actuarial Science and Capitec Bank found the collaboration mutually bene� cial and we are pleased to say that the collaboration will become a regular feature of our honours programme.
Thursday 11 October 2018 (Financial Risk Management)Chair: Prof WJ Conradie
In the second session of the Financial Risk Management presenta-tions, four groups delivered their talks.
Two of the groups investigated whether derivatives traded on the JSE satisfy the theoretical no-arbitrage pricing formulas found in literature. In the one study it was found that the market prices of a number of futures follow theoretical pricing formulas in a narrow band and if transaction cost is taken into account arbitrage opportunities do not exist. In the second study a number of options traded on the JSE was considered and it was found the market prices of these option prices closely match the theoretical option Black-Scholes-Merton and Bino-mial tree pricing theory. However, the choice of the volatility model has a considerable impact on estimating the values of the options and the challenge is to use the most appropriate volatility model.
The next group researched the ability of South African equity man-agers to time their sales, speci� cally the opportunity cost of removing a company that might have performed well in the future versus the stocks they then bought into. They found that South African managers, on average, generally did buy stocks that outperformed the stocks
they sold over the past 10 years, but that they struggled in some calendar years that had a lot of price volatility and political uncertainty.
The last group to present built various “Monkey Funds” (A term coined by Malkiel), testing whether portfolios that were random-ly constructed could outperform a market index after costs. The benchmark cognisant semi-active strategies performed the worst due to costs, and the funds that took completely random positions with infrequent rebalancing had the highest likelihood of outper-forming the market index.
Friday 12 October 2018 (Statistics and Mathematical Statistics)Chair: Dr M Lamont
Three projects were presented in this session with the main themes as follows:
In the � rst presentation students presented work on using a logistic regression model and ensemble models (bagging, random forest and boosting) to model climate data. The second presentation focused on using penalised linear discriminant analysis, which is an extension of Fisher’s linear discriminant analysis, to analyse high-dimensional mi-croarray data. The last presentation of this session investigated the use of parametric models such as the Gompertz-Makeham and Hellig-man-Pollard models as well as the Cox model in a mortality analysis.
The actuarial students also worked hard on their projects during the year, and Mr Stephen Burgess provided a brief overview below:
Every year, Actuarial staff and volunteers from industry supervise around 20 Actuarial honours research projects. Student projects cover a wide range of topics. This year topics ranged from mortality analyses and projections, investigations into the spending patterns of retirees, optimal investment strategies in retirement to analyses of trends in the cost of breast cancer treatments. This provides students with a valuable opportunity to apply the knowledge that they have built up during the undergraduate degree to real-life problems.
We are proud of the quality of these projects. For example, the Financial Services Board used insights from a project completed by a student in 2013 when they developed a new solvency regime for the � nancial services industry. This project, as well as projects completed by students in 2012 and 2017, received the Actuarial Society of South Africa’s prize for the best honours project at a South African university.
Every year, the Actuarial Society of South Africa awards a prize to the best honours project at a South African university. The 2017 prize was awarded to a Stellenbosch University student, Rayno Mostert, for his paper entitled: “Calibrating the Merton Jump Diffusion Stochastic Process using Arti� cial Neural Networks”.
Actuarial practitioners are challenged with the problem of calibrating stochastic processes to real-world data sets. Rayno’s project looked at the use of arti� cial neural networks (ANNs) as an alternative meth-od to calibrate a stochastic process. Rayno conducted a simulation study on the Merton Jump-Diffusion process and compared the performance of ANN models to traditional calibration methods such as maximum likelihood estimation and generalised method of moments. His results indicate that the ANN architecture was able to yield acceptable parameter estimates, within realistic parameter bounds.
SU student receives ASSA prize for best honours project in 2017

13
MEET AN ALUMNUS
Mr Lusani Mulaudzi: Views on the future of the SA actuarial profession
Tell us something about yourself and your family.I was born and raised in Limpopo in a village called Ha-Mashamba. I have two older brothers and two younger sisters. My parents are both teachers, but my father retired four years ago. I’ve been married for 11 years and have three boys. I am involved in community work and serve as a pastor of a small congregation in Delft. I am passionate about education and development.
Why did you choose to study at SU?I came to Stellenbosch because I was attracted by a BA (Value and Policy Studies) course that was offered only by Stellenbosch University. Actuarial Science was my second option. A counselling psychologist convinced me that it would be better to do Actuarial Science given my parents’ views and other factors such as funding opportunities. My knowledge of Actuarial Science was very limited at that point in time.
Tell us something about your career.I started off as an actuarial consultant at Sanlam for four years and moved on to Medscheme and worked as a health actuary for six years. I was responsible for pricing, product design and risk management for a number of medical schemes including Fedhealth Medical Scheme. In 2017, I worked in Johannesburg as a CEO of a small health administrator and managed care organisation. I founded a consulting company last year and I am still going through the birth pains.
What are the main challenges of your current role?The main challenge that I face is to make a meaningful impact in what I do although some of the activities that can achieve this do not pay immediately. My challenge is to maintain a good balance between pro� t-making activities and non-pro� t-making activities.
What skills developed through your actuarial quali� cation have you found particularly valuable in your career?Stellenbosch University allowed me the freedom to think and work independently, but I always had the support of classmates as well as lecturers who were more than willing to go the extra mile. Actuarial Science is technically very rigorous, and I battled a lot in my third and honours years. The discipline and professionalism amongst lecturers at Stellenbosch University were excellent and due to that very little time in all my academic years at the university was wasted. I had very little computer experience when I came to Stellenbosch University, but I left with a level of con� dence in this regard. The additional courses that I did after my honours year helped me to qualify as an actuary. In particular, I thoroughly enjoyed the Health fellowship course that was offered and presented by top health actuarial prac-titioners such as Shivani Ranchod, Heather McLeod and Paul la Cock.
Mr Lusani Mulaudzi obtained a BCom (Hons) degree and postgraduate diploma in Actuarial Science from Stellenbosch University and quali� ed as an actuary in 2012. He currently heads up his own actuarial consulting company. In 2017, he was elected as the president-elect of the Actuarial Society of South Africa and he will lead the South African actuarial profession in 2020/2021. In this article, Lusani tells us about his family, career and vision for the actuarial profession.

14
What do you think are the most important char-acteristics that a prospective actuarial student should possess if s/he wants to pursue a career in Actuarial Science?Prof Slattery presented a paper while I was at Stellenbosch University entitled “Adapt or Die”, with reference to the actuarial profession. Although the issues that he raised in that paper are no longer as applicable, the warning is still relevant today. Actuarial Science makes use of whatever quantitative and qualitative methods are available to give sound and authoritative advice to planners, especially within the � nancial services sector. We have now reached a juncture where it is clear that this skill set needs to be applied more widely, including in non-� nancial sectors. Actuaries have been involved in demographic modelling since its early days as well as in pensions and life insurance. They then branched out into general insurance, investments, health insurance, enterprise risk management and lately, banking. At the most recent convention of the Actuarial Society of South Africa, there was an increase in the number of topics covering arti� cial intelligence, data science and public policy. There was a strong sense that we need to modernise our toolkit and use it to help solve some of the biggest public policy issues facing our country. Actuaries have demonstrated their ability to adapt and the best paper at the convention on neural networks served to illustrate this point. The profession will continue to identify and ‘capture’ appropriate tools into its evolving toolkit.
What role can a professional organisation like the Actuarial Society play in developing the SA economy and/or society?In my opinion, the biggest challenge facing the profession is our abil-ity to be relevant and to serve the public interest in South Africa. In the past the profession tended to be more of a private sector discipline. Given the scope and nature of the decisions made in the public sector, it makes sense that the actuarial profession should be a lot more involved in assisting the politicians and public of� cials to better understand the future impact of their decisions and the need
to make the best possible decisions. The actuarial profession needs to continue to transform its demographics whilst at the same time maintaining high standards of actuarial education.
Is Data Science more relevant than Actuarial Science? I view Data Science as a perfect example of a modern tool that actuaries should ‘capture’. Actuaries have a much wider responsibility in � nancial services organisations such as risk management, product design, pricing, reserving and strategy development, etc. All these functions require insights that can be drawn from available data and therefore require data scientists. It might be argued that actuaries in future may need to become data scientists as part of their professional development journey in order to continue to add value in their organisations. The emphasis on professionalism and continuous professional development will continue to make the actuarial profession one of the most valued quali� cations. This can only happen if actuaries continuously adapt and � nd relevant areas of practice and set high standards in those areas.
It is a great privilege to celebrate and showcase our alumni. As an alumnus/a of Stellenbosch University, you are our most valuable stakeholder and ambassador. You form part of a global community of more than 120 000 graduates. Your involvement with us ensures that you are kept abreast of developments here, that you receive a range of opportunities to remain connected to other alumni and that your degree and alma mater remain relevant. Contact [email protected]

15
UPCOMING SEMINARS
Seminar Programme: First Semester 2019
The � rst CARME conference in Africa
Stellenbosch University - Department of Statistics and Actuarial Science8 February Peter Filzmoser (Vienna University of Technology, Austria) - Robust and sparse classi� cation in high dimensions
22 February Adriaan Rowan (Analytics consultant, Cape Town) - Using and understanding non-linear predictive models
8 March Etienne Roussouw (Munich RE, Cape Town) - The rapidly developing world of (re)insurance
12 AprilPiet Maree (Discovery Health, Johannesburg) - Incentives, physical activity and absenteeism: investigating the impact of Vitality on employee wellbeing and how an Apple Watch can prevent absenteeism
26 April Mark Nasila (FNB, Johannesburg) - Why Statisticians are key in harnessing the ‘Fourth Industrial Revolution’
10 May Loamie Kotze (Isimo Health, Cape Town) - Markov modelling of disease progression in the presence of missing covariates
Lectures start at 13:00 and are held in room 2048 of the Van der Sterr Building, c/o Victoria and Bosman streets, Stellenbosch.
Enquires: Danie UysTelephone: 021 808 3879Fax: 021 808 3830E-mail: [email protected]
This is a popular series of conferences held every four years. It started in 1991 in Cologne and the previous conference was in Naples in 2015. The conference has attracted 100-200 participants each time and has led to four edited volumes of books and two special journal issues. Please visit our website for more information: https://carmesa2019.wixsite.com/conference.
We cast the net relating to “related methods” quite wide, including all branches of multivariate analysis, compositional data analysis, analysis and modelling of categorical data, cluster analysis, multivariate data visualisation, “big data” applications, and more. Applications are welcome and usually cover a wide spectrum of � elds: sociology, � nance, food research, ecology, marketing, psychology, education, linguistics, archaeology, etc.
The Multivariate Data Analysis Group of the South African Statistical Association will be hosting the � rst Correspondence Analysis and Related Methods (CARME) conference outside Europe, from 4 to 6 February 2019, Stellenbosch, South Africa.

1616
We hope you enjoyed this edition of the Department of Statistics and Actuarial
Science’s biannual newsletter. To access all our past newsletters and departmental
information visit our website: http://www.sun.ac.za/statistics.
Follow us on social media: https://www.facebook.com/STATISTICSatSUN/
The next newsletter will be distributed in July 2019.