department of labour annual report 2008/09 - part a
TRANSCRIPT

Annual Report1 April 2008 to 31 March 2009
PublisherDepartment of Labour
Chief Directorate of CommunicationPrivate Bag X117
Pretoria0001
Editing, Photography, Layout, Design and DistributionMedia Production Subdirectorate
Chief Directorate of CommunicationDepartment of Labour
Websitewww.labour.gov.za
ISBN No978-0-621-38599-1
RP NoRP77/2009
1 April 2008 - 31 March 2009i
Annual Report

Department of LabourLaboria House
Pretoria
14 August 2009
It is my privilege and honour to submit to you the Annual Report of the Department of Labour
for the period 1 April 2008 to 31 March 2009,in terms of the Public Finance Management Act, 1999.
Minister MMS Mdladlana, MPMinister of Labour
S MorotobaActing Director-General
of Labour
1 April 2008 - 31 March 2009iii
Annual Report

Institutions reporting to the Executive Authority
Advisory Council for Occupational Health and SafetyCommission for Conciliation Mediation and Arbitration (CCMA)Commission for Employment Equity (CEE)Compensation BoardEmployment Conditions Commission (ECC)National Economic Development and Labour Council (NEDLAC)Productivity SANational Skills Authority (NSA)Sector Education and Training Authorities (SETAs)Umsobomvu Youth Fund (UYF)Unemployment Insurance Board
Minister of Labour
Employment and Skills Develop-ment Services and Human Re-
sources Development
M M S Mdladlana, MP
Deputy Director-GeneralS Morotoba
Labour Policy and Labour MarketProgrammes
Deputy Director-GeneralL Kettledas
S Morotoba
Service Delivery
Deputy Director-GeneralS Zondeki
Deputy Director-GeneralS Mkhonto
Unemployment Insurance Fund(Commissioner)
Deputy Director-GeneralB Seruwe
Compensation Fund (Commis-sioner)
Acting Director-General
Chief Financial Officer
B Maduna
Corporate Services
Acting Deputy Director-GeneralB Maduna
Vacant
Vacant
1 April 2008 - 31 March 2009
Organisational StructureTop Leadership
Annual Report
iv

Page
Section 1: General Information 1
Introduction 1Ministry of Labour 2 Mission Statement 3Legislative Mandate 3
Section 2: Programme Performance 9
Voted Funds 9 Departmental revenue, expenditure and other specific topics 9Departmental expenditure 9Transfer payments 10Aim of the Vote 10Programme purpose and measurable objectives 11 Broad policies, priorities and strategic goals 12Programme 1: Administration 26 Programme 2: Service Delivery 35Programme 3: Employment and Skills Development Services/Human Resource Development 53Programme 4: Labour Policy and Labour Market Programmes 67Programme 5: Social Insurance 68National Skills Fund 69
Section 3: Report of the Audit Committee 77
Section 4: Annual Financial Statements 79
Department of Labour
Report of the Auditor-General 80 Report of the Accounting Officer 88 Appropriation Statement 105Notes to the Appropriation Statement 115Statement of Financial Performance 118Statement of Financial Position 119Statement of Changes in Net Assets 120Cash Flow Statement 121Accounting Policies 122Notes to the Annual Financial Statements 130Disclosure Notes to the Annual Financial Statements 139Annexures 156
Sheltered Employment
Report of the Auditor-General 164 Statement of Responsibility by the Accounting Officer 171Report of the Accounting Officer 172 Balance Sheet 175 Income Statement 176
1 April 2008 - 31 March 2009
ContentAnnual Report
v

Statement of Changes in Equity 177 Cash Flow Statement 178Accounting Policies 179 Notes to the Annual Financial Statements 189 Detailed Income Statement 197
National Skills Fund
Report of the Auditor-General 199 Report of the Accounting Officer 204 Approval of Accounting Authority 213Statement of Financial Performance 214 Statement of Financial Position 215Statement of Changes in Net Assets 216Cash Flow Statement 217Accounting Policies 218 Notes to the Annual Financial Statements 227
Section 5: Human Resource Management 247
1 Expenditure 2472 Employment and vacancies 2493 Job evaluation 2514 Employment changes 2525 Employment equity 2566 Performance rewards 2597 Foreign workers 2618 Leave utilisation 2629 HIV and AIDS and Health Promotion Programmes 26310 Labour relations 26511 Skills development 26712 Injuries on duty 26813 Utilisation of consultants 269
1 April 2008 - 31 March 2009vi
Annual Report

Introduction
The Department of Labour is pleased to present its Annual Report in termsof the Public Finance Management Act for the 2008/09 financial year. Thisreport is shaped by the Ministerial Programme of Action for the period 2004to 2009.
Key amongst the issues shaping our focus as the Department, ashighlighted in the Ministerial Programme of Action, is the need to enhanceour contribution to ensure that our country’s economy grows, jobs arecreated, and ultimately – poverty is eradicated.
It is in this context that our vision remains relevant – which seeks to ensurethat “The Department will strive for a labour market which is conducive to economic growth, investmentand employment creation and which is characterised by rising skills, equity, sound labour relations,respect for employment standards and worker rights”.
In pursuance of these goals, we have set ourselves the objective of increasingly containing thebureaucracy that comes with the functioning of government, and put in place an innovative projectmanagement approach to enhance service delivery.
1 April 2008 - 31 March 20091
Annual Report
Section 1General Information
S MorotobaActing Director-General
of Labour

22 Ministry of Labour
2.1 Institutions reporting to the Executive Authority
● Advisory Council for Occupational Health and Safety (ACOHS)
● Commission for Conciliation, Mediation and Arbitration (CCMA)
● Commission for Employment Equity (CEE)
● Compensation Board
● Employment Conditions Commission (ECC)
● National Economic Development and Labour Council (NEDLAC)
● National Skills Authority (NSA)
● Productivity South Africa
● Sector Education and Training Authorities (SETAs)
● Umsobomvu Youth Fund (UYF)
● Unemployment Insurance Board.
2.2 Bills submitted to the legislature during the financia l year
The President signed the Skills Development Amendment Act, 2008 on 27 November 2008.
2.3 Ministeria l visits abroad
Ministerial Visits abroad1 April 2008 to 31 March 2009
Description Date Purpose of visit
Kingdom of Lesotho 31 March to 4 April 2008 SADC Committee Meeting of Ministers responsible for
Employment and Labour and Social Partners
International Labour
Organisation (ILO)
28 May to 13 June 2008 97TH Session of the International Labour Conference; Geneva
Korea 29 June to 2 July 2008 XVIII World Congress on Safety and Health at Work
Azerbaijan 24 to 27 September 2008 4th Global Youth Employment Summit
Namibia 20 October 2008 Signing of the Memorandum of Understanding on Labour
Cuba 1 to 15 November 2008 Study Tour on Safety and Health at Work
International Labour
Organisation (ILO)
6 to 21 November 2008 303rd Session of the Governing Body; Geneva
1 April 2008 - 31 March 20092
General Information
Annual Report
33 Mission Statement
The Department of Labour will play a significant role in reducing unemployment, poverty andinequality through a set of policies and programmes developed in consultation with social partners,which are aimed at:
● Improved economic efficiency and productivity
● Skills development and employment creation
● Sound labour relations
● Eliminating inequality and discrimination in the workplace
● Alleviating poverty in employment
● Enhancing occupational health and safety awareness and compliance in the workplace
● Nurturing the culture of acceptance that worker rights are human rights.
4 Legislative Mandate
The Department of Labour relates to the following Statutory Bodies:
4.1 Advisory Council for Occupational Health and Safety
The Council was established in terms of section 2 of the Occupational Health and Safety Act, 1993 (OHSA).
The functions of the Council include the following:
● Advising the Minister on policy matters arising out of or in connection with the application of theprovisions of the Act
● Advising the Minister on any matter relating to occupational health and safety
● Performing the functions assigned to it by the Act or referred to it by the Minister
● Conducting investigations and doing research with a view to the performance of its functions
● Making rules relating to the calling of Council meetings, the determination of a quorum for theprocedures at such meetings and generally relating to all matters which may be necessary forthe effective performance of its functions
● Advising the Department on the formulation and publication of standards, specifications or otherforms of guidance for the purpose of assisting employers, workers and users to maintainappropriate standards of occupational health and safety
● Advising the Department on the promotion of education and training in occupational health andsafety
● Advising the Department on the collection and dissemination of information on occupationalhealth and safety
● Concluding agreements for the performance of a particular act or particular work or for the
1 April 2008 - 31 March 20093
General Information
Annual Report

rendering of a particular service.
44.2 Commission for Concil iat ion, Mediation and Arbitration
This Commission was established in terms of section 112 of the Labour Relations Act, 1995 (LRA).
The Commission’s functions are to:
● Attempt to resolve disputes through conciliation and arbitration
● Assist in the establishment of workplace forums
● Compile and publish information and statistics about its activities
● Advise a party to a dispute about the procedure to follow in terms of this Act
● Assist a party to a dispute to obtain legal advice, assistance or representation
● Offer to resolve a dispute that has not been referred to the Commission through conciliation
● Conduct, oversee or scrutinise any election or ballot of a registered trade union or registeredemployers’ organisation if asked to do so
● Publish guidelines in relation to any matter dealt with in this Act
● Conduct and publish research into matters relevant to its functions
● Provide, upon request, workers, employers, registered trade unions, registered employers’organisations or councils with advice or training relating to the primary objectives of the LRA
● Perform any other duties imposed, and exercise any other powers conferred on it in terms of theLRA and perform any other function entrusted to it by any other law.
4.3 Commission for Employment Equity
This Commission was established in terms of section 28 of the Employment Equity Act, 1998 (EEA).
The Commission’s functions are to advise the Minister on:
● Codes of good practice issued by the Minister in terms of section 54 of the Act
● Regulations made by the Minister in terms of section 55
● Policy and any other matter regarding this Act
● Issuing awards of achievement by employers in furthering the purposes of the Act
● Any matter relating to the application of this Act, including appropriate and well-researchednorms and benchmarks for the setting of numerical goals in various sectors the performance ofany other prescribed function.
4.4 Compensation Board
This Board was established in terms of section 10 of the Compensation for Occupational Injuries andDiseases Act, 1993 (COIDA).
1 April 2008 - 31 March 20094
General Information
Annual Report

Its functions include advising the Minister on:
● Matters of policy arising out of or in connection with the application of the COIDA
● The nature and extent of the benefits payable to workers or dependents of workers, includingthe adjustment of existing pensions
● The appointment of assessors
● The amendment of the COIDA.
The Board also advises the Director-General regarding the performance of particular aspects of itsfunctions.
44.5 Employment Condit ions Commission
This Commission was established in terms of section 59 (1) of the Basic Conditions of EmploymentAct, 1997 (BCEA).
The functions of the Commission are to advise the Minister on:
● Sectoral determinations in terms of Chapter 8
● Any matter regarding basic conditions of employment
● Any matter arising out of the application of the Act
● The effect of the policies of Government on employment
● Trends in collective bargaining and whether any of those trends undermines the purposes of theAct
● Any matter concerning the employment of children, including the review of section 43 (inconsultation with the Minister of Welfare and Population Development, now called the Ministerfor Social Development)
● Any matter concerning basic conditions of employment in the public service (in consultation withthe Minister of Public Service and Administration).
4.6 National Economic Development and Labour Council
This Council was established under section 2 of the National Economic Development and LabourCouncil Act, 1994 (NEDLAC Act).
The functions of the Council are to:
● Strive to promote the goals of economic growth, participation in economic decision-making andsocial equity
● Seek to reach consensus and conclude agreements on matters pertaining to social and economicpolicy
● Consider all proposed labour legislation relating to labour market policy before it is introduced inParliament
● Consider all significant changes to social and economic policy before it is implemented or
1 April 2008 - 31 March 20095
General Information
Annual Report

introduced in Parliament.
44.7 National Skil ls Authority
The National Skills Authority (NSA) was established in terms of section 4 of the Skills DevelopmentAct, 1998.
The functions of the NSA are to:
● Advise the Minister on a national skills development policy, a national skills developmentstrategy, guidelines on the implementation of the national skills development strategy, theallocation of subsidies from the National Skills Fund, and any regulations to be made
● Liaise with Sector Education and Training Authorities (SETAs) on the national skills developmentpolicy and the national skills development strategy
● Report to the Minister in the prescribed manner on the progress made in the implementation ofthe national skills development strategy
● Conduct investigations on any matter arising out of the application of this Act
● Exercise any other powers and perform any other duties conferred or imposed on the NSA bythis Act.
4.8 Productivity South Africa
This is a section 21 Company (Incorporated Association without Gain), established under theCompanies Act, 1973.
The functions are to:
● Promote, develop capacity and facilitate partnerships in national productivity drives
● Disseminate information on the nation’s productivity performance and productivity improvementexperiences
● Initiate relevant productivity improvement approaches and techniques
● Influence the creation of a conducive socio-economic, legislative and policy environment forongoing productivity improvement and for South Africans to adopt a culture of sustainableproductive practices, in order to enjoy a high quality of life.
4.9 Sector Eduction and Training Authorities (SETAs)
Sector Education and Training Authorities (SETAs) were established in the terms of the SkillsDevelopment Act 1998. We have 23 SETAs as listed below:
Financial and Accounting Services Education and Training Authority FASSET
Banking Sector Education and Training Authority BANKSETA
Chemical Industries Education and Training Authority CHIETA
Clothing, Textile, Footwear and Leather Education and Training Authority CTFL SETA
Construction Education and Training Authority CETA
1 April 2008 - 31 March 20096
General Information
Annual Report

Education, Training and Development Practices Education and Training Authority ETDP SETA
Energy Sector Education Training Authority ESETA
Food and Beverages Manufacturing Education and Training Authority FoodBev SETA
Forestry Industries Education and Training Authority FIETA
Health and Welfare Sector Education and Training Authority HWSETA
Information Systems, Electronics and Telecommunication ISETTTechnologies Education and Training Authority
Insurance Sector Education and Training Authority INSETA
Local Government Education and Training Authority LGSETA
Media, Advertising, Publishing, Printing and Packaging MAPPP-SETAEducation and Training Authority
Mining Qualifications Authority MQA
Manufacturing, Engineering and Related Services Education and Training Authority MERSETA
Security and Safety Sector Education Training Authority SASSETA
Agricultural Sector Education and Training Authority AgriSETA
Public Services Sector Education and Training Authority PSETA
Services Sector Education and Training Authority SERVICES
Tourism and Hospitality Education and Training Authority THETA
Transport Education and Training Authority TETA
Wholesale and Retail Sector Education and Training Authority W&RSETA
44.10 Umsobomvu Youth Fund (UYF)
The UYF is a Section 21 Company established under the Companies Act, 1973.
The purpose of the UYF is to facilitate skills development and job creation for the youth. Skillsdevelopment programmes are divided into National Youth Services (NYS) and School to Work (StW).NYS is aimed at providing the youth with skills whilst they provide services to their community.
● StW assists young people to access high-level careers that are scarce
● Umsobomvu has established:
– 12 youth advisory centres, to offer information and counselling support regarding career development, employment and entrepeneurship
– Two Business Development Support Voucher Programme (BDSVP) fund the Entrepreneurship Finance Programme consisting of three products, namely Micro Finance (loans between R1 000 and R50 000); SME Finance (loans between R100 000 and R5 million) provided through the Progress Fund (a partnership with FNB and Momentum) and the Franchise Fund (a partnership with business partners) and cooperatives.
1 April 2008 - 31 March 20097
General Information
Annual Report

44.11 Unemployment Insurance Board
The Unemployment Insurance Board was established in terms of section 47 of the UnemploymentInsurance Act, 2001.
Its functions include the following:
● To advise the Minister on
– unemployment insurance policy– policies arising out of the application of this Act– policies for minimising unemployment– the creation of schemes to alleviate the effects of unemployment insurance
● To make recommendations to the Minister on changes to legislation in so far as it impacts onpolicy on unemployment or policy on unemployment insurance
● To perform any other function which may be requested by the Minister for purposes of givingeffect to this Act.
1 April 2008 - 31 March 20098
General Information
Annual Report

Voted Funds
Departmental revenue, expenditure and other specific topicsCollection of departmental revenue
Departmental expenditure
Appropriation Main appropriation Adjusted appropriation Actual amount spent Under-expenditure
R’000 R’000 R’000 R’000
Programme 1 387 207 384 207 372 906 11 301
Programme 2 690 361 702 331 621 350 80 981
Programme 3 203 700 178 465 172 489 5 976
Programme 4 441 142 472 102 469 730 2 372
Programme 5 10 501 10 501 6 366 4 135
Total 1 732 911 1 747 606 1 642 841 104 765
Responsible Minister Minister of Labour: MMS Mdladlana, MP
Administering Department Department of Labour
Accounting Officer Acting Director-General of Labour: S Morotoba
2005/06
Actual
2006/07
Actual
2007/08
Actual
2008/09
Target
2008/09
Actual
% deviation
from target
R’000 R’000 R’000 R’000 R’000 %
Tax revenue - - - - - -
(Specify)
Non-tax revenue 2 866 4 443 5 733 5 744 8 995 56.59
Sales of capital assets (Capital revenue) 42 - - - - -
(Specify)
Financial transactions (Recovery of loans and
advances)1 451 1 640 2 715 2 588 19 868 667.00
Total departmental receipts 4 359 6 083 8 448 8 332 28 863 246.41
Programme Voted for
2007/08
Roll-overs and
adjustments
Virement Total voted Actual
expenditure
Variance
R’000 R’000 R’000 R’000 R’000 R’000
Programme 1 387 207 - (3 000) 384 207 372 906 11 301
Programme 2 690 361 11 970 - 702 331 621 350 80 981
Programme 3 203 700 13 517 (38 752) 178 465 172 489 5 976
Programme 4 441 142 - 30 960 472 102 469 730 2 372
Programme 5 10 501 - - 10 501 6 366 4 135
Total 1 732 911 25 487 (10 792) 1 747 606 1 642 841 104 765
1 April 2008 - 31 March 20099
Annual Report
Section 2Programme Performance

TTransfer payments Transfers to be listed and reported on include amongst others:● transfers to provinces ● transfers to local governments ● transfers to Public Entities ● transfers to NGO’s and civil society● capital transfers e.g. Transfers to the National Roads Agency
Aim of the VoteThe aim of the Department of Labour is to play a significant role in reducing unemployment, povertyand inequality, through policies and programmes developed in consultation with role players andaimed at: improved economic efficiency and productivity; skills development and employmentcreation; sound labour relations; eliminating inequality and discrimination in the workplace; andalleviating poverty in the workplace; as well as to play a significant role in improving employmentand protecting and improving workers’ rights and benefits.
Name of institution Amount transferred Estimate expenditure
R’000 R’000
Departmental Agencies and Accounts
Compensation Fund 6 366 10 500
Unemployment Insurance Fund - 1
Commission for Conciliation, Mediation and Arbitration 261 710 261 710
National Productivity Institute 41 138 41 138
National Skills Fund 46 949 46 949
Strength Civil Soc Lab Reb Trans (Development Institute for Training, Support
and Education for Labour (DITSELA))15 903 15 903
National Economic Development and Labour Council (NEDLAC) 13 959 13 959
Umsobomvu Youth Fund 5 080 5 080
Statutory
Sector Education and Training Authorities 5 787 308 5 787 308
National Skills Fund 1 446 827 1 446 827
Foreign Goverment/International Organisations
International Labour Organisation (ILO) 9 777 9 777
ARLAC 600 600
Non-Profit Institutions
SA National Council for the Blind 237 249
Deaf Federation of South Africa 105 163
National Council for the Physical Disabled 159 200
Subsidised workshops for the blind 7 365 7 365
Subsidised work centres for people with disabilities 95 411 95 411
Households: Leave Gratuity 1 051 1 051
Retirement Benefit 179 179
Severance Package 2 203 2 203
Donations, Sponsorships 1 206 1 206
7 743 533 7 747 779
1 April 2008 - 31 March 200910
Programme Performance
Annual Report

PProgramme purpose and measurable objectives
Programme 1: Administration
Purpose: Conduct the overall management of the department and provide support and advisory services.
Programme 2: Service Delivery
Purpose: Protect the health and safety of workers and implement and enforce Department of Labour policies.
Measurable objective: Ensure the effective, efficient and integrated implementation of legislation, standards, guidelines and policies through the provision of inspection and enforcement services, employment services, and labour market information and statistical services.
Programme 3: Employment and Skills Development Services/Human Resource Development
Purpose: Achieve the strategic objectives and equity targets of the national skills development strategy and contribute to the achievement of the strategic objectives of the national human resources development strategy.
Measurable objective: Achieve the success indicators of the national skills development strategy targets through managing service level agreements and providing support services to all SETAs and the effective management of the strategy.
Programme 4: Labour Policy and Labour Market Programmes
Purpose: Establish an equitable and sound labour relations environment and promote South Africa’s interests in international labour matters through research, analysing and evaluating labour policy and providing data and statistics on the labour market, including providing support to institutions that promote social dialogue.
Measurable objective: Develop labour legislation and policy to reduce conflict and inequalities and improve working conditions and equity in the labour market, including through fulfilling South Africa’s obligationsto international and regional organisations.
Programme 5: Social Insurance
Purpose: Provide for administrative and other support services to the Unemployment Insurance Fund (UIF) and the Compensation Fund, and manage government’s contribution to the activities of these funds.
Measurable objective: Support and ensure sound administration of the Compensation Fund and manage government financial assistance to the Funds, for efficiency and financial sustainability.
1 April 2008 - 31 March 200911
Annual Report
Programme Performance

1 April 2008 - 31 March 2009
Broad policies, priorit ies and strategic goals
Government pr ior it ies for 2009 to 2014
The national government’s mandate underscores the need to create a democratic, non-racial,non-sexist and prosperous society through the following strategic priorities:
● Strategic Priority 1: Speeding up economic growth and transforming the economy to createdecent work and sustainable livelihoods
● Strategic Priority 2: Strengthen our skills and human resource base● Strategic Priority 3: Improve the health profile of the nation● Strategic Priority 4: Comprehensive rural development strategy linked to land and agrarian
reform and food security● Strategic Priority 5: Intensify the fight against crime and corruption● Strategic Priority 6: Massive programme to build economic and social infrastructure● Strategic Priority 7: Build cohesive, caring and sustainable communities● Strategic Priority 8: Sustainable resource management and use● Strategic Priority 9: Pursuing African advancement and enhanced international co-operation● Strategic Priority 10: Building a Developmental State including improvement of public services
and strengthening democratic institutions.
The following constitutes interventions that will be undertaken by the Department of Labour inorder to address the Government Strategic Priorities as well as numerous, inter-related challengesfaced by the labour market and to institutionalise decent work in South Africa.
Strategic Priority 1: Speeding up economic growth and transforming the economy tocreate decent work and sustainable livelihoods
The Department of Labour will contribute towards this government’s strategic priority through thefollowing strategic objectives:
Strategic Objective: Contribution to employment creation
It is generally understood that while labour market policies do contribute to the promotion of decentwork, they cannot by themselves create jobs. A combination of properly harmonisedmacro-economic, industrial as well as labour market policies is necessary for ensuring that theeconomy generates enough employment opportunities in order to reduce the rate ofunemployment.
The Department will contribute towards employment creation in the following ways:
● By actively striving to ensure that its labour market policies and strategies complement nationalgrowth and development objectives
● New labour market policies in relation to new job creation strategies, such as workercooperatives, will be developed, implemented, monitored and evaluated
● Social dialogue will be strengthened to support growth and development● There will be ongoing monitoring of the achievements and targets of government departments’
Growth and Development Summit (GDS) agreement commitments● Sector skills plans will be aligned to sectoral growth plans● Provincial skills plans will be aligned to provincial economic growth and development strategies● Learnerships, apprenticeships and internships targets as related to critical skills required by the
economy, will be achieved as per the National Skills Development Strategy, (NSDS) 2005-2010● Exit strategies for unemployed people in skills programmes, learnerships, apprenticeships and
other scarce skills interventions will be developed and implemented● Enhance the efficacy and responsiveness of the Employment Services System to improve its
performance and create value for the citizens
Programme Performance
Annual Report
12
Annual Report
1 April 2008 - 31 March 2009
● Rehabilitation and re-integration of workers who sustained injuries.
Strategic Objective: Protecting vulnerable workers
Since discrimination based on gender, race, disabilities, HIV status and other prohibited groundscontinue to pervade the labour market in the fourth cycle of democracy, the Department will seekto eradicate such discrimination by vigorously implementing the Employment Equity Act, 1998.
In order to eliminate unfair discrimination and promote equity in the labour market, the followinginterventions will be undertaken:
● The Department will amend the Employment Equity Act (Act) to strengthen enforcementmechanisms whilst promoting the culture of self-regulation. Areas of concern include amongstothers, powers of inspectors, assessment of compliance, fines to be imposed for contraventionwith the requirements of the Act, etc.
● Review the Code of Good Practice and Technical Assistance Guidelines (TAGs) on Key Aspects ofHIV and AIDS and Employment in order to align it to the newly introduced International LabourOrganisation (ILO)’s Standard
● Amendment of all applicable legislation and associated regulations; to enhance the capacity ofinspectors to enforce compliance
● Restructuring of the Inspectorate to enforce and improve compliance.
Strategic Objective: Protecting vulnerable workers
Several sectoral determinations were promulgated during the second cycle of our democratic rule.These sectoral determinations were necessary in order to protect workers whose unique workcircumstances render them susceptible to the worst forms of abuse. The main challenge in the thirdcycle of the democratic government is to ensure that workers in the sectors governed by sectoraldeterminations benefit from these interventions. The approach will include ensuring that in the firstplace, employers and workers understand their reciprocal rights and obligations. To this end, theDepartment will continue to embark on advocacy campaigns aimed at engendering the culture ofvoluntary compliance. Compliance with legislation will be increased further through targetedadvocacy and inspection programmes.
During the period 2009–2012 the Department will increase its capacity to enforce sectoraldeterminations, especially in the domestic and agricultural sectors.
Pursuant to these objectives, the Department will protect vulnerable workers by undertaking thefollowing interventions:
● Restructuring of the Sheltered Employment Factories (SEF) will be completed. This entailsfinalising a Business Case to define the legal personality of the SEF
● Sectoral determinations will be published in the following sectors :
- Unskilled workers- Building and construction workers where councils have collapsed
● Existing sectoral determinations will be reviewed:
- Farm workers - Domestic workers- Wholesale and Retail Sector- Hospitality - Civil Engineering - Learnerships- Private Security Sector- Forestry Sector
Programme Performance
Annual Report
13

1 April 2008 - 31 March 2009
● The ministerial determination for the Expanded Public Works Programme will be amended.
The following occupational health and safety regulations will be amended and published:
● Hazardous work for children● Construction● Hazardous chemical substances● Globally harmonised system for labeling and packaging of chemical substances● Diving ● Noise induced hearing loss● General health and safety ● Asbestos.
Strategic Objective: Promoting sound labour relations
It is generally agreed that the degree of adversarialism, that characterised the pre-1994 period,drastically declined during the first 10 years of democracy, manifest in part by the decline in thenumber of workdays lost due to strike action. This was largely attributable to the efficacy of ourlabour market policies as well as the maturation of social dialogue – which is also regulated by labourlegislation.
At the dawn of the third cycle of democratic rule, new labour relations challenges are beginning toemerge. The labour relations environment is entering hitherto unchartered territory, wherebyworkers and management need to negotiate complicated issues such as methods of production.Global competition calls for a more enhanced degree of cooperation between labour andmanagement. In other words, in respect of industries that faces fierce international competition,management and labour need to redefine their relationships to enable them to jointly producegoods and services at globally competitive prices. The challenge for the Department of Labour isthat of facilitating the deepening of these relationships - in the first instance through NEDLAC.
Bargaining councils, as centres of social dialogue, have been functioning effectively in the first twocycles of democracy. However, the impact of bargaining councils on small businesses continues tobe raised as one of the constraints on the growth of SMMEs. At the same time, the tendency tocasualise workers and create triangular labour relations undermines both the letter and the spirit oflabour legislation - thus rendering workers vulnerable. South Africa has seen a considerable growthof temporary employment services or labour brokers as they are known. The wages of workers oftemporary employment services, or labour brokers are very low. This is motivated by employers’attitudes of seeking to lower labour cost. Further to these objectives, the Department will continueto promote sound labour relations through:
● Ensuring legislative amendments to protect the employment relationship, address labour brokingand improve the functioning of the labour market
● Ensuring an effective and efficient dispute resolution system through participation in CCMAgovernance, support for its operations and legislative amendments to ensure the smoothfunctioning of dispute resolution
● Ensuring the publication of collective agreements to cover vulnerable workers in themanufacturing, construction, trade, transport and services sectors
● Ensuring that collective agreements embody the pillars of decent work● Enter into partnership with organised labour and the National Labour and Economic Development
Institute (NALEDI) to identify obstacles to union organisation in farm and other vulnerablesectors
● Enhance the capacity of the CCMA and Bargaining Councils to enforce compliance witharbitration awards by parties
● Integration of case management systems of the CCMA, Bargaining Councils and the Department ● Enhance accessibility of the CCMA in remote and rural areas ● Address abusive and exploitative practises associated with labour broking, sub-contracting and
outsourcing of work.
Programme Performance
Annual Report
14

Annual Report
1 April 2008 - 31 March 2009
On conditions of employment, certain provisions are not applicable or are not applied in practice. Insome instances workers are forced to enter into contracts of employment that erodes their rights interms of the law. Some of the labour brokers undermine health and safety rules by subjectingemployees to working conditions that are hazardous.
Strategic Objective: Monitoring the impact of legislation
During the third cycle of our democracy, government departments were structured into clusters inorder to promote collaboration and improve coordination both at a policy as well as implementationlevel. This intervention has improved the overall performance of government.
The Department of Labour will, during the fourth cycle of democratic governance carry outresearch, including monitoring and evaluation aimed at determining the extent to which labourmarket policies are harmonised with other economic policies and contribute to the objective ofcreating work opportunities.
To this end the Department will:
● Publish labour market reviews and statistics reports● Research and reports on the impact of aggregate and disaggregate departmental policies and
programmes on stated goals and objectives● Conduct annual client satisfaction surveys on levels of service delivery and make them public● Establish strategic partnerships and cooperation with established research institutions● Enhance the research capacity within the Department ● Strengthen the monitoring, evaluation and reporting Unit in the Department.
Strategic Priority 2: Strengthen our skills and human resource base
The Department will contribute towards this government’s strategic priority through the followingstrategic objective:
Strategic Objective: Enhancing skills development *
During the 2009/10 fincancial year, the Department will implement the last year of the NationalSkills Development Strategy (NSDS) 2005-2010 to contribute to government’s broader goals tohalve unemployment and poverty and reduce inequality by 2014. The strategy also indicatesaggregate indicators that Sector Education and Training Authorities (SETAs) and projects fundedunder the National Skills Fund (NSF) must achieve.
The NSDS will also contribute to the following:
● Skills to assist the country’s competitiveness and growth as part of the broader Human ResourceDevelopment Strategy
● Scarce skills to support the implementation of the Accelerated and Shared Growth Initiative forSouth Africa (ASGI-SA)
● Improved participation of Small, Medium and Micro Enterprises (SMMEs) in skills development● Improved productivity through work-based skills intervention programmes ● Assisting youth to enter the labour market through learnerships, apprenticeships, internships,
bursaries and other scarce skills programmes● Improved literacy levels through ABET interventions and incentives to improve access to
programmes and quality of learning● Assit workers faced with possible retrenchment through re-training-lay-off interventions.
The Skills Development Amendment Act, 2008 will bring about a number of developments,including:
Annual Report
Programme Performance
15

1 April 2008 - 31 March 2009
Formally establishing the Quality Council for Trades and Occupations (QCTO); establishingProductivity SA; listing the National Skills Fund as a public entity; introducing additional functions tothe Institute for the National Development of Learnerships, Employment Skills and LabourAssessments (INDLELA) to moderate artisan assessments; expanding the provision of employmentservices to work-seekers; and introducing a register of artisans. These developments will: improvethe quality of training, including more effective workplace learning; improve and sustain productivityin both the private and public sectors, which will save jobs and contribute to economic growth;improve the operational efficiency of the National Skills Fund to train more unemployed people, inline with the National Skills Development Strategy (NSDS) targets; provide increased access tolearners for trade assessment; and professionalise and promote the training of artisans in responseto labour market demands.
A new National Skills Development Strategy (2010 - 2015) will be developed and launched duringthe October Skills Conference. This will include a new SETA landscape that will be certified for theperiod April 2010 to March 2015.
Strategic Priority 3: Improve the health profile of the nation
The Department will contribute towards this government strategic priority by:
● Commissioning research into the prevalence of silicosis and muscular skeletal as occupationaldiseases in order to design relevant interventions by 2011
● In 2009/10, inspectors will be trained on the enforcement of hazardous biological agentregulations (HBA)
● Participate in the comprehensive national social security reforms driven by theInter-departmental Task Team at National Treasury.
To ensure conformity with international standards the following will be done:
● Promulgation of the revised occupational exposure limits and biological exposure limits● Refocusing the Compensation Fund to also include a rehabilitation programme to ensure early
return to work of injured workers in collaboration with the SEF● Promoting HIV and AIDS Code of Good Practice in work places.
Strategic Priority 4: Comprehensive rural development strategy linked to land andagrarian reform and food security
The Department will contribute towards this government’s strategic priority through the followingstrategic objectives:
Strategic Objective: Contribution to employment creation
● Sector skills plans will be aligned to sectoral growth plans● Provincial skills plans will be aligned to provincial economic growth and development strategies● Expanded Public Works Programmes’ (EPWP) participants will be trained● Learnerships, apprenticeships and internships targets as related to critical skills required by the
economy, will be achieved as per the National Skills Development Strategy, (NSDS) 2005-2010● Exit strategies for unemployed people in skills programmes, learnerships, apprenticeships and
other scarce skills interventions will be developed and implemented ● The Department will collaborate and work with the Department of Agriculture and Rural
Development on skills programmes and provision of employment services to enhance theimplementation of the Land and Agrarian Reform Programme.
Strategic Objective: Enhancing skills development
● Improved participation of Small, Medium and Micro Enterprises (SMMEs) in skills development
Programme Performance
Annual Report
16

Annual Report
1 April 2008 - 31 March 2009
● Improved productivity through work-based skills intervention programmes ● Assisting youth to enter the labour market through learnerships, apprenticeships, internships,
bursaries and other scarce skills programmes● Improved literacy levels through ABET interventions and incentives to improve the quality of
learning through SAQA accreditation.
Strategic Priority 5: Intensify the fight against crime and corruption
The Department will contribute towards this government’s strategic priority through the followingstrategic objectives:
The Department will develop a crime prevention and anti-corruption strategy within the Departmentand for all Public Entities in compliance with the Public Finance Management Act which requires thateach government department or body design an anti-corruption strategy.
To bolster its fight against crime, fraud and corruption, the Department, the UnemploymentInsurance Fund and the Compensation Fund together with all its Public Entities will increase itscapacity to:
● Investigate allegations● Institute and complete disciplinary action for cases of fraud and corruption● Detect fraud and corruption● Refer allegations of fraud and corruption to relevant law enforcement agencies or other
appropriate agencies/bodies in terms of a formal arrangement.
Furthermore:
● The Department, the Unemployment Insurance Fund and the Compensation Fund together withall its Public Entities will review the Risk Management Strategy, Fraud Prevention Plan and thewhistle-blowing policy to address the current developments and to respond to the latest trendsand needs
● Risk awareness will be conducted throughout the year● As part of the implementation of minimum information security standards the Department has
put processes in place to conduct employment pre-screening and all new appointments will besubjected to those processes. Consideration of establishing the internal vetting unit to addresssecurity vetting is on the cards
● The Department’s Provincial Risk Management committees were established in 2008/09. Thefocus moving forward will be to provide technical advice and ensure effectiveness. Thesecommittees will also play an oversight management role in the provincial offices
● The Unemployment Insurance Fund will also intensify the detection of fraud by implementingelectronic systems to analyse data on a monthly basis
● The Unemployment Insurance Fund Hotline will be entrenched to operate 24 hours daily andawareness will be intensified. The Fund will manage the investigation of all cases received andfinalise 80% of such cases and ensure successful prosecution of cases
● Conduct risk assessment, especially fraud and corruption risks and management action plans willbe put in place to address possible of fraud and corruption.
Strategic Priority 6: Massive programme to build economic and social infrastructure
The Department will contribute towards this government’s strategic priority through the followingstrategic objective:
Strategic Objective: Strengthening social protection
Parliament has passed a series of legislation aimed at providing a social safety net, including theprovision of social support to workers in the event of temporary loss of income due to
Annual Report
Programme Performance
17

1 April 2008 - 31 March 2009
unemployment or work related injuries. In the next five years, the Department will seek tostrengthen these social support systems. The support will include:
● Ensuring an improved client satisfaction of the Unemployment Insurance Fund and CompensationFund’s services
● The restructuring of the Unemployment Insurance Fund and the Compensation Fund for improvedservice delivery
● Achieving financial viability and sustainability of the Unemployment Insurance Fund and theCompensation Fund
● Improvement in revenue collection by at least 10 % during the first year● Legislative amendments to the UI Act to increase coverage to civil servants● Improve the efficiency of the Unemployment Insurance Fund with regards to revenue
management and payment processes● Improve revenue inflows by at least CPIX● Improve benefits payable to beneficiaries● Extend unemployment insurance coverage to workers in the informal sector.
Strategic Priority 7: Build cohesive, caring and sustainable communities
The Department will contribute towards this government’s strategic priority through the followingstrategic objectives:
Strategic Objective: Enhance Skills Development
● The Department will identify and implement income generating projects under the SocialDevelopment Funding window and the NSDS objectives as outlined under Strategic Priority 2.
Strategic Priority 8: Sustainable resource management and use
The Department will contribute by reducing its carbon footprint by implementing the environmentalmanagement plan developed in 2007/08. The Environmental Management Plan outlines the priorityactions required by the Department of Labour in order to integrate environmental managementwithin its functions.
Strategic Priority 9: Pursuing African advancement and enhanced internationalco-operation
The Department will contribute towards this government’s strategic priority through the followingstrategic objectives:
Strategic Objective: Strengthening multilateral and bilateral relations
South Africa occupies a strategic place in the global arena, in both multilateral as well as bilateralfora. Over the next five years the Department will promote a collective multilateral approach toglobal challenges and work for the democratisation of global institutions that operate within itsspheres of influence. To that end, South Africa will continue to participate in the SADC, ARLAC,NEPAD, AU and in the International Labour Organisation (ILO).
We have also signed several bilateral agreements with ministries of labour in countries that SouthAfrica has an interest in. The challenge in the next five years is to ensure that we solidify ourrelationships with strategically placed countries and also extend our influence in the region so as topromote the “globalisation of labour standards”.
The Department will contribute by:
Programme Performance
Annual Report
18

Annual Report
1 April 2008 - 31 March 2009
● Participating in the African Union Labour and Social Affairs Commission (AU LSAC) and willimplement its resolutions
● Ensuring the implementation of the SADC employment and labour sector (SADC-ELS) resolutions● Participating in ARLAC activities aimed at building capacity of labour administrations in English
speaking African countries● Effectively discharging South Africa’s obligations to the ILO● Ensuring that the objectives of signed bilateral agreements are implemented, monitored and
achieved● Mobilising, coordinating and managing technical cooperation● Completing capacity building for ILO associate experts .
Strategic Priority 10: Building a Developmental State including improvement of publicservices and strengthening democratic institutions
The Department will contribute towards this government’s strategic priority through the followingstrategic objectives:
Strategic Objective: Strengthening the capacity of labour market institutions
The Department created appropriate labour market institutions during the first cycle of democraticrule. Most of these institutions have been operational for about 10 years, during which many lessonshave been learned. It is now necessary to carry out an evaluation of these institutions, assess theirstrengths and weaknesses, and effect whatever interventions are required to increase theirefficiency and enhance their effectiveness.
In this regard the Department will:
● Improve service delivery provided by statutory bodies and public entities associated with theDepartment, through clear performance standards for relevant agencies
● The views of the public will be sought to assess the services received from the statutory bodiesand public entities
● The capacity of social partners to deliver on GDS commitments and other areas of cooperationwill also be enhanced by the Department’s support
● The Service Delivery model and the organisational structure to be reviewed and aligned foreffective service delivery
● An enhanced ICT infrastructure and Management Information system .
Priorities: 2009/10 Financial Year
1. Contribute to employment creation
To contribute to the creation of jobs by the end of March 2010, the Department will:
1.1 Fund the training of 90 000 people of whom 63 000 will be placed in employment opportunities.
1.2 Support 400 co-operatives/ NGOs through skills development, to place at least 2 000 people in co-ops.
1.3 Support the training of people that face retrenchment to protect at least 16 000 jobs through training-lay-offs interventions.
1.4 Support job creation Strategic Projects to train 18 000 people of whom 9 000 complete programmes and are placed in job opportunities.
1.5 Train and mentor 4 534 young people to form sustainable new ventures of which, 70% to be sustained beyond 12 months after training.
1.6 Implement Social Plan and turnaround strategies for enhanced productivity/
Annual Report
Programme Performance
19

PProgramme Performance
1 April 2008 - 31 March 2009
competitiveness of enterprises to save 15 000 jobs.1.7 Develop a draft Employment Services Bill.
2. Inspection and Enforcement Services (IES)
2.1 Ensure IES marketing and information sessions to domestic and farm workers, and wide consultation with labour unions to encourage the creation of structures for the unionisation of these workers, targeting three information sessions per province.
2.2 Implementation of the IES Strategy with its three pillars:
Pillar One: Professionalisation of the InspectoratePillar Two: Customer Centric ServicesPillar Three: Improved Compliance.
To contribute to a successful 2010 World Cup event, the Department will:
2.3 Conduct focused advocacy and inspections and enforcement in the Hospitality, Tourism and Security sectors.
2.4 Each Provincial Office to identify companies and conduct inspections in these sectors for focused inspections as follows:
● Hospitality 30● Tourism 30● Security 20
3. Decent Work
This will serve as a contribution towards the Decent Work Agenda:
3.1 Facilitate Public Hearings within communities on Labour Brokers and atypical forms of employment, complimented by a formal research programme.
4. Strengthen the institutional capacity of the Department:
4.1 Finalise quick wins of the “Functional Shift”:
● Establish the Chief Operations Office at Head Office● Relocate the Office of the Chief Inspector together with the Inspection and Enforcement Service
(IES) component from Service Delivery to Labour Policy and Labour Market Programmes(LP&LMP)
● Establish a gender and special projects section at Head Office● Reprioritise the budget and posts within Corporate Services● Resuscitate the management development programme.
4.2. Develop transitional plan to review remaining PPP period and post PPP IT enabling strategy:
● Identify and document all outstanding items as agreed in the PPP and agree on an implementation plan to finalise these within the contract period
● Resolve all outstanding contractual and administrative matters if any exist● Review the PPP to determine the strengths, weaknesses, shortcomings and challenges during the
contract period
Annual Report
20

Annual Report
PProgramme Performance
1 April 2008 - 31 March 2009
● Identify future options and research these options to determine the best one for the Department(in-house IT management or another PPP)
● Develop an operational framework for the preferred option● Develop and implement a “phase-out phase-in” programme (Transitional plan).
5. Contribution to Anti-Poverty Strategy
The Department will continue to play a critical role as a member of the National Task Team and alldepartmental provincial offices participated at the launch of the Campaign.
The Department will continue to contribute towards poverty eradication and making a dent onunemployment by 2014 through its various programmes. The Department’s programmes areintended to assist people to move out of poverty, they have social partners support and enjoysolidarity amongst those that are fortunate and less fortunate. These programmes are driventhrough legislation that is in line with international conventions and include the following:
● Minimum Sectoral Wage Determinations regulated under the Basic Conditions of EmploymentAct. The intervention is aimed at protecting vulnerable workers without trade unions to ensurethat they are paid a determined wage set after national consultation for sectors such asDomestic Workers, and Farm Workers, etc.
● Unemployment Insurance Fund regulated under the Unemployment Insurance Act. The Fundprovides a temporary relief income to those who go on maternity leave and those who looseemployment through dismissals and retrenchments up to a period of eight months, depending ontheir contribution credits. These workers are assisted to secure new employment
● Compensation Fund regulated under the Compensation of Occupational Injuries andDiseases Act (COIDA). The Fund provides a temporary relief income or long-term pension tothose injured on duty or those who contracted occupational diseases. The Fund also pays forrelated medical cost and re-habilitation cost aimed at assisting injured people to re-enteremployment
● Learnerships, apprenticeships and internships programmes regulated under the SkillsDevelopment and Skills Development Levies Acts. These programmes are aimed at assistingyoung people to enter employment by providing them with the necessary work experience whilstproviding them with a determined living allowance to meet their subsistence needs such as food,transport, etc.
● National Skills Fund Social Development Funding Window and Strategic Projects that isalso regulated under the Skills Development and Skills Development Levies Acts. The interventionis aimed at providing the unemployed with skills through ±860 skills programmes that are2 weeks to 6 months long. Learners are provided with a ±R35 daily allowance whist participatingin these programmes to meet their subsistence needs
● Sheltered Employment Factories provide employment and a living allowance mainly to peoplewith disabilities who would ordinarily find it difficult to access employment in the labour market.
Annual Report
21

PPublic EntitiesThe following public entities listed in Schedule 3 of the Public Finance Management Act, No. 1 of1999 reported to the Minister of Labour, and separate Annual Reports and Financial Statements arepublished independently:
● Commission for Conciliation, Mediation and Arbitration (CCMA)● Compensation Fund (CF) ● National Economic Development and Labour Council (NEDLAC) ● Productivity South Africa (PSA)● Sectoral Education and Training Authorities (SETAs) ● Unemployment Insurance Fund (UIF) ● Umsobomvu Youth Fund (UYF)
Commission for Conci liation, Mediation and Arbitration (CCMA)
This Commission was established in terms of section 112 of the Labour Relations Act, 1995 (LRA).
The Commission’s functions are to:
● Attempt to resolve disputes through conciliation and arbitration ● Assist in the establishment of workplace forums ● Compile and publish information and statistics about its activities ● Advise a party on the procedure to follow in respect of a dispute in terms of this Act ● Assist a party to obtain legal advice, assistance or representation in respect of a dispute ● Offer to resolve a dispute that has not been referred to the Commission through conciliation ● Conduct, oversee or scrutinise any election or ballot of a registered trade union or registered
employers’ organisation if requested to do so● Publish guidelines in relation to any matter dealt with in this Act ● Conduct and publish research into matters relevant to its functions ● Provide, upon request, workers, employers, registered trade unions, registered employers’
organisations or councils with advice on training relating to the primary objects of the LRA ● Perform any other duties imposed, and exercise any other powers conferred on it by or in terms
of the LRA and perform any other function entrusted to it by any other law.
Compensation Fund
The Compensation Fund was established in terms of the Compensation for Occupational Injuries andDiseases Act, 1993 (COIDA). The functions of the Fund are to provide compensation resulting from:
● Occupational injuries ● Diseases ● Death of workers in the course of their employment.
National Economic, Development and Labour Counci l (NEDLAC)
This Council was established under section 2 of the National Economic Development and LabourCouncil Act, 1994 (NEDLAC Act). The functions of the Council are to:
● Strive to promote the goals of economic growth, participation in economic decision-making andsocial equity
● Seek to reach consensus and conclude agreements on matters pertaining to social and economic
1 April 2008 - 31 March 200922
Programme Performance
Annual Report

policy● Consider all proposed labour legislation relating to labour market policy before it is introduced in
Parliament● Consider all significant changes to social and economic policy before it is implemented or
introduced in Parliament● Encourage and promote the formulation of coordinated policy on social and economic matters.
Furthermore, and to achieve the above, the Council:
● May investigate as it may consider necessary and shall continually survey and analyse social andeconomic affairs
● Shall keep abreast of international developments in social and economic policy● Shall continually evaluate the effectiveness of legislation and policy affecting social and
economic policy● May conduct research into social and economic policy● Shall work in close cooperation with government departments, statutory bodies, programmes
and other forums and non-governmental agencies engaged in the formulation and theimplementation of social and economic policy.
PProductivity South Africa
This is a section 21 Company (Incorporated association without gain), established under theCompanies Act, 1973, with the following functions:
● To promote a culture of productivity in workplaces ● To develop relevant productivity competencies ● To facilitate and evaluate productivity improvement and competitiveness in workplaces ● To measure and evaluate productivity in the workplace ● To maintain a data-base of productivity and competitiveness systems and publicising these
systems ● To undertake productivity-related research ● To support initiatives aimed at preventing job losses.
Sectoral Education and Training Authorit ies (SETAs)
A total of 23 Sectoral Education and Training Authorities (SETAs) were established for a period of60 months in terms of section 9 of the Skills Development Act, 1998 and may apply to bere-certified for another period of 60 months or for a period as will be determined by the Minister.
The SETAs are as follows:
● Banking Sector Education and Training Authority● Chemical Industries Education and Training Authority● Clothing, Textiles, Footwear and Leather Sector Education and Training Authority● Construction Education and Training Authority● Safety and Security Sector Education and Training● Education, Training and Development Practices Sector Education and Training Authority● Energy Sector Education and Training Authority● Financial and Accounting Services Training Authority● Food and Beverages Manufacturing Industry Sector Education and Training Authority● Forest Industries Sector Education and Training Authority● Health and Welfare Sector Education and Training Authority● Information Systems, Electronics and Telecommunications Technologies Training Authority
1 April 2008 - 31 March 200923
Programme Performance
Annual Report

PProgramme Performance
1 April 2008 - 31 March 2009
● Insurance Sector Education and Training Authority● Local Government, Water and Related Services Sector Education and Training Authority● Manufacturing, Engineering and Related Services Sector Education and Training Authority● Media, Advertising, Publishing, Printing and Packaging Training Authority● Mining Sector Education and Training Authority● Agriculture Sector Education and Training Authority● Public Sector Education and Training Authority● Services Sector Education and Training Authority● Tourism and Hospitality Education and Training Authority● Transport Education and Training Authority● Wholesale and Retail Sector Education and Training Authority.
The functions of the SETAs are regulated in terms of the Skills Development Act, 1998, SkillsDevelopment Levies Act, 1999, Public Finance Management, 1999, and include the following:
● Develop sector skills plans within the framework of the National Skills Development Strategy ● Implement sector skills plans through establishing learnerships ● Approve workplace skills plans ● Allocate grants in the prescribed manner to employers, workers, and education and training
providers ● Monitor education and training in the sector ● Promote learnerships by identifying workplaces for practical work experience and registering
learnerships ● Any other functions as required in terms of their approved constitution.
Unemployment Insurance Fund (UIF)
The Fund was established under section 4 of the Unemployment Insurance Act (Act No. 63 of2001), administered by the Director-General of Labour, to provide for the payment from the Fundof unemployment benefits to certain employees, and for the payment of illness, maternity, adoptionand dependants’ benefits related to the unemployment of such employees.
The Unemployment Insurance Fund collects and receives revenue contributions under theUnemployment Insurance Contributions Act, 2002, administered by the Commissioner of the SouthAfrican Revenue Service.
The Unemployment Insurance Fund strives to contribute to the alleviation of poverty in South Africaby providing effective short-term unemployment insurance to all workers who qualify forunemployment and related benefits.
The central purpose and role of the Unemployment Insurance Fund is defined as:
● Rendering an effective and accessible service to all stakeholders ● Being a sustainable organisation with sufficient reserves ● Administering the Fund professionally.
Umsobomvu Youth Fund (UYF)
The Umsobomvu Youth Fund (UYF) was established in 2001 and mandated to facilitate and promotethe creation of jobs and skills development and transfer among young South Africans between theage of 18 and 35. The UYF fulfils its mandate by making strategic investments that facilitateopportunities for young people to acquire skills, to access job opportunities or pursue meaningfulself-employment opportunities through various initiatives. The Fund received R855 million in 2001and a further allocation of R400 million in 2007/08. The UYF was part of a review on development
Annual Report
24

1 April 2008 - 31 March 2009
financing institutions and will be undergoing a mandate alignment based on the findings.The organisation’s priorities are informed by the Accelerated and Shared Growth Initiative for SouthAfrica (ASGISA), the National Skills Development Strategy (NSDS) and the anticipated nationalyouth policy. The UYF has contributed to achieving these national policy objectives by:
● Improving access to employment opportunities through the provision of career developmentinformation and counselling, job preparation and development, and linking young people toemployment opportunities facilitated through a range of delivery channels that include YouthAdvisory Centres (YAC) (including mobile centres), the South African youth card and magazine,Youth Connect (a UYF operated call centre), and the internet portal.
Since its inception, over 1.1 million young people have accessed UYF services through the YACprogramme. A total number of 121 YACs established to date, including two UYF- full serviceoperated YACs (in Tshwane and Nelspruit).
UYF’s youth portal has recorded over 10 million hits since inception. The UYF call centre (YouthConnect) recorded 27 000 calls in 2007/08, bringing the total number of calls since inception to233 948. The South African youth card increased its membership by 58 425 during 2007/08,bringing the total number of members to 131 937 since the start of the programme
● Expanding support for entrepreneurial activity and self-employment through the delivery ofentrepreneurship information and training, business development consultancy and advisoryservices, access to market opportunities/employment and enterprise finance.
A total number of 5 480 Business Development vouchers were issued in 2007/08 to the value ofR36 million, resulting in the creation of 2 256 new businesses and 5 795 jobs. A total number of119 voucher clients accessed loans to the value of R57.1 million and 23 clients accessed tendersworth over R15 million. Since the inception of the voucher programme, over 29 000 vouchers havebeen issued to youth and women, who have in turn accessed loans exceeding R200 million andtenders worth over R100 million.
Since the inception of the business opportunity support services (BOSS) programme, over 1 500entrepreneurs have been linked to business opportunities worth over R250 million. The jobopportunity seeker (JOBS) programme, aimed at linking unemployed graduates to jobs, hasregistered over 8 000 CVs, sourced 2 949 employment opportunities and dispatched 2 819 CVs toemployers in 2007/08, and 531 young people registered on the JOBS database have also accessedskills training and job preparedness workshops.
The SME programme has exceeded its target for 2007/08, approving loans in excess of R98 million.The micro-finance programme has issued over 8 000 loans valued at over R19 million, resulting inthe creation and or sustainability of over 7 000 jobs
● Facilitating, targeted skills development programmes focusing on graduate development andproviding young people with access to training in scarce skills required by the priority sectorsidentified in ASGI-SA.
Since 2006/07, 1 450 unemployed graduates have benefited from the graduate developmenttraining interventions and 3 930 young people are being trained through the school-to-work trainingprogramme. These projects are implemented through FET colleges and NGOs. With regards to theentrepreneur development training interventions, 180 teachers and 14 771 learners (in-school)were trained
● Engaging young people in community service and voluntarism is aimed at communitydevelopment through support for the implementation of national youth service and volunteerprogrammes.
The national youth service unit has engaged with 19 government departments that have committedto projects that will benefit more than 15 000 young people. To date, 11 484 youth have beenregistered on national youth service (NYS) projects. The NYS volunteer programme has reachedover 20 000 volunteers, most of whom were participants in the Global Youth Service Day campaign.
Annual Report
Programme Performance
25

CCommunication
The Chief Directorate of Communication continues to ensure that information about programmes,initiatives and services of the Department is disseminated to the relevant stakeholders and targetaudiences. Various communication channels specifically identified and suitable for differentaudiences have been utilised in this regard as a way of attaining government’s objective ofinteracting with constituencies. The disseminated information emanated from the variouscomponents of the Chief Directorate, which include:
● Stakeholder Re lat ions
This section has through exhibitions showcased the services of the Department at the SmallBusiness Week in the Northern Cape, Pretoria Show in Pretoria, Public Service Week in the NorthernCape, National Skills Conference at Gallagher Estate, Midrand, HRD in Africa in Johannesburg, RandShow in Johannesburg, Izimbizo in Northern Cape, Limpopo and KwaZulu-Natal.
● Market ing and Advert is ing
During the financial year under review, 20 Marketing and Advertising Campaigns were implemented.These include: Workers Rights are Human Rights, Employment Equity Reporting Campaign, QCTORoad-show Awareness Campaign, Domestic Workers Sectoral Determination and Wage IncreaseAwareness Campaign, OHS Campaign, Learnerships Adverts for Matriculants, Public Invite to PrivateSecurity Public Hearings and Strategic Projects Programme.
● Media L iaison
This section is tasked to profile the Department in both the print and electronic media through thewriting of features, media statements, organising media conferences on crucial labour relatedmatters, as well as arranging interviews for the Executive Authority and Senior Managers of theDepartment, where the policies, programmes and departmental services are explained to membersof the public. Some of the statements generated by this component of the Chief Directorateinclude:
● Statements on Safety and Health Day held in Port Elizabeth in May 2008● Articles on the Employment Equity Road-shows ● Six features have been published in the Sunday Times, Sowetan and City Press● Other features were published in Staff Communiqué, the Department’s internal newsletter, as
well as articles on the SADC Employment and Labour Sector.
Human Resource Management
Introduction
The mission of the Department’s Human Resource Management is to facilitate the development ofstaff, ensure effective and efficient utilisation of human capital and to render legal services to theDepartment of Labour. Three functional areas are covered in the programme, namely, ManagementAdvisory Services, Human Resource Management and Legal Services. The purpose is to providemanagement with advisory services on strategic management, restructuring, performancemanagement, organisational development and skills development, and at the same time ensureefficient human resource services that promote representativity in line with the Employment EquityAct. The purpose is also to provide a legal advisory service to management and stakeholders inorder to protect and further the interests of the Department in line with its strategies.
The Department’s Human Resource (HR) Plan for 2006-2009 is in place.
In its quest to further empower Senior Management Service (SMS) members with the necessaryknowledge and skills, the Department embarked on a drive to implement the Khaedu training andensured that all SMS members are granted an opportunity to participate in Khaedu programmes in
1 April 2008 - 31 March 200926
Annual Report
Programme PerformanceProgramme 1: Administration

line with the SMS Handbook.
The management of employee performance in the Department for SMS and employees at SalaryRange level 12 and lower has significantly improved as most SMS members have complied with theobligation to complete and submit performance agreements and reviews. Employees at Salary Rangelevel 12 and lower have also participated and complied with the requirements of the PerformanceManagement policy.
The Department is promoting Voluntary Counselling & Testing (VCT) to the employees. VCT wasstarted at the Head Office and will be rolled out to other provinces as well. The counselling referredto was either telephonic, a referral to a health professional or was provided in–house by EmployeeHealth and Wellness (EHWP) Practitioners.
The Department is promoting the Health and Wellness of employees. The four key Pillars that informthe Health and Wellness programme are HIV and AIDS and TB Management, Disease Management,Health and Productivity Management and Safety, Health, Environment, Risk and Quality Management(SHERQ). The Department is currently implementing the following pillars: HIV and AIDS and TBManagement, Disease Management, Health and Productivity Management.
Candlelight Memorial, Wellness Day, VCT and World Aids Day were commemorated in December2008.
The Department also continues to ensure that gender, disability and youth issues are mainstreamedinto its strategic plan and policies.
Employment Equity continues to be implemented as one of the Department’s key strategic areas.As a result, progress with regards to the implementation of the Departmental Employment EquityPlan is continuously reported to Top Management. Progress with regards to the implementation ofthe Employment Equity Plan 2006 to 2009 is monitored on a monthly basis by Local EmploymentEquity Forums (LEECFs) and on a quarterly basis by the National Employment Equity ConsultativeForum (NEECF). Comparative EE representativity profiles are updated on a monthly basis to monitorthe achievement of the numerical goals.
OOffice of the Chief F inancial Officer (CFO)
The Office of the CFO consists of three Directorates, namely Financial Management, Financial Liaisonof Public Entities, Office Administration and Supply Chain Management.
Directorate of Financial Management
The Directorate of Financial Management strives to ensure sound financial management andestablish accountability for public funds allocated to the Department by Parliament.
The Directorate of Financial Management coordinates the compilation of the budget, monitors andcontrols expenditure and administers salaries in compliance with the Public Finance Management Act(PFMA). In addition, training is provided to develop managers and staff directly involved in financialmanagement.
Financial management is based on a system of monitoring actual expenditure against the fundsallocated in terms of the Main Divisions of the Vote and the remuneration of staff members. This isperformed with the aid of computerised transversal systems, the Basic Accounting System (BAS)and the Integrated Personnel and Salaries System (PERSAL), respectively.
Financial Management provided information and support in the finalisation and conclusion of auditqueries issued to the Department of Labour, the Sheltered Employment Factories and the NationalSkills Fund for the 2008/09 financial year. In collaboration with the Office of the Director-General,regular Audit Query Forums were held in order to monitor and report on all corrective actions takento address matters raised by the Office of the Auditor-General. The forum focused on audit reportsthroughout the Department, including the National Skills Fund, Sheltered Employment Factories,
1 April 2008 - 31 March 200927
Annual Report
Programme PerformanceProgramme 1: Administration

INDLELA, the Compensation Fund and the Unemployment Insurance Fund. In addition to this, AuditSteering Committee meetings were also conducted on a regular basis, where the Chief FinancialOfficer of the Department is also present.
The Annual Financial Statements were prepared in accordance with the prescripts provided by theOffice of the Accountant-General and the financial code structures on the Basic Accounting System(BAS), for both the Department and the National Skills Fund. A help-desk facility was provided to allBAS users within the Department as well as the National Skills Fund.
Support was provided to all spending units within the Department, through the Budget AdvisoryCommittee in ensuring the management and control of financial resources.
Financial Management also provided support to all of the Main Divisions of the Vote regarding theprocessing of subsistence and travel advances and claims, the payment of salaries and servicebenefits, salary deduction reconciliations and payment processes, BAS/PERSAL reconciliations andthe management of departmental debt in line with the Department’s debt management policy. TheDepartment managed to submit its 2008/09 income tax reconciliation to the South AfricanRevenue Service (SARS) before the determined deadline.
DDirectorate of Financial Lia ison – Publ ic Entities
The Public Finance Management Act, 1999, Treasury Regulations and corporate governanceoversight responsibilities concerning 31 Public Entities reporting to the Minister of Labour, restswithin this Directorate. This accountability was amplified with the provision of services to theseentities, in the form of assistance and support on related matters in pursuit of the Public Entities’individual performance outputs.
During the year under review, the focus of the Directorate was, amongst others, the:
● Implementation of enhancements to the Annual Financial Statements’ template in order toconform to the revised National Treasury’s reporting requirements
● Facilitation and assistance with the submission and consolidation of the quarterly financialreports and the analysis thereof
● Identification in performance gaps, including the production and generation of consolidatedmanagement reports for early warning purposes
● Analysis and capturing of budget information of all Sector Education and Training Authorities(SETAs) onto a database
● Analysis of project and discretionary reserve budgetary planning, and assisting SETAs withDiscretionary Reserve planning
● Establishment of the final approved changes to the accounting standards applicable to thecurrent financial year, and disseminated relevant information to Public Entities
● Following up on critical Public Entities and the provision of feedback, guidance and support ● Continuation with capacity building, training and skills transfer to Public Entity personnel ● Analysis of Annual Financial Statements to ascertain Public Entities’ financial positions,
production of reports reflecting the findings and overall financial performance evaluation,including recommendations on the suggested individual Public Entities
● Commencement with the building of profiles on individual Public Entities.
The Directorate has also continued in providing financial advisory services to Programme 4: LabourPolicy and Labour Market Programmes on the assessment of employers’ abilities to pay minimumwages, concerning individual applications for exemption from Sectoral Determinations. The numberof affected workers boarders on 1 441.
The Directorate also managed the transfer of voted funds from the Department to selected PublicEntities in accordance with drawdown agreements subject to pre-set deliverables to ensure soundfinancial management in order to maximise delivery though the efficient and effective use of thefunds so transferred. (Umsobomvu Youth Fund, Commission for Conciliation, Mediation and
1 April 2008 - 31 March 200928
Annual Report
Programme PerformanceProgramme 1: Administration

Arbitration, Productivity SA and National Economic Development and Labour Council (NEDLAC).
DDirectorate of Off ice Administrat ion and Supply Chain Management
The Directorate of Office Administration and Supply Chain Management supports the line functioncomponents through the management and control of procurement processes.
Supply Chain Management (SCM) and Commodity Policies have been circulated to users and madeavailable on the Department’s Intranet for easy reference. The necessary support was provided toall chief users throughout the Department regarding the facilitation and processing of procurementand logistical matters such as advertising and finalising of bids, processing of orders, transit,accounting (posting function) and warehouse management.
Supply Chain Management also provided procurement support to the Compensation Fund andSheltered Employment Factories and also assisted the National Skills Fund (NSF) to align theirprocurement procedures to supply chain management best practices by drafting workflow processesand conducting workshops where the NSF procurement procedure manual was drafted.
Supply Chain Management also provided ongoing support to numerous units with regard to theutilisation of iQual and Logis as and when the need arose when chief users are either new or absent.Guidelines on various procedures with regard to procurement, contract management, warehouseissues and irregular expenditure were issued in various circulars during this financial year for ease ofreference to all users.
Transport services relating to official as well as subsidised and ministerial transport requirements aremanaged and controlled. The Department is now fully utilising the services of the PPP FleetContract with PhakisaWorld Fleet Solutions. Systems have been put in place to ensure the effectiveand efficient management of the contract. Monthly meetings are held with provincialrepresentatives to ensure the effective management of the contract.
Office accommodation is sourced and managed and Repair and Maintenance Programmes (RAMPs)on State owned buildings are facilitated through the Department of Public Works. RAMPs for ninecontracts have been completed and four more will be completed in the new financial year and bidprocesses for a RAMP in respect of Head Office was completed. Planning for follow-on RAMPcontracts for the 12 Sheltered Employment Factories have been completed.
Funds devolved from the budget of the Department of Public Works for accommodation andmunicipal charges, have been fully utilised.
Record and archive functions were performed and messenger and cleaning services wereadministered. Support was provided to the Department’s Ministry and Parliamentary Office inreviewing and finalising records through the development of a new file plan and recordsmanagement process.
Document security was improved through the installation of mobile shelving in all archival storagefacilities.
Approval was secured for the designation of the departmental records manager and briefingsessions were held with the National Archive and Records Management of South Africa.
A Subdirectorate of Asset Management has been established at the Department’s Head Office.National asset verification has been conducted for 2008/09. Major asset registers are in place forall provincial offices, INDLELA and Head Office. Asset Inventory Controllers are appointed at HeadOffice, provincial offices and INDLELA.
Asset registers in respect of the Department’s Information Technology Public Private Partnership(ITPPP), including the attachment of financial values, were made available.
1 April 2008 - 31 March 200929
Annual Report
Programme PerformanceProgramme 1: Administration

IInformation Technology
Introduction
The Department of Labour is committed to using technologies to improve service delivery. Thisintent is fully reflected in the Department’s policies and strategies which reflects the recognition ofthe contribution that technology can make to the Department’s internal operations as well as to itsservices to organised business, organised labour and the public. It is envisaged that the applicationof technologies will have a major impact on the way the Department conducts its business.
The Department entered into a Public Private Partnership (PPP) Contract with Siemens IT Solutionsand Services (SIS) on 1 December 2002. The PPP supports an integrated approach to servicedelivery, enhances the utilisation of information as a strategic resource, integrates theDepartment‘s IT systems more effectively and ensures that the relevant information is digitalised.This forms the basis of the Department’s e-government initiatives.
The key purpose of the IT PPP arrangement is to cater for the full spectrum of IT needs andrequirements of the Department. Through the partnership, SIS assumes full responsibility and therisk associated with the design, build, operation and maintenance of the Department’s IT systems.The Department on the other hand is responsible for identifying the business requirements and fordocumenting and mapping the business processes that need to be IT enabled. SIS also providesstrategic direction on new information technologies in relation to labour market trends and systemsworldwide.
The contractual framework of the PPP provides for the establishment of governance structuresnecessary for allocating risks appropriately, establishing clearly defined quality of service and valuefor money mechanisms. The PPP agreement also allows for change management procedures whichcater for the incorporation of a changing business environment. The emphasis is on partnership andthese governance structures, which are fully operational, forms the foundation for open debate anda trusting relationship.
Achievements
The following achievements are noted in terms of the respective business areas:
Governance
● The governance structures established to manage and capitalise on the benefits of the PPParrangement continued to function optimally. The PPP Contract sets out the key roles andresponsibilities of the Department and SIS necessary to manage the agreement between the twoparties. The Contract provides for four committees, each with specific terms of reference, anduser groups, catering for users with common needs. The Executive Committee, the highestdecision making body, brings together the top echelons of both parties, facilitating the processin terms of which senior management is in a position to articulate the goals and the objectives ofthe partnership and to communicate how the partnership will benefit the respectiveorganisations. The other committees are the Steering Committee, the Service ManagementCommittee and the Change Management Committee. These committees met and discharged oftheir responsibilities during the reporting period in accordance with the PPP Agreement
● A set of policies were developed to cover the key areas within the IT environment, namelyinformation systems security, network and user security, acceptable use, email and Internet anddisk space allocation. The policies were communicated and enforced during the reporting period
● A risk assessment and risk exposure analysis were completed for the IT environment to enablethe mitigation of risk more efficiently
1 April 2008 - 31 March 200930
Programme PerformanceProgramme 1: Administration
Annual Report
● An IT disaster recovery plan has been developed and approved. The implementation phase will bescheduled during this financial year.
BBusiness appl icat ions
● The development of systems and automation of processes for the Compensation Fund isdependant on the Fund streamlining and optimising its processes. In November 2008, thebusiness process mapping, optimisation and benchmarking was completed and handed over tothe IT partner for automation. Additional functionality and enhancements to current legacysystems received attention throughout the reporting period
● Various enhancements and additions have been made to the Employment Equity System (EE) insupport of changing business requirements during the 2008 reporting period. A project has beeninitiated to stabilise the system and to ensure data integrity in terms of the ManagementInformation System (MIS) reporting facility. More than 11 000 reports have been submittedsuccessfully during the 2008 period of which more than 4 000 reports were submitted throughthe online facility. An estimated 7 200 companies are currently on the Public Register
● The Employment Services System (ESSA) has been rolled out to all labour centres and provincesin collaboration with the support of key business managers. Various enhancements andmaintenance activities have been done to the system to ensure stability and data integrity,especially when it comes to MIS reporting. Refresher training was conducted during the monthsof October and November 2008. Change management and staff capacity has been identified asthe key success enablers for optimising the usage of the ESSA system country wide
● The Financial Management System Implementation for the Unemployment Insurance Fund (UIF),National Skills Fund (NSF) and Compensation Fund (CF) has been initiated during the reportingperiod. Blueprint phases are in progress to verify business processes and to recommend theto-be processes moving forward
● The development of an Integrated Client Database (ICD) has been registered as a priority projectwithin the Office of the Director-General. The Deputy Director-General of Corporate Services hasbeen appointed as the project sponsor while the Chief Information Officer (CIO) has beenappointed as the project leader. Renewed focus has been placed on the importance of the ICDand what benefits it brings for a services organisation such as the Department of Labour
● An inspection and enforcement case management system is currently being developed. Thesystem will facilitate proactive compliance interventions in line with the Department’s strategicobjectives to protect vulnerable workers and to ensure a safe working environment.
Operat ions
● Service delivery was enabled at remote sites by providing an IT service to the 20 mobile labourcentres
● The bandwidth of the data lines of several departmental offices was upgraded to improve theresponse times of the IT business applications
● Ninety six environmental racks have been installed at departmental offices throughout thecountry. These racks ensure the security of the infrastructure and provide the necessaryenvironmental facilities required in terms of air-conditioning and power supply. A maintenanceand support service level agreement is currently being finalised with SITA for environmental racks
● The Department’s Website was upgraded using FOSS (Free and Open Source Software) andadditional features were developed to enhance the content management features as well as toimprove the stability of the website. The new website that has been in operation since late 2008
1 April 2008 - 31 March 200931
Annual Report
Programme PerformanceProgramme 1: Administration

1 April 2008 - 31 March 2009
has been singled out in the UN E-Government Survey 2008 as an excellent example of a publicagency website that is well tailored to the needs of its stakeholders.
Challenges
The following are the challenges for the 2009/10 financial year:
● To continue developing IT solutions in such a manner that it will ensure that the clients of theDepartment are able to access the services of the Department at any time, from any locationand through multiple service delivery channels
● To train and recruit staff for fulfilling strategic leadership and contract management rolesnecessary to manage the PPP Agreement and to ensure alignment between the Department’s ITsystems and business processes
● To continue to emphasise the importance of business processes to be properly mapped, and ifnecessary re-engineered, prior to IT-enabling these processes
● To institute sound change management processes necessary to prepare users to appreciate thebenefits arising from ICT as a business enabler
● To work closely with SITA and third party telecommunication suppliers to secure an improvedWide Area Network Service.
Internal Audit
Introduction
The role of Internal Audit is to provide management and the Audit Committee with independent,objective assurance and consulting services designed to add value and improve the Department’soperations, and help it to accomplish its objectives by bringing a systematic, disciplined approach toevaluate and improve the effectiveness of governance, risk management and control processes.
Achievements
● A total of 57 audits were scheduled for the Department including the National Skills Fund andthe Sheltered Employment Factories. A total of 42 final reports were issued. Fifteen audits couldnot be performed due to the lack of resources. During 2007/08 51 audits were completed
● The Audit Committee of the Department held seven meetings, assisted by Internal Audit,providing secretarial services
● Internal Audit provided consulting services, specifically to the Audit Committee, IT Audit Forum,strategic meetings, etc.
● A comprehensive list of strategic and operational risks facing the Department, the National SkillsFund and the Sheltered Employment Factories were maintained to form the basis for the annualrisk assessments to be performed by management.
Challenges
● Lack of resources, to cover all risk areas within the Department, the National Skills Fund and theSheltered Employment Factories. Currently there are eight Internal Auditor and Senior InternalAuditor posts vacant. During 2007/08, seven posts were vacant
● There is a lack of specialised skills in the areas of IT auditing and Performance auditing. TheDepartment decided to make use of consultants to provide co-sourcing specialised skills, and inthe interim to appoint contract workers to assist with the normal effectiveness/complianceaudits during the 2009/10 financial year.
Programme PerformanceProgramme 1: Administration
Annual Report
32

1 April 2008 - 31 March 2009
Security Services
Physical secur ity measures
1) Electronic Security Systems and Security Appraisal Implementation
● The electronic security system was implemented at the Labour Centre: Durban, which wascompleted in March 2009. This was as a result of the striking workers that invaded the LabourCentre and damaged assets and injured staff, also due to theft of computers and laptops. Thecost of the project amounted to +-R1.7 million
● Bids have been invited for the electronic security system to be implemented at theCompensation Fund. The present system is old and costly in maintenance. A number of securitybreaches that occurred could not be indentified on the present system. The estimated cost ofthe project will be in the amount of +-R6 million. Approval of the bid is awaited from the BIDcommittee at the Compensation Fund
● Security appraisals and assessments were implemented at the Northern Cape Provincial Office,Labour Centre: Springs, Limpopo Provincial Office, Gauteng North Provincial Office, MpumalangaProvincial Office, Gauteng South Provincial Office and INDLELA.
2) Contract Security
● The Mpumalanga Province, Northern Cape Province, Limpopo Province and Eastern Cape Provincewere assisted with the procedures of private security tenders. Assistance was also given inempowering these offices with the evaluation and awarding of private security tenders. Most ofthe labour centres in those provinces therefore have security to protect State property, assets,information and equipment.
3) Izimbizo
● The National Skills Conference was held at Gallagher Estate in Midrand, during October 2008.The Directorate of Security Services coordinated all security arrangements for the Departmentand the Minister
● The Department hosted the World Day for Safety and Health at Work event in May 2008 in PortElizabeth, Eastern Cape Province. The Directorate of Security Services co-ordinated the securityarrangements and access control with the various security and emergency services for theMinister, VIP’s, Mayor and the public. There were about 5 000 people that attended the eventwhich was a success
● Security arrangements were also coordinated for the Ministerial Izimbizo in Ntabankulu, EasternCape Province; Thohoyandou, Limpopo Province; Richards Bay, KZN Province (twice) andKeiskammahoek, Eastern Cape for the 2008/09 year. Security arrangements were coordinatedfor the Minister at workshops at UIF, Boksburg and Kopanong in Benoni.
4) Contingency Planning Compliance
● The evacuation drill exercise was conducted at Head Office in March 2008. Disaster Managementfrom the Tshwane Metro and Fire Department assisted in making the drill a success. Allcontingency officers were trained in fire fighting and First Aid before the evacuation drill
● Contingency plans were implemented at Mpumalanga Provincial Office, Gauteng South ProvincialOffice, Limpopo Provincial Office and Northern Cape Provincial Office.
Information security measures
Security Awareness programme
● The Security Awareness Programme and the Security Roll-out strategy was presented at the
Programme PerformanceProgramme 1: Administration
Annual Report
33

1 April 2008 - 31 March 2009
following offices, Limpopo; Gauteng South; Free State; DG’s Office; Ministry and NSF. Thepurpose of the awareness programme and security strategy was to ensure that all staffmembers understand their roles and responsibilities as far as security measures and prescriptsare concerned. Stake holders like NIA; SAPS; ER Signs and Disaster Management also presentedon matters related to their fields.
Personnel Security
● The Directorate issued a circular to inform officials on Personnel Suitability Checks which shouldbe conducted by the Department and other Organs of State which is a pre-requisite beforeemploying personnel. In line with the approved Vetting Strategy, the Minister of Public Serviceand Administration has issued a directive that the verification prescribed in Public ServiceRegulation 2001, Chapter 1, part Vll D. 8(a) must with effect from 1 January 2008 cover thefollowing areas-: Criminal record checks, citizenships verification, financial record checks,qualifications verifications, and references. The process is being conducted in all departmentaloffices. Identified officials who will be responsible for the PSC from all departmental offices weretrained by NIA on the PSC and Head Office is rolling out to the Provinces.
Investigations
● Since the Department embarked on conducting investigations on the security breaches and theftof IT equipment, the cases on the loss of IT equipment has drastically reduced by 75% andwhere it was found to be negligence, the officials had to pay back the Department the randvalue of that equipment. The theft of plasma screens has gone down by 80%
● A Compliance check list was compiled and circulated to all Provinces to be completed whenever aloss has occurred due to theft, robbery or any unknown reason, or where the Departmentsuffered damages as a result of motor vehicle accidents, or other incidents involving motorvehicles or any other security breach.
Establishment of the vetting unit
● The request for the establishment of the vetting unit was re-submitted to the CFO for funding ofthe posts. The backlog for Screening/Vetting is so serious and NIA cannot cope with theworkload. The vetting strategy was approved by Cabinet in December 2006 and theDepartment was not part of the priority list for the funding of the establishment of the unithence the request to National Treasury for funding. In terms of the departmental priorityvetting list compiled by the Security Directorate, 4 500 posts were identified for vetting.A total of 455 officials have already been vetted. The delay by NIA in vetting all governmentofficials resulted in a huge backlog in terms of vetting. NIA embarked on a programme todecentralise the vetting field work to government departments.
Training
The following courses were attended by officials in the Directorate as part of their PDP’S
● NIA-Security Managers Course● UNISA- Security Risk Management Course● Disaster Recovery Course.
34
Annual Report
Programme PerformanceProgramme 1: Administration

EENE 2008/09-2010/11 Measurable Objectives:
● Increase percentage of registered work-seekers placed in registered employment opportunities to70% by 2010/11
● Assess and refer 10% of work-seekers to identified critical and scarce skills developmentprogrammes by 2010/11
● Ensure training of 90 000 unemployed people, 70% placed and 26% of training is accredited by2010/11
● Reduce workplace related injuries, illnesses and deaths by 2% by 2010/11● Ensure 75% compliance with labour legislation by inspected workplaces 2010/11● Promulgate the National Occupational Health and Safety legislation and implement Act by March
2010● UIF completed claims processed and paid within 4 weeks.
KRA 1: Contribute to employment creation
1.1 A single Integrated Employment Services System is rolled out and enhanced toensure improved access to employment services
The Employment Services System was developed in 2006 and enhancements to improve theefficacy of the system are continuing. The roll-out of the Integrated Employment Services Systemto all 125 labour centres of the Department to implement the Registration Services, PlacementServices, Information Services, and Special Services together with the pilot study in Thohoyandouand Pretoria Labour Centres to implement Career Information and Guidance Services progressedwell. More job-seekers accessed Employment Services and were supported, especially through careercounseling and assessments, networking with stakeholders, the matching of individuals toopportunities, recruitment and selection to access opportunities.
There is an increasing awareness by stakeholders of the availability of the system and this resultedin more placement opportunities (employment and learning) reported and listed on the database.
Registrat ion Services includes registering job-seekers, employers, opportunities (jobs andlearning) and training providers.
ENE 2008/09-2010/11 Measurable Objective: Increase percentage of registered work-seekersplaced in registered employment opportunities to 70% by 2010/11.
The number of registered work-seekers and placement opportunities registered on the databaseincreased by 252 627 and 10 968 (7 553 job opportunities) respectively compared to 2007/08.
● Over 421 686 job-seekers were registered on the database compared to 169 059 in 2007/08,and
● Over 26 332 (22 917 job and 3 415 learning) placement opportunities were registered on thedatabase compared to only 15 364 job opportunities registered in 2007/08.
1 April 2008 - 31 March 200935
Annual Report
Programme PerformanceProgramme 2: Service Delivery
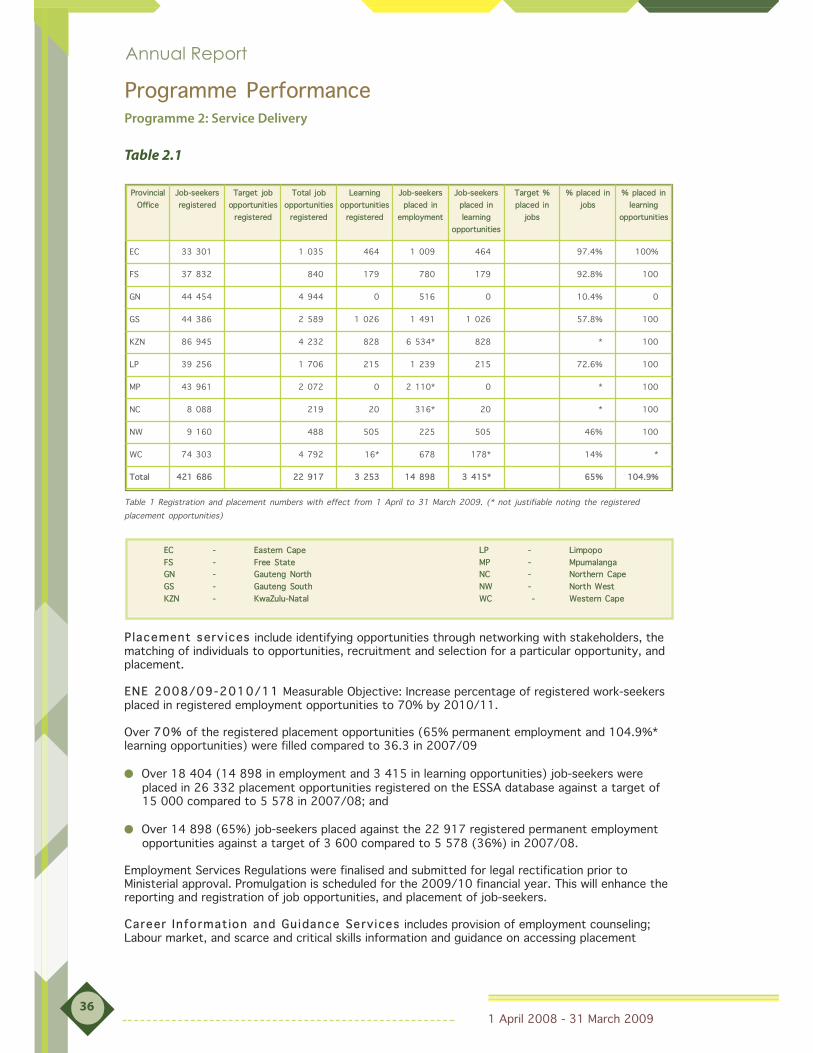
1 April 2008 - 31 March 2009
Table 2.1
Table 1 Registration and placement numbers with effect from 1 April to 31 March 2009. (* not justifiable noting the registered
placement opportunities)
Placement serv ices include identifying opportunities through networking with stakeholders, thematching of individuals to opportunities, recruitment and selection for a particular opportunity, andplacement.
ENE 2008/09-2010/11 Measurable Objective: Increase percentage of registered work-seekersplaced in registered employment opportunities to 70% by 2010/11.
Over 70% of the registered placement opportunities (65% permanent employment and 104.9%*learning opportunities) were filled compared to 36.3 in 2007/09
● Over 18 404 (14 898 in employment and 3 415 in learning opportunities) job-seekers wereplaced in 26 332 placement opportunities registered on the ESSA database against a target of15 000 compared to 5 578 in 2007/08; and
● Over 14 898 (65%) job-seekers placed against the 22 917 registered permanent employmentopportunities against a target of 3 600 compared to 5 578 (36%) in 2007/08.
Employment Services Regulations were finalised and submitted for legal rectification prior toMinisterial approval. Promulgation is scheduled for the 2009/10 financial year. This will enhance thereporting and registration of job opportunities, and placement of job-seekers.
Career Information and Guidance Services includes provision of employment counseling;Labour market, and scarce and critical skills information and guidance on accessing placement
Provincial
Office
Job-seekers
registered
Target job
opportunities
registered
Total job
opportunities
registered
Learning
opportunities
registered
Job-seekers
placed in
employment
Job-seekers
placed in
learning
opportunities
Target %
placed in
jobs
% placed in
jobs
% placed in
learning
opportunities
EC 33 301 1 035 464 1 009 464 97.4% 100%
FS 37 832 840 179 780 179 92.8% 100
GN 44 454 4 944 0 516 0 10.4% 0
GS 44 386 2 589 1 026 1 491 1 026 57.8% 100
KZN 86 945 4 232 828 6 534* 828 * 100
LP 39 256 1 706 215 1 239 215 72.6% 100
MP 43 961 2 072 0 2 110* 0 * 100
NC 8 088 219 20 316* 20 * 100
NW 9 160 488 505 225 505 46% 100
WC 74 303 4 792 16* 678 178* 14% *
Total 421 686 22 917 3 253 14 898 3 415* 65% 104.9%
36
Programme PerformanceProgramme 2: Service Delivery
Annual Report
EC - Eastern Cape LP - Limpopo
FS - Free State MP - Mpumalanga
GN - Gauteng North NC - Northern Cape
GS - Gauteng South NW - North West
KZN - KwaZulu-Natal WC - Western Cape

Annual Report
1 April 2008 - 31 March 2009
opportunities.
ENE 2008/09-2010/11Measurable Object ive: Assess and refer 10% of work-seekers toidentified critical and scarce skills development programmes by 2010/11.
● 8 531 registered job-seekers were assessed and 7 343 (86%) were referred to identified criticaland scarce skills development programmes against a target of 6 000 compared to 17 375assessed and 13 039 referred in 2007/08
● 7 546 (89%) of the 8 531 learners were assessed with the SpEEx assessment instrument forlearnerships, internships, etc. These were mainly for strategic government job creation initiativessuch as Coega, Department of Health contribution to EPWP NYS (data capturers) the EPWP NYSInfrastructure, GTZ ALMS project, the transport and construction sectors and the PSETA for ahygiene and cleaning learnership.
Table 2.2
The Resource Centre and Career Information and Guidance Services wereintroduced in the p i lot s ites.
Resource Centre funct ions : Resource Centres established with workstations equipped with sixand eight Computers (Thohoyandou and Pretoria labour centres respectively) with career websites,PACE career programme and UYF youth portal available for clients. Computer literate job-seekerswere able to perform do-it-yourself registrations and job-search activities.
Province Target of
job-seekers to be
assessed
Total job-seekers
assesed
Total identified
scarce and critical
skills dev.
programmes
registered
Total referred to
identified scarce
and critical skills
dev. programmes
% referred to
identified scarce
and critical skills
development
programmes
% placed
EC 780 2 204 1 483
FS 540 1 301 330
GN 480 471 431
GS 660 654 2 648
KZN 780 1 368 1 002
LP 540 885 411
MP 660 762 762
NC 480 217 0
NW 540 339 123
WC 540 468 153
Total 6 000 8 669 7 343
37
Programme PerformanceProgramme 2: Service Delivery
Annual Report
EC - Eastern Cape LP - Limpopo
FS - Free State MP - Mpumalanga
GN - Gauteng North NC - Northern Cape
GS - Gauteng South NW - North West
KZN - KwaZulu-Natal WC - Western Cape

1 April 2008 - 31 March 2009
● Over 4 141 clients accessed the service; with 2 975 job-seekers performing do-it-yourselfregistrations and job-search activities (2 906 Pretoria and 69 Thohoyandou)
● A roving team of 37 staff members was established and 52 staff members were trained (37 incareer information and guidance and life skills and 15 in an accredited facilitator skills course) toimplement career counseling
● Together they provided career information and counseling to 13 107 job-seekers (5 586 ofwhom were in the pilot sites Thohoyandou and Pretoria) against a target of 15 100.
Clients shared their experiences and rated the service as “good to excellent” and they started tocome for more than one day in a week, indicating the severe need for assistance. People alsostarted coming after being informed of the availability of the service by those who wereserved- marketing by word-of-mouth.
Table 2.3
Information services include producing information brochures/pamphlets and service packagesand advocacy on accessing employment and skills development services.
A total of 11 information pamphlets were published on placement services and career guidance, aswell as job-hunting and these were sent to the career guidance pilot sites including the EasternCape, Northern Cape and Mpumalanga, who had career exhibitions (four in total), as a pilot. Thesewere also used at the NSDS Conference in October 2008.
Spec ia l serv ices include active labour market (employment mediation) programmes; servicesprovided for designated/vulnerable groups including people with disabilities, youth, retrenchedworkers and ex-offenders; rehabilitation and reintegration programmes for injured workers and UIclaimants; and labour and social plan services.
● Serv ices to people with d isabi l i t ies. The Department established a partnership with theNational Councils for People with Disabilities and subsidise the salaries of 11 placement officialswho managed to place 763 people.
Provincial Office Counselling target Achieved
4 Eastern Cape 1 400 3 302
3 Free State 1 050 451
4 Gauteng North 2 650 3 173
4 Gauteng South 1 400 1 449
4 KwaZulu-Natal 1 400 1 776
3 Limpopo 2 300 2 928
4 Mpumalanga 1 400 0
3 Northern Cape 1 050 28
3 North West 1 050 0
4 Western Cape 1 400 0
Total 15 100 13 107
Programme PerformanceProgramme 2: Service Delivery
Annual Report
38

1 April 2008 - 31 March 2009
Table 2.4
● Implementation of Cuban lessons learnt Three quarterly report back meetings were heldby the National Cuban Project Implementation Forum of the Department of Labour to monitorprogress with the implementation of the Cuban lessons learnt. Five pilot projects have beenidentified, each linked to two provinces. So far, Project Sebenza (FreeState and Northern Cape)managed to place 13 unemployed graduates in the Northern Cape and is awaiting confirmation ofthe placement of 64 graduates recruited for organisations in the FreeState and Northern Cape.The other provinces are experiencing challenges with implementation due to the non-availabilityof NSF funding at this stage, but have completed project plans, planning and stakeholderidentification and briefing of stakeholders.
● Small Business intervent ion and Basic Entrepreneur ia l Ski l l s Development(BESD) programmes are being implemented with 80 EDPs trained and 182 EEs identified and143 trained. An agreement has been reached with GTZ to fund training in the following sixadditional sites, namely Queenstown; Pietermaritzburg, Kliptown, Krugersdorp, Vryburg andKhayelitsha. Criteria for site selection were also revised to enable the selection of 23 more BESDsites across all provinces.
● Protect ive Workshops : The Department is an active member of an interdepartmentaltechnical team working with the Department of Social Services on the transformation ofProtective Workshops and policy formulation for people with disabilities. The team finalised policyguidelines in this regard and is currently involved in the finalisation of a training manual aimed atthe implementation of these guidelines. A policy document has been launched by the DSD duringMarch 2009 in that regard.
1.2 Manage stakeholder relations
Over 421 686 job-seekers and 26 170 (22 917 job and 3 253 learning) placement opportunitieswere registered on the database against a target of 10 000, and over 14 898 (65%) of the 22 917registered permanent employment opportunities were filled against a target of 3 600 compared to5 578 in 2007/08 as a result of liaison and networking with strategic partners.
A partnership was established with the Eastern Cape Socio-Economic Consultative Forum in thePremier’s Office to roll out career guidance in the Eastern Cape and plans are well underway to
Programme PerformanceProgramme 2: Service Delivery
Annual Report
Provincial Office Target Achieved
Eastern Cape 100 634
Free State 100 0
Gauteng North 100 0
Gauteng South 100 125
KwaZulu-Natal 100 0
Limpopo 100 4
Mpumalanga 100 0
Northern Cape 100 0
North West 100 0
Western Cape 100 0
Total 1 000 763
39

1 April 2008 - 31 March 2009
realise this by 2009. Orientation of all Employment Services Practitioners in the Eastern Cape toroll-out career guidance will be done in March 2009. The OFO was linked to user-friendly careersinformation. A business case for three options of including an interest questionnaire into the ESSAwill be developed to facilitate career decision-making.
A partnership was also established with the Umsobomvu Youth Fund to explore opportunities totrain career counselors in co-operatives and for small business. These interventions are gearedtowards responding to second economy strategic interventions and to reinforce our ALMSprogramme. A total of 22 Career Counselors received two days training in the establishment ofCo-operatives.
A Placement Workshop was coordinated with critical stakeholders and strategic departments ingovernment in August 2008 to plan the Department’s participation in seven placement programmesthat mirrors the country’s APEX priorities and programmes for designated groups. This was followedwith discussion between the Department and the Department of Agriculture to collaborate andcooperate through skills programmes and provision of ES to enhance the implementation of theLand and Agrarian Reform programme. A formal agreement and funding proposal is being workedon. A relationship was also established with the UYF to explore opportunities to train careercounselors in co-operatives and for small business. These interventions are geared towardsresponding to second economy strategic interventions.
The Department is also playing a critical role in the anti-poverty campaign as a member of theNational Task Team, and has developed a basket of services relating to employment services andsocial security which are being rendered to these most deprived communities. A partnership wasalso established between the South African Qualifications Authority (SAQA), the Departments ofEducation and Labour to approach career guidance more holistically in the country. SAQA might setup a call centre for career guidance.
A partnership was established with the Department of Correctional Services to set up a placementprogramme for ex-offenders.
A draft communication and marketing strategy was developed to market ESSA.
Strategic interventions required to transform and enhance the capabil i tyof the Employment Services System to improve performance and createmore value to the cit izens
● Policy and Legal issues: Employment Services Regulations to be promulgated to compelprivate enterprises to register placement opportunities with the Department.
This should include a Cabinet decision to compel government departments through the Departmentof Public Service and Administration (DPSA) to register all vacancies and recruit through the ESSystem
● ICT and Processes. Integrate Client databases and create interfaces/links between processes;Employment Services of South Africa (ESSA), Unemployment Insurance (UI), Compensation forOccupational Injuries and Diseases (COID) and Inspection and Enforcement Services (IES) makingthem interdependent to manage the movement (entering, transacting and exiting the labourmarket) of workers and provide a seamless service. Siemens Business Services must commitresources, both infrastructure and competencies to enhance the Computer system performance(Matching facility, reporting facility – ensure availability of accurate information, and dataintegrity) to enable the Department to massify and intensify the provision of employmentservices
● Governance and capacity issues. The service delivery (labour centre) model andorganisational structure (inputs- management, human capital, technology, service specific andprocess specific information, facilities, and drivers; activities; and outputs of the process)reviewed and aligned to enhance process capabilities to effectively deliver the six serviceofferings. Facilities and Infrastructure to be upgraded and establish Resource Centres with
Programme PerformanceProgramme 2: Service Delivery
Annual Report
40

1 April 2008 - 31 March 2009
workstations fully equipped with the requisite technology to enable computer literate job-seekersto perform on-line registrations and job-search activities. This will ease pressure on the customerinterfacing services in the labour centres, but also improve access to employment mediationservices as these can be interfaced with other government infrastructure.
Provision should also be made for small enterprises to interact and recruit job-seekers; and the ICTinfrastructure should provide for client database integration and process interfacing with otherstrategic government departments and State owned enterprises’ processes and systems i.e.Department of Home Affairs for effective management of International Labour Migration;Socio-Economic Development Departments for identification of growth and developmentopportunities for effective provision of Special Employment Programmes to enhance placementservices including for designated groups; Thusong centres and the Government Communication andInformation System (GCIS), the Department of Communications and the South African Post Officefor effective provision of information services; and the Department of Education and institutions ofhigher learning for effective provision of career information and guidance.
KRA 2: Enhancing Ski l ls Development
Skills Development Services include developing the Provincial Skills Plans, identifying scarce andcritical skills, registering training courses with the National Skills Fund, allocating funding for skillsdevelopment, selecting and contracting training providers, monitoring training, processing trainingprovider claims and scheduling assessments at INDLELA.
2.1 NSDS 2008-2009: Year 4 Targets implementation aligned to ASGI-SA implemented.
Provincial Skills Plans were reviewed to ensure alignment with the PGDS/IDP/LED and 1 673 projectswere identified and listed, the Social Development Skills programmes procurement processes werealso aligned with the Supply Chain Management processes to comply with prescripts, the OperationsManual were finalised and users trained.
Table 2.5
Programme PerformanceProgramme 2: Service Delivery
Annual Report
41
Provincial Office No. PIP No. supported Supported
%
Amount allocated Amount spent Spent
%
Eastern Cape 369 0 0 R 0.00 0 0
Free State 84 0 0 R 0.00 0 0
Gauteng North 96 0 0 R 0.00 0 0
Gauteng South 135 0 0 R 0.00 *0 0
KwaZulu-Natal 129 0 0 R 0.00 0 0
Limpopo 115 0 0 R 0.00 0 0
Mpumalanga 165 0 0 R 0.00 0 0
Northern Cape 110 0 0 R 0.00 0 0
North West 251 0 0 R 0.00 0 0
Western Cape 219 0 0 R 0.00 0 0
Total 1 673 0 0 R 0.00 0 0

1 April 2008 - 31 March 2009
The training programmes in EPWP and the NODES were finalised.
Table 2.6
Table 2.7
Programme PerformanceProgramme 2: Service Delivery
Annual Report
Provincial Office No of unemployed trained Cost of training in Rand in support of EPWP
R
Eastern Cape 744 R 5 155 815
Free State 0 R 0
Gauteng North 1027 R 6 364 035
Gauteng South 1378 R 6 711 241
KwaZulu-Natal 4298 R 7 509 240
Limpopo 136 R 161 439
Mpumalanga 0 R 0
Northern Cape 749 R 1 848 712
North West 1144 R 3 724 947
Western Cape 914 R 5 181 569
Total 10 390 R 36 656 998
Provincial Office Rural nodes No of unemployed trained Cost of training in Rand in
support of ISRDP
R
Western Cape Central Karoo 36 R 305 090
Mpumalanga Bohlabela Cross 0 R 0
Limpopo Sekhukhune Cross 0 R 0
Eastern Cape Alfred Nzo 49 R 104 605
Eastern Cape Chris Hani 177 R 896 856
Eastern Cape Ukhahlamba 21 R 107 929
Eastern Cape OR Tambo 1 504 R 3 730 066
Northern Cape Khalagadi Cross 5 R 611 175
KwaZulu-Natal Ugu 100 R 603 201
KwaZulu-Natal Umkhanyakude 631 R 3 542 771
KwaZulu-Natal Umzinyathi 380 R 2 165 265
KwaZulu-Natal Zululand 412 R 3 328 080
Free State Thabo Mofutsanyane 0 R 0
Total 3 315 R 15 395 038
42

1 April 2008 - 31 March 2009
Table 2.8
KRA 3: Promote equity in the workplace
3.1 Employment equity implementation and enforcement mechanisms in place.
DG review implementation and roll-out coordinated by Labour Relations and progress is monitored toensure that 20 provincial staffmembers on the project are capacitated to enforce EmploymentEquity Act (EE Act) and 74 employers were subjected under the EEA DG review.
A total of 12 514 EE designated employers were identified to enforce procedural compliance andonly 9 723 were inspected and 8 112/83% complying within 90 days of inspection against a targetof 10 000 compared to 8 475 inspected and 6 881 (81%) complying at the end of March 2008.
There is a noticeable increase in the capacity to monitor and enforce EE procedural compliance.Although the target set was missed by 277, over 1 248 more EE designated employers wereinspected and over 2% more compliance achieved compared to 2007/08.
Table 2.9
Programme PerformanceProgramme 2: Service Delivery
Annual Report
43
Provincial Office Urban nodes No of unemployed trained Cost of training in Rand in
support of URP
R
Gauteng South Alexandra-URN1 0 R 0
Western Cape Khayelisha-URN6 108 R 1 576 365
Western Cape Michells Plain-URN7 0 R 0
Eastern Cape Motherwell-URN5 100 R 242 699
Eastern Cape Mdantsane-URN4 132 R 347 043
Northern Cape Galeshewe-URN8 107 R 741 240
KwaZulu-Natal Inanda-URN2 0 R 0
KwaZulu-Natal KwaMashu-URN3 0 R 0
Total 447 R 2 907 347
Provincial Office Total no of designated employers
(identified within respective province)
Total no of designated
employers inspected
Total no complying
procedurally within 90 days
%
Eastern Cape 180 124 121 98%
Free State 1 000 1 497 1 350 90%
Gauteng North 1 000 1 493 1 092 73%
Gauteng South 1 244 1 044 867 83%
KwaZulu-Natal 4 289 2 362 2 047 87%
Limpopo 843 560 467 83%
Mpumalanga 637 948 817 86%
Northern Cape 908 506 366 72%
North West 1 050 371 282 76%
Western Cape 1 363 818 703 86%
Total 12 514 9 723 8 112 83%

1 April 2008 - 31 March 2009
KRA 4: Protecting vulnerable workers
4.1 Compliance with labour legislation ensured
4.1.1 Inspection and enforcement strategy was reviewed and critical areas to enhance the capacity of inspectorate to implement and enforce compliance with labour market policies and programmes identified and enhanced:
● Professionalisation of the inspectorate: The job profiles of generalist, specialist and expertinspectors were developed and are being evaluated and weighted for implementation in 2009
● Customer centric model: The Inspection and Enforcement Case Management System is beingdeveloped. This will enhance the recording of complaints and incidents, processing thereof andtracking of progress to effectively respond to enquiries and communicate with clients
● Enforcement mechanisms ensured: COIDA Enforcement Policy developed to enhance thecapacity of inspectors to enforce compliance with COIDA.
4.1.2 At least 180 000 workplaces are inspected and 80% compliance levels achieved within 90 days of inspection.
A total of 153 697 workplaces across all the economic sectors/industries were inspected and125 323 (82%) complied within 90 days of inspection against a target of (134 280) inspections,compared to 200 665 inspected and 156 924 (78%) complying within 90 days in 2007/08.
There is a noticeable increase in the capacity of inspectors to monitor and enforce compliance withlegislation. The compliance level increased by 5% from 78% in 2007/08 to 83% in 2008/09although the total number of workplaces inspected decreased by 46 968 from 200 665 in2007/08 to 153 697 in 2008/09. However, the target inspections measured against the totalnumber of inspectors and the expected 180 inspections per inspector per annum is exceeded by19 410. The volume of workplaces inspected and the optimal utilisation of resources still remains achallenge.
Programme PerformanceProgramme 2: Service Delivery
Annual Report
44

1 April 2008 - 31 March 2009
Table 2.10
(The provinces reflected in red failed to meet the target of 180 inspections per inspector).
To monitor and enforce compliance, a total of 23 297 undertakings, 1 225 improvement notices,9 908 contravention notices, 1 255 prohibition notices and 2 251 compliance orders were issued.
Programme PerformanceProgramme 2: Service Delivery
Annual Report
Province No. of
Inspectors
Agriculture,
Hunting,
Forestry,
Fishing
Mining and
Quarrying
Manufacturing Electricity,
Gas and
Water
Supply
Wholesale
and Retail
Trade
Construction Transport,
Storage and
Communication
Financial
Intermediation
Community,
Social and
Personal
Services
Households,
Exterritorial
Organisations,
Other
*Others Total
EC 71 1 563 4 1 590 106 5 231 1 277 321 130 3 219 3 574 129 17 144
FS 61 1 680 14 503 93 2 436 687 805 250 2 425 2 141 1 475 12 509
GN 73 580 79 2 618 213 5 265 1 514 307 834 5 244 3 040 3 198 22 892
GS 115 352 257 3 214 286 4 243 2 587 746 1 870 3 776 822 1 216 19 369
KZN 127 861 12 3 947 128 6 869 1 761 828 399 3 976 7 349 983 27 113
LP 59 1 476 8 309 65 3 844 708 385 383 481 2 375 0 10 034
MP 60 984 176 681 139 3 207 1 865 590 252 1 688 2 231 0 11 813
NC 30 790 53 199 30 957 405 352 176 381 1 564 1 262 6 169
NW 57 1 532 119 398 44 824 4 043 228 156 1 083 1 858 0 10 285
WC 93 199 4 271 62 110 288 0 0 0 0 15 435 16 369
Total 746 10 017 726 13 730 1 166 32 986 15 135 4 562 4 450 22 273 24 954 23 698 153 697
Target 134 280
45
EC - Eastern Cape LP - Limpopo
FS - Free State MP - Mpumalanga
GN - Gauteng North NC - Northern Cape
GS - Gauteng South NW - North West
KZN - KwaZulu-Natal WC - Western Cape

1 April 2008 - 31 March 2009
Table 2.11
4.1.3 Coordinate and monitor the investigation and settlement of reported labour complaints/disputes to ensure 80% settlement rate within 90 days.
A total of 178 863 (79%) of the 226 297 labour complaints received were investigated andfinalised within 90 days against a target of 80% compared to 173 057 (79%) of the 220 191complaints received finalised.
Table 2.12
Programme PerformanceProgramme 2: Service Delivery
Annual Report
Province No. of
inspectors
Target no.
of
inspections
Total
workplaces
inspected
Undertakings Notices Compliance
orders
No of
employers
complying
within 90
days
%
compliance
within 90
days
%
Improvement Contravention Prohibition
EC 71 17 144 1 911 22 800 54 520 14 743 86%
FS 61 12 509 1 803 21 329 45 93 11 174 89%
GN 73 22 892 1 961 252 997 151 9 18 827 82%
GS 115 19 369 1 145 237 986 287 535 16 076 83%
KZN 127 27 113 3 202 138 2 886 235 328 22 272 82%
LP 59 10 034 1 874 45 619 34 50 7 064 70%
MP 60 11 813 1 418 171 927 149 21 10 532 89%
NC 30 6 169 1 090 127 1 069 54 15 4 655 75%
NW 57 10 285 3 621 140 786 215 317 8 052 78%
WC 93 16 369 5 272 72 509 31 363 11 928 73%
Total 746 153 697 23 297 1 225 9 908 1 255 2 251 12 5323 82%
Provincial Office Total no. of complaints reported Total no complaints investigated within
90 days
Total no of complaints
settled within 90 days
%
Eastern Cape 7 936 4 459 6 640 84%
Free State 11 220 11 220 8 953 80%
Gauteng North 50 483 37 418 33 914 67%
Gauteng South 62 333 53 467 49 184 79%
KwaZulu-Natal 14 305 13 598 11 227 78%
Limpopo 32 571 2 081 30 306 93%
Mpumalanga 14 821 3 084 11 540 78%
Northern Cape 2 130 2 429 2 245 105%
North West 5 359 4 898 4 970 93%
Western Cape 25 139 25 139 19 884 79%
Total 226 297 157 793 178 863 79%
46
EC - Eastern Cape LP - Limpopo
FS - Free State MP - Mpumalanga
GN - Gauteng North NC - Northern Cape
GS - Gauteng South NW - North West
KZN - KwaZulu-Natal WC - Western Cape

Annual Report
1 April 2008 - 31 March 2009
The 80% target was missed by 1%, however over 6 106 more complaints were received and over5 806 more complaints were finalised compared to 2007/08 although the percentage settlementremains the same at 79%.
4.1.4 Coordinate and monitor the implementation of an incident investigation and audit programme to ensure that at least 2 000 of reported OHS incidents are finalised within 90 days as per directives.
A total of 2 956 (56%) of the 5 326 OHS incidents reported were investigated and finalisedwithin 90 days against a target of 2 000. Over 4 505 (84%) of the incidents received wereinvestigated which reflect an improved capacity to investigate, although 2 280 (43%) of theincidents which were investigated were not finalised which reflect a high backlog rate despite thetarget of 2 000 being exceeded by 1 046.
Table 2.13
4.2 Targeted advocacy and blitz inspections to inspect at least 10 000 workplaces and to decrease workplace incidents in the High Risk industries by at least 2%.
4.2.1 Total reported incidents decreased by 247/4.4% from 5 573 in 2007/08 to 5 326 in 2008/09 against a target of 2%. Reported fatal incidents decreased by 61/18% from 332 in 2007/08 to 271 in 2008/09.
However workplace related injuries, diseases and deaths is still a challenge partly due to the increasein economic activity and volumes of workers in the identified sectors. This is further compounded byworkers beginning to know their rights relating to the reporting of incidents due to our advocacyprogrammes. This however does not relate to workers refusing to work in unsafe places andtherefore reduction in incidents.
Programme PerformanceProgramme 2: Service Delivery
Annual Report
Provincial
Office
Reported OHS incidents Total OHS incidents investigated Finalised in 90 days %
Eastern Cape 177 145 125 71%
Free State 227 227 191 84%
Gauteng North 346 265 231 67%
Gauteng South 413 95 32 8%
KwaZulu-Natal 2 749 2 627 1 424 52%
Limpopo 141 54 13 9%
Mpumalanga 151 147 142 94%
Northern Cape 30 37 9 30%
North West 305 226 231 76%
Western Cape 787 682 558 71%
Total 5 326 4 505 2 956 56%
47

1 April 2008 - 31 March 2009
Table 2.14
Table 2.15
Table 2.16
Programme PerformanceProgramme 2: Service Delivery
Annual Report
Provincial Office Reported OHS incidents
2007/08
Reported OHS incidents
2008/09
Eastern Cape 93 177
Free State 259 227
Gauteng North 651 346
Gauteng South 745 413
KwaZulu-Natal 2 420 2 749
Limpopo 99 141
Mpumalanga 206 151
Northern Cape 54 30
North West 233 305
Western Cape 813 787
Total 5 573 5 326
Fatal incidents
2005/06
Fatal incidents
reported 2006/07
Fatal Incidents
reported 2007/08
Fatal Incidents
reported 2008/09
Number 358 290 332 271
Reduction -19% 14% -18%
Total incidents reported 2007/08
Provincial Office Casualities Non casualities Fatalities Diseases Total
Eastern Cape 93
Free State 259
Gauteng North 651
Gauteng South 745
KwaZulu-Natal 2 420
Limpopo 99
Mpumalanga 206
Northern Cape 56
North West 233
Western Cape 813
Total 332 5 575
Variance
48

Annual Report
1 April 2008 - 31 March 2009
Table 2.17
4.2.2 Advocacy and blitz inspections programme developed targeting high risk industries and 10 285 inspections were conducted (Construction 2 458, Iron and Steel 2 449, Food and Beverage 2 701, Agriculture 2 677) against a target of 10 000.
However 8 277 less targeted blitz inspections were conducted in the high risk industries(Construction 5 273, Iron and Steel 837, Food and Beverage 792, and Agriculture 1 375) whichclearly indicates reduced visibility and lack of focus in these industries.
Table 2.18
Programme PerformanceProgramme 2: Service Delivery
Annual Report
Total incidents reported 2008/09
Provincial Office Casualities Non casualities Fatalities Diseases Total
Eastern Cape 51 0 6 0 177
Free State 27 0 34 0 227
Gauteng North 47 3 7 0 346
Gauteng South 940 50 145 3 413
KwaZulu-Natal 647 0 11 13 2 749
Limpopo 56 6 31 0 141
Mpumalanga 13 3 4 0 151
Northern Cape 18 8 4 0 30
North West 57 0 12 0 305
Western Cape 128 0 17 0 787
Total 1 984 70 271 16 5 326
Variance 61(-18%) 247 (-4%)
Provincial Office Blitz inspections
conducted
Construction Iron and Steel Food and Bev Agriculture
Eastern Cape 4 249 197 187 581
Free State 4 119 203 192 329
Gauteng North 4 70 44 204 79
Gauteng South 4 248 135 139 68
KwaZulu-Natal 4 761 707 700 354
Limpopo 4 187 356 278 244
Mpumalanga 4 437 313 325 313
Northern Cape 4 167 205 365 390
North West 4 112 197 225 259
Western Cape 4 108 92 86 60
Total 40 2 458 2 449 2 701 2 677
49

1 April 2008 - 31 March 2009
4.2.3 Further Integrated blitz inspections were conducted targeting the Hospitality, Taxi and Security industries and 5 459 workplaces inspected.
Table 2.19
KRA 6: Strengthening social protection
6.1 Enhance the rate and quality of social security services to our clients.
6.1.1 90% UI claims finalised within 5 weeks.
Not achieved. Only 87% (587 136) of the 674 161 claims received were finalised.
Table 2.20
To verify the 2007/08 figures with Unemployment Insurance Fund for comparative analysis and to determine the trends, noting the
economic crisis and impact on the resources (financial and human) of the Fund.
Programme PerformanceProgramme 2: Service Delivery
Annual Report
Provincial Office Blitz inspections
conducted
Hospitality Taxi Security
Eastern Cape 3 363 0 125
Free State 3 185 388 203
Gauteng North 3 208 0 93
Gauteng South 3 77 0 0
KwaZulu-Natal 3 597 24 170
Limpopo 3 263 350 247
Mpumalanga 3 385 356 144
Northern Cape 3 295 268 100
North West 3 288 0 104
Western Cape 3 71 0 155
Total 30 2 732 1 386 1 341
Provincial Office UI claims received UI claims finalised within 5 weeks % UI claims finalised within 5 weeks
%
Eastern Cape 55 394 39 553 71
Free State 30 889 25 896 84
Gauteng North 83 733 65 926 79
Gauteng South 124 490 116 469 94
KwaZulu-Natal 124 954 119 386 96
Limpopo 39 537 34 361 87
Mpumalanga 49 696 45 300 92
Northern Cape 21 912 19 811 90
North West 29 277 25 471 87
Western Cape 114 279 94 963 83
Total 674 161 587 136 87
50

Annual Report
1 April 2008 - 31 March 2009
KRA 9: Monitoring the impact of legislation
9.1 Changing labour market trends detected, reported and implications for Department intervention explored.
Quarterly statistics performance information reports developed and the reports analysed todetermine the performance trends.
Mid-Term and annual performance (qualitative and quantitative) information reports were analysedand trends reported on.
Performance Indicators were reviewed and aligned to those in the ENE and Strategic Plan, andperformance norms and standards across occupational classifications accordingly reviewed andimplemented.
KRA 10: Strengthening the institutional capacity of the Department
10.1 Adequately resourced and capable service delivery points
10.1.1 95% staff capacity maintained. Staff capacity maintained at only 88%.
Total 2.21
10.1.2 Extensive engagement took place between the Department and UNISA to produce a certificate qualification for inspectors in Explosives which will take place over 12 months instead of an 18-month programme without impacting negatively on the quality of the training. Expectations were given to UNISA on what would be requiredto produce an explosives inspector.
Programme PerformanceProgramme 2: Service Delivery
Annual Report
Programme Total no of approved posts Vacancies Vacancy %
DD-G 3 0 0
CD: SM 37 12 32
CD: OHS 50 26 52
Eastern Cape 666 68 10
Free State 408 29 7
Gauteng North 447 22 5
Gauteng South 876 126 14
KwaZulu-Natal 989 163 16
Limpopo 392 57 15
Mpumalanga 423 60 14
Northern Cape 227 18 8
North West 360 26 7
Western Cape 619 76 12
Total 5 497 683 12
51

1 April 2008 - 31 March 2009
Table 2.22
10.1.3 Improved access to services
Service delivery standards were developed and implementation is monitored quarterly
A programme was put in place to ensure that our facilities are accessible to people with disabilitiesand 50% of the 125 labour Centres (service delivery points) are accessible to people withdisabilities.
Selected performance and operational indicators
Programme PerformanceProgramme 2: Service Delivery
Annual Report
Provincial Office Total no of
inspectors trained
Categories of training Total
Employment equityOccupational health
and safetySocial security
Eastern Cape 10 2 10 0 12
Free State 8 2 3 0 5
Gauteng North 0 2 0 0 2
Gauteng South 154 2 152 0 154
KwaZulu-Natal 0 2 0 0 2
Limpopo 84 2 72 0 74
Mpumalanga 0 2 4 0 6
Northern Cape 0 2 0 0 2
North West 0 2 0 0 2
Western Cape 0 2 0 0 2
Total 256 20 241 0 261
Indicator Programme Figures/percentage
Number of new jobs registered on
Employment Services database Service delivery 26 332
Percentage of registered work-seekers
placed in permanent employment Service delivery 65%
Percentage of Occupational Health and
Safety incidents investigated within 90
days
Service delivery 57%
Percentage decrease in workplace
related injuries, diseases and deathsService delivery 4.4%
Percentage compliance with labour
legislation by inspected workplaces Service delivery 82%
52

3.1 Purpose: To contribute to employment creation and skills development by promoting and monitoring the achievement of the objectives of the National SkillsDevelopment Strategy (NSDS) and the National Human Resource Development Strategy.
Table 3:1 Selected Performance Indicators
Table 3.2: Progress made by the Employment and Skills Development Services (ESDS)and Human Resource Development (HRD) Subprogrammes towards meeting the 2008 /09 targets. The report covers the period 1 April 2008 to
31 March 2009:
1 April 2008 - 31 March 200953
Programme PerformanceProgramme 3: Employment and Skills Development Services/Human Resource Development
Annual Report
Measurable objective: To implement the National Skills Development Strategy 2005-2010.
Subprogramme Output Measure/Indicator
Target April
2008-March
2009
Actual
National Skills
Fund (NSF)
Admin and
Transfers
Implementation of National Skills
Development Strategy (NSDS)
2005-2010 year 4 targets aligned
to the Accelerated Shared Growth
Initiative-South Africa (ASGI-SA)
Achieve NSF strategic projects
targets in support of provincial
growth and development
strategies/ASGI-SA
Number of unemployed people
assisted to enter learning
programmes
16 000 people 41 336
Number of people completed
learning programmes
8 000 people 31 003
Number of under-graduate
bursaries awarded
4 500 people 1 752 under-graduate
bursaries awarded
Number of post-graduate
bursaries awarded
1 500 people 997 post-graduate
bursaries were awarded
Number of Adult Basic Education
and Training (ABET) learners
registered by the NSF
40 000 people 21 413 NSF funded
ABET learners recruited
and commenced learning
programmes
Measure/Indicator Target April 2008-March 2009 Actual April 2008 –March 2009
Number of Small BEE SMMEs and
cooperatives that receive skills
development support
1 200 2 251 small BEE enterprises and cooperatives
received skills development support
Number of people participating in trade
tests at the Institute for the National
Development of Learnerships,
Employment Skills and Labour
Assessments (INDLELA)
10 000 8 337 people participated in trade tests at
INDLELA
Percentage pass rate for trade tests 40% 41% pass rate
Number of artisans registered for training
by Sector Education and Training
Authorities (SETAs
18 693 17 228

1 April 2008 - 31 March 200954
Programme PerformanceProgramme 3: Employment and Skills Development Services/Human Resource Development
Subprogramme Output Measure/Indicator
Target April
2008-March
2009
Actual
Number of ABET learners
completed programme
20 000 people
Number of unemployed people
trained
90 000
unemployed
people funded
for training,
26% of which
receive
accredited
training.
Approved
budget R844
million
R190.5 million disbursed
for the training of
unemployed people
15 169
unemployed people
trained
Number of trained unemployed
people placed in employment
63 000 people 8 885 trained
unemployed people placed
in employment
Number of non-levy paying
co-ops receiving skills
development support by March
2009
400
Community
Based
Co-Operatives
367
Community Based
Co-Operatives have
benefitted from skills
development support
funded by the NSF
SETA
co-ordination
Implementation of National Skills
Development Strategy 2005-2010
year 4 targets aligned to ASGI-SA
Scarce and critical skills list and
database updated
September
2008
Scarce and critical skills
list 2008 was finalised by
the Skills Focus Group
(SFG) and signed off by
the Economic Investment
Employment (EIE) cluster.
Request for the printing
of scarce skills
publications was
processed and forwarded
to Chief Directorate of
Communication and sent
to stakeholders.
Achievement of targeted SETA
funded skills development
programmes monitored
Number of non-levy paying
organisations receiving skills
development support by March
2009
At least 5 865
SMMEs, NGOs,
co-ops and
small BEE
enterprises
7 601 SMMEs, NGOs,
co-ops and small BEE
enterprises received
training
Annual Report

1 April 2008 - 31 March 200955
Programme PerformanceProgramme 3: Employment and Skills Development Services/Human Resource Development
Annual Report
Subprogramme Output Measure/Indicator
Target April
2008-March
2009
Actual
Number of ABET employed
learners trained by March 2009
44 640 ABET
employed
learners to be
trained by
March 2009
40 851 employed learners
registered with ABET
programmes and
14 221 learners
completed their training
Number of workers assisted to
enter scarce and critical skills in
learnerships, apprenticeships,
internships, bursaries and skills
programmes
56 506
workers to be
assisted to
enter scarce
and critical
skills in
learnerships,
apprenticeships,
internships,
bursaries and
skills
programmes
103 293 learners assisted
to enter scarce and
critical skills programmes
109 270 workers
completed training
programmes
Number of unemployed people
assisted to enter scarce and
critical skills programmes in
learnerships, apprenticeships,
internships, bursaries and skills
programmes
43 316
unemployed
people assisted
to enter scarce
and critical
skills
programmes in
learnerships,
apprenticeships,
internships,
bursaries and
skills
programmes
60 125 unemployed
people assisted to enter
scarce and critical skills
programmes
63 658 unemployed
people completed learning
programmes
Number of learners in areas of
critical skills placed for
experience locally and
internationally
9 088 learners
in areas of
critical skills
placed for
experience
locally and
internationally
13 148 learners placed
in workplaces
Number of youth trained in New
Venture Creation (NVC)
3 276 youth
trained in New
Venture
Creation
3 900 youth trained in
New Venture Creation

Table 3.3 Achievements against the NSDS 2005-2010 year four (2008-9) targets
1 April 2008 - 31 March 200956
Goal Key performance
indicator
Annual targets for
2008/09
Performance results April
2008 to March 2009
Reasons for variance
1. Prioritising and
communicating
critical skills for
sustainable
growth,
development and
equity
1.1. Skills
Development
supports national
and sectoral
growth,
development and
equity priorities
Skills development
supports national and
sectoral growth,
development and equity
priorities
Publications of the scarce
skills list were produced
and distributed to
stakeholders at the skills
conference and to
departmental offices and
SETAs
Subprogramme Output Measure/Indicator
Target April
2008-March
2009
Actual
INDLELA Assessment services
Backlog on assessments
Provision of Train the Trainer
Programmes
The number of candidates
assessed at INDLELA annually
10 000
candidates by
March 2009
8 337 assessed
3 392 passed
Pass rate = 41%
All applicants to be assessed
within the acceptable period
All applicants to
be assessed
within two
months
Backlogs as at February
2009
Electrical Trade
Applications are full until
April 2010
Bricklaying, Welders and
Carpenters applications
are full until June 2009
Riggers applications are
full until July 2009
Motor Mechanics
applications are full until
May 2009
A number of assessors,
moderators, facilitators and
assessment tools developers
trained in the current financial
year
20 Assessors
20 Moderators
20 Facilitators
20 Assessment
tools
developers
Total trained
26 Assessors
11 Moderators
12 Facilitators
24 Assessment
tools
developers
were trained
Annual Report
Programme PerformanceProgramme 3: Employment and Skills Development Services/Human Resource Development

1 April 2008 - 31 March 200957
Goal Key performance
indicator
Annual targets for
2008/09
Performance results April
2008 to March 2009
Reasons for variance
The NSF will fund the
printing of the guide
The NSF will fund the
training of career
guidance counsellors in
the use of the
information
[NSDS Lever 1.2]
The National Master Scarce
Skills List for South Africa
2008 was updated and
printed by October 2008.
NSF budget was available
Career guidance focus was on
putting structures in place,
including appointment of
councillors. Therefore no funding
was requested from the NSF for
training of career guidance
counsellors
1.2. Information
on critical skills is
widely available to
learners. Impact of
information
dissemination
researched,
measured and
communicated in
terms of rising
entry, completion
and placement of
learners
15 139 Sector
Development
Facilitators (SDF) and
Sector Specialists trained
(15 019 by SETAs)
(120 by Productivity SA)
18 836 SDF and Sector
Specialists trained
(18 760 by SETAs)
(78 by Productivity SA)
Productivity SA entered into an
agreement with BankSeta under
whose terms the SETA was to
facilitate the training of 45 Sector
Specialists in 2008/09.
BankSeta moved the training
backwards to May 2009
2. Promoting and
accelerating
quality training for
all in the work
place
2.1. By March
2010 at least
80% of large
firms’ employment
equity targets are
supported by skills
development.
Impact on overall
equity profile
assessed
3 480 large firms and
4 791 medium firms to
be supported through
skills development
4 284 large firms and
5 670 medium firms
(123% and 118% of the
target respectively) were
supported through skills
development
2.2. By March
2010 skills
development in at
least 40% of
small levy-paying
firms supported
and the impact of
the support is
measured
25 004 small levy-paying
firms supported through
skills development
26 736 small levy-paying
firms (107% of the
target) supported through
skills development
Annual Report
Programme PerformanceProgramme 3: Employment and Skills Development Services/Human Resource Development

1 April 2008 - 31 March 2009
Goal Key performance
indicator
Annual targets for
2008/09
Performance results April
2008 to March 2009
Reasons for variance
2.3. By March
2010 at least
80% of
government
departments
spend at least 1%
of personnel
budget on training
and impact of
training on service
delivery measured
and reported
84 government
departments spend at
least 1% of personnel
budget on training
65 government (77% of
the target) departments
spent at least 1% of
personnel budget on
training
There is a lack of cooperation by
government departments
2.4. By March
2010 at least
500 enterprises
achieve a national
standard of good
practice in skills
development
approved by the
Minister of Labour
A national standard of
good practice in skills
development submitted to
the Minister for approval
A Framework on Good
Practice in Skills
Development and Awards
was approved and
successfully piloted in
2008. Thirty-two
companies received
Ministerial Awards at the
October 2008 Skills
Conference for their
outstanding contribution to
national skills development
The NSA resolved to waive the
implementation of objective 2.4 of
the National Skills Development
Strategy for two years pending
further research on possible policy
options for the national standard
2.5. Anually
increasing number
of small BEE firms
and BEE
co-operatives
supported by skills
development.
Progress measured
through an annual
survey of BEE
firms and BEE
co-operatives
within the sector
from the second
year onwards.
Impact of support
measured
A total of 1 406 small
BEE firms and BEE
co-operatives supported
with skills development
A total of 2 251 Small
BEE and BEE co-ops
(160% of the target) were
supported
Programme PerformanceProgramme 3: Employment and Skills Development Services/Human Resource Development
Annual Report
58

1 April 2008 - 31 March 2009
Programme PerformanceProgramme 3: Employment and Skills Development Services/Human Resource Development
Annual Report
59
Goal Key performance
indicator
Annual targets for
2008/09
Performance results April
2008 to March 2009
Reasons for variance
2.6. From April
2005 to March
2010 there is an
annually increasing
number of people
who benefit from
incentivised
training for
employment or
re-employment in
new investments
and expansion
initiatives. Training
equity targets
achieved. Of
number trained,
100% to be SA
citizens
Annually increasing
number of people who
benefit from incentives
training for employment /
re-employment in new
investments and
expansion initiatives
A) Workplace Skills
Development Support
Programme (WSDSP)
effectively implemented
(10% increase on
previous year’s beneficiary
numbers achieved)
B) BPO&O (Business
Process Outsourcing and
Offshoring) Training
Grant as part of DTI
Investment Incentive
programme effectively
implemented (Process all
applications and claims
received within the
timeframes and prescripts
as agreed in the MoU)
[new programme since
July 2007]
R60 million committed
over a 3-year period.
12 440 workers targeted
to benefit
Establish 120 Future
Forums and give support
on developing strategies
and work plans
Develop 70 and
implement 50 turnaround
strategies
2 069 new workers
benefited from the
Workplace Skills
Development Support
Programme (WSDSP)
The total number of
workers trained is 6 156
All those trained are South
African Citizens
The total WSDSP training
expenditure is
R19, 77 million and 45
SMMEs benefited
151 new workers benefited
from the BPO&O Training
Grant.
Eight ( 8) applications
were processed and
adjudicated by the BPO&O
Adjudication Committee –
7 were approved and 1
was pending
One claim was paid to the
amount of R1 596 million
Productivity SA established
105 future forums under
the Social Plan Technical
Support Facility process
Productivity SA developed
59 and implemented 0
turn-around strategies to
prevent job losses in terms
of the Social Plan
The implementation of the Future
Forums objective slowed down
due to financial challenges met
Implementation did not take place
due to financial challenges met
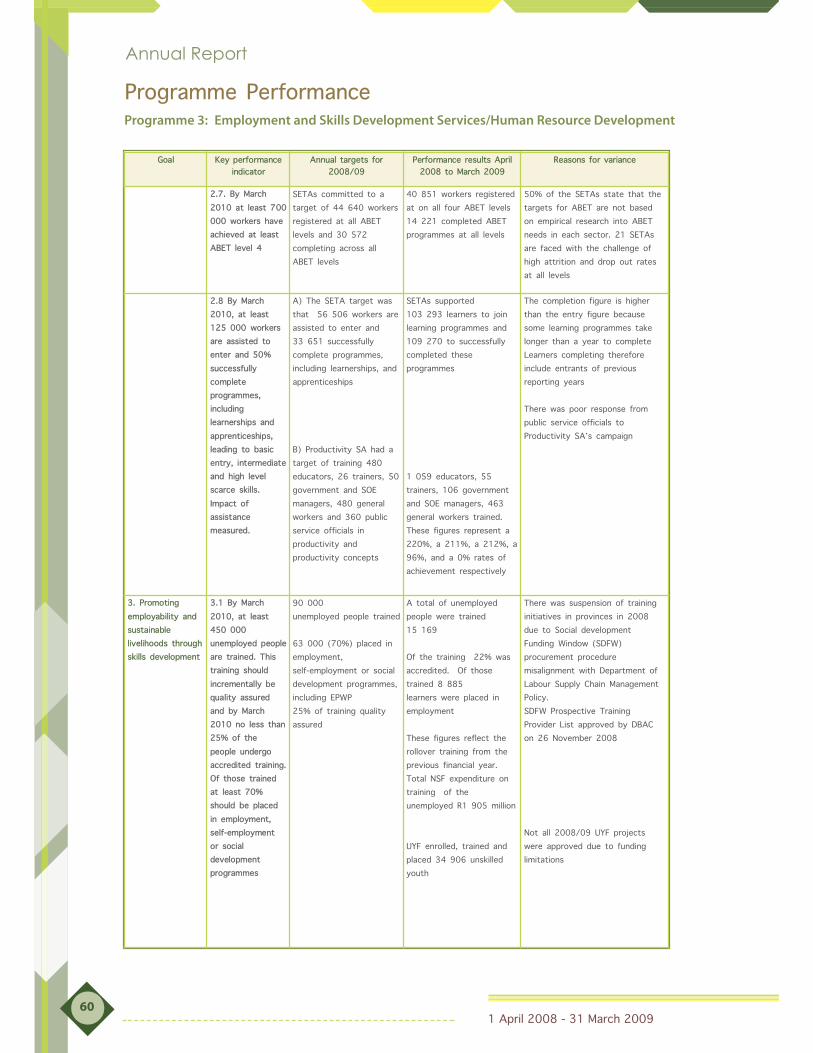
1 April 2008 - 31 March 2009
Goal Key performance
indicator
Annual targets for
2008/09
Performance results April
2008 to March 2009
Reasons for variance
2.7. By March
2010 at least 700
000 workers have
achieved at least
ABET level 4
SETAs committed to a
target of 44 640 workers
registered at all ABET
levels and 30 572
completing across all
ABET levels
40 851 workers registered
at on all four ABET levels
14 221 completed ABET
programmes at all levels
50% of the SETAs state that the
targets for ABET are not based
on empirical research into ABET
needs in each sector. 21 SETAs
are faced with the challenge of
high attrition and drop out rates
at all levels
2.8 By March
2010, at least
125 000 workers
are assisted to
enter and 50%
successfully
complete
programmes,
including
learnerships and
apprenticeships,
leading to basic
entry, intermediate
and high level
scarce skills.
Impact of
assistance
measured.
A) The SETA target was
that 56 506 workers are
assisted to enter and
33 651 successfully
complete programmes,
including learnerships, and
apprenticeships
B) Productivity SA had a
target of training 480
educators, 26 trainers, 50
government and SOE
managers, 480 general
workers and 360 public
service officials in
productivity and
productivity concepts
SETAs supported
103 293 learners to join
learning programmes and
109 270 to successfully
completed these
programmes
1 059 educators, 55
trainers, 106 government
and SOE managers, 463
general workers trained.
These figures represent a
220%, a 211%, a 212%, a
96%, and a 0% rates of
achievement respectively
The completion figure is higher
than the entry figure because
some learning programmes take
longer than a year to complete
Learners completing therefore
include entrants of previous
reporting years
There was poor response from
public service officials to
Productivity SA’s campaign
3. Promoting
employability and
sustainable
livelihoods through
skills development
3.1 By March
2010, at least
450 000
unemployed people
are trained. This
training should
incrementally be
quality assured
and by March
2010 no less than
25% of the
people undergo
accredited training.
Of those trained
at least 70%
should be placed
in employment,
self-employment
or social
development
programmes
90 000
unemployed people trained
63 000 (70%) placed in
employment,
self-employment or social
development programmes,
including EPWP
25% of training quality
assured
A total of unemployed
people were trained
15 169
Of the training 22% was
accredited. Of those
trained 8 885
learners were placed in
employment
These figures reflect the
rollover training from the
previous financial year.
Total NSF expenditure on
training of the
unemployed R1 905 million
UYF enrolled, trained and
placed 34 906 unskilled
youth
There was suspension of training
initiatives in provinces in 2008
due to Social development
Funding Window (SDFW)
procurement procedure
misalignment with Department of
Labour Supply Chain Management
Policy.
SDFW Prospective Training
Provider List approved by DBAC
on 26 November 2008
Not all 2008/09 UYF projects
were approved due to funding
limitations
Annual Report
Programme PerformanceProgramme 3: Employment and Skills Development Services/Human Resource Development
60

1 April 2008 - 31 March 2009
Annual Report
Programme PerformanceProgramme 3: Employment and Skills Development Services/Human Resource Development
61
Goal Key performance
indicator
Annual targets for 2008/09 Performance results April
2008 to March 2009
Reasons for variance
including Extended
Public Works
Programmes
(EPWP), or should
be engaged in
further studies.
Placement
categories each to
be defined,
measured,
reported and
sustainability
assessed
Umsobomvu Youth Fund
(UYF) had a target of
facilitating the enrolment,
training and placing in
community service
programmes of 38 000
unemployed youth
3.2 By March
2010 at least
2 000
non-levy paying
enterprises, NGOs,
CBOs and
Community-based
co-operatives
supported by skills
development.
Impact of support
on sustainability
measured with a
targeted 75%
success rate
The annual target for SETAs
was that 5 865
non-levy paying enterprises
are supported through skills
development
The NSF’s target was that
at least 400 Community
Based Co-Operatives are
supported by skills
development
Productivity SA had a target
of training 1 800 SMMEs in
productivity. The organisation
achieved a 55.5% success
rate having provided training
for 910 SMMEs in the year
A total of 7 601 enterprises
(130% of the SETA target)
were supported by SETAs
through skills development
29 signed Memorandum of
Agreements (MoA) are in
operation with service
providers and cover a total
of 367 Small Community
Based Co-Ops across all
provinces
About 4 000 Co-ops workers
will benefit from the skills
support arrangement. Equity
targets are
Females – 65%
Blacks – 95%
Youth – 41%
People with dissabilities –
4%
Productivity SA provided
training for 910 SMMEs in
the year; 55% of the target
3 MoA affecting 33 co-ops
were cancelled due to non
compliance to MoA conditions
and mis-management
The target was not achieved
because of financial challenges
faced by Seda which
organisation under the
condition of an MOU entered
into with PSA was to
facilitate training processes
3.3. By March
2010 at least
100 000
unemployed
people have
participated in
ABET level
programmes of
which at least
70% have
achieved ABET
level four
40 000 unemployed people
participate in ABET Level
programmes of which 70%
have achieved ABET Level 4
At least 20 000 ABET
learners complete
programmes
The number of ABET
learners registered is
73 438
Number of learners
completed 27 194

1 April 2008 - 31 March 200962
Annual Report
Programme PerformanceProgramme 3: Employment and Skills Development Services/Human Resource Development
Goal Key performance
indicator
Annual targets for
2008/09
Performance results April
2008 to March 2009
Reasons for variance
4. Assisting
designated groups,
including new
entrants to
participate in
accredited work,
integrated learning
and work-based
programmes to
acquire critical
skills to enter the
labour market and
self-employment
4.1. By March
2010 at least
125 000
unemployed
people assisted to
enter and at least
50% successfully
complete
programmes,
including
learnerships and
apprenticeships,
leading to basic
entry, intermediate
and high level
scarce skills.
Impact of
assistance
measured
SETAs target was that
43 316 unemployed
people are assisted to
enter learning programmes
and at least 50%
successfully complete
those learning
programmes including
learnerships and
apprenticeships
Productivity SA had the
objective of providing
internships for 50
industrial engineering
graduates
The objective of UYF
Graduate Development
Programme was to recruit
and enrol 6 300
unemployed graduates in
life skills and work
readiness programmes.
All 6 300 graduates were
to complete. Of the
6 300 completed
graduates, 4 500 were to
be linked to job
employment opportunities.
The objective of one of
UYF’s special projects was
to provide accredited
basic training to young
people to enable them to
access further learning.
The 2008/09 target set
as part of this objective
is the training of 3 641
young people
The NSF objective was to
fund the awarding of
4 500 scarce skills
undergraduate bursaries
and 1 500 scarce skills
post-graduate bursaries.
60 125 unemployed
learners were assisted to
enter learning programmes
and 63 658 unemployed
learners successfully
completed the learning
programmes
The organisation achieved
a 10% success rate
through developing
internships for 5 industrial
engineers
The organisation achieved
a 27.7% success rate in
recruiting and enrolling
unemployed graduates
whereby 1 750 graduates
were recruited and enrolled
against the target. It
achieved a 0% success
rate against the
completion target and a
0% success rate against
the placement target
The organisation achieved
a 0% rate of success in
the pursuit of this
objective.
The NSF funded the
awarding of 4 869
undergraduate bursaries
through the NSFAS and a
total of 997 post graduate
bursaries were awarded
through the NRF
The completion figure is higher
than the entry figure because
some learning programmes take
longer than a year to complete.
Learners completing therefore
include entrants of previous
reporting years
The organisation had limited
resources for the implementation
of this project
The Graduate Development
Programme did not achieve its
objectives because of partners
reneging on their commitments.
The Project Management
programme which focuses on
special skills projects is currently
under review

1 April 2008 - 31 March 200963
Annual ReportAnnual Report
Programme PerformanceProgramme 3: Employment and Skills Development Services/Human Resource Development
Goal Key performance indicator Annual targets for
2008/09
Performance results April
2008 to March 2009
Reasons for variance
4.2. 100% of learners in
critical skills programmes
covered by sector
agreements from Further
Education and Training
(FET) and Higher Education
and Training (HET)
institutions assisted to gain
work experience locally or
abroad, of whom at least
70% find placement in
employment or
self-employment
The annual collective
SETAs target was that
9 088 learners in critical
skills programmes are
covered by sector
agreements from FET
and HET institutions and
are assisted to gain work
experience. At least 70%
of these learners should
find placement
13 148 learners in critical
skills programmes were
assisted to enter the
workplace
(145% of the target)
4.3. By March 2010 at
least 10 000 young people
trained and mentored to
form sustainable new
ventures and at least 70%
of new ventures in
operation 12 months after
completion of programme
The collective SETA’s
target was that 3 276
young people are trained
and mentored to form
sustainable new ventures
and at least 70% of new
ventures should be still in
operation 12 months
after the young people
have completed the
programme
3 900 young people were
trained by SETAs to create
new ventures and 475 of
the new ventures created
are sustainable
A few SETAs state that
young people are not
necessarily the people
best able to create
sustainable new ventures.
SETAs also do not have
the funds to provide
seed capital for new
ventures
5. Improving the
quality and
relevance of
provision
5.1. By March 2010 each
SETA recognises and
supports at least 5
Institutes of Sectoral and
Occupational Excellence
(ISOE) within public or
private institutions and
through Public Private
Partnerships (PPPs) where
appropriate, spread as
widely as possible
geographically for the
development of people to
attain identified critical
occupational skills, whose
excellence is measured in
the number of learners
successfully placed in the
sector and employer
satisfaction ratings of their
training
511 Institutes of Sectoral
and Occupational
Excellence (ISOE) are
recognised and supported
by SETAs
449 Institutes of Sectoral
and Occupational
Excellence (ISOE) were
recognised and supported
by SETAs
A number of institutions
identified as ISOEs need
human and other
resources.
Different SETAs are
targeting the same
institutions as candidates
for an ISOE status

Goal Key performance indicator Annual targets for
2008/09
Performance results April
2008 to March 2009
Reasons for variance
5.2. By March 2010, each
province has at least two
provider institutions
accredited to manage the
delivery of the new venture
creation qualification. 70%
of new ventures still
operating after 12 months
will be used as a measure
of the institutions’ success
92 provider institutions
accredited to manage the
delivery of the new
venture creation
qualification
138 provider institutions
were accredited to manage
the delivery of the new
venture creation
qualification
5.3. By March 2010 there
are measurable
improvements in the quality
of the services delivered by
skills development
institutions and those
institutions responsible for
the implementation of the
National Qualification
Framework (NQF) in
support of the National
Skills Development Strategy
(NSDS)
Measurable improvement
in the quality of the
services delivered by skills
development institutions
The refinement of the
draft QCTO policy
document is continuing.
This will assist in
positioning the policy
document accordingly
within the NQF framework.
Draft QCTO regulations
called ‘The Occupational
Qualifications Regulations”
have been developed. The
regulations are now ready
to be tabled to the Quality
Council for Trades and
Occupations (QCTO) Board
once established for
further processing and
finalisation. The draft
QCTO Regulations’ criteria
and guidelines are being
developed now that the
draft regulations are in
place
The appointment of QCTO
Board members as well as
establishing an interim
operational team for the
QCTO is in progress
5.4. By March 2010, there
is a National Skills
Authority (NSA)
constituency based
assessment of an
improvement in stakeholder
capacity and commitment
to the National Skills
Development Strategy
NSA constituency based
assessment of
improvement in
stakeholder capacity
development
The NSF availed
R20 million to the 18
constituencies of the NSA
for the capacity building of
their members. In this
reporting period only
7 constituency
organisations took up the
funding offer and 3 263
members benefitted.
R 12 210 554 was
disbursed
1 April 2008 - 31 March 2009
Programme PerformanceProgramme 3: Employment and Skills Development Services/Human Resource Development
Annual Report
64

Annual Report
1 April 2008 - 31 March 2009
3.4 Skills levies collected and transferred to SETAS and NSF
Table 3.4 illustrates the total levies collected by SARS and transferred to SETAs and the NSFwithin 30 days of each second month. The amounts represent 1% of the employer’s payroll. Itfurther illustrates the total amount collected and transferred to SETAs and the NSF by end of March2009.
Table 3.4 Skills levies collected and transferred to SETAs and NSF
3.5 Productivity SA
Productivity SA’s key priorities include promoting productivity knowledge and awareness, skillsdevelopment and accelerating productivity within the non-formal economy through interventionsthat encourage social dialogue and collaboration between partners.
Progress made by Productivity SA on its workplan for 2008/09 is as reflected in Table 3.5
Table 3.5 Productivity SA’s progress in 2008/09
Programme PerformanceProgramme 3: Employment and Skills Development Services/Human Resource Development
Annual Report
Levy year
Year collected
1 April 2008-
March 2009
Total amount collectedAmount transferred to
SETAs during the levy year
Amount transferred to NSF
during the levy year
2008/09 1 April 2008-
March 2009
7 333 171 049 5 866 536 837 1 466 634 212
Grand total 7 333 171 049 5 866 536 837 1 466 634 212
Indicator Annual targets for 2008/09 Achievements April 2008 to March 2009
Number of education and training service
providers and productivity trainers accredited
26 55
Number of emerging entrepreneurs trained in
productivity improvement and competencies
1 800 910
Number of skills development facilitators trained
in productivity
120 78
Number of managers and workers trained to
enhance productivity competencies and mindsets
in private and public enterprises
530 569
Number of future forums established at
companies with turnaround solutions
120 105
65

3.6 Umsobomvu Youth Fund
The Umsobomvu Youth Fund’s key priorities include improving access to employment opportunitiesthrough the provision of career development information, counselling and the linking young peopleto employment opportunities; expanding support for entrepreneurial activity and self-employmentthrough the provision of entrepreneurship information and entrepreneurship training. The Fund alsoundertakes graduate development, facilitates young people’s access to scarce and critical skillstraining and engages young people in community service and voluntarism.
Progress made by the Umsobomvu Youth Fund on its workplan for 2008/09 is as reflected inTable 3.6
Table 3.6 Umsobomvu Youth Fund’s progress in 2008/09
1 April 2008 - 31 March 200966
Indicator Annual targets for 2008/09 Achievements April 2008 to March 2009
Number of youth advisory centres
(full service, points and kiosks)
288 151
Number of young people acquiring skills through
the NYS projects (category 1)
38 500 34 000
Number of unemployed graduates enrolled in
training programmes to improve their skills to
access employment opportunities
6 000 700
Value of business opportunities sourced R830 million R39 667 960
Number of jobs created or sustained through
SMMEs
14 400 12 980
Annual Report
Programme PerformanceProgramme 3: Employment and Skills Development Services/Human Resource Development

NB: Kindly note that the number of companies that have been assessed until 2008/09has been corrected. The 60 companies to be assessed in 2009/10 - 2012 has beenremoved because 106 companies have now been assessed against the top 100 JSElisted companies initially planned for.
Furthermore, in 2009/10, the Directorate will be focusing on conducting the follow-ups on the 106companies assessed in the previous 3 years, although some companies may still be assessed fromprovincial level as part of the process of building capacity in the provinces.
1 April 2008 - 31 March 200967
Indicator Programme
Past Current Projections
2005/06 2006/07 2007/08 2008/09 2009/10 2010/11 2011/12
Percentage of top 100
Johannesburg
Securities Exchange
(JSE) listed companies
assessed for
employment equity
Labour Policy
and Labour
Market
Programmes
- 6%
(6)
26%
(26)
74%
(74)
- - -
Annual Report
Programme PerformanceProgramme 4: Labour Policy and Labour Market Programmes

Social Insurance provides for the compensation of civil servants in cases of accidents or illnessessustained while on duty through the Compensation Fund. It also contributes to the UnemploymentInsurance Fund when neccessary.
Both the Compensation Fund and the Unemployment Insurance Fund publish their own AnnualReports in terms of the Public Finance Management Act.
1 April 2008 - 31 March 200968
Annual Report
Programme Performance
Programme 5: Social Insurance

NNational Skills Fund PerformanceThe National Skills Fund was established in 1999 in terms of the Skills Development Act,1998. Theprimary objective of the National Skills Fund is stipulated in the Skills Development Act, namely thatthe money in the NSF may be used only for the projects identified in the National SkillsDevelopment Strategy (NSDS) as national priorities or for such other projects related to theachievement of the purposes of the Act as the Director-General of the Department of Labourdetermines.
The NSF primarily provides funding and policy development in order to meet objectives of the NSDSfor 2005-2010.
Performance against NSDS 2005-2010
1 April 2008 - 31 March 200969
Goal Key performance
indicator
Target
(2008/09)
Performance results Reason for variance
1. Prioritising and
communicating critical
skills for sustainable
growth, development
and equity.
NSDS Success Indicator
1.2:
Information on critical
skills is widely available
to learners. Impact of
information
dissemination
researched, measured
and communicated in
terms of rising entry,
completion and
placement of learners.
The NSF will fund the
printing of the guide.
The NSF will fund the
training of career
guidance counsellors in
the use of the
information
[NSDS Lever 1.2].
The National Master
Scarce Skills List for
South Africa, 2008, was
updated and printed by
October 2008.
10 000 booklets were
printed and
disseminated at the
National Skills
Conference in October
2008 and to provincial
offices and labour
centres.
NSF budget was
available.
No funding was
requested from the NSF
for training of career
guidance counsellors.
Annual Report
Programme Performance
National Skills Fund

1 April 2008 - 31 March 200970
Goal Key performance
indicator
Target
(2008/09)
Performance results Reason for variance
2. Promoting and
accelerating quality
training for all in the
workplace.
NSDS Success Indicator
2.6:
From April 2005 to
March 2010 there is an
annually increasing
number of people who
benefit from incentivised
training for employment
or re-employment in
new investments and
expansion initiatives.
Training equity targets
achieved. Of number
trained, 100% to be SA
citizens.
1. Workplace Skills
Development Support
Programme (WSDSP)
effectively implemented
(10% increase on
previous year’s
beneficiary numbers
achieved).
1. Target ACHIEVED
Total No. of workers
trained increased 82%
during 2008/09 –
6 156 (2007/08 –
3 378)
New workers received
training – 2 069
(2007/08 – 2 368)
(Equity: Black – 88%,
Female – 38%.
2. BPO&O Training
Grant as part of DTI
Investment Incentive
Programme effectively
implemented (Process all
applications and claims
received within the
timeframes and
prescripts as agreed to
in the MoU)
[new programme since
July 2007].
All were SA Citizens.
45 SMEs benefited (53
claims paid)
Total expenditure –
R19,77 million.
Total new workers
benefiting since April
2005 – 10 934.
Target ACHIEVED.
All applications (8) were
processed of which 7
were approved.
R 60 million training
grants were committed
over a 3-year period
(100% of available
budget).
In total 12 440 workers
are targeted to benefit.
One claim was received,
processed and paid to
the amount to R1,6
million.
Annual Report
Programme Performance
National Skills Fund

1 April 2008 - 31 March 200971
Goal Key performance
indicator
Target
(2008/09)
Performance results Reason for variance
3. Promoting
employability and
sustainable livelihoods
through skills
development.
NSDS Success Indicator
3.1:
By March 2010, at least
450 000 unemployed
people are trained. This
training should
incrementally be quality
assured and by March
2010 no less than 25%
of the people undergo
accredited training. Of
those trained at least
70% should be placed in
employment,
self-employment or
social development
programmes including
EPWP, or should be
engaged in further
studies. Placement
categories each to be
defined, measured,
reported and
sustainability assessed.
NSF to provide funding
for the training of
unemployed
people -
● 90 000 unemployed
people trained.
● 63 000 (70%) placed
in employment, self-
employment or social
development
programmes, including
EPWP.
● 25% of training
quality assured.
Approved a budget of
R844 million for the
year.
Training targets not met
as only 15 169 people
were trained and
8 885 placed.
Accredited training –
22%.
Number trained for
EPWP projects –
10 390 (form part of
the numbers indicated
above).
Equity:
Blacks – 98%;
Women – 54%;
People with disabilities
(PWD) – 2%;
Youth – 61%.
Total expenditure on
training of unemployed
people came to
R 190 136 million.
Suspension of training
initiatives in provinces in
2008 due to SDFW
procurement procedure
misalignment with
Department of Labour
SCM-Policy.
SDFW. The procurement
process has since been
revised and new
operational procedures
approved.
NSDS Success Indicator
3.2:
By March 2010, at least
2 000 non-levy paying
enterprises, NGOs, CBOs
and Community-based
co-operatives supported
by skills development.
Impact of support on
sustainability measured
with a targeted 75%
success rate.
Monyetla Work
Readiness Pilot
Programme:
1 000 unemployed
people trained for the
Call Centre sector and
70% placed in
employment.
The NSF target – at
least 400 Community
Based Co-Operatives are
supported by skills
development.
Impact with effect from
1 April 2005 (NSDS):
Total unemployed
people trained under
SDFW –
338 414 + Monyetla
learners 1 129 =
339 543 (75,5% of
target)
Placed (of those
trained) – SDFW
226 006 + Monyetla
1 016 = 227 022
(66,8%)
Accredited training -
22% (average over 4
years).
Target marginally not
achieved, due to
unforeseen
circumstances.
NSF contribution:
367 Small Community
Based Co-Ops across all
provinces. ±4 000
Co-ops workers will
benefit from the skills
support arrangement.
3 MoAs affecting 33
co-ops were cancelled
due to non-compliance
to MoA conditions and
mis-management.
Annual Report
Programme Performance
National Skills Fund

1 April 2008 - 31 March 200972
Goal Key performance
indicator
Target
(2008/09)
Performance results Reason for variance
Equity targets are
Females – 65%; Blacks
– 95%; Youth – 41%;
PWD – 4%).
Total amount spent on
skills development –
R16,2 million (77% of
the budget amount of
R21 million).
NSDS Success Indicator
3.3:
By March 2010, at least
100 000 unemployed
people have participated
in ABET level
programmes of which at
least 70% have
achieved ABET level 4.
Targeted skills
development
programmes achieved:
● 40 000 ABET
Learners registered
by March 2009
● At least 20 000
ABET learners
complete programmes
by March 2009.
A total of 40 110
learners were registered
for ABET programmes.
A total of R119 million
was spent.
None of the 40 110
learners completed the
programme
A further 33 328 ABET
learners were registered
under the Strategic
Projects and
Discretionary Funding
Windows. Of these
27 194 completed their
programmes.
The cumulative total
number of ABET
learners since 2005 now
stands at 93 425
representing 93% of the
target of 100 000
learners by March 2010.
Learners could not
complete due to the
projects starting
mid-way through the
reporting year
Annual Report
Programme Performance
National Skills Fund

1 April 2008 - 31 March 200973
Goal Key performance
indicator
Target
(2008/09)
Performance results Reason for variance
4. Assisting designated
groups, including new
entrants to participate
in accredited work,
integrated learning and
work-based
programmes to acquire
critical skills to enter
the labour market and
self-employment.
NSDS Success Indicator
4.1:
By March 2010 at least
125 000 unemployed
people assisted to enter
and at least 50%
successfully complete
programmes, including
learnerships and
apprenticeships, leading
to basic entry,
intermediate and high
level scarce skills.
Impact of assistance
measured.
[Joint target of NSF and
SETAs].
● 16 000 unemployed
learners enter learning
programmes
(learnerships,
apprenticeships, etc.)
by March 2009.
● 8 000 unemployed
people complete
learning programmes
(learnerships,
apprenticeships, etc.)
● Funding of bursaries
in scarce skills:
- 4 500 undergraduate
bursaries awarded
- 1 500 post-graduate
bursaries awarded.
A total of 17 599
learners entered various
learning programmes on
scarce and critical skills.
A total of 4 080
completed programmes.
NSF funded the
awarding of 4 869
undergraduate bursaries
through the NSFAS.
A total of 997 post
graduate bursaries were
awarded through the
NRF.
The numbers reported
above contribute to the
overall target of
125 000 learners by
March 2010. The NSF
has contributed
R531million in grant
allocations to SETAs.
Due to the duration of
the learning programmes
it was not possible to
complete them within a
year.
5. Improving the
quality and relevance
of provision.
NSDS Success Indicator
5.4:
By March 2010, there is
an NSA constituency
based assessment of an
improvement in
stakeholder capacity and
commitment to the
National Skills
Development Strategy.
NSF to provide funding
for NSA constituency
stakeholders for
capacity building of
members.
ACHIEVED.
NSF availed R20 million
to the 18 constituencies
of the NSA.
Seven (7) constituency
organisations took up
the funding and 3 263
members benefited from
the training.
Total expenditure –
R12 195 million.
Annual Report
Programme Performance
National Skills Fund

1 April 2008 - 31 March 2009
Programme Performance
National Skills Fund
Annual Report
74
Project highl ights
Monyetla Work Readiness Project
This project was implemented in partnership with the Department of Trade and Industry in supportof the Business Process Outsourcing and Off-shoring (BPO&O) sector, as one of the top threepriority sectors to stimulate growth within the Accelerated Shared Growth Initiative (ASGI-SA). Thesector is identified for its potential to attract investment and create employment opportunities inthe economy.
The NSF made available an amount of R17,1 million to cover the costs of training 1 000unemployed people as entry level BPO agents using the Monyetla model. The Business Trustprovided R2,9 million for project design, implementation and evaluation.
This joint project focuses on six objectives that were identified as crucial to make South Africa afavourable location for BPO&O, specifically to:
● support the effective marketing of South Africa as a competitive BPO&O destination ● develop and deepen a pool of internationally competitive talent ● create an enabling environment of infrastructure and incentives ● assure the quality of the South Africa offering ● mobilise industry to be increasingly competitive in the promotion of South Africa as a centre for
value based off-shoring ● Optimise the impact on the second economy.
The availability of work-ready talent is one of the key factors considered by prospectiveinternational and national investors in the sector. Cross-sector research on the current trainingsituation led to the formulation of a skills development needs analysis with three objectives forfocused, rapid development of talent for the BPO&O sector, i.e.:
● to increase the pool of entry-level employable people● to accelerate the development of home-grown supervisors and managers by developing
supervisors, team leaders and managers through the skills development system● to ensure the ongoing development of a globally competitive talent pool by encouraging life-long
learning and training through the National Skills Development Strategy.
The scope of the pilot project was as follows:
● Provide 1 000 unemployed South Africans from the NSDS target group with entry-level skillsappropriate for the BPO&O sector
● Place 70% learners in employment on completion of the skills programme ● Enable successful learners to enter the Level 2 Contact Centre Learnership with 60 credits of
the 128 credits required ● Increase the pool of developed BPO&O talent by ensuring that one home- grown supervisor is
developed for every six Monyetla learners, using the levy-grant system that is managed bySector Education and Training Authorities.
Achievements of the project:
● A total of 1 307 young unemployed people benefitted by the training, i.e. 30% more than theoriginal target
● Of those that commenced the training (16 weeks, 60-credit skills programme) 1 129 completed(86%)
● Of those completing the training and found competent, 1 016 (90%) gained employment, ofwhich 740 were women and 276 men
● 368 were trained as supervisors

1 April 2008 - 31 March 2009
● 179 learners proceeded to complete the full Contact Centre Level 2 qualification (128 SAQAcredits). A further 200 learners are busy completing the full Contact Centre Level 2 qualification.
Workplace Ski l ls Development Support Programme Project
Invisible Card (Pty) Ltd, Somerset West in the Western Cape is one of 45 SME enterprises thatreceived training incentive grants from the NSF during the reporting period in support of the SmallMedium Enterprise Development Programme (SMEDP) incentive programme of the Department ofTrade and Industry.
A total of 70 newly appointed workers (32 Black males, 12 Black females, 12 White females,7 White males) received training in skills programmes. The training incentive grants amounted toR1 003 244 over a period of three years (1 July 2005 to 30 June 2008). The average cost perlearner is R14 332 per learner. The training done was as follows:
KwaZulu-Natal Strategic Project
The project is implemented in partnership with the Provincial Government of the KwaZulu-NatalProvince. The project would be implemented over a three-year period spanning from January 2007to December 2009. The aim of the project is to deliver appropriate skills and knowledge (bothtechnical and soft) in order that beneficiaries can participate fully in economic activity both withinsecond and first economies. The objectives of the projects are aimed at addressing the following:
● Reducing challenges of illiteracy and unemployment, especially among women, youth and peoplewith disabilities
● Alleviating poverty ● Developing scarce skills ● Developing the SMME sector through cooperatives ● Improving economic growth.
Annual Report
Programme Performance
National Skills Fund
● Operators trained in Health and Safety…………………………………. 8● Operators trained in First Aid……………………………………………… 7● Cutting programme (operators)…………………………………..………. 6● Operators trained in Integrated Manufacturing Programme…… 55● Packaging and dispatch…………………………………………….. 14● Exporting methods and legal requirements …………………………….. 5● Quality control ………………………………………………………… 60● Productivity awareness ……………………………………………… 60● Supervisors in conflict mediation ………………………………………… 6● Storekeeping and stock control ……………………………….………… 5● Supervisors in operational management ………………………………… 9● Trainers (Train the trainer course) …………………………….………... 6
75

Achievements of the project
The project planned to reach a total of 17 520 learners pursuing various learning programmesincluding ABET. By March 2009 (27 months into the implementation period) the project has alreadyexceed its target. The table below provides a summary of this achievement.
The ABET Programme in KZN was implemented as part of the Masifundisane Literacy Campaign. Thecampaign targets those people who never had the opportunity to go to school and consequentlyhave low levels of literacy.
Participation into this ABET project exceeded expectations as the result indicate but one highlightof this project is the story of Gogo Alice who could not read or write before joining the programme.Gogo Alice has overcome this challenge.
1 April 2008 - 31 March 200976
Name of programme Target learners Achieved by March 2009
Learnerships 580 507
Apprenticeships 240 40
ABET 16 700 27 194
Total 17 520 27 741
Annual Report
Programme Performance
National Skills Fund

1 April 2008 - 31 March 200977
We are pleased to present our report for the financial year ended 31 March 2009.
Audit Committee Members and attendance:The Audit Committee consists of the members listed hereunder and should meet atleast three times per annum as per its approved terms of reference. During the currentyear seven meetings were held.
Name of Member Number of meetings attended
Ms. MM Mahlabe (Chairperson), appointed 23 May 2008 5Mr. NK Mlamla 6Mr. K Buthelezi 4Mr. TS Mageza, appointed 23 May 2008 3
Audit Committee Responsibil ityWe report that we have adopted appropriate formal terms of reference in our charter in line withthe requirements of Section 38(1)(a) of the Public Finance Management Act, No 1 of 1999 andTreasury Regulation 3.1. We further report that we conducted our affairs in compliance with thischarter.
Effectiveness of internal controlDepartment of Labour
The system of internal control was not entirely effective for the year under review. During the yearunder review, several deficiencies in the system of internal control and deviations were reported bythe internal auditors and the Auditor-General of South Africa. In certain instances, the mattersreported previously have not been satisfactorily addressed.
National Skills Fund
The system of internal control was not entirely effective for the year under review. During the yearunder review, several deficiencies in the system of internal control and deviations were reported bythe internal auditors and the Auditor-General of South Africa.
Sheltered Employment Factories
The system of internal control was not entirely effective for the year under review. During the yearunder review, minor deficiencies in the system of internal control and deviations were reported bythe internal auditors and the Auditor-General of South Africa.
The qual ity of in year management and monthly/quarterly reportssubmitted in terms of the PFMAWe are satisfied with the content and quality of monthly and quarterly reports prepared and issuedby the Acting Accounting Officer of the Department during the year under review.
Annual Report
Section 3Report of the Audit Committee

1 April 2008 - 31 March 200978
Annual Report
Evaluation of Financia l StatementsWe have:● Reviewed and discussed the audited Annual Financial Statements to be included in the annual
report with the Auditor-General of South Africa and the Acting Accounting Officer● Reviewed the Auditor-General of South Africa's management report and management's response
thereto● Reviewed changes in accounting policies and practices● Reviewed the Department's compliance with legal and regulatory provisions● Reviewed significant adjustments resulting from the audit.
We concur with and accept the Auditor-General of South Africa 's report on the Annual FinancialStatements and are of the opinion that the audited Annual Financial Statements should beaccepted, read together with the report of the Auditor-General of South Africa.
Internal AuditWe are satisfied that the internal audit function has addressed the risks pertinent to theDepartment in its audits.
We have however noted that due the loss of staff, only 73% of the approved annual internal auditplan could be executed.
We are still concerned regarding the lack of capacity to perform Information Technology audits andthe many positions where there are people acting and the lack of staff capacity.
Auditor-General of South AfricaWe have met with the Auditor-General of South Africa to ensure that there are no unresolvedissues.
Addit ional commentsThe Audit Committee has noted with concern the issues raised in the report of the Auditor-General.The Audit Committee has tasked management to prepare a comprehensive plan to indicate how theDepartment will address the issues and report progress regularly to the Committee. Managementhas embarked on the process of addressing these issues with immediate effect and these includeamong others:
● Verificaton of performance information against the Department’s Business Plan and BranchBusiness Plans
● Physicial verification of assets against the asset register.
The delays in receiving management’s comments on internal and external audit reports have beennoted by the Audit Committee and management has made a commitment to address theseshortcomings.
Chairperson of the Audit Committee
Date: 20/08/09

Content Page
Report of the Auditor-General 80
Report of the Accounting Officer 88
Appropriation Statement 105
Notes to the Appropriation Statement 115
Statement of Financial Performance 118
Statement of Financial Position 119
Statement of Changes in Net Assets 120
Cash Flow Statement 121
Accounting Policies 122
Notes to the Annual Financial Statements 130
Disclosures Notes to the Annual Financial Statements 139
Annexures 156
Department of Labour - Vote 15
Annual Financial Statements for the year ended 31 March 2009
1 April 2008 - 31 March 200979
Annual Report
Section 4Annual Financial Statements

REPORT OF THE AUDITOR-GENERAL TO PARLIAMENT ON THE FINANCIAL STATEMENTSAND PERFORMANCE INFORMATION OF VOTE NO. 15: DEPARTMENT OF LABOUR FOR THEYEAR ENDED 31 MARCH 2009
REPORT ON THE FINANCIAL STATEMENTS
Introduction
1. I have audited the accompanying financial statements of the Department of Labour whichcomprise the appropriation statement, the statement of financial position as at 31 March 2009,and the statement of financial performance, the statement of changes in net assets and thecash flow statement for the year then ended, a summary of significant accounting policies andother explanatory notes, and the accounting officer’s report, as set out on pages 88 to 162.
The accounting officer’s responsibility for the financial statements
2. The accounting officer is responsible for the preparation and fair presentation of these financialstatements in accordance with the modified cash basis of accounting determined by the NationalTreasury as set out in accounting policy note 1.1 and in the manner required by the PublicFinance Management Act, 1999 (Act No. 1 of 1999) (PFMA) and for such internal control as theaccounting officer determines is necessary to enable the preparation of financial statements thatare free from material misstatement, whether due to fraud or error.
The Auditor-General’s responsibility
3. As required by section 188 of the Constitution of the Republic of South Africa, 1996 read withsection 4 of the Public Audit Act, 2004 (Act No. 25 of 2004) (PAA) my responsibility is toexpress an opinion on these financial statements based on my audit.
4. I conducted my audit in accordance with the International Standards on Auditing read withGeneral Notice 616 of 2008, issued in Government Gazette No. 31057 of 15 May 2008. Thosestandards require that I comply with ethical requirements and plan and perform the audit toobtain reasonable assurance about whether the financial statements are free from materialmisstatement.
5. An audit involves performing procedures to obtain audit evidence about the amounts anddisclosures in the financial statements. The procedures selected depend on the auditor’sjudgement, including the assessment of the risks of material misstatement of the financialstatements, whether due to fraud or error. In making those risk assessments, the auditorconsiders internal control relevant to the entity’s preparation and fair presentation of thefinancial statements in order to design audit procedures that are appropriate in thecircumstances, but not for the purpose of expressing an opinion on the effectiveness of theentity’s internal control. An audit also includes evaluating the appropriateness of accountingpolicies used and the reasonableness of accounting estimates made by management, as well asevaluating the overall presentation of the financial statements.
6. I believe that the audit evidence I have obtained is sufficient and appropriate to provide a basisfor my audit opinion.
Basis for qualified opinion
Capital assets
7. The Department established an Asset Management Unit in March 2008 to address thedeficiencies identified and reported in the prior year audit report. However, the audit stillrevealed amongst others the following significant shortcomings in the management and controlof these assets and the asset register.
● A number of assets on the asset register were included at incorrect values.
1 April 2008 - 31 March 200980
Annual Report
Department of Labour - Vote 15
Report of the Auditor-General for the year ended 31 March 2009

● The asset register was not adequately maintained in accordance with the requirements of theNational Treasury Regulations.
● The reconciliation of the prior year balance of R106 million (2007: 123.3 million) as disclosed innote 30 and note 29 to the financial statements with the asset registers for the financial yearsending 31 March 2007 and 2008 is still outstanding.
Due to the discrepancies noted above, I was unable to verify the valuation, existence, completeness,rights and obligation of the property, plant and equipment amounting to R110, 5 million as per note28 to the financial statement.
PPublic Private Partnership (PPP) assets
8. The Department does not maintain an adequate asset register in accordance with therequirements of National Treasury, which resulted in the following significant shortcomings:
● Sufficient and appropriate audit evidence for the adjustments to the prior year closing balanceamounting to R14, 0 million as disclosed in note 26 to the financial statements could not besubmitted for audit.
● Not all current year’s additions to the PPP assets were accounted for in the asset register.
Consequently, I was unable to obtain adequate assurance relating to valuation, existence andcompleteness of the PPP assets amounting to R134,9 million as disclosed in note 26 to the financialstatement.
Qualified opinion
9. In my opinion, except for the possible effects of the matters described in the Basis for qualifiedopinion paragraphs, the financial statements present fairly, in all material respects, the financialposition of the department of Labour as at 31 March 2009 and its financial performance and itscash flows for the year then ended, in accordance with the modified cash basis of accountingand in the manner required by the PFMA.
Basis of accounting
10. The Department of Labour’s policy is to prepare financial statements on a modified cash basis ofaccounting determined by the National Treasury, as set out in accounting policy note 1.1 to thefinancial statements.
Other matters
I draw attention to the following matters that are related to my responsibilities in the audit of thefinancial statements:
Subsequent events
11. Following the State of the Nation address in Parliament by the President where he announced hisintention to perform a macro reorganisation of functions within Government, the currentstructure of the Department of Labour will change to the extent that the skills developmentfunction will shift to the Department of Higher Education and Training.
Non-compliance with applicable legislation
12. The following instances of non-compliance occurred during the year under review:
Public Finance Management Act
1 April 2008 - 31 March 200981
Annual Report
Department of Labour - Vote 15
Report of the Auditor-General for the year ended 31 March 2009

● The Department did not maintain an effective, efficient and transparent system of financial andrisk management and internal control as required by section 38 (1)(a)(i) of the PFMA, astransfer payments were made to entities without a service level agreement in place.
● The accounting officer of the Department did not ensure that proper control systems exist forassets and that preventative mechanisms are in place to eliminate theft, losses, wastage andmisuse as required by section 38(1) (d) of the PFMA.
● The accounting officer did not take effective and appropriate steps to prevent irregularexpenditure disclosed in note 23 to the financial statements as is required by section 38(1) (c)of the PFMA.
Treasury Regulations
● The Department did not have an approved Fraud Prevention Plan as required by sections 3.2.1and 27.2.1 Treasury Regulation.
● The accounting officer did not take reasonable steps to recover debt before debts owed to theState were written off as irrecoverable debts as required by Treasury Regulations 11(4) (a)
● The Department of Labour did not perform regular assessment of Supply Chain managementperformance to identify whether the system is functioning as is required by Treasury Regulations16A3.2.
● The performance contract of the chief financial officer was not signed by the chief financialofficer and the accounting officer as acceptance of his responsibilities as is required by TreasuryRegulations 2.1.3.
Skills Development Levies Act
● Department of Labour does not have approved controls in place to verify the accuracy andcompleteness of levies, interest and penalties transferred to the SETAs and National Skills Fundas is required by practice note 1 of 2008 of the SDL Act.
Governance framework
13. The governance principles that impact on the auditor’s opinion on the financial statements arerelated to the responsibilities and practices exercised by the accounting officer and executivemanagement and are reflected in the internal control deficiencies and key governanceresponsibilities addressed below:
Internal control deficiencies
14. Section 38(1)(a)(i) of the PFMA states that the accounting officer must ensure that theDepartment of Labour has and maintains effective, efficient and transparent systems offinancial and risk management and internal control. The table below depicts the root cause thatgave rise to deficiencies in the system of internal control which led to the qualified opinion. Theroot causes are categorised according to the five components of an effective system of internalcontrol. (The number listed per component can be followed with the legend below the table.) Insome instances deficiencies exist in more that one internal control component.
1 April 2008 - 31 March 200982
Annual Report
Department of Labour - Vote 15
Report of the Auditor-General for the year ended 31 March 2009

OOverall conclusion on financial management based on the root causes
15. Based on the above basis for qualification, the Department of Labour does not have anadequate control environment in place to ensure that assets in the assets register are complete,accurate, do exist and belong to the Department. Furthermore, the Department did not havecapacity to implement corrective action relating to previous year’s findings on assets.
1 April 2008 - 31 March 200983
Legend
CE = Control environment
The organisational structure does not address areas of responsibility and lines of reporting to support effective control
over financial reporting.
1
Management and staff are not assigned appropriate levels of authority and responsibility to facilitate control over
financial reporting.
2
Human resource policies do not facilitate effective recruitment and training, disciplining and supervision of personnel. 3
Integrity and ethical values have not been developed and are not understood to set the standard for financial reporting. 4
The accounting officer/accounting authority does not exercise oversight responsibility over financial reporting and
internal control.
5
Management’s philosophy and operating style do not promote effective control over financial reporting. 6
The entity does not have individuals competent in financial reporting and related matters. 7
RA = Risk assessment
Management has not specified financial reporting objectives to enable the identification of risks to reliable financial
reporting.
1
The entity does not identify risks to the achievement of financial reporting objectives. 2
The entity does not analyse the likelihood and impact of the risks identified. 3
The entity does not determine a risk strategy/action plan to manage identified risks. 4
The potential for material misstatement due to fraud is not considered. 5
Par. no. Basis for qualified opinion CE RA CA IC M
7 Capital assets 1, 5 1, 2, 5 3, 4 3 1
8 Public, Private Partnership assets 1, 5 1, 2, 5 3, 4 3 1
Annual Report
Department of Labour - Vote 15
Report of the Auditor-General for the year ended 31 March 2009

Key governance responsibilities
16. The PFMA tasks the accounting officer with a number of responsibilities concerning financial andrisk management and internal control. Fundamental to achieving this is the implementation ofkey governance responsibilities, which I have assessed as follows:
1 April 2008 - 31 March 200984
Annual Report
Department of Labour - Vote 15
Report of the Auditor-General for the year ended 31 March 2009
CA = Control activities
There is inadequate segregation of duties to prevent fraudulent data and asset misappropriation. 1
General information technology controls have not been designed to maintain the integrity of the information system and
the security of the data.
2
Manual or automated controls are not designed to ensure that the transactions have occurred, are authorized, and are
completely and accurately processed.
3
Actions are not taken to address risks to the achievement of financial reporting objectives. 4
Control activities are not selected and developed to mitigate risks over financial reporting. 5
Policies and procedures related to financial reporting are not established and communicated. 6
Realistic targets are not set for financial performance measures, which are in turn not linked to an effective reward
system.
7
IC = Information and communication
Pertinent information is not identified and captured in a form and time frame to support financial reporting. 1
Information required to implement internal control is not available to personnel to enable internal control responsibilities. 2
Communications do not enable and support the understanding and execution of internal control processes and
responsibilities by personnel.
3
M = Monitoring
Ongoing monitoring and supervision are not undertaken to enable an assessment of the effectiveness of internal control
over financial reporting.
1
Neither reviews by internal audit or the audit committee nor self -assessments are evident. 2
Internal control deficiencies are not identified and communicated in a timely manner to allow for corrective action to be
taken.
3
No. Matter Y N
Clear trail of supporting documentation that is easily available and provided in a timely manner
1. No significant difficulties were experienced during the audit concerning delays or the availability of
requested information.
✓
Quality of financial statements and related management information
2. The financial statements were not subject to any material amendments resulting from the audit. ✓

1 April 2008 - 31 March 200985
Annual Report
Department of Labour - Vote 15
Report of the Auditor-General for the year ended 31 March 2009
No. Matter Y N
3. The annual report was submitted for consideration prior to the tabling of the auditor’s report. ✓
Timeliness of financial statements and management information
4. The annual financial statements were submitted for auditing as per the legislated deadlines section
40/55 of the PFMA
✓
Availability of key officials during audit
5. Key officials were available throughout the audit process. ✓
Development and compliance with risk management, effective internal control and governance practices
6. Audit committee
• The Department of Labour had an audit committee in operation throughout the financial year. ✓
• The audit committee operates in accordance with approved, written terms of reference. ✓
• The audit committee substantially fulfilled its responsibilities for the year, as set out in
section 77 of the PFMA and Treasury Regulation 3.1.10/27.1.8
✓
7. Internal audit
• The Department of Labour had an internal audit function in operation throughout the financial
year.
✓
• The internal audit function operates in terms of an approved internal audit plan. ✓
• The internal audit function substantially fulfilled its responsibilities for the year, as set out in
Treasury Regulation 3.2/27.2
✓
8. There are no significant deficiencies in the design and implementation of internal control in respect
of financial and risk management.
✓
9. There are no significant deficiencies in the design and implementation of internal control in respect
of compliance with applicable laws and regulations.
✓
10. The information systems were appropriate to facilitate the preparation of the financial statements. ✓
11. A risk assessment was conducted on a regular basis and a risk management strategy, which
includes a fraud prevention plan, is documented and used as set out in Treasury Regulation
3.2/27.2
✓
12. Delegation of responsibilities are in place, as set out in section 44/56 of the PFMA. ✓
Follow-up of audit findings
13. The prior year audit findings have been substantially addressed. ✓
14. SCOPA resolutions have been substantially implemented. ✓

17. The Department does not have sufficient capacity to implement controls to manage andmonitor the assets of the Department and carry out the internal audit responsibilities.
Investigations
18. Investigations were conducted during the period under review relating to fraudulent activitieswith regard to unauthorised payments. At the time of this report, further investigations werestill underway.
REPORT ON OTHER LEGAL AND REGULATORY REQUIREMENTS
Report on performance information
19. I have reviewed the performance information as set out on pages 26 to 76.
The accounting officer’s responsibility for the performance information
20. The accounting officer has additional responsibilities as required by section 40(3)(a) of thePFMA to ensure that the annual report and audited financial statements fairly present theperformance against predetermined objectives of the Department of Labour.
The Auditor-General’s responsibility
21. I conducted my engagement in accordance with section 13 of the PAA read with General Notice616 of 2008, issued in Government Gazette No. 31057 of 15 May 2008.
22. In terms of the foregoing my engagement included performing procedures of an audit nature toobtain sufficient appropriate evidence about the performance information and related systems,processes and procedures. The procedures selected depend on the auditor’s judgement.
23. I believe that the evidence I have obtained is sufficient and appropriate to provide a basis forthe audit findings reported below.
Findings on performance information
Non-compliance with regulatory requirements
Content of strategic plan
24. The strategic plan of the Department of Labour did not include the measurable objectives,expected outcomes, programme outputs, indicators (measures) and targets of the entity's
1 April 2008 - 31 March 200986
Annual Report
Department of Labour - Vote 15
Report of the Auditor-General for the year ended 31 March 2009
No. Matter Y N
Issues relating to the reporting of performance information
15. The information systems were appropriate to facilitate the preparation of a performance report
that is accurate and complete.
✓
16. Adequate control processes and procedures are designed and implemented to ensure the accuracy
and completeness of reported performance information.
✓
17. A strategic plan was prepared and approved for the financial year under review for purposes of
monitoring the performance in relation to the budget and delivery by the Department of Labour
against its mandate, predetermined objectives, outputs, indicators and targets Treasury Regulations
5.1, 5.2 and 6.1
✓
18. There is a functioning performance management system and performance bonuses are only paid
after proper assessment and approval by those charged with governance.
✓

programmes, as required by Treasury Regulation 5.2.3(d).
LLack of effective, efficient and transparent systems and internal controls regardingperformance management
25. The accounting officer did not ensure that the Department of Labour has and maintains aneffective, efficient and transparent system and internal controls regarding performancemanagement, which describe and represent how the institution’s processes of performanceplanning, monitoring, measurement, review and reporting will be conducted, organised andmanaged, as required in terms of section 38(1)(a)(i) and (b) of the PFMA.
Usefulness and reliability of reported information
26. The following criteria were used to assess the usefulness and reliability of the information on theDepartment’s performance with respect to the objectives in its strategic plan:
● Consistency: Has the Department reported on its performance with regard to its objectives,indicators and targets in its approved strategic plan?
● Relevance: Is the performance information as reflected in the indicators and targets clearlylinked to the predetermined objectives and mandate. Is this specific and measurable, and is thetime period or deadline for delivery specified?
● Reliability: Can the reported performance information be traced back to the source data ordocumentation and is the reported performance information accurate and complete in relation tothe source data or documentation?
The following audit findings relate to the above criteria:
Inconsistently reported information
27. The Department of Labour has not reported on its performance with regard to its objectives,indicators and targets as per the approved strategic plan. However, the Departmentconsistently reported on its objectives, indicators and targets as per the ENE.
APPRECIATION
28. The assistance rendered by the staff of the Department of Labour during the audit is sincerelyappreciated.
Pretoria
2 August 2009
1 April 2008 - 31 March 200987
Annual Report
Department of Labour - Vote 15
Report of the Auditor-General for the year ended 31 March 2009

Report of the Accounting Officer to the Executive Authorityand Parliament of the Republic of South Africa.
11. General review of the state of financial affairs The aim of the Department of Labour is to reduce unemployment, poverty and inequality, throughpolicies and programmes developed in consultation with social partners, which are aimed at;improved economic efficiency and productivity, skills development and employment creation; soundlabour relations; eliminating inequality and discrimination in the workplace and alleviating poverty inthe workplace; enhancing occupational health and safety awareness and compliance in theworkplace; as well as nurturing the culture of acceptance that worker rights are human rights.
Key pol icy developments and legis lat ive changes, s ignificant eventsthat have taken place during the year and major projects undertakenor completed during the year
The Department has prioritised the following areas over the MTEF period:
Decent work
The draft Decent Work Country Programme was developed in collaboration with the InternationalLabour Organisation (ILO) and in consultation with social partners. The programme focuses onstrengthening support for existing skills development and employment services programmes inspecific areas and on formulating new initiatives to deal with labour market challenges, especially inrelation to creating employment and alleviating poverty. The four pillars of the Decent Work agendaare: fundamental principles and rights at work and international labour standards, employment andincome opportunities, social dialogue and tripartism (collaboration between government, tradeunions and employers), and social protection and social security. These will be dealt with in thecontext of related government reform processes and the Department's constitutional obligations.
Occupational health and safety
The draft framework document which gives effect to the integration of occupational health andsafety and compensation competencies across government was finalised in 2008. Both the draftNational Occupational Health and Safety Bill and the policy were developed. The main objective ofthe policy is to reduce the number of work related accidents and diseases by promoting a culture ofprevention. The secondary objective is to ensure equitable medical, rehabilitation and compensationbenefits for victims of work-lated accidents and diseases.
Skil ls development
The 2008 Skills Development Amendment Act will bring about a number of developments, including:
Formally establishing the Quality Council for Trades and Occupations (which will have the samestatus as the Council for Higher Education and the Umalusi Council for General and FurtherEducation) under the Ministry of Labour, establishing Productivity SA, listing the National Skills Fundas a public entity, introducing additional functions to the Institute for the National Development ofLearnerships, Employment Skills and Labour Assessments (INDLELA) to moderate artisanassessments; expanding the provision of employment services to work-seekers; and introducing aregister of artisans. These developments will: improve the quality of training, including moreeffective workplace learning, improve and sustain productivity in both the private and publicsectors, which will save jobs and contribute to economic growth, improve the operational efficiencyof the National Skills Fund to train more unemployed people, in line with national skills developmentstrategy targets, provide increased access to learners for trade assessment, and professionalise andpromote the training of artisans in response to labour market demands.
1 April 2008 - 31 March 200988
Annual Report
Department of Labour - Vote 15
Report of the Accounting Officer for the year ended 31 March 2009

The Department has also proposed certain amendments to the Income Tax Act (1962), aimed atproviding equitable employer tax allowances for taking on long-term learnerships.
EEmployment services system
The employment services system, developed in line with international best practice standards andInternational Labour Organisation conventions, includes an IT system to assist the Department toprovide a public employment service by registering work-seekers and placement opportunities andproviding job matching services for potential employers and work-seekers. The system will helpgovernment to deal with unemployment, generate useful statistics, and support social securityfunctions by integrating social insurance services. The system will also support: registration, careerguidance and counselling services, recruitment and selection services, skills development services,information services, and special services, which include services provided to special interest groupslike people with disabilities, retrenched employees and ex-offenders.
It will position labour centres to improve matching supply and demand in the local labour market,and will align provincial skills development plans and interventions with provincial growth anddevelopment strategies.
Spending trends
Excluding direct charges against the National Revenue Fund, expenditure decreased at a rate of15.46%, from R1.94 billion in 2007/08 to R1.64 billion in 2008/09. This was mainly due to aonce-off allocation of R400 million to the Umsobomvu Youth Fund, which was used to facilitateyouth development and employment creation.
Direct charges against the National Revenue Fund provide for the transfer of skills developmentlevies to the Sector Education and Training Authorities and the National Skills Fund, which isexpected to grow from R7.2 billion in 2008/09 to R9.1 billion in 2011/12, at an average annualrate of 8.3%. Direct charges are included under transfers and subsidies.
Expenditure in the Employment and Skills Development Services/Human Resources Developmentprogramme excluding the once-off allocation of R400 million to the Umsobomvu Youth Fundincreased at an average annual rate of 15%, from R117.4 million in 2005/06 to R172.5 million in2008/09, and is expected to increase to R572.5 million in 2011/12, over the MTEF period, due tothe additional allocation of R996.4 million to the Umsobomvu Youth Fund.
Between 2005/06 and 2008/09, expenditure on the Labour Policy and Labour Market Programmesgrew at an average annual rate of 10.4% due to additional allocations to:
● the Commission for Conciliation, Mediation and Arbitration subprogramme for increased capacityat the commission
● the Sheltered Employment Factories subprogramme for a provident fund for wage workers andthe salary alignment of staff at the sheltered employment factories.
Spending on compensation of employees grew at an average annual rate of 8.56% between2005/06 and 2008/09. Expenditure on goods and services is anticipated to grow at an averageannual rate of 2.8%, from R575.6 million in 2008/09 to R638.6 million in 2011/12, due to costcontainment measures.
Over the MTEF period, expenditure on payments for capital assets is expected to increase, fromR12.1 million in 2008/09 to R15.9 million in 2011/12, because projects at INDLELA have beensuspended as a result of ongoing concerns about the dolomite ground structure in the area. Theproject will start again, pending an investigation by the Department of Public Works.
The 2009 Budget provides additional allocations over the MTEF period of R320.7 million (2009/10),R358.4 million (2010/11) and R375.4 million (2011/12), mainly for:
1 April 2008 - 31 March 200989
Annual Report
Department of Labour - Vote 15
Report of the Accounting Officer for the year ended 31 March 2009

● the Umsobomvu Youth Fund (R303 million, R342 million and R356.4 million) ● personnel inflation adjustments (R18.9 million, R17 million and R17.5 million) ● capital inflation adjustments (R1.8 million, 1.4 million and R1.5 million).
SSavings and reprior it isation
The Department has identified efficiency savings and cost containment initiatives totallingR204 million over the MTEF period, across all programmes in the following items:
● R14.6 million in compensation of employees due to savings on funded vacancies ● R150.1 million in goods and services, including travel and subsistence, contractors, inventory,
food and food supplies, computer services and consultants ● R27.2 million in departmental agencies and accounts, specifically the allocation to the
Compensation Fund ● R12.1 million in machinery and equipment due to the suspension of projects at INDLELA.
Infrastructure spending
Infrastructure spending grew at an average annual rate of 70.6% between 2005/06 and 2008/09,rising from R5.5 million to R27.3 million, due to the construction of labour centres and provincialoffices at Bochum, Jane Furse, Taung, Temba, Bronkhorstspruit, Garankuwa, Rustenburg, MountAyliff, Mamelodi, Mdantsane, Durban and Lusikisiki. These projects were registered at theDepartment of Public Works and are in various stages of development.
Funding over the MTEF period for projects in the design and tender recommendation stagesamounts to R2.6 million in 2009/10, R3.8 million in 2010/11 and R4 million in 2011/12. The newprojects arise because lease contracts have expired and no accommodation that meets Departmentof Public Works requirements is available. Several renovation and maintenance programmes forprovincial offices and labour centres were registered by the Department of Public Works, withfunding for these amounting to R25.5 million in 2010/11 and R26.8 million in 2011/12.
Virement:
Programme 1
● R3 million virement approved by National treasury to programme 4 for Strengthening of CivilSociety which is a Transfer Payment (Departmental Agencies and Accounts), from that of Goodsand Services under Programme: Administration for the 2008/09 financial year. Refer to thenotes of the Appropriation Statement.
Programme 3
● R27.960 million was shifted to Programme 4; Sheltered Employment Factories, broken down asfollows:
– R10.96 million from Compensation of Employees, because not all vacant posts could befilled as planned. Therefore these funds will be taken to Repairs and Maintenanceprogrammes (RAMP) at Sheltered Employment Factories in Programme 4
– Due to vacancy of some posts, utilisation of the Goods and Services budget has been lowerthan expected, therefore R9 million was shifted from Goods and Services
– R8 million was shifted from Payment for Capital Assets due to the Machinery and Equipmentbudget that could not be exhausted due to the delays in procurement processed by theDepartment of Public Works (DPW), has been shifted to Sheltered Employment Factories(SEF) in Programme 4 to defray R14 million required to resolve liquidity issues.
1 April 2008 - 31 March 200990
Annual Report
Department of Labour - Vote 15
Report of the Accounting Officer for the year ended 31 March 2009

● R13 million virement was made to Productivity SA from the Department’s allocation. Aturnaround plan was developed to reduce the deficit incurred in the 2007/08 financial year.National Treasury proposed that the Department consider the approval of a cash injection as oneof the options to address this situation. Application for this cash injection was then drawn up bythe Department and was approved by the National Treasury. The turnaround plan reflected ashortfall of R4.1million, towards off-setting the envisaged deficit. However, as agreed indeliberations with the National Treasury, it was essential that the Entity should have a reservefund, hence the request for an additional R9 million. The ESDS and HRD Branch projectedR8 million under-expenditure on Goods and Services due to delays in the QCTO establishment aswell as in contracting of consultants for services at INDLELA. An amount of R3.5 million was thensourced from the projected under-expenditure on compensation of employees, brought about bythe delays in filling vacant posts resulting from staff turnover, and R1.5 million from the CAPEXsaving due to procurement delays by the DPW. The total amount of R13 million was then madeavailable for transfer to Productivity SA.
PProgramme 4
Total funding required by Programme 4 was R37.593 million. Please note that this was approved byNational Treasury in the Appropriation Statement.
Virement appl ied
– R14 million required to address critical liquidity facing Sheltered Employment Factories (SEF)was shifted from Programme 3
– R6.4 million required to address Provident and Wage issues, was taken from savings undergoods and services within the Programme
– R17.193 million was required for Repairs and Maintenance programmes (RAMP) at SEF; ofthese R13.96 million was sourced from Programme 3 and R3.233 million was reprioritisedwithin Programme 4.
Reasons for under-spending
The Department has recorded expenditure to the value of R 1 642 841 245.55 against its finalallocation of R1 747 606 000.00. This calculates to an under-spending of R104 764 754.45 or5.99%.
In respect of current payments, the under-spending can mainly be attributed to unfilled vacanciesand the concomitant under-spending on goods and services.
Any other material matter
Irregular expenditure of R716 000.00 has been incurred as disclosed in note 23 of the 2008/09Annual Financial Statements.
2. Services rendered by the Department 2.1 List of services rendered:
Programme 1: AdministrationConduct the overall management of the Department and provide strategic support and advisoryservices.
Programme 2: Service DeliveryImplement and monitor Department’s policies and programmes at provincial offices and labourcentres.
1 April 2008 - 31 March 200991
Annual Report
Department of Labour - Vote 15
Report of the Accounting Officer for the year ended 31 March 2009

1 April 2008 - 31 March 2009
Programme 3: Employment and Skil ls Development Services/HumanResource DevelopmentContribute to employment creation and skills development by promoting and monitoring theachievement of the objectives of the National Skills Development Strategy and the National HumanResource Development Strategy.
Programme 4: Labour Po licy and Labour Market ProgrammesEstablish an equitable and sound labour relations environment and promote South Africa’s interestsin international labour matters through research, analysing and evaluating labour policy, andproviding statistical data on the labour market, including providing support to the institutions thatpromote social dialogue.
Programme 5: Socia l InsuranceProvide for administrative and other support services to the Unemployment Insurance Fund (UIF)and the Compensation Fund (CF), and manage government’s contribution to the activities of theseFunds.
2.2 Tariff pol icy:
Tariffs for services rendered at INDLELA were approved by National Treasury.
2.3 Inventories:
The total inventories on hand at year-end amounts to R6 319 395.98.
3. Capacity constraintsVacancies in the Department placed a strain on its capacity to effectively deliver its services.The Department noted that control procedures need to be implemented to improve recruitmentprocesses. The vacancy rate is 17.23% as at 31 March 2009. The reasons why staff leave theDepartment (including the National Skills Fund) are established through exit interviews and in mostcases, these are related to better remuneration elsewhere. As previoulsy reported, the Departmentadopted a policy on career management and retention in an attempt to curb the high turnover rateof staff.
4. Util isation of donor fundsThe Department, mainly ESDS and Employment Services, received Technical Assistance from theGerman Technical Co-operation Assistance programme overseen by the National Treasury.
5. Public entitiesThe following public entities listed in Schedule 3 of the Public Finance Management Act, No. 1 of1999 reported to the Minister of Labour, and separate Annual Reports and Financial Statements arepublished independently:
● Commission for Conciliation, Mediation and Arbitration (CCMA) ● Compensation Fund (CF) ● National Economic Development and Labour Council (NEDLAC) ● Productivity South Africa (PSA) ● Sectoral Education and Training Authorities (SETAs) ● Unemployment Insurance Fund (UIF)
Department of Labour - Vote 15
Report of the Accounting Officer for the year ended 31 March 2009
Annual Report
92

1 April 2008 - 31 March 2009
● Umsobomvu Youth Fund (UYF).
Commission for Concil iat ion, Mediation and Arbitration (CCMA)
The CCMA was established in terms of section 112 of the Labour Relations Act, 1995 (LRA). TheCommission’s functions are to:
● Attempt to resolve disputes through conciliation and arbitration ● Assist in the establishment of workplace forums ● Compile and publish information and statistics about its activities ● Advise a party on the procedure to follow in respect of a dispute in terms of the Act ● Assist a party to obtain legal advice, assistance or representation in respect of a dispute ● Offer to resolve a dispute that has not been referred to the Commission through conciliation ● Conduct, oversee or scrutinise any election or ballot of a registered trade union or registered
employers’ organisation if requested to do so ● Publish guidelines in relation to any matter dealt with in this Act ● Conduct and publish research into matters relevant to its functions ● Provide, upon request, workers, employers, registered trade unions, registered employers’
organisations or councils with advice on training relating to the primary objectives of the LRA ● Perform any other duties imposed, and exercise any other powers conferred on it by or in terms
of the LRA and perform any other function entrusted to it by any other law.
Compensation Fund (CF)
The CF was established in terms of the Compensation for Occupational Injuries and Diseases Act,1993 (COIDA). The functions of the Fund are to provide compensation resulting from:
● Occupational injuries ● Diseases ● Death of workers in the course of their employment.
National Economic, Development and Labour Council (NEDLAC)
The NEDLAC was established under section 2 of the National Economic Development and LabourCouncil Act, 1994 (NEDLAC Act). The functions of the Council are to:
● Strive to promote the goals of economic growth, participation in economic decision-making andsocial equity
● Seek to reach consensus and conclude agreements on matters pertaining to social and economicpolicy
● Consider all proposed labour legislation relating to labour market policy before it is introduced inParliament
● Consider all significant changes to social and economic policy before it is implemented orintroduced in Parliament
● Encourage and promote the formulation of coordinated policy on social and economic matters.
Furthermore, and to achieve the above, the Council:
● May investigate as it may consider necessary and shall continually survey and analyse social andeconomic affairs
● Shall keep abreast of international developments in social and economic policy ● Shall continually evaluate the effectiveness of legislation and policy affecting social and economic
policy ● May conduct research into social and economic policy ● Shall work in close cooperation with government departments, statutory bodies, programmes and
Department of Labour - Vote 15
Report of the Accounting Officer for the year ended 31 March 2009
Annual Report
93

1 April 2008 - 31 March 2009
other forums and non-governmental agencies engaged in the formulation and theimplementation of social and economic policy.
Productivity South Africa (PSA)
The PSA is a section 21 Company (Incorporated association without gain), established under theCompanies Act, 1973, with the following functions:
● To promote a culture of productivity in workplaces ● To develop relevant productivity competencies ● To facilitate and evaluate productivity improvement and competitiveness in workplaces ● To measure and evaluate productivity in the workplace ● To maintain a data-base of productivity and competitiveness systems and publicising these
systems ● To undertake productivity-related research ● To support initiatives aimed at preventing job losses.
Sectoral Education and Training Authorit ies (SETAs)
A total of 23 SETAs were established for a period of 60 months in terms of section 9 of the SkillsDevelopment Act, 1998 and may apply to be re-certified for another period of 60 months or for aperiod as will be determined by the Minister.
The l ist of SETAs for the 2005-2010 per iod are:
● Banking Sector Education and Training Authority● Chemical Industries Education and Training Authority● Clothing, Textiles, Footwear and Leather Sector Education and Training Authority● Construction Education and Training Authority● Safety and Security Sector Education and Training● Education, Training and Development Practices Sector Education and Training Authority● Energy Sector Education and Training Authority● Financial and Accounting Services Training Authority● Food and Beverages Manufacturing Industry Sector Education and Training Authority● Forest Industries Sector Education and Training Authority● Health and Welfare Sector Education and Training Authority● Information Systems, Electronics and Telecommunications Technologies Training Authority● Insurance Sector Education and Training Authority● Local Government, Water and Related Services Sector Education and Training Authority● Manufacturing, Engineering and Related Services Sector Education and Training Authority● Media, Advertising, Publishing, Printing and Packaging Training Authority● Mining Sector Education and Training Authority● Agriculture Sector Education and Training Authority● Public Sector Education and Training Authority● Services Sector Education and Training Authority● Tourism and Hospitality Education and Training Authority● Transport Education and Training Authority● Wholesale and Retail Sector Education and Training Authority.
The functions of the SETAs are regulated in terms of the Skills Development Act, 1998, SkillsDevelopment Levies Act, 1999, Public Finance Management Act, 1999, and include among othersthe following:
● Develop sector skills plans within the framework of the National Skills Development Strategy ● Implement sector skills plans through establishing learnerships
Department of Labour - Vote 15
Report of the Accounting Officer for the year ended 31 March 2009
Annual Report
94

1 April 2008 - 31 March 2009
● Approve workplace skills plans ● Allocate grants in the prescribed manner to employers, workers, and education and training
providers ● Monitor education and training in the sector ● Promote learnerships by identifying workplaces for practical work experience and registering
learnerships ● Any other functions as required in terms of their approved constitution.
Unemployment Insurance Fund (UIF)
The UIF was established under section 4 of the Unemployment Insurance Act, No. 63 of 2001,administered by the Director-General of Labour, to provide for the payment from the Fund ofunemployment benefits to certain employees, and for the payment of illness, maternity, adoptionand dependants’ benefits related to the unemployment of such employees.
The UIF collects and receives revenue contributions under the Unemployment InsuranceContributions Act, 2002, administered by the Commissioner of the South African Revenue Service.
The UIF strives to contribute to the alleviation of poverty in South Africa by providing effectiveshort-term unemployment insurance to all workers who qualify for unemployment and relatedbenefits.
The central purpose and role of the Unemployment Insurance Fund is defined as:
● Rendering an effective and accessible service to all stakeholders ● Being a sustainable organisation with sufficient reserves ● Administering the Fund professionally.
Umsobomvu Youth Fund (UYF)
The UYF was established in 2001 to implement development programmes that would enhanceyoung people’s ability to access employment and self-employment opportunities. In addition, UYFprogrammes seek to engage young people in community development through volunteerism. Tothis end, the UYF developed products and services which were responsive to the needs of youngpeople. UYF’s choice of products and services were informed by key national priorities such as theAccelerated Shared Growth Initiative of South Africa (ASGI-SA), the National Youth DevelopmentPolicy and Framework, the Expanded Public Works Programme (EPWP), the Human ResourcesDevelopment Strategy (HRDS), the National Skills Development Strategy (NSDS), the South AfricanQualifications Act (SAQA Act) and the Black Economic Empowerment Act.
To assist young people that are unemployed to a stage where they can access sustainablelivelihoods, the UYF developed certain forms of interventions which informed its strategy, as well asthe products and services. These products fell within the following categories: provision ofinformation and advice, provision of skills, training and community service, business developmentsupport and access to finance.
Other entities
National Ski l ls Fund (NSF)
The NSF was established in 1999 in terms of the Skills Development Act, 1998. The revenuesources for the Fund are:
● A total of 20% of the skills development levies as determined in the Skills Development LeviesAct
● The skills development levies collected and transferred to the Fund, in terms of the SkillsDevelopment Levies Act, in respect of those employers or sectors for which there are no SETAs
Department of Labour - Vote 15
Report of the Accounting Officer for the year ended 31 March 2009
Annual Report
95

● Funds appropriated by Parliament for the Fund ● Interest earned on investments
– Donations to the Fund – Funds received from any other source.
The primary objective of the NSF is stipulated in the Skills Development Act, namely that the moneyin the NSF may be used only for the projects identified in the National Skills Development Strategy(NSDS) as national priorities or for such other projects related to the achievement of the purposesof the Act as the Director-General of the Department of Labour determines. Given the commitmentof government to act in a more concerted fashion, the flexibility given to the Director-General in thelatter part of the afore mentioned clause of the Act, allows the Department to take into accountother government policy/priority imperatives in the allocation of these funds. These might includethe HRD Strategy, growth, employment and investment strategies and social development priorities.
SSheltered Employment Factories (SEF)
The SEFs were established in 1943 to provide employment for war veterans. During 1953 peoplewith mental and physical disabilities that prevented them from entering the open labour market dueto the nature of their afflictions, were included. Of the 1 040 factory workers currently employed,some 80% are mentally challenged. The factories have operated without enabling legislation sinceinception, except for a Cabinet Memorandum, written in 1956. There are currently 12 factoriesacross the country in seven provinces. Income for the factories is generated from sales ofmanufactured goods ranging from wood and metal furniture, hospital commodities, linen, bedding,protective clothing, garments, upholstery, bookbinding and screen printing.
6. Organisations to whom transfer payments have been made – (See Annexure 1 of the Financial Statements)
7. Public/private partnerships (PPP)See disclosure note 26 to Financial Statements for details in this regard.
The Information Technology Public/Private, Partnership Agreement (IT PPP) was concluded andimplemented on 1 December 2002, aimed at providing an IT enablement to the Department as wellas the Unemployment Insurance Fund and Compensation Fund, for a period of 10 years.
8. Corporate governance arrangementsGovernance structures and responsibi l it ies
The following governance structures have been put in place to assist with ensuring good governancewithin the Department:
● The Minister is the Executive Authority of the Department ● In terms of the Public Finance Management Act, the Head of the Department (Director-General)
is the Accounting Officer of the Department ● The Accounting Officer is individually and personally accountable for achieving good value for
money, safeguarding and maintenance of assets, regularity and propriety in the administration ofthe Department. Programme performance as well as asset management information is disclosedin Section B of the Annual Report
● Management Committee – the Committee consists of the Minister, the Director-General, theDeputy Directors-General and the Chief Financial Officer. The Committee deals with strategic andadministrative matters of the Department
1 April 2008 - 31 March 200996
Annual Report
Department of Labour - Vote 15
Report of the Accounting Officer for the year ended 31 March 2009

● Management Team - consists of the Director-General and the Deputy Directors-General andoversees the implementation of decisions and coordination of activities between theManagement Committee and the Departmental Executive Committee
● The Budget Advisory Committee – determines the total budget for the Department, allocation offunds to Programmes and provinces, monitoring and reporting on the expenditure levels ofProgrammes
● Departmental Executive Committee (DEXCOM) – the Committee consists of the Director-General,the Deputy Directors-General, all Senior Executive Managers, the Chief Information Officer, theChief Financial Officer, the Commissioners of the two Funds and the Provincial ExecutiveManagers
● Audit Committees – these function at the Department, the Compensation Fund andUnemployment Insurance Fund levels.
The following structures were established in terms of the following Acts.
The Department’s Strategic Plan sets out the objectives and actions that must be taken to ensurethe achievement of government’s labour market objectives. These objectives and actions thentranslate into the roles and responsibilities of the Department in achievement of the strategic plan.
The 10 strategic objectives for 2008 to 2011 are:
1. Employment creation.2. Skills development.3. Protection of vulnerable workers.4. Equity in the labour market.5. Strengthening multilateral and bilateral relations.6. Strengthening the capacity of labour market institutions.7. Strengthening social protection.8. Sound labour relations.9. Monitoring the impact of legislation on broad government policy.10. Strengthening the Department’s institutional capacity to improve service delivery.
Organisational structures within the Department’s programmes support the achievement ofprogrammes’ objectives, which are in alignment with the Department’s objectives.
1 April 2008 - 31 March 200997
Annual Report
Department of Labour - Vote 15
Report of the Accounting Officer for the year ended 31 March 2009
Structure Act
UIF Board Unemployment Insurance Act, 2001
Compensation Board Compensation for Occupational Injuries and Diseases Act, 1993
National Skills Authority (NSA) Skills Development Act, 1998
Commission for Employment Equity (CEE) Employment Equity Act, 1998
Employment Conditions Commission (ECC) Basic Conditions of Employment Act, 1997
SETAs Skills Development Act, 1998
Productivity SA (Formerly the NPI) This is a section 21 Company (Incorporated association without
gain), established under the Companies Act, 1973
National Economic Development and Labour Council (NEDLAC) NEDLAC Act, 1994
Advisory Council for Occupational Health and Safety Occupational Health and Safety Act, 1993
1 April 2008 - 31 March 200998
Annual Report
Department of Labour - Vote 15
Report of the Accounting Officer for the year ended 31 March 2009
Organisational structures support the reporting of fraud, corruption or mal-administration, and theprotection of the person disclosing bona fide information.
Governance committees
There are numerous committees and project teams that have been put in place by the Departmentto ensure that its objectives are met. Some of these are specific to the different programmes in theDepartment and the different areas of responsibility.
Audit Committee
The Minister in consultation with the Accounting Officer has appointed members to the AuditCommittee for the Department and Audit Committees for the Unemployment Insurance Fund (UIF)and Compensation Fund (CF). The chairpersons of the two audit committees of the two Funds aremembers of the Audit Committee of the Department. The Audit Committee of the Department isalso responsible for the oversight over the National Skills Fund and Sheltered Employment Factories.
The Department’s Audit Committee consists of:
● Ms. MM Mahlabe Independent Non-executive Chairperson ● Mr. TS Mageza Independent Non-executive Member ● Mr. NK Mlamla Chairperson of the UIF Audit Committee (independent non-executive) ● Mr. K Buthelezi Chairperson of the CF Audit Committee (independent non-executive).
The following people are permanent invitees:
● Director-General● Deputy Director-General of Corporate Services● Deputy Director-General of Service Delivery● Deputy Director-General of LP and LMP● Deputy Director-General of ESDS● Chief Financial Officer● Unemployment Insurance Commissioner● Compensation Commissioner● Senior Executive Manager: National Skills Fund● CEO of the Sheltered Employment Factories● Head of Internal Audit● Representatives of the Auditor-General.
Risk management approach
A Risk Management Unit within the Department has been established.
The Risk Management Unit has already commenced with the development of a Risk ManagementStrategy and carrying out risk assessments. Risk assessments were previously conducted by InternalAudit and reports are available. The Risk Management Unit has already conducted 75% of thestrategic risk assessment. A comprehensive risk assessment will be conducted during the currentfinancial year.
Directorate of Internal Audit
The Directorate of Internal Audit has the responsibility, as part of its strategic plan, to identify themajor activity areas of the Department and to base their planning on the Department’s significantrisk areas. As part of the assessment of risk and during their audit fieldwork, they also take intoaccount the risks of fraud, corruption and maladministration.

This risk assessment combined with the existence and effective operations of internal controls, andan appropriate level of management oversight, are major factors in determining the frequency andnature of audit coverage. In general the majority of units within the Department are audited onceevery three years.
Internal Audit undertakes requests for special investigations received from all levels of managementof the Department and the Audit Committee.
Fraud prevention policiesA separate Fraud Prevention Plan for the Department has been developed, however it was notapproved.
9. Discontinued activities/activities to be discontinued None
10. New/proposed activities None
11. Asset management 11.1 Progress with regard to capturing assets in an asset
register:● Assets owned by the Department within all provincial offices, labour centres and visiting points
are bar-coded. However, according to the findings of the Auditor-General there are still someassets not bar-coded and the Department has developed an internal strategy to resolve thisproblem
● The Department adopted an asset management policy for the control, accounting, maintenanceand disposal of all assets.
11.2 Indication of the extent of compliance with asset management reforms (AMR) milestones:
● Asset registers are in the process of being updated in order to meet the minimum requirementsas set out by National Treasury
● Disposal and asset management policies are in place and the implementation thereof will beenforced.
11.3 An Asset Management Unit was established at Head Office.National asset verification is performed on all assets atHead Office, INDLELA and provincial offices. The IntegratedAsset Management Solution (IAMS) system has been rol ledout to INDLELA and provincial offices. The followingmilestones will be achieved during the 2009/10 financialyear:
● Capturing and linking assets to life cycles ● BAS reconciliation to asset register
1 April 2008 - 31 March 200999
Annual Report
Department of Labour - Vote 15
Report of the Accounting Officer for the year ended 31 March 2009

● Clearing of the LOGIS ledger (duplicate ledgers) ● Asset acquisition plan ● Asset operations and maintenance plan.
112. Events after the reporting date In his State of the Nation address in Parliament, the Honourable State President announced hisintention to perform a macro reorganisation of functions within Government. In this regard, thecurrent structure of the Department of Labour will be impacted upon through the shift of the skillsdevelopment functions from the Department of Labour, where they currently reside, to the newlyestablished Department of Higher Education and Training. A Presidential proclamation was due to bepublished in August 2009 to effect the transfer by November 2009.
13. Performance Information Quarterly monitoring (QMR) of performance of the organisation functions as follows: ● Information on the QMR is derived from the annual work plans which link-up with the ENE
performance measures (Target date, quarter and indicator) ● Progress is reported on the specific indicators within a specific quarter.
Level reporting exists as follows:● Subdirectorates combine their reports into a Directorate Report ● Directorates combine their reports into a Programme Report ● Programme reports are combined into a Branch Report ● Branch reports are combined to form the QMR.
The above mentioned reports are discussed at senior official level and at the Mid-Term Reviewworkshop. The Mid-Term Review workshop is attended by the Minister and the senior managementof the Department and monitors the first six months of the organisation’s work plan. Any needs forchanges in the plan are then communicated and amendments are effected accordingly.
Annual Review and Planning WorkshopSenior Executive Managers up to the level of the Minister attend the evaluation discussion of anentire year’s performance as well as the Planning Workshop. The outcome of the Annual Review andPlanning Workshop is utilised as reporting information in the annual report.
14. SCOPA resolutions
1 April 2008 - 31 March 2009100
Annual Report
Reference to previous audit report and SCOPA resolutions
Subject Findings on progress
19th SCOPA, dated
11 March 2008
1. Fixed assets An Asset Management Unit has been established in order to
address all asset related matters
19th SCOPA, dated
11 March 2008
2. Vacancies The vacancy rate is 17.23% as at 31 March 2009
Department of Labour - Vote 15
Report of the Accounting Officer for the year ended 31 March 2009

15. Prior modifications to audit reportsAudit Report 2007/08 - Progress as fol lows:
A) Qualification
1 April 2008 - 31 March 2009101
Annual Report
Reference to previous audit report and SCOPA resolutions
Subject Findings on progress
19th SCOPA, dated
11 March 2008
3. Leave entitlement The Department implemented the following measures to deal with
the administration of leave:
a) Continuous performance of leave audits.
b) Attendance and leave registers are reconciled on a regular
basis.
c) Leave forms and relevant proof are attached to files of
employees.
d) All leave forms are filed and captured on PERSAL.
e) No sick or study leave forms are captured on PERSAL without
supporting documentation.
f) Leave registers for regional offices are submitted to provincial
offices on a weekly basis.
g) All members of staff are sensitised through circulars and other
means about their obligations with regards to leave
administration.
19th SCOPA, dated
11 March 2008
4. Receivables The Department has implemented an approved Debt Management
Policy which has been developed in accordance with the relevant
Treasury Regulations. Irrecoverable debts are written off in terms
of this policy.
● The Department has written off irrecoverable debts to the value
of R2 142 140.37 in terms of the 2007/08 financial year
● An amount of R2 122 563.39 has been referred to the State
Attorney for collection
● As at March 2009, a total of 780 cases amounting to
R6 506 682.56 have been referred to the Chief Directorate of
Legal Services which could either be recovered or written off
● Legal Services has recommended that an amount of
R2 217 038.77 be written off during the 2008/09 financial
year
● The amount that was recovered from in-service officials from
April 2008 to March 2009 is R 727 299.09.
Amounts are written off as recommended by Legal Services.
19th SCOPA, dated
11 March 2008
5. General
a) The monitoring of the suspense
account; and
b) Inadequate remuneration policies
a. Suspense accounts are being monitored on an ongoing basis.
b. Remuneration policies have now been included in the Financial
Management Policies and Procedure Manual.
19th SCOPA, dated
11 March 2008
6. The Committee recommends
that the Accounting Officer
ensures that quarterly progress
reports are submitted to
Parliament commencing within
60 days after the adoption of
this report by the National
Assembly
Reports are provided quarterly to SCOPA.
Department of Labour - Vote 15
Report of the Accounting Officer for the year ended 31 March 2009

1 April 2008 - 31 March 2009102
Capital Assets:1.1 Audit finding –The audit revealed the following significant shortcomings in the management and
control of assets and asset register:
(a) There were numerous assets with duplicate barcodes
Progress● Duplicate barcodes were removed from the register. However, please take note that certain IT
assets consist of different components (serial numbers) which will reflect similar bar-codes.
(b) A number of assets on the assets register were included at incorrect values.
Progress● The assets values have been re-calculated and the amounts corrected on the systems, however,
the Department is still in the process to ensure that all assests are re-calculated.
(c) The asset register was not adequately maintained in accordance with the requirements of National Treasury.
Progress● Asset registers were maintained and implemented adequately for the reporting period. The
Department will continue to ensure that the asset register are maintained according to NationalTreasury requirements.
(d) The reconciliation of the prior year balance (R123,3 million – disclosure note 29) with the asset registers submitted for the period ending 31 March 2007 is still outstanding.
Progress :● The Department provided a reconciliation to the Auditor-General. However, differences were
noted by the Auditor-General and the Department will provide a comprehensive reconciliation inthis regard.
1.2 Audit finding – PPP Asset Register : Due to numerous discrepancies noted, the Auditor-Generalwas not able to obtain adequate assurance relating to the valuation, existence andcompleteness of assets amounting to R106.3 million disclosed in note 30 to the financialstatements, and the PPP assets amounting to R124,8 million as disclosed in note 28 to thefinancial statements. At the time of the report the Department was in the process of seekingguidance with regard to the accounting treatment of the PPP assets.
● The Office of the Chief Information Officer (OCIO), in collaboration with the office of the ChiefFinancial Officer (CFO) and Siemens, compiled an action plan on how the OCIO and Siemens willassist the Asset Management Unit (AMU) in updating the IT asset register:
- Siemens will provide the financial values of all IT assets procured since the inception of thePPP. This will enable the AMU to update the asset register
- Siemens will provide monthly reports of all new IT assets procured, including financialinformation which will enable the AMU to update the asset register
- The AMU will be informed of all movements of IT assets that are moved by the IT engineers.
Progress :● Siemens provided the information as indicated in the action plan. AMU to verify correctness
thereof and report discrepancies to the OCIO ● All information relating to new IT assets procured is provided to the AMU ● Ongoing process and has been implemented, movements of IT assets by SIEMENS are provided.
Reports from the IT helpdesk are provided to the AMU on a monthly basis to verify movements.
B) Other matters
Internal controls
Annual Report
Department of Labour - Vote 15
Report of the Accounting Officer for the year ended 31 March 2009

Section 38(1)(a)(i) of the PFMA states that the Accounting Officer must ensure that theDepartment has and maintains effective, efficient and transparent systems of financial and riskmanagement and internal control.
Non-compl iance with appl icable legis lat ion
PFMA/Regulations
Audit Finding:
(a) Treasury regulations 3.2.1 – An inadequate risk assessment for 2007/08 was performed, and afunctional risk committee has not been implemented
Progress● The Manager of Risk Management has been appointed at the beginning of 2009. The Risk
Management Unit has just been established and three assistant managers are due to start at thebeginning of April 2009. The Manager has undertaken to develop the first draft risk managementstrategy by the end of the first quarter in the financial year 2009/10. The first draft will be thebasis for the initial consultation process in the Department
● The project planning process of the Department include the identification and management ofproject risks. At macro organisational level, this process is, however, limited to the identifiedstrategic priorities of the Department which constitute the Integrated Work Plan or the BusinessStrategy of the Department. Such risks are managed proactively through the weekly and monthlymanagement meetings which are chaired by the Acting Director-General
● Data quality risks will be resolved by the implementation of the Information Management Systemthat is currently under design to be fully implemented by the beginning of the 2010/11 financialyear.
National Treasury practice note SCM 3 of 2004 part 6 Audit Finding:(a) Although a detailed implementation plan for Supply Chain Management has been developed,
only acquisition and logistics management has been implemented.
(b) De-briefing session were not held with unsuccessful bidders.
(c) Demand performance management has not been implemented.
(d) No need assessment performed before each acquisition.
(e) Performance of vendors not monitored.
ProgressCapacity challenges do not allow full implementation of this activity. Action will commence uponapproval of the structure.
(f) Monthly reporting questionnaires to National Treasury not completed and submitted by theDepartment on a monthly basis.
ProgressThis is done electronically on National Treasury's website on a monthly basis.
Departments own enabling legislationAudit Finding:(a) The Skills Development Levies Act No. 9 of 1999 – operating procedures are not formally
documented and therefore it is not clear which controls were implemented by the Department
1 April 2008 - 31 March 2009103
Annual Report
Department of Labour - Vote 15
Report of the Accounting Officer for the year ended 31 March 2009

1 April 2008 - 31 March 2009104
to administer the Act.ProgressA detailed Standard Operating Procedure with specific reference to Part III: Roles and Responsibilitiesof the Director-General of Labour was provided to the Auditor-General.
(b) The Travel and Subsistence policy paragraph 6- In some instances officials on extended dutydid not complete their claim forms within the prescribed period, after returning to the office.
ProgressA circular was sent to all provincial offices and programmes to emphasise the importance ofadhering to this stipulation.
Other applicable legislationAudit f inding:● The Guideline for Employees Tax – IRP 10 Volume 41 – the IRP 5 reconciliation for the financial
year ending 31 March 2007 was not performed and issued to SARS within the prescribed orextended period.
Progress● Tax reconciliation for 2006/07 was submitted to SARS on 31 July 2008 and the tax
reconciliation for 2007/08 was submitted on 26 August 2008.
Performance informationLack of systems generat ing performance informationFor the information tested it was not possible to obtain sufficient appropriate evidence in relation tothe performance information of the Department, as the system used for generating information wasnot adequate.
ProgressThe ESSA system was rolled out to all 125 labour centres.
16. Exemptions and deviations received from the NationalTreasury
None
17. Other None.
18. ApprovalThe Annual Financial Statements have been approved by the Accounting Officer.
Acting Director-General of Labour
Date: 31/07/2009
Annual Report
Department of Labour - Vote 15
Report of the Accounting Officer for the year ended 31 March 2009

1 April 2008 - 31 March 2009105
Appropriation per programme
2008/09 2007/08
Appropriation
Statement
Adjusted
appropriation
Shifting of
funds
Virement Final
appropriation
Actual
expenditure
Variance Expenditure
as % of final
appropriation
Final
appropriation
Actual
expenditure
R'000 R'000 R'000 R'000 R'000 R'000 % R'000 R'000
1 Administration
Current payments 382 223 - (3 971) 378 252 366 951 11 301 97.0% 357 492 326 954
Transfers and subsidies - - 1 711 1 711 1 711 - 100.0% 708 708
Payments for capital
assets1 984 - 2 260 4 244 4 244 - 100.0% 1 808 722
2 Service Delivery
Current payments 671 480 - (1 137) 670 343 614 336 56 007 91.6% 650 099 645 909
Transfers and subsidies 1 546 - 1 137 2 683 2 572 111 95.9% 2 053 1 970
Payments for capital
assets29 305 - - 29 305 4 442 24 863 15.2% 13 257 8 874
3 Employment and Skills Development Services/Human Resource Development
Current payments 91 398 (11 695) (120) 79 583 76 117 3 466 95.6% 92 009 65 466
Transfers and subsidies 80 167 13 000 120 93 287 93 287 - 100.0% 472 661 472 661
Payments for capital
assets6 900 (1 305) - 5 595 3 085 2 510 55.1% 10 369 1 992
4 Labour Policy and Labour Market Programmes
Current payments 72 174 (5 218) (737) 66 219 63 916 2 303 96.5% 79 422 70 253
Transfers and subsidies 399 507 5 218 737 405 462 405 462 - 100.0% 347 325 347 122
Payments for capital
assets421 - - 421 352 69 83.6% 661 92
5 Social Insurance
Transfers and subsidies 10 501 - - 10 501 6 366 4 135 60.6% 10 001 5 898
Subtotal 1 747 606 - - 1 747 606 1 642 841 104 765 94.0% 2 037 865 1 948 621
Statutory Appropriation
Transfers and subsidies 7 529 600 (295 465) - 7 234 135 7 234 135 - 100% 6 284 306 6 284 306
Total 9 277 206 (295 465) - 8 981 741 8 876 976 104 765 98.8% 8 322 171 8 232 927
Reconciliation with Statement of Financial Performance
Add: Departmental receipts 28 863 8 448
Actual amounts per Statement of Financial Performance
(total revenue)9 010 604 8 330 619
Actual amounts per Statement of Financial Performance
(total expenditure)8 876 976 8 232 927
Annual Report
Department of Labour - Vote 15
Appropriation Statement for the year ended 31 March 2009

1 April 2008 - 31 March 2009106
Statutory appropriation
2008/09 2007/08
Direct charges against
the National/Provincial
Revenue Fund
Adjusted
appropriation
Shifting of
funds
Virement Final
appropriation
Actual
expenditure
Variance Expenditure
as % of final
appropriation
Final
appropriation
Actual
expenditure
R'000 R'000 R'000 R'000 R'000 R'000 % R'000 R'000
Sector Education and
Training Authorities
(SETAs)
6 023 680 - (236 372) 5 787 308 5 787 308 - 100.0% 5 027 445 5 027 445
National Skills Fund 1 505 920 - (59 093) 1 446 827 1 446 827 - 100.0% 1 256 861 1 256 861
Total 7 529 600 - (295 465) 7 234 135 7 234 135 - 100.0% 6 284 306 6 284 306
Appropriation per economic classification
2008/09 2007/08
Per economic
classification
Adjusted
appropriation
Shifting of
funds
Virement Final
appropriation
Actual
expenditure
Variance Expenditure
as % of final
appropriation
Final
appropriation
Actual
expenditure
R'000 R'000 R'000 R'000 R'000 R'000 % R'000 R'000
Current payments
Compensation of
employees
628 875 (8 537) (42 868) 577 470 541 427 36 043 93.8% 562 599 543 826
Goods and services 588 689 (8 376) 32 362 612 675 575 641 37 034 94.0% 614 109 562 442
Financial transactions in
assets and liabilities
- - 4 252 4 252 4 252 - 100.0% 2 314 2 314
Transfers and subsidies
Departmental agencies
and accounts
374 630 15 530 - 390 160 386 025 4 135 98.9% 375 350 371 247
Foreign governments
and international
organisations
7 689 2 688 - 10 377 10 377 - 100.0% 7 620 7 416
Public corporations and
private enterprises
5 080 - - 5 080 5 080 - 100.0% 400 000 400 000
Non-profit institutions 103 388 - - 103 388 103 277 111 99.9% 46 433 46 361
Households 934 - 2 499 3 433 3 433 - 100.0% 3 345 3 335
Gifts and donations - - 1 206 1 206 1 206 - 100.0% - -
Payments for capital assets
Buildings and other
fixed structures
27 276 - 34 27 310 3 367 23 943 12.3% 13 643 6 260
Machinery and
equipment
11 045 (1 305) 2 515 12 255 8 756 3 499 71.4% 12 369 5 420
Software and other
intangible assets
- - - - - - - 83 -
Total 1 747 606 - - 1 747 606 1 642 841 104 765 94.0% 2 037 865 1 948 621
Annual Report
Department of Labour - Vote 15
Appropriation Statement for the year ended 31 March 2009

1 April 2008 - 31 March 2009107
Annual Report
Department of Labour - Vote 15
Detail per Programme 1 – Administration for the year ended 31 March 2009
2008/09 2007/08
Details per
subprogramme
Adjusted
appropriation
Shifting of
funds
Virement Final
appropriation
Actual
expenditure
Variance Expenditure
as % of final
appropriation
Final
appropriation
Actual
expenditure
R'000 R'000 R'000 R'000 R'000 R'000 % R'000 R'000
1.1 Minister
Current payments 1 019 - 593 1 612 1 584 28 98.3% 1 108 1 108
1.2 Management
Current payments 33 370 - (6 813) 26 557 21 505 5 052 81.0% 23 141 23 202
Payments for capital
assets
182 - 385 567 567 - 100.0% 389 389
1.3 Corporate Services
Current payments 176 395 - (1 340) 175 055 175 054 1 100.0% 172 212 146 847
Transfers and subsidies - - 183 183 183 - 100.0% 549 549
Payments for capital
assets
558 - (127) 431 431 - 100.0% 1 356 285
1.4 Financial Management
Current payments 74 065 - 2 589 76 654 74 409 2 245 97.1% 72 091 71 380
Transfers and subsidies - - 1 528 1 528 1 528 - 100.0% 159 159
Payments for capital
assets
1 244 - 2 002 3 246 3 246 - 100.0% 63 48
1.5 Property Management
Current payments 97 374 - 1 000 98 374 94 399 3 975 96.0% 88 940 84 417
Total 384 207 - - 384 207 372 906 11 301 97.1% 360 008 328 384

1 April 2008 - 31 March 2009108
2008/09 2007/08
Programme 1
per economic
classification
Adjusted
appropriation
Shifting of
funds
Virement Final
appropriation
Actual
expenditure
Variance Expenditure
as % of final
appropriation
Final
appropriation
Actual
expenditure
R'000 R'000 R'000 R'000 R'000 R'000 % R'000 R'000
Current payments
Compensation of
employees79 879 - (18 398) 61 481 59 156 2 325 96.2% 64 654 64 441
Goods and services 302 344 - 10 175 312 519 303 543 8 976 97.1% 290 524 260 199
Financial transactions in
assets and liabilities- - 4 252 4 252 4 252 - 100.0% 2 314 2 314
Transfers and subsidies
Households - - 505 505 505 - 100.0% 708 708
Gifts and donations - - 1 206 1 206 1 206 - 100.0% - -
Payments for capital assets
Buildings and other
fixed structures- - 34 34 34 - 100.0% - -
Machinery and
equipment1 984 - 2 226 4 210 4 210 - 100.0% 1 808 722
Total 384 207 - - 384 207 372 906 11 301 97.1% 360 008 328 384
Annual Report
Department of Labour - Vote 15
Detail per Programme 1 – Administration for the year ended 31 March 2009

1 April 2008 - 31 March 2009109
Annual Report
Department of Labour - Vote 15
Detail per Programme 2 – Service Delivery for the year ended 31 March 2009
2008/09 2007/08
Details per
subprogramme
Adjusted
appropriation
Shifting of
funds
Virement Final
appropriation
Actual
expenditure
Variance Expenditure
as % of final
appropriation
Final
appropriation
Actual
expenditure
R'000 R'000 R'000 R'000 R'000 R'000 % R'000 R'000
2.1 Management Support Services
Current payments 201 617 - (939) 200 678 194 643 6 036 97.0% 241 069 239 146
Transfers and subsidies 419 - 68 487 487 - 100.0% 341 341
Payments for capital
assets29 045 - (17) 29 028 4 167 24 861 14.4% 12 623 8 240
2.2 Beneficiary Services
Current payments 1 - - 1 - 1 - 1 -
2.3 Employment Services
Current payments 161 806 - (821) 160 985 143 383 17 602 89.1% 129 634 128 501
Transfers and subsidies 642 - 447 1 089 978 110 89.9% 867 794
Payments of capital
assets230 - (88) 142 142 - 100.0% 270 270
2.4 Inspection and Enforcement Services
Current payments 266 387 - (1 855) 264 532 236 086 28 446 89.2% 242 435 242 435
Transfers and subsidies 485 - 622 1 107 1 107 - 100.0% 835 835
Payments of capital
assets20 - 7 27 27 - 100.0% 173 173
2.5 Labour Market Information and Statistics
Current payments 21 211 - (1 470) 19 741 18 374 1 367 93.1% 20 502 19 813
Transfers and subsidies - - - - - - - 10 -
Payments of capital
assets10 - - 10 8 2 80.0% 57 57
2.6 Occupational Health and Safety
Current payments 20 458 - 3 948 24 406 21 850 2 556 89.5% 16 458 16 014
Payments of capital
assets- - 98 98 98 - 100.0% 134 134
Total 702 331 - - 702 331 621 350 80 981 88.5% 665 409 656 753

1 April 2008 - 31 March 2009110
2008/09 2007/08
Programme 2 -
per economic
classification
Adjusted
appropriation
Shifting of
funds
Virement Final
appropriation
Actual
expenditure
Variance Expenditure
as % of final
appropriation
Final
appropriation
Actual
expenditure
R'000 R'000 R'000 R'000 R'000 R'000 % R'000 R'000
Current payments
Compensation of
employees458 338 - (25 141) 433 197 401 289 31 908 92.6% 407 839 403 649
Goods and services 213 142 - 24 004 237 146 213 047 24 099 89.8% 242 260 242 260
Transfers and subsidies
International
organisations- - - - - - - 140 139
Non-profit institutions 612 - - 612 501 111 81.9% 583 511
Households 934 - 1 137 2 071 2 071 - 100.0% 1 330 1 320
Payments for capital assets
Buildings and other
fixed structures26 276 - - 26 276 2 690 23 586 10.2% 10 643 6 260
Machinery and
equipment3 029 - - 3 029 1 752 1 277 57.8% 2 614 2 614
Total 702 331 - - 702 331 621 350 80 981 88.5% 665 409 656 753
Annual Report
Department of Labour - Vote 15
Detail per Programme 2 – Service Delivery for the year ended 31 March 2009

1 April 2008 - 31 March 2009111
Annual Report
Department of Labour - Vote 15
Detail per Programme 3 – Employment and Skills Development Services/Human
Resources Development for the year ended 31 March 2009
2008/09 2007/08
Details per
subprogramme
Adjusted
appropriation
Shifting of
funds
Virement Final
appropriation
Actual
expenditure
Variance Expenditure
as % of final
appropriation
Final
appropriation
Actual
expenditure
R'000 R'000 R'000 R'000 R'000 R'000 % R'000 R'000
3.1 NSF Admin and transfers
Current payments 2 297 - (1 316) 981 718 263 73.2% 1 434 1 434
Transfers and subsidies 46 949 - - 46 949 46 949 - 100.0% 44 799 44 799
Payments of capital
assets- - 69 69 69 - 100.0% 163 29
3.2 SETA Co-ordination
Current payments 23 507 (1 784) (1 362) 20 361 18 825 1 536 92.5% 25 188 15 858
Transfers and subsidies - - - - - - - 708 708
Payments of capital
assets140 - - 140 75 65 53.6% 163 159
3.3 INDLELA
Current payments 46 567 (4 606) 1 411 43 372 43 307 65 99.9% 42 306 37 022
Transfers and subsidies - - 120 120 120 - 100.0% 517 517
Payments of capital
assets6 218 (1 305) (69) 4 844 2 727 2 117 56.3% 9 850 1 611
3.4 Training of staff
Current payments 1 200 - 953 2 153 2 153 - 100.0% 1 891 1 891
3.5 Programme Management Support
Current payments 5 408 - 194 5 602 5 575 27 99.5% 5 711 4 672
Payments of capital
assets230 - - 230 46 184 20.0% 151 151
3.6 NSA Secretariat
Current payments 3 349 - 640 3 989 3 744 245 93.9% 5 479 3 791
Payments of capital
assets262 - - 262 168 94 64.1% 42 42
3.7 Quality Development and Promotion
Current payments 9 070 (5 305) (640) 3 125 1 795 1 330 57.4% 10 000 798
Payments of capital
assets50 - - 50 - 50 - - -
3.8 Productivity SA
Transfers and subsidies 28 138 13 000 - 41 138 41 138 - 100.0% 26 637 26 637
3.9 Umsobomvu Youth Fund
Transfers and subsidies 5 080 - - 5 080 5 080 - 100.0% 400 000 400 000
Total 178 465 - - 178 465 172 489 5 976 96.7% 575 039 540 119

1 April 2008 - 31 March 2009112
2008/09 2007/08
Programme 3 -
per economic
classification
Adjusted
appropriation
Shifting of
funds
Virement Final
appropriation
Actual
expenditure
Variance Expenditure
as % of final
appropriation
Final
appropriation
Actual
expenditure
R'000 R'000 R'000 R'000 R'000 R'000 % R'000 R'000
Current payments
Compensation of
employees51 421 (3 319) (120) 47 982 46 172 1 810 96.2% 52 416 43 612
Goods and services 39 977 (8 376) - 31 601 29 945 1 656 94.8% 39 593 21 854
Transfers and subsidies
Departmental agencies
and accounts75 087 13 000 - 88 087 88 087 - 100.0% 71 436 71 436
Public corporations and
private enterprises5 080 - - 5 080 5 080 - 100.0% 400 000 400 000
Households - - 120 120 120 - 100.0% 1 225 1 225
Payments for capital assets
Buildings and other
fixed structures1 000 - - 1 000 643 357 64.3% 3 000 -
Machinery and
equipment5 900 (1 305) - 4 595 2 442 2 153 53.1% 7 369 1 992
Total 178 465 - - 178 465 172 489 5 976 96.7% 575 039 540 119
Annual Report
Department of Labour - Vote 15
Detail per Programme 3 – Employment and Skills Development Services/ Human
Resources Development for the year ended 31 March 2009

1 April 2008 - 31 March 2009113
Department of Labour - Vote 15
Detail per Programme 4 – Labour Policy and Labour Market Programmes
for the year ended 31 March 2009
Annual Report
2008/09 2007/08
Details per
subprogramme
Adjusted
appropriation
Shifting of
funds
Virement Final
appropriation
Actual
expenditure
Variance Expenditure
as % of final
appropriation
Final
appropriation
Actual
expenditure
R'000 R'000 R'000 R'000 R'000 R'000 % R'000 R'000
4.1 Programme Management Unit
Current payments 8 887 (649) 728 8 966 8 078 888 90.1% 8 689 7 161
Transfers and subsidies - - - - - - - 82 82
Payments for capital
assets
25 - - 25 - 25 - 77 63
4.2 Strengthen Civil Society
Transfers and subsidies 13 373 2 530 - 15 903 15 903 - 100.0% 9 919 9 919
4.3 Collective Bargaining
Current payments 8 651 (126) 83 8 608 8 608 - 100.0% 9 638 9 005
Transfers and subsidies - - 713 713 713 - 100.0% - -
Payments of capital
assets
11 - - 11 - 11 - - -
4.4 Employment Equity and Standards
Current payments 27 070 (1 816) (1 548) 23 706 23 244 462 98.1% 25 624 23 370
Transfers and subsidies - - 24 24 24 - 100.0% - -
Payments of capital
assets
362 - - 362 345 17 95.3% 291 -
4.5 Commission for Conciliation, Mediation and Arbitration
Transfers and subsidies 261 710 - - 261 710 261 710 - 100.0% 270 646 270 646
4.6 Research, Policy and Planning
Current payments 8 524 (1 281) (1 588) 5 655 4 778 877 84.5% 17 457 15 003
Payments of capital
assets23 - - 23 7 16 30.4% 60 18
4.7 Labour Market Information and Statistics
Current payments 4 431 (718) 311 4 024 4 016 8 99.8% 4 710 3 918
Payments of capital
assets- - - - - - - 70 11
4.8 International Labour Matters
Current payments 11 401 (578) 1 207 12 030 12 029 1 100.0% 10 782 9 733
Transfers and subsidies 7 689 2 688 - 10 377 10 377 - 100.0% 7 480 7 277
Payments of capital
assets- - - - - - - 163 -
4.9 National Economic Development and Labour Council
Current payments 444 (50) - 394 368 26 93.4% - -
Transfers and subsidies 13 959 - - 13 959 13 959 - 100.0% 13 348 13 348
4.10 Sheltered Employment Factories
Current payments 2 766 - 70 2 836 2 795 41 98.6% 2 522 2 063
Transfers and subsidies 102 776 - - 102 776 102 776 - 100.0% 45 850 45 850
Total 472 102 - - 472 102 469 730 2 372 99.5% 427 408 417 467

1 April 2008 - 31 March 2009114
Annual ReportDepartment of Labour - Vote 15
Detail per Programme 4 – Labour Policy and Labour Market Programmes
for the year ended 31 March 2009
2008/09 2007/08
Programme 4 -
per economic
classification
Adjusted
appropriation
Shifting of
funds
Virement Final
appropriation
Actual
expenditure
Variance Expenditure
as % of final
appropriation
Final
appropriation
Actual
expenditure
R'000 R'000 R'000 R'000 R'000 R'000 % R'000 R'000
Current Payments
Compensation of
employees39 237 (5 218) 791 34 810 34 810 - 100.0% 37 690 32 124
Goods and services 33 226 - (1 817) 31 409 29 106 2 303 92.7% 41 732 38 129
Transfers and subsidies
Departmental agencies
and accounts289 042 2 530 - 291 572 291 572 - 100.0% 293 913 293 913
International
organisations7 689 2 688 - 10 377 10 377 - 100.0% 7 480 7 277
Non-profit institutions 102 776 - - 102 776 102 776 - 100.0% 45 850 45 850
Households - - 737 737 737 - 100.0% 82 82
Payments for capital assets
Machinery and
equipment132 - 289 421 352 69 83.6% 578 92
Software and other
intangible assets- - - - - - - 83 -
Total 472 102 - - 472 102 469 730 2 372 99.5% 427 408 417 467
Department of Labour - Vote 15
Detail per Programme 5 – Social Insurance for the year ended 31 March 2009
2008/09 2007/08
Details per
subprogramme
Adjusted
appropriation
Shifting of
funds
Virement Final
appropriation
Actual
expenditure
Variance Expenditure
as % of final
appropriation
Final
appropriation
Actual
expenditure
R'000 R'000 R'000 R'000 R'000 R'000 % R'000 R'000
5.1 Unemployment Insurance Fund
Transfers and subsidies 1 - - 1 - 1 - 1 -
5.2 Compensation Fund
Transfers and subsidies 10 500 - - 10 500 6 366 4 134 60.6% 10 000 5 898
Total 10 501 - - 10 501 6 366 4 135 60.6% 10 001 5 898
2008/09 2007/08
Programme 5 -
per economic
classification
Adjusted
appropriation
Shifting of
funds
Virement Final
appropriation
Actual
expenditure
Variance Expenditure
as % of final
appropriation
Final
appropriation
Actual
expenditure
R'000 R'000 R'000 R'000 R'000 R'000 % R'000 R'000
Transfers and subsidies
Departmental agencies
and accounts10 501 - - 10 501 6 366 4 135 60.6% 10 001 5 898
Total 10 501 - - 10 501 6 366 4 135 60.6% 10 001 5 898

11. Detail of transfers and subsidies as per Appropriation Act (after virement):
Detail of these transactions can be viewed in note 10 (Transfers and subsidies) and Annexure 1(A-L) to the Annual Financial Statements.
2. Detail of specifically and exclusively appropriated amounts voted (after virement):
Detail of these transactions can be viewed in note 1 (Annual appropriation) to the Annual FinancialStatements.
3. Detail on financial transactions in assets and liabil itiesDetail of these transactions per programme can be viewed in note 9 (Financial transactions in assetsand liabilities) to the Annual Financial Statements.
4. Explanations of material variances from amounts voted (after virement):
There were delays on the filling of vacancies, which were mostly caused by the vetting processesconducted by an external agency. Equipment under R5 000 budgeted for in respect of an envisagedincrease in the number of staff, did not take place as these units were staffed from the existingestablishment, negating the need to purchase new furniture and equipment.
Variances reflected under this Main Division of the Vote are mainly attributable to an unforeseenhigh number of posts vacated during the financial year, resulting in an increased level of vacancieson the establishment, as well as unanticipated delays in respect of the commencement of capitalworks projects and the appointment of contractors to perform repair and maintenance work atvarious offices. (A roll-over request regarding the capital works and repair and maintenance projectswas submitted to the National Treasury.)
1 April 2008 - 31 March 2009115
Annual ReportAnnual Report
Department of Labour - Vote 15
Notes to the Appropriation Statement for the year ended 31 March 2009
4.1 Per programme Final appropriation Actual expenditure Variance Variance as a % of
final appropriation
R'000 R'000 R'000 %
Administration
Current payments 378 252 366 951 11 301 3
Transfers and subsidies 1 711 1 711 - -
Payments for capital assets 4 244 4 244 - -
Service Delivery
Current Payments 670 343 614 336 56 007 8
Transfers and Subsidies 2 683 2 572 111 4
Payments for Capital Assets 29 305 4 442 24 863 85

The under-expenditure on compensation of employees was brought about by the process ofreprioritising posts and also the filling of the critical posts. The delays on the filling of vacancieswere mostly caused by the vetting processes conducted by an external agency. ESDS/HRD Goodsand Services under-spent due to the delay and the rigorous process to appointment of consultantshas taken longer than envisaged for 5 pilot projects. The delay in the filling of vacancies resulted inless expenditure on Goods and Services aligned to posts/staff. The lesser the staff establishmentthe lesser the goods required for service delivery. Delays by the Department of Public Works in theappointing a service provider for the security upgrade at INDLELA resulted in under-expenditureunder this classification. Initial processes towards the said project only resumed early this year andthe payment for the service provided has been processed from the current budget. (Invoice issuedin this financial year).
Delays in the issuing of disposal certificates and the lack of capacity within Sheltered EmploymentFactories to deliver orders on time.
The under-expenditure is mainly due to delays in the issuing of disposal certificates and the lack ofcapacity within Sheltered Employment Factories to deliver orders on time. Under-spending onMachinery and Equipment relates to lack of appropriate demand for expenditure against this lineitem and need to revise budgeting in the future. No authorisation to purchase furniture forincumbent manager's office as current furniture considered to be useable.
This is attributed to fewer claims received on behalf of public servants injured on duty.
1 April 2008 - 31 March 2009116
Employment and Skills Development Services/Human Resources Development
Current payments 79 583 76 117 3 466 4
Transfers and subsidies 93 287 93 287 - -
Payments for capital assets 5 595 3 085 2 510 45
Labour Policy and
Labour Market Programmes
Final appropriation
R’000
Actual expenditure
R’000
Variance
R’000
Variance as a % of
final appropriation
R’000
Current payments 66 219 63 916 2 303 3
Transfers and subsidies 405 462 405 462 - -
Payments for capital assets 421 352 69 16
Social Insurance
Transfers and subsidies 10 501 6 366 4 135 39
Annual Report
Department of Labour - Vote 15
Notes to the Appropriation Statement for the year ended 31 March 2009

1 April 2008 - 31 March 2009117
4.2 Per economic classification Final appropriation Actual expenditure Variance Variance as a % of
final appropriation
R'000 R'000 R'000 %
Current payments:
Compensation of employees 577 470 541 427 36 043 6.2
Goods and services 612 675 575 641 37 034 6.0
Unauthorised expenditure approved 4 252 4 252 - -
Transfers and subsidies:
Departmental agencies and accounts 390 160 386 025 4 135 1.1
Public corporations and private enterprises 5 080 5 080 - -
Foreign governments and international
organisations10 377 10 377 - -
Non-profit institutions 103 388 103 277 111 0.1
Households 3 433 3 433 - -
Gifts and donations 1 206 1 206 - -
Payments for capital assets:
Buildings and other fixed structures 27 310 3 367 23 943 87.7
Machinery and equipment 12 255 8 756 3 499 28.6
Annual Report
Department of Labour - Vote 15
Notes to the Appropriation Statement for the year ended 31 March 2009

NNote 2008/09 2007/08
R'000 R'000
Revenue
Annual appropriation 1 1 747 606 2 037 865
Statutory appropriation 2 7 234 135 6 284 306
Departmental revenue 3 28 863 8 448
Total Revenue 9 010 604 8 330 619
Expenditure
Current expenditure
Compensation of employees 4 541 427 543 826
Goods and services 5 575 641 562 442
Financial transactions in assets and liabilities 6 4 252 2 314
Total current expenditure 1 121 320 1 108 582
Transfers and subsidies 7 7 743 533 7 112 665
Expenditure for capital assets
Total expenditure for tangible capital assets 8 12 123 11 680
Total Expenditure 8 876 976 8 232 927
Surplus/(Deficit) for the year 133 628 97 692
Reconciliation of Net Surplus/(Deficit) for the year
Voted Funds 104 765 89 244
Departmental Revenue 3 28 863 8 448
Surplus/(Deficit) for the year 133 628 97 692
1 April 2008 - 31 March 2009118
Annual Report
Department of Labour - Vote 15
Statement of Financial Performance for the year ended 31 March 2009
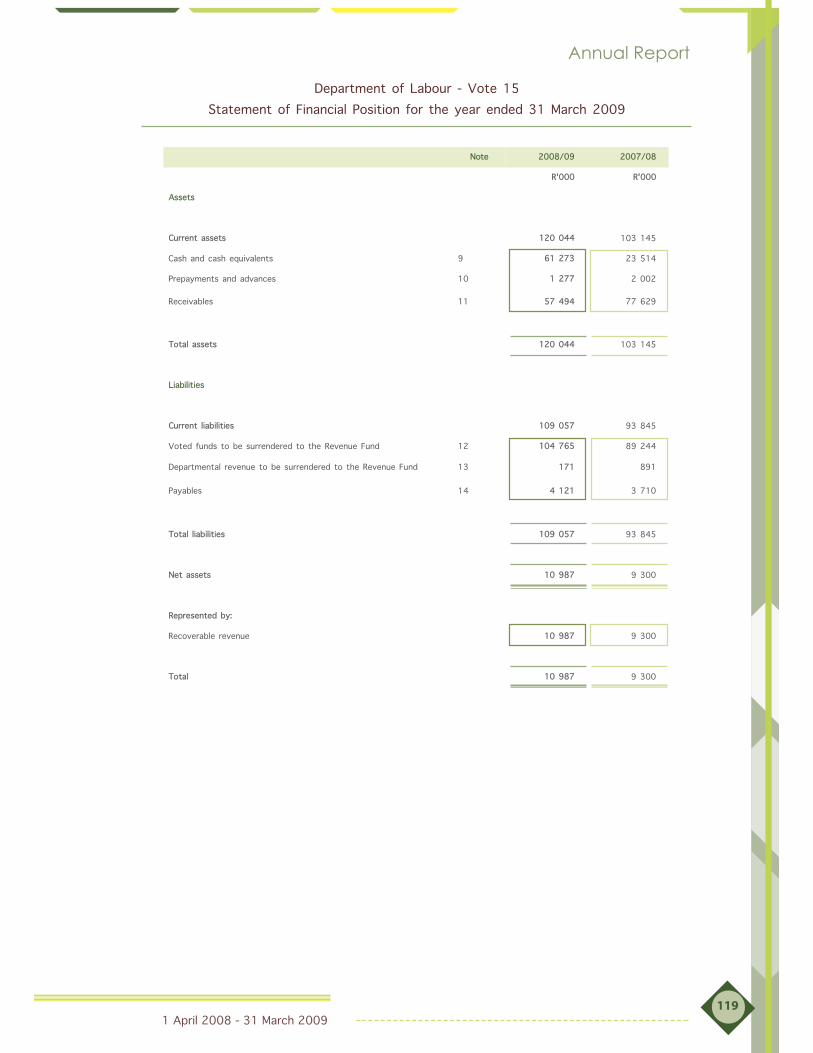
1 April 2008 - 31 March 2009119
Note 2008/09 2007/08
R'000 R'000
Assets
Current assets 120 044 103 145
Cash and cash equivalents 9 61 273 23 514
Prepayments and advances 10 1 277 2 002
Receivables 11 57 494 77 629
Total assets 120 044 103 145
Liabilities
Current liabilities 109 057 93 845
Voted funds to be surrendered to the Revenue Fund 12 104 765 89 244
Departmental revenue to be surrendered to the Revenue Fund 13 171 891
Payables 14 4 121 3 710
Total liabilities 109 057 93 845
Net assets 10 987 9 300
Represented by:
Recoverable revenue 10 987 9 300
Total 10 987 9 300
Annual Report
Department of Labour - Vote 15
Statement of Financial Position for the year ended 31 March 2009

1 April 2008 - 31 March 2009120
Note 2008/09 2007/08
R'000 R'000
Recoverable revenue
Opening balance 9 300 7 699
Transfers: 1 687 1 601
Irrecoverable amounts written off 6.3 (30) (15)
Debts revised (256) (221)
Debts recovered (included in departmental receipts) (3 840) (2 322)
Debts raised 5 813 4 159
Total 10 987 9 300
Annual Report
Department of Labour - Vote 15
Statement of Changes in Net Assets for the year ended 31 March 2009

1 April 2008 - 31 March 2009121
Note 2008/09 2007/08
R'000 R'000
Cash flows from operating activities
Receipts 9 010 604 8 330 619
Annual appropriated funds received 1.1 1 747 606 2 037 865
Statutory appropriated funds received 2 7 234 135 6 284 306
Departmental revenue received 3 28 863 8 448
Net (increase)/decrease in working capital 21 271 (49 990)
Surrendered to Revenue Fund (118 827) (47 624)
Current payments (1 121 320) (1 108 582)
Transfers and subsidies paid (7 743 533) (7 112 665)
Net cash flow available from operating activities 15 48 195 11 758
Cash flows from investing activities
Payments for capital assets 8 (12 123) (11 680)
Net cash flows from investing activities (12 123) (11 680)
Cash flows from financing activities
Increase/(decrease) in net assets 1 687 1 601
Net cash flows from financing activities 1 687 1 601
Net increase/(decrease) in cash and cash equivalents 37 759 1 679
Cash and cash equivalents at the beginning of the period 23 514 21 835
Cash and cash equivalents at end of period 16 61 273 23 514
Annual Report
Department of Labour - Vote 15
Cash Flow Statement for the year ended 31 March 2009

1 April 2008 - 31 March 2009122
The Financial Statements have been prepared in accordance with the following policies, which havebeen applied consistently in all material aspects, unless otherwise indicated. However, whereappropriate and meaningful, additional information has been disclosed to enhance the usefulness ofthe Financial Statements and to comply with the statutory requirements of the Public FinanceManagement Act, No 1 of 1999 (as amended by Act 29 of 1999), and the Treasury Regulationsissued in terms of the Act and the Division of Revenue Act, No 2 of 2006.
1. Presentation of the Financial Statements1.1 Basis of preparation
The Financial Statements have been prepared on a modified cash basis of accounting, except wherestated otherwise. The modified cash basis constitutes the cash basis of accounting supplementedwith additional disclosure items. Under the cash basis of accounting transactions and other eventsare recognised when cash is received or paid.
1.2 Presentation currency
All amounts have been presented in the currency of the South African Rand (R) which is also thefunctional currency of the Department.
1.3 Rounding
Unless otherwise stated all financial figures have been rounded to the nearest one thousand Rand(R’000).
1.4 Comparative figures
Prior period comparative information has been presented in the current year’s financial statements.Where necessary figures included in the prior period financial statements have been reclassified toensure that the format in which the information is presented is consistent with the format of thecurrent year’s financial statements.
1.5 Comparative figures - Appropriation Statement
A comparison between actual amounts and final appropriation per major classification of expenditureis included in the Appropriation Statement.
2. Revenue2.1 Appropriated funds
Appropriated funds are recognised in the financial records on the date the appropriation becomeseffective. Adjustments to the appropriated funds made in terms of the adjustments budget processare recognised in the financial records on the date the adjustments become effective.
Total appropriated funds are presented in the Statement of Financial Performance.
Unexpended appropriated funds are surrendered to the National/Provincial Revenue Fund. Amountsowing to the National/Provincial Revenue Fund at the end of the financial year are recognised in theStatement of Financial Position.
Annual Report
Department of Labour - Vote 15
Accounting Policies for the year ended 31 March 2009
1 April 2008 - 31 March 2009123
2.2 Statutory appropriation
Statutory appropriations are recognised in the financial records on the date the appropriationbecomes effective. Adjustments to the statutory appropriations made in terms of the adjustmentsbudget process are recognised in the financial records on the date the adjustments becomeeffective.
Total statutory appropriations are presented in the Statement of Financial Performance.
Unexpended statutory appropriations are surrendered to the National/Provincial Revenue Fund.Amounts owing to the National/Provincial Revenue Fund at the end of the financial year arerecognised in the Statement of Financial Position.
2.3 Departmental revenue
All departmental revenue is paid into the National/Provincial Revenue Fund when received, unlessotherwise stated. Amounts owing to the National/Provincial Revenue Fund at the end of thefinancial year are recognised in the Statement of Financial Position.
Amounts receivable at the reporting date are disclosed in the disclosure notes to the AnnualFinancial Statements.
2.3.1 Tax revenue
Tax revenue consists of all compulsory unrequited amounts collected by the Department inaccordance with laws and or regulations (excluding fines, penalties and forfeits).
Tax receipts are recognised in the Statement of Financial Performance when received.
2.3.2 Sales of goods and services other than capital assets
The proceeds received from the sale of goods and/or the provision of services is recognised in theStatement of Financial Performance when the cash is received.
2.3.3 Fines, penalt ies and forfeits
Fines, penalties and forfeits are compulsory unrequited amounts which were imposed by a Court orquasi-judicial body and collected by the Department. Revenue arising from fines, penalties andforfeits is recognised in the Statement of Financial Performance when the cash is received.
2.3.4 Interest, dividends and rent on land
Interest, dividends and rent on land is recognised in the Statement of Financial Performance whenthe cash is received.
2.3.5 Sale of capital assets
The proceeds received on sale of capital assets are recognised in the Statement of FinancialPerformance when the cash is received.
2.3.6 Financial transactions in assets and liabi l it ies
Repayments of loans and advances previously extended to employees and public corporations forpolicy purposes are recognised as revenue in the Statement of Financial Performance on receipt ofthe funds.
Cheques issued in previous accounting periods that expire before being banked are recognised as
Annual Report
Department of Labour - Vote 15
Accounting Policies for the year ended 31 March 2009

1 April 2008 - 31 March 2009124
Annual Report
revenue in the Statement of Financial Performance when the cheque becomes stale. When thecheque is reissued the payment is made from Revenue.
Forex gains are recognised on payment of funds.
2.3.7 Transfers received (including gifts, donations and sponsorships)
All cash gifts, donations and sponsorships are paid into the National/Provincial Revenue Fund andrecorded as revenue in the Statement of Financial Performance when received. Amounts receivableat the reporting date are disclosed in the Disclosure Notes to the Financial Statements.
All in-kind gifts, donations and sponsorships are disclosed at fair value in an annexure to theFinancial Statements.
2.4 Direct exchequer receipts
All direct exchequer receipts are recognised in the Statement of Financial Performance when thecash is received.
All direct exchequer payments are recognised in the Statement of Financial Performance when finalauthorisation for payment is effected on the system (by no later than 31 March of each year.)
2.5 Aid assistance
Local and foreign aid assistance is recognised as revenue when notification of the assistance isreceived from the National Treasury or when the Department directly receives the cash from thedonor(s).
All in-kind local and foreign aid assistance are disclosed at fair value in the annexures to the AnnualFinancial Statements.
The cash payments made during the year relating to local and foreign aid assistance projects arerecognised as expenditure in the Statement of Financial Performance. The value of the assistanceexpensed prior to the receipt of the funds is recognised as a receivable in the Statement of FinancialPosition.
Inappropriately expensed amounts using local and foreign aid assistance and any unutilised amountsare recognised as payables in the Statement of Financial Position.
All CARA funds received must be recorded as revenue when funds are received. The cash paymentsmade during the year relating to CARA earmarked projects are recognised as current or capitalexpenditure in the Statement of Financial Performance.
Inappropriately expensed amounts using CARA funds and any unutilised amounts are recognised aspayables in the Statement of Financial Position.
3. Expenditure3.1 Compensation of employees
3.1.1 Short-term employee benefits
Salaries and wages comprise payments to employees (including leave entitlements, thirteenthcheques and performance bonuses). Salaries and wages are recognised as an expense in theStatement of Financial Performance when final authorisation for payment is effected on the system(by no later than 31 March of each year.) Capitalised compensation forms part of the expenditure
Department of Labour - Vote 15
Accounting Policies for the year ended 31 March 2009

1 April 2008 - 31 March 2009125
Annual Report
for capital assets in the Statement of Financial Performance.
All other payments are classified as current expense.
Short-term employee benefits that give rise to a present legal or constructive obligation aredisclosed in the Disclosure Notes to the Financial Statements. These amounts are not recognised inthe Statement of Financial Performance or Position.
3.1.2 Post retirement benefitsThe Department provides retirement benefits (pension benefits) for certain of its employeesthrough a defined benefit plan for government employees. These benefits are funded by bothemployer and employee contributions. Employer contributions (i.e. social contributions) to the fund are expensed when the finalauthorisation for payment to the fund is effected on the system by no later than 31 March of eachyear. No provision is made for retirement benefits in the Financial Statements of the Department.Any potential liabilities are disclosed in the Financial Statements of the National/Provincial RevenueFund and not in the Financial Statements of the employer department.The Department provides medical benefits for certain of its employees. Employer contributions tothe medical funds are expensed when final authorisation for payment to the fund is effected on thesystem (by no later than 31 March of each year.)
3.1.3 Termination benefitsTermination benefits such as severance packages are recognised as an expense in the Statement ofFinancial Performance as a transfer (to households) when the final authorisation for payment iseffected on the system (by no later than 31 March of each year.)
3.1.4 Other long-term employee benefitsOther long-term employee benefits (such as capped leave) are recognised as an expense in theStatement of Financial Performance as a transfer (to households) when the final authorisation forpayment is effected on the system (by no later than 31 March of each year.)Long-term employee benefits that give rise to a present legal or constructive obligation aredisclosed in the Disclosure Notes to the Financial Statements. These amounts are not recognised inthe Statement of Financial Performance or Position.
3.2 Goods and services
Payments made for goods and/or services are recognised as an expense in the Statement ofFinancial Performance when the final authorisation for payment is effected on the system by nolater than 31 March of each year. The expense is classified as capital if the goods and services wereused for a capital project or an asset of R5 000 or more is purchased. All assets costing less thanR5 000 will also be reflected under goods and services.
3.3 Interest and rent on land
Interest and rental payments are recognised as an expense in the Statement of FinancialPerformance when the final authorisation for payment is effected on the system by no later than31 March of each year. This item excludes rental for the use of buildings or other fixed structures.If it is not possible to distinguish between payment for the use of land and the fixed structures onit, the whole amount should be recorded under goods and services.
3.4 Financial transactions in assets and liabil ities
Debts are written off when identified as irrecoverable. Debts written-off are limited to the amountof savings and/or underspending of appropriated funds. The write-off occurs at year-end or when
Department of Labour - Vote 15
Accounting Policies for the year ended 31 March 2009

funds are available. No provision is made for irrecoverable amounts but amounts are disclosed as aDisclosure Note.
Forex losses are recognised on payment of funds.
All other losses are recognised when authorisation has been granted for the recognition thereof.
33.5 Transfers and subsidies
Transfers and subsidies are recognised as an expense when the final authorisation for payment iseffected on the system (by no later than 31 March of each year.)
3.6 Unauthorised expenditure
When discovered unauthorised expenditure is recognised as an asset in the Statement of FinancialPosition until such time as the expenditure is either approved by the relevant authority, recoveredfrom the responsible person or written off as irrecoverable in the Statement of FinancialPerformance.
Unauthorised expenditure approved with funding is recognised in the Statement of FinancialPerformance when the unauthorised expenditure is approved and the related funds are received.Where the amount is approved without funding it is recognised as expenditure, subject to availabilityof savings, in the Statement of Financial Performance on the date of approval.
3.7 Fruitless and wasteful expenditure
Fruitless and wasteful expenditure is recognised as expenditure in the Statement of FinancialPerformance. If the expenditure is recoverable it is treated as an asset until it is recovered from theresponsible person or written off as irrecoverable in the Statement of Financial Performance.
3.8 Irregular expenditure
Irregular expenditure is recognised as expenditure in the Statement of Financial Performance. If theexpenditure is not condoned by the relevant authority it is treated as an asset until it is recoveredor written off as irrecoverable in the Statement of Financial Performance.
3.9 Expenditure for capital assets
Payments made for capital assets are recognised as an expense in the Statement of FinancialPerformance when the final authorisation for payment is effected on the system (by no later than31 March of each year.)
4. Assets4.1 Cash and cash equivalents
Cash and cash equivalents are carried in the Statement of Financial Position at cost.
For the purposes of the Cash Flow Statement, cash and cash equivalents comprise cash on hand,deposits held, other short-term highly liquid investments and bank overdrafts.
4.2 Other financial assets
Other financial assets are carried in the Statement of Financial Position at cost.
1 April 2008 - 31 March 2009
Annual Report
Department of Labour - Vote 15
Accounting Policies for the year ended 31 March 2009
126

44.3 Prepayments and advances
Amounts prepaid or advanced are recognised in the Statement of Financial Position when thepayments are made.
Pre-payments and advances outstanding at the end of the year are carried in the Statement ofFinancial Position at cost.
4.4 Receivables
Receivables included in the Statement of Financial Position arise from cash payments made that arerecoverable from another party.
Receivables outstanding at year-end are carried in the Statement of Financial Position at cost plusany accrual interest.
4.5 Investments
Capitalised investments are shown at cost in the Statement of Financial Position. Any cash flowssuch as dividends received or proceeds from the sale of the investment are recognised in theStatement of Financial Performance when the cash is received.
Investments are tested for an impairment loss whenever events or changes in circumstancesindicate that the investment may be impaired. Any loss is included in the Disclosure Notes.
4.6 Loans
Loans are recognised in the Statement of Financial Position at the nominal amount when cash ispaid to the beneficiary. Loan balances are reduced when cash repayments are received from thebeneficiary. Amounts that are potentially irrecoverable are included in the Disclosure Notes.
Loans that are outstanding at year-end are carried in the Statement of Financial Position at cost.
4.7 Inventory
Inventories purchased during the financial year are disclosed at cost in the notes.
4.8 Capital assets
4.8.1 Movable assets
A capital asset is recorded on receipt of the item at cost. Cost of an asset is defined as the totalcost of acquisition. Where the cost cannot be determined accurately, the movable capital asset isstated at fair value. Where fair value cannot be determined, the capital asset is included in the assetregister at R1.
Subsequent expenditure of a capital nature is recorded in the Statement of Financial Performance as“expenditure for capital asset” and is capitalised in the asset register of the Department oncompletion of the project.
Repairs and maintenance is expensed as current “goods and services” in the Statement of FinancialPerformance.
4.8.2 Immovable assets
A capital asset is recorded on receipt of the item at cost. Cost of an asset is defined as the total
1 April 2008 - 31 March 2009
Department of Labour - Vote 15
Accounting Policies for the year ended 31 March 2009
Annual Report
127

1 April 2008 - 31 March 2009128
Annual Report
cost of acquisition. Where the cost cannot be determined accurately, the immovable capital asset isstated at R1 unless the fair value for the asset has been reliably estimated.
Work-in-progress of a capital nature is recorded in the Statement of Financial Performance as“expenditure for capital asset”. On completion, the total cost of the project is included in the assetregister of the Department that legally owns the asset or the provincial/national Department ofPublic Works.
Repairs and maintenance is expensed as current “goods and services” in the Statement of FinancialPerformance.
5. Liabil ities5.1 Voted funds to be surrendered to the revenue fundUnexpended appropriated funds are surrendered to the National/Provincial Revenue Fund. Amountsowing to the National/Provincial Revenue Fund at the end of the financial year are recognised in theStatement of Financial Position.
5.2 Departmental revenue to be surrendered to the revenuefundAmounts owing to the National/Provincial Revenue Fund at the end of the financial year arerecognised in the Statement of Financial Position at cost.
5.3 Direct exchequer receipts to be surrendered to therevenue fundAll direct exchequer fund receipts are recognised in the Statement of Financial Performance whenthe cash is received.
Amounts received must be surrendered to the relevant revenue fund on receipt thereof. Anyamount not surrendered at year end is reflected as a current payable in the Statement of FinancialPosition.
5.4 Bank overdraftThe bank overdraft is carried in the Statement of Financial Position at cost.
5.5 PayablesRecognised payables mainly comprise of amounts owing to other governmental entities. Thesepayables are recognised at historical cost in the Statement of Financial Position.
5.6 Contingent liabil itiesContingent liabilities are included in the Disclosure Notes to the Financial Statements.
5.7 CommitmentsCommitments are not recognised in the Statement of Financial Position as a liability or asexpenditure in the Statement of Financial Performance but are included in the Disclosure Notes.
5.8 AccrualsAccruals are not recognised in the Statement of Financial Position as a liability or as expenditure inthe Statement of Financial Performance but are included in the Disclosure Notes.
Department of Labour - Vote 15
Accounting Policies for the year ended 31 March 2009

1 April 2008 - 31 March 2009129
Annual Report
5.9 Employee benefitsShort-term employee benefits that give rise to a present legal or constructive obligation aredisclosed in the Disclosure Notes to the Financial Statements. These amounts are not recognised inthe Statement of Financial Performance or the Statement of Financial Position.
5.10 Lease commitmentsFinance leasesFinance leases are not recognised as assets and liabilities in the Statement of Financial Position.Finance lease payments are recognised as an expense in the Statement of Financial Performance andare apportioned between the capital and the interest portions. The finance lease liability is disclosedin the Disclosure Notes to the Financial Statements.
Operating leasesOperating lease payments are recognised as an expense in the Statement of Financial Performance.The operating lease commitments are disclosed in the Disclosure Notes to the Financial Statements.
6. Receivables for departmental revenueReceivables for departmental revenue are disclosed in the Disclosure Notes to the Annual FinancialStatements.
7. Net Assets7.1 Capitalisation reserveThe capitalisation reserve comprises of financial assets and/or liabilities originating in a priorreporting period but which are recognised in the Statement of Financial Position for the first time inthe current reporting period. Amounts are transferred to the National/Provincial Revenue Fund ondisposal, repayment or recovery of such amounts.
7.2 Recoverable revenueAmounts are recognised as recoverable revenue when a payment made in a previous financial yearbecomes recoverable from a debtor in the current financial year.
8. Related party transactionsSpecific information with regards to related party transactions is included in the Disclosure Notes.
9. Key management personnelCompensation paid to key management personnel including their family members where relevant, isincluded in the Disclosure Notes.
10. Public private partnershipsA description of the PPP arrangement, the contract fees and current and capital expenditure relatingto the PPP arrangement is included in the Disclosure Notes.
Department of Labour - Vote 15
Accounting Policies for the year ended 31 March 2009

1 April 2008 - 31 March 2009130
1. Annual appropriation
1.1 Annual appropriation
Included are funds appropriated in terms of the Appropriation Act (and the Adjustments Appropriation Act) for NationalDepartments (Voted funds) and Provincial Departments:
Final
appropriation
Actual funds
received
Funds not
requested/not
received
Appropriation
received
2007/08
R'000 R'000 R'000 R'000
Administration 384 207 384 207 - 365 653
Service Delivery 702 331 702 331 - 665 409
Employment and Skills Development
Services / Human Resource Development178 465 178 465 - 575 039
Labour Policy and Labour Market
Programmes472 102 472 102 - 421 763
Social Insurance 10 501 10 501 - 10 001
Total 1 747 606 1 747 606 - 2 037 865
Note 2008/09 2007/08
R'000 R'000
2. Statutory appropriation
Sector Education and Training Authorities (SETAs) 5 787 308 5 027 445
National Skills Fund 1 446 827 1 256 861
Total 7 234 135 6 284 306
Actual Statutory Appropriation received 7 234 135 6 284 306
3. Departmental revenue
Sales of goods and services other than capital assets 3.1 4 654 4 055
Fines, penalties and forfeits 3.2 436 395
Interest, dividends and rent on land 3.3 3 905 1 283
Financial transactions in assets and liabilities 3.4 19 868 2 715
Departmental revenue collected 28 863 8 448
3.1 Sales of goods and services other than capital assets
Sales of goods and services produced by the Department 3 4 608 3 968
Sales by market establishment 584 482
Administrative fees 2 340 2 081
Other sales 1 684 1 405
Sales of scrap, waste and other used current goods 46 87
Total 4 654 4 055
Annual Report
Department of Labour - Vote 15
Notes to the Annual Financial Statements for the year ended 31 March 2009

Note 2008/09 2007/08
R'000 R'000
3.2 Fines, penalties and forfeits 3
Fines 436 395
Total 436 395
3.3 Interest, dividends and rent on land 3
Interest 3 905 1 283
Total 3 905 1 283
3.4 Financial transactions in assets and liabilities 3
Receivables 2 081 1 040
Stale cheques written back 7 9
Other receipts including recoverable revenue 17 780 1 666
Total 19 868 2 715
4. Compensation of employees
4.1 Salaries and wages
Basic salary 376 808 378 210
Performance award 8 894 7 058
Service based 435 35
Compensative/circumstantial 7 122 5 385
Other non-pensionable allowances 67 672 67 871
Total 460 931 458 559
4.2 Social contributions
Employer contributions
Pension 49 758 55 257
Medical 30 645 29 895
Bargaining Council 93 115
Total 80 496 85 267
Total compensation of employees 541 427 543 826
Average number of employees 3 079 3 881
1 April 2008 - 31 March 2009131
Annual Report
Department of Labour - Vote 15
Notes to the Annual Financial Statements for the year ended 31 March 2009

1 April 2008 - 31 March 2009132
Note 2008/09 2007/08
R'000 R'000
5. Goods and services
Administrative fees 2 633 176
Advertising 34 629 26 734
Assets less then R5 000 5.1 5 901 6 578
Bursaries (employees) 2 447 2 391
Catering 4 172 4 934
Communication 45 060 49 315
Computer services 5.2 119 425 87 699
Consultants, contractors and agency/outsourced Services 5.3 40 756 78 258
Entertainment 297 368
Audit cost – external 5.4 29 918 18 245
Inventory 5.5 38 795 32 917
Operating leases 87 877 78 182
Owned and leasehold property expenditure 5.6 21 308 31 131
Transport provided as part of the departmental activities 40 157
Travel and subsistence 5.7 111 557 109 511
Venues and facilities 18 263 18 010
Training and staff development 9 885 12 514
Other operating expenditure 5.8 2 678 5 322
Total 575 641 562 442
5.1 Assets less than R5 000
Tangible assets 5
Machinery and equipment 5 901 6 578
Total 5 901 6 578
5.2 Computer services 5
SITA computer services 27 615 11 522
External computer service providers 91 810 76 177
Total 119 425 87 699
5.3 Consultants, contractors and agency/outsourced services 5
Business and advisory services 2 234 260
Infrastructure and planning 1 330 1 017
Legal costs 2 307 1 243
. Contractors 15 443 46 353
Agency and support/outsourced services 19 442 29 385
Total 40 756 78 258
Annual Report
Department of Labour - Vote 15
Notes to the Annual Financial Statements for the year ended 31 March 2009

1 April 2008 - 31 March 2009133
Annual Report
Department of Labour - Vote 15
Notes to the Annual Financial Statements for the year ended 31 March 2009
Note 2008/09 2007/08
R'000 R'000
5.4 Audit cost – external 5
Regularity audits 29 918 17 504
Performance audits - 741
Total 29 918 18 245
5.5 Inventory 5
Learning and teaching support material 62 15
Food and food supplies 1 721 1 416
Fuel, oil and gas 1 131 1 226
Other consumable materials 2 731 2 269
Maintenance material 5 592 4 445
Stationery and printing 27 531 23 535
Medical supplies 27 11
Total 38 795 32 917
5.6 Owned and leasehold property expenditure 5
Municipal services 13 376 11 804
Property management fees 668 590
Other 7 264 18 737
Total 21 308 31 131
5.7 Travel and subsistence
Local 5 101 870 103 490
Foreign 9 687 6 021
Total 111 557 109 511
5.8 Other operating expenditure
Professional bodies, membership and subscription fees 139 91
Resettlement costs 1 148 1 851
Other 1 391 3 380
Total 2 678 5 322

1 April 2008 - 31 March 2009134
Annual Report
Department of Labour - Vote 15
Notes to the Annual Financial Statements for the year ended 31 March 2009
Note 2008/09 2007/08
R'000 R'000
6. Financial transactions in assets and liabilities
Other material losses written off 6.1 2 092 -
Debts written off 6.2 2 160 2 314
Total 4 252 2 314
6.1 Other material losses written off
Nature of losses 6
Salary overpayment 1 078 -
Irregular expenditure 1 014 -
Total 2 092 -
6.2 Debts written off
Nature of losses 6
Staff debts 2 106 2 314
Other 54 -
Total 2 160 2 314
6.3 Recoverable revenue written off
Nature of losses
Breach of contract Stat Chg
in NA
30 15
Total 30 15
7. Transfers and subsidies
Departmental agencies and accounts Annex 1A 7 620 160 6 655 553
Foreign governments and international organisations Annex 1C 10 377 7 416
Public corporations and private enterprises Annex 1B 5 080 400 000
Non-profit institutions Annex 1D 103 277 46 361
Households Annex 1E 3 433 3 335
Gifts, donations and sponsorships made Annex 1F 1 206 -
Total 7 743 533 7 112 665

NNote 2008/09 2007/08
R'000 R'000
8. Expenditure for capital assets
Tangible assets 12 123 11 680
Buildings and other fixed structures 30.1 3 367 6 260
Machinery and equipment 28.1 8 756 5 420
Total 12 123 11 680
8.1 Analysis of funds utilised to acquire capital assets – 2008/09
Voted funds Aid assistance Total
R’000 R’000 R’000
Tangible assets
Buildings and other fixed structures 3 367 - 3 367
Machinery and equipment 8 756 - 8 756
Total 12 123 - 12 123
Analysis of funds utilised to acquire capital assets – 2007/08
Total assets acquired 11 680 - 11 680
9. Cash and cash equivalents
Note 2008/09 2007/08
R'000 R'000
Consolidated Paymaster - General Account 60 651 23 110
Cash receipts 7 -
Disbursements 95 8
Cash on hand 520 396
Total 61 273 23 514
1 April 2008 - 31 March 2009135
Annual Report
Department of Labour - Vote 15
Notes to the Annual Financial Statements for the year ended 31 March 2009

1 April 2008 - 31 March 2009136
Annual Report
11. Receivables
2008/09 2007/08
NoteLess than
one year
One to three
years
Older than
three yearsTotal Total
R’000 R’000 R’000 R’000 R’000
Claims recoverable11.1
Annex 3670 3 912 34 095 38 677 60 241
Recoverable expenditure 11.2 981 - - 981 -
Staff debt 11.3 2 966 5 227 9 517 17 710 15 635
Other debtors 11.4 46 16 64 126 1 753
Total 4 663 9 155 43 676 57 494 77 629
11.1 Claims recoverable
Note 2008/09 2007/08
11 R'000 R'000
National departments 1 222 483
Provincial departments 69 45
Public entities 37 331 59 679
Private enterprises 43 -
Local governments 12 34
Total 38 677 60 241
11.2 Recoverable expenditure (disallowance accounts) 11
Disallowance 981 -
Total 981 -
11.3 Staff debt 11
Staff debtors 17 710 15 635
Total 17 710 15 635
Department of Labour - Vote 15
Notes to the Annual Financial Statements for the year ended 31 March 2009
Note 2008/09 2007/08
R'000 R'000
10. Prepayments and advances
Travel and subsistence 339 779
Advances paid to other entities 938 1 223
Total 1 277 2 002

NNote 2008/09 2007/08
R'000 R'000
11.4 Other debtors 11
Clearing accounts 62 702
Disall dishonoured cheques 38 26
Irregular expenditure - 1 014
Arrear wages debt 26 11
Total 126 1 753
12. Voted funds to be surrendered to the Revenue Fund
Opening balance 89 244 39 955
Transfer from Statement of Financial Performance 104 765 89 244
Paid during the year (89 244) (39 955)
Closing balance 104 765 89 244
13. Departmental revenue to be surrendered to the Revenue Fund
Opening balance 891 112
Transfer from Statement of Financial Performance 28 863 8 448
Paid during the year (29 583) (7 669)
Closing balance 171 891
14. Payables – current
Description2008/09
Total
2007/08
Total
Amounts owing to other entities Annex 4 118 965
Clearing accounts 14.1 3 392 2 243
Other payables 14.2 611 502
Total 4 121 3 710
14.1 Clearing accounts 14
Salary control accounts 3 392 2 243
Total 3 392 2 243
14.2 Other payables 14
Recoverable expenditure 570 469
Arrear wages 41 33
Total 611 502
1 April 2008 - 31 March 2009137
Annual Report
Department of Labour - Vote 15
Notes to the Annual Financial Statements for the year ended 31 March 2009

Department of Labour - Vote 15
Notes to the Annual Financial Statements for the year ended 31 March 2009
1 April 2008 - 31 March 2009138
Note 2008/09 2007/08
R'000 R'000
15. Net cash flow available from operating activities
Net surplus/(deficit) as per Statement of Financial Performance 133 628 97 692
Add back non cash/cash movements not deemed operating activities (85 433) (85 934)
(Increase)/decrease in receivables – current 20 135 (58 757)
(Increase)/decrease in prepayments and advances 725 6 156
(Increase)/decrease in other current assets - 1 260
Increase/(decrease) in payables – current 411 1 351
Expenditure on capital assets 12 123 11 680
Surrenders to Revenue Fund (118 827) (47 624)
Net cash flow generated by operating activities 48 195 11 758
16. Reconciliation of cash and cash equivalents for cash flow purposes
Consolidated Paymaster-General Account 60 651 23 110
Cash receipts 7 -
Disbursements 95 8
Cash on hand 520 396
Total 61 273 23 514
Annual Report

1 April 2008 - 31 March 2009139
Department of Labour - Vote 15
Disclosure Notes to the Annual Financial Statements for the year ended 31 March 2009
Annual Report
Note 2008/09 2007/08
R'000 R'000
These amounts are not recognised in the Annual Financial Statements and are disclosed to enhance the usefulness of the
Annual Financial Statements.
17. Contingent liabilities
Liable to Nature
Motor vehicle guarantees Employees Annex 2A 191 254
Housing loan guarantees Employees Annex 2A 11 654 12 881
Claims against the Department Annex 2B 2 861 919
Other departments (interdepartmental unconfirmed balances) Annex 4 13 324 408
Total 28 030 14 462
18. Commitments
Current expenditure
Approved and contracted 12 903 7 127
Approved but not yet contracted - -
Total commitments 12 903 7 127
19 Accruals
Listed by economic classification
30 Days 30+ Days Total Total
Compensation of employees - - - -
Goods and services 933 904 1 837 11 552
Buildings and other fixed structures - 872 872 -
Machinery and equipment 55 201 256 -
Total 988 1 977 2 965 11 552
Listed by programme level
Programme 1 – Administration 109 5 973
Programme 2 – Service Delivery 1 905 5 191
Programme 3 – ESDS/HRD 933 307
Programme 4 – LP & LMP 18 81
Total 2 965 11 552

LLand Buildings and
other fixed
structures
Machinery and
equipment
Total
21. Lease commitments
21.1 Operating leases expenditure
2008/09
Not later than 1 year - - - -
Later than 1 year and not later than 5 years - - 5 5
Total lease commitments 5 5
2007/08
Not later than 1 year - - 15 15
Later than 1 year and not later than 5 years - - 5 5
Total lease commitments 20 20
21.2 Finance leases expenditure**
2008/09
Not later than 1 year - - 3 556 3 556
Later than 1 year and not later than 5 years - - 3 853 3 853
Later than 5 years
Total lease commitments - - 7 409 7 409
Less: finance costs - - - -
Total present value of lease liabilities - - 7 409 7 409
2007/08
Not later than 1 year - - 2 472 2 472
Later than 1 year and not later than 5 years - - 2 910 2 910
Later than 5 years
Total lease commitments - - 5 382 5 382
Less: finance costs - - - -
Total present value of lease liabilities - - 5 382 5 382
**This note excludes leases relating to public private partnership as they are separately disclosed to note no.26.
Note: The considerable increase for the 2008/09 financial year is mainly due to expired contracts renewed during this
financial year.
Note 2008/09 2007/08
R'000 R'000
20. Employee benefits
Leave entitlement 18 902 15 683
Thirteenth cheque 16 747 16 045
Performance awards - 81
Capped leave commitments 34 195 32 347
Total 69 844 64 156
1 April 2008 - 31 March 2009
Department of Labour - Vote 15
Disclosure Notes to the Annual Financial Statements for the year ended 31 March 2009
Annual Report
140

223.3 Details of irregular expenditure condoned
Incident Condoned by
(condoning authority)
2008/09
R’000
Amount not approved by the Subtender Committee Director-General 1 439
Expenditure in contravention with tender procedure Director-General 45
Overtime not approved timeously Director-General 40
Total 1 524
Note 2008/09 2007/08
R'000 R'000
22. Receivables for departmental revenue
Sales of goods and services other than capital assets - -
Fines, penalties and forfeits - -
Interest, dividends and rent on land 53 -
Financial transactions in assets and liabilities - -
Total 53 -
23. Irregular expenditure
23.1 Reconciliation of irregular expenditure
Opening balance 1 014 1 012
Add: Irregular expenditure – relating to prior year - 2
Add: Relating to prior year not disclosed 510 -
Add: Irregular expenditure - relating to current year 716
Less: Amounts condoned (1 524) -
Irregular expenditure awaiting condonation 716 1 014
Analysis of awaiting condonation per age classification
Current year 716 2
Prior years - 1 012
Total 716 1 014
23.2 Details of irregular expenditure current year
Incident
No prior approval obtained from Executive Authority as required by a DPSA circular 216
Transfer payments without a signed service level agreement 500
Total 716
1 April 2008 - 31 March 2009
Department of Labour - Vote 15
Disclosure Notes to the Annual Financial Statements for the year ended 31 March 2009
Annual Report
141

224. Related party transactions
The disclosure note exclude transfers and subsidies paid to related parties as these transactions are disclosed in annexure 1A
as well as disclosure of further relevant information in the report of the Accounting Officer note 2 and 5. The
under-mentioned entities are regarded as related parties of the Department:
Financial Accounting Service SETA
Banking SETA
Chemical Industry SETA
Clothing, Textiles, footwear and Leather SETA
Construction SETA
Education, Training and Development Practices SETA
Energy SETA
Food Beverages Manufacturing Industry SETA
Forest Industry SETA
Health and Welfare SETA
Information Systems, Electronics and Telecommunications Technologies Training SETA
Insurance SETA
Local Government, Water and Related Service SETA
Media Advertising, Publishing, Printing and Packaging SETA
Mining Qualifications SETA
Manufacturing Engineering SETA
Safety and Security Sector SETA
Agriculture Sector Education and Training Authority
Public Service SETA
Service SETA
Tourism and Hospitality Sector SETA
Transport SETA
Wholesale and Retail SETA
National Skills Fund
Unemployment Insurance Fund
Compensation Fund
No. of individuals 2008/09 2007/08
R'000 R'000
25. Key management personnel
Political office bearers (provide detail below)
Officials: 1 1 479 951
Level 15 to 16 4 3 083 2 791
Level 14 (incl. CFO if at a lower level) 17 10 123 11 308
Total 14 685 15 050
1 April 2008 - 31 March 2009
Department of Labour - Vote 15
Disclosure Notes to the Annual Financial Statements for the year ended 31 March 2009
Annual Report
142

1 April 2008 - 31 March 2009
26. Public Private Partnership
A desc r ipt ion of the a r rangement
Subsequent to obtaining Treasury Approval III from National Treasury in terms of Treasury Regulation 16, theDepartment of Labour entered into a Public Private Partnership Agreement (“PPP Agreement”) with SiemensBusiness Services (Proprietary) Limited (“private partner”), effective from 1 December 2002, to provideinformation technology related, infrastructure, services and management support to the Department of Labour,the Unemployment Insurance Fund and the Compensation Fund (“the Funds”) for a period of 10 years.
S ign i f icant te rms of the a r rangement that may a f fec t the amount , t iming and ce rta in ty offutu re cash f lows
The Department pays a fixed fee (“unitary fee”), which is subject to escalation with CPIX annually on 1 April.Significant terms that may affect the amount, timing or certainty of future cash flows are summarised below:
• Service credits
The Department is entitled to deduct service credits from the unitary fee if and when the quality of service fallsbelow the agreed service levels
• Additional services
Provision is made for additional services to be obtained from a table of rates that is adjusted annually by CPIXand benchmarked at three-yearly intervals. The private partner does not have an exclusive right to provideadditional services, but does however, have a “first call” option
• Variations
The contractual change management procedures make provision for the approval of changes in respect of thePPP Agreement via mutual agreement and payment will either be in the form of an agreed change in the unitaryfee or a lump sum payment
• Scalability
Provision is made for scalability of services within certain boundaries in terms of volume and usage. The unitaryfee may be adjusted for the following categories if the actual number of users exceeds the stipulatedbreakpoints:
- Number of end-user devices - Rural and urban spread of end-user devices - Number of end-user devices with high license and maintenance cost
• Excess profit regime
Any actual profits achieved by the private partner on the PPP Agreement above a stipulated percentage have tobe deposited in the re-investment fund by the private partner
• Foreign exchange rate mechanism
The PPP Agreement makes provision for sharing the risk of devaluation of the Rand over the PPP Agreementperiod. The Department’s risk in the event that the Rand devaluates outside certain agreed parameters iscapped and managed through a prescribed mechanism.
Nature and extent of the a r rangement
a. Rights to use specified assets
The beneficial use of, control and risks in respect of legacy assets were transferred to the private partner interms of the PPP Agreement.Legacy assets means the system of integrated computer hardware, operating systems software, departmentaldata, software, computer network and computer peripherals and the like used by the Department and the Fundsprior to the effective date of the PPP Agreement.
b. Obligations to provide or rights to expect provision of services
In terms of the PPP Agreement, the services to be provided by the private partner are divided into threecategories:• Initial services
Department of Labour - Vote 15
Disclosure Notes to the Annual Financial Statements for the year ended 31 March 2009
Annual Report
143

1 April 2008 - 31 March 2009
Immediately prior to the effective date of the PPP Agreement, the Department and the Funds provided their owninformation technology services. The initial services are continued by the private partner until such time as theyare replaced by other services explained in the following paragraph
• Improvement services
The private partner is required to develop a new information technology environment (hardware, network,operating systems, software applications and training) that is appropriate to support the business processes ofthe Department and the Funds
• Operational services
The private partner is required to operate, maintain, support and refresh the information technologyenvironment of the Department and the Funds at agreed service levels.
c. Obligations to acquire or build items of property, plant and equipment
The private partner has to acquire computer equipment to the extent necessary in order to deliver theimprovement services and operational services at the agreed service levels.
d. Obligation to deliver or rights to receive specified assets at the end of the concession period
On early termination of the PPP Agreement the information technology environment shall transfer to theDepartment upon payment of the relevant termination compensation to the private partner as set out in the PPPAgreement.
On expiry of the PPP Agreement (10 years after effective date) the information technology environment shalltransfer to the Department at no cost.
e. Renewal and termination options
The PPP Agreement provides the Department an option to renew the PPP Agreement for a further period of upto 10 years, provided that such renewal shall be on materially similar terms and conditions. The Department hasto exercise this option in writing by no later than 12 months prior to the expiry date of the PPP Agreement.
The Department may at expiry of the PPP Agreement, in its sole discretion, request support services for a12-month period in order to facilitate transition to any new arrangement.
The PPP Agreement makes provision for the following termination options:
• Department event of default • Private partner event of default • Termination on Force Majeure • Termination on corrupt gifts and fraud.
f. Other rights and obligations (e.g. major overhauls)
None, other than those underlying the improvement services and operational services.
g. Changes in the arrangement occurring during the period
None.
h. Reinvestment fund
The reinvestment fund is a separate bank account for purposes of administering and the separate safekeeping ofexcess profit, foreign exchange rate savings and service credits. The reinvestment fund may be used during theterm of the PPP Agreement to fund:
• The Department’s obligations in the event that the Rand devaluates outside certain agreed parameters • Additional services or variations • A reduction in unitary fee • Bank charges related to the reinvestment fund.
Any residual funds at the end of the PPP Agreement will be distributed to the party entitled to it, which is
Department of Labour - Vote 15
Disclosure Notes to the Annual Financial Statements for the year ended 31 March 2009
Annual Report
144

summarised below:
• Funds accumulated due to foreign exchange savings will be distributed to the Department • Funds accumulated due to excess profits will be shared equally between the Department and the private
partner • Funds accumulated due to service credits will be shared between the Department and the private partner,
depending on how the service credit originated.
As at 31 March 2009, the balance of the reinvestment fund was:
i. Expenditure for the financial year
The expenditure incurred over the past seven years paid to the private partner in terms of the PPP Agreement isas follow:
The Department makes all payments to the private partner in respect of the unitary fee element in terms of thePPP Agreement. The unitary fee element of the PPP Agreement is divided equally between the Department, theUnemployment Insurance Fund and the Compensation Fund, as agreed to in writing between the entities. TheUnemployment Insurance Fund and Compensation Fund pay their applicable portion of the unitary fee to theDepartment.
The cost of additional services is paid by the entity that requested the additional services. The UnemploymentInsurance Fund and Compensation Fund pay their applicable portion of the cost of additional services directly tothe private partner.
The table below provides a summary of payments made for the year ended 31 March 2009:
YYear ended Unitary fee Additional services Total
31 March 2003 R40 833 333 R nil R40 833 333
31 March 2004 R125 463 046 R36 806 561 R162 269 607
31 March 2005 R136 962 744 R22 646 145 R159 608 889
31 March 2006 R160 210 820 R14 130 604 R174 341 424
31 March 2007 R158 421 099 R21 988 865 R180 409 964
31 March 2008 R194 901 365 R11 386 879 R206 288 244
31 March 2009 R202 499 896 R 11 967 310 R214 467 206
2008/09 2007/08
Department of Labour 9 890 566 8 875 995
Compensation Fund 9 772 631 8 847 382
Unemployment Insurance Fund 9 856 317 8 839 423
Total 29 519 514 26 562 800
Payments type Total payments to
private partner
Department of Labour
portion
Unemployment Insurance
Fund portion
Compensation Fund
portion
R’000 R’000 R’000 R’000
Unitary fee 202 500 67 500 67 500 67 500
Additional services 11 968 7 867 3 803 298
Legacy claim 28 620 9 540 9 540 9 540
Total 243 088 84 907 80 843 77 338
1 April 2008 - 31 March 2009
Department of Labour - Vote 15
Disclosure Notes to the Annual Financial Statements for the year ended 31 March 2009
Annual Report
145
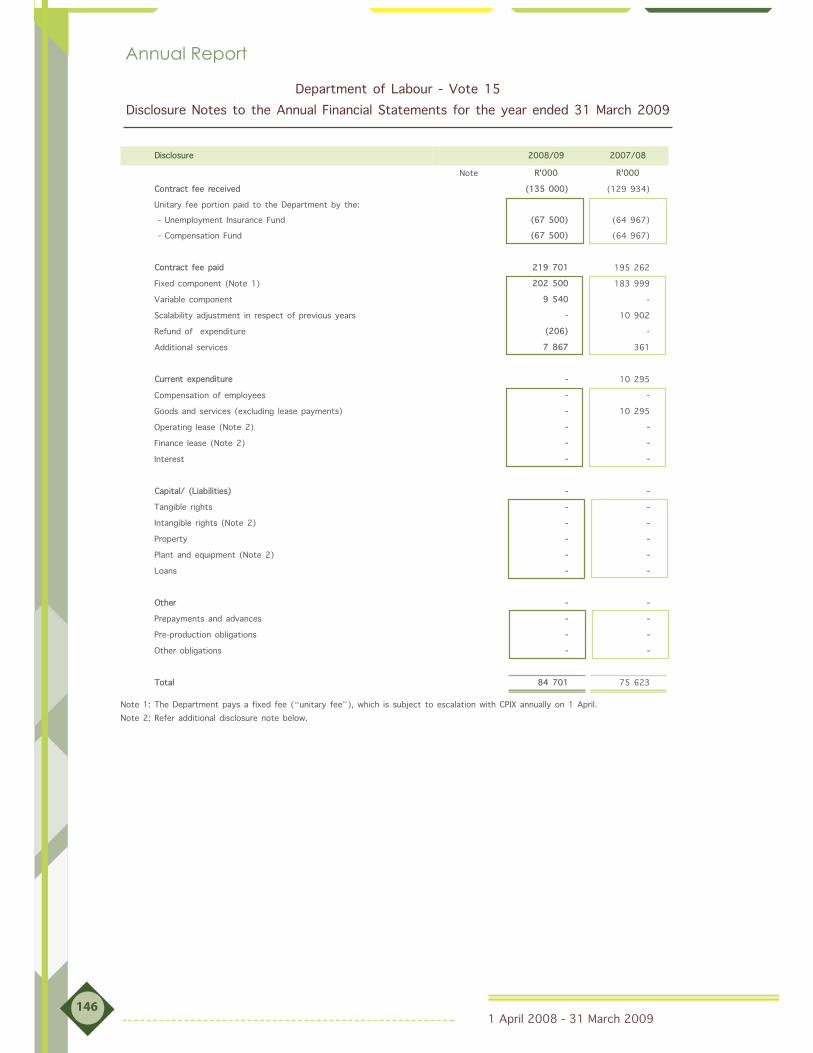
1 April 2008 - 31 March 2009146
Annual Report
Disclosure 2008/09 2007/08
Note R'000 R'000
Contract fee received (135 000) (129 934)
Unitary fee portion paid to the Department by the:
- Unemployment Insurance Fund (67 500) (64 967)
- Compensation Fund (67 500) (64 967)
Contract fee paid 219 701 195 262
Fixed component (Note 1) 202 500 183 999
Variable component 9 540 -
Scalability adjustment in respect of previous years - 10 902
Refund of expenditure (206) -
Additional services 7 867 361
Current expenditure - 10 295
Compensation of employees - -
Goods and services (excluding lease payments) - 10 295
Operating lease (Note 2) - -
Finance lease (Note 2) - -
Interest - -
Capital/ (Liabilities) - -
Tangible rights - -
Intangible rights (Note 2) - -
Property - -
Plant and equipment (Note 2) - -
Loans - -
Other - -
Prepayments and advances - -
Pre-production obligations - -
Other obligations - -
Total 84 701 75 623
Note 1: The Department pays a fixed fee (“unitary fee”), which is subject to escalation with CPIX annually on 1 April.
Note 2: Refer additional disclosure note below.
Department of Labour - Vote 15
Disclosure Notes to the Annual Financial Statements for the year ended 31 March 2009

AAddit i ona l d is c l osu re
The International Financial Reporting Committee (IFRIC) issued IFRIC 12 Service Concession Arrangements(IFRIC 12) in November 2006. IFRIC 12 is effective for periods commencing on or after 1 January 2008. IFRIC 12provides guidance on the financial reporting implications of a service concession arrangement in the financialstatements of the operator (private party). IFRIC 12 does not address the accounting treatment for the grantor(public entity). The Accounting Standards Board (ASB) in South Africa has issued guidance in respect of thegrantor’s (public entity’s) accounting treatment in such arrangements.
Certain aspects and disclosures relating to some forms of service concession arrangements are alreadyaddressed by existing standards and some aspects of service concessions are not addressed. The disclosuresrequired in terms of AC 429 (SIC29) Service Concession Arrangements Disclosures have been provided aboveand the disclosures in terms of GRAP 13 Leases are disclosed below to provide additional disclosure.
The following disclosures are made that indicate the potential effect on the Annual Financial Statements of theDepartment, should the Public Private Partnership Agreement be recognised in the Financial Statements as afinance lease.
Notes 28 and 29 of the Annual F inanc ia l Statements – Tangi b le and in tangib le cap i ta l assets
Notes 28 and 29 of the Annual Financial Statements: would require the following additions in respect of the PPPAgreement:
Physical Asset (tangible and intangible assets) Movement Schedule as at 31 March 2009
Opening balance Current year
adjustments to
prior year
balances
Additions Disposals Closing balance
Cost Cost Cost Cost Cost
Tangible assets
Computer equipment
- Legacy assets (Note 1) - - - - -
- Other assets (Note 2) 125 851 - 9 439 (373) 134 917
Intangible assets
Software development and
enhancements (Note 3)
58 557 - 9 455 - 68 012
Total tangible and intangible
assets
184 408 - 18 894 (373) 202 929
1 April 2008 - 31 March 2009147
Annual Report
Department of Labour - Vote 15
Disclosure Notes to the Annual Financial Statements for the year ended 31 March 2009
Annual Report

1 April 2008 - 31 March 2009148
Physical asset (tangible and intangible assets) movement schedule as at 31 March 2008
Note 1: Legacy assets means computer hardware used by the Department prior to the effective date of thePPP Agreement, the beneficial use of, control and risks in respect of which was transferred to the privatepartner. Due to the fact that the Annual Financial Statements have been prepared on a modified cash basis ofaccounting, all legacy assets were expensed in the Statement of Financial Performance when the finalauthorisation for payment was effected, thus prior to December 2002. The opening balance is therefore Rnil.
Note 2: Other assets means the progressive refurbishment and additions made by the private partner to thelegacy assets during the provision of the services, including those additions in respect of additional services.Other assets are stated at cost (being the cost price to the private partner, inclusive of VAT) and nodepreciation is included, although the assets have an estimated useful life of 3 years. If the Annual FinancialStatements are prepared on an accrual basis of accounting, the assets would be depreciated over their usefullives. The depreciation charge would be recognised in the Statement of Financial Performance on a straight-linebasis over three years. The carrying value of the assets would decrease as the asset is depreciated.
Note 3: Software development and enhancements means the software improvements made by the privatepartner during the provision of the services, including those improvements in respect of additional serviceswhere the actual cost of such improvements are known and the improvements meets the definition of an asset.Software development and enhancements are stated at cost (being the cost price to the private partner,inclusive of VAT) and no amortisation is included, although the assets have an estimated useful life of threeyears. The cost to the private partner of software development and enhancement is in most cases not known tothe Department and in these cases the assets are excluded from the disclosure of software development andenhancements. If the Annual Financial Statements are prepared on an accrual basis of accounting, the assetswould be recognised as the Department’s intangible assets and amortised over their useful lives. Theamortisation charge would be recognised in the Statement of Financial Performance on a straight-line basis overthree years. The carrying value of the assets would decrease as the asset is depreciated. Software developmentand enhancements costs running over more than one financial year relating to assets, are only capitalised asassets on completion of the project and at the total cost incurred over the duration of the project.
Note 4: During the year, updated asset information was received from Siemens. This information has had animpact on prior year disclosure and the effect of this has been incorporated in the the prior year disclosures onthe Physical Asset movement schedule above as well as the prior year disclosures that follow.
Annual Report
Department of Labour - Vote 15
Disclosure Notes to the Annual Financial Statements for the year ended 31 March 2009
Opening balance Current year
adjustments to
prior year
balances
Additions Disposals Closing balance
Cost Cost Cost Cost Cost
R'000 R'000 R'000 R'000 R'000
Tangible assets
Computer equipment
- Legacy assets (Note 1) - - - - -
- Other assets (Note 2) 115 273 - 10 578 - 125 851
Intangible assets
Software development and
enhancements (Note 3)
51 918 - 6 639 - 58 557
Total tangible and intangible
assets
167 191 - 17 217 - 184 408

1 April 2008 - 31 March 2009149
Annual Report
Department of Labour - Vote 15
Disclosure Notes to the Annual Financial Statements for the year ended 31 March 2009
Note 5 : Annua l F i nancial S tatements Goods and Serv i ces
Note 5 of the Annual Financial Statement would require the following additions in respect of the PPP Agreement:
Note 21 of the Annua l F i nanci al Statements – Fi nance Leases
Note 21.1 of the Annual Financial Statements would require the following additions in respect of the PPPAgreement.
Note: The above includes only tangible assets.
The above disclosures (in respect of Note 5 and 21.2) are based on the following information andcalculations:
2008/09 2007/08
R'000 R'000
Computer Services 201 267 188 690
Public Private Partnership Agreement in respect of information technology:
Total
2008/09
Total
2007/08
R'000 R'000
For the current financial year 13 200 17 598
Not later than 1 year 22 992 13 200
Later than 1 year and not later than 5 years 120 226 143 217
Later than five years - -
Present value of lease liabilities (deemed entered into as at year end) 9 868 12 986
Year ends Months in
period
Unitary fee Additional
service fee
Total
payments
to private
partner
Capital
expenditure
by private
partner
“Deemed”
lease
payments
Interest
element of
“deemed”
lease
payments
Computer
Services
R’000 R’000 R’000 R’000 R’000 R’000 R’000
1 December
2003 to 31
March 2003
4 40 833 - 40 833 - - - 40 833
1 April 2003
to 31 March
2004
12 125 463 36 807 162 270 34 184 12 871 2 381 149 399
1 April 2004
to 31 March
2005
12 136 963 22 646 159 609 44 976 29 804 4 633 129 805
1 April 2005
to 31 March
2006
12 160 211 14 131 174 342 20 459 37 509 3 948 136 833

1 April 2008 - 31 March 2009
The unitary fee for years subsequent to 31 March 2009 has not been adjusted for inflation after31 March 2009 and has been assumed to be the planned expenditure as reflected in the currentfinancial model. However, the PPP Agreement makes provision for an annual increase in the unitaryfee by inflation. The additional service fee for subsequent years has been stated as Rnil, as thevalue of future commitments regarding additional services will only be known in those futureperiods.
Capital expenditure includes tangible assets only and is based on the actual cost, including VAT,incurred by the private partner up to 31 March 2009 for computer equipment. All subsequent yearsare based on the planned expenditure by the private partner in respect of tangible assets.
“Deemed” lease payments have been calculated based on the capital expenditure, the weightedaverage government borrowing rate (being 8,775%), a lease period of the shorter of three years(being an assumed average economic life for computer hardware and software development andenhancements) or the remaining period of the PPP Agreement, monthly lease payments in arrearsand assuming that all capital expenditure in a year is incurred on the first day of the financial year.
“Computer Services” relating to the PPP has been calculated as the unitary fee plus the additionalservice fee less the calculated “deemed” lease payments.
Year ends Months in
period
Unitary fee Additional
service fee
Total payments
to private
partner
Capital
expenditure by
private partner
“Deemed”
lease payments
Interest
element of
“deemed”
lease payments
Computer
Services
R’000 R’000 R’000 R’000 R’000 R’000 R’000
1 April 2006
to 31 March
2007
12 158 421 21 989 180 410 15 654 30 532 2 710 149 878
1 April 2007
to 31 March
2008
12 194 901 11 387 206 288 10 578 17 598 1 779 188 690
1 April 2008
to 31 March
2009
12 202 500 11 967 214 467 8 692 13 200 1 390 201 267
1 April 2009
to 31 March
2010
12 202 500 - 202 500 41 242 22 992 3 713 179 508
1 April 2010
to 31 March
2011
12 202 500 - 202 500 34 548 33 569 4 681 168 931
1 April 2011
to 31 March
2012
12 202 500 - 202 500 34 943 52 876 4 439 149 624
1 April 2012
to 31 March
2013
8 135 000 - 135 000 8 698 33 780 1 085 101 220
Total 120 1 761 792 118 927 1 880 719 253 974 284 731 30 759 1 595 988
Department of Labour - Vote 15
Disclosure Notes to the Annual Financial Statements for the year ended 31 March 2009
Annual Report
150

1 April 2008 - 31 March 2009
The table below provides reconciliation between the Department’s portion in respect of the PPP Agreement andthe total payments made to the private partner:
Department of Labour - Vote 15
Disclosure Notes to the Annual Financial Statements for the year ended 31 March 2009
Annual Report
151
Total
2008/09
Total
2007/08
R'000 R'000
Total Computer Services in respect of the PPP (additional disclosure in respect of Note 5) 201 267 188 690
Allocated to the Department of Labour 62 167 47 730
Allocated to Unemployment Insurance Fund 71 302 75 190
Allocated to Compensation Fund 67 798 65 770
“Deemed” finance lease payments by the Department of Labour (additional disclosure in
respect of Note 21.2)
13 200 17 598
Total payments to the private partner 214 467 206 288
Payments allocated to the Department of Labour as per the Statement of Financial Per-
formance
“Deemed” finance lease payments 13 200 17 598
Computer Services 62 167 47 730
Total payments by the Department of Labour (included in Note 5) 75 367 65 328
28. Movable tangible capital assets
Movement in movable tangible capital assets per asset register for the year ended 31 March 2009
Opening balance Current year
adjustments to
prior year
balances
Additions Disposals Closing balance
R'000 R'000 R'000 R'000 R'000
Machinery and equipment 106 325 6 498 18 722 (20 995) 110 550
Transport assets 9 857 2 618 - - 12 475
Computer equipment 31 109 (3 579) 1 790 (12 863) 16 457
Furniture and office equipment 34 222 2 776 10 930 (6 617) 41 311
Other machinery and equipment 31 137 4 683 6 002 (1 515) 40 307
Total movable tangible capital assets 106 325 6 498 18 722 (20 995) 110 550
27. Provisions
2008/09 2007/08
R'000 R'000
Potential irrecoverable debts
Private enterprises 94 -
Staff debtors 7 492 8 853
Other debtors 1 932 87
Claims recoverable - 531
Total 9 518 9 471

228.1 Additions
Additions to movable tangible capital assets per asset register for the year ended 31 March 2009
Cash Non-cash (Capital work in
progress
current costs
and finance
lease pay-
ments)
Received cur-
rent, not paid
(Paid current
year, received
prior year)
Total
R'000 R'000 R'000 R'000 R'000
Machinery and equipment 8 756 9 754 - 212 18 722
Computer equipment 6 1 746 - 38 1 790
Furniture and office equipment 6 492 4 316 - 122 10 930
Other machinery and equipment 2 258 3 692 - 52 6 002
Total additions to movable tangible
capital assets
8 756 9 754 - 212 18 722
28.2 Disposals
Disposals of movable tangible capital assets per asset register for the year ended 31 March 2009
Sold for cash Transfer out or
destroyed or
scrapped
Total disposals Cash Received
Actual
R'000 R'000 R'000 R'000
Machinery and equipment - 20 995 20 995 -
Computer equipment - 12 863 12 863 -
Furniture and office equipment - 6 617 6 617 -
Other machinery and equipment - 1 515 1 515 -
Total disposal of movable tangible
capital assets- 20 995 20 995 -
28.3 Movement for 2007/08
Movement in movable tangible capital assets per asset register for the year ended 31 March 2008
Opening balance Additions Disposals Closing balance
R'000 R'000 R'000 R'000
Machinery and equipment 103 131 5 378 (2 184) 106 325
Transport assets 9 857 - - 9 857
Computer equipment 31 234 88 (213) 31 109
Furniture and office equipment 32 392 3 099 (1 269) 34 222
Other machinery and equipment 29 648 2 191 (702) 31 137
Total movable tangible assets 103 131 5 378 (2 184) 106 325
1 April 2008 - 31 March 2009
Annual Report
Department of Labour - Vote 15
Disclosure Notes to the Annual Financial Statements for the year ended 31 March 2009
152

1 April 2008 - 31 March 2009
Annual Report
Department of Labour - Vote 15
Disclosure Notes to the Annual Financial Statements for the year ended 31 March 2009
153
29. Intangible capital assets
Movement in intangible capital assets per asset register for the year ended 31 March 2009
Opening balance Current year
adjust-ments to
prior year
balances
Additions Disposals Closing balance
R'000 R'000 R'000 R'000 R'000
Computer software 7 028 - - 6 998 30
Services and operating rights 23 - - - 23
Other intangibles 71 - - 71 -
Total intangible capital assets 7 122 - - 7 069 53
28.4 Minor assets
Minor assets of the department for the year ended 31 March 2009
Intangible
assets
Heritage assets Machinery and
equipment
Biological
assets
Total
R'000 R'000 R'000 R'000 R'000
Minor assets - - 82 177 - 82 177
Total - - 82 177 - 82 177
Number of minor assets - - 101 258 - 101 258
Total - - 101 258 - 101 258
29.1 Additions
Additions to intangible capital assets per asset register for the year ended 31 March 2009
Cash Non-Cash (Develop-ment
work in
progress –
current costs)
Received
current year,
not paid (Paid
current year,
received prior
year)
Total
R'000 R'000 R'000 R'000 R'000
Computer software - - - - -
Other intangibles - - - - -
Total additions to intangible capital
assets- - - - -
29.2 Disposals
Disposals of intangible capital assets per asset register for the year ended 31 March 2009
Sold for cash Transfer out or
destroyed or
scrapped
Total disposals Cash received
actual
R'000 R'000 R'000 R'000 R'000
Computer software - 6 998 6 998 -
Other intangibles - 71 71 -
Total disposals of intangible capital
assets- 7 069 7 069 -

** An amount of R24 009 was budgeted and paid by this Department for capital projects on buildings owned by the Department of
Public Works
30.2 Disposals
Disposals of immovable tangible capital assets per asset register for the year ended 31 March 2009
Sold for cash Transfer out or
destroyed or
scrapped
Total disposals Cash received
actual
R'000 R'000 R'000 R'000 R'000
Buildings and other fixed structures - - - -
Non-residential buildings - - - -
Total disposals of immovable tangible
capital assets- - - -
1 April 2008 - 31 March 2009
30. Immovable tangible capital assets
Movement in immovable tangible capital assets per asset register for the year ended 31 March 2009
Opening balance Current year
adjust-ments to
prior year
balances
Additions Disposals Closing balance
Buildings and other fixed structures 23 203 (1 729) 3 367 - 24 841
Non-residential buildings 23 203 (1 729) 3 367 - 24 841
Total immovable tangible capital assets 23 203 (1 729) 3 367 - 24 841 *
30.1 Additions
Additions to immovable tangible capital assets per asset register for the year ended 31 March 2009
Cash Non-Cash Capital work in
progress
current costs
and finance
lease
payments)
Received
current year,
not paid (Paid
current year,
received prior
year)
Total
R'000 R'000 R'000 R'000 R'000
Building and other fixed structures - - - - -
Non-residential buildings 3 367 - - - 3 367
Total additions to immovable tangible
capital assets 3 367 - - - 3 367
Annual Report
Department of Labour - Vote 15
Disclosure Notes to the Annual Financial Statements for the year ended 31 March 2009
154
29.2 Movement for 2007/08
Movement in intangible capital assets per asset register for the year ended 31 March 2008
Opening balance Additions Disposals Closing balance
R'000 R'000 R'000 R'000
Computer software 7 028 - - 7 028
Services and operating rights 23 - - 23
Other intangibles 71 - - 71
Total 7 122 - - 7 122

330.3 Movement for 2007/08
Movement in immovable tangible capital assets per asset register for the year ended 31 March 2008
Opening balance Additions Disposals Closing balance
R'000 R'000 R'000 R'000
Buildings and other fixed structures 16 943 6 260 - 23 203
Non-residential buildings 16 943 6 260 - 23 203
Total immovable tangible assets 16 943 6 260 - 23 203
1 April 2008 - 31 March 2009
Annual Report
Department of Labour - Vote 15
Disclosure Notes to the Annual Financial Statements for the year ended 31 March 2009
155

1 April 2008 - 31 March 2009156
Annual Report
Annexure 1AStatement of transfers to departmental agencies and accounts
Annexure 1BStatement of transfers/subsidies to public corporations and private enterprises
Department of Labour - Vote 15
Annexures to the Annual Financial Statements for the year ended 31 March 2009
Department/ Agency/
Account
Transfer allocation Transfer 2007/08
Adjusted
appropriation act
Roll
overs
Adjustments Total
available
Actual
transfer
% of
available
funds
transferred
Appropriation act
R’000 R’000 R'000 R'000 R'000 % R’000
Compensation Fund 10 500 - - 10 500 6 366 61% 10 000
Unemployment Insurance
Fund1 - - 1 - - 1
Commission for Conciliation,
Mediation and Arbitration261 710 - - 261 710 261 710 100% 270 646
Productivity South Africa 28 138 - 13 000 41 138 41 138 100% 26 637
National Skills Fund 46 949 - - 46 949 46 949 100% 44 799
Strengh Civil Soc Lab Reb
Trans {Development Institute
for Training, Support and
Education for Labour
(DITSELA)}
13 373 - 2 530 15 903 15 903 100% 9 919
National Economic
Development and Labour
Council (NEDLAC)
13 959 - - 13 959 13 959 100% 13 348
Statutory:
Sector Education and Training
Authorities 6 023 680 - (236 372) 5 787 308 5 787 308 100% 5 027 445
National Skills Fund (20%) 1 505 920 - (59 093) 1 446 827 1 446 827 100% 1 256 861
Total 7 904 230 - (279 935) 7 624 295 7 620 160 6 659 656
Name of public
corporation/private
enterprise
Transfer allocation Expenditure 2007/08
Adjusted
appropriation
act
Roll
overs
Adjustments Total
available
Actual
transfer
% of
Available
funds
tranferred
Capital Current Appropriation
act
R’000 R’000 R'000 R'000 R'000 % R’000 R’000 R’000
Public corporations
Umsobomvu Youth
Fund5 080 - - 5 080 5 080 100.0 - - 400 000
Total 5 080 - - 5 080 5 080 - - 400 000

Annexure 1CStatement of transfers to foreign government and international organisations
Annexure 1DStatement of transfers to non-profit institutions
1 April 2008 - 31 March 2009157
Annual Report
Department of Labour - Vote 15
Annexures to the Annual Financial Statements for the year ended 31 March 2009
Foreign governments/
international organisations
Transfer allocation Transfer 2007/08
Adjusted
appropriation
act
Roll
overs
Adjustments Total
available
Actual
transfer
% of
available
funds
tranferred
Final
Appropriation
act
R’000 R’000 R'000 R'000 R'000 % R’000
Transfers
International Labour Organisation 7 150 - 2 627 9 777 9 777 100% 7 000
African Regional Labour Adm.
Centre539 - 61 600 600 100% 480
World Association of Public
Employment Services- - - - - 140
Total 7 689 - 2 688 10 377 10 377 7 620
Non-profit institutions Transfer allocation Transfer 2007/08
Adjusted
appropriation
act
Roll
overs
Adjustments Total
available
Actual
transfer
% of
available
funds
tranferred
Final
Appropriation
act
R’000 R’000 R'000 R'000 R'000 % R’000
Transfers
SA National Council for the Blind 249 - - 249 237 95% 237
Deaf Federation of South Africa 163 - - 163 105 64% 155
National Council for the Physical Disabled 200 - - 200 159 80% 191
Workcentres for people with disabilities 95 411 - - 95 411 95 411 100% 38 808
Workcentres for the blind 7 365 - - 7 365 7 365 100% 7 042
Total 103 388 - - 103 388 103 277 46 433

1 April 2008 - 31 March 2009158
Annexure 1EStatement of transfers to households
Annexure 1FStatement of gifts, donations and sponsorships made and remmissions, refunds andpayments made as an act of grace
Households Transfer allocation Expenditure 2007/08
Adjusted
appropriation
act
Roll
overs
Adjustments Total
available
Actual
transfer
% of
available
funds
tranferred
Appropriation
act
R’000 R’000 R'000 R'000 R'000 % R’000
Transfers
Leave gratuity 311 - 740 1 051 1 051 100% 3 345
Retirement benefits 179 - - 179 179 100% -
Severance package 444 - 1 759 2 203 2 203 100% -
Total 934 - 2 499 3 433 3 433 3 345
Annual Report
Department of Labour - Vote 15
Annexures to the Annual Financial Statements for the year ended 31 March 2009
Nature of gift, donation or sponsorship 2008/09 2007/08
R’000 R’000
Households 62 -
Public corporations 644 -
Non-profit institutions 500 -
Total 1 206 -

1 April 2008 - 31 March 2009159
Annexure 2AStatement of financial guarantees issued as at 31 March 2009 – local
Annual Report
Department of Labour - Vote 15
Annexures to the Annual Financial Statements for the year ended 31 March 2009
Guarantor institution Guarantee in
respect of
Original
guaranteed
capital
amount
Opening
balance
1 April
2008
Adjustment
to opening
balance
Guarantees
draw-downs
during the
year
Guarantees
repayments/
cancelled/
reduced/
released
during the
year
Closing
balance
31 March
2009
Realised
losses not
recoverable
i.e. claims
paid out
R’000 R’000 R’000 R’000 R’000 R’000 R’000
Stannic Motor vehicles 254 254 - - (63) 191 -
Housing
Standard Bank of SA Limited Housing loan
guarantee
1 934 1 934 (63) 18 (163) 1 726 -
Nedbank Limited (former Cape
of Good Hope)
Housing loan
guarantee
15 15 - - - 15 -
Nedbank Limited Housing loan
guarantee
1 688 1 688 (77) - (118) 1 493 -
Firstrand Bank Limited: FNB Housing loan
guarantee
1 712 1 712 (48) - (153) 1 511 -
Nedbank LTD Incorporating
BOE
Housing loan
guarantee
9 9 - - - 9 -
ABSA Housing loan
guarantee
3 391 3 391 (91) 74 (181) 3 193 -
Company Unique Finance
(PTY)
Housing loan
guarantee
198 198 - - (19) 179 -
Old Mutual Finance Limited Housing loan
guarantee
68 68 1 30 (19) 80 -
Peoples Bank (former FBC
Fidelity Bank)
Housing loan
guarantee
394 394 (53) - (13) 328 -
Nedbank LTD Incorp. NBS
(former Peoples Bank NBS)
Housing loan
guarantee
661 661 (11) - (59) 591 -
Firstrand Bank Limited: FNB
(former Saambou)
Housing loan
guarantee
969 969 (16) 33 (95) 891 -
Old Mutual Bank Division of
Nedbank (former PERM)
Housing loan
guarantee
1 411 1 411 (49) 18 (82) 1 298 -
Future Bank Corparation
Limited
Housing loan
guarantee
14 14 - - - 14 -
Ithala Limited Housing loan
guarantee
43 43 - - (28) 15 -
Free State Development
Corporation
Housing loan
guarantee
113 113 - - 113 -
VBS Mutual Bank Housing loan
guarantee
82 82 (1) - (15) 66 -
Mpumalanga Housing Finance
Unibank
Housing loan
guarantee
43 43 - - - 43 -
Albaraka Bank Housing loan
guarantee
11 11 - - - 11 -
ABSA Bank (former Unibank) Housing loan
guarantee
13 13 - - (13) - -
BOE Bank Limited Housing loan
guarantee
19 19 - - - 19 -
SA Home loans (PTY) LTD Housing loan
guarantee
34 34 - - - 34 -
Green Start Home Loans
(PTY) LTD
Housing loan
guarantee
33 33 (33) - - - -
MEEG Bank Housing loan
guarantee
26 26 (1) - - 25 -
Total 13 135 13 135 (442) 173 (1021) 11 845 -

Annexure 2BStatement of contingent liabilities as at 31 March 2009
Nature of liability Opening balance
01/04/2008
Liabilities
incurred during
the year
Liabilities
paid/cancelled/
reduced during
the year
Liabilities
recoverable
Closing balance
31/03/2009
R’000 R’000 R'000 R'000 R’000
Claims against the Department
Industry Training Board (446/07/99/MT) 476 - - - 476
W Kruger (11/10/2002/MT) 8 - - - 8
Casino National Training (794/09/00/MT) 385 - - - 385
C J de Vries (12/5/1/18/LM) 1 - - - 1
Local News Network (Pty) Ltd
(12/2/1/55/ZB)4 - - - 4
Fernhill Hotel (12/1/5/317/NR) hfkdsh 20 - - - 20
D Ntombela (12/1/5/318/NR) 25 - - - 25
SASA WU : NP Gwazela Case P53/06
(SM/PSG 925 – 04/05)- 530 - - 530
Dian Uys Brink (12/5/1/313/BT) - 1 412 - - 1 412
Total 919 1 942 - - 2 861
1 April 2008 - 31 March 2009160
Annual Report
Department of Labour - Vote 15
Annexures to the Annual Financial Statements for the year ended 31 March 2009

Annexure 3Claims recoverable
1 April 2008 - 31 March 2009161
Annual Report
Department of Labour - Vote 15
Annexures to the Annual Financial Statements for the year ended 31 March 2009
Government entity Confirmed balance outstanding Unconfirmed balance
outstanding
Total
31/03/2009 31/03/2008 31/03/2009 31/03/2008 31/03/2009 31/03/2008
R’000 R’000 R’000 R’000 R’000 R’000
Department
Correctional Services 68 42 - - 68 42
Agriculture 80 95 - - 80 95
Education 157 23 - - 157 23
Foreign Affairs 87 6 966 - 1 053 6
Health 168 74 - - 168 74
Public Works 157 87 - - 157 87
Traditional and Local Government
Affairs12 13 - - 12 13
Gauteng Shared Services 27 12 - - 27 12
KwaZulu-Natal Provincial Government 33 33 - - 33 33
Social Development 47 29 - - 47 29
Justice and Constitutional
Development57 17 - - 57 17
Communications 17 - - - 17 -
The Presidency 63 24 - - 63 24
Home Affairs 17 6 - - 17 6
Transport 23 16 - - 23 16
Water Affairs and Forestry 72 34 - - 72 34
National Treasury 28 13 - - 28 13
Minerals and Energy 21 12 - - 21 12
Safety an Security 9 5 - - 9 5
Provincial Local Government - 21 - - - 21
Economic Development 21 - - - 21 -
Department
Statistics South Africa 29 - - - 29 -
Welfare and Population Development 29 - - - 29 -
Housing 33 - - - 33 -
Public Service Commission 39 - - - 39 -
KZN Office of the Premier 9 - - - 9 -
Other government entities
Compensation Fund 16 182 51 273 - - 16 182 51 273
National Skills Fund (NSF) 5 646 8 406 - - 5 646 8 406
Unemployment Insurance Fund 15 420 - - - 15 420 -
Government Employees Pension Fund
(GEPF)49 - - - 49 -
South African Social Security Agency 34 - - - 34 -
Private enterprises
Companies and Intellectual Properties
Registration21 - - - 21 -
Siemens 22 - - - 22 -
Total 38 677 60 241 966 - 39 643 60 241

Annexure 4Inter-government payables
Government entity
Confirmed balance outstandingUnconfirmed balance
outstandingTotal
31/03/2009 31/03/2008 31/03/2009 31/03/2008 31/03/2009 31/03/2008
R’000 R’000 R’000 R’000 R’000 R’000
Departments
Current
Justice - - 82 408 82 408
Communications - 964 - - - 964
Compensation Fund 118 1 - - 118 1
Public Works - - 12 846 - 12 846 -
Provincial Treasury - - 42 - 42 -
Public Administration - - 354 - 354 -
Total 118 965 13 324 408 13 442 1 373
1 April 2008 - 31 March 2009162
Annual Report
Department of Labour - Vote 15
Annexures to the Annual Financial Statements for the year ended 31 March 2009

1 April 2008 - 31 March 2009163
Annual Report
Content Page
Report of the Auditor-General 164
Statement of Responsibility by the Accounting Officer 171
Report of the Accounting Officer 172
Balance Sheet 175
Income Statement 176
Statement of Changes in Equity 177
Cash Flow Statement 178
Accounting Policies 179
Notes to the Annual Financial Statements 189
The following supplementary information does not form part of the Annual Financial Statements and is unaudited:
Detailed Income Statement 197
Sheltered Employment Factories
Annual Financial Statements for the year ended 31 March 2009

REPORT OF THE AUDITOR-GENERAL TO PARLIAMENT ON THE FINANCIAL STATEMENTSAND PERFORMANCE INFORMATION OF SHELTERED EMPLOYMENT FACTORIES FOR THE YEARENDED 31 MARCH 2009
REPORT ON THE FINANCIAL STATEMENTS
Introduction
1. I have audited the accompanying financial statements of the Sheltered Employment Factorieswhich comprise the balance sheet as at 31 March 2009, income statement, statement ofchanges in equity and cash flow statement for the year then ended, and a summary ofsignificant accounting policies and other explanatory notes, as set out on pages 171 to 197.
The accounting officer’s responsibility for the financial statements
2. The accounting officer is responsible for the preparation and fair presentation of these financialstatements in accordance with South African Statements of Generally Accepted AccountingPractice (SA GAAP) as set out in note 1 and in the manner required by the Public FinanceManagement Act, 1999 (Act No. 1 of 1999) (PFMA) and for such internal control as theaccounting officer determines is necessary to enable the preparation of financial statements thatare free from material misstatement, whether due to fraud or error.
The Auditor-General’s responsibility
3. As required by section 188 of the Constitution of the Republic of South Africa, 1996 read withsection 4 of the Public Audit Act, (Act No. 25 of 2004) (PAA), my responsibility is to express anopinion on these financial statements based on my audit.
4. I conducted my audit in accordance with the International Standards on Auditing and GeneralNotice 616 of 2008, issued in Government Gazette No. 31057 of 15 May 2008. Thosestandards require that I comply with ethical requirements and plan and perform the audit toobtain reasonable assurance whether the financial statements are free from materialmisstatement.
5. An audit involves performing procedures to obtain audit evidence about the amounts anddisclosures in the financial statements. The procedures selected depend on the auditor’sjudgment, including the assessment of the risks of material misstatement of the financialstatements, whether due to fraud or error. In making those risk assessments, the auditorconsiders internal control relevant to the entity’s preparation and fair presentation of thefinancial statements in order to design audit procedures that are appropriate in thecircumstances, but not for the purpose of expressing an opinion on the effectiveness of theentity’s internal control. An audit also includes evaluating the appropriateness of accountingpolicies used and the reasonableness of accounting estimates made by management, as well asevaluating the overall presentation of the financial statements.
6. I believe that the audit evidence I have obtained is sufficient and appropriate to provide a basisfor my audit opinion.
Basis for qualified opinion
Inventory
7. Inventories are carried in the balance sheet at R15.8 million. Included in this amount is directlabour and manufacturing overhead costs of R1.5 million which were allocated to work inprogress and finished goods for wood and metal products using an historic allocation rate as thebasis. I was not able to obtain any evidence on the assumptions used to calculate the allocationrate and was thus unable to evaluate these assumptions to be able to determine the accuracy ofthe calculations. The Sheltered Employment Factories’ records did not permit the application ofadequate alternative procedures regarding this inventory. Consequently, I did not obtain
1 April 2008 - 31 March 2009164
Annual Report
�������������� ������������������������������������������������������������������ ����������������������������������� � ���������� !

sufficient appropriate audit evidence to satisfy myself as to the valuation of wood and metalwork in progress and finished goods.
QQualified opinion
8. In my opinion, except for the possible effects of the matter described in the Basis for qualifiedopinion paragraph, the financial statements present fairly, in all material respects, the financialposition of the Sheltered Employment Factories as at 31 March 2009 and its financialperformance and its cash flows for the year then ended, in accordance with South Africanstatements of Generally Accepted Accounting Practice and in the manner required by the PFMA.
Emphasis of matter(s)
I draw attention to the following matters, on which I do not express a qualified opinion:
Irregular expenditure
9. As disclosed in note 26 to the financial statements, irregular expenditure to the amount ofR3 702 440 was incurred, due to non-adherence to practice note number SCM 1 of 2003, issuedby National Treasury which requires a tax clearance certificate to be obtained as part of thestandard bid documents when awarding contracts.
Fruitless and wasteful expenditure
10. As disclosed in note 27 to the financial statements, Sheltered Employment Factories incurredfruitless and wasteful expenditure amounting to R278 514 on cellphone contracts and storagecosts.
Other matters
I draw attention to the following matters that relate to my responsibilities in the audit of thefinancial statements:
Governance framework
11. The governance principles that impact the auditor’s opinion on the financial statements arerelated to the responsibilities and practices exercised by the accounting officer and executivemanagement and are reflected in the internal control deficiencies and key governanceresponsibilities addressed below:
Internal control deficiencies
12. Section 38(1)(a)(i) of the PFMA states that the accounting officer must ensure that the tradingentity has and maintains effective, efficient and transparent systems of financial and riskmanagement and internal control. The table below depicts the root causes that gave rise to thedeficiencies in the system of internal control, which led to the qualified opinion. The root causesare categorised according to the five components of an effective system of internal control.(The number listed per component can be followed with the legend below the table.) In someinstances deficiencies exist in more than one internal control component.
13. The historic allocation of overheads to finished goods and work in progress is characterised bythe inadequate organisational structure resulting in significant risk not being identified to
1 April 2008 - 31 March 2009165
Par. no. Basis for qualified opinion CE RA CA IC M
6 Inventory 1 1,3 3 1,2 3
Annual Report
�������������� ������������������������������������������������������������������ ����������������������������������� � ���������� !

enhance the achievement of financial reporting objectives. The entity does not have individualscompetent in financial reporting and related oversight roles. The accounting policies are alignedto National Treasury guidelines and not to the accounting framework. Ongoing monitoring andsupervision are not undertaken to enable an assessment of the effectiveness of internal controlover financial reporting.
1 April 2008 - 31 March 2009166
Legend
CE = Control environment
The organisational structure does not address areas of responsibility and lines of reporting to support effective control
over financial reporting.
1
Management and staff are not assigned appropriate levels of authority and responsibility to facilitate control over
financial reporting.
2
Human resource policies do not facilitate effective recruitment and training, disciplining and supervision of personnel. 3
Integrity and ethical values have not been developed and are not understood to set the standard for financial reporting. 4
The accounting officer/accounting authority does not exercise oversight responsibility over financial reporting and
internal control.
5
Management’s philosophy and operating style do not promote effective control over financial reporting. 6
The entity does not have individuals competent in financial reporting and related matters. 7
RA = Risk assessment
Management has not specified financial reporting objectives to enable the identification of risks to enable reliable
financial reporting.
1
The entity does not identify risks to the achievement of financial reporting objectives. 2
The entity does not analyse the likelihood and impact of the risks identified. 3
The entity does not determine a risk strategy/action plan to manage identified risks. 4
The potential for material misstatement due to fraud is not considered. 5
CA = Control activities
There is inadequate segregation of duties to prevent fraudulent data and asset misappropriation. 1
General information technology controls have not been designed to maintain the integrity of the information system and
the security of the data.
2
Manual or automated controls are not designed to ensure that the transactions have occurred, are authorised, and are
completely and accurately processed.
3
Actions are not taken to address risks to the achievement of financial reporting objectives. 4
Control activities are not selected and developed to mitigate risks over financial reporting. 5
Annual Report
�������������� ������������������������������������������������������������������ ����������������������������������� � ���������� !

KKey governance responsibilities
14. The PFMA tasks the accounting officer with a number of responsibilities concerning financial andrisk management and internal control. Fundamental to achieving this is the implementation ofkey governance responsibilities, which I have assessed as follows:
1 April 2008 - 31 March 2009167
Legend
CA = Control activities
Policies and procedures related to financial reporting are not established and communicated. 6
Realistic targets are not set for financial performance measures, which are in turn not linked to an effective reward
system.
7
IC = Information and communication
Pertinent information is not identified and captured in a form and time frame to support financial reporting. 1
Information required to implement internal control is not available to personnel to enable internal control responsibilities. 2
Communications do not enable and support the understanding and execution of internal control processes and
responsibilities by personnel.
3
M = Monitoring
Ongoing monitoring and supervision are not undertaken to enable an assessment of the effectiveness of internal control
over financial reporting.
1
Neither reviews by internal audit or the audit committee nor self -assessments are evident. 2
Internal control deficiencies are not identified and communicated in a timely manner to allow for corrective action to be
taken.
3
No. Matter Y N
Clear trail of supporting documentation that is easily available and provided in a timely manner
1. No significant difficulties were experienced during the audit concerning delays or the availability of
requested information.
✓
Quality of financial statements and related management information
2. The financial statements were not subject to any material amendments resulting from the audit. ✓
3. The annual report was submitted for consideration prior to the tabling of the auditor’s report. ✓
Timeliness of financial statements and management information
4. The annual financial statements were submitted for auditing as per the legislated deadlines (section
40 of the PFMA)
✓
Availability of key officials during audit
5. Key officials were available throughout the audit process. ✓
Annual Report
�������������� ������������������������������������������������������������������ ����������������������������������� � ���������� !

1 April 2008 - 31 March 2009168
No. Matter Y N
Development and compliance with risk management, effective internal control and governance practices
6. Audit committee
The trading entity had an audit committee in operation throughout the financial year. ✓
The audit committee operates in accordance with approved, written terms of reference. ✓
The audit committee substantially fulfilled its responsibilities for the year, as set out in section 77
of the PFMA and Treasury Regulation 3.1.10.
✓
7. Internal audit ✓
The trading entity had an internal audit function in operation throughout the financial year. ✓
The internal audit function operates in terms of an approved internal audit plan. ✓
The internal audit function substantially fulfilled its responsibilities for the year, as set out in
Treasury Regulation 3.2.
✓ ✓
8. There are no significant deficiencies in the design and implementation of internal control in respect
of financial and risk management.
✓
9. There are no significant deficiencies in the design and implementation of internal control in respect
of compliance with applicable laws and regulations.
✓
10. The information systems were appropriate to facilitate the preparation of the financial statements. ✓
11. A risk assessment was conducted on a regular basis and a risk management strategy, which
includes a fraud prevention plan, is documented and used as set out in Treasury Regulation 3.2.
✓
12. Powers and duties have been assigned, as set out in section 44 of the PFMA. ✓
Follow-up of audit findings
13. The prior year audit findings have been substantially addressed. ✓
14. SCOPA resolutions have been substantially implemented. ✓
Issues relating to the reporting of performance information
15. The information systems were appropriate to facilitate the preparation of a performance report
that is accurate and complete.
✓
16. Adequate control processes and procedures are designed and implemented to ensure the accuracy
and completeness of reported performance information.
✓
17. A strategic plan was prepared and approved for the financial year under review for purposes of
monitoring the performance in relation to the budget and delivery by the Sheltered Employment
Factories against its mandate, predetermined objectives, outputs, indicators and targets Treasury
Regulations 5.1, 5.2 and 6.1.
✓
18. There is a functioning performance management system and performance bonuses are only paid
after proper assessment and approval by those charged with governance.
✓
Annual Report
�������������� ������������������������������������������������������������������ ����������������������������������� � ���������� !

15. The entity does not have individuals competent in financial reporting and related oversight rolesThe accounting policies are aligned to National Treasury guidelines and not to the accountingframework. Ongoing monitoring and supervision are not undertaken to enable an assessment ofthe effectiveness of internal control over financial reporting
IInvestigations
16. With reference to note 9 to the financial statements dealing with cheques fraudulently cashedby unknown parties, an investigation was conducted by the South African Police Service. Thecase was subsequently closed by the South African Police Service without any criminalproceedings being instituted against anyone.
REPORT ON OTHER LEGAL AND REGULATORY REQUIREMENTS
Report on performance information
17. I have reviewed the performance information as set out on pages 167 to 168.
The accounting officer’s responsibility for the performance information
18. The accounting officer has additional responsibilities as required by section 40(3)(a) of thePFMA to ensure that the annual report and audited financial statements fairly present theperformance against predetermined objectives of the Sheltered Employment Factories.
The Auditor-General’s responsibility
19. I conducted my engagement in accordance with section 13 of the Public Audit Act, 2004 (ActNo. 25 of 2004) read with General Notice 616 of 2008, issued in Government Gazette No.31057 of 15 May 2008
20. In terms of the foregoing my engagement included performing procedures of an audit nature toobtain sufficient appropriate audit evidence about the performance information and relatedsystems, processes and procedures. The procedures selected depend on the auditor’sjudgement.
21. I believe that the evidence I have obtained is sufficient and appropriate to provide a basis forthe audit findings reported below.
Findings on performance information
Non compliance with regulatory requirements
Lack of effective, efficient and transparent systems and internal controls regardingperformance
management
22. The accounting officer did not ensure that the Sheltered Employment Factories has andmaintains an effective, efficient and transparent system and internal controls regardingperformance management, which describe and represent how the institution’s processes ofperformance planning, monitoring, measurement, review and reporting will be conducted,organized and managed, as required in terms of section 38(1)(a)(i) and (b) of the PFMA.
Reported performance information not reliable
23. The reported actual achievements of measures could not be substantiated by adequateevidence.
1 April 2008 - 31 March 2009169
Annual Report
�������������� ������������������������������������������������������������������ ����������������������������������� � ���������� !

1 April 2008 - 31 March 2009170
Annual Report
APPRECIATION
24. The assistance rendered by the staff of the Sheltered Employment Factories during the audit issincerely appreciated.
Pretoria31 July 2009
�������������� ������������������������������������������������������������������ ����������������������������������� � ���������� !

The Acting Director-General is responsible for the preparation and fair presentation of these AnnualFinancial Statements in accordance with South African Statements of Generally AcceptedAccounting Practice (GAAP) and in the manner required by the Public Finance Management Act,1999 (Act No 1 of 1999). This responsibility includes: designing, implementing and maintaininginternal control relevant to the preparation and fair presentation of financial statements that arefree from material misstatement, whether due to fraud or error; selecting and applying appropriateaccounting policies; and making accounting estimates that are reasonable in the circumstances. TheAuditor-General is responsible for expressing an opinion on the fair presentation of the FinancialStatements.
As the Acting Director-General is also responsible for the system of internal financial control, itshould be noted that these are designed to provide reasonable, but not absolute, assurance as tothe fair presentation of the Financial Statements, and to adequately safeguard, verify and maintainaccountability of the assets, and to prevent and detect misstatements and loss. Nothing has cometo the attention of the Acting Director-General to indicate that any material breakdown in thefunctioning of these controls, procedures and systems has occurred during the year under review.
The Financial Statements have been prepared on the going concern basis, since the ActingDirector-General has every reason to believe that the factories have adequate resources in place tocontinue in operation for the foreseeable future.
The Financial Statements have been audited by the Auditor-General, who was given unrestrictedaccess to all financial records and related data, including minutes of all management meetings held.The Auditor-General believes that all representations made to the Auditor-General during the auditwere valid and appropriate.
The Financial Statements were approved by the Acting Director-General on 31 May 2009.
Acting Director-GeneralDate: 31/05/2009
1 April 2008 - 31 March 2009171
Annual ReportSheltered Employment Factories
Annual Financial Statements for the year ended 31 March 2009
Statement of Responsibility by the Accounting Officer

GGeneral review of the state of affairs
The Sheltered Employment Factories (SEF) were established in 1943 to provide employment forpeople with mental and physical disabilities that prevented them from entering the open labourmarket due to the nature of their afflictions. Of the 1 044 factory workers currently employed,some 80% are intellectually/mentally/psychologically challenged. The factories are open to all races.
The factories have operated without any enabling legislation since inception, except for a CabinetMemorandum, first compiled in 1947. This issue is being addressed by investigating options forconferring an appropriate legal and corporate form for the entity and a transformation plan that willalign with government’s national integrated disability strategy.
There are currently 12 factories across the country in seven provinces. Income for the factories isgenerated from sales of manufactured goods ranging from wood and metal furniture, hospitalcommodities, linen, bedding, protective clothing, garments, upholstery, bookbinding and screenprinting. The income from sales, supplemented by transfers from the Department of Labour, coversthe operating expenses of the factories.
It is the vision of the factories to transform and expand direct employment for people withintellectual and multiple disabilities, and to develop as a provider of quality training for people withdisabilities to enable and to facilitate their transition into the open labour market.
Results of operations
The results of the operations are summarised in the Income Statement and the Statement ofChanges in Equity.
Registered Office (Under the auspices of the Department ofLabour)
221 Moreleta Street, Silverton, 0184
Accounting Officer
The Director-General of Labour is the appointed Accounting Officer.
Auditor
The Auditor-General will continue as auditor of the Sheltered Employment Factories.
Going concern
Sheltered Employment Factories is an entity that is a going concern and has continued to adopt thegoing concern basis in preparing the Financial Statements.
Events subsequent to balance sheet date
No matter which is material to the financial affairs of the entity has occurred between the balancesheet date and the date of approval of the Financial Statements.
1 April 2008 - 31 March 2009172
Annual Report
Sheltered Employment Factories
Annual Financial Statements for the year ended 31 March 2009
Report of the Accounting Officer

Scopa resolutions
1 April 2008 - 31 March 2009173
Annual Report
Sheltered Employment Factories
Annual Financial Statements for the year ended 31 March 2009
Report of the Accounting Officer
Reference to previous
audit report and SCOPA
resolutions
Subject Findings/progress
SCOPA report Supply Chain Management
● No competitive bids The practice of obtaining competitive quotes from known suppliers has
been in place for many years.
It needs to be noted however that there are limited suppliers of major
raw materials such as locally produced fabric that meets SABS
certification for hospital linen, and saligna wood for school furniture.
There is a supplier database in place. To ensure that the supplier data
base is complete, a detailed set of specifications has been compiled for
all major raw materials. Approval to advertise these in the Government
Tender Bulletin is being sought through the Department’s Subtender
Committee.
Respondents to the advertisements will then be evaluated by the
Departmental Bid Adjudication Committee and approved suppliers added
to the existing supplier data base.
● No valid transport contract Transport issues have been resolved and courier services are being
utilised in terms of the State Contract arranged by National Treasury.
In cases where courier services are not utilised, transport services are
procured on a 3-quote basis by making use of the database of service
providers.
SCOPA report Misstatement of fixed assets
● Availability of skilled staff The project to restructure the factories is progressing well with
assistance from the Technical Assistance Unit of the National Treasury.
Population of organisation structures will be progressed when the
transformation plan is approved.
● Impairment of redundant
assets
The SEF is now fully compliant with SA GAAP.
Redundant/obsolete fixed assets have been identified and provisions
made in the Annual Financial Statements for impairment.
A depreciation policy was developed in March 2007 and supported by the
SEF Management Committee on 23 January 2009. The policy is being
applied and asset values are correctly reported in the Annual Financial
Statements.

1 April 2008 - 31 March 2009174
Approval
The Annual Financial Statements have been approved by the Accounting Officer.
S MorotobaActing Director-General of Labour
Date: 31 May 2009
Annual Report
Sheltered Employment Factories
Annual Financial Statements for the year ended 31 March 2009
Report of the Accounting Officer

1 April 2008 - 31 March 2009175
Annual Report
Sheltered Employment Factories
Annual Financial Statements for the year ended 31 March 2009
Balance Sheet
Notes 2008/09 2007/08
R'000 R'000
Assets
Non-current assets
Property, plant and equipment 4 8 847 10 052
Intangible assets 5 3 10
Leased assets – office equipment 7 215 372
9 065 10 434
Current assets
Inventories 8 15 804 18 759
Trade and other receivables 9 7 509 8 815
Pre-payments for licenses 39 -
Cash and cash equivalents 10 21 722 248
45 074 27 822
54 139 38 256
Total assets
Equity and liabilities
Equity
Accumulated funds 23 687 21 056
Liabilities
Non-current liabilities
Finance lease liabilities 11 128 310
Employee benefits 13 2 113 1 933
Medical aid benefit 14 270 299
2 511 2 542
Current liabilities
Finance lease liabilities 11 94 88
Trade and other payables 15 6 617 14 570
Deferred income 12 21 230 -
27 941 14 658
Total Liabilities 30 452 17 200
Total equity and liabilities 54 139 38 256

NNotes 2008/09 2007/08
R'000 R'000
Revenue 16 56 974 38 970
Cost of sales (89 877) (81 702)
Gross deficit (32 903) (42 732)
Other income 17 56 915 38 831
Operating expenses (21 522) (22 332)
Operating surplus (deficit) 18 2 490 (26 233)
Finance income 19 183 129
Finance costs 20 (42) (54)
Net surplus (deficit) for the year 2 631 (26 158)
1 April 2008 - 31 March 2009
Sheltered Employment Factories
Annual Financial Statements for the year ended 31 March 2009
Income Statement
Annual Report
176

NNotes 2008/09
Accumulated
funds
2007/08
Total
R'000 R'000
Balance at 1 April 2007 47 214 47 214
Changes in equity (26 158) (26 158)
Deficit for the year
(26 158) (26 158)
Total changes 21 056 21 027
Opening balance as previously reported
Adjustments
Prior period adjustments - 29
Balance at 1 April 2008 as restated 21 056 21 056
Changes in equity
Surplus for the year 2 631 2 631
Total changes 2 631 2 631
Balance at 31 March 2009 23 687 23 687
1 April 2008 - 31 March 2009
Sheltered Employment Factories
Annual Financial Statements for the year ended 31 March 2009
Statement of Changes in Equity
Annual Report
177

1 April 2008 - 31 March 2009178
Notes 2008/09 2007/08
R'000 R'000
Cash flow from operating activities
Cash receipts from customers 58 448 41 663
Cash paid to suppliers and employees (115 143) (91 409)
Cash utilised in operations 21 (56 695) (49 746)
Interest income 183 129
Parliamentary allocation and finance charges 22 78 065 38 764
Net cash from operating activities 21 553 (10 853)
Cash flow from investing activities
Purchase of property, plant and equipment 4 (229) (263)
Sale of property, plant and equipment 1 3
Sale of leased assets – office equipment 157 -
Net cash flow from investing activities (71) (260)
Cash flow from financing activities
Movement in finance lease liability 139 142
Movement in medical aid benefit (29) 299
Finance lease payments (118) (88)
Net cash from financing activities (8) 353
Total cash movement for the year 21 474 (10 760)
Cash at the beginning of the year 248 11 008
Total cash at end of the year 10 21 722 248
Annual ReportSheltered Employment Factories
Annual Financial Statements for the year ended 31 March 2009
Cash Flow Statement

1 April 2008 - 31 March 2009179
1. Presentation of Annual Financial Statements
The Annual Financial Statements have been prepared in accordance with South African Statementsof Generally Accepted Accounting Practice. The Annual Financial Statements have been prepared onthe historical cost basis, except for financial instruments at fair value and incorporate the principalaccounting policies set out below.
These accounting policies are consistent with the previous period.
1.1 Significant judgements
In preparing the Annual Financial Statements, management is required to make estimates andassumptions that effect the amounts represented in the Annual Financial Statements and relateddisclosures. Use of available information and the application of judgement is inherent in theformation of estimates. Actual results in the future could differ from these estimates which may bematerial to the Annual Financial Statements. Significant judgements include:
Trade receivables
The entity assesses its trade receivables for impairment at each balance sheet date, In determiningwhether an impairment loss should be recorded in the Income Statement, the entity makesjudgements as to whether there is observable data indicating a measurable decrease in theestimated future cash flows from a financial asset.
The impairment for trade receivables is calculated on a portfolio basis, based on historical lossratios, adjusted for national and industry-specific economic conditions and other indicators presentat the reporting date that correlate with defaults on the portfolio. These annual loss ratios areapplied to loan balances in the portfolio and scaled to the estimated loss emergence period.
Allowance for s low moving, damaged and obsolete stock
An allowance for stock to write stock down to the lower of cost or net realisable value.
Management have made estimates of the selling price and direct cost to sell on certain inventory items. The write down is included in the operation profit note.
Inventory
Work in progress is valued, based on the stage of completion of goods, adding a percentage to thedirect costs to account for overheads. These percentages range from 8.7% (2008: 8.7%) to 120%(2008: 120%) of the direct costs. The total costs are considered to be less than the net realisablevalue of inventory.
1.2 Property, plant and equipment
The cost of an item of plant and equipment is recognised as an asset when:
● It is probable that future economic benefits associated with the item will flow to the entity; and● The cost of the item can be measured reliably.
Costs include costs incurred initially to acquire or construct an item of plant and equipment andcosts incurred subsequently to add to, replace part of, or service it. If a replacement cost isrecognised in the carrying amount of an item of plant and equipment, the carrying amount of thereplaced part is derecognised.
Annual Report
Sheltered Employment Factories
Accounting Policies for the year ended 31 March 2009

Property, plant and equipment is carried at cost less accumulated depreciation and any impairmentlosses.
IItem Average useful l ifePlant and machinery 10 to 15 yearsFurniture and fixtures 10 to 15 yearsOffice equipment 8 to 10 yearsIT equipment 3 yearsAppliances 5 to 8 years
The residual value and the useful life of each asset are reviewed at each financial period-end.
Each part of an item of property, plant and equipment with a cost that is significant in relation tothe total cost of the item shall be depreciated separately.
The depreciation charge for each period is recognised in profit or loss unless it is included in thecarrying amount of another asset. Depreciation is calculated on the straight line method over theuseful lives of the assets.
The gain or loss arising from the derecognition of an item of property, plant and equipment isincluded in profit or loss when the item is derecognised. The gain or loss arising from thederecognition of an item of property, plant and equipment is determined as the difference betweenthe net disposal proceeds, if any, and the carrying amount of the item.
Minor assets are wri tten-off in the year of purchase.
Subsequent costs are included in the asset’s carrying amount or recognised as a separate asset, asappropriate, only when it is probable that future economic benefits associated with the item willflow to the entity and the cost of the item can be measured reliably. All other repairs andmaintenance are charged to the Income Statement during the financial period in which they areincurred.
1.3 Intangible assets
Intangible assets are carried at cost less any accumulated amortisation and any impairment losses.
Acquired computer software is capitalised on the basis of the costs incurred to acquire and bring touse the specific software. These costs are amortised over their estimated useful life.
Costs associated with maintaining computer software programmes are recognised as an expense asincurred.
Armotisation is provided to write down the intangible assets, on a straight line basis, to theirresidual values as follows:
Item Useful l ifeComputer software 3 years
1.4 Financia l instruments
Ini t ia l recognit ion and measurement
Financial instruments comprise of receivables, payables and cash and cash equivalents. The entitydoes not have any derivatives.
Financial instruments are recognised initially when the entity becomes a party to the contractualprovisions of the instruments.
The entity classifies financial instruments, or their component parts, or initial recognition as afinancial asset, a financial liability or an equity instrument in accordance with the substance of thecontractual arrangement.
1 April 2008 - 31 March 2009
Sheltered Employment Factories
Accounting Policies for the year ended 31 March 2009
Annual Report
180

Financial instruments are measured initially at fair value.
For financial instruments which are not at fair value through profit or loss, transaction costs areincluded in the initial measurement of the instrument.
SSubsequent measurement
Loans and receivables are subsequently measured at amortised cost, using the effective interestmethod, less accumulated impairment losses.
Financial liabilities at amortised costs are subsequently measured at amortised cost, using theeffective interest method.
Impai rment of f inancia l assets
At each balance sheet date the entity assesses all financial assets, other those at fair value throughprofit or loss, to determine whether there is objective evidence that a financial asset or group offinancial assets has been impaired.
For amounts due to the entity, significant financial difficulties of the debtor, probability that thedebtor will enter bankruptcy and default of payments are all considered indicators of impairment.
Impairment losses are recognised in profit or loss.
Impairment losses are reversed when an increase in the financial asset’s recoverable amount can berelated objectively to an event occurring after the impairment was recognised, subject to therestriction that the carrying amount of the financial asset at the date that the impairment isreversed shall not exceed what the carrying amount would have been had the impairment not beenrecognised.
Reversals of impairment losses are recognised in profit or loss.
Where financial assets are impaired through the use of an allowance account, the amount of the lossis recognised in profit or loss within operating expenses. When such assets are written off, thewrite-off is made against the relevant allowance account. Subsequent recoveries of amountspreviously written off are credited against operating expenses.
Trade and other rece ivables
Trade receivables are measured at initial recognition at fair value, and are subsequently measured atamortised cost using the effective interest rate method. Appropriate allowances for estimatedirrecoverable amounts are recognised in profit or loss when there is objective evidence that theasset is impaired. Significant financial difficulties of the debtor, probability that the debtor will enterbankruptcy or financial reorganisation, and default or delinquency in payments (more that 30 daysoverdue) are considered indicators that the trade receivable is impaired. The allowance recognised ismeasured as the difference between the asset’s carrying amount and the present value ofestimated future cash flows discounted at the effective interest rate computed at initial recognition.
The carrying amount of the asset is reduced through the use of an allowance account, and theamount of the loss is recognised in the Income Statement within operating expenses. When a tradereceivable is uncollectible, it is written off against the allowance account for trade receivables.Subsequent recoveries of amounts previously written off are credited against operating expenses inthe Income Statement.
Trade and other receivables are classified as loans and receivables.
1 April 2008 - 31 March 2009
Sheltered Employment Factories
Accounting Policies for the year ended 31 March 2009
Annual Report
181

1 April 2008 - 31 March 2009
Trade and other payables
Trade payables are initially measured at fair value, and are subsequently measured at amortisedcost, using the effective interest rate method.
Cash and cash equivalents
Cash and cash equivalents comprise cash on hand and demand deposits and other short-term highlyliquid investments that are readily convertible to a known amount of cash and are subject to aninsignificant risk of changes in value. These are initially and subsequently recorded at fair value.
1.5 Tax
Income tax
Provision has not been made for taxation as the entity is exempt from income tax.
1.6 Leases
A lease is classified as a finance charge if it transfers substantially all the risks and rewardsincidental to ownership. A lease is classified as an operating lease if it does not transfersubstantially all the risks and rewards incidental to ownership.
Finance leases – lessee
Finance leases are recognised initially as assets and liabilities in the balance sheet at amounts equalto the fair value of the leased property or, if lower, the present value of the minimum leasepayments. The corresponding liability to the lessor is included in the balance sheet as a financelease obligation.
The discount rate used in calculating the present value of the minimum lease payments is theinterest rate implicit in the lease.
The lease payments are apportioned between the finance charge and the reduction of theoutstanding liability. The finance charge is allocated to each period during the lease term so as toproduce a constant periodic rate on the remaining balance of the liability.
Leased assets are depreciated over the useful life of the asset or over the lease term, whichever isthe shorter.
Subsequent costs are included in the asset’s carrying amount or recognised as a separate asset, asappropriate, only when it is probable that future economic benefits associated with the item willflow to the entity and the cost of the item can be measured reliably.
Operating leases – lessee
Operating lease payments are recognised as an expense on a straight-line basis over the lease term.The difference between the amounts recognised as an expense and the contractual payments arerecognised as an operating lease asset. This liability is not discounted.
Any contingent rents are expensed in the period they are incurred.
1.7 Inventories
Inventories are measured at the lower of cost and net realisable value.
Net realisable value is the estimated selling price in the ordinary course of business less theestimated costs of completion and the estimated costs necessary to make the sale.
Annual Report
Sheltered Employment Factories
Accounting Policies for the year ended 31 March 2009
182

1 April 2008 - 31 March 2009
The cost of inventories compromises of all costs of purchase, costs of conversion and other costsincurred in bringing the inventories to their present location and condition. Provision for obsoletestock is determined at 100% of the value of inventories that have not been used in production orsold for a period longer than 12 months.
The cost of inventories of items that are not ordinarily interchangeable and goods or servicesproduced and segregated for specific projects is assigned using specific identification of theindividual costs.
The cost of inventories is assigned using the weighted average cost formula. The same cost formulais used for all inventories having a similar nature and use to the entity.
When inventories are sold, the carrying amount of those inventories are recognised as an expense inthe period in which the related revenue is recognised. The amount of any write-down of inventoriesto net realisable value and all losses of inventories are recognised as an expense in the period thewrite-down or loss occurs. The amount of any reversal of any write-down of inventories, arising froman increase in net realisable value, are recognised as a reduction in the amount of inventoriesrecognised as an expense in the period which the reversal occurs.
1.8 Impairment of assets
The entity assesses at each balance sheet date whether there is any indication that an asset maybe impaired. If no such indication exists, the entity estimates the recoverable amount of the asset.
If there is any indication that an asset may be impaired, the recoverable amount is estimated for theindividual asset. If it is not possible to estimate the recoverable amount of the individual asset, therecoverable amount of the cash-generating unit to which the asset belongs is determined.
The recoverable amount of an asset or a cash-generating unit is the higher of its fair value lesscosts to sell and its value in use. The entity determines the value in use of an asset by discountingthe future cash flow values expected to be derived from the asset or cash generating unit.
If the recoverable amount of an asset is less than its carrying amount, the carrying amount of theasset is reduced to its recoverable amount. That reduction is an impairment loss.
An impairment loss of assets carried at cost less any accumulated depreciation or amortisation isrecognised immediately in profit or loss.
An impairment loss is recognised for cash-generating units if the recoverable amount of the unit isless than the carrying amount of the units. The impairment loss is allocated to reduce the carryingamount of the assets of the unit in the following order:
● First, to reduce the carrying amount of any goodwill allocated to the cash-generating unit and● Then, to the other assets of the unit, pro rata on the basis of the carrying amount of each asset
in the unit.
The entity assesses at each reporting date whether there is any indication that an impairment lossrecognised in prior periods for assets other than goodwill may no longer exist or may havedecreased. If any such indication exists, the recoverable amounts of those assets are estimated.
The increased carrying amount of an asset other than goodwill attributable to a reversal of animpairment loss does not exceed the carrying amount that would have been determined had noimpairment loss been recognised for the asset in prior periods.
A reversal of an impairment loss of assets carried at cost less accumulated depreciation oramortisation other than goodwill is recognised immediately in profit or loss.
Annual Report
Sheltered Employment Factories
Accounting Policies for the year ended 31 March 2009
183

1 April 2008 - 31 March 2009
1.9 Employee benefits
Short-term employee benefits
The cost of short-term employee benefits, (those payable within 12 months after the service isrendered, such as paid vacation leave and sick leave, bonuses, and non-monetary benefits such asmedical care), are recognised in the period in which the service is rendered and are not discounted.
The expected cost of compensated absence is recognised as an expense as the employees renderservices that increase their entitlement or, in the case of non-accumulating absences, when theabsence occurs.
The expected cost of bonus payments is recognised as an expense when there is a legal orconstructive obligation to make such payments as a result of past performance.
Defined contribution plans
Payments to defined contribution retirement benefit plans are charged as an expense as they falldue.
Payment made to the State-managed Retirement Benefit Scheme are dealt with as definedcontribution plans where the obligations under the scheme are equivalent to those arising in adefined contribution retirement benefit plan. The SEF are also liable for other post retirementbenefits, such as accumulated leave and medical benefits, to which workers become entitled to atretirement.
Benefits falling due more than 12 months after the balance sheet date are discounted to theirpresent value and are calculated by management.
1.10 Government grants
Government grants are recognised as part of income when there is reasonable assurance that:
● the entity will comply with the conditions attaching to them ● the grants will be received.
Government grants are recognised as income over the periods necessary to match them with therelated costs that they are intended to compensate.
Grants related to income are presented as a credit in the Income Statements (separately)
Repayment of a grant related to income is applied first against any un-amortised deferred credit setup in respect of the grant. To the extent that the repayment exceeds any such deferred credit, orwhere no deferred credit exists, the repayment is recognised immediately as an expense.
Repayment of a grant related to an asset is recorded by reducing the deferred income balance bythe amount repayable. The cumulative additional depreciation that would have been recognised todate as an expense in the absence of the grant is recognised immediately as an expense.
Annual Report
Sheltered Employment Factories
Accounting Policies for the year ended 31 March 2009
184

1 April 2008 - 31 March 2009
1.11 Revenue from the sale of goods
Revenue from the sale of goods is recognised when all the following conditions have been satisfied:
● the entity has transferred to the buyer the significant risks and rewards of ownership of thegoods
● the entity retains neither continuing managerial involvement to the degree usually associatedwith ownership nor effective control over the goods sold
● the amount of revenue can be measured reliably ● It is probable that the economic benefits associated with the transaction will flow to the entity ● the costs incurred or to be incurred in respect of the transaction can be measured reliably.
Revenue is measured at the fair value of the consideration received or receivable and represents theamounts receivable for goods provided in the normal course of business, net of trade discounts andvolume rebates, and value added tax.
1.12 Cost of sales
When inventories are sold, the carrying amount of those inventories is recognised as an expense inthe period in which the related revenue is recognised. The amount of any write-down of inventoriesto net realisable value and all losses of inventories are recognised as an expense in the period thewrite-down or loss occurs. The amount of any reversal of any write-down of inventories, arising froman increase in net realisable value, is recognised as a reduction in the amount of inventoriesrecognised as an expense in the period in which the reversal occurs.
The related cost of providing services and manufacturing of goods is recognised as revenue in thecurrent period is included in cost of sales.
1.13 Deferred income
Government grants related to assets are presented in the balance sheet by setting up the grant asdeferred income or by deducting the grant in arriving at the carrying amount of the asset.
Repayment of a grant related to income is applied first against any un-amortised deferred credit setup in respect of the grant. To the extent that the repayment exceeds any such deferred credit, orwhere no deferred credit exists, the repayment is recognised immediately as an expense.
Repayment of a grant related to an asset is recorded by increasing the carrying amount of the assetor reducing the deferred income balance by the amount repayable. The cumulative additionaldepreciation that would have been recognised to date as an expense in the absence of the grant isrecognised immediately as an expense.
1.14 Related parties
All transactions and balances with national departments of government are regarded to betransactions with related parties and are disclosed separately in the notes to the FinancialStatements.
1.15 Finance income
Interest income and expenses are recognised, in profit or loss, using the effective interest ratemethod.
When a receivable is impaired, the entity reduces the carrying amount to its recoverable amount,being the estimated future cash flow discounted at the original effective interest rate of theinstrument, and continues unwinding the discount as interest income. Interest income on impairedloans is recognised using the original effective interest rate.
Sheltered Employment Factories
Accounting Policies for the year ended 31 March 2009
Annual Report
185

1 April 2008 - 31 March 2009
2. New standards and interpretations
2.1 Standards and interpretations not yet effective
IAS 1 (AC 101) (Revised) Presentation of Financial Statements
The main revisions to IAS 1 (AC 101):
● Require the presentation of non-owner changes in equity in a single statement of comprehensiveincome or in an income statement and statement of comprehensive income
● Require the presentation of a balance sheet at the beginning of the earliest comparative periodwhenever a retrospective adjustment is made. This requirement includes related notes
● Require the disclosure of income tax and reclassification adjustments relating to each componentof other comprehensive income. The disclosures may be presented on the face of the statementof comprehensive income or in the notes
● Allow dividend presentations to be made either in the statement of changes in equity or in thenotes only
● Have changed the titles to some of the financial statement components, where the ‘balancesheet’ becomes the ‘statement of financial position’ and the ‘cash flow statement’ becomes the‘statement of cash flows’. These new titles will be used in International Financial ReportingStandards, but are not mandatory for use in financial statements.
The effective date of the standard is for years beginning on or after 1 January 2009.
The company expects to adopt the standard for the first time in the 2010 Annual FinancialStatements.
May 2008 annual improvements to IFRS’s: Amendments to IFRS 7 (AC 144)Financial Instruments: Disclosures
The amendment relates to changes in the Implementation Guidance of the Standard. ‘Total interestincome’ was removed as a component of finance costs from paragraph IG13. This was to removeinconsistency with the requirement of IAS 1 (AC 101) Presentation of Financial Statements whichprecludes the offsetting of income and expenses.
The effective date of the amendment is for years beginning on or after 1 January 2009.
The entity expects to adopt the amendment for the first time in the 2010 Annual FinancialStatements.
It is unlikely that the amendment will have a material impact on the company’s Annual FinancialStatements.
May 2008 annual improvements to IFRS’s: Amendments to IAS 1 (AC 101)Presentation of F inancial Statements
The amendment is to clarify that financial instruments classified as held for trading in accordancewith IAS 39 (AC 133) Financial Instruments: Recognition and Measurement are not always requiredto be presented as current assets/liabilities.
The effective date of the amendment is for years beginning on or after 1 January 2009.
The entity expects to adopt the amendment for the first time in the 2010 Annual FinancialStatements.
It is unlikely that the amendment will have a material impact on the company’s Annual FinancialStatements.
Annual Report
Sheltered Employment Factories
Accounting Policies for the year ended 31 March 2009
186

1 April 2008 - 31 March 2009
May 2008 Annual improvements to IFRS’s: Amendments to IAS 8 (AC 103)Accounting Pol ic ies Changes in Accounting Est imates and Errors
The amendment clarified that Implementation Guidance related to any Standard is only mandatorywhen it is identified as an integral part of the Standard.
The effective date of the amendment is for years beginning on or after 1 January 2009.
The entity expects to adopt amendment for the first time in the 2010 Annual Financial Statements.
It is unlikely that the amendment will have a material impact on the company’s Annual FinancialStatements.
May 2008 annual improvements to IFRS’s: Amendments to IAS 16 (AC 123)Property, P lant and Equipment
The term ‘net selling price’ has been replaced with ‘fair value less cost to sell’ in the definition ofrecoverable amount.
The effective date of the amendment is for years beginning on or after 1 January 2009.
The entity expects to adopt the amendment for the first time in the 2010 Annual FinancialStatements.
It is unlikely that the amendment will have a material impact on the entity’s Annual FinancialStatements.
2.2 Standard and interpretations not yet effective or relevant
The following standards and interpretations have been published and are mandatory for the entity’saccounting periods beginning on or after 1 April 2009 or later periods but are not relevant to itsoperations:
IAS 23 (AC 114) (Revised) Borrowing Costs
The revision requires an entity to capitalise borrowing costs directly attributable to the acquisition,construction or production of a qualifying asset (one that takes a substantial period of time to getready for use or sale) as part of the cost of that asset. The option of immediately expensing thoseborrowing costs has been removed.
The effective date of the standard is for years beginning on or after 1 January 2009.
The entity does not envisage the adoption of the standard until such time as it becomes applicableto the entity’s operations.
It is unlikely that the standard will have a material impact on the entity’s Annual FinancialStatements.
May 2008 annual improvements to IFRS’s: Amendments to IAS 23 (AC 114)Borrowing Costs (as revised in 2007)
The description of specific components of borrowing costs has been replaced with a reference tothe guidance in IAS 39 (AC 133) Financial Instruments: Recognition and measurement on theeffective interest rate.
The effective date of the amendment is for years beginning on or after 1 January 2009.
The entity does not envisage the adoption of the standard until such time as it becomes applicable
Sheltered Employment Factories
Accounting Policies for the year ended 31 March 2009
Annual Report
187

to the entity’s operations.
It is unlikely that the amendment will have a material impact on the entity’s Annual FinancialStatements.
3. Risk management
Capital r isk management
The entity’s objectives when managing capital are to safeguard the entity’s ability to continue as agoing concern and to maintain an optimal capital structure to reduce the cost of capital.
In order to maintain or adjust the capital structure, the SEF are largely dependent on funding fromthe Department of Labour through Parliamentary allocations, based on an approved budgetsubmitted to the Department of Labour.
There have been no changes to what the entity manages as capital, the strategy for capitalmaintenance or externally imposed capital requirements from the previous year.
Liquidity risk
Prudent liquidity risk management implies maintaining sufficient cash and marketable securities, theavailability of funding through an adequate amount of committed credit facilities and the ability toclose out market positions. Due to the dynamic nature of the underlying businesses, entity treasurymaintains flexibility in funding by maintaining availability under committed credit lines.
The entity’s risk to liquidity is a result of the funds available to cover future commitments. Theentity manages liquidity risk through an ongoing review of future commitments and credit facilities.
Cash flow forecasts are prepared and adequate utilised borrowing facilities are monitored.
Credit risk
Credit risk consists mainly of cash deposit, cash equivalents, and trade debtors. The entity onlydeposits cash with major banks with high quality credit standing and limits exposure to any onecounter-party.
Trade debtors mainly consist of government departments of which surety vests in the NationalTreasury for any such debts owing. Other debtors comprise private sector trade debtor and staffdebtors.
Interest rate r isk
The entity manages it’s exposure to interest rate in line with movements in market rates.
1 April 2008 - 31 March 2009
Sheltered Employment Factories
Accounting Policies for the year ended 31 March 2009
Annual Report
188

44. Property, plant and equipment
2008/09 2007/08
Cost /valuation Accumulated
depreciation
Carrying
valueCost /valuation
Accumulated
depreciation
Carrying
value
Plant and machinery 14 464 (6 488) 7 976 16 276 (7 397) 8 879
Furniture and fixtures 735 (355) 380 730 (303) 427
Office equipment 465 (236) 229 501 (228) 273
IT equipment 1 504 (1 270) 234 1 705 (1 260) 445
Appliances 74 (46) 28 63 (35) 28
Total 17 242 (8 395) 8 847 19 275 (9 223) 10 052
Reconciliation of property, plant and equipment – 2008/09
Opening balance Additions Depreciation Total
Plant and machinery 8 879 157 (1 060) 7 976
Furniture and fixtures 427 5 (52) 380
Office equipment 273 6 (50) 229
IT equipment 445 50 (261) 234
Appliances 28 11 (11) 28
10 052 229 (1 434) 8 847
Reconciliation of property, plant and equipment – 2007/08
Opening
balance
Additions Disposals Depreciation Impairment loss Total
Plant and machinery 11 248 167 (1) (1 332) (1 203) 8 879
Furniture and fixtures 465 21 - (59) - 427
Office equipment 336 18 - (60) (21) 273
IT equipment 778 40 (1) (368) (4) 445
Appliances 24 17 (1) (12) - 28
12 851 263 (3) (1 831) (1 228) 10 052
5. Intangible assets
2008/09 2007/08
Cost /valuation Accumulated
depreciation
Carrying
valueCost /valuation
Accumulated
depreciation
Carrying
value
Computer software - 3 3 - 10 10
Reconciliation of intangible assets – 2008/09
Opening balance Amortisaltion Total
Computer software 10 (7) 3
Reconciliation of intangible assets – 2007/08
Opening balance Amortisaltion Total
Computer software 20 (10) 10
1 April 2008 - 31 March 2009
Sheltered Employment Factories
Notes to the Annual Financial Statements for the year ended 31 March 2009
Annual Report
189

2008/09 2007/08
R'000 R'000
6. Retirement benefits
Defined contribution plan
The SEF contributes in part to the Temporary Employment Pension Fund (TEPF) for the
benefit of employees. There are 120 employees (consisting of administrative staff and
factory instructors) who are members of the TEPF. SEF contributes 2.75% in every Rand
contributed by the employees toward the Fund.
The entity is under no obligation to cover any unfunded benefits.
Contributions for the year included in staff costs 1 444 1 500
7. Leased assets – office equipment
Year ended 31 March 2008
Leased assets
- cost 639
- accumulated depreciation (267)
Carrying value 372
Reconciliation of leased assets 31 March 2008
Opening balance 330
Additions 142
Disposals (2)
Depreciation (98)
Total 372
Year ended 31 March 2009
Leased assets
- cost 573
- accumulated depreciation (358)
Carrying value 215
Reconciliation of leased assets 31 March 2009
Opening balance 372
Additions 21
Disposals (3)
Depreciation (175)
Total 215
Leased assets are encumbered by finance lease liabilities. (Refer note 11)
2008/09 2007/08
R'000 R'000
8. Inventories
Raw materials, components 12 029 16 471
Work in progress 1 085 1 911
Finished goods 4 097 4 665
17 211 23 047
Inventories write-downs (included as part of cost of sales) (1 407) (4 288)
15 804 18 759
1 April 2008 - 31 March 2009
Sheltered Employment Factories
Notes to the Annual Financial Statements for the year ended 31 March 2009
Annual Report
190

9. Trade and other receivables
2008/09 2007/08
R'000 R'000
Trade receivables 6 748 8 103
Employee cists in advance 18 3
VAT 143 134
Unpaid cheques 599 570
Sundry debtors 1 5
7 509 8 815
As of 31/03/2009, trade receivables of R 11.6 million (2007/08: R14.25 million) were
impaired and provided for. The movement has been included as part of operating expenses –
provision for credit losses in the Income Statement.
Included in accounts receivable are unpaid cheques amounting to R 598 518
(2007/08: 570 209) that are not recoverable due to unknown parties fraudulently
intercepting and cashing cheques from SEF debtors.
Trade and other receivables past due but not impaired
Trade and other receivables which are less than 3 months past due are not considered to be
impaired. At 31 March 2009, R 2.69 million (2008: R2.29 million) were past due but not
impaired.
The ageing of amounts past due and impaired is as follows:
1 month past due 1 647 1 507
2 months past due 372 672
3 months past due 670 106
Impaired 11 600 14 250
14 289 16 535
10. Cash and cash equivalents
Cash and cash equivalents consist of:
Cash on hand 23 23
Bank balances 21 699 225
21 722 248
A parliamentary allocation amounting to R21 230 million was received by the Sheltered
Employment Factories during the year. These funds are earmarked for the projects listed
below and cannot be used for any other operational purpose:
- Business case project 3 316
- Establishment of provident fund for SEF and other special projects 6 433
- Repairs and maintenance project 11 481
1 April 2008 - 31 March 2009
Annual Report
Sheltered Employment Factories
Notes to the Annual Financial Statements for the year ended 31 March 2009
191

2008/09 2007/08
R'000 R'000
11. Finance lease obligation
Minimum lease payments due
-within one year 135 123
-in second to fifth year inclusive 225 285
360 408
Less: future finance charges (60) (78)
Present value of minimum lease payments 300 330
Present value of minimum lease payments due
-within one year 104 88
-in second to fifth year inclusive 196 242
300 330
Non-current liabilities 128 310
Current liabilities 9488
222 398
It is entity policy to lease certain equipment under finance leases.
The average lease term was 5 years and the average effective borrowing rate was 12%
(2008: 14%).
Interest rates are linked to prime at the contract date. Some lease agreement have fixed
repayments while others have a 15% escalation clause.
12. Deferred income
The following amounts were received from the Department of Labour:
Non-current liabilities - -
Current liabilities 21 230 -
21 230 -
These funds should be applied as follows and cannot be used for any other purpose:
- Business case project 3 316
- Establishment of provident fund for SEF and other special projects 6 433
- Repairs and maintenance project 11 481
13. Employee benefits
Accrued leave pay 2 113 1 933
14. Medical aid benefit
Medical aid expenditure
This liability relates to medical expenses covered by the SEF on behalf of its employees,
limited to the employee contributions. The entity is under no obligation to cover any
unfunded benefits relating to medical expenses incurred by the employees.
270 299
1 April 2008 - 31 March 2009
Sheltered Employment Factories
Notes to the Annual Financial Statements for the year ended 31 March 2009
Annual Report
192

2008/09 2007/08
R'000 R'000
15. Trade and other payables 4 549 13 444
Trade payables 136 318
Amounts received in advance 3 16
Unallocated receipts from debtors 268 427
Fair value estimate for unpaid cheque control 661 250
Trade accruals 990 99
Accruals 10 16
Outstanding cheques 6 617 14 570
The carrying values stated above approximate fair values for those items that are highly
liquid.
16. Revenue
Sale of goods 55 974 38 970
17. Other income
Commission received 27 21
Parliamentary allocation 56 887 38 808
Profit and loss on sale of assets and liabilities 1 2
56 915 38 831
18. Operating surplus (deficit)
Operating surplus / deficit for the year is stated after accounting for the following:
Operating lease charges
Premises
- Contractual amounts 199 199
Profit on sale of property, plant and equipment 1 2
Impairment on property, plant and equipment - 1 228
Depreciation on property, plant and equipment 1 550 1 960
Employee costs 55 060 50 396
Auditor’s remuneration 1 894 1 899
Impairment loss/ (reversal of impairment) 2 653 (1 578)
Expenses by nature
Employee benefit expense (55 060) 50 396)
Depreciation, amortization and impairment charges (1 550) (3 188)
Transportation expenses (6 772) (7 545)
Advertising costs (61) (75)
Operating lease payments (199) (199)
Other expenses (47 757) (42 631)
Total cost of sales, distribution costs and administrative expenses (111 399) (104 034)
1 April 2008 - 31 March 2009
Sheltered Employment Factories
Notes to the Annual Financial Statements for the year ended 31 March 2009
Annual Report
193

2008/09 2007/08
R'000 R'000
19. Finance income
Interest revenue 27 34
Bank 156 95
Interest charged on trade and other receivables 183 129
20. Finance costs
Finance leases 42 54
21. Cash used in operations
Profit (loss) before taxation 2 631 (26 158)
Adjustments for:
Depreciation and amortisation 1 434 1 831
Profit on sale of assets (1) (2)
Interest received (183) (129)
Finance costs 42 54
Impairment loss - 1 228
Parliamentary allocation (78 117) (38 808)
Assets written off - 5
Changes in working capital:
Inventories 2 955 (677)
Trade and other receivables 1 306 2 673
Prepayments for licenses (39) -
Trade and other payables (7 953) 10 237
Deferred income 21 230 -
(56 695) (49 746)
22. Parliamentary allocation and finance charges
Parliamentary allocation amounted to R78,11 million (2008: R38,80 million).
23. Commitments
Operating leases – as lessee (expense)
Minimum lease payments due
- within one year 199 199
- in second to fifth year inclusive 796 796
995 995
The SEF leases various factory facilities, offices and warehouses under non-cancelable
operating lease agreements from the Department of Public Works. These leases have
indefinite terms.
1 April 2008 - 31 March 2009
Annual Report
194
Sheltered Employment Factories
Notes to the Annual Financial Statements for the year ended 31 March 2009

2008/09 2007/08
R'000 R'000
24. Related parties
All national departments of government are regarded to be related parties in accordance
with Circular 4 pf 2005: Guidance on the term “State-controlled entities” in the context of
IAS24 (AC 126) – Related Parties, issued by the South African institute of Chartered
Accountants. No transaction is implicated simply by the nature or existence of the
relationships between these entities. Key management of the SEF are remunerated directly
by the Department of Labour. However, the following transactions and balances were
recorded relating to transactions with related parties as defined above:
Related party balances
Sale of goods to related parties
Year-end balances arising from sale of goods to related parties 14 802 18 735
Impairment provision
Impairment provision on year-end balances arising from sale of Goods to related parties 8 740 10 380
Services provided by related parties
Municipalities 116 129
SARS - PAYE 51 -
SARS – VAT 185 696
Telkom 51 80
Workmen’s compensation 4 13
Related party transactions
Parliamentary allocation
Yearly parliamentary allocation 78 117 38 808
Sale of goods to related parties
Yearly sale of goods to related parties 46 982 33 071
Services provided by related parties
Municipalities 2 611 1 178
Postmaster 12 10
SARS – PAYE 1 292 1 129
SARS – VAT 1 597 1 563
Telkom 1 086 1 120
UIF 1 031 948
Workmen’s compensation 428 690
25. Prior period errors
An asset leased under a finance lease in December 2006 was not accounted for in the
correct financial year. The corresponding interest and depreciation charges were also not
accounted for in the correct year. The correction was made in the current year and is as
follows:
Balance sheet
Property, plant and equipment - (68)
Opening retained earnings - (29)
1 April 2008 - 31 March 2009
Annual Report
195
Sheltered Employment Factories
Notes to the Annual Financial Statements for the year ended 31 March 2009

2008/09 2007/08
R'000 R'000
Income statement
Prior period errors
Depreciation expense - (18)
Finance lease charges - (10)
26. Irregular expenditure
Reconciliation if irregular expenditure
Opening balance 9 504 -
Add: Irregular expenditure relating to the current year 3 702 9 504
Add: Irregular expenditure relating to the prior year - -
Irregular expenditure awaiting condonment 13 206 9 504
Details of irregular expenditure – current year
- The tax portion of cellphone contracts with Vodacom, provided to employees,
was not included in their respective salaries and the taxes were not paid over to SARS R 1 329
- Transport contract R 3 701 112
(Practice note number SCM 1 of 2003 Paragraph 2.3 not complied with)
No criminal or disciplinary steps were taken as a consequence nor were any amounts
considered recoverable.
27. Fruitless and wasteful expenditure
Reconciliation of fruitless and wasteful expenditure
Fruitless and wasteful expenditure relating to prior year - -
Fruitless and wasteful expenditure relating to current year 279 -
Less: Amounts condoned - -
Less: Amounts transferred to receivables for recovery - -
Fruitless and wasteful expenditure awaiting condonation 279
Details of fruitless and wasteful expenditure – current year
- SEF paid storage fees for assets which did not belong to SEF 94 392
- SEF paid the cellphone contracts for former employees 184 122
1 April 2008 - 31 March 2009
Sheltered Employment Factories
Notes to the Annual Financial Statements for the year ended 31 March 2009
Annual Report
196

Annual Report
2008/09 2007/08
R'000 R'000
Revenue
Sale of goods 56 974 38 970
Cost of sales
Opening stock (4 665) -
Purchases 568 (4 665)
Cost of manufactured goods (89 877) (81 702)
Closing stock 4 097 4 665
(89 877) (81 702)
Gross deficit (32 903) (42 732)
Other income
Commission received 27 21
Parliamentary allocation 56 887 38 808
Interest received 183 129
Gains on disposal of assets 1 2
57 098 38 960
Expenses (Refer to page 31) (21 522) (22 332)
Operating surplus (deficit) 2 673 (26 104)
Finance costs (42) (54)
Net surplus (deficit) for the year 2 631 (26 158)
Operating expenses
Administration and management fees - 9
Advertising (61) (75)
Auditors remuneration (1 894) (1 199)
Bank charges (125) (111)
Depreciation, amortisation and impairment (427) (1 739)
Employee costs (10 794) (8 078)
Entertainment (19) (16)
Administrative expenses 11 (53)
IT expenses (324) (137)
Minor assets expensed (112) (117)
Printing and stationery (463) (404)
Professional services (156) (185)
Project costs expensed (1 594) (738)
Impairment of accounts receivable 2 653 (1 578)
Repairs and maintenance (173) (61)
Security (633) (617)
Telephone and fax (1 415) (1 136)
Training (21) (145)
Transport and freight (5 743) (5 833)
Travel – local (232) (119)
(21 522) (22 332)
1 April 2008 - 31 March 2009
Sheltered Employment Factories
Detailed Income statement for the year ended 31 March 2009
Annual Report
197