deployment flowcharting
TRANSCRIPT

8/10/2019 Deployment Flowcharting
http://slidepdf.com/reader/full/deployment-flowcharting 1/21
THE BASICS OFDEPLOYMENT FLOWCHARTING
& PROCESS MAPPING
A User’s Guide to DFCfor
Know-how Capture and Process Design
by David Howard
Management-NewStyle
8/10/2019 Deployment Flowcharting
http://slidepdf.com/reader/full/deployment-flowcharting 2/21
Deployment FlowCharting
2
"Draw a flowchart for whatever you are doing. Until you do, you do not fullyunderstand what you are doing. You just have a job."
"Words have no meaning unless they are translated into action, agreed upon by everyone. An operational definition puts communicable meaning into a concept."
"The first step in any organisation is to draw a flow diagram to show how eachcomponent depends on others. Then everyone may understand what their job is. If
people do not see the process, they cannot improve it."
W Edwards Deming (1900-1993)
--------------
"The manager's job has changed. The people work in the system. The job of themanager is to work on the system to improve it continually, with their help."
Myron Tribus
8/10/2019 Deployment Flowcharting
http://slidepdf.com/reader/full/deployment-flowcharting 3/21
Deployment FlowCharting
3
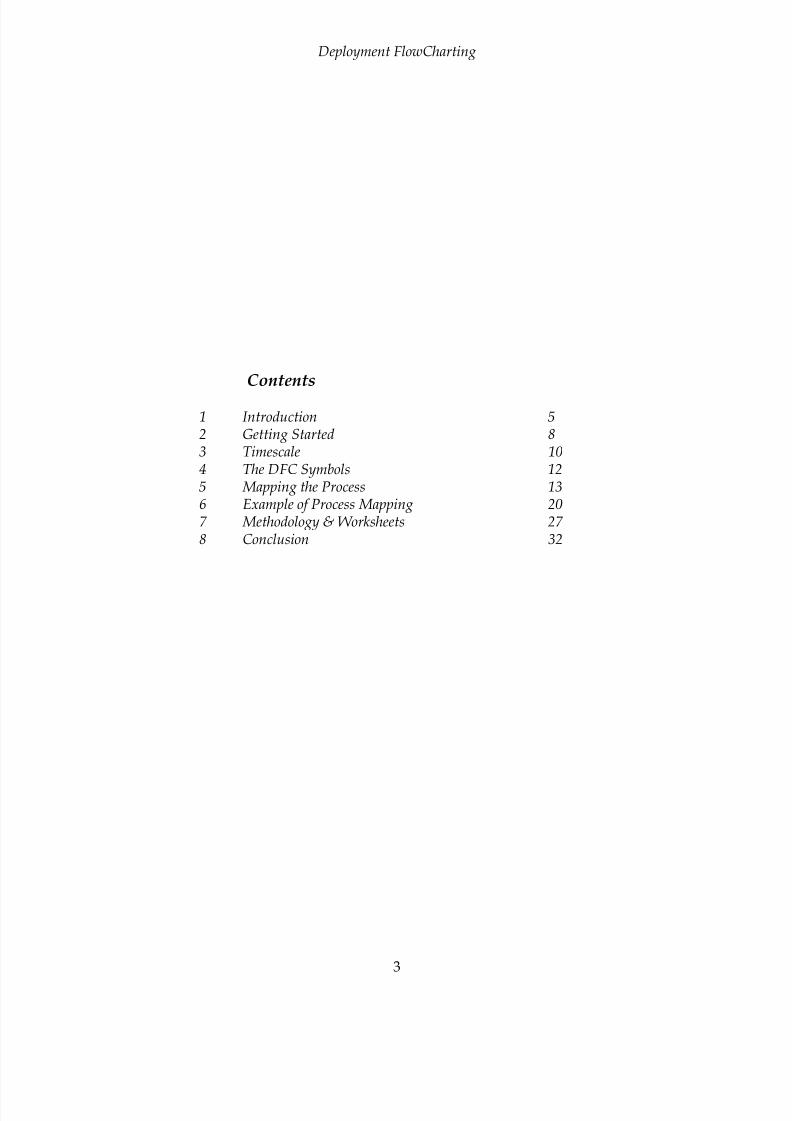
Contents
1 Introduction 52 Getting Started 83 Timescale 104 The DFC Symbols 125 Mapping the Process 136 Example of Process Mapping 207 Methodology & Worksheets 278 Conclusion 32

8/10/2019 Deployment Flowcharting
http://slidepdf.com/reader/full/deployment-flowcharting 4/21
Deployment FlowCharting
4
An early FlowMap for Getting the Work done on time and to Plan
Figure 1 - The author’s ‘deployed flowchart’ for a major facilities project he led for a US client in the early1980s. It pioneered the first conjunctive use of systems thinking and process working in the constructionindustry in the UK. A team of some 15 construction professionals delivered the 170,000 sq ft project on-time,on-cost and on-spec in half the usual time and at half the usual professional services fee. The contractordelivered the commissioned complex in 16 months rather than the traditional 30 months for such a project
Figure 2 - The Milton Keynes project upon completion in mid-1983.(Ref: Management Accounting February 1985 pp36-38 )

8/10/2019 Deployment Flowcharting
http://slidepdf.com/reader/full/deployment-flowcharting 5/21
Deployment FlowCharting
5
1. INTRODUCTION
This pamphlet introduces, with a typical example, a simple but very powerful businessprocess mapping technique known as deployment flowcharting (DFC). Deploymentflowcharting, sometimes called swimlane or matrix flow-charting, is increasingly being
recognised today as the preferred technique for capturing the operational details ofbusiness activities.
Start
Open Job File
Job DocketProcess clientdetails
& plan job
Details
confirmed?Job Process 1
Resolve issues
with Customer
Provide
additional data
Job Process 2
Job Completion
Completion
Commissioning
Test Record
Finalise Job
Record
Product
Release
for Delivery
Client
Acceptan ce
Process
Title : Job Handling Process Process Owner: SM
Chart No. : JHP-1 Revision: 0 Date: 17 06 03The Service
Company
Sales Assistant
Jane L
Job Planner
Jennifer M
Project Manager
Jack K
Job Designer
John H
Job Finisher
James WCustomer
Figure 3 - A typical deployment flowchart. Note the header details, cast of characters and the disciplinedlayout of the charting. Connecting links are always horizontal or vertical, never inclined. Horizontal linksdenote co-operation; vertical links, time and shadowed drop-chart links, increasing detail.
Level 1
Level 2
Level 3
Teamwork
Level of Detail
Timing
Figure 4 - A deployment flowchart provides process understanding by virtue of the three vectors shownabove - teamwork, timing and detail.

8/10/2019 Deployment Flowcharting
http://slidepdf.com/reader/full/deployment-flowcharting 6/21
Deployment FlowCharting
6
Figure 5 - As process dependencies are mapped a heterarchy forms which graphically represents how anorganisation is actually connected (i.e. many-to-many mappings). By contrast traditional organisation chartsare hierarchical (i.e. one to one mappings) and show responsibilities but not the vital, often informalconnectivities of process working.
The strength of a deployment flowchart lies in it's ability to display process knowledge
clearly and insightfully. It thus encourages the subsequent improvement of processperformance and innovation. All business activities consist of a sequence of related actionsand tasks, which use resources to transform inputs into outputs, be they products orservices. Such transformations are the source of all value creation for a business. They arealso the source of all the added costs that tend to reduce productivity, efficiency andeconomic-quality. Process mapping based on the DFC technique thus helps identify thesources of both value and cost. Once the sources have been found then costs can berationalised and value creation optimised. Product and service quality are consequentlyimproved.
The ultimate purpose of all process mapping must be to bring about improvement and
innovation. It is therefore most helpful to start mapping processes as they are, not as theycould be. Changes to the process can follow once the initial condition is defined. Processmapping can also, of course, be used for planning new processes.
Deployment FlowCharts as Operational Definitions
A well-formed FlowMap serves as an operational definition of the way work gets done and time gets used. Byvirtue of its collaborative origins it uniquely defines how value is created by transformation of inputs to
outputs and it serves as a basis for all subsequent improvement.
The process manager (owner and leader) is ultimately responsible for improving his or herassigned processes. However, experience shows that without the support of the peoplewho work within the process it is not possible to bring about lasting improvement single-handedly. Contrary to received wisdom in traditional hierarchical organisations, everyonewho has a job is part of, or owns, a process. There are no exceptions. Identifying theprocess may be difficult. But a process will exist. The question is whether it is a necessary,value-adding process or one that just adds cost.
8/10/2019 Deployment Flowcharting
http://slidepdf.com/reader/full/deployment-flowcharting 7/21
Deployment FlowCharting
7
2. GETTING STARTED
Once a candidate process has been identified for mapping agree a clear, short-name for it.It is important that this is done concisely - try to use no more than five words. Lack ofclarity at this stage - particularly in the opinion of others outside the process - will only
result in confusion later on. Avoid loose ends.
A process only flourishes when it is led. Left to itself it becomes inefficient. Whether it bedealing with a product or a service the process will only perform as well as themanagement provided by it's leader. This leader can be seen as the process owner. Theleader will generally be a 'manager' in functional terms (i.e. the person responsible forcontinual improvement of the process) if not in title. For high level business operations -the core processes of the organisation - the process owner will be a director.The unambiguous identification of a process by concise title and owner's name constitutesthe major first step forward in process mapping. Often allocation of ownership is one ofthe biggest hurdles to be overcome. The perceived manager is not always the one whocarries actual delegated responsibility. Sometimes responsibility may appear shared;sometimes it will apparently not be owned by anyone!
It is also necessary to identify the person who will lead the process mapping exercise - themapping steward. This person will generally not be the manager, but rather the processsupervisor or team leader. This person will have worked within the process and knowsabout it in detail and also has the full support of the process team members.
Managers have often not worked in the processes for which they are responsible and thusare not best suited to leading the mapping exercise. Their contribution will be in enablingthe overall exercise and removing the barriers to progress which can so easily arise,especially in the early stages of process mapping.
The people involved in the process represent the "cast of characters". Each one has a vitalrole to play in the transformation which is the focus of their attention. Just as with a troupeof actors who meticulously rehearse their roles, so the members of the process team arepart of a cast-list which shares the responsibility for ever better performances with thepassage of time and experience.
Finally, it is essential to clearly identify who the process customer is. It may be the nextwork team along the line; it may be another, distant, department; perhaps another factory
in the same company or an outside business. Or, of course it may be that conventionalexemplar of the customer, the end-user. It is never the boss!
3. TIMESCALE
Process mapping does not take a lot of time so long as it is approached in a carefullyplanned way. Each member of the cast must know what is expected of them. To ensurethat everybody recognises that time is of the essence it is recommended that the timeschedule for the mapping exercise be defined carefully.

8/10/2019 Deployment Flowcharting
http://slidepdf.com/reader/full/deployment-flowcharting 8/21

8/10/2019 Deployment Flowcharting
http://slidepdf.com/reader/full/deployment-flowcharting 9/21
Deployment FlowCharting
9
convenient effect, especially for large groups. Print-outs of progress can be distributed atmeeting breaks so that participants can reflect on progress and resolve outstanding issues.
Each member of the process team (or 'cast of characters') is identified and listed (i.e.deployed) sequentially across the top of the chart (the end-user usually to the right). Theagreed process actions, or steps, are plotted on the chart beneath the appropriate person.In this way the cast jointly develops the script for the process and records it in an agreedmanner that minimises subsequent misunder-standing and confusion.
Providing process mapping participants with a hard-copy record of the progress made atthe end of each session reinforces the importance of the mapping exercise (how often dominutes of meetings get provided at the end of the meeting?); it also reinforces in the eyesof the participants that the exercise is being taken seriously by management.
With each member of the process team able to take away a copy of the draft flowchart theycan share a clear basis of understanding for informed reflection before the next mappingsession. As the process map takes shape people will see that it is more than a simple linearflowchart. Because of the way each activity is assigned to the responsible person thedeployment flowchart becomes an operational definition of how value is created.
Rather like sheet music it provides a consistent statement of intent that loses no essentialmeaning in the interpretation - something which cannot always be said about proceduralstatements with their many loopholes and opportunities for misunderstanding.
5. THE DFC SYMBOLS
The symbols used to chart the flow of events within a process are few in number.Experience has shown that significant progress can be made with just the four symbolsshown in Figure 6 – the terminal, activity, decision and document symbols. Each is linkedto the next in sequence by either vertical or horizontal solid lines in the positive (value-adding) direction of the process flow. In the early stage of process mapping restrictyourself to the basic four symbols shown below:
Terminal
Start / Stop
Activity
Task
Sole-Operation
uery
Decision
Test
Readable
Document,
Computer Screen
Figure 6 – The four most important process mapping symbols.
Simplicity is the key to overcoming the complexity which, through time, has overwhelmedthe efficient conduct of many process activities today. At the outset and conclusion ofdrafting a DFC business process map the sausage-shaped terminal symbol is used.
This defines the limits of process activity. At the outset it is placed below the member ofthe cast of characters who actually initiates the process. Similarly wherever the processterminates the symbol denotes the end point of the mapping.

8/10/2019 Deployment Flowcharting
http://slidepdf.com/reader/full/deployment-flowcharting 10/21
Deployment FlowCharting
10
The rectangle-shaped task or activity box is the most used flowcharting symbol. This is thefundamental component of all processes. This activity or task will form the basis of awork instruction.
As high level business processes are examined in detail it becomes necessary to map lowerlevel, subsidiary processes. Two drop-chart symbols, shown in Figure 7, are used toindicate such linked charts – child and parent.
These symbols serves as reminders that further higher level context or lower level detail isavailable to support the understanding of the overall system of processes. The drop-shadow symbol (left) indicates a link to a separate process map containing the details.Similarly the drop-outline symbol (right) indicates a link to the parent of the chart onwhich it appears.
Denotes link to
parent chart
Denotes link to
child chart
Figure 7 – Chart connection symbols
Any process will involve decision making. These decisions can be mapped using thediamond shape. An important discipline in the use of this shape is to emphasise theprocess-positive outcome of the decision by ensuring that the bottom angle is used for thepositive output. Where possible restrict the neutral or negative output(s) to the two lateralangles.
Yes
Re-work
Waste Reject
Valid Test
Result?
UncertainInput
Figure 8 – The decision diamond
Further, any process-negative flow out of the diamond should be mapped with a dotted ordashed line to highlight any re-work that is involved. This will serve as a reminder for
early improvement action to reduce or eliminate the incidence of such process negativeoccurrences. Documentation, hard-copy or screen-based, features strongly in mostprocesses and it is necessary to track it with the other activities and decisions.
There are many other symbols that can be used to powerful benefit as skill in processmapping develops, such as the 'judgement' and 'freedom boxes' which form an integralpart of The FlowMap System DFC methodology. A 'judgement box' is used to remindreaders that this particular task requires a formal (professional) qualification forcompletion. In contrast the 'freedom box' is useful in preventing a process mapping

8/10/2019 Deployment Flowcharting
http://slidepdf.com/reader/full/deployment-flowcharting 11/21
8/10/2019 Deployment Flowcharting
http://slidepdf.com/reader/full/deployment-flowcharting 12/21
Deployment FlowCharting
12
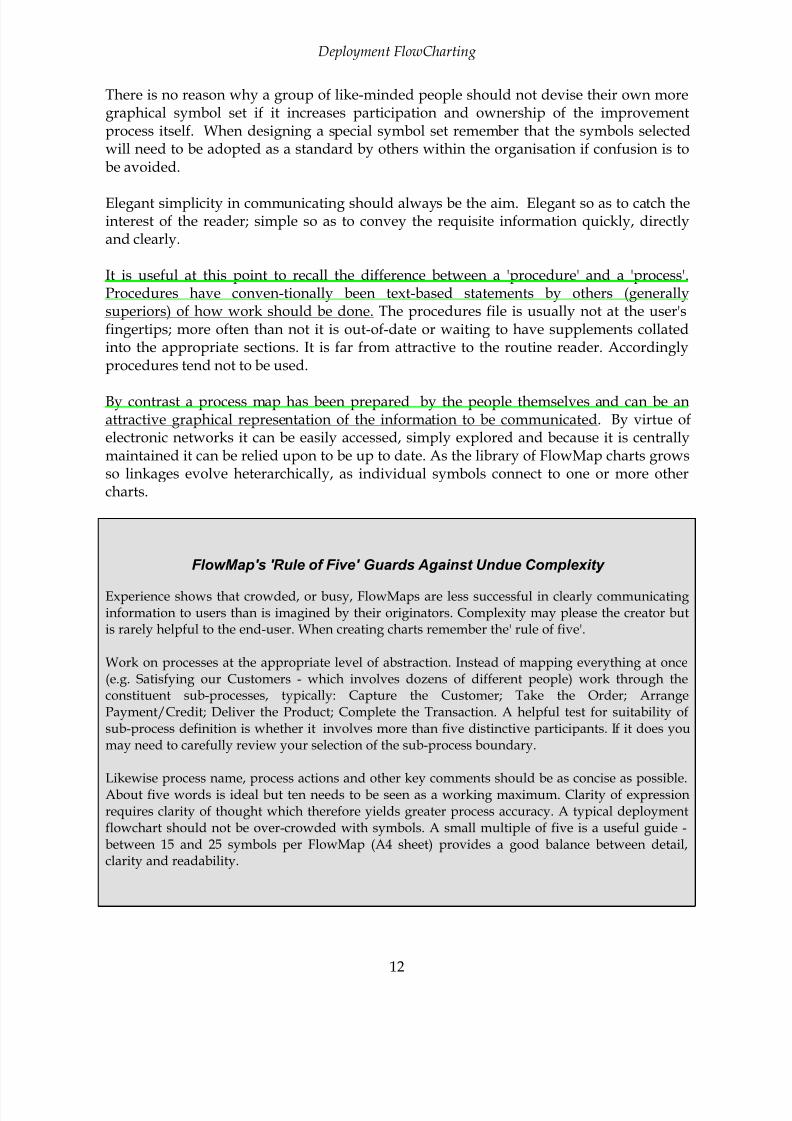
There is no reason why a group of like-minded people should not devise their own moregraphical symbol set if it increases participation and ownership of the improvementprocess itself. When designing a special symbol set remember that the symbols selectedwill need to be adopted as a standard by others within the organisation if confusion is tobe avoided.
Elegant simplicity in communicating should always be the aim. Elegant so as to catch theinterest of the reader; simple so as to convey the requisite information quickly, directlyand clearly.
It is useful at this point to recall the difference between a 'procedure' and a 'process'.Procedures have conven-tionally been text-based statements by others (generallysuperiors) of how work should be done. The procedures file is usually not at the user'sfingertips; more often than not it is out-of-date or waiting to have supplements collatedinto the appropriate sections. It is far from attractive to the routine reader. Accordinglyprocedures tend not to be used.
By contrast a process map has been prepared by the people themselves and can be anattractive graphical representation of the information to be communicated. By virtue ofelectronic networks it can be easily accessed, simply explored and because it is centrallymaintained it can be relied upon to be up to date. As the library of FlowMap charts growsso linkages evolve heterarchically, as individual symbols connect to one or more othercharts.
FlowMap's 'Rule of Five' Guards Against Undue Complexity
Experience shows that crowded, or busy, FlowMaps are less successful in clearly communicatinginformation to users than is imagined by their originators. Complexity may please the creator butis rarely helpful to the end-user. When creating charts remember the' rule of five'.
Work on processes at the appropriate level of abstraction. Instead of mapping everything at once(e.g. Satisfying our Customers - which involves dozens of different people) work through theconstituent sub-processes, typically: Capture the Customer; Take the Order; ArrangePayment/Credit; Deliver the Product; Complete the Transaction. A helpful test for suitability ofsub-process definition is whether it involves more than five distinctive participants. If it does youmay need to carefully review your selection of the sub-process boundary.
Likewise process name, process actions and other key comments should be as concise as possible.About five words is ideal but ten needs to be seen as a working maximum. Clarity of expressionrequires clarity of thought which therefore yields greater process accuracy. A typical deploymentflowchart should not be over-crowded with symbols. A small multiple of five is a useful guide -between 15 and 25 symbols per FlowMap (A4 sheet) provides a good balance between detail,clarity and readability.

8/10/2019 Deployment Flowcharting
http://slidepdf.com/reader/full/deployment-flowcharting 13/21
Deployment FlowCharting
13
A process map is also a self-evidently auditable document and one which can be used todemonstrate due-diligence as and when required.
This latter aspect of deployment flowcharting is of growing importance in an increasinglyregulated business environment.
However the over-riding purpose of flowcharting a process using DFC is to increaseunderstanding and gain insights about how to improve the process and its output as wellas discovering opportunities for process innovation.
6 – AN EXAMPLE OF PROCESS MAPPING
A company supplies its customers daily with a range of products. Each week a total ofsome 45,000 boxes of some 60 different lines is assembled to order for shipment to some 35different destinations. Each week the company issues appropriate invoices for goodsdelivered and 21 days later payment is received so long as the delivery exactly matchesthe order. The weekly revenue is approximately £1 million.
It is noted in a regular review of business performance that trade debtor performance isroutinely around five weeks, namely some two weeks behind the nominal value. Topmanagement faced with reducing margins decided that it could no longer tolerate such acontinuing loss of potential profit because of late payment (with the consequent borrowingto fund work in progress) and decided to identify and correct the root cause of latepayments. It was agreed by all parties that improvement would only result fromunderstanding the processes.
At the same time the company managing director has been looking at how he coulddevelop his manager’s early views on quality management and this seemed to be apromising area for further detailed consideration. The finance director was not keen tolead the project - his department considered that it would not be worth the disruption.After all 'late payments' had been the norm for very many months, even years!
Early discussions with the various departmental managers - sales, production, marketing,credit control and distribution - were however more fruitful in not only better defining theissue (order errors spotted by customers who then returned the unpaid invoices withcorrections for re-processing) but in also discovering that the warehouse manager wantedto improve his operations but had, until now, no wider basis on which to operate. With
this project he would be able to implement some of the paperwork changes that hisdespatch crews needed but were of no interest to the accounts team.
It is decided to map the Trade Debtor process at high level and then follow it through tothe operational sales and distribution processes. By using the deployment flowchartingnotation the way the work is done can be carefully examined in full detail. Traditionallinear flowcharting would not so precisely define who did what, when and where. It wasrecognised that the solution to the problem would most likely reside in the small-scaledetail; all the normal large-scale solutions had been tried many times before and alwaysfailed to win lasting improvement.

8/10/2019 Deployment Flowcharting
http://slidepdf.com/reader/full/deployment-flowcharting 14/21
Deployment FlowCharting
14
Product ion - GA Sales - GC -
DG Accounts - TB Custom er - XY Notes
Order
Formal order
document
J Plan &
manage
production run
Receive goods
into warehouse
Pallet
assembly
Delivery
schedule
Deliver to
customer
Off-load &
obtain signed
receipt
Proof of celivery
document
yes
Any iss ues ?no
Credit control
Invoice
Order
completed
Issue invoice
Customer
payment
process
Payment
received
See process
P10
See processes
P19 & P27
(l to r)
See process
P16
See process
P25
Figure 12 - A FlowMap showing high level mapping of the trade debtor process.
Suitable training and coaching was provided to the individual members of the variousteams involved with the distribution process and early meetings held between them withthe sales and order planning teams.
The picture became clearer. The warehouse distribution operation had a long term errorrate of some 185 units per week. Expressed as an error rate of 0.4% this seemed'reasonable' but when expressed in the unit of world-class performance, parts per million,it was an error rate of 4,100 ppm. Further when the previously ignored weekly errorfigures were examined in a run chart over the past few months the SPC chart showed avery stable system at work.
Only by means of a major change to the way the work was carried out on a daily basiscould the situation be improved. The weekly errors were randomly spread across allcustomer depots and at any one time were holding up payment of about one half of allinvoices issued.
Only detailed re-design of the process could reduce the defects figure to the long termtarget of below 100 ppm arbitrarily set by the managing director. A FlowMap of theoverall trading process was prepared, initially at high level and then progressively atlower more detailed levels all the way 'down' to individual work instructions. Key sub-

8/10/2019 Deployment Flowcharting
http://slidepdf.com/reader/full/deployment-flowcharting 15/21
Deployment FlowCharting
15
processes, such as pallet assembly, credit control etc., were identified and their detail wasalso mapped. During the mapping exercise the cast of characters learned a number oflessons. Firstly the importance of only mapping how the work is actually done at the time.Resist attempting to improve the process before you have defined clearly andunambiguously how it actually really operates on a routine basis, the ‘Revision Zero’condition.
Warehousesupervisor - MK
Sales - GC -
Checker - KL -
Notes
Order List
Ass emb ly Note
ref FGW01Select pallet
assembler
Select assembly
area & pallets
See processP14
Decide stacking
pattern & product
mi x
Asse mb le pal let
load
Mark layers &
record total units
Shrink-wrap
pallet & add ID#
at top front
Move pallet to
forward holding
area
Corrective
chill-down
Create pallet slip
FGW02
Mark-up FGW01
& pallet code #
File
copies
Order List
Load vehicle &
deliver to
customer Pass
Fail
Temp. check
Figure 13 - A FlowMap for a pallet loading process. When improving a process it is important to ensure thatthe customer is made aware of any changes that are introduced.
Don't try to capture the process in one session. It inevitably takes two or more iterations toget to Revision Zero. Further, make sure that there is a change control system in place sothat any change made to the Revision Zero map is made with everyone's knowledge.
Enthusiasm can, and does, run away with operators when they discover the power andthe joy of doing their job efficiently for, often, the first time in their working life. Goodideas can derail the entire operation if individual members of the cast forget that they arenow part of a team based upon co-operative working rather than competitive advantage.
Once Revision Zero had been mapped to the satisfaction of the "cast of characters" theprocess was followed without change for about ten weeks. During this period the errorrate dropped to 2,300 ppm. This was primarily due to the result of the initial process

8/10/2019 Deployment Flowcharting
http://slidepdf.com/reader/full/deployment-flowcharting 16/21
8/10/2019 Deployment Flowcharting
http://slidepdf.com/reader/full/deployment-flowcharting 17/21
Deployment FlowCharting
17
methodology. It is best if the precise details of the selected methodology are, in reality,developed, or at least endorsed, by the key participants, thus ensuring local ownership.
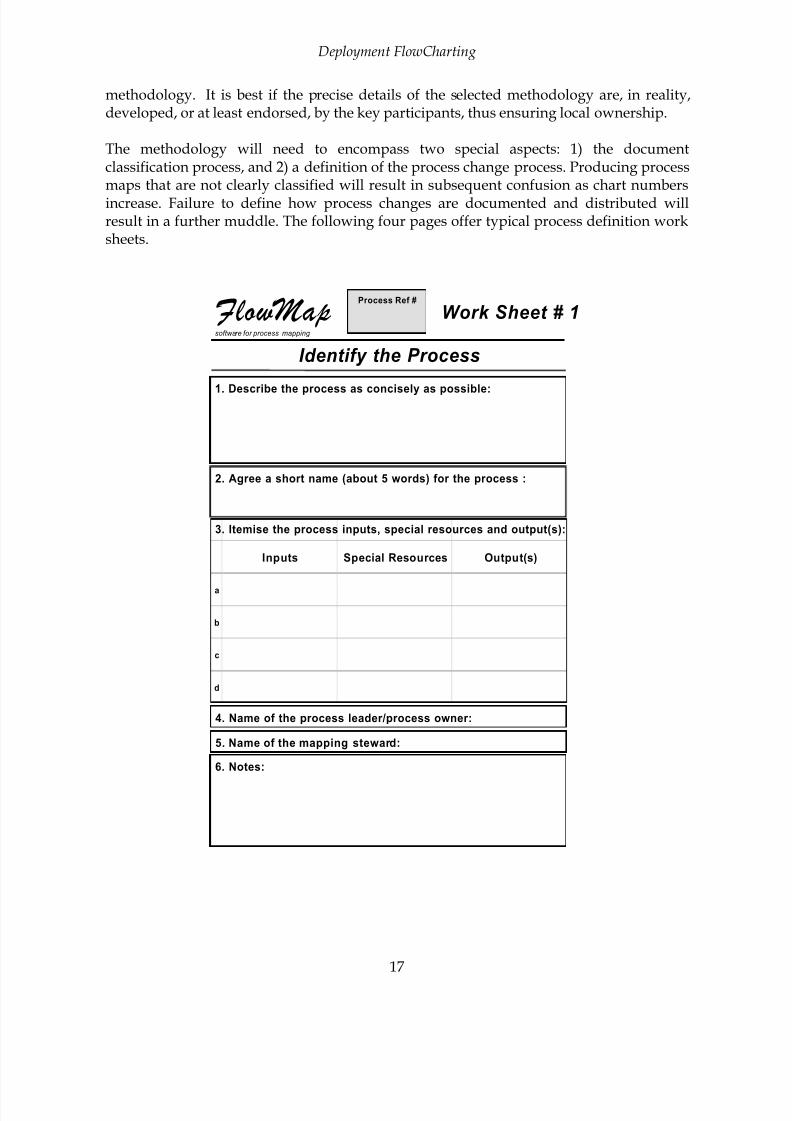
The methodology will need to encompass two special aspects: 1) the documentclassification process, and 2) a definition of the process change process. Producing processmaps that are not clearly classified will result in subsequent confusion as chart numbersincrease. Failure to define how process changes are documented and distributed willresult in a further muddle. The following four pages offer typical process definition worksheets.
FlowMap Work Sheet # 1
Identify the Process
1. Describe the process as concisely as possible:
2. Agree a short name (about 5 words) for the process :
5. Name of the mapping steward:
6. Notes:
a
b
c
d
Inputs Special Resources Output(s)
3. Itemise the process inputs, special resources and output(s):
software for process mapping
Process Ref #
4. Name of the process leader/process owner:

8/10/2019 Deployment Flowcharting
http://slidepdf.com/reader/full/deployment-flowcharting 18/21
Deployment FlowCharting
18
FlowMap
Identify the People
1. Are there any uncertainties over process ownership: YES / NO
(see foono te*) (encircle)
5. Identify process customer(s):
a
b
c
d
e
f
Name Location Position/Job Title
3. Identify the cast of characters within the process:
* Only procee d beyond (2) if answer to (1) is NO.
2. If YES, state by whom they will be resolved, by when and o whose authority:
software for process mapping
Process Ref #
Work Sheet # 2
4. Name of the mapping steward:
8/10/2019 Deployment Flowcharting
http://slidepdf.com/reader/full/deployment-flowcharting 19/21
Deployment FlowCharting
19
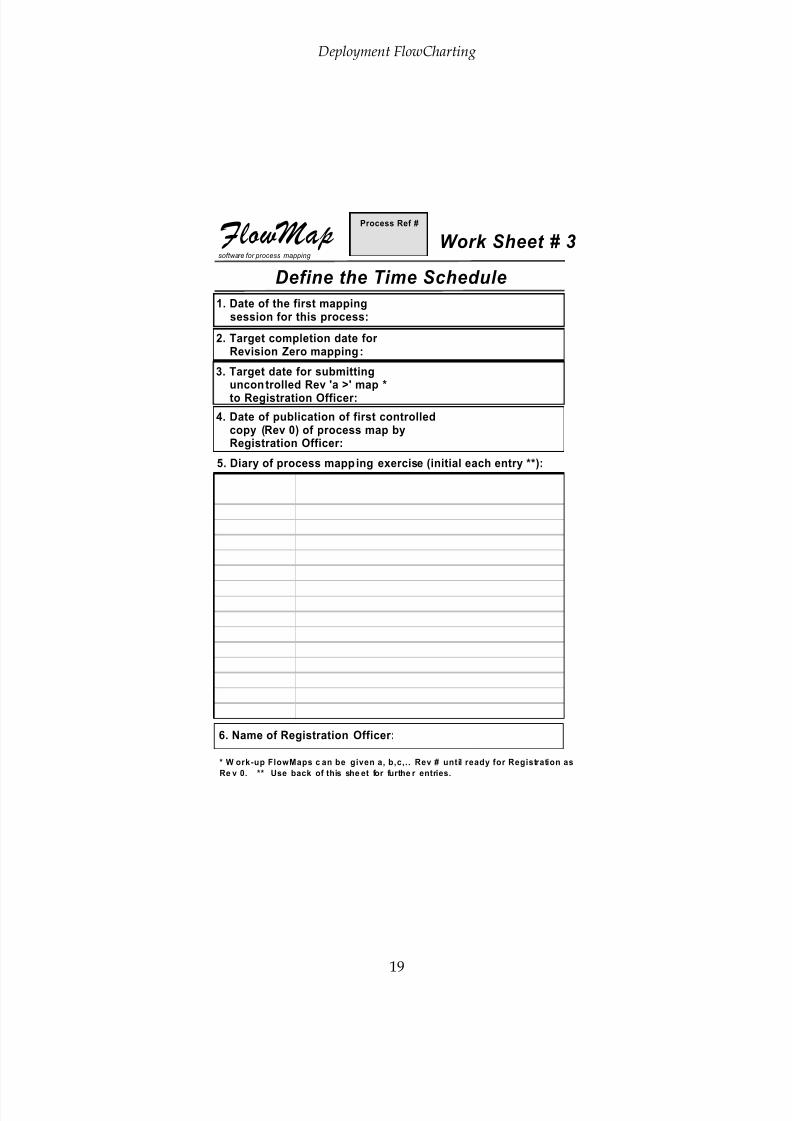
FlowMap Work Sheet # 3
Define the Time Schedule
1. Date of the first mapping session for this process:
3. Target date for submitting uncontrolled Rev 'a >' map * to Registration Officer:
* W ork-up FlowMaps c an be given a, b,c,.. Rev # until ready for Registration as
Re v 0. ** Use back of this she et for furthe r entries.
2. Target completion date for Revision Zero mapping:
software for process mapping
Process Ref #
4. Date of publication of first controlled copy (Rev 0) of process map by Registration Officer:
5. Diary of process mapping exercise (initial each entry **):
6. Name of Registration Officer:

8/10/2019 Deployment Flowcharting
http://slidepdf.com/reader/full/deployment-flowcharting 20/21

8/10/2019 Deployment Flowcharting
http://slidepdf.com/reader/full/deployment-flowcharting 21/21
Deployment FlowCharting
8 - CONCLUSION
Over the past two decades experience has shown that there is no better means thandeployment flowcharting to fully understand how a process actually works. And knowingthis is the key to finding out what opportunities there are for improvement and
innovation. Such charting forms the starting point for SPC or the study of processbehaviour and capability. (See our companion booklet The Basics of Statistical ProcessControl & Behaviour Charting for details of getting started with SPC).
But deployment flowcharts do more than just drive improvement. They also provide thekey documentation for compliance with such management systems as the ISO 9001 2000,ISO14000 and OHSAS 18001. And beyond that they also provide a firm basis for stafftraining as well as a re-assuring basis for demonstrating due diligence – something whichwill be increasingly required by insurers and regulators alike in the coming years.
______________________________________________
This booklet is provided to users of The FlowMap System to provide general insights into business problemsolving and process aligned management. The key to both of these activities is the discipline of
'thinking in systems and working on processes'.
______________________________________________
This publication copyright (c) 2003 Management-NewStyle ISBN : 0-9543866-4-7 1st Edition, June 2003 Published by Management-NewStyle,
Chislehurst, Kent, BR7 5NB, England www.firstmetre.co.uk
The FlowMap System (c) 1990-2003 David HowardFlowMap Software (c) 1994-2003 David Howard and Maurice Tomkinson
MAP is a registered trademark of Management-NewStyle