design of scale-model floating wind turbine: spar buoy
TRANSCRIPT
EVALUATION OF WRTA SERVICE
DESIGN OF SCALE-MODEL FLOATING WIND TURBINE:
SPAR BUOY
A Major Qualifying Project Report
submitted to the Faculty of
WORCESTER POLYTECHNIC INSTITUTE
in partial fulfillment of the requirements for the
Degree of Bachelor of Science.
Written by:
____________________________
Justin Frye
____________________________
Nathan Horvath
____________________________
Arnold Ndegwa
Approved by:
____________________________
Prof. David Olinger
09 March 2011

Frye, Horvath, Ndegwa
2
Abstract The goal of this project was to design and build a 100:1 scale model of a spar buoy
floating wind turbine. This report details the design process used to create the spar buoy, as well
as a mooring system. A preliminary design for adding rotating blades to the nacelle is also
described. The components were modeled in SolidWorks, then machined using either a rapid
prototyping machine or machine tools. A system of accelerometers, inclinometers, and load cells
which were developed by a concurrent master’s thesis project was implemented into the model to
collect data during the testing phase. Models were tested in fresh water to determine draft,
buoyancy, and the spar-buoy response to differing wave heights and frequencies. One round of
testing, conducted at Alden Research Laboratory in Holden, Massachusetts, was performed on
the spar buoy while anchored to the base of the water flume. Future testing using the developed
scale model will implement the rotating blades and model the gyroscopic and thrust effects on
the spar buoy.
Frye, Horvath, Ndegwa
3
Acknowledgements This MQP project was supported by the Energy for Sustainability Program of the
National Science Foundation through Grant CBET-0853579. The team would like to sincerely
express its thanks to the following people, who have willingly contributed with their knowledge,
experience, advice, and time throughout this endeavor:
WPI’s Mechanical Engineering Department, for their financial support of the group’s 3D
printing work;
Professor David Olinger, for his direction during the eight months of project-work, and
for his vision and passion in promoting renewable energy and a sustainable future;
WPI Graduate Student Kazim Naqvi, for his assistance with the design of the anchoring
system, implementation of the load cells, and his expertise with the electronic systems
used for data collection;
WPI Graduate Student Eric Murphy, for designing, purchasing, and installing all the
necessary instrumentation for data collection, and providing test results for the
completion of this project report;
WPI Doctorate Student, Ali Nematbakhsh, for the insight provided during testing and for
his numerical simulations of both the TLP and Spar Buoy tests;
WPI Doctorate Student, Erica Stults, for printing all necessary parts to construct the Spar
Buoy model, and ensuring these were always in-line with the team’s design
specifications;
Alden Research Laboratory, for the use of their facilities during testing and for providing
the team with all necessary equipment for smooth testing;

Frye, Horvath, Ndegwa
4
And finally, the WPI Aerospace Department faculty, for their suggestions on
improvements to the team’s design, and bi-weekly advice during presentations.
Frye, Horvath, Ndegwa
5
Table of Contents
Abstract ......................................................................................................................................................... 2
Acknowledgements ....................................................................................................................................... 3
Table of Contents .......................................................................................................................................... 5
List of Tables ................................................................................................................................................. 7
List of Figures ................................................................................................................................................ 8
1. Introduction ............................................................................................................................................ 10
2. Background ............................................................................................................................................. 13
2.1. Wind Power ...................................................................................................................................... 13
2.2 Offshore Wind Power ....................................................................................................................... 14
2.3 Shallow Offshore Wind Turbines ...................................................................................................... 16
2.4 Developments in Floating Wind Turbines ......................................................................................... 17
2.4.1 Previous Scale Floating Wind Turbine Tests .............................................................................. 19
2.4.2 Previous Full Scale Floating Wind Turbine Tests ........................................................................ 21
2.4.3 Mooring Cable Configurations for the Spar Buoy Design .......................................................... 23
3. MQP Objectives....................................................................................................................................... 25
4. Design and Manufacture ......................................................................................................................... 26
4.1 Project Designs .................................................................................................................................. 26
4.2 Scaling of Dimensions ....................................................................................................................... 27
4.3 Mass Calculations .............................................................................................................................. 28
4.4 Turbine Platform and System Components ...................................................................................... 32
4.4.1 Platform ..................................................................................................................................... 32
4.4.2 Instrumentation Cylinder ........................................................................................................... 35
4.4.3 Tank Cover ................................................................................................................................. 36
4.4.4 Ballast Plates .............................................................................................................................. 37
4.4.5 Cables and Attachments ............................................................................................................ 39
4.4.6 Modified Cable Attachments ..................................................................................................... 41
4.4.7 Anchoring Plates ........................................................................................................................ 42
4.4.8 Full Assembly Views ................................................................................................................... 44
4.5 Center of Mass Test .......................................................................................................................... 46
4.6 Flotation Test .................................................................................................................................... 47

Frye, Horvath, Ndegwa
6
4.7 Design of Disk for Wind Modeling .................................................................................................... 48
4.8 Blades and Motors for Wind Modeling ............................................................................................. 53
4.9 Design Modifications ........................................................................................................................ 57
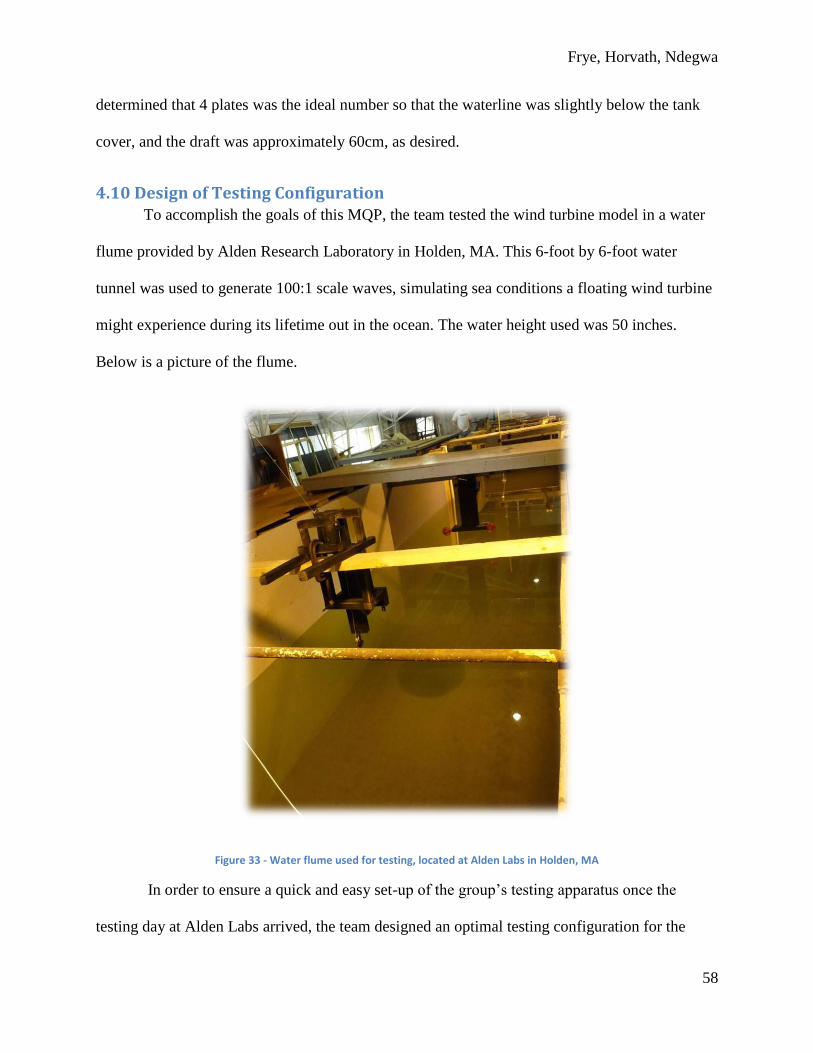
4.10 Design of Testing Configuration ...................................................................................................... 58
5. Testing ..................................................................................................................................................... 60
6. Results ..................................................................................................................................................... 62
7. Conclusions ............................................................................................................................................. 66
8. Future Work ............................................................................................................................................ 67
References .................................................................................................................................................. 69
Appendix ..................................................................................................................................................... 71
Certain materials are included under the fair use exemption of the U.S. Copyright Law and have
been prepared according to the fair use guidelines and are restricted from further use.

Frye, Horvath, Ndegwa
7
List of Tables Table 1 - Offshore Wind Resources available off the US coast, in GW and km2 [3] ................................... 15
Table 2 - 100:1 Scale Spar Buoy Floating Wind Turbine Design Parameters .............................................. 26
Table 3 - Ballast Configuration Calculation Results .................................................................................... 30
Table 4 - Air speed measurements performed on industrial fan to be used for wind modeling. .............. 52
Table 5 - Design specifications for the SK28-36 750 model motor ............................................................. 54
Table 6 - Comparisons of the moment of inertia and weight calculations of different blade materials ... 56

Frye, Horvath, Ndegwa
8
List of Figures Figure 1- Renewable Energy Consumption in the Nation’s Energy Supply, 2009 [1] ................................. 10
Figure 2 - Wind energy potential of the east coast in kilowatts [2]............................................................ 11
Figure 3 - Floating Wind Turbine Designs [3]. ............................................................................................. 18
Figure 4 - Scale model of the WindFloat floating system ........................................................................... 19
Figure 5 - A prototype of the floating wind turbine developed by MARINTEK. ......................................... 21
Figure 6 -Installation of the Full- prototype of Statoil’s Hywind Wind Turbine Floating System ............... 22
Figure 7 - A prototype of the floating wind turbine developed by Blue H Technologies. .......................... 23
Figure 8 - Ballasted mooring lines configuration for the spar buoy design. ............................................... 24
Figure 9 - Cross-sectional view of tank assembly ....................................................................................... 27
Figure 10 - Spar Buoy Floating Wind Turbine full assembly ....................................................................... 28
Figure 11 - Assembly method for spar buoy tank ....................................................................................... 33
Figure 12 - Photo of Spar Buoy tank (with cover and cable attachments) ................................................. 34
Figure 13 - Inside of Spar Buoy tank, showing ABS cement glue layer in black .......................................... 34
Figure 14 - Instrumentation cylinder with ABS cement coating ................................................................. 35
Figure 15 - Cross-sectional view of tank cover sketch ................................................................................ 36
Figure 16 - Bottom view of tank cover. ....................................................................................................... 37
Figure 17 - Top view of tank cover. ............................................................................................................. 37
Figure 18 - SolidWorks sketch of one steel plate to be used as ballast ...................................................... 38
Figure 19 - Rust-protected, ballast steel plates .......................................................................................... 39
Figure 20 - SolidWorks sketch of mooring cable attachment ..................................................................... 40
Figure 21 - Zoomed view of mooring cable attachment ............................................................................. 41
Figure 22 - SolidWorks screenshot of modified cable attachment. ............................................................ 42
Figure 23 - Alden Labs Testing Configuration, on SolidWorks .................................................................... 44
Figure 24 - Zoomed view on location where silicone was applied for water-tightness ............................. 46
Figure 25 - Spar Buoy Center of Mass test. ................................................................................................. 46
Figure 26 - Spar Buoy Full Assembly Flotation Test. ................................................................................... 48
Figure 27 - Wind modeling test of floating wind turbine. .......................................................................... 49
Figure 28- SolidWorks model of new nacelle assembly with carbon fiber blades and foam disk .............. 50
Figure 29 - Plot of disk diameter as a function of fan air speed, for wind modeling. ................................. 51
Figure 30 - Plot of air speed as a function of distance from industrial fan. ................................................ 52
Figure 31 - Plot of disk mass as a function of fan air speed. ....................................................................... 53
Figure 32 - SK28-36 750 model ................................................................................................................... 55
Figure 33 - Water flume used for testing, located at Alden Labs in Holden, MA ....................................... 58
Figure 34 - LabVIEW screenshot of TLP testing .......................................................................................... 62
Figure 35 - LabVIEW screenshot of spar buoy testing ................................................................................ 63
Figure 36 - Graph showing results from Spar buoy test ............................................................................. 65
Figure 37 - SolidWorks drawing of tank cover (all dimensions in cm) ........................................................ 71
Figure 38 - SolidWorks drawing of Spar Buoy Tank Assembly (all dimensions in cm) ................................ 72
Figure 39 - SolidWorks drawing of modified cable attachments (all dimensions in cm)............................ 73
Figure 40 - SolidWorks drawing of platform assembly (all dimensions in cm) ........................................... 74

Frye, Horvath, Ndegwa
9
Figure 41 - Spar Buoy Testing Configuration (all dimensions in cm) .......................................................... 75
Frye, Horvath, Ndegwa
10
1. Introduction The world is reaching a pivotal period in its history. Since the 1960’s, people have begun
to realize that our current dependence on fossil fuels needs to change, but no significant steps
have been taken to cut consumption until very recently. The U.S. uses more oil than any other
nation, and needs to lead the push toward renewable energy sources. We are nearing what has
been deemed a critical point in the consumption of fossil fuels, as we have nearly used half of the
fossil fuels resources available throughout the world.
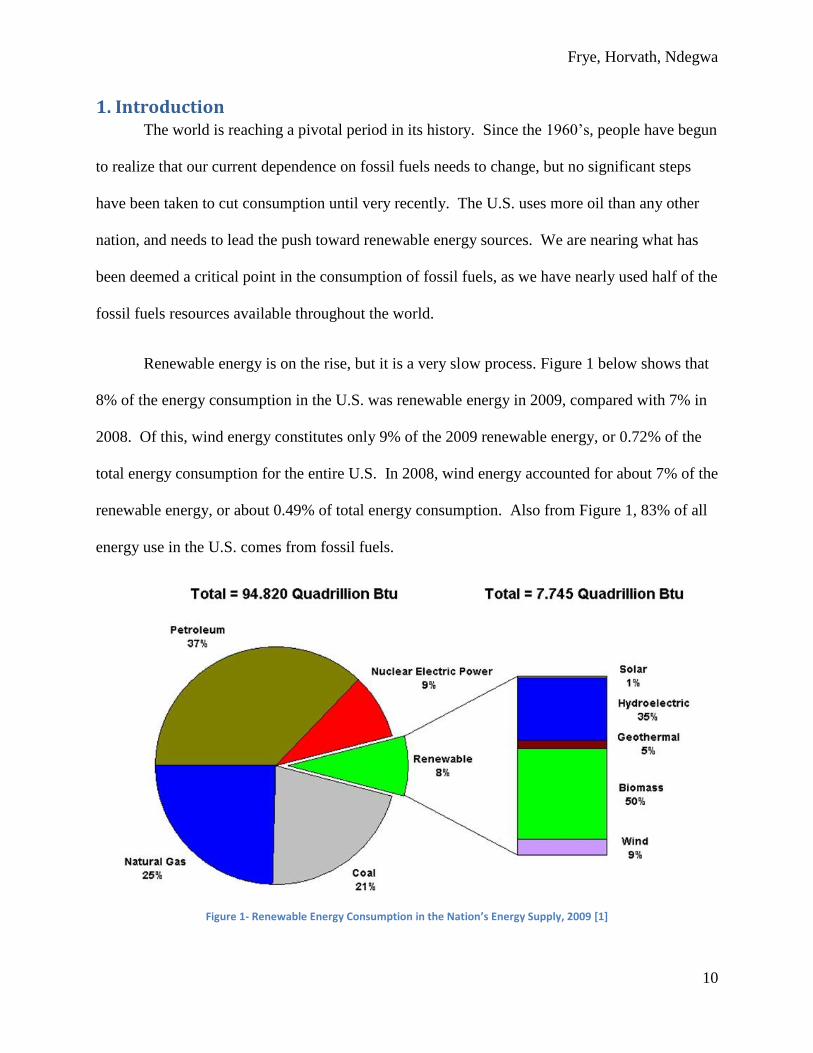
Renewable energy is on the rise, but it is a very slow process. Figure 1 below shows that
8% of the energy consumption in the U.S. was renewable energy in 2009, compared with 7% in
2008. Of this, wind energy constitutes only 9% of the 2009 renewable energy, or 0.72% of the
total energy consumption for the entire U.S. In 2008, wind energy accounted for about 7% of the
renewable energy, or about 0.49% of total energy consumption. Also from Figure 1, 83% of all
energy use in the U.S. comes from fossil fuels.
Figure 1- Renewable Energy Consumption in the Nation’s Energy Supply, 2009 [1]

Frye, Horvath, Ndegwa
11
One possible expansion of renewable energy is through floating wind turbines. Wind
energy is a vast and relatively untapped resource. Offshore wind turbines have the potential to
significantly decrease the use of fossil fuels, being thus of great benefit to the environment.
Currently, almost all wind energy is harnessed through stationary wind platforms, either on land
or in shallow water fixed to the ocean floor.
The idea of locating wind farms far offshore is not only to remove them from the horizon
of the coast, but also to harness the strong winds that exist in the above the open sea waters.
Figure 2 below shows the east coast of the U.S. and the amount of potential wind energy that
could be harnessed from offshore wind turbine farms in those locations. The wind over the
ocean is strong in many other places around the world, and these potential wind farms could
become a catalyst for a global move towards renewable energy.
Figure 2 - Wind energy potential of the east coast in kilowatts [2]

Frye, Horvath, Ndegwa
12
Offshore wind turbines will also help decrease the transmission distance of many of the
wind farms to major cities. Since there are a large number of cities which are located in coastal
areas, and many of the current land based wind farms are found in the mid-western part of the
country, the U.S. could greatly decrease the amount of money spent transporting the harvested
energy to the cities that need it by installing offshore wind farms.
As the world shifts toward renewable energy resources, significant amounts of research
will be needed to aid the continual development of these new energy resources in order to use
them in a large scale setting such as wind farms. This MQP will study one specific design of the
floating wind turbine concepts, the Spar Buoy. It will involve designing and manufacturing a
100:1 scale-model spar buoy platform, and performing tests in a water flume with the use of a
wave generator at Alden Research Laboratory in Holden, MA. This will be done in order to
analyze the turbine system’s response to different simulated ocean conditions. Finally, the team
will draw conclusions on the feasibility of this design and determine any future improvements
that can be made so that it can be implemented on wind farms.

Frye, Horvath, Ndegwa
13
2. Background
2.1. Wind Power
Wind power is defined as energy derived from the conversion of kinetic energy of
moving air into useful forms such as electric energy for powering homes and industries. Wind
energy is not only a renewable form of energy, but also a clean energy source, since it does not
produce any harmful byproducts or emissions that can damage the environment. Wind energy is
also an attractive form of energy generation, because it utilizes wind which is found abundantly
in many areas of the world. It also does not require a large land-use footprint compared to other
energy generation methods like hydroelectric generation. Hence, other activities such as
agriculture can be carried out in the same location. These advantages make wind energy an ideal
method of harnessing energy to augment or replace the power derived from the much more
environmentally harmful fossil fuels.
Over the past few decades, technological improvements in the wind energy sector have
led to a significant drop in the cost of producing electricity. Better siting procedures, more
accurate wind maps and measurements, and larger, more efficient turbines, manufactured with
better materials and production techniques have contributed to the significant increase in current
wind turbine efficiency [16]. Wind energy does, however, face numerous hurdles such as noise
and visual pollution, and relatively low generation efficiency. For example in the latter case, the
generation capacity of nuclear plants in the US is approximately 98% while the capacity of wind
turbines cannot exceed 59.3% according to the Betz’ law limit. Furthermore, there are concerns
about the possible impact of the spinning blades on the avian and bat populations. These

Frye, Horvath, Ndegwa
14
drawbacks however, pale in comparison to the advantages that may be accrued from producing
vast amounts of energy from wind.
2.2 Offshore Wind Power Offshore wind power utilizes the vast wind energy resources found offshore to produce
electricity. More accurate wind data collection shows that most of the wind resources lie off the
coast, and this is evident in the US wind map in section 1 of this report. It is this abundance of
wind resources offshore that has brought an increased interest in the development of electricity-
generating wind facilities in open sea waters. Locating the wind facilities in the open ocean has
many other benefits as well. Their distance from land may result in less of an aesthetic and noise
problem, which comprises a good portion of the debate regarding the Cape Wind project off the
coast of New England. The vast open space of the ocean provides ample room to place wind
farms. This open space also results in faster and more unobstructed winds, which is the main
contributing factor of the large wind resource offshore.
Currently, there is a renewed interest in the vast wind resources that exist off the coast of
the United States. It is estimated this resource has a potential installed capacity of roughly 4.15
terawatts. According to the US Energy Information Administration (E.I.A), the net demand for
electricity in 2008 in the US was roughly 744,151 GW, while installed generation capacity
exceeded 900 GW. Therefore offshore wind resources could conceivably supply a large portion
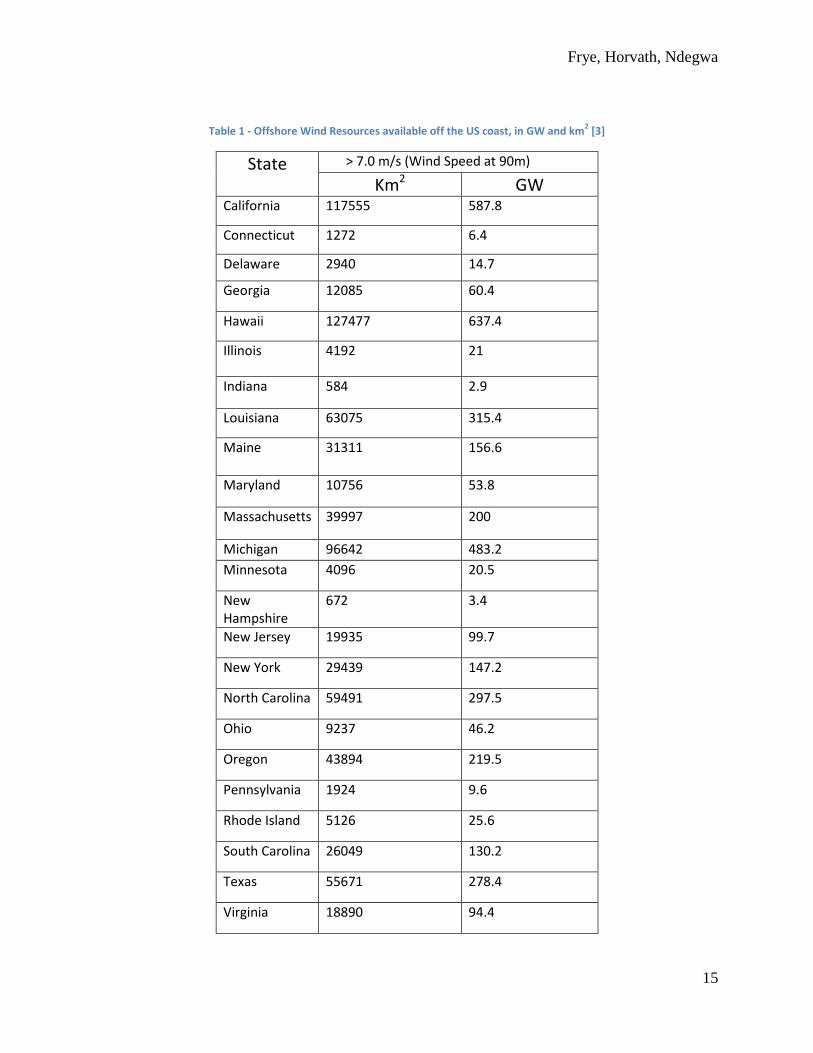
of the electricity supply. Table 1 shows the offshore wind resources available in square
kilometers (km2) and potential installed capacity in (GW) of US states with shorelines. The areas
considered had winds with average annual speeds greater than 7 meters-per-second (m/s).
Frye, Horvath, Ndegwa
15
Table 1 - Offshore Wind Resources available off the US coast, in GW and km2 [3]
State > 7.0 m/s (Wind Speed at 90m)
Km2 GW California 117555 587.8
Connecticut 1272 6.4
Delaware 2940 14.7
Georgia 12085 60.4
Hawaii 127477 637.4
Illinois 4192 21
Indiana 584 2.9
Louisiana 63075 315.4
Maine 31311 156.6
Maryland 10756 53.8
Massachusetts 39997 200
Michigan 96642 483.2
Minnesota 4096 20.5
New Hampshire
672 3.4
New Jersey 19935 99.7
New York 29439 147.2
North Carolina 59491 297.5
Ohio 9237 46.2
Oregon 43894 219.5
Pennsylvania 1924 9.6
Rhode Island 5126 25.6
South Carolina 26049 130.2
Texas 55671 278.4
Virginia 18890 94.4
Frye, Horvath, Ndegwa
16
Washington 24455 122.3
Wisconsin 23298 116.5
Total 830064 4150.3
2.3 Shallow Offshore Wind Turbines Shallow offshore wind turbines consist of turbines that are installed in shallow waters
close to the coast. In most cases, water depths suitable for their installation range between 30-80
meters. Most of the offshore wind turbines currently installed are of the bottom fixed type,
similar to those used onshore. However, different depths require different foundations for
stability. A monopole with a six meter diameter is usually used in waters up to 30 meters deep;
in deeper waters of up to 80 meters, a tripod base or steel jacket is used for stability.
Currently, Europe is the world leader in installed offshore wind energy. The first wind
farm placed in operation during 1991 and was located in Denmark, and as of June 2010, Europe
had an installed capacity of 2396 MW [11]. There are 39 offshore wind farms presently installed
with 100GW of new projects proposed or under construction.
Contrastingly, there are no offshore wind farms in the United States. All of the wind
power produced in the United States comes from onshore wind farms with a generation capacity
of 34,296MW in 2009 [14]. However in a report issued by the Department of Energy (DOE) in
2010, a plan was laid out to achieve 54 GW of offshore wind power by 2030 [12]. Most of the
potential offshore farms are close to the major urban load centers that are found along the coasts
where land for onshore wind farms is limited, and demand for energy is high. The first of these
wind farms is the Cape Wind Project sited off the coast of Nantucket Sound in Massachusetts.
This wind farm will be comprised of 130 wind turbines, producing up to 170 MW, to cover 75%
of the electricity needs in Cape Cod, Martha’s Vineyard and Nantucket.

Frye, Horvath, Ndegwa
17
2.4 Developments in Floating Wind Turbines The large wind resources found in deeper waters off the coast and the growing need for
renewable energy sources have led to interest in the development of floating wind turbine
facilities. Floating wind turbine facilities can be sited in deeper waters where large and less
turbulent wind resources exist and where there is an abundance of open space. Since most
designs do not require heavy concrete foundations, floating wind facilities offer a cost effective
choice in capturing wind energy for water depths in excess of 50 meters. The floating designs
also have an extra advantage of low decommissioning costs compared to conventional offshore
wind turbines. This is because the floating structure does not have a large footprint on the
seabed, since it uses mooring lines for anchorage. Floating wind turbine technologies have also
benefited from floating technologies, pioneered and improved by the oil and gas industries.
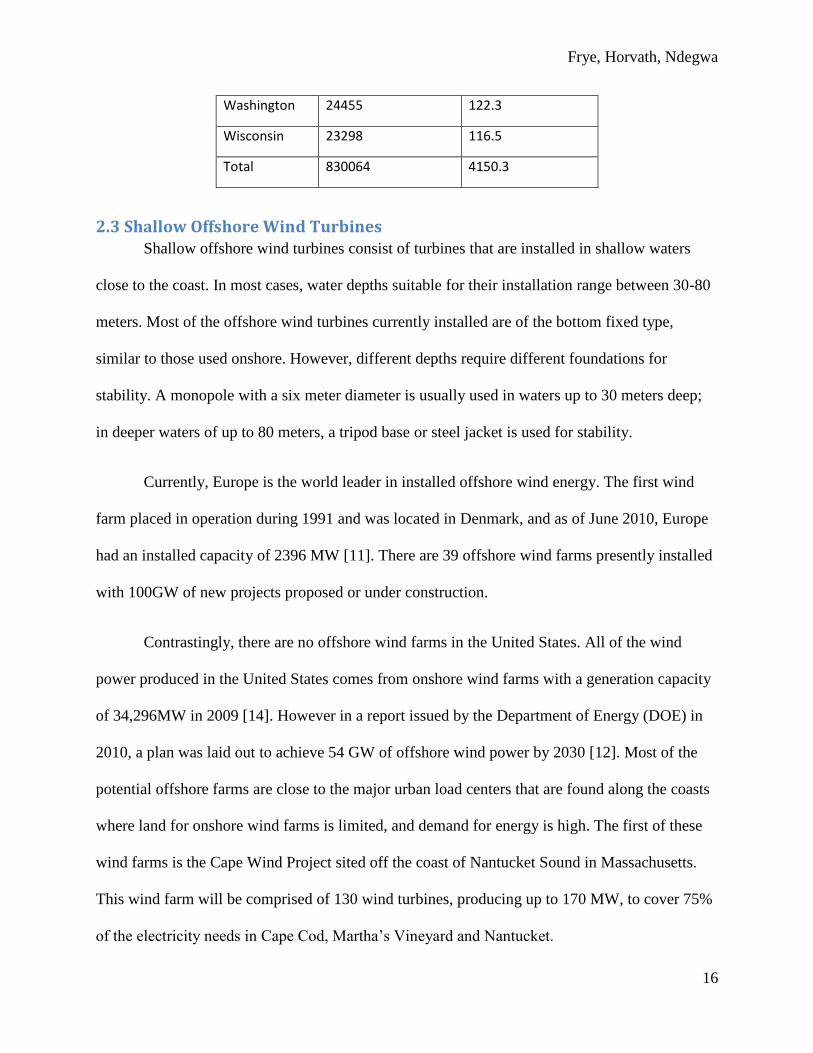
There are currently several floating wind turbine designs that show the most promise for
the advancement of offshore wind technology as shown in figure 3. These include the Tension
Leg Platform (TLP), Shallow draft barge, and Spar buoy concepts. The TLP incorporates a tank
with an intermediate aspect ratio (ratio between height and diameter) as compared to the other
floating concepts. The TLP design achieves stability through the use of vertical mooring lines
that are attached to tank legs and tensional by the reverse buoyancy of the tank. Thus, the
platform is permanently moored by means of tethers attached at the corners of the structure.
Another design is the shallow draft barge. The barge concept incorporates a tank design with
lower aspect ratio and larger water plane area compared to the TLP and spar buoy designs. The
barge concept achieves stability from the large water plane area-to-volume ratio that allows it to
remain buoyant in water. The spar buoy model is designed for deeper waters of up to 300 meters.
The spar buoy incorporates an elongated cylindrical tank with a high aspect ratio, which holds
Frye, Horvath, Ndegwa
18
ballast at the tank bottom. The ballast helps to lower the center of gravity of the tank and make it
more stable. In addition, the spar buoy is moored to the ocean bed with either taut or catenary
lines to provide further stability.
The TLP and Barge designs were the subjects of the MQP carried out in 2009 [10]. For
the current project, our team designed, built, and analyzed a 100:1 scale prototype of the Spar
Buoy concept. Of note are the differences in size and structural designs of their platforms.
Figure 3 - Floating Wind Turbine Designs [3].
Shallow Draft Barge
Platform
Spar Buoy
Tension-Leg Platform
Frye, Horvath, Ndegwa
19
2.4.1 Previous Scale Floating Wind Turbine Tests
2.4.1.1 WindFloat Floating Model
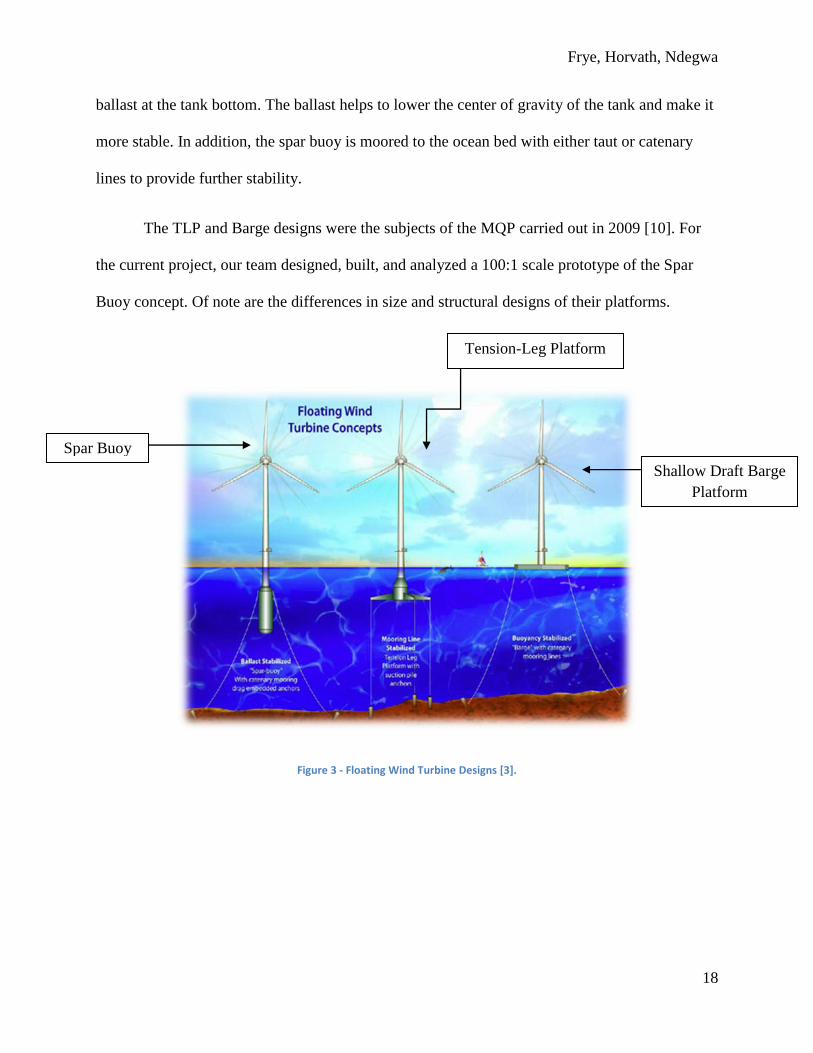
The WindFloat model comprises a three-legged floating foundation designed to support
multi megawatt offshore wind turbines [13]. The foundation is designed to accommodate large
wind turbines (5 MW and above), with minimum modifications made to the nacelle and rotor. As
part of the plan in developing the prototype model, the designers carried out tests on scale
models. The 1/105 scale model was fabricated out of acrylic [13]. The figure below shows the
scale model with the different components listed.
Figure 4 - Scale model of the WindFloat floating system
List with the components comprising the above floating wind turbine system, and their functions:
Frye, Horvath, Ndegwa
20
1. Floating columns with water-entrapment plates
2. Video camera: tracked the motion of light-emitting diodes placed on the model
3. Tower: made from acrylic piping
4. Loading cell: measured the axial force perpendicular to the tower
5. Foam board disk: attracts wind loads matching the design wind force
6. Electrical motor: modeled the gyroscopic effect
7. Turbine blades: modeled out of aluminum rods
8. End weights: helped in matching the design inertia.
To carry out the test, the model was placed in a floating tank using four soft springs and
mooring lines. A plunger type wave maker produced the scale waves while a set of five large
wind fans generated the required wind loading. A three-hour test was carried out to simulate a
100-year storm, with an associated wind of 25 m/s [13].
2.4.1.2 Statoil/ SINTEF Scale Tests.
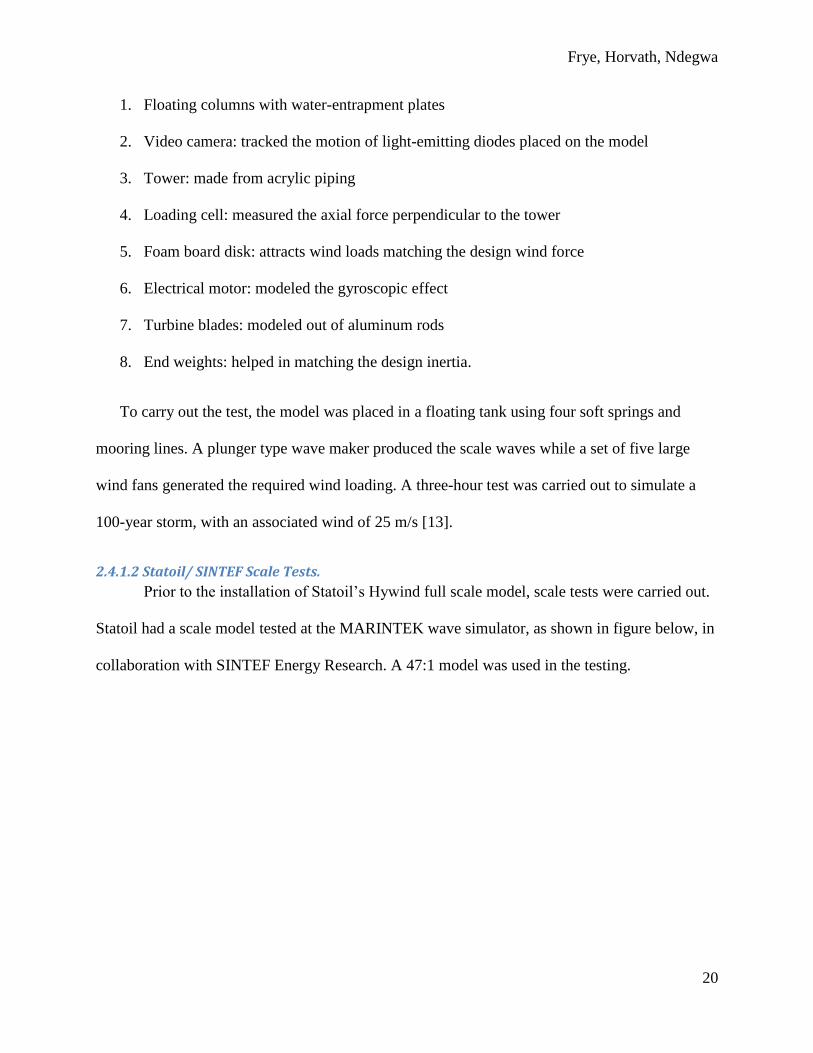
Prior to the installation of Statoil’s Hywind full scale model, scale tests were carried out.
Statoil had a scale model tested at the MARINTEK wave simulator, as shown in figure below, in
collaboration with SINTEF Energy Research. A 47:1 model was used in the testing.
Frye, Horvath, Ndegwa
21
Figure 5 - A prototype of the floating wind turbine developed by MARINTEK.
2.4.2 Previous Full Scale Floating Wind Turbine Tests
Despite the increased interest in Floating Wind Turbines, there have been few floating
systems that have been subject to open sea trials. This is mainly due to the larger scale and
resources that are needed to undergo such a turbine test. Consequently, most of the promising
wind turbine models have been subject to limited scale model testing as described in the previous
section.
2.4.2.1 Statoil’s Hywind
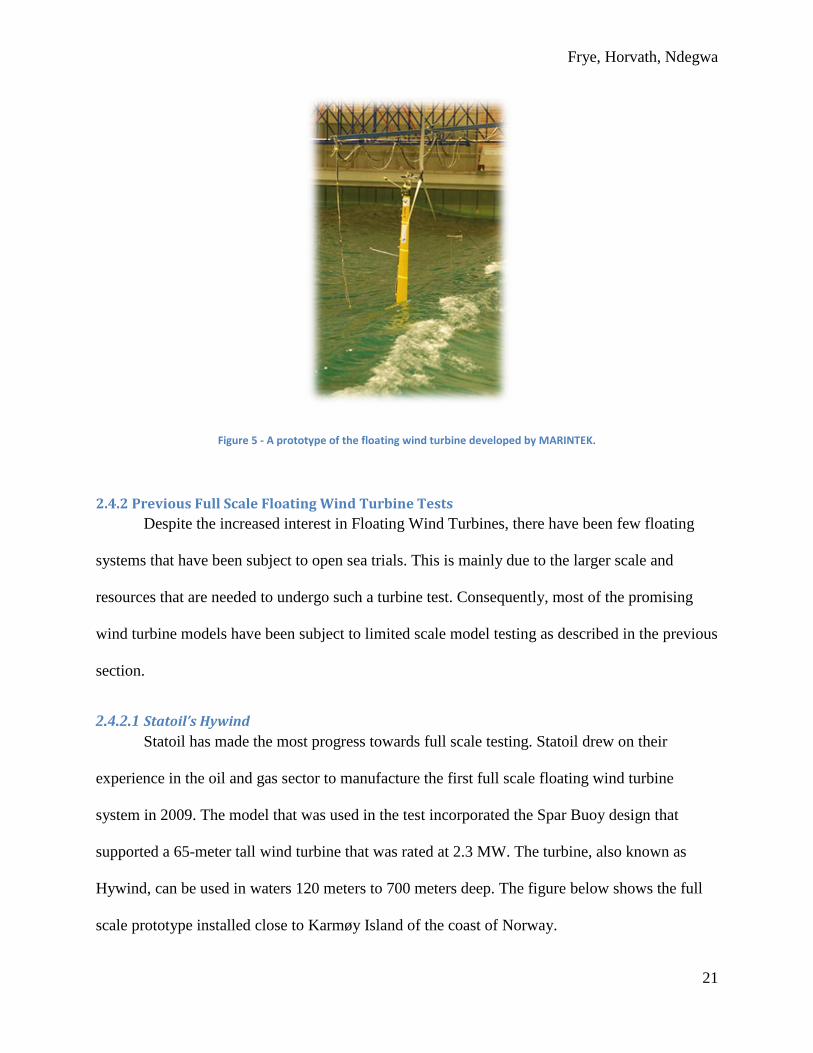
Statoil has made the most progress towards full scale testing. Statoil drew on their
experience in the oil and gas sector to manufacture the first full scale floating wind turbine
system in 2009. The model that was used in the test incorporated the Spar Buoy design that
supported a 65-meter tall wind turbine that was rated at 2.3 MW. The turbine, also known as
Hywind, can be used in waters 120 meters to 700 meters deep. The figure below shows the full
scale prototype installed close to Karmøy Island of the coast of Norway.
Frye, Horvath, Ndegwa
22
Figure 6 -Installation of the Full- prototype of Statoil’s Hywind Wind Turbine Floating System
2.4.2.2 Blue H Technologies
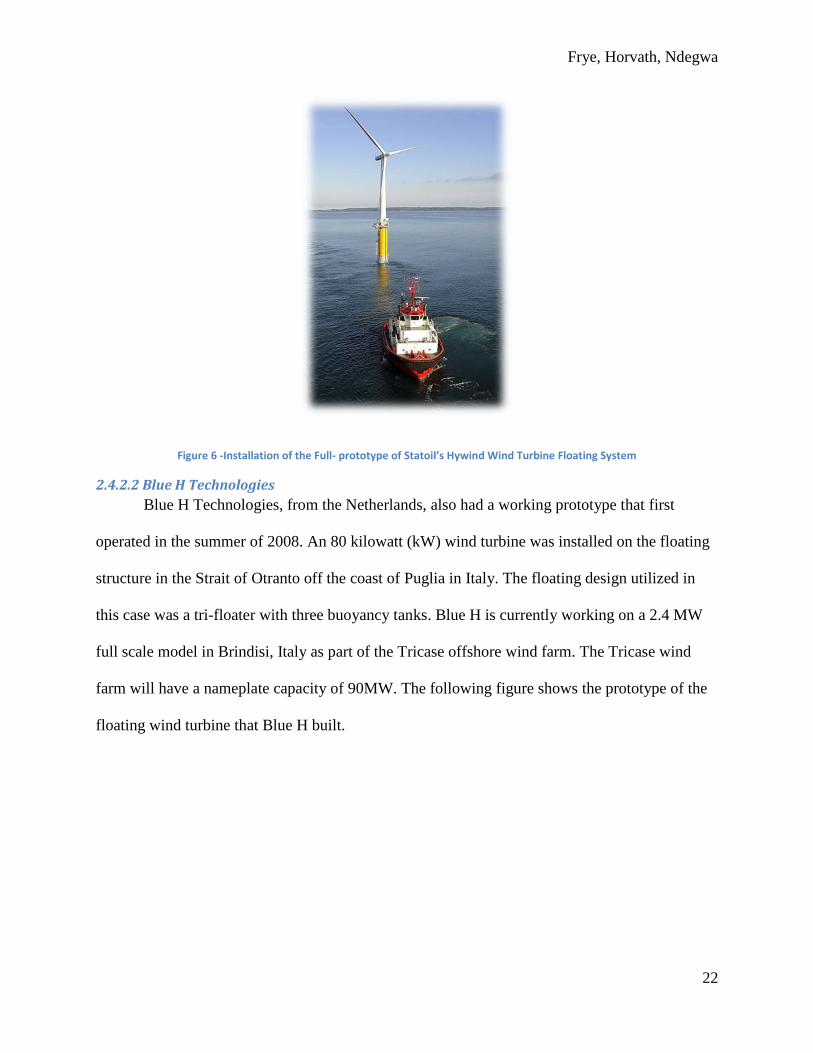
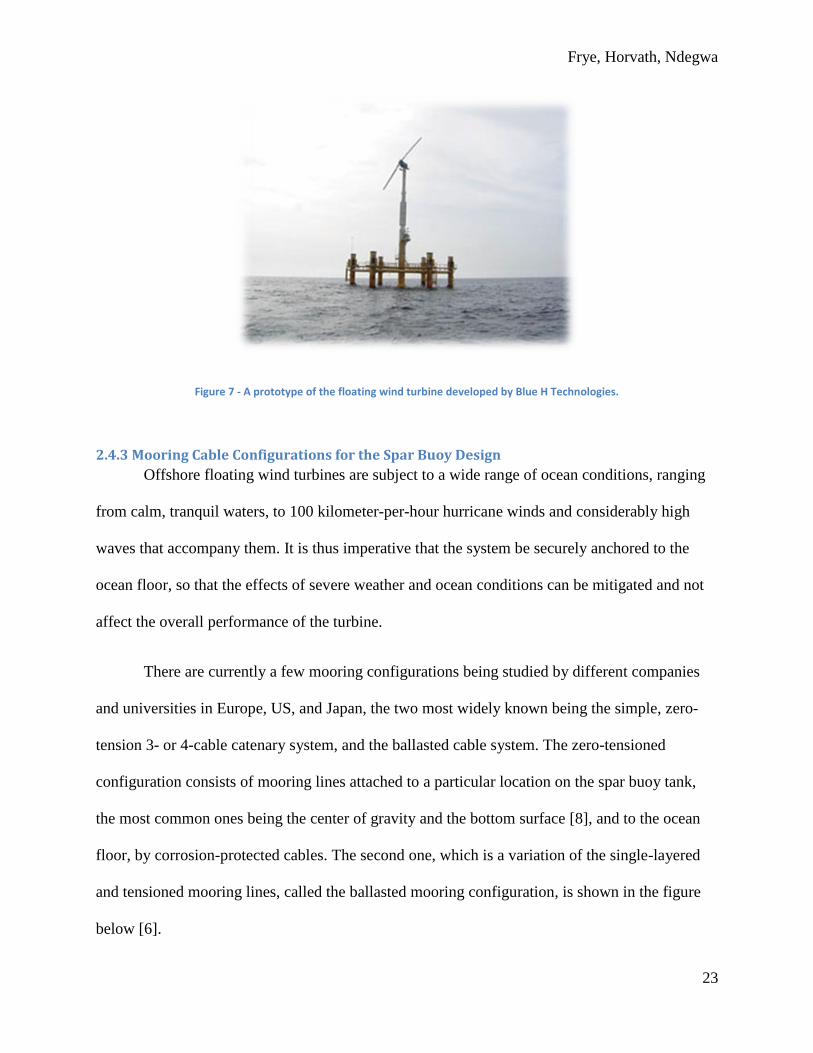
Blue H Technologies, from the Netherlands, also had a working prototype that first
operated in the summer of 2008. An 80 kilowatt (kW) wind turbine was installed on the floating
structure in the Strait of Otranto off the coast of Puglia in Italy. The floating design utilized in
this case was a tri-floater with three buoyancy tanks. Blue H is currently working on a 2.4 MW
full scale model in Brindisi, Italy as part of the Tricase offshore wind farm. The Tricase wind
farm will have a nameplate capacity of 90MW. The following figure shows the prototype of the
floating wind turbine that Blue H built.
Frye, Horvath, Ndegwa
23
Figure 7 - A prototype of the floating wind turbine developed by Blue H Technologies.
2.4.3 Mooring Cable Configurations for the Spar Buoy Design
Offshore floating wind turbines are subject to a wide range of ocean conditions, ranging
from calm, tranquil waters, to 100 kilometer-per-hour hurricane winds and considerably high
waves that accompany them. It is thus imperative that the system be securely anchored to the
ocean floor, so that the effects of severe weather and ocean conditions can be mitigated and not
affect the overall performance of the turbine.
There are currently a few mooring configurations being studied by different companies
and universities in Europe, US, and Japan, the two most widely known being the simple, zero-
tension 3- or 4-cable catenary system, and the ballasted cable system. The zero-tensioned
configuration consists of mooring lines attached to a particular location on the spar buoy tank,
the most common ones being the center of gravity and the bottom surface [8], and to the ocean
floor, by corrosion-protected cables. The second one, which is a variation of the single-layered
and tensioned mooring lines, called the ballasted mooring configuration, is shown in the figure
below [6].
Frye, Horvath, Ndegwa
24
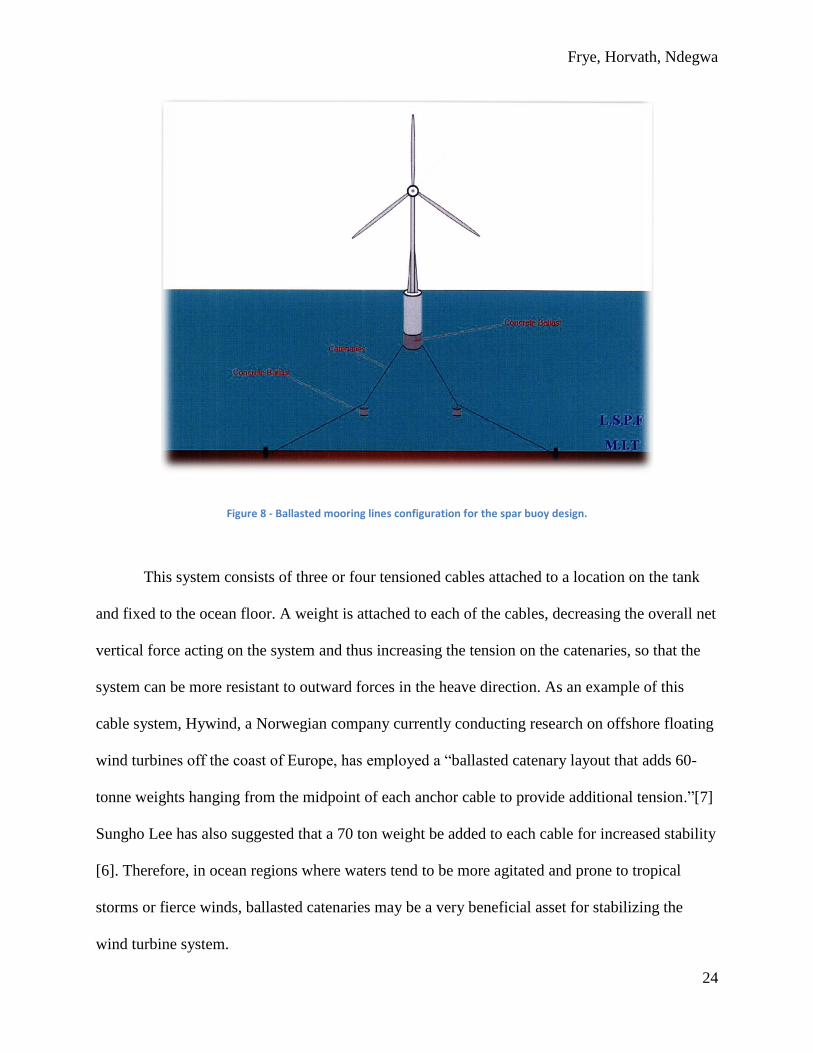
Figure 8 - Ballasted mooring lines configuration for the spar buoy design.
This system consists of three or four tensioned cables attached to a location on the tank
and fixed to the ocean floor. A weight is attached to each of the cables, decreasing the overall net
vertical force acting on the system and thus increasing the tension on the catenaries, so that the
system can be more resistant to outward forces in the heave direction. As an example of this
cable system, Hywind, a Norwegian company currently conducting research on offshore floating
wind turbines off the coast of Europe, has employed a “ballasted catenary layout that adds 60-
tonne weights hanging from the midpoint of each anchor cable to provide additional tension.”[7]
Sungho Lee has also suggested that a 70 ton weight be added to each cable for increased stability
[6]. Therefore, in ocean regions where waters tend to be more agitated and prone to tropical
storms or fierce winds, ballasted catenaries may be a very beneficial asset for stabilizing the
wind turbine system.
Frye, Horvath, Ndegwa
25
3. MQP Objectives This Major Qualifying Project had the following objectives:
Conduct a literature review on floating wind turbines, particularly the spar buoy design;
Design and build a 100:1 scale model of the spar buoy floating wind turbine;
Incorporate new wireless instrumentation to measure inclination and acceleration of both
the tower and the buoy, as well as measuring wave size and frequency. The electronics
for this project were developed by Eric Murphy, a WPI graduate student;
Test spar buoy model in wave flume at Alden Research Laboratory in Holden, MA;
o Tests were conducted in January 2011, and an assessment of the spar buoy’s
dynamical performance was made.
Implement mooring lines and anchoring plates, securing the model to the floor during
testing.
Attach load cells to the anchoring plates so that cable tension could be measured during
testing. Kazim Naqvi, a WPI graduate student, developed a method for attaching the load
cells and was responsible for this system;
Implement rotating turbine blades to tower and analyze how gyroscopic effects impact
the stability of the system;
o The rotating blades could further alter the stability of a floating wind turbine.
Implement an aerodynamic drag disc and model air flow (using fans) to model the thrust
force on the turbine rotor.
Frye, Horvath, Ndegwa
26
4. Design and Manufacture
4.1 Project Designs This section explains the important decisions and procedures involved in designing the
Spar Buoy floating wind turbine model, starting with the basic scaling of dimensions and mass
calculations. The team referred to Sungho Lee’s S.M. Thesis [6], who analytically modeled the
dynamics of the Spar Buoy turbine concept, incorporating his results and design parameters to
construct this team’s own model. This study used the NREL baseline wind turbine, with a rotor
diameter of 126 meters, a hub height of 90 meters and a total weight of 700 metric tons. The
turbine is rated to produce 5 MW. For the floating platform system, a spar buoy design was used,
with a draft of 60 meters and a diameter of 14 meters. Table 2 below shows the specific full-
scale and model dimensions of the spar-buoy wind turbine system. For this project, the group
used Froude scaling to scale down length measurements by 100:1, weights and forces by 106:1
and 1010
:1 for moments of inertia.
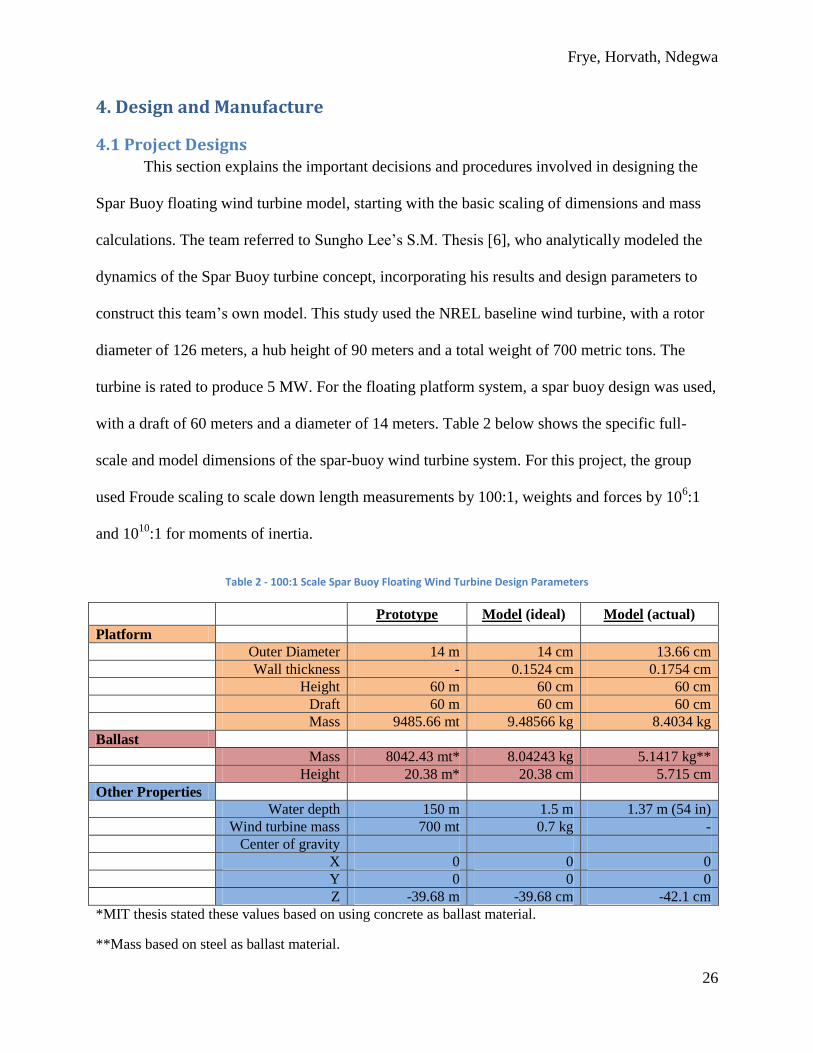
Table 2 - 100:1 Scale Spar Buoy Floating Wind Turbine Design Parameters
Prototype Model (ideal) Model (actual)
Platform
Outer Diameter 14 m 14 cm 13.66 cm
Wall thickness - 0.1524 cm 0.1754 cm
Height 60 m 60 cm 60 cm
Draft 60 m 60 cm 60 cm
Mass 9485.66 mt 9.48566 kg 8.4034 kg
Ballast
Mass 8042.43 mt* 8.04243 kg 5.1417 kg**
Height 20.38 m* 20.38 cm 5.715 cm
Other Properties
Water depth 150 m 1.5 m 1.37 m (54 in)
Wind turbine mass 700 mt 0.7 kg -
Center of gravity
X 0 0 0
Y 0 0 0
Z -39.68 m -39.68 cm -42.1 cm
*MIT thesis stated these values based on using concrete as ballast material.
**Mass based on steel as ballast material.
Frye, Horvath, Ndegwa
27
4.2 Scaling of Dimensions The purpose of this MQP is to construct and test a 100:1 scale model of a Floating Wind
Turbine, using the Spar Buoy conceptual platform design. In performing the scaling operations,
all length dimensions were scaled down by a factor of 100 and all weight values were scaled
down by a factor of 1,000,000, since mass is directly proportional to the length cubed.
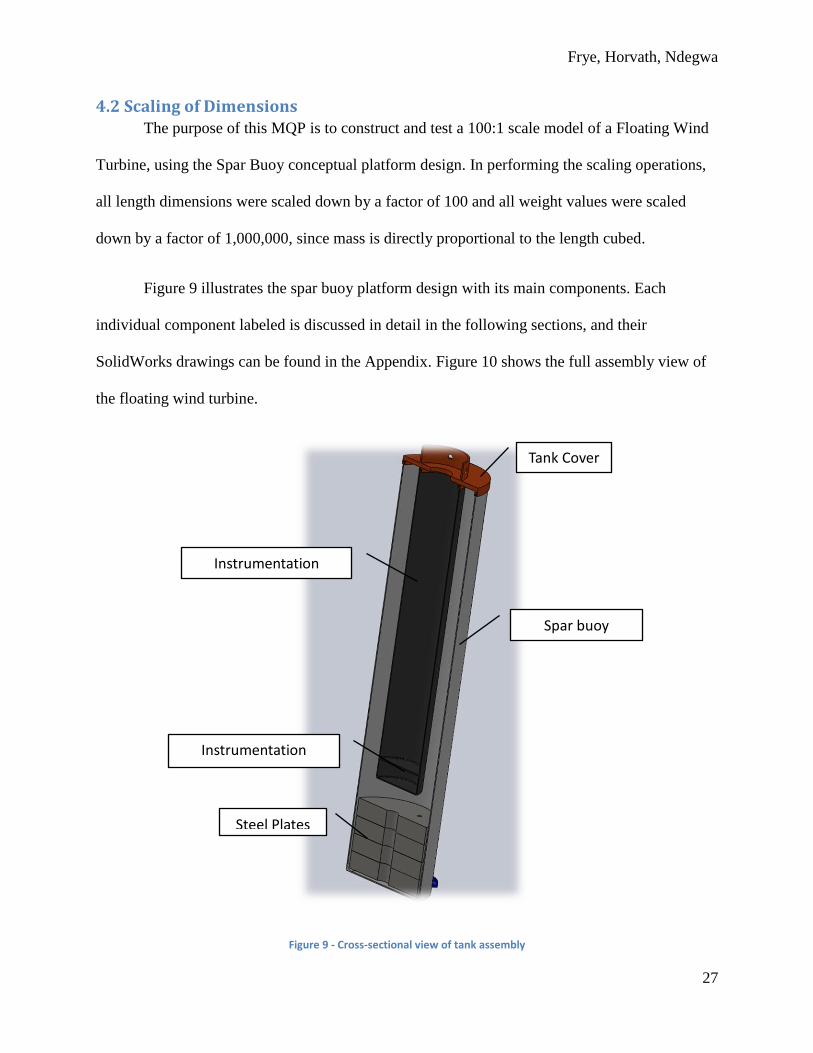
Figure 9 illustrates the spar buoy platform design with its main components. Each
individual component labeled is discussed in detail in the following sections, and their
SolidWorks drawings can be found in the Appendix. Figure 10 shows the full assembly view of
the floating wind turbine.
Figure 9 - Cross-sectional view of tank assembly
Tank Cover
Spar buoy platform
Instrumentation Cylinder
Instrumentation Platform
Steel Plates

Frye, Horvath, Ndegwa
28
Figure 10 - Spar Buoy Floating Wind Turbine full assembly
4.3 Mass Calculations This section explains all the calculations performed in the design procedures to determine
ballast support characteristics, tank dimensioning, and weight limitations.
The group initially envisioned that the most adequate ballast configuration would consist
of a layer of metal plates, which would sit at the bottom of the tank (and thus lower the center of
mass location of the spar buoy to a greater distance below the water level), followed by a layer of
sand above the plates. The amount of sand could be easily altered depending on the floating
characteristics of the system once it is actually placed in water, and making the stabilizing work
Nacelle
Tower
Tank Cover
Spar Buoy Platform
Cable Attachments
Frye, Horvath, Ndegwa
29
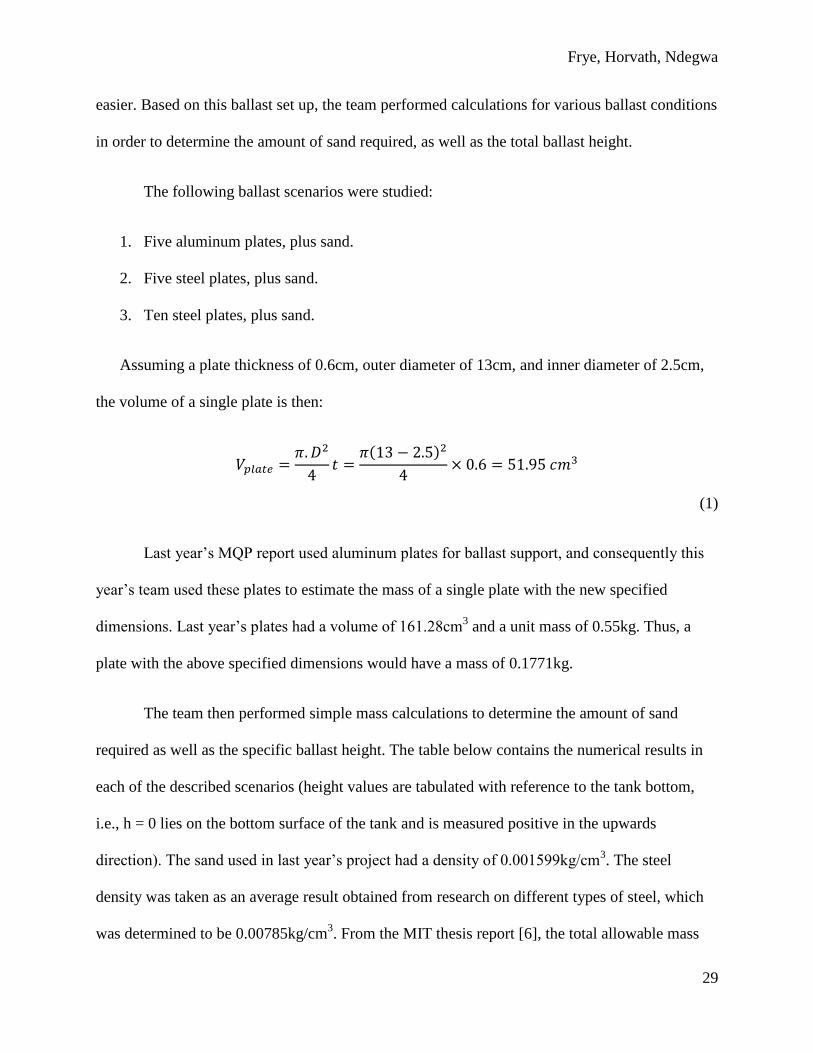
easier. Based on this ballast set up, the team performed calculations for various ballast conditions
in order to determine the amount of sand required, as well as the total ballast height.
The following ballast scenarios were studied:
1. Five aluminum plates, plus sand.
2. Five steel plates, plus sand.
3. Ten steel plates, plus sand.
Assuming a plate thickness of 0.6cm, outer diameter of 13cm, and inner diameter of 2.5cm,
the volume of a single plate is then:
( )
(1)
Last year’s MQP report used aluminum plates for ballast support, and consequently this
year’s team used these plates to estimate the mass of a single plate with the new specified
dimensions. Last year’s plates had a volume of 161.28cm3 and a unit mass of 0.55kg. Thus, a
plate with the above specified dimensions would have a mass of 0.1771kg.
The team then performed simple mass calculations to determine the amount of sand
required as well as the specific ballast height. The table below contains the numerical results in
each of the described scenarios (height values are tabulated with reference to the tank bottom,
i.e., h = 0 lies on the bottom surface of the tank and is measured positive in the upwards
direction). The sand used in last year’s project had a density of 0.001599kg/cm3. The steel
density was taken as an average result obtained from research on different types of steel, which
was determined to be 0.00785kg/cm3. From the MIT thesis report [6], the total allowable mass
Frye, Horvath, Ndegwa
30
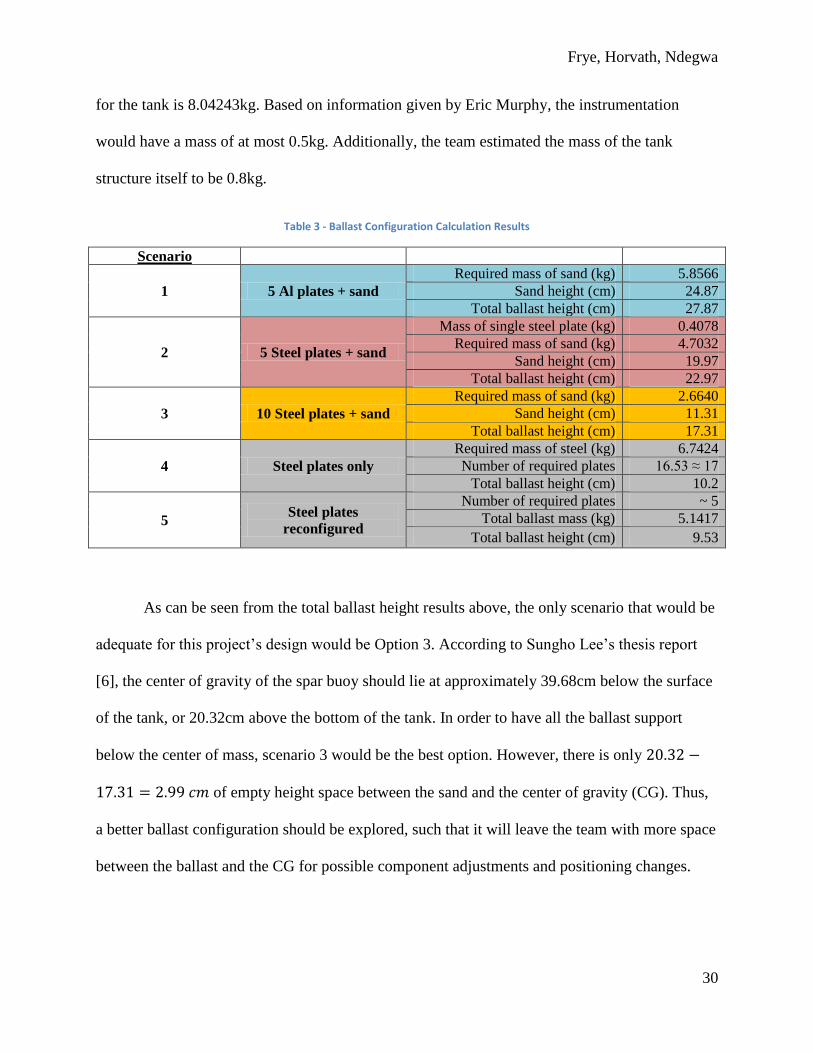
for the tank is 8.04243kg. Based on information given by Eric Murphy, the instrumentation
would have a mass of at most 0.5kg. Additionally, the team estimated the mass of the tank
structure itself to be 0.8kg.
Table 3 - Ballast Configuration Calculation Results
Scenario
1 5 Al plates + sand
Required mass of sand (kg) 5.8566
Sand height (cm) 24.87
Total ballast height (cm) 27.87
2 5 Steel plates + sand
Mass of single steel plate (kg) 0.4078
Required mass of sand (kg) 4.7032
Sand height (cm) 19.97
Total ballast height (cm) 22.97
3 10 Steel plates + sand
Required mass of sand (kg) 2.6640
Sand height (cm) 11.31
Total ballast height (cm) 17.31
4 Steel plates only
Required mass of steel (kg) 6.7424
Number of required plates 16.53 ≈ 17
Total ballast height (cm) 10.2
5 Steel plates
reconfigured
Number of required plates ~ 5
Total ballast mass (kg) 5.1417
Total ballast height (cm) 9.53
As can be seen from the total ballast height results above, the only scenario that would be
adequate for this project’s design would be Option 3. According to Sungho Lee’s thesis report
[6], the center of gravity of the spar buoy should lie at approximately 39.68cm below the surface
of the tank, or 20.32cm above the bottom of the tank. In order to have all the ballast support
below the center of mass, scenario 3 would be the best option. However, there is only
of empty height space between the sand and the center of gravity (CG). Thus,
a better ballast configuration should be explored, such that it will leave the team with more space
between the ballast and the CG for possible component adjustments and positioning changes.
Frye, Horvath, Ndegwa
31
The spar buoy tank will have an instrumentation cylinder located inside and concentric
with the symmetry axis of the tank, as shown previously in Figure 9. This cylinder will have a
built-in platform to house part of the instrumentation, which needs to be strategically positioned
at the system’s center of gravity. With this in mind, another ballast configuration was proposed.
It consisted on extending this instrumentation cylinder along the entire length of the tank
(roughly 60cm), and placing the metal plates and sand around it. The problem with this set-up
was that a large amount of space which was previously being used by sand and/or plates would
now remain empty, since the cylinder was hollow. Thus the calculated ballast height increased to
a value much greater than the designed draft height of 60cm. A suggestion to solve this issue was
to fill the hollow cylinder with sand to compensate for this loss of space, but this design seemed
impractical and the team decided to explore other possible scenarios.
Since steel (0.00785 kg/cm3) is roughly three times denser than aluminum (0.0027
kg/cm3), it was decided to use steel for the metal plates. The team then studied the possibility of
using only steel plates for ballasting. The results obtained have also been tabulated in Table 4
above as scenario 4.
As can be seen from Table 4, the ballast height is reduced to 10.2cm, which is
significantly lower than the results for the sand-and-plates configurations.
In an effort to reduce the number of plates the team would need to manufacture,
increasing the thickness of the plates from 0.6cm to 1.905cm (0.75 inches) was considered. This
would yield a total of roughly 5 steel plates, with a new total ballast height of 9.5cm. This
Frye, Horvath, Ndegwa
32
scenario is displayed as option 5 in Table 3 above. After careful consideration and re-
calculations, the team decided to pursue this particular configuration1.
4.4 Turbine Platform and System Components The Spar Buoy tank is comprised of four main structural components as displayed in
Figure 9: the outer tank casing (platform), the tank cover, the instrumentation cylinder, and the
steel ballast plates. This section explains the design procedures involved in manufacturing each
of these components, along with the mooring lines and their attachment to both the spar buoy
and the anchor plates.
4.4.1 Platform
To manufacture the parts required for assembling the tank (with the exception of the steel
plates), the team used WPI’s Rapid Prototyping Machine, which manufactured the parts from
ABS plastic. This machine had sizing limitations and could only manufacture parts that were less
than 10in (width) x 10in (length) x 12in (height). The tank height was about 60cm (23.62in), thus
the team designed two hollow cylindrical tubes, one with both ends open and the other with one
end closed, so that when assembled they would have the desired length of 60cm. They were
assembled using an inner ring which was about 0.01 inch smaller in diameter than the inner
diameter of the platform. This allowed for a secure and tight fit between both halves of the tank.
The figure below shows the above-described process.
1 As is explained in section 4.5, the team later decided it was safer to use only 4 steel plates when testing in the
water, so that the water line was slightly above the cover lid and the draft approximately 60 cm. The total ballast mass was thus 5.1417 kg, as is shown in Table 2.

Frye, Horvath, Ndegwa
33
Figure 11 - Assembly method for spar buoy tank
To ensure that the platform was fully waterproof, the team applied two layers of ABS
cement to the insides of the tank. This cement acts as a water sealant and contains a combination
of methyl ethyl ketone (MEK), acetone, and ABS solids, and is commonly used to coat ABS
plastic materials for waterproofing.
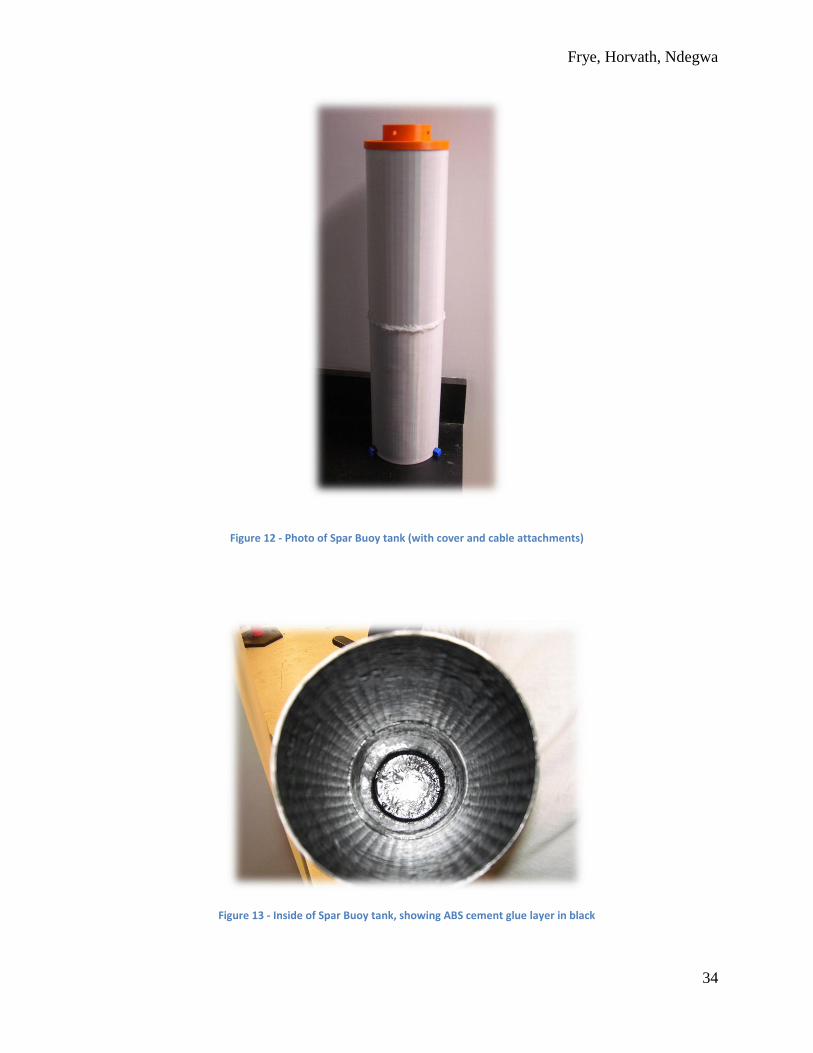
The figures below are pictures of the actual spar buoy tank. The second picture shows the
ABS cement coating on the inside of the tank (black layer).
Upper half
Lower half
Inner attachment ring
Frye, Horvath, Ndegwa
34
Figure 12 - Photo of Spar Buoy tank (with cover and cable attachments)
Figure 13 - Inside of Spar Buoy tank, showing ABS cement glue layer in black
Frye, Horvath, Ndegwa
35
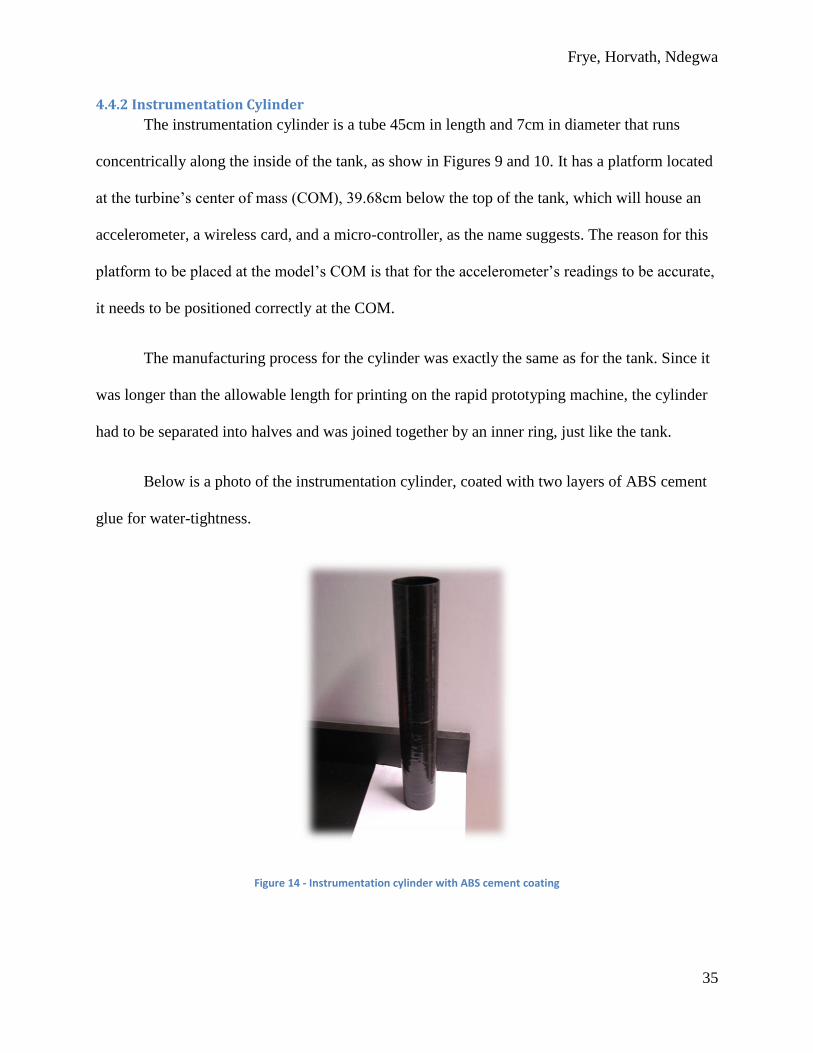
4.4.2 Instrumentation Cylinder
The instrumentation cylinder is a tube 45cm in length and 7cm in diameter that runs
concentrically along the inside of the tank, as show in Figures 9 and 10. It has a platform located
at the turbine’s center of mass (COM), 39.68cm below the top of the tank, which will house an
accelerometer, a wireless card, and a micro-controller, as the name suggests. The reason for this
platform to be placed at the model’s COM is that for the accelerometer’s readings to be accurate,
it needs to be positioned correctly at the COM.
The manufacturing process for the cylinder was exactly the same as for the tank. Since it
was longer than the allowable length for printing on the rapid prototyping machine, the cylinder
had to be separated into halves and was joined together by an inner ring, just like the tank.
Below is a photo of the instrumentation cylinder, coated with two layers of ABS cement
glue for water-tightness.
Figure 14 - Instrumentation cylinder with ABS cement coating
Frye, Horvath, Ndegwa
36
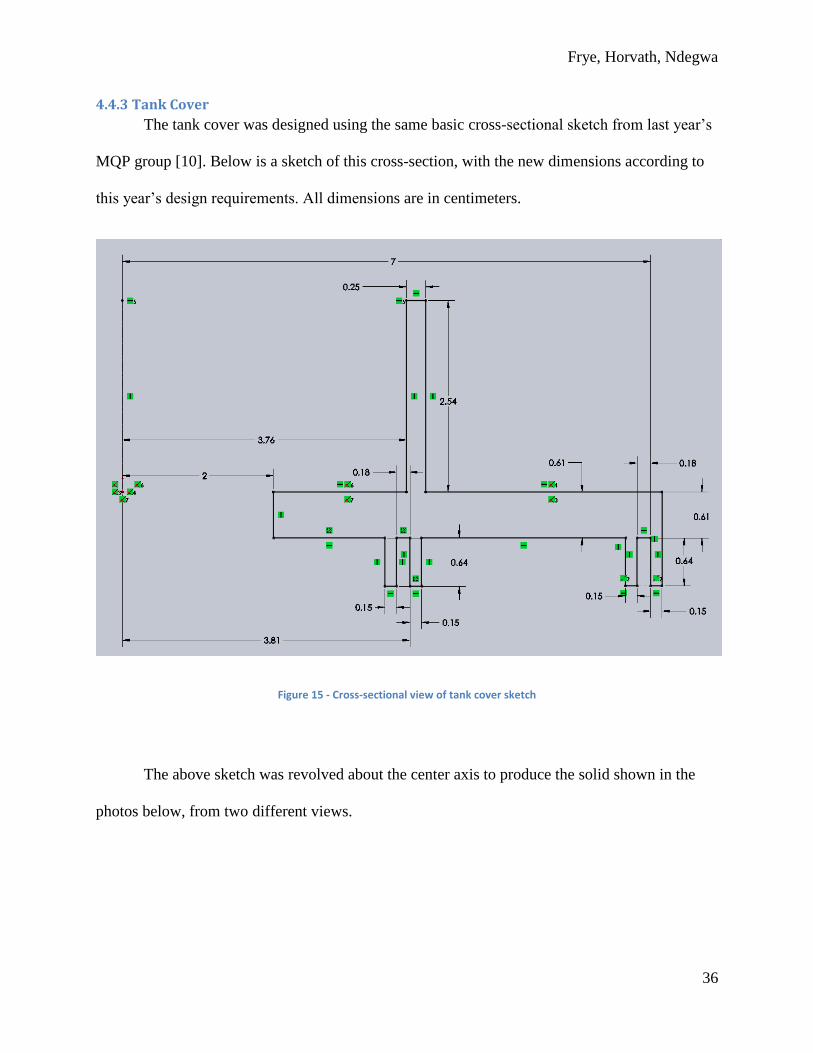
4.4.3 Tank Cover
The tank cover was designed using the same basic cross-sectional sketch from last year’s
MQP group [10]. Below is a sketch of this cross-section, with the new dimensions according to
this year’s design requirements. All dimensions are in centimeters.
Figure 15 - Cross-sectional view of tank cover sketch
The above sketch was revolved about the center axis to produce the solid shown in the
photos below, from two different views.
Frye, Horvath, Ndegwa
37
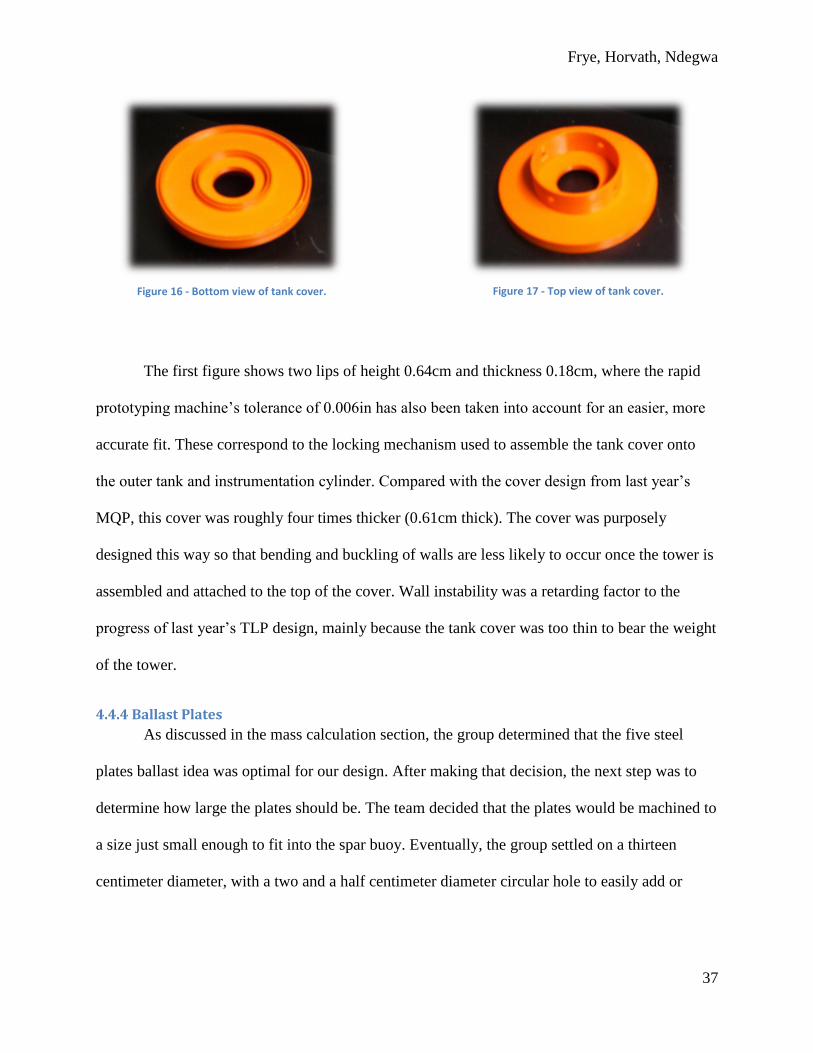
The first figure shows two lips of height 0.64cm and thickness 0.18cm, where the rapid
prototyping machine’s tolerance of 0.006in has also been taken into account for an easier, more
accurate fit. These correspond to the locking mechanism used to assemble the tank cover onto
the outer tank and instrumentation cylinder. Compared with the cover design from last year’s
MQP, this cover was roughly four times thicker (0.61cm thick). The cover was purposely
designed this way so that bending and buckling of walls are less likely to occur once the tower is
assembled and attached to the top of the cover. Wall instability was a retarding factor to the
progress of last year’s TLP design, mainly because the tank cover was too thin to bear the weight
of the tower.
4.4.4 Ballast Plates
As discussed in the mass calculation section, the group determined that the five steel
plates ballast idea was optimal for our design. After making that decision, the next step was to
determine how large the plates should be. The team decided that the plates would be machined to
a size just small enough to fit into the spar buoy. Eventually, the group settled on a thirteen
centimeter diameter, with a two and a half centimeter diameter circular hole to easily add or
Figure 16 - Bottom view of tank cover. Figure 17 - Top view of tank cover.
Frye, Horvath, Ndegwa
38
remove plates from the spar buoy. Later, the group added two small quarter inch diameter holes
to bolt the plates down during machining so that they could not move.
Then the group moved on to the actual machining of the steel plates. This process took a
long time because of the density of steel and the level of difficulty to machine. The team used the
plate design obtained in SolidWorks and imported it into ESPRIT, subsequently adding all the
cutting operations for manufacturing the circular disk with its holes. After this preliminary set-up
had been completed, the team began work on machining the plates using the CNC machines
located in Higgins Labs. There were a few minor issues while machining, including occasional
changing of the tools, mostly due to overheating. After two full days of machining, the parts
were completed and nearly ready to be used as ballast inside the spar buoy tank. All that was left
was to coat these plates with a rust-protective paint, so that in case water leaked into the tank
during testing, the plates would not rust as easily.
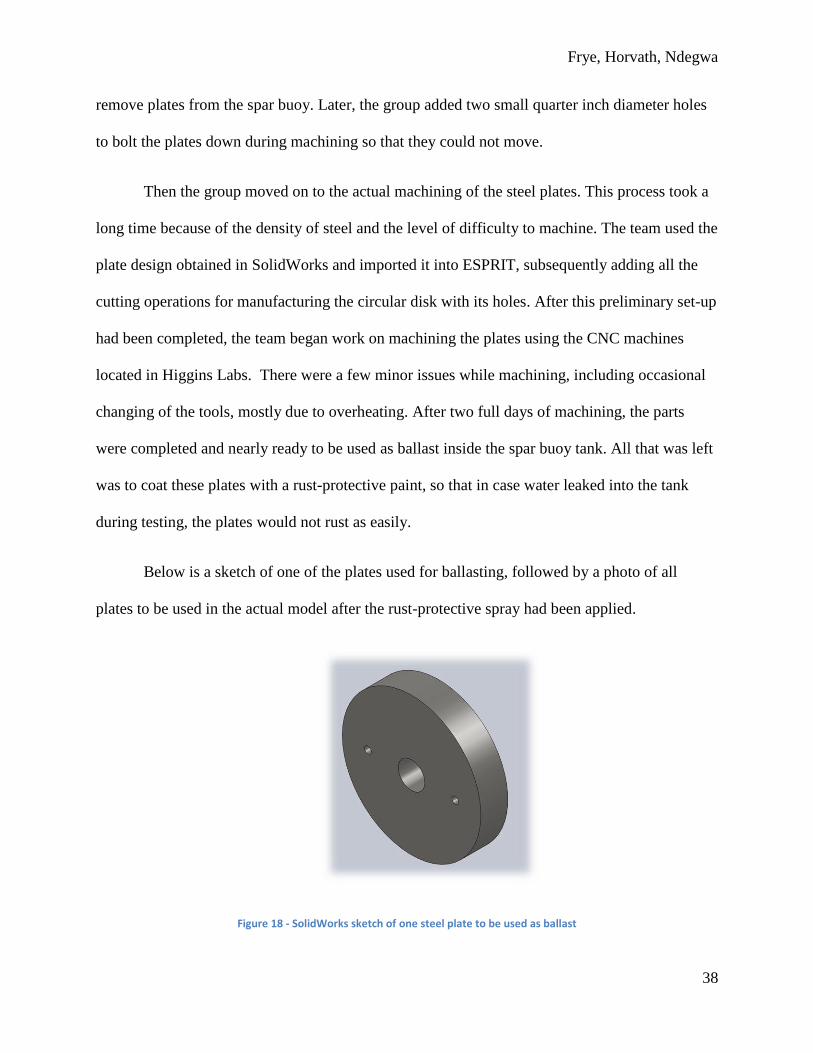
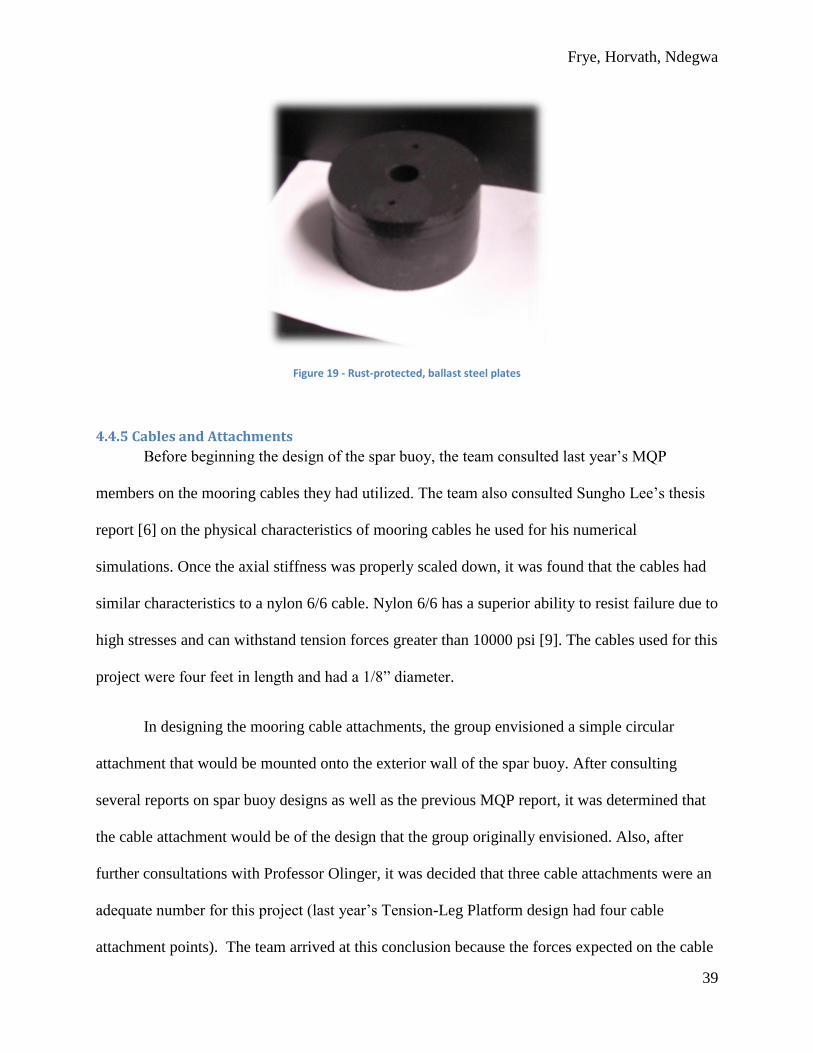
Below is a sketch of one of the plates used for ballasting, followed by a photo of all
plates to be used in the actual model after the rust-protective spray had been applied.
Figure 18 - SolidWorks sketch of one steel plate to be used as ballast
Frye, Horvath, Ndegwa
39
Figure 19 - Rust-protected, ballast steel plates
4.4.5 Cables and Attachments
Before beginning the design of the spar buoy, the team consulted last year’s MQP
members on the mooring cables they had utilized. The team also consulted Sungho Lee’s thesis
report [6] on the physical characteristics of mooring cables he used for his numerical
simulations. Once the axial stiffness was properly scaled down, it was found that the cables had
similar characteristics to a nylon 6/6 cable. Nylon 6/6 has a superior ability to resist failure due to
high stresses and can withstand tension forces greater than 10000 psi [9]. The cables used for this
project were four feet in length and had a 1/8” diameter.
In designing the mooring cable attachments, the group envisioned a simple circular
attachment that would be mounted onto the exterior wall of the spar buoy. After consulting
several reports on spar buoy designs as well as the previous MQP report, it was determined that
the cable attachment would be of the design that the group originally envisioned. Also, after
further consultations with Professor Olinger, it was decided that three cable attachments were an
adequate number for this project (last year’s Tension-Leg Platform design had four cable
attachment points). The team arrived at this conclusion because the forces expected on the cable

Frye, Horvath, Ndegwa
40
attachments did not warrant the addition of an excessive amount of cable attachments. It was also
decided that the cable attachments would be designed using Solid Works and built in the Rapid
Prototyping machine (RPM) using ABS plastic. Furthermore, the group concluded that the cable
attachments were to be placed at the base of the spar buoy.
Some of the features of the cable attachment include a circular loop through which the
mooring cable was attached to. The size of this loop was dictated by the thickness of the mooring
cable selected for this design. Since the cables used were relatively thin, the team settled on a
loop that was approximately ¼ of an inch in diameter. Another feature was the circular curvature
of the attachment point with the spar buoy. The radius of this curve was 14 cm, which was the
radius of the outer cylinder of the spar buoy. This allowed the cable attachment to fit in neatly
and more securely to the outer cylinder.
Below is a sketch of the cable attachment, with the attachment hole in view.
Figure 20 - SolidWorks sketch of mooring cable attachment
Once the cable attachments were designed, the Solid Works sketches were submitted for
printing in the RPM. Once completed, the group attached the cable attachments on the spar buoy Face to be attached to
the spar buoy

Frye, Horvath, Ndegwa
41
using ABS cement. Beforehand, the team had measured and marked three equidistant points
around the bottom of the base. These marks specified the points on which the cable attachments
were to be positioned
Below is a photo of the spar buoy tank with a cable attachment in view.
Figure 21 - Zoomed view of mooring cable attachment
However, this design proved to have a few drawbacks. The loop which was designed to
hold and secure the cable did not perform as well as the team anticipated. Therefore, the team
redesigned the cable fasteners with a new fastening screw hole as well as a mooring cable hole
running vertically through the aft section of each of the cable fasteners. A summary of the team’s
redesign is described in the following section.
4.4.6 Modified Cable Attachments
A modified cable attachment design was also developed to improve the method of
securing the tether lines to the platform. These new attachments, shown below, should make for
an easier method of attachment to the spar buoy, as well as easier to adjust once the spar buoy is
in the water.
Frye, Horvath, Ndegwa
42
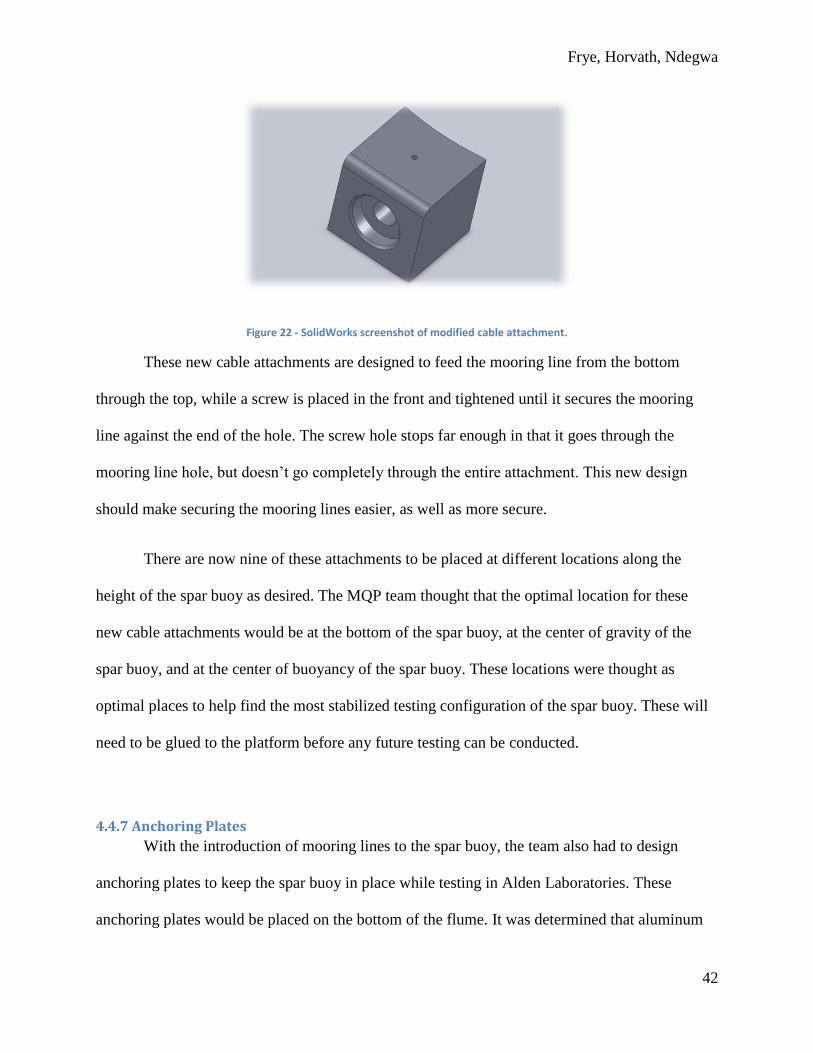
Figure 22 - SolidWorks screenshot of modified cable attachment.
These new cable attachments are designed to feed the mooring line from the bottom
through the top, while a screw is placed in the front and tightened until it secures the mooring
line against the end of the hole. The screw hole stops far enough in that it goes through the
mooring line hole, but doesn’t go completely through the entire attachment. This new design
should make securing the mooring lines easier, as well as more secure.
There are now nine of these attachments to be placed at different locations along the
height of the spar buoy as desired. The MQP team thought that the optimal location for these
new cable attachments would be at the bottom of the spar buoy, at the center of gravity of the
spar buoy, and at the center of buoyancy of the spar buoy. These locations were thought as
optimal places to help find the most stabilized testing configuration of the spar buoy. These will
need to be glued to the platform before any future testing can be conducted.
4.4.7 Anchoring Plates
With the introduction of mooring lines to the spar buoy, the team also had to design
anchoring plates to keep the spar buoy in place while testing in Alden Laboratories. These
anchoring plates would be placed on the bottom of the flume. It was determined that aluminum
Frye, Horvath, Ndegwa
43
was the most adequate option for manufacturing the plates and that met the needs of this project,
both because of its price and ease of machining, along with the fact that it is corrosion-resistant.
The next step in this process was to size the plates. The team’s first decision was that
because of the location where the mooring lines should be anchored, our group needed to use
three separate plates, one for each mooring line. Then, the alignment of the buoy was finalized in
an attempt to minimize the amount of force on any given line. The group decided that the easiest
way to do this was to place one line directly downstream and the other two one hundred twenty
degrees in either direction. This way the plates would be evenly spaced, and the spar buoy would
only have a significant force downstream, so the main force will be evenly distributed among
two plates. Finally, the group had to estimate the maximum force exerted on any plate, which the
team estimated might approach the weight of the spar buoy if the force were only applied to one
mooring line. After this conclusion, the team ordered three one inch thick, one foot by one foot
plates, one for each of the mooring lines.
The next step was to machine the plates as needed with the help of graduate student
Kazim Naqvi. Kazim also helped with ensuring that the method the team used for attaching the
load cells and cables, and for lowering the anchoring plates onto the flume floor were the same
as the ones for the TLP. An eyehook system was used for lowering the plates to the bottom of
Alden Labs water flume, and adjusting the plates to achieve the correct tension in each mooring
line.
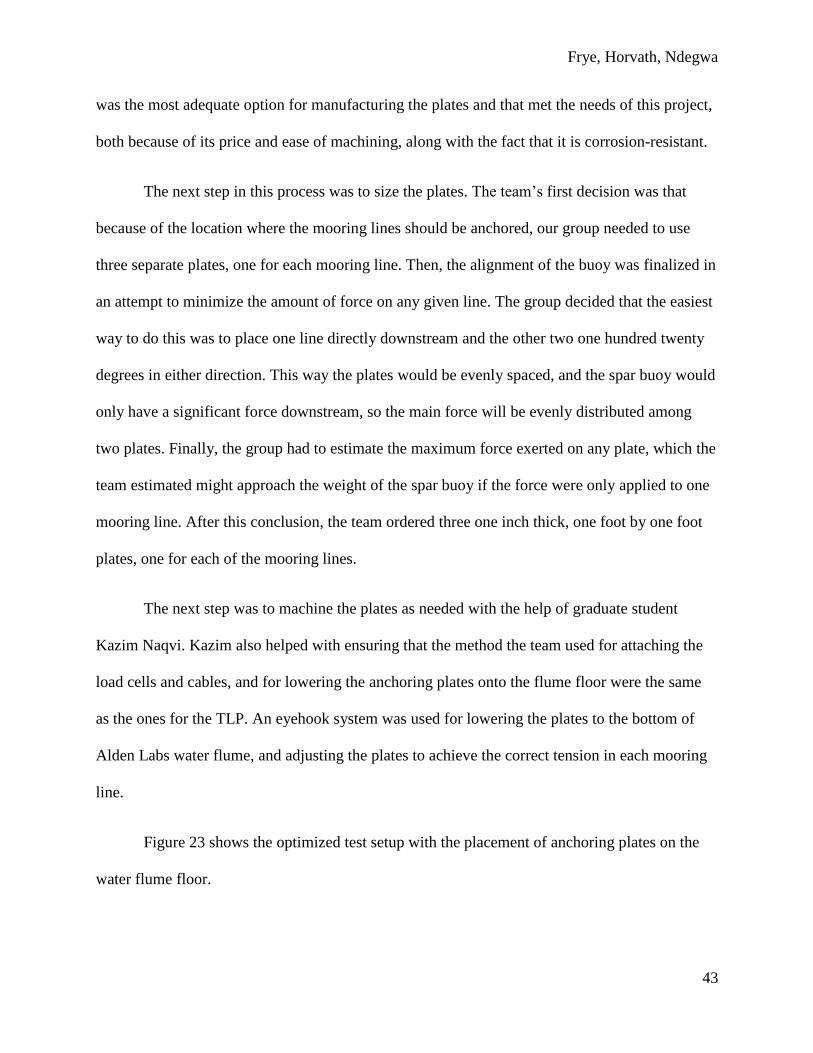
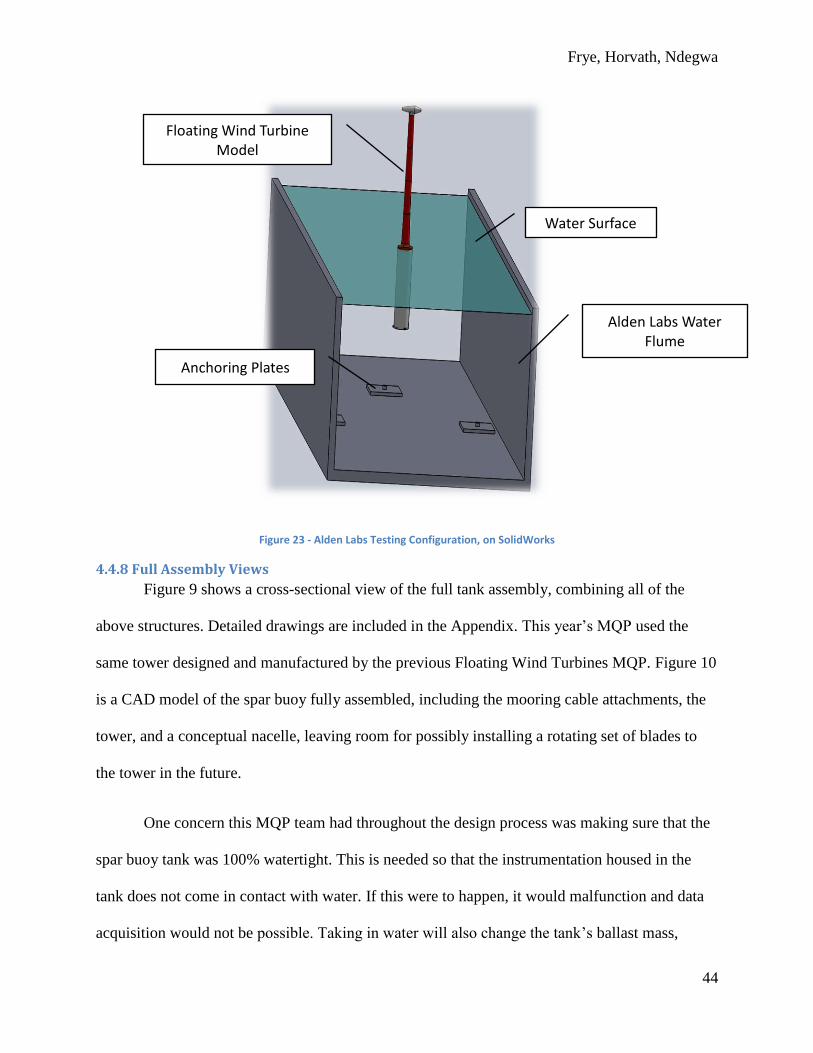
Figure 23 shows the optimized test setup with the placement of anchoring plates on the
water flume floor.
Frye, Horvath, Ndegwa
44
Figure 23 - Alden Labs Testing Configuration, on SolidWorks
4.4.8 Full Assembly Views
Figure 9 shows a cross-sectional view of the full tank assembly, combining all of the
above structures. Detailed drawings are included in the Appendix. This year’s MQP used the
same tower designed and manufactured by the previous Floating Wind Turbines MQP. Figure 10
is a CAD model of the spar buoy fully assembled, including the mooring cable attachments, the
tower, and a conceptual nacelle, leaving room for possibly installing a rotating set of blades to
the tower in the future.
One concern this MQP team had throughout the design process was making sure that the
spar buoy tank was 100% watertight. This is needed so that the instrumentation housed in the
tank does not come in contact with water. If this were to happen, it would malfunction and data
acquisition would not be possible. Taking in water will also change the tank’s ballast mass,
Alden Labs Water Flume
Water Surface
Floating Wind Turbine Model
Anchoring Plates
Frye, Horvath, Ndegwa
45
making it heavier, prone to sinking, and altering its stability. To ensure water-tightness, the team
coated the inner surface of the outer tank and outer surface of the instrumentation cylinder with
the ABS cement glue previously described. The group then placed the full assembly in the WPI
water tank and left it there for a full day to make sure no leaks were present. This was a
successful test and no water was let in.
However, the team did run into some water-tightness issues as the tank was accidentally
dropped on the ground while being assembled to the tower. This fractured the outer layer of the
tank casing at different locations around the cable attachment points. After another leakage test,
it was determined that the tank was no longer watertight. Once again, the team sealed the leaks
with ABS cement glue to reinforce any fractures. After this, a last leakage test was conducted
and thankfully the tank was watertight once again.
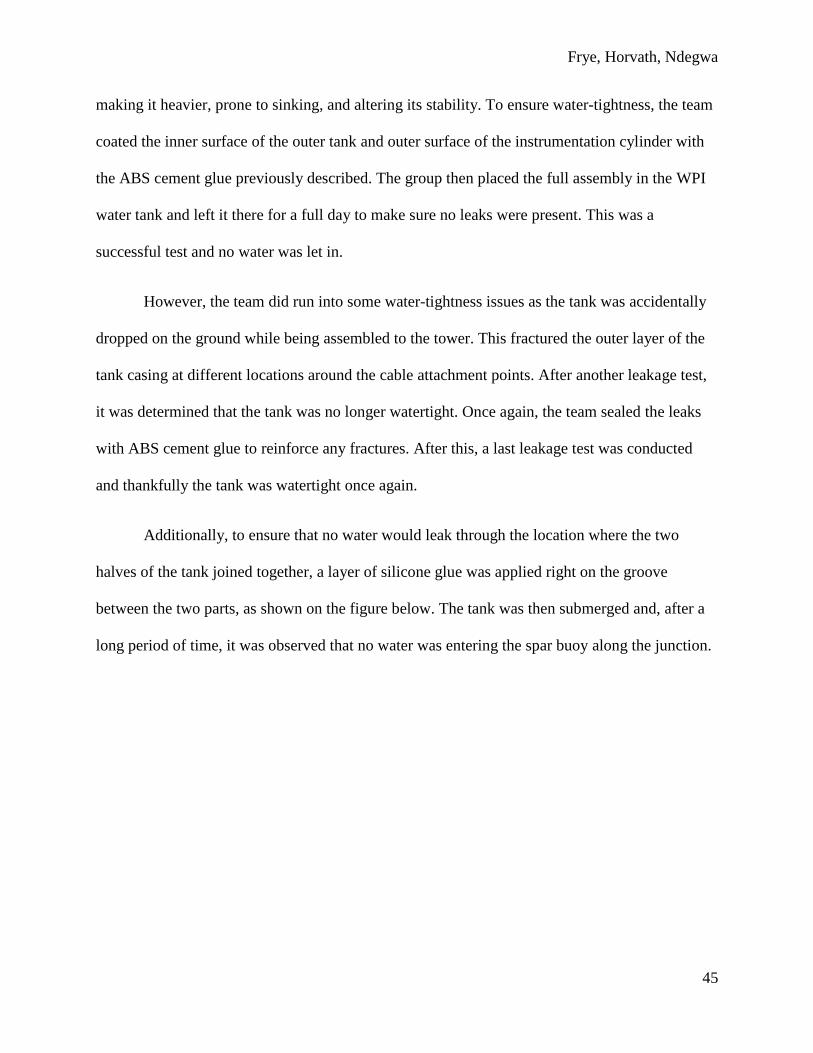
Additionally, to ensure that no water would leak through the location where the two
halves of the tank joined together, a layer of silicone glue was applied right on the groove
between the two parts, as shown on the figure below. The tank was then submerged and, after a
long period of time, it was observed that no water was entering the spar buoy along the junction.
Frye, Horvath, Ndegwa
46
Figure 24 - Zoomed view on location where silicone was applied for water-tightness
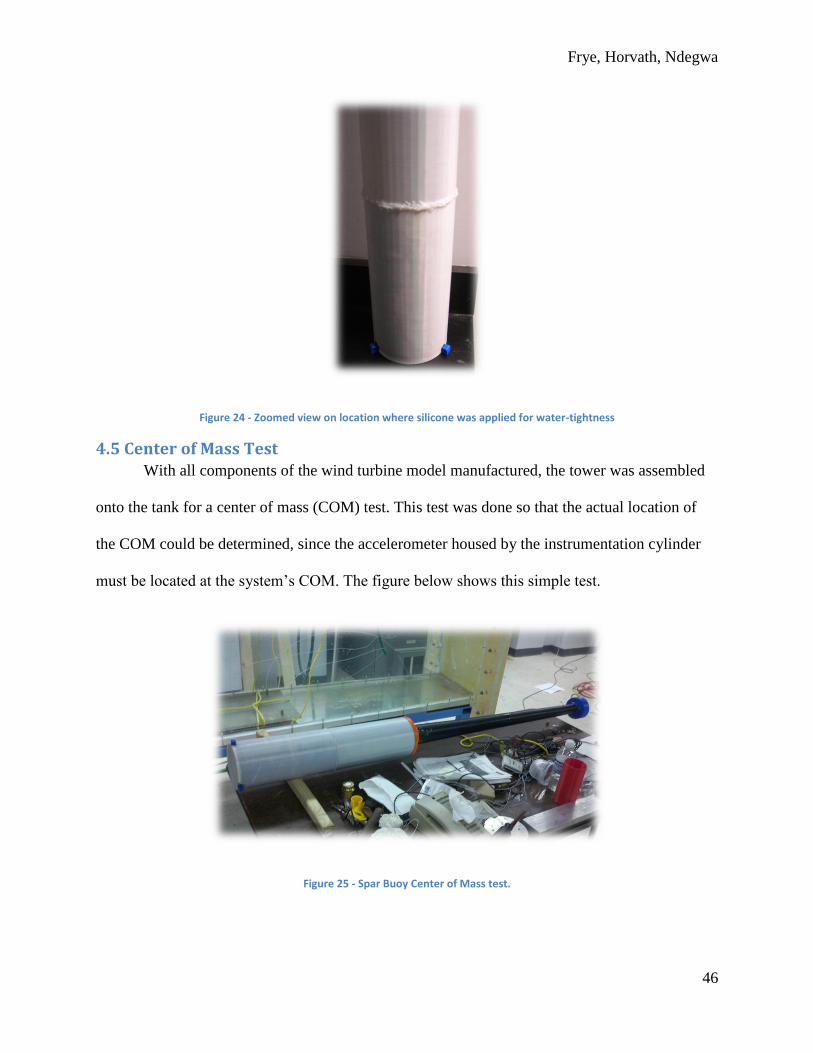
4.5 Center of Mass Test With all components of the wind turbine model manufactured, the tower was assembled
onto the tank for a center of mass (COM) test. This test was done so that the actual location of
the COM could be determined, since the accelerometer housed by the instrumentation cylinder
must be located at the system’s COM. The figure below shows this simple test.
Figure 25 - Spar Buoy Center of Mass test.
Frye, Horvath, Ndegwa
47
As can be seen from above, the assembly was placed horizontally on a table and laid to
rest on a wooden bar, which was adjusted along the length of the tank until it was able to balance
the entire assembly. This location was then measured and it was determined that the COM of the
assembly was located at 17.9cm from the bottom of the tank, or 42.1cm from the top of the
cover. Sungho Lee’s estimate for the COM was at 39.68cm from the cover top [6], which means
this MQP’s design was very close in comparison to his calculated value, differing by
approximately 6%.
4.6 Flotation Test The team then conducted a simple flotation test to determine the inherent stability of the
wind turbine system. This was done to ensure that the assembly was balanced and could float
vertically upwards on its own. It was also conducted so that the team could determine the
number of plates required to keep the water level of the tank approximately at the tank cover,
corresponding to the desired draft height of 60 cm (see Table 2 on page 20), and whether or not
this number matched the predicted value of five steel plates. The figure below shows this test.
Frye, Horvath, Ndegwa
48
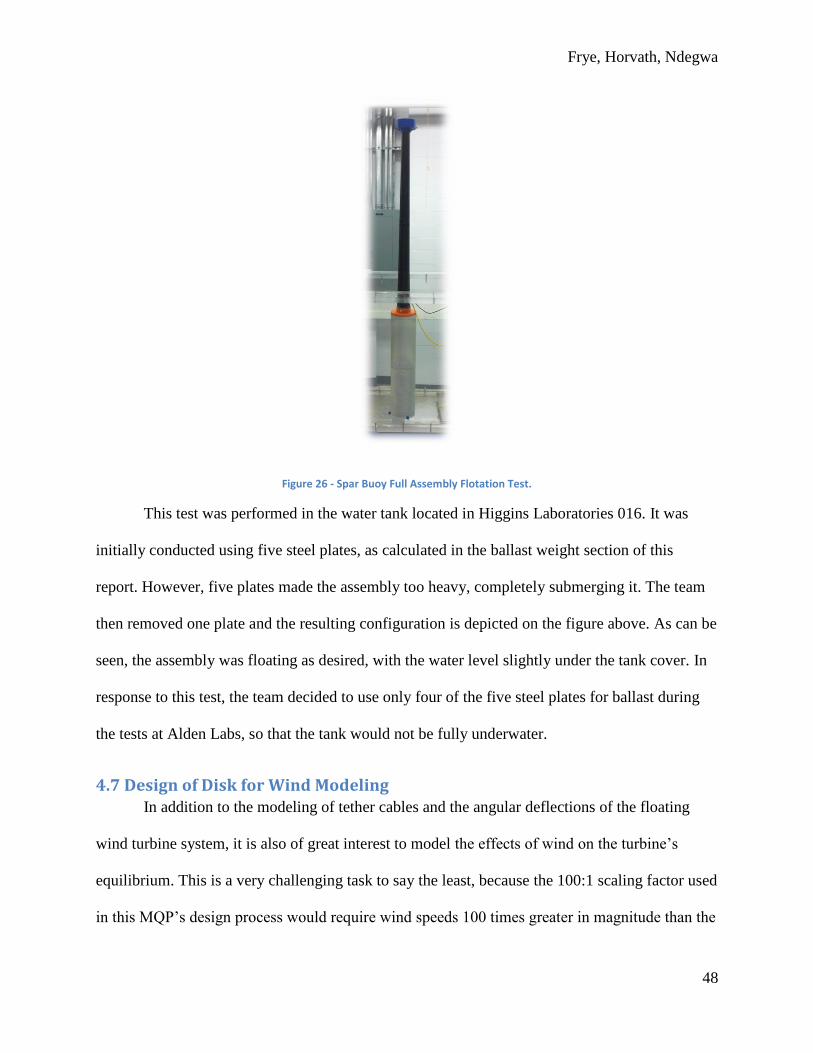
Figure 26 - Spar Buoy Full Assembly Flotation Test.
This test was performed in the water tank located in Higgins Laboratories 016. It was
initially conducted using five steel plates, as calculated in the ballast weight section of this
report. However, five plates made the assembly too heavy, completely submerging it. The team
then removed one plate and the resulting configuration is depicted on the figure above. As can be
seen, the assembly was floating as desired, with the water level slightly under the tank cover. In
response to this test, the team decided to use only four of the five steel plates for ballast during
the tests at Alden Labs, so that the tank would not be fully underwater.
4.7 Design of Disk for Wind Modeling In addition to the modeling of tether cables and the angular deflections of the floating
wind turbine system, it is also of great interest to model the effects of wind on the turbine’s
equilibrium. This is a very challenging task to say the least, because the 100:1 scaling factor used
in this MQP’s design process would require wind speeds 100 times greater in magnitude than the
Frye, Horvath, Ndegwa
49
ones experienced in real life. Placing this concept into perspective, 10 mile-per-hour winds the
prototype could potentially experience in open sea waters would equate to 1000 mile-per-hour
winds for the scaled model! This is simply impossible.
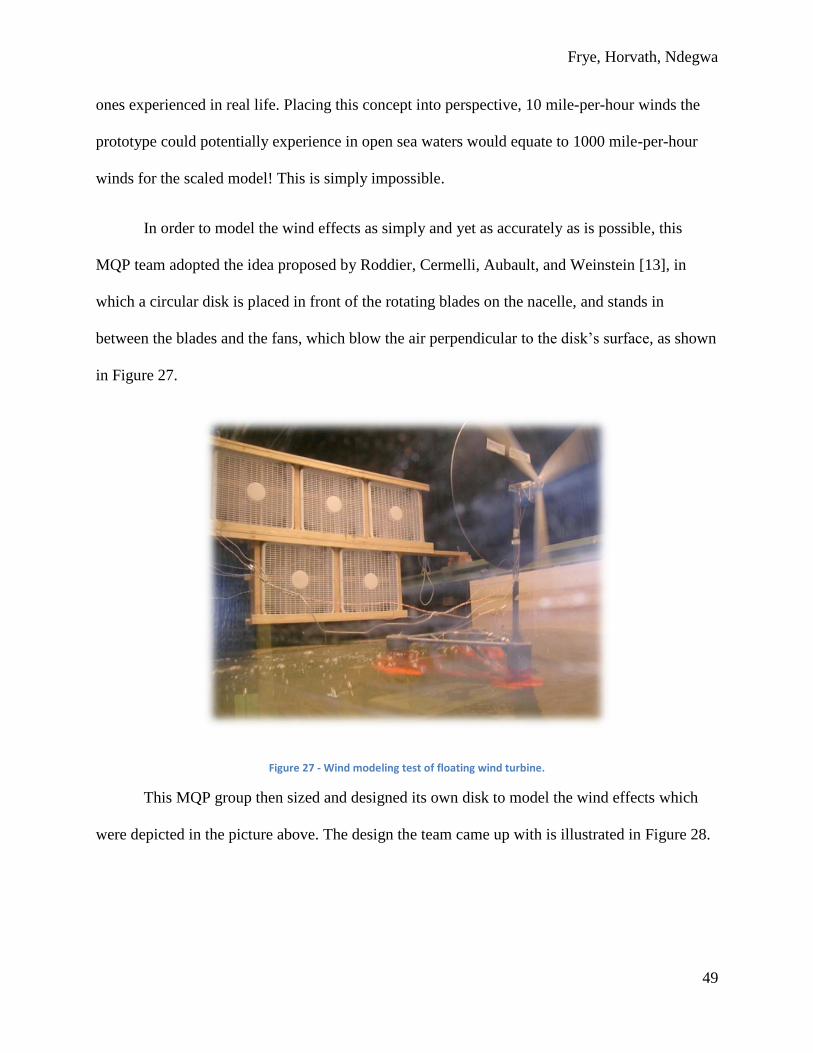
In order to model the wind effects as simply and yet as accurately as is possible, this
MQP team adopted the idea proposed by Roddier, Cermelli, Aubault, and Weinstein [13], in
which a circular disk is placed in front of the rotating blades on the nacelle, and stands in
between the blades and the fans, which blow the air perpendicular to the disk’s surface, as shown
in Figure 27.
Figure 27 - Wind modeling test of floating wind turbine.
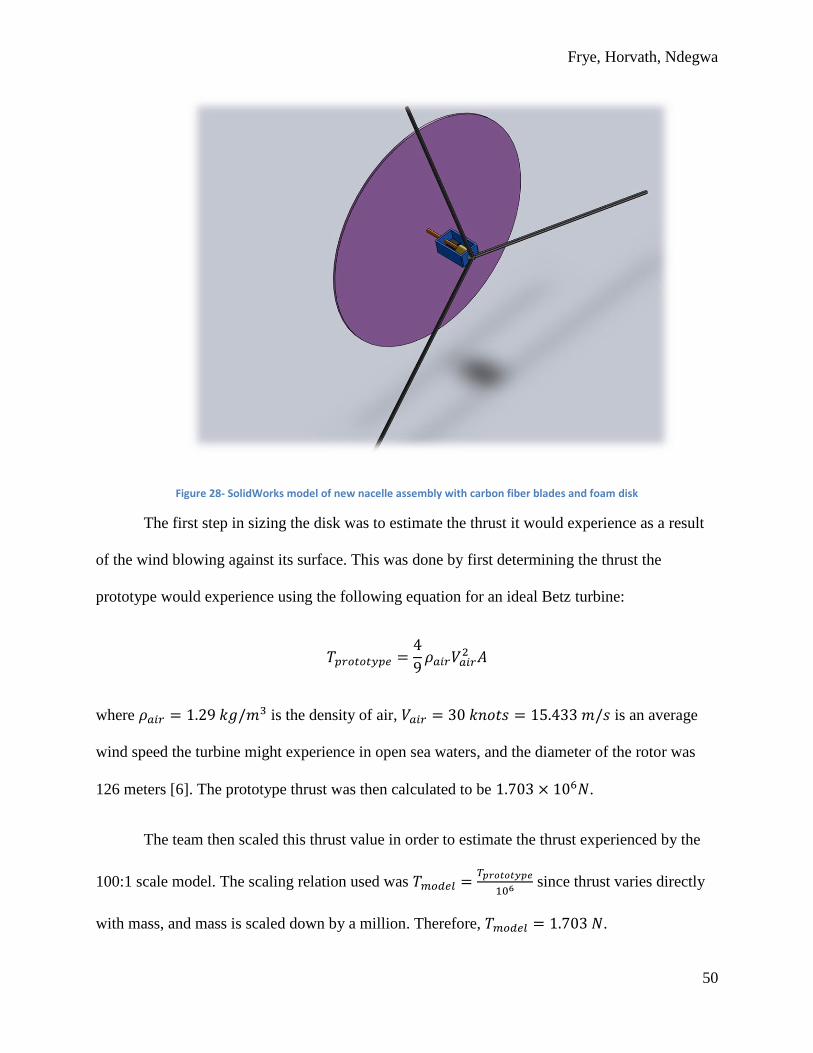
This MQP group then sized and designed its own disk to model the wind effects which
were depicted in the picture above. The design the team came up with is illustrated in Figure 28.
Frye, Horvath, Ndegwa
50
Figure 28- SolidWorks model of new nacelle assembly with carbon fiber blades and foam disk
The first step in sizing the disk was to estimate the thrust it would experience as a result
of the wind blowing against its surface. This was done by first determining the thrust the
prototype would experience using the following equation for an ideal Betz turbine:
where is the density of air, is an average
wind speed the turbine might experience in open sea waters, and the diameter of the rotor was
126 meters [6]. The prototype thrust was then calculated to be .
The team then scaled this thrust value in order to estimate the thrust experienced by the
100:1 scale model. The scaling relation used was
since thrust varies directly
with mass, and mass is scaled down by a million. Therefore, .
Frye, Horvath, Ndegwa
51
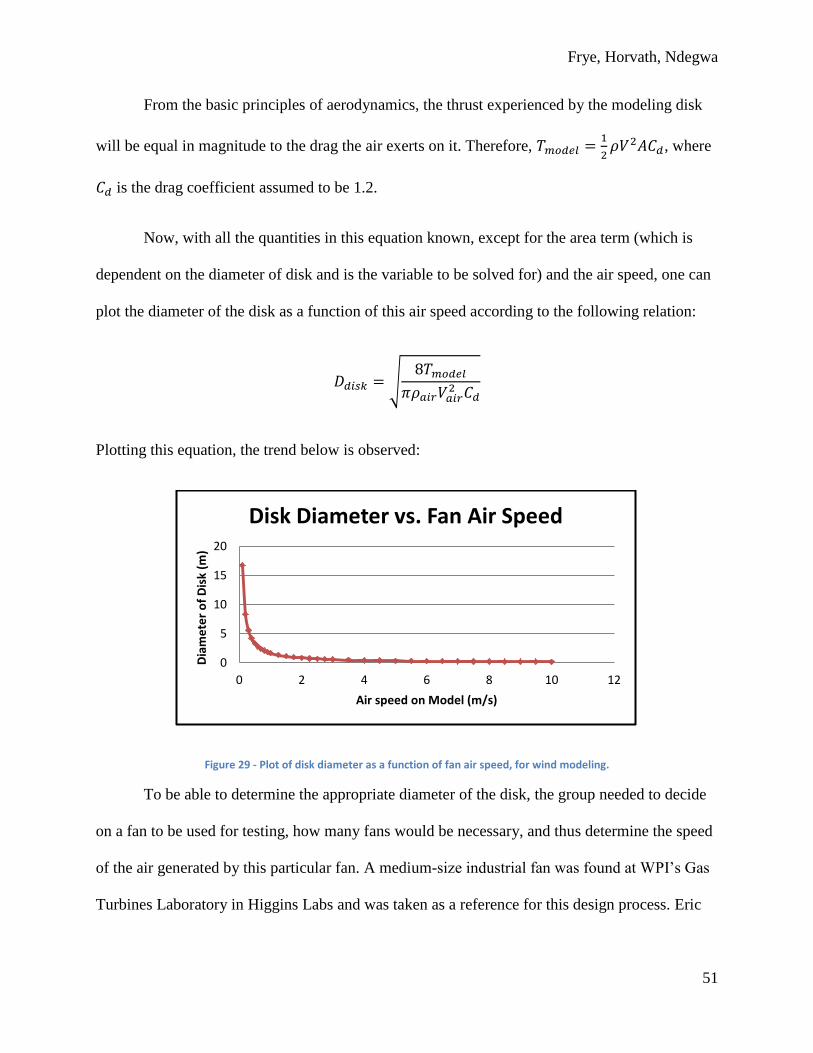
From the basic principles of aerodynamics, the thrust experienced by the modeling disk
will be equal in magnitude to the drag the air exerts on it. Therefore,
, where
is the drag coefficient assumed to be 1.2.
Now, with all the quantities in this equation known, except for the area term (which is
dependent on the diameter of disk and is the variable to be solved for) and the air speed, one can
plot the diameter of the disk as a function of this air speed according to the following relation:
√
Plotting this equation, the trend below is observed:
Figure 29 - Plot of disk diameter as a function of fan air speed, for wind modeling.
To be able to determine the appropriate diameter of the disk, the group needed to decide
on a fan to be used for testing, how many fans would be necessary, and thus determine the speed
of the air generated by this particular fan. A medium-size industrial fan was found at WPI’s Gas
Turbines Laboratory in Higgins Labs and was taken as a reference for this design process. Eric
0
5
10
15
20
0 2 4 6 8 10 12
Dia
me
ter
of
Dis
k (m
)
Air speed on Model (m/s)
Disk Diameter vs. Fan Air Speed

Frye, Horvath, Ndegwa
52
Murphy, a WPI graduate student, measured the air speed produced by this fan, and his results are
displayed in the table and graph below.
Table 4 - Air speed measurements performed on industrial fan to be used for wind modeling.
Distance from fan
(cm)
High (mph) Low (mph)
25 9.3 7.4
50 8.1 5
75 5.5 3.5
100 5.2 3.5
125 5.2 3.5
150 5.2 3.5
Figure 30 - Plot of air speed as a function of distance from industrial fan.
The highlighted row in the table corresponds to the selected distance from the fan at
which the disk will be located. The “high” setting will be used, yielding a speed of
. Thus, from the equation for Ddisk, it can be determined that .
One of the design constraints that needed to be taken into consideration is that the disk
had to be as light as possible so that the total nacelle mass could stay as close to the desired 240
0
2
4
6
8
10
0 50 100 150 200
Air
sp
ee
d (
mp
h)
Distance from fan (cm)
Industrial Fan Speeds
High
Low
Frye, Horvath, Ndegwa
53
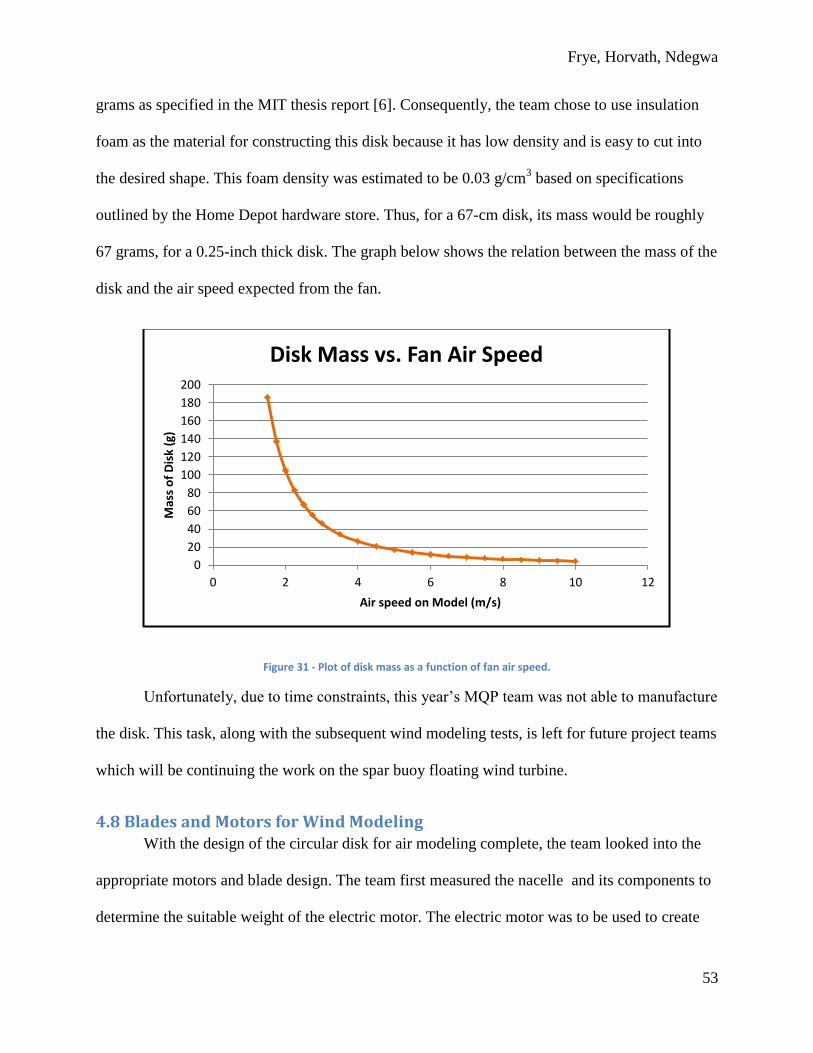
grams as specified in the MIT thesis report [6]. Consequently, the team chose to use insulation
foam as the material for constructing this disk because it has low density and is easy to cut into
the desired shape. This foam density was estimated to be 0.03 g/cm3 based on specifications
outlined by the Home Depot hardware store. Thus, for a 67-cm disk, its mass would be roughly
67 grams, for a 0.25-inch thick disk. The graph below shows the relation between the mass of the
disk and the air speed expected from the fan.
Figure 31 - Plot of disk mass as a function of fan air speed.
Unfortunately, due to time constraints, this year’s MQP team was not able to manufacture
the disk. This task, along with the subsequent wind modeling tests, is left for future project teams
which will be continuing the work on the spar buoy floating wind turbine.
4.8 Blades and Motors for Wind Modeling With the design of the circular disk for air modeling complete, the team looked into the
appropriate motors and blade design. The team first measured the nacelle and its components to
determine the suitable weight of the electric motor. The electric motor was to be used to create
0
20
40
60
80
100
120
140
160
180
200
0 2 4 6 8 10 12
Mas
s o
f D
isk
(g)
Air speed on Model (m/s)
Disk Mass vs. Fan Air Speed
Frye, Horvath, Ndegwa
54
the gyroscopic effects produced by turning turbine blades. According to the NREL baseline
5MW wind turbine weights, the nacelle weight was set at 240,000 kg [15]. When scaled down
using our 106:1 weight scale, the new scaled down weight came to 240 g. After measuring the
weight of the nacelle components, accelerometer, inclinometer, and wiring at the nacelle, it was
discovered that the maximum weight allowable for the motor was 110 g. The maximum
allowable space was 60mm by 60mm. The motor the team chose had to fit these dimensions
while producing an RPM of 120 to properly model the scaled down rotation speeds.
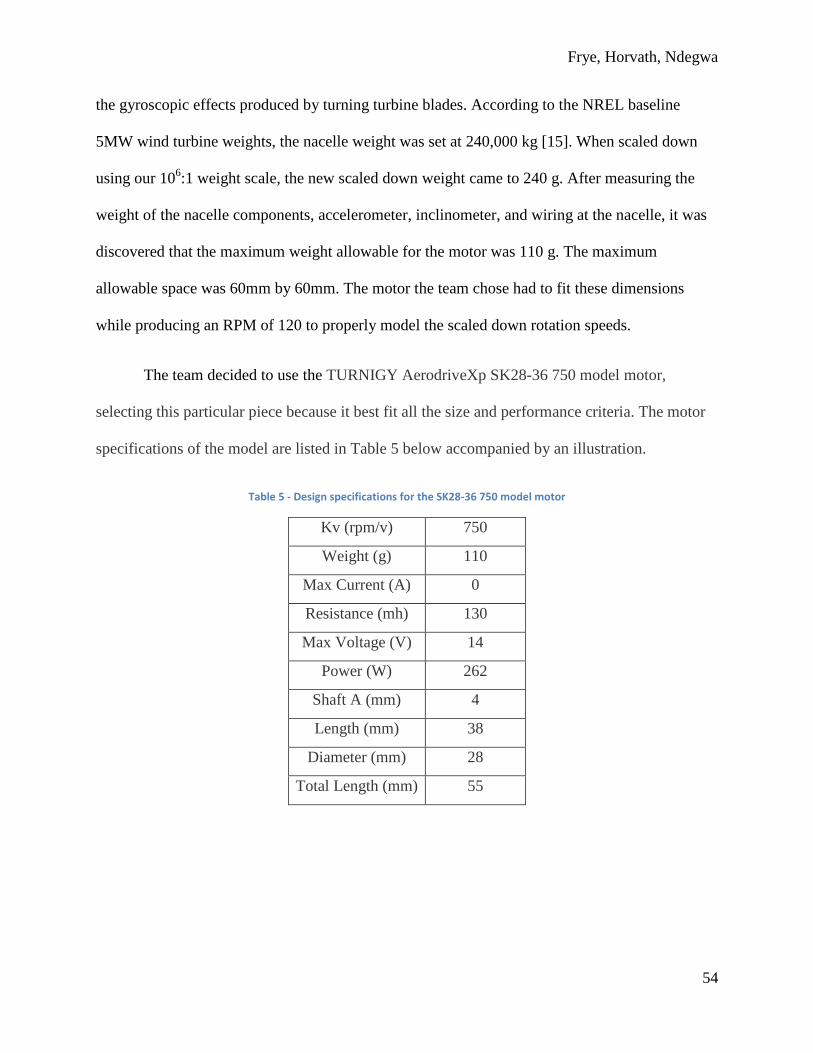
The team decided to use the TURNIGY AerodriveXp SK28-36 750 model motor,
selecting this particular piece because it best fit all the size and performance criteria. The motor
specifications of the model are listed in Table 5 below accompanied by an illustration.
Table 5 - Design specifications for the SK28-36 750 model motor
Kv (rpm/v) 750
Weight (g) 110
Max Current (A) 0
Resistance (mh) 130
Max Voltage (V) 14
Power (W) 262
Shaft A (mm) 4
Length (mm) 38
Diameter (mm) 28
Total Length (mm) 55
Frye, Horvath, Ndegwa
55
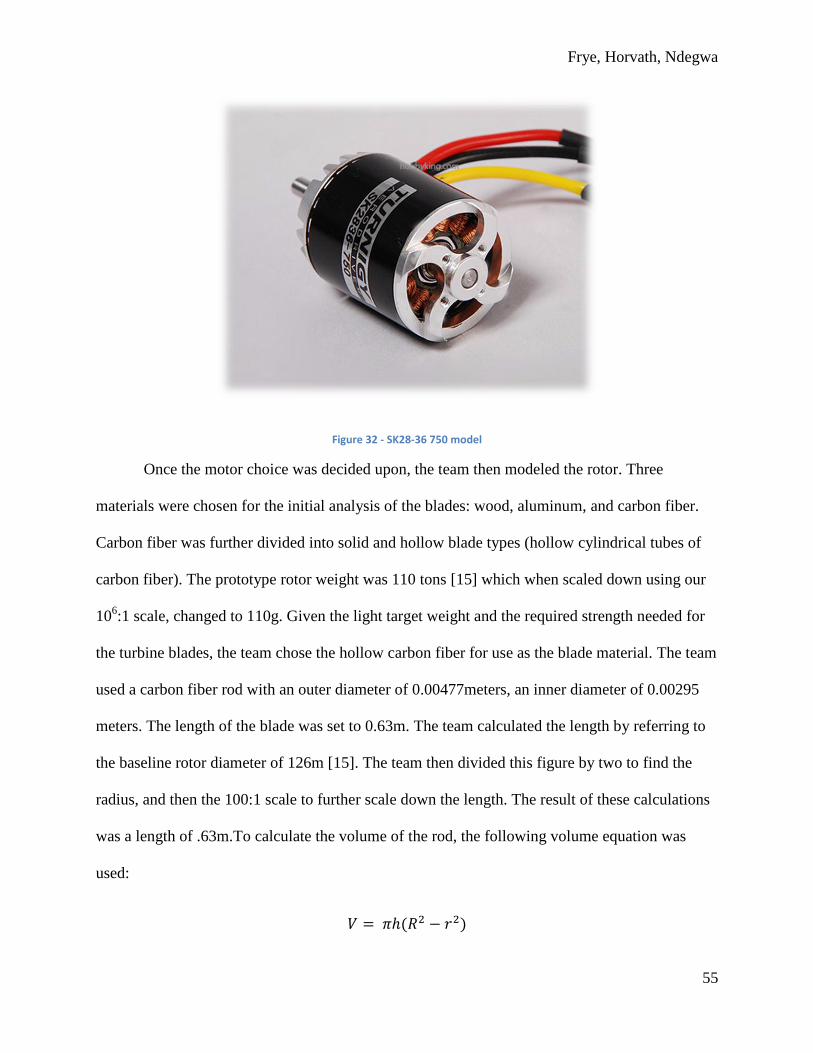
Figure 32 - SK28-36 750 model
Once the motor choice was decided upon, the team then modeled the rotor. Three
materials were chosen for the initial analysis of the blades: wood, aluminum, and carbon fiber.
Carbon fiber was further divided into solid and hollow blade types (hollow cylindrical tubes of
carbon fiber). The prototype rotor weight was 110 tons [15] which when scaled down using our
106:1 scale, changed to 110g. Given the light target weight and the required strength needed for
the turbine blades, the team chose the hollow carbon fiber for use as the blade material. The team
used a carbon fiber rod with an outer diameter of 0.00477meters, an inner diameter of 0.00295
meters. The length of the blade was set to 0.63m. The team calculated the length by referring to
the baseline rotor diameter of 126m [15]. The team then divided this figure by two to find the
radius, and then the 100:1 scale to further scale down the length. The result of these calculations
was a length of .63m.To calculate the volume of the rod, the following volume equation was
used:
( )

Frye, Horvath, Ndegwa
56
where h is the rod length, R is the outer radius, and r is the inner radius of the tube. Using the
manufacturer’s calculated carbon fiber density of 1330 kg/m3, the team was able to find the mass
of the blade to be 0.036985523 kg which was approximately close to the scaled down weight of
one blade.
However, to properly model the turbine length, the blades would require a moment of
inertia equal to that of the prototype when scaled down. To calculate the moment of inertia, the
following equation was used
where, I stands for moment of inertia, M for mass and L for length. The calculated moment of
inertia of the full scale prototype blades were 48,510,000 kg.m2. When scaled down, the moment
of inertia was converted to 0.004851kg.m2. The scaling factor used was
. In
order to match the moment of inertia of the hollow carbon fiber tubing to that of the prototype
blade, the team used a rod with a length of 0.63m The weight and moment calculations were
performed in Microsoft Excel. The table below shows a comparison of the weights and moments
for the three materials.
Table 6 - Comparisons of the moment of inertia and weight calculations of different blade materials
Aluminum Wood Carbon Fiber (hollow)
Length (m) 0.63 0.63 0.63
Radius (m) 0.007 Width:0.05
Height: 0.01
Outer Radius: 0.00477
Inner Radius: 0.00295
Volume (m3) 9.6969 x 10
5 0.00032
2.78 x 10
5
Density (kg/m3) 2700 800
1330
Mass (kg) 0.267 0.252 0.0369

Frye, Horvath, Ndegwa
57
Moment (kg.m2) 0.0346 0.03334
0.00489
4.9 Design Modifications After the team performed the COM test, it was determined that the actual location of the
COM was 42.1cm from the cover, roughly 6.1% off from Lee’s [6] predicted value. This would
affect the location of the instrumentation platform, which has to be located at the system’s COM
so that the accelerometer readings are accurate. After having manufactured all of the tank’s
components for preliminary tests early on in the project, the team had to then redesign the
instrumentation cylinder taking this change into consideration and reprint the parts.
Another design modification that was done simultaneously to the above platform location
change was in regards to the diameter of the instrumentation cylinder. The initial inner diameter
was 7cm, which was confirmed by Eric Murphy to be large enough to house the instruments.
However, this value turned out to be slightly smaller than the group expected. So the team
redesigned the cylinder to an outer diameter of 7.874cm so that all the instruments
(accelerometer, wireless card, and micro-controller) would fit tightly and securely inside.
The aforementioned design modifications made to the instrumentation cylinder also
affected the tank cover design, changing the diameter of the inner lip which allows for a secure
fit between the cylinder and the cover. Since the cover also had already been printed early on in
the project, the team placed another order and reprinted it to meet these specifications.
Additionally, a modification to the wind turbine’s ballast configuration was also made.
This came about after the team conducted its first floatation test on the model, where it became
apparent that 5 steel plates made the system significantly heavier than desired, despite the
calculations done above, plunging the tank completely underwater. By trial and error, it was then
Frye, Horvath, Ndegwa
58
determined that 4 plates was the ideal number so that the waterline was slightly below the tank
cover, and the draft was approximately 60cm, as desired.
4.10 Design of Testing Configuration To accomplish the goals of this MQP, the team tested the wind turbine model in a water
flume provided by Alden Research Laboratory in Holden, MA. This 6-foot by 6-foot water
tunnel was used to generate 100:1 scale waves, simulating sea conditions a floating wind turbine
might experience during its lifetime out in the ocean. The water height used was 50 inches.
Below is a picture of the flume.
Figure 33 - Water flume used for testing, located at Alden Labs in Holden, MA
In order to ensure a quick and easy set-up of the group’s testing apparatus once the
testing day at Alden Labs arrived, the team designed an optimal testing configuration for the
Frye, Horvath, Ndegwa
59
zero-tension catenaries, using the flume’s space as best as possible. A picture of this setup can be
seen in Figure 23, and a detailed, dimensioned drawing in the Appendix.
The optimal design for this setup allowed the team to place two aluminum anchoring
plates upstream of the turbine and the remaining one downstream. Thus, if the wind turbine is
carried downstream with the waves, there would be two plates pulling it back to its original
position. The two upstream anchoring plates were symmetrically distributed along the flume
floor, located 4.12cm from the flume walls and 108.12cm from the downstream plate.

Frye, Horvath, Ndegwa
60
5. Testing There were two distinct phases of testing. The first phase was conducted in a water tank
in Higgins Laboratories 016. The testing of the water-tightness of the spar buoy and the test to
determine the height at which the fully assembled spar buoy floated at when submerged in water
were outlined earlier in this report. One of the last necessary tests to perform was whether
instrumentation (inclinometers and accelerometers) data acquisition software was operational.
This test, performed by graduate student Eric Murphy working on a concurrent project, allowed
the MQP team to see that all the data would be collected and that there would not be any major
issues once the team traveled to Alden Research Laboratories. It also gave the team a chance to
see the new wireless testing configuration, which removed the need for an umbilical cable
between the floating platform and the laptop computer to transfer data. An umbilical cable would
affect the platform dynamics under wave loading.
The final testing phase was conducted in Alden Research Laboratories in Holden,
Massachusetts in a 6 foot by 6 foot flume. This flume has a wave generator that allows for
varying wave frequencies and amplitudes. Wave amplitudes were conducted with 3 or 4 inch
amplitude waves (peak to peak). Because of the modifications to the testing configurations,
water did not get into the tank at all during the actual data acquisition phase.
The majority of the testing was done on a different design of floating wind turbine called
a tension leg platform (TLP). This design was originally studied by last year’s floating wind
turbine MQP team. This year, the TLP design was being run in a concurrent project by graduate
student Kazim Naqvi. The entire first day of testing consisted of setting up the instrumentation
and making sure everything was ready for the next day. The next two days of testing were spent

Frye, Horvath, Ndegwa
61
performing 80 test runs with varying wave amplitudes and frequencies, as well as a varying
ballast weight.
The fourth day of testing was spent almost entirely switching from the TLP to the spar
buoy. The base plate for the TLP was removed, and a lot of time was spent checking again to
make sure the spar buoy was water tight before any instrumentation was used. All the testing
done that day was on a freely floating spar buoy.
The final day of testing was spent testing an anchored spar buoy. The MQP team ran
about 67 tests of varying wave amplitudes (0 – 7.5 cm in height), frequencies (0.5-1.5s periods),
as well as varying the ballast weight (1.02-5.14 kg). The data of these tests is analyzed in the
next section.
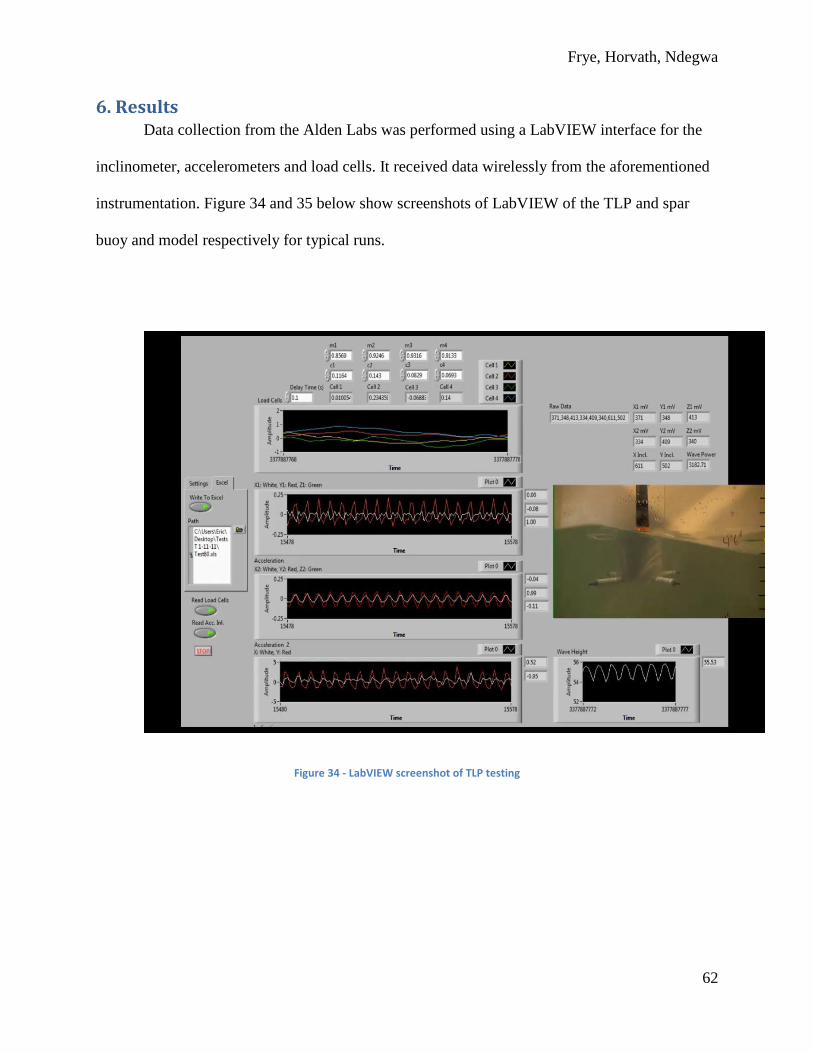
Frye, Horvath, Ndegwa
62
6. Results Data collection from the Alden Labs was performed using a LabVIEW interface for the
inclinometer, accelerometers and load cells. It received data wirelessly from the aforementioned
instrumentation. Figure 34 and 35 below show screenshots of LabVIEW of the TLP and spar
buoy and model respectively for typical runs.
Figure 34 - LabVIEW screenshot of TLP testing
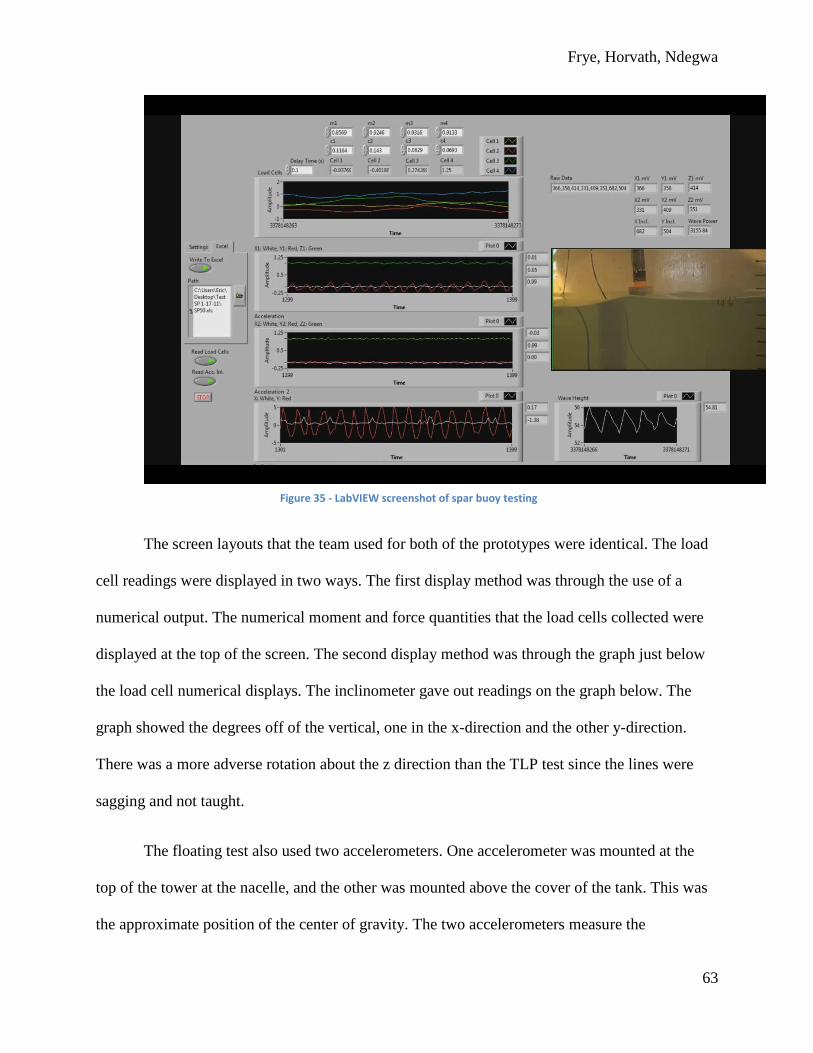
Frye, Horvath, Ndegwa
63
The screen layouts that the team used for both of the prototypes were identical. The load
cell readings were displayed in two ways. The first display method was through the use of a
numerical output. The numerical moment and force quantities that the load cells collected were
displayed at the top of the screen. The second display method was through the graph just below
the load cell numerical displays. The inclinometer gave out readings on the graph below. The
graph showed the degrees off of the vertical, one in the x-direction and the other y-direction.
There was a more adverse rotation about the z direction than the TLP test since the lines were
sagging and not taught.
The floating test also used two accelerometers. One accelerometer was mounted at the
top of the tower at the nacelle, and the other was mounted above the cover of the tank. This was
the approximate position of the center of gravity. The two accelerometers measure the
Figure 35 - LabVIEW screenshot of spar buoy testing
Frye, Horvath, Ndegwa
64
acceleration in the z, y and z directions. The x and y had more significant accelerations in the
spar buoy compared to the TLP mainly due to the more sagging cable comparatively. The z
direction acceleration was significant as the wave action brought about a substantial vertical
movement.
Lastly, a float type gauge was used in the experiment. This provided an accurate
measurement of the wave height for LabVIEW. This device used a small buoyant ball on a thin
metal rod that was connected to a rotating joint on a potentiometer. This joint allowed the ball to
rise and fall with each passing wave and measure the amplitude of the waves on the graph at the
bottom right-hand side of the screen.
Below is a collection of graphs compiled from LabVIEW. The graphs illustrate the
nacelle acceleration, center of gravity acceleration, wave height and the nacelle inclination. By
comparing the graphs of all tests we were able to correlate the effects of the different wave
heights and the dynamic forces on the floating system.
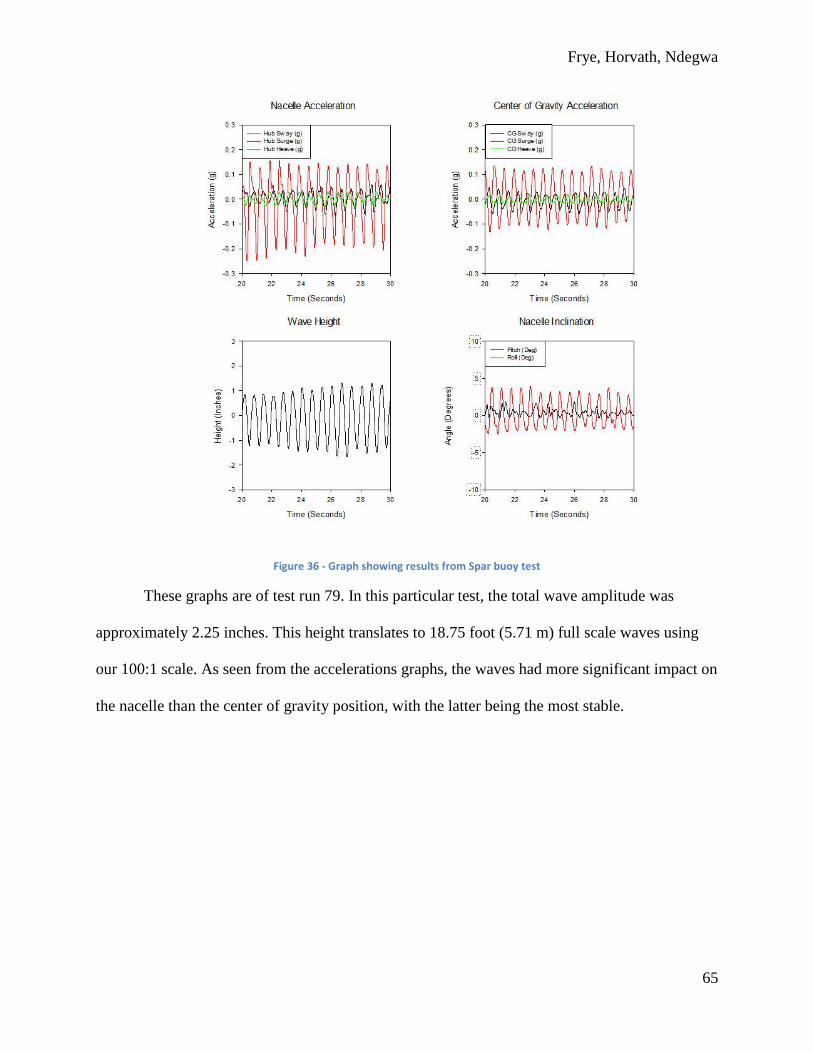
Frye, Horvath, Ndegwa
65
Figure 36 - Graph showing results from Spar buoy test
These graphs are of test run 79. In this particular test, the total wave amplitude was
approximately 2.25 inches. This height translates to 18.75 foot (5.71 m) full scale waves using
our 100:1 scale. As seen from the accelerations graphs, the waves had more significant impact on
the nacelle than the center of gravity position, with the latter being the most stable.

Frye, Horvath, Ndegwa
66
7. Conclusions The rise in demand and use of renewable energy sources has been attributed to the
increasingly scarce supply of fossil fuels. Additionally, utilization of fossil fuels to produce
energy produces byproducts that are harmful to the environment. Wind energy output has
increased significantly as renewable energy use has risen. However, with the introduction of
floating platform technology, wind energy stands to make more advances as turbines are moved
to offshore locations with much greater wind speeds. The floating wind turbine platform may in
the future play a significant role in meeting world energy needs.
This MQP designed and constructed a spar buoy floating wind turbine platform concept.
Additionally, the team members were involved in the testing of the tension Leg Platform (TLP)
design. Both the TLP and Spar Buoy scale models were equipped with inclinometers and
accelerometers for data collection during testing. The tests were carried out in water tanks at the
WPI’s Higgins Laboratories as well as a flume with a wave generator at the Alden Research
Labs in Holden, MA. These tests replicated various conditions from calm weather to hurricane
storms. Based on the test results, both models were able to stay afloat in all conditions.
A great deal of work needs to be done in the future to improve on the spar buoy wind
turbine model. Improvements should be made to the spar buoy model especially on the ballasting
system and cable attachments. Also, more work should be spent in water proofing both of the
models with emphasis given to the cover, the tower attachment points and the cable attachment
points. A more detailed discussion on future work is found in the following section.
Frye, Horvath, Ndegwa
67
8. Future Work The goal of this MQP was to design, build, and test a 100:1 model of a Floating Wind
Turbine, using the spar buoy as the platform design. For next year’s project, the team suggests
modeling wind and gyroscopic effects in the presence of a rotating set of turbine blades, in
addition to the existing methods for modeling the tension on the spar buoy tether lines. In the
case of the wind modeling, this group performed basic thrust calculations to size a disk that can
be placed in front of the turbine blades and serve to analyze how wind affects the pitching angle
of the turbine, as described in the design chapter. Next year’s group can manufacture the disk as
specified above and develop a shaft system to attach it to the turbine hub. They can then take the
full modified system to Alden Labs for a more extensive and detailed testing session. As for the
gyroscopic effects due to rotating blades, this MQP has also developed all of the preliminary
design procedures for manufacturing the blades, as can be seen in the design section of this
report. Future groups can purchase the required materials, manufacture them to the specified
dimensions, assemble them onto the tower and nacelle, and, after incorporating the suggested
motor for rotation, perform new tests at Alden Labs.
Additionally, due to the unfortunate accident described earlier of dropping the platform, a
few dents were discovered on the part. This required the team to add several additional ABS
sealant layers to the inside of the platform, adding unnecessary and undesired weight to the
system. Therefore, it is highly encouraged that future teams reprint the platform parts and
reassemble them, applying a thin layer of ABS sealant to the inside of the tank and taking extra
care not to damage the parts.
Furthermore, a modified cable attachment design was also proposed to improve the
method of securing the tether lines to the platform. There are now nine of these attachments to be
Frye, Horvath, Ndegwa
68
placed at different locations along the height of the spar buoy as desired. These will need to be
glued to the platform before any future testing can be made.
Also, next year’s MQP team can analyze the effects of a ballasted tether system on the
turbine’s stability. Unfortunately, due to time constraints, this year’s team was unable to fully
design a ballasted configuration (see Figure 8) or test it in Alden Labs. It is advised that further
research be made into this mooring system so that it can be accurately designed and tested,
comparing the new data with the one presented in this MQP report.
Finally, wind modeling and gyroscopic effects should be introduced and observed how
they affect the stability of the system. The first step to introducing new wind modeling and
gyroscopic effects is to calculate the current nacelle weight and the potential new weight. The
weight of the nacelle for the testing configuration in Alden was 245 grams. Of this mass, 145
grams were the instrumentation and the case that held it. This means that to keep the same
weight for the nacelle, the motor, blades, and disk would all have to weigh a total of 100 grams.
This is basically impossible based on the size of the disk required and on the maximum velocity
that can be achieved. The MQP team decided that if all the weights were minimized as much as
possible, than the weight of the new nacelle should not affect the data too drastically.
Frye, Horvath, Ndegwa
69
References 1. "Renewable Energy Consumption in the Nation’s Energy Supply." U.S. Energy Information
Administration. URL:
<http://www.eia.doe.gov/cneaf/alternate/page/renew_energy_consump/figure1.html>
2. Kempton, W. "Offshore Wind Power." Wind Powering America. URL:
http://www.windpoweringamerica.gov/pdfs/workshops/2010_summit/kempton_offshore.pdf
3. Butterfield, S., et al. Engineering Challenges for Floating Offshore Wind Turbines.
http://www.nrel.gov/wind/pdfs/38776.pdf
4. Schwartz, M., Heimiller, D., Haymes, S., and Musial, W. Assessment of Offshore Wind
Energy Resources for the United States. Technical Report NREL/ TP-500-45889, June 2010.
URL: <http://www.nrel.gov/docs/fy10osti/45889.pdf>
5. United States Power Consumption, Electricity, U.S. Energy Information Administration-
EIA. URL: <http://www.eia.doe.gov/oiaf/aeo/electricity.html>
6. Lee, K.H., Sclavounos, P., and Wayman, E. Floating Wind Turbines. Department of
Mechanical Engineering, MIT, June, 2005. URL:
<http://www.iwwwfb.org/Abstracts/iwwwfb20/iwwwfb20_35.pdf>
7. Lee, S. “Dynamic response analysis of spar buoy floating wind turbine systems,” S.M.
Massachusetts Institute of Technology, 2008.
8. Floating Wind Turbine. Book’s personal blog. URL:
<http://bookscooler.supersized.org/archives/161-Floating-wind-turbine.html>
9. Nishida, E., Sato, I., and Utsunomiya, T. “Wave Response Experiment on SPAR-type
Floating Bodies for Offshore Wind Turbine.” The International Society of Offshore and
Polar Engineers. June, 2009.
10. Information of Nylon 6/6 from McMaster-Carr website.
<http://www.mcmaster.com/#nylon/=a60gci>
11. Berlo, D., et al. “Design of Scale-Model Floating Wind Turbine Platforms.” Major
Qualifying Project. WPI, March, 2010 < http://www.wpi.edu/Pubs/E-project/Available/E-
project-031610-140402/unrestricted/Wind_Turbines_Final_Report.pdf>
12. “Offshore Wind.” Environmental and Energy Study Institute. URL:
<http://www.eesi.org/files/offshore_wind_101310.pdf>
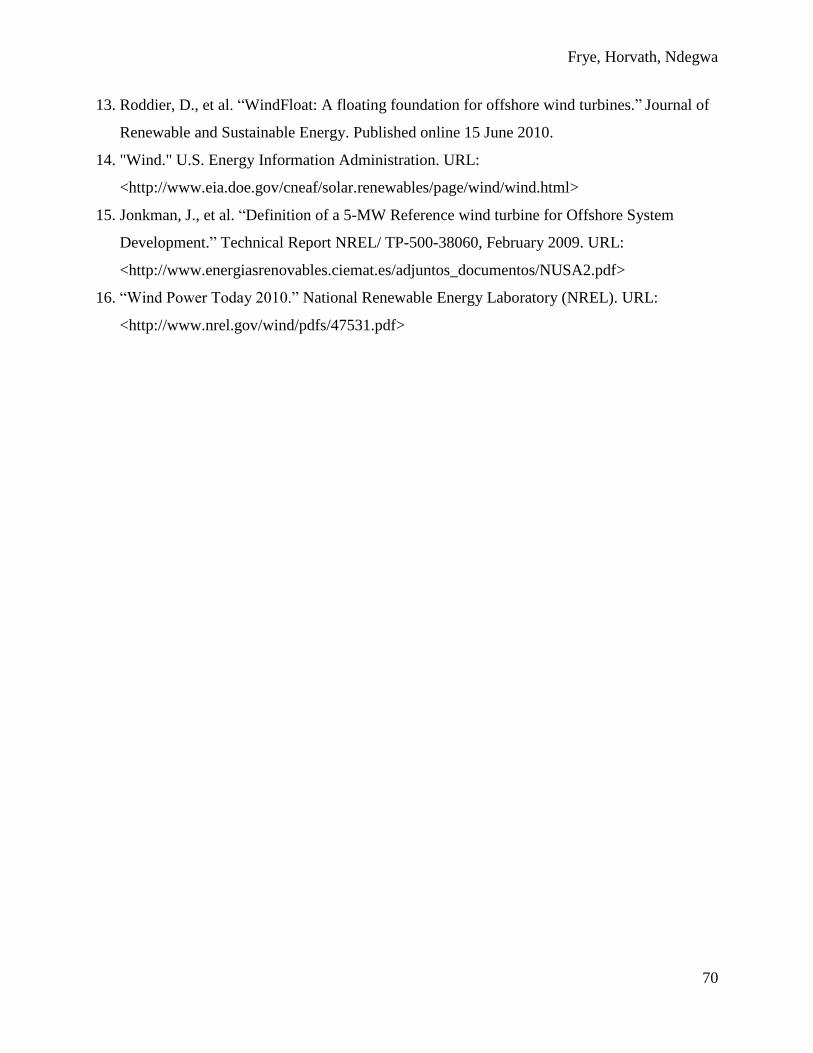
Frye, Horvath, Ndegwa
70
13. Roddier, D., et al. “WindFloat: A floating foundation for offshore wind turbines.” Journal of
Renewable and Sustainable Energy. Published online 15 June 2010.
14. "Wind." U.S. Energy Information Administration. URL:
<http://www.eia.doe.gov/cneaf/solar.renewables/page/wind/wind.html>
15. Jonkman, J., et al. “Definition of a 5-MW Reference wind turbine for Offshore System
Development.” Technical Report NREL/ TP-500-38060, February 2009. URL:
<http://www.energiasrenovables.ciemat.es/adjuntos_documentos/NUSA2.pdf>
16. “Wind Power Today 2010.” National Renewable Energy Laboratory (NREL). URL:
<http://www.nrel.gov/wind/pdfs/47531.pdf>
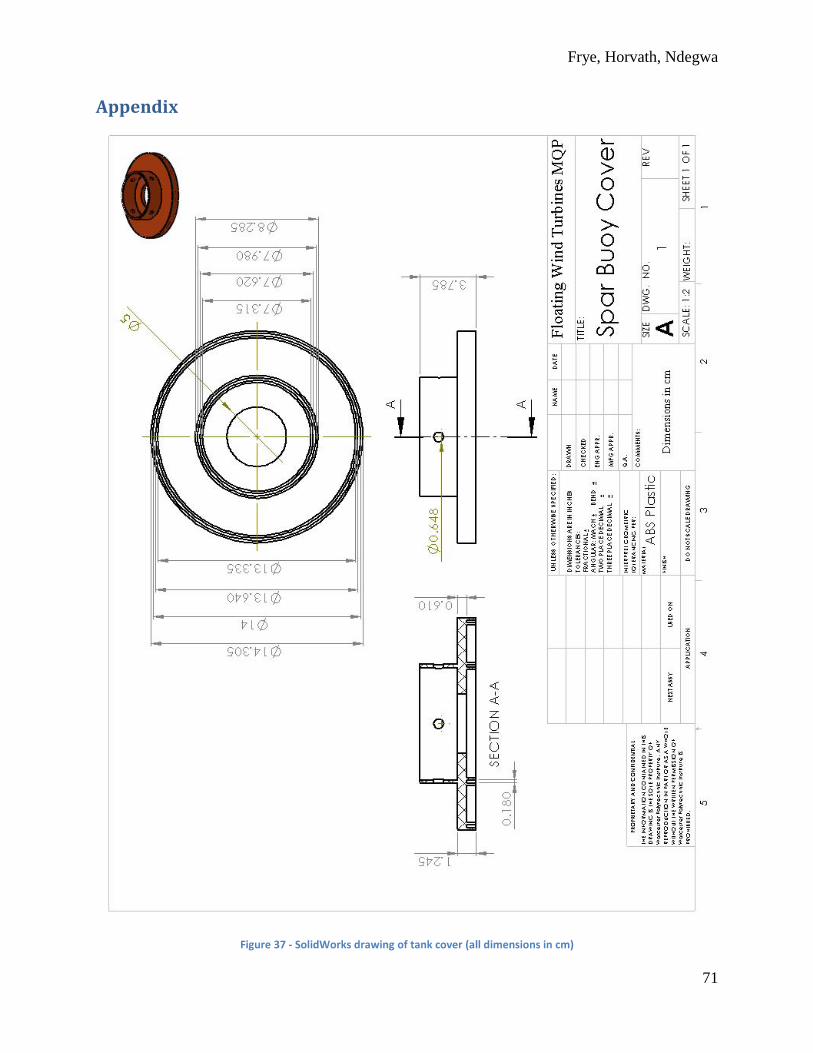
Frye, Horvath, Ndegwa
71
Appendix
Figure 37 - SolidWorks drawing of tank cover (all dimensions in cm)
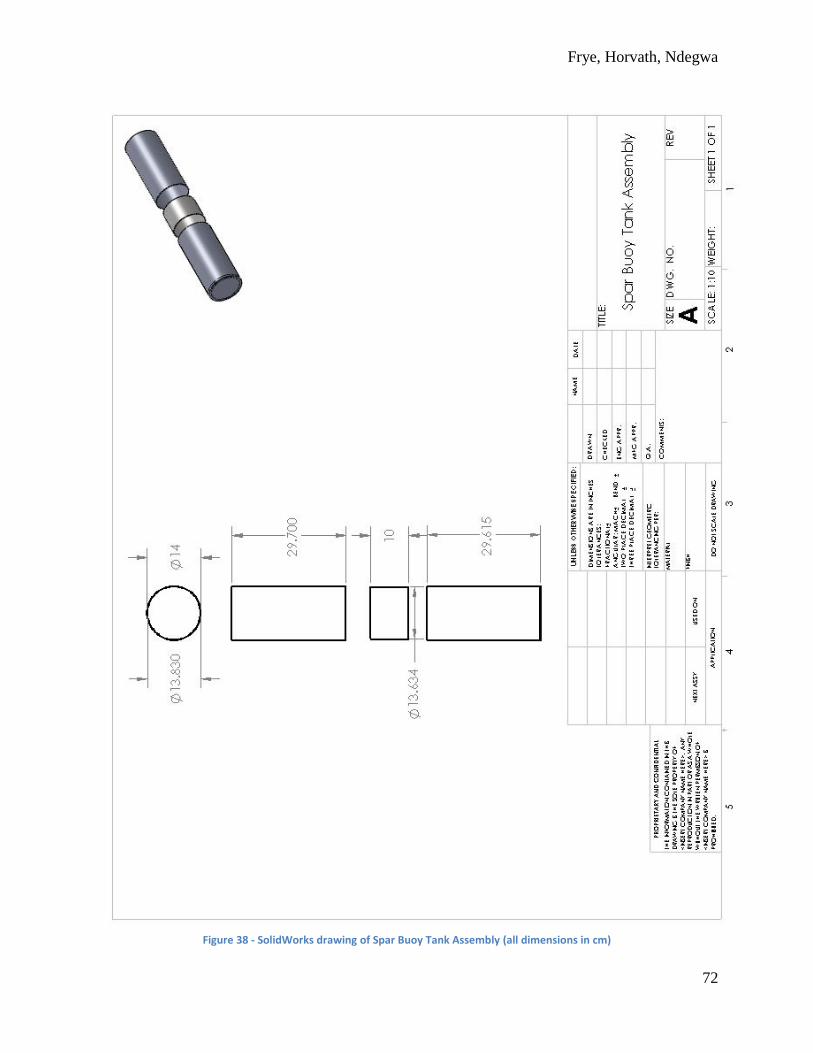
Frye, Horvath, Ndegwa
72
Figure 38 - SolidWorks drawing of Spar Buoy Tank Assembly (all dimensions in cm)
Frye, Horvath, Ndegwa
73
Figure 39 - SolidWorks drawing of modified cable attachments (all dimensions in cm)
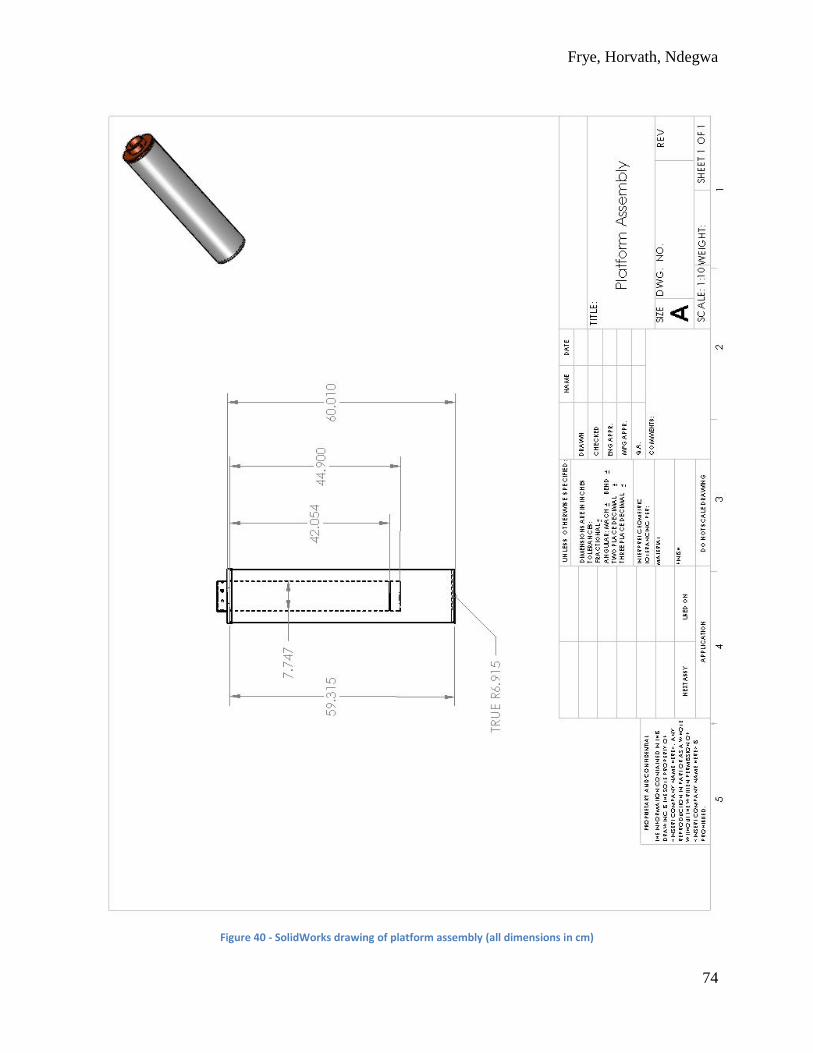
Frye, Horvath, Ndegwa
74
Figure 40 - SolidWorks drawing of platform assembly (all dimensions in cm)
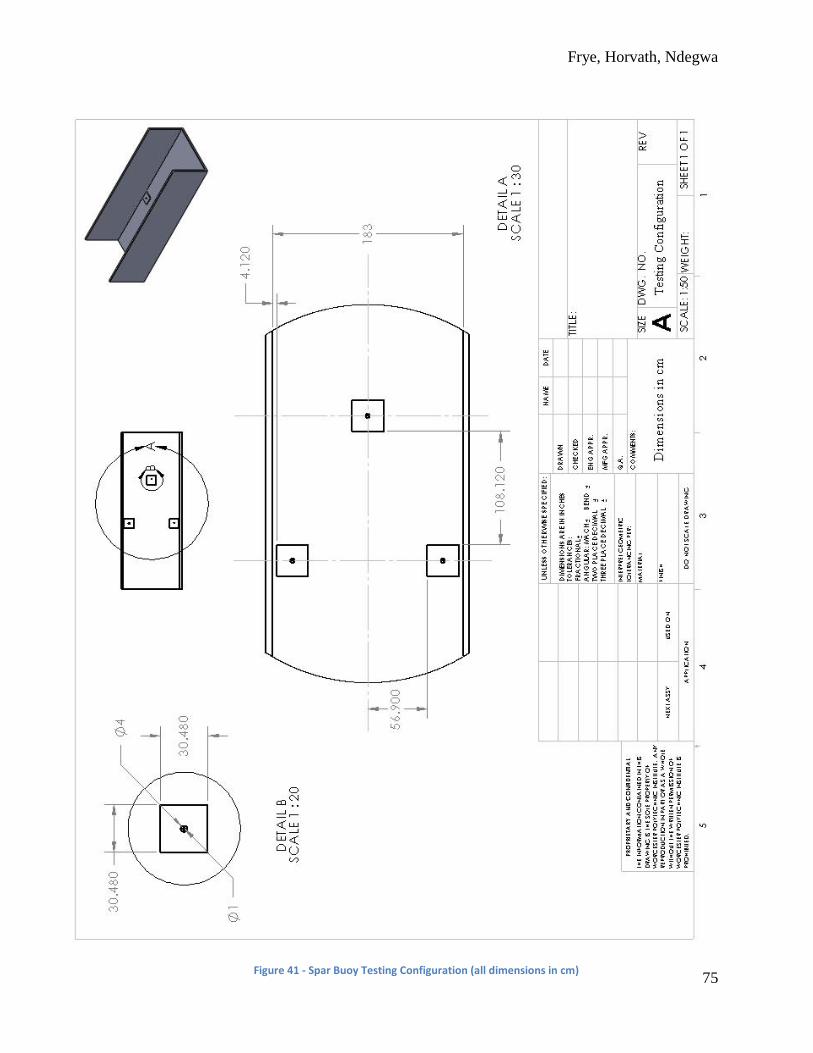
Frye, Horvath, Ndegwa
75
Figure 41 - Spar Buoy Testing Configuration (all dimensions in cm)