design science research contribution to business
TRANSCRIPT
Design Science Research Contribution to Business Intelligence in the Cloud –
A Systematic Literature Review
Odette Sangupamba Mwilu1, Isabelle Comyn-Wattiau1,2 and Nicolas Prat2
1 CEDRIC-CNAM, Paris, France
[email protected], [email protected] 2 ESSEC Business School, Cergy-Pontoise, France
{wattiau,prat}@essec.edu
Abstract: Business intelligence (BI) helps managers make informed decisions. In the age of big data, BI
technology provides essential support for decision making. Cloud computing also attracts many organizations
because of its potential: ubiquitous, convenient, on-demand network access to a shared pool of configurable
computing resources (e.g. networks, servers, storage, applications, and services). This paper focuses on the
deployment of BI in the cloud, from the vantage point of design science research (DSR). We produce a state
of the art of research pertaining to BI in the cloud, following the methodology of systematic literature review.
This literature review especially exhibits the different artifacts proposed by design science researchers
regarding BI in the cloud. To structure the literature review, we propose a framework composed of two
dimensions: artifact type and BI step. In particular, we propose a typology of artifact types, refining the
coarse-grained typology commonly used in DSR. We use the two-dimensional framework both to map the
current state of DSR regarding BI in the cloud, and to elicit future research avenues in terms of design
science artifacts for BI in the cloud. The contribution is threefold: the literature review may help DSR
researchers get an overview of this active research domain; the two-dimensional framework facilitates the
understanding of different research streams; finally, the proposed future topics may guide researchers in
identifying promising research avenues.
Keywords: business intelligence, analytics, cloud computing, design science research, systematic literature
review
1. Introduction
Business intelligence (BI) helps managers make informed decisions. In the age of big data, the support
of BI technology is critical in guaranteeing effective and efficient decision making. BI tools facilitate the
presentation of more accurate reporting, improve decision making, enhance customer relationships, and
increase revenue [1]. BI must scale up to big volumes of data (big data analytics). The term of business
analytics appeared in 2008 and tends to replace business intelligence. According to IDC [3], the business
analytics software market will grow at a 9.7% compound annual rate through 2017. Even if the BI software
market is mature and prolific, many research issues remain open in this domain. BI is a major topic since
companies need to acquire more skills and to increase their maturity. They need robust methodologies to
choose BI solutions, to implement them, to express business goals in terms of indicators and, more generally,
to manage companies thanks to effective decision support systems.
Cloud computing also attracts many organizations because of its potential: ubiquitous, convenient, on-
demand network access to a shared pool of configurable computing resources (e.g., networks, servers,
storage, applications, and services) [2]. It provides innovative services to different types of users. The latter
are freed from the underlying technical infrastructure. Beyond outsourcing, two concepts are highlighted in
cloud computing: virtualization and agility. Through the cloud, organizations can acquire IT services without
human intervention from the provider. According to IDC [3], spending on public IT cloud services alone
was estimated a $47.4 billion industry in 2013 and is expected to more than double by 2017. Ultimately,
cloud computing enables more efficient BI tasks. It allows faster deployment and greater flexibility compared
to traditional BI solutions [4] and produces accurate results more rapidly than desktop computers [5]. Even if
the cloud relies on well-known technologies, it raises new research questions: which guidelines are available
for companies that want to adopt cloud architectures? Which architecture must be preferred, given a context?
Are there specific approaches to help a company migrate to the cloud? Hence, the many issues and
opportunities associated with cloud computing also generate a dynamic research activity.
BI and analytics and cloud computing raise many issues for information systems researchers from
various streams, more specifically quantitative research, qualitative research, and design science research. In
this paper, we take the vantage point of design science research (DSR). DSR builds and evaluates artifacts
[6], which may be constructs, models, methods, or instantiations [7]. DSR has much to contribute to BI and
analytics [8] and cloud computing [9]. We consider the intersection of these two topics, focusing on the
deployment of BI in the cloud, from the point of view of DSR. Our research question is: What new artifacts
can design science researchers bring to the domain of BI in the cloud? To answer this question, we perform a
systematic literature review (SLR) of BI in the cloud in DSR. The literature review exhibits the different
artifacts proposed by design science researchers regarding BI in the cloud. Moreover, building on the
literature and on a framework composed of two dimensions (artifact type and BI step), we elicit future
research avenues in terms of design science artifacts for BI in the cloud. This article is an extension of a
previous paper [2]: it proposes a systematic literature review (SLR) and enriches the two-dimensional
framework.
The remainder of the paper is structured as follows: in the ensuing section, we present the research
gap and the research question. In Section 3, we describe our research method. Section 4 details our typology
of DSR artifacts. In Section 5, we propose a framework synthesizing the current state of research for business
intelligence in the cloud. Section 6 describes open research issues and opportunities for DSR and introduces a
discussion before concluding the paper in Section 7.
2. Research gap and research question
Design science produces artifacts to attain human goals [10]. DSR in information systems (IS) seeks
to extend the boundaries of human and organizational capabilities by creating new and innovative artifacts
[6]. While behavioral research aims at understanding, the main objective of DSR is utility. DSR is now
established as a major research paradigm in IS [11]. Many researchers support the view that the output of
DSR is an artifact or a set of artifacts, even though others argue that its purpose should be the creation of
theories [12]. In this paper, we adopt the view that the primary goal of DSR is the production of useful
artifacts. March and Smith [7] distinguish four categories of artifacts: constructs, models, methods, and
instantiations. According to these authors, constructs “form the vocabulary of a domain. They constitute a
conceptualization used to describe problems within the domain and to specify their solutions”. A model “is a
set of propositions or statements expressing relationships among constructs”. A method is “a set of steps (an
algorithm or guideline) used to perform a task. Methods are based on a set of underlying constructs
(language) and a representation (model) of the solution space”. An instantiation is “the realization of an
artifact in its environment”. This typology of artifacts is the most widely used in DSR. Other typologies have
been proposed, e.g. that of Offermann et al. [13]. These typologies help researchers and practitioners
represent, analyze, design, implement, and evaluate successful information systems. Our aim is to study
which artifacts have been proposed regarding BI in the cloud. Building on these previous papers, we
proposed a typology of artifacts that allows us to structure the literature review on BI in the cloud and detect
open research questions [2].
Many artifacts have been designed and found valuable regarding BI. Cloud computing puts forward
new architectures and new opportunities to share information and applications, but it also raises new risks. It
may offer new economic models for information technology (IT) and IS solutions. BI and analytics rely on
huge data sets, requiring complex and robust algorithms to produce information and knowledge. Abundant
literature can be found on BI and cloud computing and, more recently, on their combination.
The recent literature describes many research works investigating the specific opportunities and
addressing the research issues of BI in the cloud. Since this is a recent topic, there is no comprehensive
survey allowing researchers to quickly obtain a synthesized view of research results and opportunities. This
paper aims at filling this gap by proposing a systematic literature review and a framework for analyzing
significant results and identifying opportunities for further research. Considering the significant contribution
of DSR to BI in the cloud, the paper focuses on this research paradigm.
BI in the cloud raises many new research issues for the IS community at large (quantitative and
qualitative research, IS economics, design-science research). We acknowledge the potential contributions of
the various research paradigms to BI in the cloud, especially when used in combination (e.g. combination of
DSR with qualitative research), but we focus on DSR to reduce the search space. Thus, the research question
addressed in the paper is: What new artifacts can DSR bring to the domain of BI in the cloud?
In a previous publication [2], we proposed a first answer to this question. We conducted a preliminary
literature review to evaluate the state of the art of DSR for BI in the cloud. Using our artifact typology, we
summarized this review by listing, for each artifact type, which functions were covered among data
management, service management, and security management. More precisely, for each artifact type and for
each function, we answered the following question: did authors propose such artifacts to manage this
function (data, service, security) of BI in the cloud? Then, based on this preliminary literature review, we
proposed future research avenues for BI in the cloud.
In this paper, we go beyond by first performing a systematic literature review to validate and
strengthen our findings. Second, we organize the results into a two-dimensional framework. The first
dimension is our typology of artifacts. The second one is dedicated to BI components. In the same way, we
both analyze the literature and suggest further research according to this framework. The next section
describes our research method.
3. Research method
In this paper, we present the result of a systematic literature review (SLR) that we performed to assess
the current state of research on BI in the cloud.
Kitchenham [15] mentions three common motivations for undertaking a SLR in software engineering:
1) to summarize the existing evidence, the benefits and limitations of a specific technology, 2) to identify any
gaps in current research and suggest areas for further investigation, and 3) to provide a framework in order to
appropriately position new research activities. This paper is in alignment with the last two motivations,
focusing on BI in the cloud from the vantage point of DSR.
Let us note that a SLR synthesizes existing work in a scientific approach, targeting the completeness of
the search to be assessed. In particular, it allows literature reviews not to be limited to academic publications.
This seems particularly useful in emergent topics, such as BI on the cloud, where both researchers and
professionals may propose new artifacts.
3.1. Research question
Let us remind our research question identified in the previous section: Which new artifacts can DSR
bring to the domain of BI in the cloud?
According to the principles of SLR, we first have to check that the research question is meaningful
and important to practitioners as well as researchers. By describing the market of BI solutions and the
advantages of the cloud, we have met the practitioners’ viewpoint. BI and cloud computing being two major
research topics in computer science and IS, the interest of combining both concepts is at least twofold: BI in
companies becomes a more and more important part of the information system, requiring investment in terms
of computational performance and data volumes, that the cloud may provide easily; second, given the cloud
opportunities, the question of migrating the whole IS including its BI is of great interest. In particular,
researchers have to provide professionals with models and methods helping to make the decision as well as to
implement it.
The second requirement is that answering the research question will impact current practice and
extend the body of knowledge. Practitioners need to know if past rules for managing BI remain valid if it is
based partially or totally on the cloud. Research must check the applicability of past artifacts and when
appropriate propose new ones.
Third, the answer to the research question must identify discrepancies between common beliefs and
reality. In our case, the question appears to be: is cloud computing a new concept or only a new deployment
of past concepts (e.g. distributed systems)? Regarding BI, the question turns into: does migration of BI on the
cloud lead to new challenges and thus require new artifacts such as methods for example?
3.2. Selection of papers
Our sample for SLR first included articles that are at the intersection of BI and cloud computing on
the one hand (sources of type 1). In order to select the relevant references [15], we used appropriate
keywords for each type of sources. The following set of keywords was used: (« Business Intelligence » OR «
Analytics » OR « Data warehouse ») AND (« Cloud » OR « SaaS »). The first set of terms refers to BI and its
synonyms, and the second refers to the cloud and its most typical layer (SaaS). We searched the keywords in
the full text of papers.
Apart from Google Scholar, the main sources of academic papers related to BI in the cloud are the
ACM Digital Library, IEEE Xplore, DBLP, ScienceDirect, EBSCOhost and the electronic library of the AIS
(AISeL). We used all these sources. One main objective of SLR is the completeness of results, constraining
us to browse all common academic sources.
Based on initial tests, we limited the search to the first fifty pages of results, for each source. The time
span for sources examination was from 2004 to 2014, considering that BI and cloud computing technologies
are evolving fast. Several papers were cited in multiple sources (in particular, most papers referenced in
Google Scholar). Thus, the different search results were then merged (deduplication).
We examined these papers to exhibit artifacts already proposed in the papers, and also artifacts
mentioned as future research.
On the other hand, given that BI in the cloud is an emerging technology, we took into account papers
that deal with each of these two domains separately (sources of type 2). The process for selecting these
papers was similar to the one described above for papers on the topic of BI in the cloud. The difference lies in
the choice of keywords: the keywords were specific to each of the related domains, and also ensured that
only the seminal papers for understanding the domains (literature reviews) were selected. We queried the
same databases with two consecutive queries as follows:
(“Overview” OR “State of the art” OR “Survey” OR “Literature review”) AND (“Business
Intelligence” OR “Analytics” OR “Data warehouse”)
(“Overview” OR “State of the art” OR “Survey” OR “Literature review”) AND (“Cloud” OR “SaaS”). The objective was not to analyze the whole literature on each topic but to obtain a content synthesis of
each domain. Thus, we limited our SLR to the papers proposing such a synthesis. After deduplication and
elimination of non-ERA and non-DSR papers, the list was reduced to 19 papers and we examined these papers to exhibit artifacts already proposed in the papers.
3.3. Paper quality assessment
Conducting an SLR requires the definition of exclusion and inclusion criteria ensuring the quality of
selected papers and reducing the bias in this selection.
As an exclusion criterion of our SLR, we eliminated all the papers that were not published in journals
or conference proceedings from the ERA list [16] [17] (exclusion criterion). Then the abstracts were screened
to ensure that they were DSR papers (inclusion criterion). The basic heuristic helping us decide if a paper
was a DSR paper was to elicit the artifact or the artifacts proposed in the paper (inclusion criterion). Thus,
our typology of artifacts (presented below) allowed us to detect and categorize the artifacts already proposed
in the domain of BI in the cloud, and hence those to which DSR should dedicate its future efforts.
Originally, after querying the databases mentioned above, we got a list of 1030 papers. After
deduplication and elimination of non-ERA and non-DSR papers, the list was reduced to 63 papers (45 of
source 1 and 18 of source 2).
3.4. A two-dimensional framework for characterizing DSR pertaining to BI in the cloud
In this section, we describe the two dimensions of our literature analysis, i.e. the artifacts described in
papers and the steps of business intelligence. These dimensions aim to help the reader in understanding the
field. Below, we describe and justify these two dimensions.
We based our categorization on the hierarchy of artifacts detailed in Section 4 below. This typology
helped us in different ways. First, we focused our SLR on DSR. This typology of artifacts proved very useful
in deciding whether a paper was a contribution of DSR. When parsing more than one thousand abstracts, we
detected whether they mentioned as a contribution one or several artifacts of our typology. Then we read the
whole paper to ensure that we had captured the whole set of DSR artifacts proposed by the authors.
Business intelligence requires the capabilities of acquiring information, storing it, and analyzing it
using different tools and techniques. These three aspects are often handled through different research teams.
We structured our state of the art along these three aspects:
Data collection and blending: This aspect includes ETL (Extract-Transform-Load) techniques for
collecting and consolidating data from different sources.
Data modeling and storage: This topic encompasses all the models, methods, techniques, and tools for
managing high volumes of various data types.
Analytics: This third aspect encompasses the analysis and visualization of data. It may be subdivided
into descriptive, inquisitive, predictive, and prescriptive analytics [18] [19].
Given the definition of BI that involves collecting, blending, modeling, storing, analyzing and
reporting information, this categorization is used to classify the artifacts according to their role in this
process.
In the following section, we describe our typology of design science research artifacts as a help for
structuring our analysis.
4. A detailed typology of DSR artifacts
DSR in IS generates new and innovative artifacts [6]. As mentioned above, March and Smith [7]
distinguish four types of artifacts constituting the outputs of DSR: constructs, models, methods, and
instantiations. This typology of artifacts is widely used, including in the seminal paper by Hevner et al. [6].
However, the typology is sometimes difficult to operationalize, due to the relative fuzziness of the concepts
of construct, model, method, and instantiation. Therefore, it is useful to specialize the typology, specifying
and defining subcategories for the four main categories of artifacts. As an example, Offermann et al. [8]
specialize the typology of artifacts. This work provides a useful basis for a classification of the various types
of artifacts. However, the typology of Offermann lacks some important subcategories of artifacts, some types
include a large number of different concepts, and the proposed definitions may lead to confusion. Moreover,
the proposed types are not directly related to the original concepts of constructs, models, methods, and
instantiations. Consequently, we proposed our typology of the different types of artifacts, subtyping the
categories of construct, model, method, and instantiation [2]. For each subcategory, we gave a definition,
using or adapting the definitions found in the literature. Our typology, with precise subcategories and a
definition for each subcategory, helps in the identification and characterization of DSR artifacts. When the
definition is borrowed from other authors, the reference is provided.
4.1. Constructs
We have put together, in the construct category, the concepts and their combinations, leading to three
artifacts: concepts, language, and meta-model.
Language: A set of concepts, or more generally symbols, rules for combining them (syntax), and rules
for interpreting combinations of symbols (semantics) [20].
Meta-model: A set of concepts represented in graphical notation, with rules for combining the concepts.
Concept: A new construct added to an extant language or meta-model. As an example, class is a main
concept in object-oriented models as well as verb is a main concept in natural language grammars.
4.2. Models
When constructs are used to build more structured objects, we obtain models. The most common
artifact in the model category is the system design [13], proposed in a large number of DSR papers. We have
added the categories of ontologies, taxonomies, and frameworks, that are very specific models frequently
proposed in DSR.
System design: A structure or behavior-related description of a system, commonly using some
graphical notation and possibly text [13].
Ontology: An explicit formal specification of a shared conceptualization [21]
Taxonomy: A classification of objects in a domain of interest, based on common characteristics [22].
Framework: A logical structure for organizing complex information [23].
Architecture: A blueprint representing the fundamental organization of a system embodied in its
components, their relationships to each other, and to the environment [24] [25].
Requirement: A condition or capability that must be met or possessed by a system [24].
4.3. Methods
The method category puts together dynamic artifacts. Offerman et al. [13] proposed: method,
guideline, and algorithm. We added method fragment for describing components of more comprehensive
methods, including patterns for example. We also added metrics. The latter are close to algorithms but
very specific artifacts since their interest is not their logic or their performance but their ability to
synthesize a measure inside a mathematical formula. Finally, we adopted methodology instead of method,
thus avoiding homonyms between categories and subcategories.
Methodology: A predefined set of steps and guidelines, with associated techniques and tools. It is
aimed at, or used by, individuals who work in a discipline [24] [26].
Guideline: A suggestion regarding behavior in a particular situation [13]. Examples: design
principles (broad guidelines), heuristics, rules (detailed guidelines) [27].
Algorithm: An executable sequence of operations for performing a specific task [24].
Method fragment: A method component that can be treated as a separate unit and reused in different
contexts [28]. Design patterns are an example of method fragment.
Metric: A function that assigns a number or symbol to an entity in order to characterize an attribute
or a group of attributes. The value of the metric is called a measure [29].
4.4. Instantiations
Instantiations are specific artifacts often proposed to assess the feasibility of other constructs, e.g.
system designs or methodologies. We differentiate between the prototypes or more finalized tools on the
one hand and, on the other hand, the examples described in the papers to illustrate the contributions.
Implemented system: An implemented software or hardware system. In research papers, the
implemented systems may be either prototypes or finalized tools.
Example: Any other concrete materialization of an abstract artifact (construct, model, or method).
Examples are proposed either for illustrating the artifact or as a first step of validation of the
usefulness of the artifact. It may be the application of a query language to an illustrative scenario,
or the illustration of a design-theory framework with concrete examples of design theories, or the
application of a project methodology to a real project.
We applied our typology to a set of more than 120 papers and thus checked that it is a useful tool
to check if a paper is dedicated to DSR and to extract the main contributions of such papers [30].
5. Mapping current research on BI in the cloud
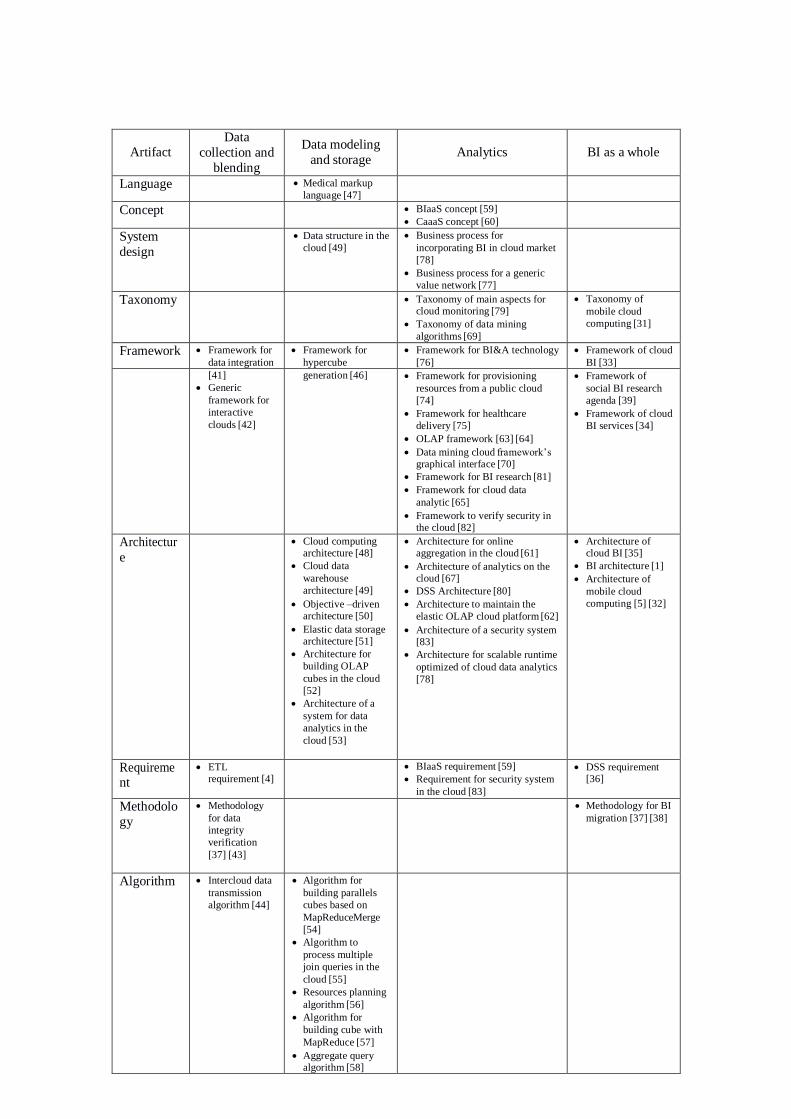
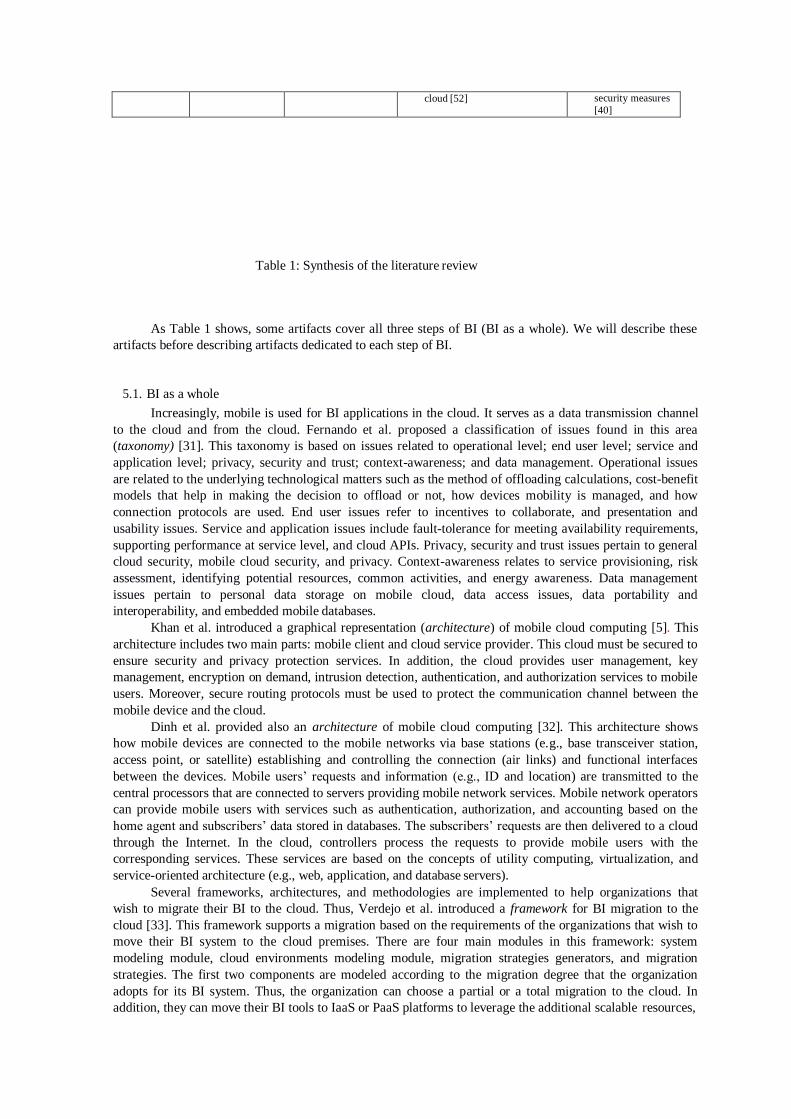
In this section, we describe the findings from our SLR. Table 1 synthesizes, for each BI step, the
artifacts found in the 64 papers. It illustrates the richness of DSR research on the topic. Almost each cell
of the table contains many different artifacts.
Artifact Data
collection and
blending
Data modeling
and storage
Analytics
BI as a whole
Language Medical markup
language [47]
Concept BIaaS concept [59]
CaaaS concept [60]
System
design Data structure in the
cloud [49]
Business process for
incorporating BI in cloud market
[78]
Business process for a generic
value network [77]
Taxonomy Taxonomy of main aspects for cloud monitoring [79]
Taxonomy of data mining
algorithms [69]
Taxonomy of
mobile cloud
computing [31]
Framework Framework for
data integration
Framework for
hypercube
Framework for BI&A technology
[76]
Framework of cloud
BI [33]
[41]
Generic
framework for
interactive
clouds [42]
generation [46] Framework for provisioning
resources from a public cloud
[74]
Framework for healthcare
delivery [75]
OLAP framework [63] [64]
Data mining cloud framework’s graphical interface [70]
Framework for BI research [81]
Framework for cloud data
analytic [65]
Framework to verify security in the cloud [82]
Framework of
social BI research
agenda [39]
Framework of cloud
BI services [34]
Architectur
e Cloud computing
architecture [48]
Cloud data
warehouse
architecture [49]
Objective –driven architecture [50]
Elastic data storage architecture [51]
Architecture for
building OLAP
cubes in the cloud
[52]
Architecture of a
system for data
analytics in the
cloud [53]
Architecture for online aggregation in the cloud [61]
Architecture of analytics on the cloud [67]
DSS Architecture [80]
Architecture to maintain the
elastic OLAP cloud platform [62]
Architecture of a security system [83]
Architecture for scalable runtime
optimized of cloud data analytics
[78]
Architecture of cloud BI [35]
BI architecture [1]
Architecture of
mobile cloud
computing [5] [32]
Requireme nt
ETL requirement [4]
BIaaS requirement [59]
Requirement for security system
in the cloud [83]
DSS requirement [36]
Methodolo
gy
Methodology
for data
integrity
verification
[37] [43]
Methodology for BI
migration [37] [38]
Algorithm Intercloud data
transmission
algorithm [44]
Algorithm for
building parallels
cubes based on
MapReduceMerge
[54]
Algorithm to
process multiple
join queries in the
cloud [55]
Resources planning
algorithm [56]
Algorithm for
building cube with
MapReduce [57]
Aggregate query algorithm [58]

Implement
ed system Tool for analysis in the cloud
[67]
Tool for online aggregation in the cloud [61]
Tool for scalable runtime
optimized of cloud data analytics
[73]
Tool for incorporating BI in cloud market [78]
Tool to maintain the elastic
OLAP cloud platform [62]
Tool for application
reconfiguration [71]
Tool to combine the scale of
Google App Engine with offline
data analytics [72]
Example Example of building OLAP on Example of
cloud [52] security measures
[40]
Table 1: Synthesis of the literature review
As Table 1 shows, some artifacts cover all three steps of BI (BI as a whole). We will describe these
artifacts before describing artifacts dedicated to each step of BI.
5.1. BI as a whole
Increasingly, mobile is used for BI applications in the cloud. It serves as a data transmission channel
to the cloud and from the cloud. Fernando et al. proposed a classification of issues found in this area
(taxonomy) [31]. This taxonomy is based on issues related to operational level; end user level; service and
application level; privacy, security and trust; context-awareness; and data management. Operational issues
are related to the underlying technological matters such as the method of offloading calculations, cost-benefit
models that help in making the decision to offload or not, how devices mobility is managed, and how
connection protocols are used. End user issues refer to incentives to collaborate, and presentation and
usability issues. Service and application issues include fault-tolerance for meeting availability requirements,
supporting performance at service level, and cloud APIs. Privacy, security and trust issues pertain to general
cloud security, mobile cloud security, and privacy. Context-awareness relates to service provisioning, risk
assessment, identifying potential resources, common activities, and energy awareness. Data management
issues pertain to personal data storage on mobile cloud, data access issues, data portability and
interoperability, and embedded mobile databases.
Khan et al. introduced a graphical representation (architecture) of mobile cloud computing [5]. This
architecture includes two main parts: mobile client and cloud service provider. This cloud must be secured to
ensure security and privacy protection services. In addition, the cloud provides user management, key
management, encryption on demand, intrusion detection, authentication, and authorization services to mobile
users. Moreover, secure routing protocols must be used to protect the communication channel between the
mobile device and the cloud.
Dinh et al. provided also an architecture of mobile cloud computing [32]. This architecture shows
how mobile devices are connected to the mobile networks via base stations (e.g., base transceiver station,
access point, or satellite) establishing and controlling the connection (air links) and functional interfaces
between the devices. Mobile users’ requests and information (e.g., ID and location) are transmitted to the
central processors that are connected to servers providing mobile network services. Mobile network operators
can provide mobile users with services such as authentication, authorization, and accounting based on the
home agent and subscribers’ data stored in databases. The subscribers’ requests are then delivered to a cloud
through the Internet. In the cloud, controllers process the requests to provide mobile users with the
corresponding services. These services are based on the concepts of utility computing, virtualization, and
service-oriented architecture (e.g., web, application, and database servers).
Several frameworks, architectures, and methodologies are implemented to help organizations that
wish to migrate their BI to the cloud. Thus, Verdejo et al. introduced a framework for BI migration to the
cloud [33]. This framework supports a migration based on the requirements of the organizations that wish to
move their BI system to the cloud premises. There are four main modules in this framework: system
modeling module, cloud environments modeling module, migration strategies generators, and migration
strategies. The first two components are modeled according to the migration degree that the organization
adopts for its BI system. Thus, the organization can choose a partial or a total migration to the cloud. In
addition, they can move their BI tools to IaaS or PaaS platforms to leverage the additional scalable resources,
Or to a SaaS solution and use available BI tools. The migration strategies generator contains a security
module and a synchronization module. In order to avoid data from being compromised at the moment of
migration, the security module ensures end-to-end encryption. Some data may not leave the premises of the
BI-user organization, because of the law or political sensitivity, but may be required by BI tools running in
the cloud environment. Through the security module, the elements of these sensitive data are substituted for a
generated token that represents the sensitive or secret data. The synchronization module serves as a bridge
and controls the communication between all framework components. The migration options are stored as
migration strategies.
Baars and Kemper proposed a framework representing the logical structure of cloud BI [34]. This
framework contains two mains components: service composition and service distribution. Both components
are covered by an umbrella which is a general provider. The composition and the distribution must be done
according to the service granularity expected in the contract. There are six scenarii that illustrate the different
service organizations existing in the cloud: i) Add-on services scenario: some components (e.g. a web search
engine) are selected from the cloud to BI infrastructure; ii) Tool replacement scenario: The cloud makes
available a complete tool, for instance a data mart or OLAP tool. This is SaaS (Software as a Service); iii)
Solution provision scenario: The cloud supports a software and hardware remote solution; iv) Business
network scenario: A solution provider acts within a corporate network. The cloud aspect resides in the
abstraction of the physical infrastructure that has become virtual; v) Best-of-breed scenario: The
replacement of the tool is pushed to a higher level to the point where all components of the BI infrastructure
are provided by an external supplier; vi) BI mashup scenario: The BI solution is freely constituted using a
global market space over the Internet.
Kasem et al proposed a blueprint that represents the fundamental organization of BI on the cloud
(architecture) [35]. This architecture shows the minimum elements that the cloud can offer to BI. These
elements are: i) Hardware processing, storage, and networks. ii) Software: the operating systems and drivers
required to handle the hardware. iii) Data integration: the tools performing the ETL and data cleansing
processes. iv) Database: the relational or multidimensional database systems that contain the data. v) Data
warehousing tools: the set of applications that allow the creation and maintenance of the data warehouse. vi)
BI tools: the set of front-end applications that read and analyze data.
Chaudhuri et al. proposed a BI architecture, describing the BI tasks [1]. It is not dedicated to the cloud
and it is classically composed of three parts for respectively data collection and blending, data modeling and
storage, and analytics.
Jun and Jun introduce a set of requirements to implement a decision support system (DSS) for BI in
the cloud [36]. This needs to describe how a decision-making process is articulated. This DSS contains three
basic components: a database, a model base, and a user interface. Thus, it requires: i) A database
management system (DBMS) or a data warehouse that consists of structured, real-life information, such as
customer account records, which provides quantitative analytic information for crucial issues. ii) A model
base management system (MBMS), which contains one or more models supporting the analysis that the
system will perform. The model base reflects the internal nature of large amounts of data, and enables
qualitative analysis to assist decision makers by means of knowledge reasoning. iii) A user interface that
provides the decision maker with feedback.
Gash et al. proposed the procedure to follow step by step for BI migration to the cloud (methodology)
[37]. This procedure includes four steps. The first is the evaluation of the environment. Organizations that
wish to migrate their BI to the cloud must conduct the analysis of the current environment. The second step is
the design of a cloud-based solution. In this step, organizations must design a solution to expose their data to
the cloud provider by web service or secure tunnel. This solution must take into account the amount of data
being transferred, speed of transferring and security concerns on the one hand. On the other hand, they must
work with the cloud provider to design the appropriate structure for reporting. The third step is the solution
building phase. Organizations must work with the cloud provider to implement the integrations required to
expose data to the cloud provider and to create reports to meet the needs uncovered in the evaluation phase.
The fourth step is the support phase. In this step, organizations must not only support everyday operations of
cloud-based environments, but also monitor its usage.
Muriithi and Kotzé introduced another procedure (methodology) for BI migration [38]. This procedure
includes three following steps: i) Situational analysis: this step consists of the current evaluation of an
organization to identify potential opportunities for cloud BI. Potential candidates for migration may be
hardware or software tools across the three layers of BI: data layer (ETL, data warehouse or data mart), logic
layer (e.g. reporting tool, OLAP tool or data mining tool) and access layer (e.g. a portal or a mobile
application). ii) Suitability assessment: in this step, each candidate to migration must be evaluated for cloud
suitability subjects. The evaluation criteria include business value, technical viability, risk exposure, and
organizational impact. iii) Implementation: BI tools that pass the suitability assessment are migrated to the
cloud and their performance will be evaluated to determine how well they meet the needs of the organization.
BI Research also involves taking into account specific aspects such as social media. As an
illustration, Dinter and Lorenz introduced a framework for a Social BI Research Agenda, enabling to guide
the derivation of a social BI research agenda [39]. This is a matrix which crosses two dimensions: social
media characteristics and BI design areas. Social media characteristics are highly dynamic data, high data
volumes, semi-structured or unstructured data, extensive meta-data, unknown data quality, wisdom of the
crowds, user network information, unclear legal situation, and coverage by literature. BI areas considered are
the following: users and customers, products and services, process, data (architecture and development,
security management, quality management, and meta-data management), information and communication
technology (ICT), techniques, governance, and strategy.
Cloud computing raises several issues, such as security. Research on cloud computing also focuses on
security concerns in order to strengthen the security of all resources in the cloud. Ryan suggests an example
to put forward the safety concern when exchanging cloud data [40]. As a real life example, EasyChair and
EDAS systems allow a conference chair to create the conference account in the cloud. They handle all the
necessary administration such as assignment of papers to program committee members, collection and
distribution of reviews and discussion. In addition, these systems produce emails to authors and reviewers
and reports such as acceptance statistics. Cloud providers take responsibility for the data across all
conferences. They are custodians of a huge quantity of data regarding the submission and reviewing behavior
of thousands of researchers, aggregated across multiple conferences. Thus cloud-computing-based
conference management generate privacy concerns. Ultimately, technological solutions which would
provide the data owner with verifiable guarantees that their data remains confidential are required.
5.2. Data collection and blending
Negash proposed a data framework for BI [41]. This framework represents the logical structure to
perform the integration of structured and semi-structured data. It includes three main components: i)
acquisition, integration, and cleanup of structured data; ii) acquisition, integration, and cleanup of semi-
structured data; iii) search, analysis and delivery. This BI framework shows that semi-structured data and
structured data are equally important to help decision makers. Moreover, the processes of acquisition,
cleaning, and integration are required for both structured and semi-structured data.
A cloud data warehouse includes not only organizations’ local data, but also data from other clouds.
Therefore, ETL is also used to exchange data between different clouds. Clay et al. proposed a generic
framework called RHIC (Resource Harvester for Interactive Clouds) [42]. This framework autonomously
optimizes a hybrid cluster running with residual resources. RHIC provides intelligent cluster sizing for a wide
range of throughput-oriented parallel batch workloads. It combines online profiling with periodic job
progress and system resource monitoring.
BI in the cloud currently offers one-way data integration (from user to cloud) via Extract-Transform-
Load (ETL) tools. In [4] Herwig proposed additional functionalities (requirement) in order to enable the ETL
not only to perform integration but also to compute some results and send them to user interfaces. The
interface definition must include the data to be exchanged, the data format, and the communication (protocol
level). Regarding security concerns, only those end-users of the cloud-based application are allowed to see
the report of this application. Before the cloud-based application can request data from the cloud-based BI
solution, it has to authenticate itself.
In [43] Chang et al. proposed a methodology for verifying the integrity and confidentiality of data
throughout the ETL step till storage in the data warehouse. The verification of integrity regarding remote data
contains the followings steps: setup and data upload; authorization for Third-Party Auditor (TPA); integrity
proof; updated data; updated metadata; and verification of updated data. In setup and data upload, the client
will need to prepare verification metadata in order to verify the data without retrieving them. In authorization
for TPA, there are three parties (client, auditor and storage service provider). This step is required when
users need a semi-trusted TPA to verify the data on their behalf. Challenge and verification of data storage is
where the integrity verification has to be fulfilled. Data update is required in dynamic data contexts. In some
cases, the client needs to perform updates to some of the cloud data storage. If the data is stored in blocks of
varying size for efficiency reasons, there will be more types of updates to address. In metadata update, the
client will need to update the verification metadata with the existing keys so that the data storage stay
verifiable without retrieving all the data stored and/or re-running the entire setup phase. In verification of
updated data, the client verifies the data update process in order to see if the updating of both user data and
verification metadata has been performed successfully in order to ensure that the data can still be verified
correctly in the future.
Hyuck et al. proposed an inter-cloud data transmission algorithm that applies a filter each time after
reading data [44]. All data files are uploaded to HDFS (Hadoop Distributed File System). Before
transmission between clouds, data will be filtered. Input data are recognized as sets of tuples, and sent to the
client side applying filters. The client side then receives filtered data.
5.3. Data modeling and storage
Data collected from different sources must be modeled and stored in a data warehouse. The data
warehouse is the central element of BI. BI in the cloud provides three possibilities to implement and manage
a data warehouse. The first occurs when an organization already has a data warehouse and plans to transfer it
to the cloud. The second is to create a data warehouse directly in the cloud and store it in the cloud. Finally,
the third situation is that of an organization that manages its data warehouse on its own servers but solicits
cloud data warehouse tools.
Chi et al. introduced a data structure (system design), called SLA-tree, to support profit-oriented
decisions in cloud computing [45]. This model consists of multiple servers, where queries arrive to the
system dispatcher. The dispatcher sends each incoming query to one of the servers or may reject the query if
admission control is in place. When a query is dispatched to a database server, if the server is busy, the query
becomes part of a buffer of queries waiting to be executed. When the execution of the current query in the
server is completed, the query at the front of the buffer is executed next, or optionally, a scheduler picks a
query from the buffer to be executed next according to certain scheduling policies.
Tapiador et al. proposed a framework that allows the hypercube generation to be easily done in a
MapReduce infrastructure [46]. This framework has been implemented in Java considering the following
features: i) A thin layer on top of Hadoop that allows users or external tools to focus only on the definition of
the hypercubes to compute. ii) Hide the complexity of this novel computing paradigm and the distributed
system on which it runs. Therefore, it provides a way to deal with a cutting-edge distributed system (Hadoop)
without any knowledge of big data internals. iii) Possibility to process many hypercubes in one single scan of
data, taking advantage of Hadoop jobs, thus reducing the time for generating the precomputed statistics
required for each data release. iv) Leverage the capabilities offered by this new computing model so that the
solution is scalable. v) Java generics have been used throughout the framework in order to ease its integration
in any domain.
Tancer and Varde introduce the medical markup language (MML) for storing and analyzing medical
data using cloud services [47]. MML allows quick and easy distribution of medical data over the Web
without requiring conversion from relational formats. The head of an MML document contains two sections:
the clinical document header and the body. The clinical document header holds information about the
document type, origination creation date, healthcare provider information, basic patient information and the
local header. An MML document is a container for medical data to be transferred from one health institution
to another, even if both institutions implement different systems. The cloud is an appropriate solution for
using MML for medical data storage and analytics worldwide.
Organizations that choose to migrate to the cloud can also take advantage of large amounts of data
(big data) contained in the cloud. According to the sensitivity of their data, they will opt for migrating a part
of or their entire data warehouse. The cloud offers virtual spaces that seem unlimited for customers.
Qian et al. provided a cloud computing architecture [48]. This architecture has three layers: resource,
platform, and application. Resource is the infrastructure layer that includes physical and virtualized
computing, storage and networking resources. Platform is the most complex layer that could be split into
many sub-layers, especially a storage sub-layer providing unlimited storage and caching capability. An
application layer supports large and distributed transactions and management of huge volumes of data.
These three layers provide external service through web services or more secured networks.
In order to take advantage of the cloud, a data warehouse must have a structure that matches the cloud
functionalities. To achieve this, in [49], Kaur et al. suggested a cloud data warehouse architecture. This
architecture combines the traditional data warehouse architecture with the description of the various services
provided by the cloud. It identifies different layers that may be hosted in the cloud. The data staging or
inbound layer houses the extraction programmers. They can be hosted in the cloud by initiating the

appropriate data governance model at the data source layer itself. They use the extraction logic to cleanse and
summarize the data. Complete data warehouses can be designed in the cloud with the use of Data as a Service
(DaaS) and simply paying on a “pay-per-use” basis. On-demand servers for storage also provide scalability.
In [50] AbdelBaky et al.introduced an objective-driven architecture called MapReduce-CometCloud.
This architecture allows distributing data chunks to nodes and then pushes computational tasks to the nodes
that contain these chunks in order to achieve the best performance in computing. It includes four MapReduce
components: i) Job submission and monitor provide facilities to read input files through Input Reader. ii)
Mapper that takes a set of data and transforms it into a list of key/value pairs. The Mapper outputs are sorted
and then partitioned per Reducer. Users can optionally specify a combiner to perform local aggregation of the
intermediate outputs, which helps to cut down the amount of data transferred from the Mapper to the
Reducer. iii) Reducer takes the list that resulted from the map function and reduces the list of key/value pairs
based on their key. The number of output is the same as the number of reduce tasks. iv) Output Collector
collects data output by the Mapper or the Reducer (either the intermediate outputs or the output of the job).
In [51] Cao et al. proposed an architecture of a system able to support both data-intensive analytical
operations (OLAP) and online transactions (OLTP). This is an elastic data storage system, which is designed
to support both functionalities within the same storage. There are three major modules in this architecture:
data import control, data access control, and physical storage. The data import control module supports
efficient data bulk-loading from external data sources. The data import control module consists of two sub-
components, namely import manager and write cache. The import manager has separate protocols to
communicate with different data sources. The write cache resides in memory and temporarily buffers the
imported data that are eventually flushed to the physical storage when the write cache is full. The physical
storage module contains three main components: distributed file system (DFS), meta-data catalog and
distributed indexing. The DFS is required when the imported data are actually stored. The meta-data catalog
maintains the meta-information about the tables in the storage. Distributed indexing maintains various
distributed secondary indexes over the data stored in DFS. The data access control module is responsible for
performing data access requests from both OLAP jobs executed by the elastic execution engine and OLTP
requests submitted by end users.
In [52] Arres et al. implemented an architecture for building OLAP cubes in the cloud and an
example illustrating the usefulness of this architecture. The latter is built using the Hive DBMS in a Hadoop
environment. It illustrates the partitioning of the data warehouse on different clusters (nodes), the
construction and the querying of OLAP cubes by users. The implemented example includes two phases: i)
Construction phase of the data warehouse. The latter is implemented using the star schema model of sales
stores. ii) Loading phase and OLAP cube construction. This phase builds a data cube answering a question
requiring multi-level aggregation.
Palanisamy et al. provided a system architecture called CURA for data analytics in the cloud [53].
This architecture creates the best cluster configuration for the jobs using MapReduce. It is composed of the
following components: i) Secure instant VM allocation employs a secure instant VM allocation scheme that
reduces response times for jobs, in contrast to existing MapReduce services that create VMs on demand. ii)
Job Scheduler is faced with the challenge of scheduling jobs among available VM pools while minimizing
global cloud resource usage. Therefore, carefully executing jobs in the best VM type and cluster size among
the available VM pools becomes a crucial factor for performance. The scheduler has knowledge of the
relative performance of the jobs across different cluster configurations from the predictions obtained from the
profile and analysis service. iii) VM Pool Manager deals with the challenge of dynamically managing the
VM pools to help the job scheduler effectively obtain efficient resource allocations. In addition, this
component may perform optimization such as power management by suitably shutting down VMs.
In order to improve more analysis in the cloud, many algorithms are proposed. In [54] Wang et al.
proposed four algorithms for building parallel data cubes based on the MapReduceMerge data processing
system. These algorithms reduce data movement compared to traditional MapReduce, and make the data
storage more efficiently to support the OLAP tasks. In MapReduceMerge, the map function is identical to the
original MapReduce, but there is a difference between the reduce functions. The reduce function of
MapReduceMerge produces a key/value list instead of just values. Each of these algorithms performs a
defined task. The first algorithm (merge control flow) divides the entire key into different partitions which
leads to a Cartesian product between reducers. The second algorithm (k-select) is responsible for matching
reducer and merger and obtaining the best performance tradeoff. The third is the data iterator. This algorithm
is a data process controller. The last algorithm (merge) determines the merge action and the format of results.
In cloud data warehouses, data are distributed to different nodes depending on the availability of
resources. The location of data can change dynamically. A large volume of data requires increasing the
number of nodes and, therefore, increasing the flow of communication messages between nodes. All these
factors increase the use of the bandwidth and possibly degrade performance. To remedy this situation, in
[55], Kurunji et al. proposed an algorithm to process multi-join queries in the cloud and reduce
communication costs. A reference graph is built to help run this algorithm. This reference graph consists of
tables and relationships between the tables of the star schema. The inputs of this algorithm are query and
reference graphs, and the result of the query is the output. In this algorithm, all the tables in the “from” clause
of the query are retrieved and sorted by the corresponding value in the reference graph. Then, the process of
each table predicate starts from the first table of the above sorted order.
In [56] Lee et al. introduced a Resource Planning algorithm for video analytic. This algorithm
provides the best video processing performance under user defined constraints in a resource shared cloud
environment. The inputs of this algorithm consist of the kind of analytic processing that should be performed,
the video dataset, and constraints such as time threshold and maximum cost. Output files in nodes are
downloaded to the video bank or to other nodes for performing computation tasks automatically.
In [57] Abelló et al. provided three algorithms for building cubes with MapReduce. Corporate
historical data are stored in a cloud using BigTable. MapReduce is used as an agile mechanism to deploy
cubes in ad-hoc Data Marts. The first algorithm is called Filtered Source Scan. The inputs of this algorithm
are the names of the BigTable source and measure table, and the output value in this case is just the key in
the source table. The second algorithm is called Indexed Random Access. Its inputs are name of source and
index BigTable, and file containing the slicers. Its output is a data cube. The third algorithm is called Indexed
Partial Scan. Its inputs are name of source and index BigTable, and file containing the slicers. The output is
a data cube. This third algorithm is a mix of the two others. The aim is to use the index but avoid random
access to the source.
In [58] Hua et al. introduced an aggregate query algorithm in R-tree structure. The inputs of this
algorithm are dimensional attributes and the outputs are aggregate cells. This algorithm is an on-line ranking-
based (top-k) aggregate query which can return top-k query results. It creates sorted lists for ranking cuboids
and then initializes these sorted lists by scanning materialized cuboids into memory.
5.4. Analytics
The analytics step uses the data stored in the data warehouse to perform analysis. There are two
possibilities for BI in the cloud: cloud can provide analytical tools as SaaS or organizations can perform
themselves their analysis in the cloud using PaaS.
In [59] Chang proposed a new concept called BIaaS (Business Intelligence as a Service). It is a type of
SaaS which focuses on how the application offers quality services in cloud environments. BIaaS is a Cloud
based service designed to improve the accuracy and quality of both pricing and risk analysis in financial
markets, compared with traditional desktop technologies. Chang suggested functionalities for BIaaS
(requirement). With the advent of cloud computing, it becomes important to implement models and methods
to improve BI tasks in order to perform accurate and fast simulations. Requirements for BIaaS are based on
reputable models, compute and track volatility, accuracy, and diversity. Regarding the reputable models,
BIaaS adopts reputable models including the Heston Model and visualization APIs to compute the best
pricing and risks for different scenarios. Moreover, BIaaS can track the movement of volatility that can help
investors to make better judgment for investment when prices are high and volatility is low. Regarding
accuracy, BIaaS can compute pricing and risk values to several decimal places and also calculate their mean,
lower and upper range to get results that are as accurate as possible. Regarding diversity, BIaaS should not
just limit its operations on desktop or a particular platform, but extend to different types of clouds.
In [60] Chen et al. proposed a new concept called CaaaS (Continuous analytics as a Service),
dedicated to real-time analytics. More and more applications are dependent on analytics results in real time
events. CaaaS is a cloud computing model enabling convenient, on-demand network access to a shared pool
of event analytics results. The support of CaaaS is characterized by the following: i) a unified query model
over both stored relations and dynamic streaming data, and techniques to extend query engines to support the
unified model; ii) the “table-ring” mechanism which allows the infinite analytics results to be kept in a list of
small-sized tables based on time sequence, and staged through “switching labels” without actual data copying
and moving; iii) CaaaS is scaled out with multiple engines cooperating based on the common data chunking
criterion, on both parallel database and network distributed Map-Reduce infrastructures.
This third stage of BI provides all the data analysis capabilities and supports the distribution of
knowledge relevant to different users. The essential elements of this layer are reporting tools, data mining
and OLAP (On-Line Analysis Processing). OLAP is based primarily on exploration operations. Given this,
several models, methods and tools are implemented for data analysis in the cloud.
Yantao et al. introduced a MapReduce-based online aggregation system (an architecture and
implemented system) called COLA [61]. The architecture contains four modules: User Interface, Query
Engine, Online Aggregation Executor, and Data Manager. i) User Interface: this module provides interactive
and flexible interfaces, users can issue SQL queries or submit MapReduce program via a shell interface. ii)
Query Engine: this module is responsible for compiling the SQL query into a directed acyclic graph of
MapReduce jobs, and translating the non-OLAP jobs into an online version. iii) Online Aggregation
Executor: this module is the key module of COLA performing the online query processing algorithm over
MapReduce. It processes the sample data, produces approximate answers with their associated confidence
intervals and progressively refines the answers. iv) Data Manager: this module makes use of HDFS to store
and manage data. It stores metadata such as mappings between tables and HDFS directories in the Metadata
manager that can be used to perform query optimization and compilation in the SQL2MR Translator. The
implemented tool provides progressive approximate aggregates for single tables and for multiple joined
tables with novel techniques supporting incremental and continuous computing of aggregation, and
minimizing the waiting time.
Brezany et al. proposed an architecture and a tool (implemented system) to maintain the elastic OLAP
cloud platform [62]. This system provides dynamic provision and extension by utilizing the virtualization of
cloud computing platforms such as Amazon EC2. The architecture of the platform consists of several
services and brokers utilized to manage and assign free virtual cube servers and cube host resources. The
platform involves the resources, described as follows: i) Virtual cube server is a container which can manage
one or more virtual cubes. ii) Host cube is the physical storage and computational resource in which
multidimensional data arrays are stored and OLAP queries processed. iii) Virtual cube broker is responsible
for managing free virtual cube servers. When a client requests a virtual cube server, it should first ask the
broker and the broker then assigns a suitable free virtual cube server to the client. Cube host broker aims to
manage free cube host resources.
In [63] [64] Al-Aqrabi et al. proposed the BI and OLAP framework which allows multiple OLAP
application servers applying parallel query loads on an array of servers hosting relational databases. This
framework has seven components: i) a user interface layer that contains a large library of dashboards for
graphical reporting; ii) a layer for data analytics that contains different scenarios, reports, stored queries and
data models; iii) a layer for storing the OLAP cubes formed by multi-dimensional data extraction from the
data layer (the data warehouses); iv) a data integration layer for identification, cleaning, organizing and
grouping of data extracted from the data warehouses before the cubes are formed; v) a data layer comprising
the data warehouses; vi) a layer for acquiring data from the business processing, decision support and
transactional databases used by various functions of the organization; vii) a layer comprising the IT
infrastructure components and related resources (data processing, storage, and networking).
Wlodarczyk et al. proposed a framework for designing and deploying cloud-based data analytic
systems [65]. This framework is based on Hadoop and uses the Web Ontology Language (OWL). It is
composed of four layers: knowledge, deployment, processing, and data. The knowledge layer provides
several ontologies to completely specify the functionality of a Hadoop-based system described using the task-
method decomposition technique. In the deployment layer, several specialized processes are used to control
both the deployment of the system on the cloud and its monitoring. In the processing layer, the DataStorm
framework is explained using a simple algorithm. Its goal is to show how to use basic ontological elements
introduced in the Knowledge Layer. The Data layer contains data of different formats.
Chaisiri et al. proposed a framework called CODA (Cloud-Oriented Data Analytics) [66]. This
framework includes functions for composing, managing, and processing workflows for big data analytics in
cloud computing. This framework contains four layers: workflow client, workflow management, tools and
services, and computing resource. The workflow client layer provides the environment where the users
compose workflows through workflow composers. A workflow composer prepares tasks (i.e., reusable
software components) and each task performs a specific function i.e., reading the data stored in an Excel file,
clustering the data with the k-means method, and writing the result to a file. This framework can support
different workflow composers e.g., RapidMiner, Taverna, and JOpera. The workflow management layer
provides main functions to support the execution of data analytics workflows: Scheduler, monitoring,
security, data locality, provisioning, workflow recommender, and visualizer. The tools services layer
provides the programming tools (or frameworks) and reusable services for creating an executable code of
tasks (i.e., software component) that can be used in the workflow composition. The computing resource
layer provides computational platforms that host executable codes of tasks.
Soumya et al. proposed an architecture to be deployed in analytical processing based on OLAP tools
in a cloud computing environment [67]. This architecture deals with issues such as data warehouse creation,
dispatching of data in distributed data centers and materialized view creation. It contains two main modules:
ETL and analyzer. ETL is an important module to create the OLAP data servers and to take care of a large
number of activities such as data collection, data cleaning, data loading, and data blending. The Analyzer
Module ensures faster processing of data. The diverse queries of clients are analyzed through the Query
Analyzer. There are already a number of techniques to analyze the users’ queries or requirements. Based on
the result of the analysis, the materialized views are formed, thanks to the Materialized View Generator
module.
Patel et al. proposed an architecture and a tool called P2RAC (implemented system) for data analytics
in the cloud [68]. This architecture allows the analyst to perform a simulation or an optimization job. This
system comprises three components: core tools, diagnostic tools and configuration files. The core tools
provide the functionalities for cluster management, data management and execution management of a task on
the Amazon cloud. Regarding diagnostic tools, the P2RAC currently offers two tools, which are used for
listing the clusters created by the analyst on the Amazon cloud and for accessing the master instance of a
cluster respectively. Configuration files include three files that support the core and diagnostic tools which
reside on the analyst site.
Lian and Li Da proposed a taxonomy of algorithms for data mining [69]. The purpose of this
taxonomy is to introduce the fundamental methods to decision makers, and let them choose the proper
method for their data mining applications. This taxonomy contains two major groups: supervised learning
methods and unsupervised learning methods. The supervised learning methods for building a model to
predict a specified unknown attribute according to the observed attributes. They can be used for nominal
prediction, while only neural networks, regression models, and the nearest neighbor method can be used for
numeric prediction. The supervised learning methods include the following algorithms: i) Decision Tree; ii)
Bayesian Statistics; iii) Neural Network; iv) Support Vector Machine; v) Regression; vi) Nearest Neighbor.
The Unsupervised learning methods for extracting patterns, such as clusters, process graphs, and correlated
items from data. With respect to supervised learning, more accurate prediction is the golden goal. The
unsupervised learning methods include itemset mining and clustering. This taxonomy is not specific to BI on
the cloud, but all these data mining algorithms may be used on the cloud.
Talia proposed Data Mining Cloud Framework’s graphical programming interface [70]. This
framework includes the following components: i) a set of binary and text data containers (Azure blobs) used
to store data to be mined (input datasets) and the results of data mining tasks (data mining models); ii) a task
queue that contains the data mining tasks to be executed; iii) a task status table that keeps information about
the status of all tasks; iv) a pool of k workers, where k is the number of virtual servers available, in charge of
executing the data mining tasks submitted by the users; v) a website that allows users to submit, monitor the
execution, and access the results of data mining tasks. This workflow-based data mining framework runs on
cloud platforms and uses a service-oriented approach. It offers a flexible programming model, distributed
task interoperability, and execution scalability that reduces data analytics completion time.
In [71][84] Goncalves et al. introduced a tool called AWARD (Autonomic Workflow Activities
Reconfigurable and Dynamic) which allows more flexibility according to the application characteristics
(implemented system). This tool proposes four activities: split, mapper, merger, and reducer. The Split
activity gets the size of the input file and calculates the file offsets of each split to be processed by mappers.
The Mapper activity invokes the map function for each data record extracted from the input split and the map
function stores key/value pairs by invoking the method collect of the MRcollector argument. The Merger
activity produces a tuple space identified in parameters with an ordered partition of keys. The Reducer
activity produces a tuple space identified in parameters with the final key/value pairs, whose values are
reduced using multithreading.
Chohan et al provided a tool (implemented system) [72]. This tool allows combining the scale of
Google App Engine (GAE) with the flexibility of customizable offline data analytics. The Task Queue API
facilitates the use of multiple, independent user defined queues, each with a rate limit of 100 tasks per second
in GAE. A task consists of an URL application, which is called by the system upon task queue. This tool
considers two approaches to data synchronization: bulk and incremental data transfer. For bulk transfer,
GAE currently provides tools as part of its software development kit (SDK) to upload and download data into
and out of the GAE data store. AppScale is extended with similar functionality. Incremental transfer
implements an asynchronous URL Fetch call to the AppScale analytics cloud for the application upon each
destructive update. If this call fails, the GAE and AppScale replicas will be inconsistent until the next time
the same entity is updated.
Barga et al proposed an architecture and a tool (implemented system) for a scalable runtime optimized
of data analytics in the cloud [73]. The architecture is composed by two Windows Azure worker roles: master
and slave. For a given deployment, there will be a single instance of the master and any number of slave
instances depending on the deployment configuration. Similar to other MapReduce runtimes, the master
performs the scheduling of applications and tasks and handling failures, whereas the slaves simply execute
Map and Reduce tasks assigned to them by the master. The communications between master and slaves and
between slaves happen directly via TCP connections. This tool called Daytona is a highly optimized iterative
MapReduce runtime designed for the cloud.
Mian et al. implemented a framework to solve the problem of provisioning resources in a public cloud
[74]. This framework is composed of two main modules: a provisioner and a scheduler. The provisioner
takes a description of the workload from the client as input. The description includes the set of query types,
the frequencies of each type, the data partition, and the required service level objective (SLO) for each query
class. The Scheduler accepts requests from application clients and directs requests to the appropriate VMs
based on the query class of the request. The Scheduler can be replicated as needed to ensure that scheduling
does not become a bottleneck.
Yuan and Herbert proposed a framework for pervasive healthcare that tries to change the healthcare
delivery model [75]: from doctor-centric to patient-centric, from acute reactive to continuous preventive,
from sampling to monitoring. On the cloud server, blob storage, multiple queues and worker roles are
deployed for the purpose of analyzing users’ activity data and producing the best classification model for
each user. According to this model, this framework consists of five types of queues: data queue, result
queue, register queue, task queue, and model queue. i) Data queue is a general queue and is used to
communicate between the client and the controller node. ii) Result queue: When the most suitable model is
selected by the allocated worker role (Evaluation Node), the URL of the best model is added to that user’s
Result Queue. Unlike the Data Queue which is unique and all the users have access to it, one Result Queue is
independently created for each individual and doesn’t provide public access. iii) Register queue: It is used to
transfer the information of a new user. Once a new user is registered, the system assigns him/her a dedicated
Result Queue and a blob container. iv) Task queue: In order to make all worker roles start building models in
parallel, there should be separate queues. The queues are dedicated to each of the worker roles. v) Model
queue: Once the model of each classifier is retrained and evaluated, the evaluation result will be sent to the
evaluation node in the model queue.
Shanks et al. suggested a framework for understanding business analytics technology and capabilities
that can bring better performance to organizations [76]. This framework contains three components: business
analytics resources, value creating action, and firm performance. The business analytics resources
component includes business analytics capabilities allowing to identify opportunities. The value creating
action component evaluates these opportunities. Finally, this value-creating action may generate firm
performance.
Leimeister et al proposed a business process model (system design) for a generic value network of
cloud computing [77]. This model is created by providing services that are valuable for other participants of
the network. It describes the interactions between different business partners to jointly develop and
manufacture a product or service. The manufacturing process is decomposed into its strategically relevant
activities, thus determining how competitive advantages can be achieved. Competitive advantages are
achieved by fulfilling the strategically important activities cheaper or better than the competition. The
different partners considered in this business process are the following: customer, service provider,
infrastructure provider, aggregate services provider, and platform provider.
Gatzioura et al focuses on implementation of a business model process (system design) and a tool
(implemented system) for incorporating business intelligence in cloud marketplaces [78]. Based on the
individual requirements and using profile of each particular cloud customer, this system allows answering the
question: “Which offering should I buy”? The user enters his business parameters of interest (which may be
availability, security level, price, reliability, product rate, with or without quality assurance, eco-friendliness)
and imposes threshold values on them (minimum, maximum or equal), which delimit the possible final
solutions’ set.
Aceto et al. proposed a taxonomy of the main aspects of cloud monitoring [79]. This taxonomy
consists of four aspects: basic concepts, properties, need for monitoring, and open issues. The basic concepts
include a number of concepts at the basis of cloud monitoring that are used to set the context such as: layers,
abstraction levels and metrics. Regarding the properties, in order to operate properly, a distributed monitoring
system is required to have several properties including scalability, elasticity, adaptability, accuracy, and
availability. The need for monitoring is a task of paramount importance for both Providers and Consumers.
On the one side, it is a key tool for controlling and managing hardware and software infrastructures; on the
other side, it provides information and Key Performance Indicators (KPIs) for both platforms and
applications. It includes several activities such as: capacity and resource planning, capacity and resource
management, data center management, service level agreement (SLA) management, billing, performance
management, and security management. Regarding open issues and future directions, the infrastructure of a
cloud is very complex, requiring more effort for management and monitoring. The greater scalability and
larger size of clouds compared to traditional service hosting infrastructures involve more complex monitoring
systems, which therefore have to be more scalable, robust and fast. Such systems must be able to manage and
verify a large number of resources and must do it effectively and efficiently. It must also be able to quickly
spot and report performance impairments or other issues, to ensure timely interventions such as the allocation
of new resources.
Demirkan and Delen introduced an architecture of service oriented decision support system (DSS) on
the cloud [80]. This architecture is composed of three modules: data service, information service, and
analytics service. Data-as-a-service began with the notion that data quality could happen in a centralized
place, cleansing and enriching data and offering it to different systems, applications or users, irrespective of
where they were in the organization, computers or on the network. Information-as-a-Service is a
comprehensive strategy for the delivery of information obtained from information services, following a
consistent approach using SOA infrastructure and/or internet standards. The concept of analytics-as-a-service
(AaaS) referred to agile analytics. It is a comprehensive strategy for the delivery of information obtained
from information services, following a consistent approach using SOA infrastructure and/or Internet
standards.
Kowalczyk et al proposed a framework that combines a selection of process outcomes, as well as
process characteristics that are considered as relevant in managerial decision process research [81]. The
framework considers the following decision process phases: identification, development and selection, and
focus on the following attributes for each of the three phases: i) Information quality: One of the major
benefits of business intelligence and analytics (BI&A) systems is the provision of accurate, high-quality
information which is easily accessible. ii) Comprehensiveness and procedural rationality: In managerial
decision process research, procedural rationality describes the level of reliance upon analysis of information
in decision making and comprehensiveness characterizes the extent to which analysis is exhaustive within the
decision process. iii) Speed: Time savings are another major benefit that is proposed to be realized by BI&A
systems. iv) Phase outcomes: The final decision is not the only result, within a decision process. Each phase
produces results, which can be analyzed with respect to their quality and quantity. v) Decision result: The
decision result is the outcome of the overall process. vi) Total decision speed: The total decision speed
characterizes duration of the overall decision process, which is expected to be reduced.
As in the other stages of BI, security remains a major challenge to be addressed in analyzing data
Subashini and Kavitha introduced a process model (framework) for security in the cloud [82]. This model
contains three layers: lower, higher and middle. The lower layer represents the different deployment models
of the cloud, namely private, community, public and hybrid cloud deployment models. The higher layer
represents the different delivery models that are utilized within a particular deployment model. These
delivery models are the SaaS, PaaS and IaaS. These delivery models form the core of the cloud and they
exhibit certain characteristics like on-demand self-service, multi-tenancy, ubiquitous network, measured
service and rapid elasticity which are shown in the top layer . The middle layer describes security. The
fundamental elements of the cloud require security which depends and varies with respect to the deployment
model that is used, the way by which it is delivered and the character it exhibits. Some of the fundamental
security challenges are data storage security, data transmission security, application security, and security
related to third-party resources. This involves the use of strong network traffic encryption techniques such as
Secure Socket Layer (SSL) and Transport Layer Security (TLS) for security.
Ng et al introduced architecture and design principles (requirement) for a system that enables secure
and privacy preserving data analytics services in the cloud [83]. This architecture includes five main
components: security manager, stream manager, Qos (Quality of Service) controller, privacy controller, and
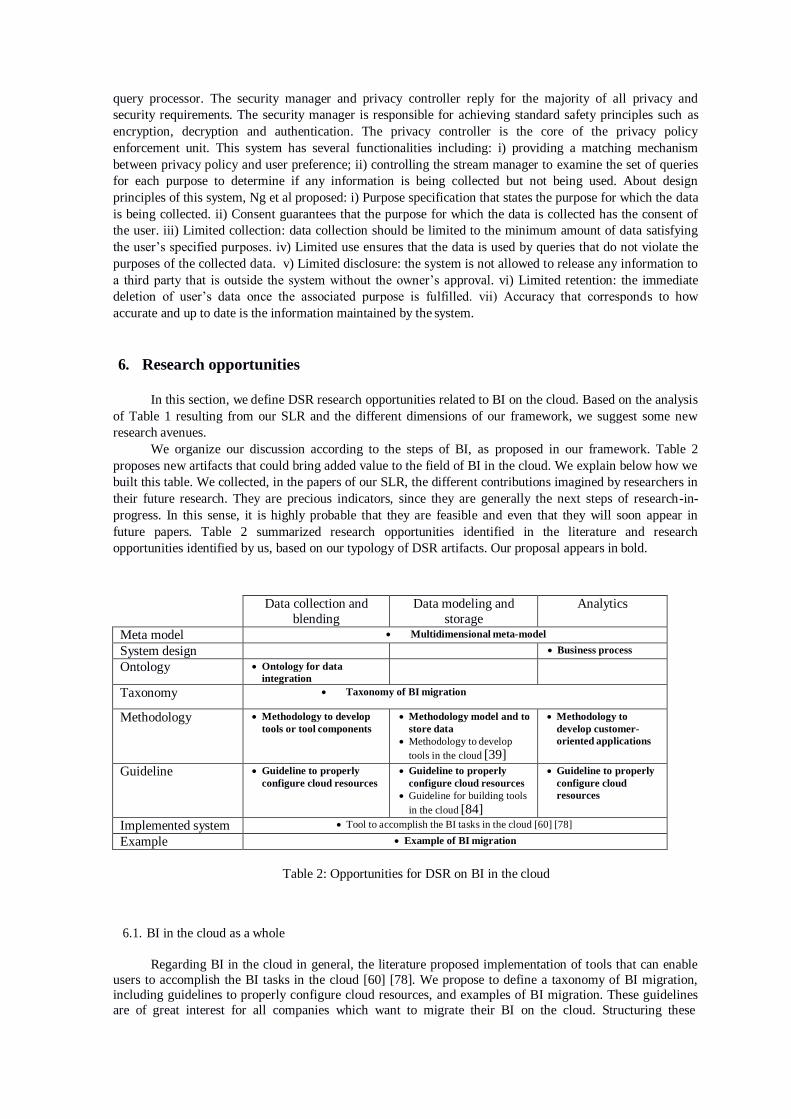
query processor. The security manager and privacy controller reply for the majority of all privacy and
security requirements. The security manager is responsible for achieving standard safety principles such as
encryption, decryption and authentication. The privacy controller is the core of the privacy policy
enforcement unit. This system has several functionalities including: i) providing a matching mechanism
between privacy policy and user preference; ii) controlling the stream manager to examine the set of queries
for each purpose to determine if any information is being collected but not being used. About design
principles of this system, Ng et al proposed: i) Purpose specification that states the purpose for which the data
is being collected. ii) Consent guarantees that the purpose for which the data is collected has the consent of
the user. iii) Limited collection: data collection should be limited to the minimum amount of data satisfying
the user’s specified purposes. iv) Limited use ensures that the data is used by queries that do not violate the
purposes of the collected data. v) Limited disclosure: the system is not allowed to release any information to
a third party that is outside the system without the owner’s approval. vi) Limited retention: the immediate
deletion of user’s data once the associated purpose is fulfilled. vii) Accuracy that corresponds to how
accurate and up to date is the information maintained by the system.
6. Research opportunities
In this section, we define DSR research opportunities related to BI on the cloud. Based on the analysis
of Table 1 resulting from our SLR and the different dimensions of our framework, we suggest some new
research avenues.
We organize our discussion according to the steps of BI, as proposed in our framework. Table 2
proposes new artifacts that could bring added value to the field of BI in the cloud. We explain below how we
built this table. We collected, in the papers of our SLR, the different contributions imagined by researchers in
their future research. They are precious indicators, since they are generally the next steps of research-in-
progress. In this sense, it is highly probable that they are feasible and even that they will soon appear in
future papers. Table 2 summarized research opportunities identified in the literature and research
opportunities identified by us, based on our typology of DSR artifacts. Our proposal appears in bold.
Data collection and
blending
Data modeling and
storage
Analytics
Meta model Multidimensional meta-model
System design Business process
Ontology Ontology for data
integration
Taxonomy Taxonomy of BI migration
Methodology Methodology to develop
tools or tool components
Methodology model and to
store data
Methodology to develop
tools in the cloud [39]
Methodology to
develop customer-
oriented applications
Guideline Guideline to properly
configure cloud resources
Guideline to properly
configure cloud resources
Guideline for building tools
in the cloud [84]
Guideline to properly
configure cloud
resources
Implemented system Tool to accomplish the BI tasks in the cloud [60] [78]
Example Example of BI migration
Table 2: Opportunities for DSR on BI in the cloud
6.1. BI in the cloud as a whole
Regarding BI in the cloud in general, the literature proposed implementation of tools that can enable
users to accomplish the BI tasks in the cloud [60] [78]. We propose to define a taxonomy of BI migration, including guidelines to properly configure cloud resources, and examples of BI migration. These guidelines
are of great interest for all companies which want to migrate their BI on the cloud. Structuring these
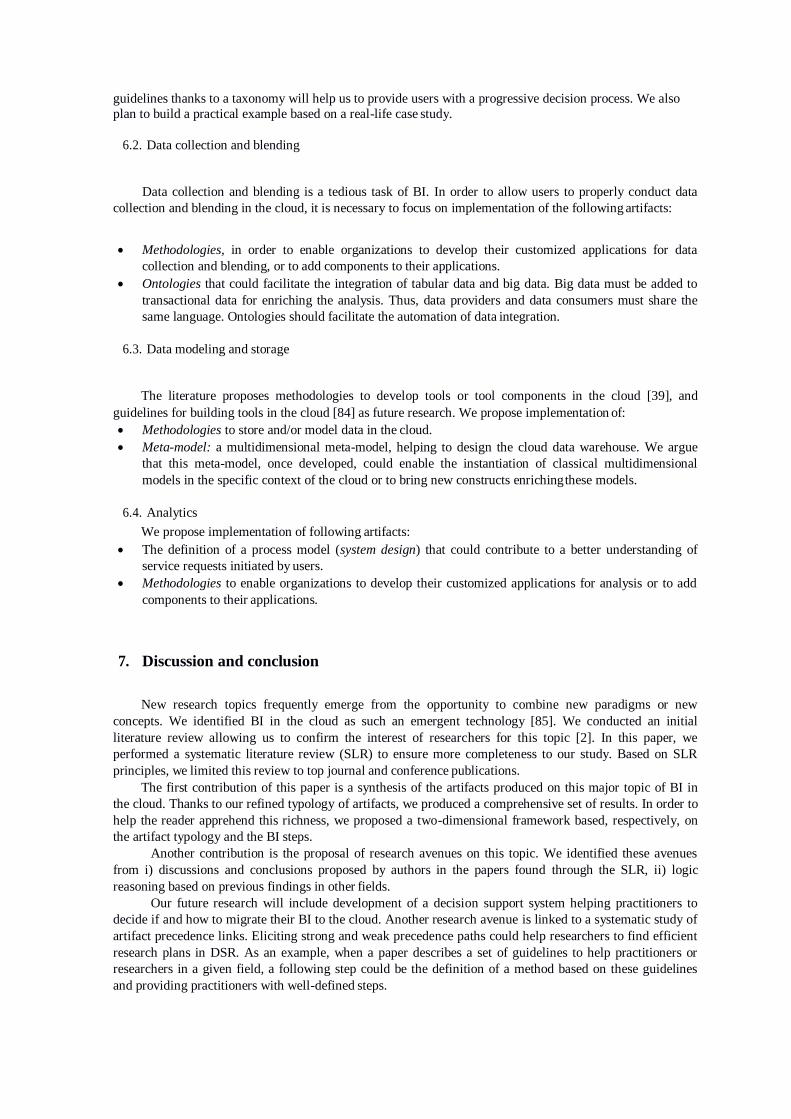
guidelines thanks to a taxonomy will help us to provide users with a progressive decision process. We also
plan to build a practical example based on a real-life case study.
6.2. Data collection and blending
Data collection and blending is a tedious task of BI. In order to allow users to properly conduct data
collection and blending in the cloud, it is necessary to focus on implementation of the following artifacts:
Methodologies, in order to enable organizations to develop their customized applications for data
collection and blending, or to add components to their applications.
Ontologies that could facilitate the integration of tabular data and big data. Big data must be added to
transactional data for enriching the analysis. Thus, data providers and data consumers must share the
same language. Ontologies should facilitate the automation of data integration.
6.3. Data modeling and storage
The literature proposes methodologies to develop tools or tool components in the cloud [39], and
guidelines for building tools in the cloud [84] as future research. We propose implementation of:
Methodologies to store and/or model data in the cloud.
Meta-model: a multidimensional meta-model, helping to design the cloud data warehouse. We argue
that this meta-model, once developed, could enable the instantiation of classical multidimensional
models in the specific context of the cloud or to bring new constructs enriching these models.
6.4. Analytics
We propose implementation of following artifacts:
The definition of a process model (system design) that could contribute to a better understanding of
service requests initiated by users.
Methodologies to enable organizations to develop their customized applications for analysis or to add
components to their applications.
7. Discussion and conclusion
New research topics frequently emerge from the opportunity to combine new paradigms or new
concepts. We identified BI in the cloud as such an emergent technology [85]. We conducted an initial
literature review allowing us to confirm the interest of researchers for this topic [2]. In this paper, we
performed a systematic literature review (SLR) to ensure more completeness to our study. Based on SLR
principles, we limited this review to top journal and conference publications.
The first contribution of this paper is a synthesis of the artifacts produced on this major topic of BI in
the cloud. Thanks to our refined typology of artifacts, we produced a comprehensive set of results. In order to
help the reader apprehend this richness, we proposed a two-dimensional framework based, respectively, on
the artifact typology and the BI steps.
Another contribution is the proposal of research avenues on this topic. We identified these avenues
from i) discussions and conclusions proposed by authors in the papers found through the SLR, ii) logic
reasoning based on previous findings in other fields.
Our future research will include development of a decision support system helping practitioners to
decide if and how to migrate their BI to the cloud. Another research avenue is linked to a systematic study of
artifact precedence links. Eliciting strong and weak precedence paths could help researchers to find efficient
research plans in DSR. As an example, when a paper describes a set of guidelines to help practitioners or
researchers in a given field, a following step could be the definition of a method based on these guidelines
and providing practitioners with well-defined steps.
Besides, we agree that our SLR suffers from some limitations. The false positives have been discarded
by our screening step. But, by only performing search by keywords, we may miss some important
publications. Moreover, we could not check if all artifacts were really specific or if some papers just adapted
previous artifacts to make them available in the viewpoint of BI on the cloud. Conducting again the same
SLR in a few months will also help us to measure the productivity of research in this field and check if BI in
the cloud is really a new topic.
Acknowledgements. We thank the reviewers for their helpful comments as well as MoBiD 2014 program
committee members that have enabled us to improve our paper.
8. References
[1] S. Chaudhuri, U. Dayal, V. Narasayya, An overview of business intelligence technology, Commun. ACM.
54 (2011) 88–98. [2] O. Sangupamba Mwilu, N. Prat, I. Comyn-Wattiau, Business Intelligence and Big Data in the Cloud:
Opportunities for Design-Science Researchers. Advances in Conceptual Modeling - Proceedings of ER
2014 workshops. Atlanta, GA, USA, pp.75-84, (2014).
[3] IDC, IDC Cloud, (n.d.). http://www.idc.com/prodserv/FourPillars/mobility/index.jsp. [4] V. Herwig, Business intelligence as a service for Cloud-based applications, in: Intell. Data Acquis. Adv.
Comput. Syst. IDAACS 2013 IEEE 7th Int. Conf. On, IEEE, 2013: pp. 188–192. [5] A.N. Khan,
M.L. Mat Kiah, S.U. Khan, S.A. Madani, Towards secure mobile cloud computing: A survey, Future
Gener. Comput. Syst. 29 (2013) 1278–1299.
[6] A.R. Hevner, S. Ram, S.T. March, J. Park, Design Science in Information Systems Research, MIS Q. 28
(2004) 75–105.
[7] S.T. March, G.F. Smith, Design and Natural Science Research on Information Technology, Decis. Support
Syst. 15 (1995) 251–266.
[8] H. Chen, R.H. Chiang, V.C. Storey, Business Intelligence and Analytics: From Big Data to Big Impact.,
MIS Q. 36 (2012) 1165–1188.
[9] H. Yang, M. Tate, Where are we at with cloud computing?: a descriptive literature review, in: 20th Australas. Conf. Inf. Syst. Melb., 2009: pp. 2–4.
[10] H.A. Simon, The sciences of the artificial, 3. ed., [Nachdr.], MIT Press, Cambridge, Mass., 2008.
[11] P.B. Goes, Design Science Research in Top Information Systems Journals, MIS Q. (2014) iii–viii.
[12] S. Gregor, D. Jones, The anatomy of a design theory, J. Assoc. Inf. Syst. 8 (2007) 312–335.
[13] P. Offermann, S. Blom, M. Schönherr, U. Bub, Artifact types in information systems design science–a
literature review, in: Glob. Perspect. Des. Sci. Res., Springer, 2010: pp. 77–92. [14] B. Kitchenham,
P. Brereton, A systematic review of systematic review process research in software engineering, (2013)
2049–2075.
[15] F. Rowe, What literature review is not: diversity, boundaries and recommendations, Eur. J. Inf. Syst. 23
(2014) 241–255.
[16] https://www.google.be/webhp?sourceid=chrome-instant&ion=1&espv=2&ie=UTF-
8#q=ERA+2012+%3A+journal+ranking+list, (2012).
[17] https://www.google.be/webhp?sourceid=chrome-instant&ion=1&espv=2&ie=UTF-
8#q=ERA+2012+:+conference+ranking+list, (2012). [18] T. Davenport, J. Harris, Competing on analytics, harvard business review 84 (2006) 98-107
[19] M. Minelli, M. Chambers, A. Dhiraj, Big data, big analytics – Emerging business intelligence for today’s businesses, (2013).
[20] S. Edwards, L. Lavagno, E.A. Lee, A. Sangiovanni-Vincentelli, Design of embedded systems: Formal
models, validation, and synthesis, in hardware/software co-design (2001) 86
[21] T.R. Gruber, Toward principles for the design of ontologies used for knowledge sharing?, Int. J. Hum.-
Comput. Stud. 43 (1995) 907–928.
[22] R.C. Nickerson, U. Varshney, J. Muntermann, A method for taxonomy development and its application in
information systems, Eur. J. Inf. Syst. 22 (2013) 336–359.
[23] CIO Council, Federal enterprise architecture framework,
https://www.whitehouse.gov/sites/default/files/omb/assets/egov_docs/fea_v2.pdf (1999). [24] D.E.R. Denning, Information warfare and security, (1999).
http://vxheaven.org/lib/pdf/Information%20warfare%20and%20security.pdf.
[25] M. Jarke, P. Loucopoulos, K. Lyytinen, J. Mylopoulos, W. Robinson, The brave new world of design
requirements, Inf. Syst. 36 (2011) 992–1008.
[26] J.F. Nunamaker Jr, R.O. Briggs, R.H.S. Gert-Jan De Vreede Jr, Special Issue: Enhancing Organizations’
Intellectual Bandwidth: The Quest for Fast and Effective Value Creation, J. Manag. Inf. Syst. 17 (2000) 3–
8.
[27] O. Hanseth, K. Lyytinen, Design theory for dynamic complexity in information infrastructures: the case of
building internet, J. Inf. Technol. 25 (2010) 1–19.
[28] E. Kornyshova, R. Deneckère, C. Salinesi, Method chunks selection by multicriteria techniques: an
extension of the assembly-based approach, in: Situational Method Eng. Fundam. Exp., Springer, 2007: pp. [29] S. Purao, V. Vaishnavi, Product metrics for object-oriented systems, ACM Comput. Surv. CSUR. 35
(2003) 191–221.
[30] N. Prat, I. Comyn-Wattiau, J. Akoka, « A taxonomy of evaluation methods for information systems
artifacts », accepted for publication in the Journal of Management Information Systems
[31] N. Fernando, S.W. Loke, W. Rahayu, Mobile cloud computing: A survey, Future Gener. Comput. Syst. 29
(2013) 84–106.
[32] H.T. Dinh, C. Lee, D. Niyato, P. Wang, A survey of mobile cloud computing: architecture, applications,
and approaches: A survey of mobile cloud computing, Wirel. Commun. Mob. Comput. 13 (2013) 1587–
1611. doi:10.1002/wcm.1203.
[33] A. Juan-Verdejo, B. Surajbali, H. Baars, H.-G. Kemper, Moving Business Intelligence to cloud
environments, in: Comput. Commun. Workshop INFOCOM WKSHPS 2014 IEEE Conf. On, IEEE, 2014:
[34] H. Baars, H.-G. Kemper, Business intelligence in the cloud?, In : Communication Software and Networks (ICCSN), 2011 IEEE 3rd International Conference on. IEEE, 2011. p. 650-655.
[35] M. Kasem, E.E. Hassanein, Cloud Business Intelligence Survey, (2014). [36] L. Jun, W. Jun, Cloud Computing Based Solution to Decision Making, Procedia Eng. 15 (2011) 1822–
1826. doi:10.1016/j.proeng.2011.08.339.
[37] D. Gash, T. Ariyachandra, M. Frolick, Looking to the Clouds for Business Intelligence, J. Internet
Commer. 10 (2011) 261–269.
[38] G.M. Muriithi, J.E. Kotzé, A conceptual framework for delivering cost effective business intelligence
solutions as a service, in: ACM Press, 2013: p. 96.
[39] B. Dinter, A. Lorenz, Social Business Intelligence: a Literature Review and Research Agenda,
Proceedings of the 33rd ICIS (2012).
[40] M.D. Ryan, Cloud computing security: The scientific challenge, and a survey of solutions, J. Syst. Softw. 86 (2013) 2263–2268.
[41] S. Negash, Business intelligence, Commun. Assoc. Inf. Syst. 13 (2004) 54. [42] R.B. Clay, Z. Shen, X. Ma, Accelerating Batch Analytics with Residual Resources from Interactive
Clouds, in: IEEE, 2013: pp. 414–423. [43] C. Liu, C. Yang, X. Zhang, J. Chen, External integrity
verification for outsourced big data in cloud and IoT: A big picture, Future Gener. Comput. Syst. (2014).
[44] H. Han, Y.C. Lee, S. Choi, H.Y. Yeom, A.Y. Zomaya, Cloud-Aware processing of MapReduce-based
OLAP applications, in: Proc. Elev. Australas. Symp. Parallel Distrib. Comput.-Vol. 140, Australian
Computer Society, Inc., 2013: pp. 31–38. [45] Y. Chi, H.J. Moon, H. Hacigümüş, J. Tatemura, SLA-tree: a
framework for efficiently supporting SLA-based decisions in cloud computing, in: Proc. 14th Int. Conf. Extending Database Technol., ACM, 2011: pp. 129–140..
[46] D. Tapiador, W. O’Mullane, A.G.A. Brown, X. Luri, E. Huedo, P. Osuna, A framework for building
hypercubes using MapReduce, Comput. Phys. Commun. 185 (2014) 1429–1438.
[47] J. Tancer, A.S. Varde, The Deployment of MML for Data Analytics over the Cloud, in: IEEE, 2011: pp.
188–195. [48] L. Qian, Z. Luo, Y. Du, L. Guo, Cloud computing: An overview, in: Cloud Comput.,
Springer, 2009: pp. 626–631. h [49] H. Kaur, P. Agrawal, A. Dhiman, Visualizing Clouds on Different Stages of DWH-An Introduction to
Data Warehouse as a Service, in: Comput. Sci. ICCS 2012 Int. Conf. On, IEEE, 2012: pp. 356–359.
[50] M. AbdelBaky, H. Kim, I. Rodero, M. Parashar, Accelerating MapReduce Analytics Using CometCloud, in: IEEE, 2012: pp. 447–454..
[51] Y. Cao, C. Chen, F. Guo, D. Jiang, Y. Lin, B.C. Ooi, et al., Es 2: A cloud data storage system for
supporting both oltp and olap, in: Data Eng. ICDE 2011 IEEE 27th Int. Conf. On, IEEE, 2011: pp. 291–
302.
[52] B. Arres, N. Kabbachi, O. Boussaid, Building OLAP cubes on a Cloud Computing environment with
MapReduce, in: Comput. Syst. Appl. AICCSA 2013 ACS Int. Conf. On, IEEE, 2013: pp. 1–5.
[53] B. Palanisamy, A. Singh, L. Liu, & B. Langston, Cura: A Cost-optimized Model for MapReduce in a
cloud, in: 'IPDPS', IEEE Computer Society, (2013) , pp. 1275-1286 .
[54] Y. Wang, A. Song, J. Luo, A MapReduceMerge-based Data Cube Construction Method, in: IEEE, 2010: pp. 1–6. [55] S. Kurunji, T. Ge, B. Liu, C.X. Chen, Communication cost optimization for cloud
Data Warehouse queries., in: CloudCom, Citeseer, 2012: pp. 512–519. [56] J. Lee, T. Feng, W. Shi,
A. Bedagkar-Gala, S.K. Shah, H. Yoshida, Towards Quality Aware Collaborative Video Analytic Cloud,
in: IEEE, 2012: pp. 147–154.
[57] A. Abelló, J. Ferrarons, O. Romero, Building cubes with MapReduce, in: Proc. ACM 14th Int. Workshop
Data Warehous. OLAP, ACM, 2011: pp. 17–24. [58] Y. Hua, X. Liu, H. Jiang, ANTELOPE: A
Semantic-Aware Data Cube Scheme for Cloud Data Center Networks, IEEE Trans. Comput. 63 (2014)
2146–2159. [59] V. Chang, The business intelligence as a service in the cloud, Future Gener. Comput.
Syst. 37 (2014) 512–534.
[60] Q. Chen, M. Hsu, H. Zeller, Experience in Continuous analytics as a Service (CaaaS), in: Proc. 14th Int.
Conf. Extending Database Technol., ACM, 2011: pp. 509–514. [61] G. Yantao, M. Xiaofeng, S.
Yingjie, COLA: A Cloud-Based System for Online Aggregation, in: Data Engineering (ICDE), 29th International Conference on. IEEE, 2013. p. 1368-1371.
[62] P. Brezany, Y. Zhang, I. Janciak, P. Chen, S. Ye, An Elastic OLAP Cloud Platform, in: IEEE, 2011: pp.
356–363.
[63] H. Al-Aqrabi, L. Liu, R. Hill, N. Antonopoulos, Cloud BI: Future of business intelligence in the Cloud, J.
Comput. Syst. Sci. 81 (2015) 85–96.
[64] H. Al-Aqrabi, L. Liu, R. Hill, N. Antonopoulos, Taking the Business Intelligence to the Clouds, in: IEEE,
2012: pp. 953–958.
[65] T.W. Wlodarczyk, C. Rong, B. Jia, L. Cocanu, C.I. Nyulas, M.A. Musen, DataStorm An Ontology-Driven
Framework for Cloud-Based Data Analytic Systems, in: IEEE, 2010: pp. 123–127.
[66] S. Chaisiri, Z. Bong, C. Lee, B.-S. Lee, P. Sessomboon, T. Saisillapee, et al., Workflow framework to
support data analytics in cloud computing, in: Cloud Comput. Technol. Sci. CloudCom 2012 IEEE 4th Int. Conf. On, IEEE, 2012: pp. 610–613 [67] S. Soumya, D. Debabrata, C. Nabendu, An Architecture to
Maintain Materialized View in Cloud Computing Environment for OLAP Processing, ICCS 2012 Int.
Conf. pp.360,365, 14-15 Sept. 2012
[68] I. Patel, A. Rau-Chaplin, B. Varghese, A Platform for Parallel R-based Analytics on Cloud Infrastructure,
in: Parallel Process. Workshop ICPPW 2012 41st Int. Conf. On, IEEE, 2012: pp. 188–193.
[69] D. Lian, X. Li Da, Business intelligence for enterprise systems: a surve, 8 (2012) 679–687.
[70] D. Talia, Toward Cloud-Based Big Data Analytics, Computer. 46, 5, p. 98-101. (2013).
[71] C. Goncalves, L. Assuncao, J.C. Cunha, Data analytics in the cloud with flexible MapReduce workflows.,
in: CloudCom, Citeseer, 2012: pp. 427–434. [72] N. Chohan, A. Gupta, C. Bunch, K. Prakasam, C.
Krintz, Hybrid Cloud support for large scale analytics and web processing, in: Proc. 3rd USENIX Conf.
Web Appl. Dev., USENIX Association, 2012: pp. 4–4. [73] R.S. Barga, J. Ekanayake, W. Lu, Project
Daytona: Data Analytics as a Cloud Service, in: IEEE, 2012: pp. 1317–1320.
[74] R. Mian, P. Martin, J.L. Vazquez-Poletti, Provisioning data analytic workloads in a cloud, Future Gener.
Comput. Syst. 29 (2013) 1452–1458. [75] B. Yuan, J. Herbert, A Cloud-Based Mobile Data Analytics Framework: Case Study of Activity
Recognition Using Smartphone, in: Mob. Cloud Comput. Serv. Eng. MobileCloud 2014 2nd IEEE Int.
[76] G. Shanks, R. Sharma, P. Seddon, P. Reynolds, The impact of strategy and maturity on business analytics
and firm performance: a review and research agenda, in: Proc 21st Australas. Conf. Inf. Syst., 2010.
[77] S. Leimeister, M. Böhm, C. Riedl, H. Krcmar, The Business Perspective of Cloud Computing: Actors,
Roles and Value Networks., in: ECIS, 2010.
[78] A. Gatzioura, A.Menychtas, V.Moulos & T. Varvarigou, Incorporating Business Intelligence in Cloud
Marketplaces, In: Parallel and Distributed Processing with Applications (ISPA), 2012 IEEE 10th
International Symposium on. IEEE, 2012. p. 466-472. [79] G. Aceto, A. Botta, W. de Donato, A.
Pescapè, Cloud monitoring: A survey, Comput. Netw. 57 (2013) 2093–2115.
[80] H. Demirkan, D. Delen, Leveraging the capabilities of service-oriented decision support systems: Putting analytics and big data in cloud, Decis. Support Syst. 55 (2013) 412–421. [81] M. Kowalczyk, P.
Buxmann, J. Besier, Investigating Business Intelligence And Analytics From A Decision Process
Perspective: A Structured, (2013).
[82] S. Subashini, V. Kavitha, A survey on security issues in service delivery models of cloud computing, J.
Netw. Comput. Appl. 34 (2011) 1–11.

[83] W.S. Ng, M. Kirchberg, S. Bressan, K.-L. Tan, Towards a privacy-aware stream data management system for cloud applications,
Int. J. Web Grid Serv. 7 (2011) 246–267. [84] M.D. Assunção, R.N. Calheiros, S. Bianchi, M.A.S. Netto, R. Buyya, Big Data computing and clouds: Trends and future
directions, J. Parallel Distrib. Comput. (2014).
[85] O. Sangupamba Mwilu, N. Prat, I. Comyn-Wattiau, Taxonomy development for complex emerging technologies – The case of
Business Intelligence and Analytics On the cloud, in PACIS: 2015.