designing, commissioning and monitoring of 40% scale
TRANSCRIPT
WM2014 Conference, March 2 – 6, 2014, Phoenix, Arizona, USA
Designing, Commissioning and Monitoring of 40% Scale Bentonite Buffer Test – 14260
Harri Kivikoski*, Pieti Marjavaara* and Pasi Rantamäki** * VTT Technical Research Centre of Finland, Espoo, Finland
** Posiva Oy, Eurajoki, Finland
ABSTRACT
A 40% scale bentonite buffer tests was commissioned to simulate geological disposal of nuclear waste according to the current reference design concept adopted in Finland. Two experimental vertical holes with a diameter of 800 mm were drilled into the tunnel floor at the testing place located 140 m underground. The depth of both of the holes was about 3 m and the distance between the holes was 4 m. Bentonite buffer blocks and a heating canister simulating nuclear waste were installed in the holes with monitoring equipment. During the test program one hole was artificially wetted. Thermocouples, relative humidity transducers, total and pore pressure sensors, displacement and force transducers were installed to monitor the system behavior. The bentonite buffer blocks were instrumented and preassembled to stacks in VTT’s laboratory and were then transported to the test site in Posiva’s underground rock characterization facility (ONKALO) in Olkiluoto.
The building of the test setup succeeded well. The heating system simulating nuclear waste has worked without any issues. However, in the monitoring system after two years of testing 30% of sensors were out of order. The main reason for brake down of the sensors has been the leaking of water along and inside cables. All the monitoring and data acquisition systems were controlled by using custom made programs.
The outcomes of the project are being used for designing of the future full- scale demonstration tests which will be carried out deeper in the same test site in ONKALO.
INTRODUCTION
The main purposes of the 40% scale buffer tests were to perform tests at medium-scale and to learn how to plan and build the demonstrations and instrumentations for demanding underground repository conditions. The goal of the first phase tests was to get information about the early phase processes in the bentonite buffer. The early phase processes include distribution of the heat, the rate of saturation from the gap to the middle of the buffer block, the effect of watering, the possible piping and erosion, the swelling and the buffer uplifting.
ONKALO is Posiva’s Underground Rock Characterization Facility for rock characterisation for the final disposal of spent nuclear fuel in Finland. Two experimental holes with a diameter of 800 mm were drilled at the test site. The depth of both of the test holes is about 3 meters and the distance between the holes is 4 meters. The surface temperature of the dummy canister simulating nuclear waste was planned to be +90 °C. The needed heating power of the canisters was pre-analysed to be 900 W. The duration of the test was planned to last a minimum of two years but it can be continued if necessary and deemed beneficial by Posiva Oy.
DESIGNING
The geotechnical design of the 40% scale buffer test was identical to Posiva’s current reference buffer design [1], as described for the construction application that was submitted in December
1
WM2014 Conference, March 2 – 6, 2014, Phoenix, Arizona, USA
2012. The buffer test construction preparation work took approximately 4 months, with emplacement of the components and start of the test in October 2011. During the test program one hole was artificially wetted, while the other was subjected only to water inflow from fissures the surrounding rock. The bentonite buffer blocks were manufactured by the isostatic compression method. The used compression pressure was 120 MPa and the used bentonite raw material was MX-80. The average bulk density of the blocks was 2094 kg/m3 and the average water content was 17.6%. The gap between the rock surface and the bentonite blocks was on average 38 mm and the gap between the bentonite blocks and the canister was 7 mm. The outer gap was filled with pillow-shaped MX-80-bentonite pellets and the estimated bulk density of the pellet filling was calculated to be 1075 kg/m3.
The piston system above the bentonite blocks was adjustable so that there was a possibility to allow ±50 mm vertical displacement of the bentonite buffer blocks. The pistons were designed to be dense enough to withstand the high swelling pressure of 5 MPa and also strong enough to endure the uplifting force of 2.8 MN coming from the swelling of the bentonite.
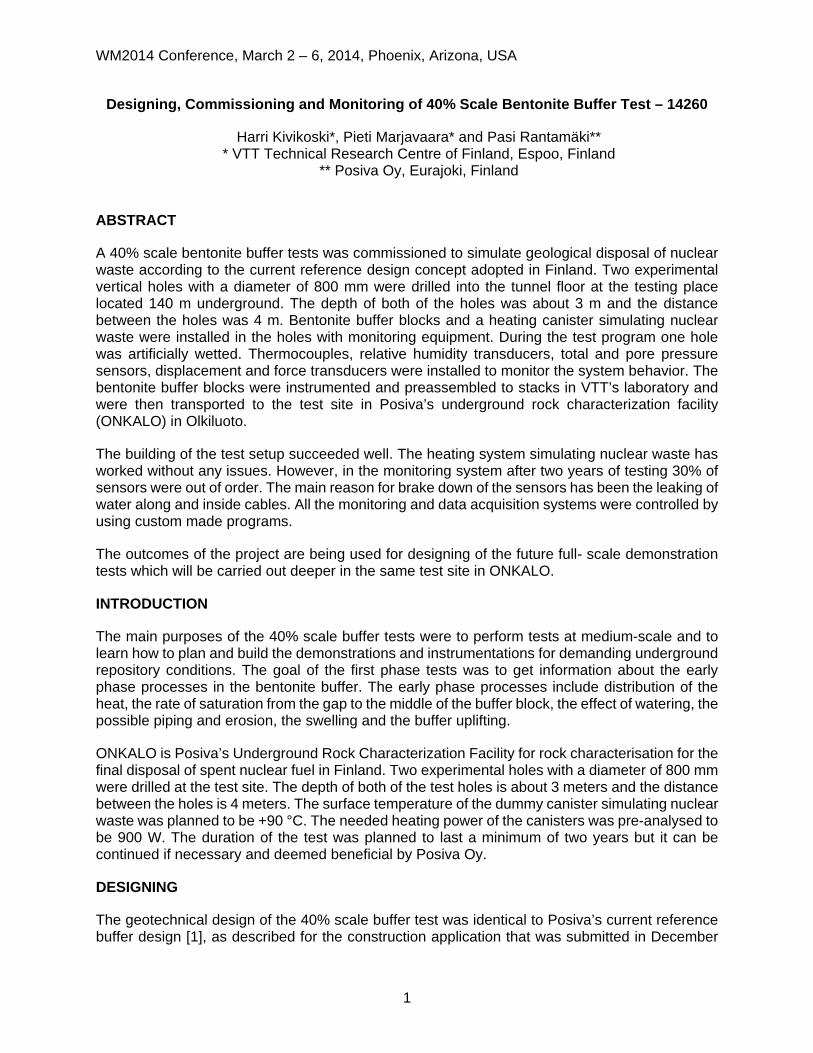
The surface temperature of the canister was planned to be controlled to +90 °C. The needed heating power of the canisters was analyzed by thermal behavior modeling to be 900 W. The structure of the canister is presented on Fig. 1. The tubes inside the canister were used for the instrumentation and cabling.
The design criterion was that the swelling pressure against the canister will be less than 5 MPa. The structural mechanical design for the compression pressure of 5 MPa lead to a wall thickness of 12 mm stainless steel for the outer casing of the canister. The outer diameter of the canister was 462 mm and the top part, “pipe”, of the canister was made of a hollow stainless steel tube with a diameter of 114 mm and a wall thickness of 4 mm.
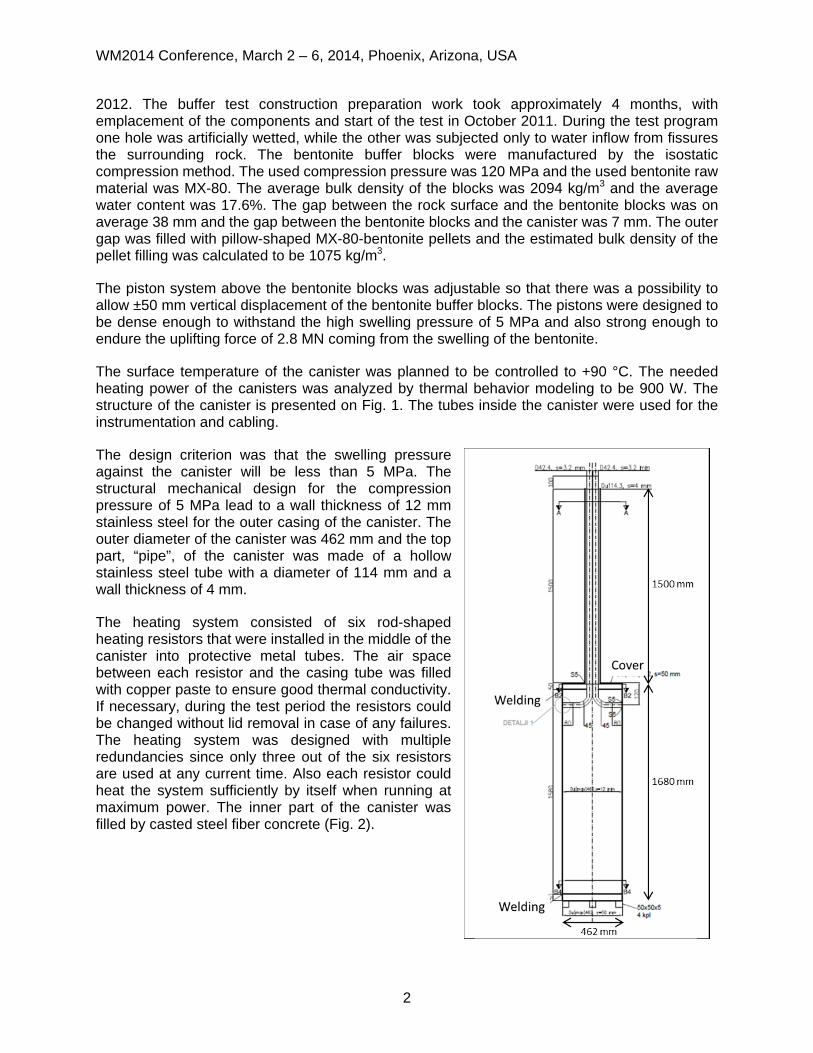
The heating system consisted of six rod-shaped heating resistors that were installed in the middle of the canister into protective metal tubes. The air space between each resistor and the casing tube was filled with copper paste to ensure good thermal conductivity. If necessary, during the test period the resistors could be changed without lid removal in case of any failures. The heating system was designed with multiple redundancies since only three out of the six resistors are used at any current time. Also each resistor could heat the system sufficiently by itself when running at maximum power. The inner part of the canister was filled by casted steel fiber concrete (Fig. 2).
2
WM2014 Conference, March 2 – 6, 2014, Phoenix, Arizona, USA
Fig. 1. The structure of the test canister.
Fig. 2. The cross section of the test canister.
COMMISSIONING
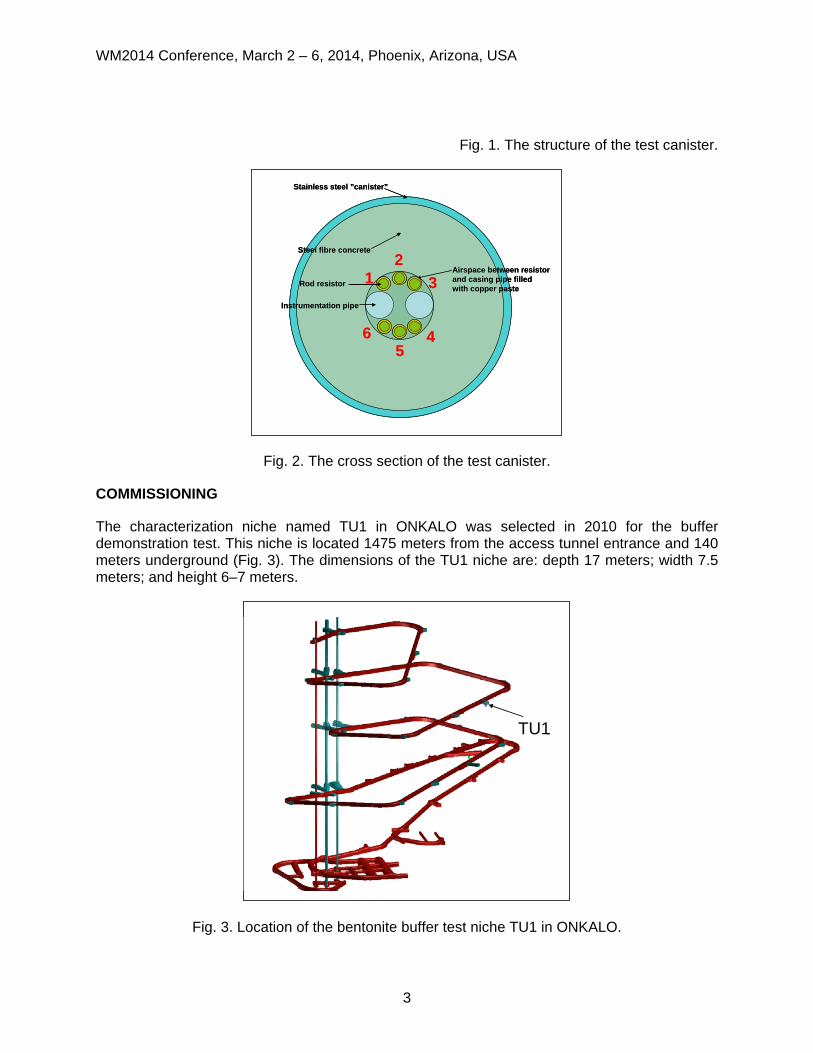
The characterization niche named TU1 in ONKALO was selected in 2010 for the buffer demonstration test. This niche is located 1475 meters from the access tunnel entrance and 140 meters underground (Fig. 3). The dimensions of the TU1 niche are: depth 17 meters; width 7.5 meters; and height 6–7 meters.
Fig. 3. Location of the bentonite buffer test niche TU1 in ONKALO.
12
3
45
6
Stainless steel ”canister”
Instrumentation pipe
Airspace between resistorand casing pipe filledwith copper paste
Steel fibre concrete
Rod resistor 12
3
45
6
Stainless steel ”canister”
Instrumentation pipe
Airspace between resistorand casing pipe filledwith copper paste
Steel fibre concrete
Rod resistor
TU1TU1
3

WM2014 Conference, March 2 – 6, 2014, Phoenix, Arizona, USA
Two experimental holes were drilled into the rock at the selected characterization niche. The diameter of each hole was 800 mm, the depth was about 3.0 meters and the distance between holes was 4 meters (Fig. 4). The dimensions of the holes were chosen by two main criteria. The first demand was that the size should be at least one third of the full-scale dimensions and the second criteria was that the hole should be large enough to allow a person to work in it. Also the available drilling machinery gave some limits to the diameter selection possibilities. The chosen depth and diameter dimensions are roughly 40% of the current the full-scale dimensions of 7.8 meters depth and 1.75 meters diameter.
Fig. 4. Drilling of the first demonstration hole.
The drilling of the holes started with an over-coring cutter with an outside diameter of 800 mm and the height of 600 mm. The resulting rock core was then broken up by first drilling into it with smaller 300 mm drilling cutters and then using a hydraulic jack to break it up in smaller rock pieces. All rock pieces were removed and the aforementioned process was then repeated for the next 600 mm deep section. Upon completion the actual shape and dimensions of both test holes were measured by laser scanning.
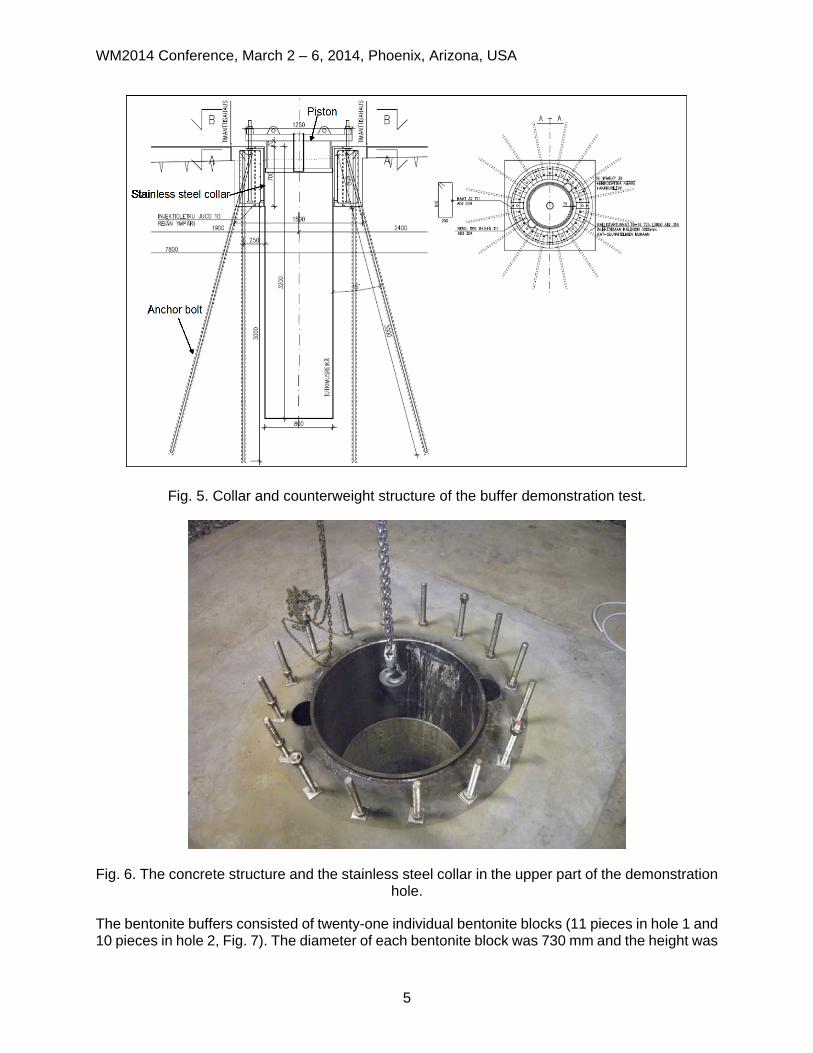
The thickness of the Excavation Disturbance Zone (EDZ) around the test holes was between 500–700 mm, including a few large cracks. The stability of the upper parts of the test holes was secured with anchor bolts into the rock, a concrete structure and stainless steel collars (Fig. 5). A stainless steel collar was placed against the rock wall in the upper part of the hole to ensure tightness and isolation of the test hole. The depth of the collar was 700 mm and it was about the same thickness as the broken EDZ-zone. The thickness of the collar steel wall was 15 mm (Fig. 6).
4
WM2014 Conference, March 2 – 6, 2014, Phoenix, Arizona, USA
Fig. 5. Collar and counterweight structure of the buffer demonstration test.
Fig. 6. The concrete structure and the stainless steel collar in the upper part of the demonstration hole.
The bentonite buffers consisted of twenty-one individual bentonite blocks (11 pieces in hole 1 and 10 pieces in hole 2, Fig. 7). The diameter of each bentonite block was 730 mm and the height was
5

WM2014 Conference, March 2 – 6, 2014, Phoenix, Arizona, USA
280 mm, except for one block in hole 1 which was made in two parts of 200 mm and 80 mm in height, respectively. The gap between the rock surface and the bentonite blocks was on average 38 mm (varying in the range of 15–65 mm) and the gap between the bentonite blocks and the canister was 7 mm. The outer gap was filled with pillow shaped roller compacted bentonite pellets.
Fig. 7. The dimensions of the test holes, the buffer blocks, the gaps and the canister (in red).
The materials for the buffer systems were preassembled in a laboratory, prior to their use in ONKALO. The instrumentation work included drilling small holes through the bentonite blocks for the installation of the sensors and the cables, including sensors to instrumentation tubes and rock holes. The bentonite blocks were then instrumented so that the vertical holes were first drilled to the bentonite to host sensors and channels were then drilled or cut to the bentonite for cables (Fig. 8). The empty spaces around sensors and cables were then filled with bentonite powder.
To fasten the instrumentation to the rock, four stainless steel instrumentation tubes were built to be used as the mounting and housing system for sensors. Total pressure sensors, relative humidity sensors, K-type temperature sensors and water nozzles were fitted to the front faces of the instrumentation tubes. Also the cables from the bottom of the hole containing pore pressure and total pressure sensors were led through the same instrumentation tubes up to the surface tunnel. These instrumentation tubes were installed into the vertical, rock cored, sampling holes, which had been drilled adjacent to the experimental holes. After the installation of the tubes these holes were filled with low-pH grout.
6

WM2014 Conference, March 2 – 6, 2014, Phoenix, Arizona, USA
Fig. 8. The cutting and routing work of the bentonite block for the instrumentation.
The assembled and instrumented bentonite block stacks were transported 270 km from VTT Technical Research Center’s laboratories to ONKALO by a large 3-axis truck trailer. The bentonite blocks were wrapped with thin plastic foil and the entire load was then protected with a thicker plastic tarpaulin to minimize any possible moisture changes in the bentonite blocks during the transportation (Fig. 9).
Fig. 9. Bentonite block stacks in protection tent and stacks installed in trailer for transport.
The final installation of the bentonite block stacks was done in October 2011 by using a chain jigger fixed to the ceiling of the tunnel to hang the stack and then lowering it into its place (Fig. 10).
7
WM2014 Conference, March 2 – 6, 2014, Phoenix, Arizona, USA
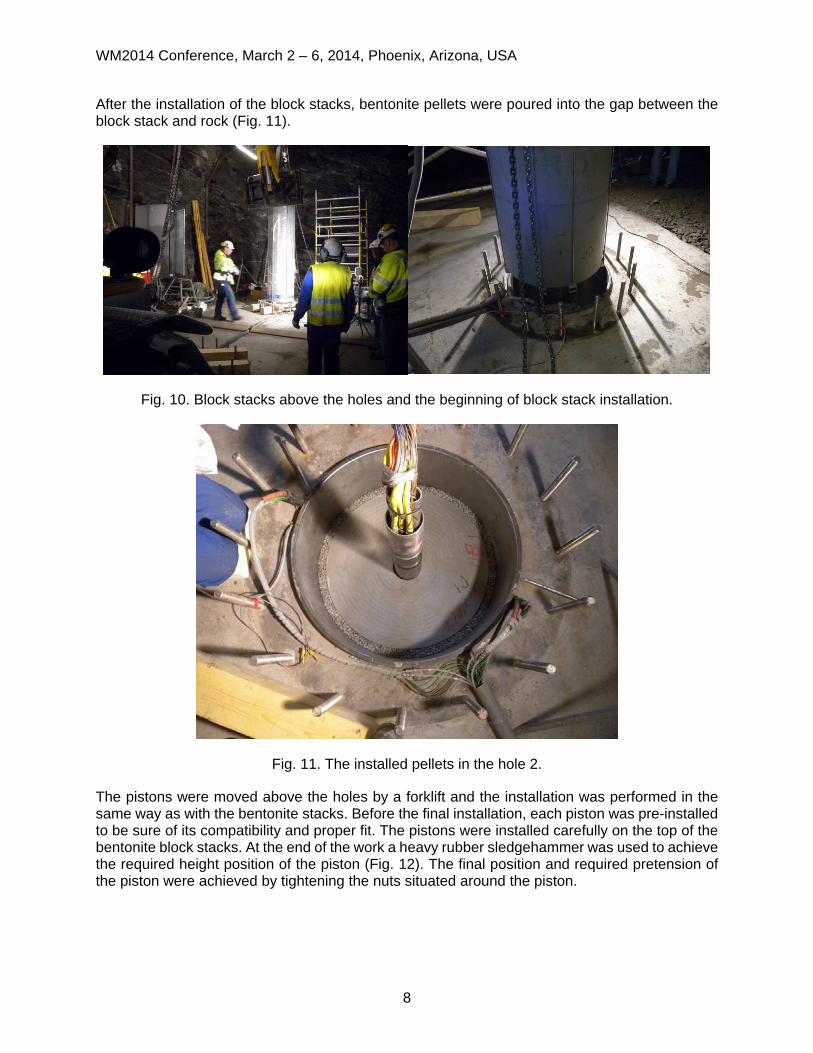
After the installation of the block stacks, bentonite pellets were poured into the gap between the block stack and rock (Fig. 11).
Fig. 10. Block stacks above the holes and the beginning of block stack installation.
Fig. 11. The installed pellets in the hole 2.
The pistons were moved above the holes by a forklift and the installation was performed in the same way as with the bentonite stacks. Before the final installation, each piston was pre-installed to be sure of its compatibility and proper fit. The pistons were installed carefully on the top of the bentonite block stacks. At the end of the work a heavy rubber sledgehammer was used to achieve the required height position of the piston (Fig. 12). The final position and required pretension of the piston were achieved by tightening the nuts situated around the piston.
8

WM2014 Conference, March 2 – 6, 2014, Phoenix, Arizona, USA
Fig. 12. Installation of piston and adjusting by rubber sledgehammer.
The heating elements of the canisters were turned on in November 2011. The temperature of the canister was raised up stepwise.
The artificial watering of the buffer test in hole 1 started in the middle of November 2011. One of the two holes was wetted with marked salinity water (TDS in the range of 10–12 g/l). A tracer compound, fluoresceine (250 µg/l), was used to mark the water to distinguish it from natural flows. Most of the watering was done at a flow rate of 8–10 litres per minute, while the pressure was monitored to be about 360 kPa. A total of 100 litres of water was injected into the hole during the first wetting phase. The second phase had dosing pumps driving water to the system until it had enough moisture to reach the saturated state. During the first phase of water pumping, the water level was monitored with a digital endoscope which was found to be a suitable piece of equipment and that performed well for this task.
MONITORING
The duration of the 40% scale buffer test was planned to have continuous monitoring for at least two years, in order to obtain valuable data supporting initial and early stage performance assessments. The following measurements were made in each test hole:
• The temperature was measured at 30 points (+ six points in the rock between the holes); • The total pressure was measured at 10 points,
o pore water pressure at one point, and o relative humidity at eight points,
• The axial force was measured at four points, and • Displacements was measured at one point.
The temperature readings were also measured by all relative humidity sensors and some pressure sensors. The data acquisition system included three separate loggers from different manufacturers.
All data acquisition systems were controlled by using a customized LabView program. The data from the test were collected to the measuring computer and sent from ONKALO over Ethernet to the server aboveground. The measuring computer makes local measurement files where the data are recorded in one-minute intervals. From these files a summary file is generated and retrieved
9
WM2014 Conference, March 2 – 6, 2014, Phoenix, Arizona, USA
hourly to the research result database system, which also makes automatic back-ups of the recorded data. The data are then re-processed and several graphs are drawn automatically.
CONCLUSIONS
The 40% scale bentonite buffer test has been on-going for over two years. The building of the test setup succeeded well although it was challenging to work inside an 800 mm diameter experimental hole in underground conditions. The nuclear waste simulating heating system has worked without any problems. However, in the monitoring system after two years of testing 30% of sensors were out of order. The main reason for the brake down of the sensors has been the leaking of water along or inside the cables. The manufacturers’ description of the level of sensor protection was not accurate enough for these challenging conditions. Some pressure sensors have failed because of the chosen installation method. Also in some cases the contact of the sealing compound and cablings has not been watertight. Disturbances were also caused by on-going ONKALO construction and excavation works.
The outcomes of the project are being used for designing of the near future full-scale demonstration tests which will be carried out in Posiva’s ONKALO URL. The results can also be used by other nuclear waste organizations when designing and implementing in-situ performance tests and monitoring programs.
REFERENCES
1. Juvankoski, M., Ikonen, K., and Jalonen, T. ”Buffer Production Line 2012. Design, Production and Initial State of the Buffer.” Posiva Report 2012-17. Posiva Oy (2012).
ACKNOWLEDGEMENTS
This work was commissioned by Posiva Oy, an expert organisation responsible for the final disposal of spent nuclear fuel of the owners. Posiva is owned by Teollisuuden Voima Oyj and Fortum Power & Heat Oy. Posiva is responsible for research into the final disposal of spent nuclear fuel of the owners as well as for the construction, operation and eventual decommissioning and dismantling of the final disposal facility.
10