designing for pedestrians: a level-of-service concept
TRANSCRIPT

DESIGNING FOR PEDESTRIANS: A LEVEL-OF-SERVICE CONCEPT John J. Fruin, The Port of New York Authority
Pedestrian facilities should be designed on the basis of qualitative as well as quantitative factors. Present procedures involve the use of maximum capacity ratings for design. The capacity of a pedestrian traffic stream invariably occurs at the heaviest concentrations combined with restricted walking speeds. This condition is not representative of a comfortable human environment. Time-lapse photography studies make it possible to establish the relationship between volume, speed, and human convenience at different pedestrian concentrations. The studies form the basis for six levels of service for the design of walkways and stairways. These levels of service provide a qualitative method of designing new or evaluating existing pedestrian environments.
•THE design of pedestrian facilities involves the application of traffic engineering principles combined with consideration of human convenience and the design environment. Different environments logically require the application of different qualitative as well as quantitative design standards. The design rationale for shopping areas would not apply to transportation terminals, and it follows that airport terminal standards would not apply directly to rapid transit facilities. Each area has its own traffic patterns, physical restraints, and individual environmental requirements.
The Traffic Engineering Handbook (1 ), the most authoritative reference on pedestrian design, provides a series of capacity ratings for walkways and stairways based on cordon counts made at several locations. In each case the capacity of the section under heavy pedestrian flow is reported; however, there is no evaluation of human convenience associated with these capacity ratings. Traffic engineers recognize the principle that maximum capacity of a traffic stream occurs in the region of maximum density. When this principle is related to pedestrian flow, it can be seen that maximum capacity volumes are attained only when there is a dense crowding of pedestrians. Crowding significantly reduces pedestrian convenience because normal walking speeds are restricted and the freedom to maneuver in the traffic stream is limited. Because human convenience is one of the primary considerations in environmental design, design standards for pedestrians must be based on a relative scale to provide the desired design environment.
LEVEL OF SERVICE FOR PEDESTRIANS
The level -of- s ervice concept for highway design contained in the Highway Capacity Manual (2) offer s a model approach to the des ign of pedes t r ian ways as well. The manual descnbes six levels of des ign r anging from A to F based on service volumes, volume/ capacity ratio, and a qualitative evaluation of driver convenience. Included in this evaluation is the individual freedom to choose desired vehicle operating speed, the ability to overtake and pass other vehicles, and the freedom to change lanes.
Pedestrian level-of-service standards similarly should be based on the freedom to select desired walking speed, the ability to bypass slower moving pedestrians, the ease
Sponsored by Committee on Pedestrians and presented at the 50th Annual Meeting .
1

2
of crossing, and the presence of reverse flows at various traffic concentrations. These standards would provide a basis for qualitative as well as quantitative design. The data required to define relative levels of convenience of pedestrians have been difficult to collect with normal field survey procedures; therefore few observations of this type have been made . However, time-lapse photography techniques make possible the collection of large amounts of data that can subsequently be analyzed in great detail. These data provide the means for a more definitive evaluation of traffic flow relationships and human convenience.
THEORETICAL BASIS OF STUDY
The development of pedestrian traffic flow relationships from time-lapse photography analysis is based on the classic equation of traffic flow (derived from the original analogy to fluid flow). This equation is usually expressed in the form
where
q mean flow rate, u = mean speed, and k ::: mean concentration or density.
q = uk (1)
This equation has been used to describe pedestrian flow, but the use of mean concentration or density, k, results in expressing pedestrian concentrations in tenths of a pedestrian per square foot, an unwieldy and somewhat unnatural unit to work with (3, 4). The use of the reciprocal of density, or square feet area per pedestrian-the pedestrian module, as used in this paper-allows a much clearer visualization of the pedestrian environment and relative quality of service. To describe pedestrian traffic flow in terms of the pedestrian area module, with changes in notation adopted for this study, Eq. 1 is rewritten as
where
p s M
P mean flow rate, pedestrians per foot width per minute; S = horizontal space mean speed, feet per minute; and
M = pedestrian area module, square feet per pedestrian.
(2)
The horizontal measurement of speed (and area) is required to maintain the consistency of the equation and to provide area modules for stairways based on horizontal tread occupancy. All time-lapse photography studies of pedestrian flows were based on the measurements of the volume, P-i. e., the number of pedestrians crossing the centerline of the field of measurement during the photographic sequence-and the pedestrian module, M-i. e., the average pedestrian occupancy of the field during the sequence. The space mean speed, S, was derived from these measurements by use of Eq. 2. This method is one of several suggested by Edie for measurement of traffic flow by sampling processes such -as time-lapse photography (~).
PEDESTRIAN TRAFFIC FLOW ON WALKWAYS
Three time-lapse photography studies, with minor modifications in techniques due to progressive experience and analysis of the initial data output, were conducted of walkway flows. The first experiment consisted of photographing directionalized flow through a 10-ft wide channel erected parallel to the main stream of peak-hour pedestrian traffic at a large commuter bus terminal. The channel was progressively narrowed in the subsequent two experiments in an attempt to produce higher density flows. In the last experiment of the series, a funnel-like approach was erected at the entrance to a 6-ft wide channel to further concentrate traffic. The data takeoff of volume, P, and

VOLUME (P)
30 I I I I MEASURED VOLUME (P) VS. PEDESTRIAN MODULE, (M)
I 25 ,__ 0
30 ,__ 0
20 0 u.
"' w 0..
w ,__ 15 :>
z
"' "' w 0.. 10
~· PLOT OF CLASS AVERAGES
~ CHANNEL WIDTHS • 10; *7.5; &6'
~ t ·~ ~ ~
~* "' z Sl "' w 0..
~Al-~~ ~ ...!..... •• "'ii. • • ....
5
0 j
0 5 10 15 20 25 30 35 40 45 50 (M) MODULE IN SQUARE FEET PER PEDESTRIAN
Figure 1. Pedestrian volume versus space for unidirectional traffic flow on walkways.
average pedestrian area occupancy, M, were organized in class averages. The data were then fitted mathematically by the method of least squares (6).
3
Figures 1 and 2 show the results of photographic studies of umdirectional flow including the mathematical curve of best fit. The equation for the curve of best fit based
w ,__ :> z
"' "' w 0.. ,__ w w u.. 0 w w e; '-' z
"" --' <(
~
SPEED(S)
350 I I
SPACE MEAN SPEED
300
250 . *
*/.
/ 200
150
* 4
~~ ~ .. •
•
* • • • • • • • • *. • , .... * • • • ··t• •
•
1 DERIVED WALK ING SPEED( S) VS. PEDESTRIAN MODULE (M) PLOT OF CLASS AVERAG •s
50 I
S = (P )(M)
I
100
0 0 5 10 15 20 25 30 35 40 45
(M) MODULE IN SQUARE FEET PER PEDESTRIAN
Figure 2. Pedestrian speed versus space for unidirectional traffic flow on walkways.
50
4
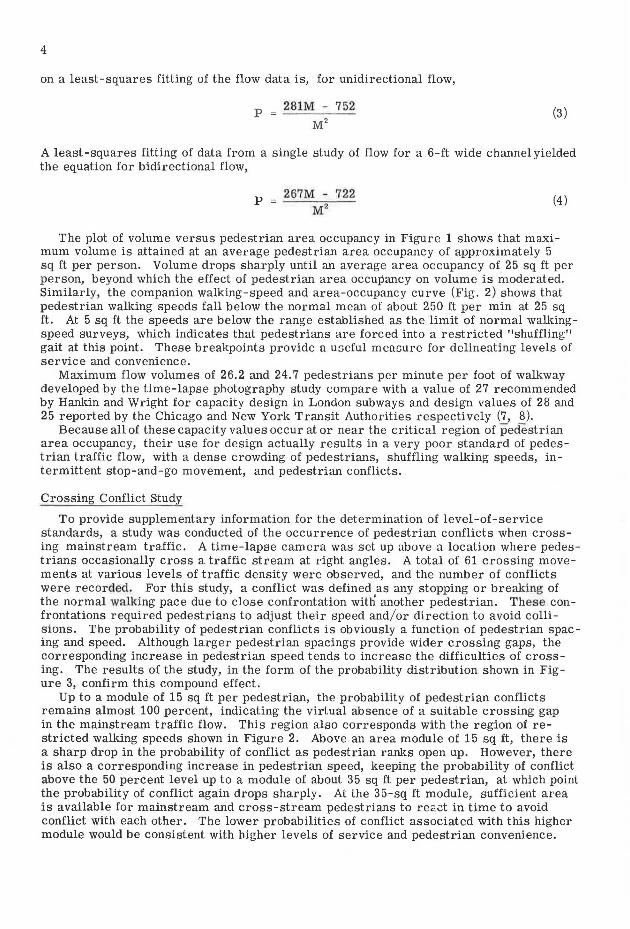
on a least-squares fitting of the flow data is, for unidirectional flow,
p = 281M - 752 M2
(3)
A least-squares fitting of data from a single study of flow for a 6-ft wide channel yielded the equation for bidirectional flow,
p = 267M - 722 M 2
(4)
The plot of volume versus pedestrian area occupancy in Figure 1 shows that maximum volume is attained at an average pedestrian area occupancy of approximately 5 sq ft per person. Volume drops sharply until an average area occupancy of 25 sq ft per person, beyond which the effect of pedestrian area occupancy on volume is moderated. Similarly, the companion walking-speed and area-occupancy curve (Fig. 2) shows that pedestrian walking speeds fall below the normal mean of about 250 ft per min at 25 sq ft. At 5 sq ft the speeds are below the range established as the limit of normal walkingspeed surveys, which indicates that pedestrians are forced into a restricted "shuffling" gait at this point. These breakpoints provide a useful measure for delineating levels of service and convenience.
Maximum flow volumes of 26.2 and 24.7 pedestrians per minute per foot of walkway developed by the time-lapse photography study compare with a value of 27 recommended by Hankin and Wright for capacity design in London subways and design values of 28 and 25 reported by the Chicago and New York Transit Authorities respectively (7, 8).
Because all of these capacity values occur at or near the critical region of pedestrian area occupancy, their use for design actually results in a very poor standard of pedestrian traffic flow, with a dense crowding of pedestrians, shuffling walking speeds, intermittent stop-and-go movement, and pedestrian conflicts.
Crossing Conflict Study
To provide supplementary information for the determination of level-of-service standards, a study was conducted of the occurrence of pedestrian conflicts when crossing mainstream traffic. A time-lapse camera was set up above a location where pedestrians occasionally cross a traffic stream at right angles. A total of 61 crossing movements at various levels of traffic density were observed, and the number of conflicts were recorded. For this study, a conflict was defined as any stopping or breaking of the normal walking pace due to close confrontation with another pedestrian. These confrontations required pedestrians to adjust their speed and/ or direction to avoid collisions. The probability of pedestrian conflicts is obviously a function of pedestrian spacing and speed. Although larger pedestrian spacings provide wider crossing gaps, the corresponding increase in pedestrian speed tends to increase the difficulties of crossing. The results of the study, in the form of the probability distribution shown in Figure 3, confirm this compound effect.
Up to a module of 15 sq ft per pedestrian, the probability of pedestrian conflicts remains almost 100 percent, indicating the virtual absence of a suitable crossing gap in the mainstream traffic flow. This region also corresponds with the region of restricted walking speeds shown in Figure 2. Above an area module of 15 sq ft, there is a sharp drop in the probability of conflict as pedestrian ranks open up. However, there is also a corresponding increase in pedestrian speed, keeping the probability of conflict above the 50 percent level up to a module of about 35 sq ft per pedestrian, at which point the probability of conflict again drops sharply. At the 35-sq ft module, sufficient area is available for mainstream and cross-stream pedestrians to rec.ct in time to avoid conflict with each other. The lower probabilities of conflict associated with this higher module would be consistent with higher levels of service and pedestrian convenience.

>....
1.1
1.0
.9
.8
:::! .7 co < :g .6 a:: 0.. .... .5 u ....J LL. .4 z 0 u
. 3
.2
. l
0 0 5 10
\ ' \
\...... - -...... ~ ....
\ \ \ \ ,
• 15 20 25 30 35 40
(M) MODULE SQUARE FEET PER PEDESTRIAN
Figure 3. Probability of conflicts for cross-flow traffic.
Pedestrian Spacing Study
5
. 45 50
The Traffic Engineering Handbook makes use of a 2-ft wide pedestrian lane for design purposes. On the basis of human shoulder breadths this might be considered a valid assumption. In the course of field studies, however, it was observed that a 2-ft pedestrian spacing was adopted intermittently and only under the densest flow conditions. In free-flow conditions most pedestrians prefer to avoid contact with others and therefore adopt larger inter-person spacings. Natural spacing in the traffic stream also determines the ease of overtaking and passing other pedestrians. To determine these natural spacings under different traffic concentrations, inter-person distances were measured on a large sample of time-lapse photographs. Figure 4 shows the results of these measurements fitted to parabolas as suggested by a somewhat similar study of sidewalks conducted by Navin and Wheeler ~).
Level-of-Service Standards for Walkways
The level-of-service standards for walkways provide a means of determining the qualitative aspect of the design environment; however, they do not eliminate the need for designer judgment. The designer must carefully examine all elements of walkway design including such traffic characteristics as the magnitude and duration of peaks, platooning caused by traffic light cycles, and all the ramifications of space utilization and cost. When designing for extreme peak demands of short duration, lower level-ofservice standards may be tolerated to provide the basis for more economic design. Added consideration must be exercised in selecting design standards near maximum capacity levels because the critical pedestrian density is likely to be exceeded intermittently. When critical density is exceeded, flow volumes fall below the specified design level, and pedestrian delay and backups are likely to occur, thus requiring determination of the adequacy of holding or queuing space at the approaches to the critical section.
The proposed level-of-service standards are based on the assumption of a pedestrian module range of area occupancies per person. Each level of service is illustrated by a photograph of unidirectional flow at the approximate pedestrian area occupancy repre-

6
;:: fUJ UJ LL
~ 2 ......... . w ....... . ~ .... ~ ~~~ ~
•• s .. ' uQ
3
(X) LONGITUDINAL SPACING - FEET
Figure 4. Longitudinal and lateral spacing of pedestrians in traffic stream.
s
senting that level. The photographs are supplemented by a verbal description of the qualitative aspects of each level of service in terms of the freedom to select individual walking speeds, freedom to pass, and probability of crossing conflicts. Design volumes are presented as a range, and the designer is required to ex~rcise judgment in applying these values. If unidirectional traffic is composed of commuters or workers, the higher design volumes in a given range may be safely assumed. The lower range of design vol-
VOLUME (P)
I f-0 j'
f-0 0 LL
"' UJ 0..
w f:::J z ::<
"' w 0..
"' z El "' w 0..
30
25
20
15
10
5
0
I I ~F- !-+- E - i-o c--e A
~
.~·~ ... ··~ I\. ~<;
~ ... ··.~
I"-. ~ ........ ... ::~ COMMUTER
c ···.:.~ [JUNl-DIRECTIONAL
= ~ .. ~::-..
e .... ;:_
:.\~ COMMUTER
f .... ~-Lei-DIRECTIONAL ·····::':" · -~. ........ 1.-~:: ... - . - --= ,_ i \ . -·-····-
,SHOPPERS MUL Tl-OIRECTIONA
I I
5 10 15 20 25 30 35 40 45 50
(M) MODULE IN SQUARE FEET PER PEDESTRIAN
Figure 5. Level-of-service standards for walkways (volume versus module).

7
umes would be recommended where traffic is composed largely of shoppers or persons carrying baggage or where the traffic pattern involves cross movements, reverse flows, or other conflicts.
Level-of-Service Descriptions for Walkways
Level-of-service standards for walkways are described in the following paragraphs, and pedestrian volume and area relationships are shown in Figure 5. Figure 6 shows pedestrian concentrations at the varioli's levels of service.
Level of Ser vice A-Equivalent to an average pedestrian area occupancy of 35 sq ft per per son or greater, at level of service A sufficient area is provided for pedestrians to select freely their own walking speed, to bypass slower pedestrians, and to avoid crossing conflicts with others. Design volumes would be approximately 7 pedestrians per minute per foot width of walkway or less. Designs consistent with this level of service would include public buildings or plazas without severe peaking characteristics or space restrictions.
..... .,---' I I I I I I I I
·--·---· ... ... ------------. I I I I I
' ' I ~ • ·--------------------------------
@ G.REATER THAM 35 SQ. FT / PED
Figure 6 . Levels of service for walkways.

8
Level of Service B-Equivalent to an average area occupancy in the range of 25 to 35 sq ft per person, at level of service B sufficient space is available to select normal walking speed and to bypass other pedestrians in primarily unidirectional flows. Where reverse direction or pedestrian crossing movements exist, minor conflicts will occur, slightly lowering mean pedestrian sp~eds and potential volumes. Design volumes would be in the approximate range of 7 to 10 pedestrians per minute per foot width of walkway. Designs consistent with this level of service would represent a reasonably high type of design for transportation terminals and buildings in which recurrent, but not severe, peaks are likely to occur.
Level of Service C-Equivalent to an average area occupancy in the range of 15 to 25 sq ft per person, at level of service C freedom to select individual walking speed and freely pass other pedestrians is restricted. Where pedestrian cross movements and reverse flows exist, there is a high probability of conflict requiring frequent adjustment of speed and direction to avoid contact. Design volumes would be in the range of 10 to 15 pedestrians per minute per foot width of walkway. Designs consistent with this level of service would represent reasonably fluid flow; however, considerable friction and interaction between pedestrians are likely to occur, particularly in multidirect.ional flow situations. Examples of this type of design would be heavily used transportation terminals, public buildings, or open spaces where severe peaking, combined with space restrictions, limit design flexibility.
Level of Service D-Equivalent to an aver;.'lgP. a,rP.a occupancy in the range of 10 to 15 sq ft per person, at level of service D the majority of persons would have their normal walking speeds restricted and reduced due to difficulties in bypassing slower moving pedestrians and avoiding conflicts. Pedestrians involved in reverse-flow and crossing movements would be sever ely restricted, with the occurrence of multiple conflicts. Design volumes would be in the range of 15 to 20 pedestrians per minute per foot width of walkway. Designs at this level of service would be repi asentati ve of the most crowded public areas, where it is necessary to continually alter walking stride and direction to maintain reasonable forwa1·d progress. At this level of SF •.·vice there is some probability of intermittently reaching critical density, causing momentary stoppages of flow. Designs consistent with this level of service would represent only the most crowded public areas.
Level of Service E-Equivalent to an average area occupancy in the range of u 10 sq ft per person, at level of service E virtually all pedestrians would have their normal walking speeds restdcted requiring frequent adjustments of gait. At the lower end of the range, forward progress would only be made by shuffling . Insufficient area wouJ1· be available to bypass slower moving pedestrians. Extreme difficulties would be experienced by pedestrains attempting reverse-flow and cross-flow movements. The design volume in the range of 20 to 25 pedestrians per minute pe1· foot width of walkway would approach the maximum attainable capacity of the walkway, with the result of frequent stoppages and interruptions of flow. Design in this range should only be employed for short peaks in the most crowded areas. This design level would occur natu1·ally with a bulk arrival traffic pattern that immediately exceeds available capacity, and this is the only design situation for which it would be recommended. Examples would include sports stadium design or rail transit facilities where there may be a large shortterm exiting of passengers from a train. When this level of service is assumed for these design conditions, the adequacy of pedestrian holding areas at critical design sections and all supplementary pedestrian facilities must be carefully evaluated.
Level of Service F-Equivalent to an average area occupancy of 5 sq ft or less per person, at level of servicP. F all pedestrian walking speeds ai·e extremely restricted, and forward progress can only be made by shuffling . There would be frequent unavoidable contact with other pedestrians and reverse or crossing movements would be virtually impossible. Traffic flow would be sporadic with forward progress based on movement of those in front. This level of service is representative of a loss of control and a complete breakdown in traffic flow. Pedestrian areas less than 5 sq ft are more representative of a queuing than a traffic flow situation, and this level of service is not recommended for walkway design.

9
PEDESTRIAN TRAFFIC FLOW ON STAIRWAYS
Human locomotion on stairways is a distinctly different activity from walking. Locomotion on stairways is restricted because of the need to overcome gravity in ascent and to safely control it in descent. In addition, the dimensional restraints imposed by the stair treads limit pacing distance, which further restricts locomotion. Because of these factors, pedestrians tolerate closer spacing on stairways than they generally do on streets.
Two time-lapse photography studies of stairways were conducted using the same techniques developed for walkways. These studies consisted of photography of ascending commuter movement at a Manhattan ferry terminal and ascending and descending movements at a sports stadium. Equations resulting from a least-squares fitting of the data were, for ascending stairways,
p lllM - 162 Mz
s lllM - 162 M
and for descending stairways,
p 128M - 206 M2
s 128M - 206 M
where
P volume in pedestrians per minute per foot of stairway, S = horizontal space mean speed in feet per minute, and
M = pedestrian module in square feet area per pedestrian.
(5)
(6)
(7)
(8)
The data plot and fitted curves from the two surveys are shown in Figures 7, 8, 9, and 10. The study indicates that a pedestrian area occupancy of about 10 sq ft per person is approximately normal based on previous studies of free-flow speeds on stairs. This area module is about half that required for normal walking.
The critical pedestrian area modules of 2.9 and 3.2 sq ft derived from the two surveys are about equal to a 2 stair-tread length, human-shoulder-width area. The zero movement area of 1.5 and 1.6 ft determined by the curve fitting is equivalent to human occupancy of one tread. At an area of 10 sq ft the pedestrian zone is estimated to be about 4 to 5 stair-treads long and 2% ft wiP,e. This would give sufficient room for reasonably normal stair locomotion but not enough freedom to bypass slower pedestrians. Using the 2 shoulder-width spacing criterion for bypassing others, lateral spacing would have to expand to 4 ft or more, giving an estimated area for bypassing slower moving pedestrians of about 20 sq ft.
The maximum flow volumes of 18.9 persons per minute per foot of stair width ascending and 20.0 descending developed by the time-lapse photography study compares with values of 19 and 21 recommended by Hankin and Wright as design criteria for the London subways. The New York City Transit Authority reports a design capaeity of 1,000 persons per hour per foot width for stairways (16.7 PPMFT) and the Massachusetts Bay Transit Authority a design value of 20 persons pe;r foot width per minute (8).
The results shown by this study indicate that all these design values, with the exception of the New Yorl< Transit Authority, occur at the critical region of pedestrian traffic flow equivalent to an area occupancy of about 3 sq ft per person. Use of design values at this level of pedestrian area occupancy shows little regard for comfortable human requirements of stair locomotion, which would require an open area of at least 3 stair treads in length and one human shoulder in width, or an area of at least 5 to 6 sq ft per person.

10
VOi IJME (P)
30 ' UP DIRECTION M~ASU RED
1 VOLUME, (P) VS.
J: to i to 0 LL
"' w 0..
w
25
20
t- 15 :J z :E
"' w 0.. 10 V> z 0 V>
"' w 0.. s
0 0
PEDESTRIAN MODULE (M) PLOT OF CL ASS AVERAGES
~ ...
\ t~
• k_ '
. ·~ - ... • 4
' ....
• ... • - ... • s l 0 15 20 25 30 35 40 45 so
(M) MODULE IN SQUARE FEET PER PEDESTRIAN
Figure 7. Pedestrian volume versus space for traffic moving up on stairways.
SP EED(S)
200 I I I
DER11VED HO~I ZONTA~
w t
175
:J 150 z :E
"' ~ 125 tw w LL 100 0 w w 0.. V> 75 Cl z iii :! 50 _J
u
25
0 0
HORIZONTAL COMPONENT SPACE MEAN SPEED COMPONENT OF CLIMBING
UP DIRECTION SPEED(S) - VS PEDESTRIAN _ MUlJULE (M) PLOT OF CLASS AVERAGES
• ...
" • • ie ... • ... • • ...
~ - 11• ... ... ... ... • • •
I I •
I ...
' ...
j 10 15 20 25 30 JS 40 45 so
(M) MODULE IN SQUARE FEET PER PEDESTRIAN
Figure 8 . Pedestrian speed versus space for traffic moving up on stairways.

VOLUME (P)
~ :i:: .... 0 :;;: .... 0 0 u.
"' w a. w .... :::> z :i
"' w a.
"' z :;;: "' w a.
w .... :::> z :i
"' w a. .... w w u. 0 w w a. "' " z 0 z w u "' w 0
30 I I I I I DOWN DIRECTION MEASURED VOLUME (P) VS
PEDESTRIAN MODULE (M) PLOT OF CLASS AVERAGE S
25
20 "" \ 15
10
\.
\ ..... ~ ~ ......._
5 . .------ - . ..
• • 0
0 5 10 15 20 25 30 35 40 45 (M) MODULE IN SQUARE FEET PER PEDESTRIAN
Figure 9. Pedestrian volume versus space for traffic moving down on stairways.
SPEED(S)
300 DERIVED HORIZONTAL
•
50
HORIZONTAL COMPONENT SPACE MEAN SPEED COMPONENT OF DESC ENDING
250
200
150
100
50
0
0
SPEED(S) VS PEDESTRIAN DOWN DIRECTION MODULE (M) PLOT OF CLASS
AVERAGES
t
• • • • • .. • ·~
........ - - •• • r •
I •
I 10 15 20 25 30 35 40 45
(M) MODULE IN SQUARE FEET PER PEDESTRIAN
Figure 10. Pedestrian speed versus space for traffic moving down on stairways.
-
•
50
11

12
Level-of-Service Standards for Stairways
In designing stairways, increased consideration must be given to the role of human characteristics because of the greater safety hazards and energy expenditure required in stair locomotion. In addition to the exercise of designer judgment in evaluating traffic patterns and peaking characteristics recommended in using walkway standards, the following factors should be considered in stair design:
1. Stairways should be well lighted and provided with sufficient headroom, properly designed and maintained riser and tread configurations, and railings;
2. Stairways should be located so as to be readily visible and identifiable as a means of direct access to the levels they are designed to interconnect;
3. Riser heights should be kept below 7 in. to reduce human energy expenditure and to increase traffic efficiency;
4. Stairways should be offset from mainstream traffic to avoid pedestrian conflicts; 5. Clear areas sufficiently large to allow for queuing pedestrians should be provided
at the top and bottom of all stairways; and 6. When a stairway is placed directly within a corridor, the lower capacity of the
stairway is the controlling factor in the design of the section.
Level-of-Service Descriptions for Stairways
Level-of-service standards for stairways are described in the following paragraphs, and pedestrian volume and area relationships are shown in Figure 11. Figure 12 shows pedestrian concentrations at the various levels of service.
Level of Service A-Level of service A is equivalent to an average pedestrian area occupancy of 20 or more sq ft ,er person and a volume of approximately 5 or fewer pedestrians per minute per foot width of stairway. This area occupancy represents a space more than 5 treads long and 4 ft wide. At this level of service, sufficient area is provided to select freely stair locomotion speed and to bypass slower moving pedestrians. No difficulties would be experienced with reverse traffic flows. Designs at this level of service would be consistent with public buildings or plazas that have no severe traffic peaks or space limitations.
VOLUME (P)
30
I 25 I-0 F E D c B A 3' I-0 20 0 LL
"' w 0..
w I- IS ::::i z ::;
"' w 0.. 10
-~ -,~ II
\.\ • I' i
I \ \ I ' \..
V)
z 0 V)
"' w 0.. 5
I '~ I~ ·. /~OWNSTAIRS
-·~ ....__ ......... .
Ii-.~ ·r ·-· .,.-- . ~ -·-UPSTAIRS..,-1 ·-·-0 I
0 5 10 15 20 25 30 35 <10 45
(M) MODULE IN SQUARE FEET PER PEDESTRIAN
Figure 11. Level-of-service standards for stairways (volume versus module).

13
Level of Service B-Level of service B is equivalent to an average area occupancy of between 15 and 20 sq ft per person and a volume of 5 to 7 pedestrians per minute per foot width of stairway. This area occupancy represents a space 5 treads long and 3 to 4 ft wide. Virtually all persons may freely select stair locomotion speeds. However, in the lower range of area occupancy, some difficulties would be experienced in passing slower moving pedestrians. Reverse flows would not present a serious traffic conflict. Designs at this level of service would be consistent with transportation terminals and public buildings that have recurrent peak demands and no serious space limitations.
Figure 12. Levels of service for stairways.
14
Level of Service C-Level of service C is equivalent to an average area occupancy of 10 to 15 sq ft per person and a volume range of 7 to 10 pedestrians per minute per foot width of stairway. This area occupancy represents a space 4 to 5 treads long and about 3 ft wide. At this level of service stair locomotion speed would be restricted slightly due to the inability to pass slower moving pedestriami. Serious conflicts would not be encow1tered with reverse flows. Design at this level of service would be consistent with transportation terminals and public buildings with recurrent peak demands and some space restrictions.
Level of Service D-Level of service Dis equivalent to an average area occupancy of 7 to 10 sq ft per person and a volume range of 10 to 13 pedestrians per minute per foot width of stairway . This area occupancy represents a space 3 to 4 treads long and 2 to 3 It wide. At this level of service, stair locomotion speeds would be restricted for the majority of persons due to the inability to pass slower moving pedestrians and the limited open tread space ahead. Reverse flows would encounter some conflicts. Designs at this level of service would be consistent with more crowded public buildings and transportation terminals subjected to relatively severe peak demands.
Level of Service E-Level of service E is equivalent to an average area occupancy of 4 to 7 sq ft per person and a volume of 13 to 17 pedestrians per minute per foot width of stairway. This area occupancy represents a space 2 to 4 tread lengths long and 2 ft wide, or the minimum possible area for stair locomotion. At this level of service, virtually all pen;uus would have their normal stair locomotion speeds reduced bec.:rnRe of the minimum tread length space and the inability to bypass others. Intermittent stoppages are likely to occur as the critical pedestrian density is reached. Reverse flows would experience serious conflicts. This level of service would only occur naturally with a bulk arrival traffic pattern that immediately exceeds available capacity, and this is the only design situation for which it would be recommended. Examples would include sports stadiums or transit facilities where there is a large, uncontrolled short-term exodus of pedestrians.
Level of Service F-Level of service Fis equivalent to an average area occupancy of 4 sq ft per person or less. This area occupancy is representative of a complete breakdown in traffic flow, with many stoppages. Forward progress would depend on movement of those in front. This level of service is not recommended for design.
ACKNOWLEDGMENTS
This paper is an extract from a larger sludy submitted as partial fulfillment for the Doctor of Philosophy degree awarded by the Polytechnic Institute of Brooklyn in June 1970. The dissertation was completed with lhe guidance and direction of Louis J. Pignataro, Head of the Department of Transportation Planning of the Polytechnic, and under the auspices of the Howard Cullman fellowship awarded by the Port of New York Authority.
REFERENCES
1. Baerwald, J. E., ed. Traffic Engineering Handbook. Institute of Traffic Engineers, 3rd Edition, 1965.
2. Highway Capacity Manual. HRB Special Report 87, 1965. 3. Older, S. J. Movement of Pedestrians on Footways in Shopping Streets. Traffic
Engineering and Control (Great Britain), Aug. 1968, pp. 160-163. 4. Oeding, D. Verkehrsbelastung und Dimensionierung von Gehwegen und anderen
Anlagen des Fusgangerverkehrs. Strassenbau und StrassenverkehrRtechnik, Heft 22, 1963.
5. Edie, L. C. Discussion of Traffic Stream Measurements and Definitions. Proc. Second Internat. Symposium on the Theory of Traffic Flow, London, 1963, pp. 140-154.
6. Linnik, Y. V. Method of Least Squares and Principles of the Theory of Observations. Translation from the Russian edition, Pergamon Press, 1961.

15
7. Hankin, B. D., and Wright, R. A. Passenger Flow in Subways. Operational Research Quarterly (Great Britain), Vol. 9, No. 2, 1958, pp. 81 - 88.
8. Preliminary Information Report on Pedestrian Characteristics and Space Requirements. Unpublished report of Committee BF, Institute of Traffic Engineers.
9. Navin, F. P. D., and Wheeler, R. J. Pedestrian Flow Characteristics. Traffic Engineering, Vol. 39, No. 9, June 1969, pp. 30-36.