designing for the situated and public visualization of
TRANSCRIPT

Designing for the Situated and Public Visualization
of Urban Data
Andrew Vande Moere and Dan Hill
ABSTRACT This paper investigates the concept of urban visualization, the visual represen-tation of an urban environment through its intrinsic or related data, where its display isalso situated within that physical environment. It describes how the principles behindpublic and urban displays can be combined with those of social visualization and persua-sive computing in order to create discursive as well as pictorial representations thatprovide a better and potentially actionable understanding of urban issues to its inhabi-tants. We introduce the role of several related research fields, and analyze a set of represen-tative case studies, taken from current best practice, academic research studies, and anexperimental design studio course to highlight the typical issues involved in conceptualiz-ing and implementing an urban visualization. Lastly, the paper proposes a set of designconstraints that typically characterize an urban visualization, in order to guide thefuture design and evaluation of useful applications within the field.
KEYWORDS Urban Computing; Public Display; Visualization; Urban Data; Persuasion;Design; Interaction Design; Physical Computing; Education
Introduction
Humans are becoming an “urban” species, living in a large number of vast urbanagglomerations. In fact, more than half the people on earth now live in cities. By2050, it is expected that more than two-thirds of the world population will (UnitedNations, 2007). Yet cities around the world face various challenges of which thechanging demands of demographics, mobility, energy consumption, quality oflife, crime dynamics, economics, resource use, waste, culture production, and con-sumption, are just a few. While most citizens are becoming increasingly aware ofthe environmental, societal, and economic challenges that surround modernurban living, only few might comprehend the driving principles behind these pro-blems, let alone reflect upon how these affect the reality of their own daily lives.Anticipating, understanding, and reflecting upon such urban problems iscomplex because of the sheer quantity and variety of interrelated parametersthat influence these phenomena and their inherent dependence on the localcontext and sensitivities of a given location. No two cities in the world, or eventwo neighborhoods within the same city, are identical in the issues that residents
Correspondence Address: Andrew Vande Moere, KU Leuven, Department of Archi-tecture, Urbanism and Planning, Kasteelpark Arenberg 1, 3001, Heverlee,Belgium. Email: [email protected]
Journal of Urban Technology, Vol. 19, No. 2, 25–46, April 2012
1063-0732 Print/1466-1853 Online.Copyright # 2012 by The Society of Urban Technologyhttp://dx.doi.org/10.1080/10630732.2012.698065All rights of reproduction in any form reserved.
Dow
nloa
ded
by [
K.U
.Leu
ven
- T
ijdsc
hrif
ten]
at 1
0:39
08
Oct
ober
201
2
face. Solving urban problems now requires taking into account the cultural,environmental, legal, or societal reality surrounding a specific place, in whichthe subjective experience and opinions of citizens are becoming as important asthe physical manifestation of buildings and public services in the urban land-scape. However, more localized decision-making typically requires higher resol-ution information gathering, in terms of quantitative measurements of theenvironment, but also in terms of collecting qualitative feedback from the verypeople who actually have to co-exist with, and within, these data. In order togain a truer understanding of the influencing principles and tendencies behindgrowing cities, one should consider how to make stakeholders—i.e., citizens—better aware of the true nature of urban challenges. By involving the local popu-lation in understanding the driving principles behind current urban issues, morewidely adopted and competent actions such as those induced by legislation andpolicies will stand a greater chance of improving the quality of life in cities,especially when part of the solution requires city inhabitants to change theirways of living.
One of the most pressing issues in cities is how to make them more envir-onmentally sustainable. We claim that in order for urban inhabitants to becomeaware and act towards a more qualitative and sustainable urban neighborhood,a new way of communicating information will be required, involving both dis-cursive as well as pictorial representations. Therefore, in this paper, we presentthe first exploratory steps in investigating the potential of representing “urban”data, or data that has a contextual relationship to the immediate environment,within the public, physical environment of the city as a potential solution forconveying actionable knowledge to local inhabitants. Moreover, the compellingcommunication of relevant, localized, and situated information might evenchange the perception of the physical environment in which the display islocated.
Economic and cultural activities such as heavy industry and physicaltrade once helped define the local character of a city and its people throughthe various perceivable traces of their physical presence, such as the smokefrom factory chimneys, the noise of local food markets, the dynamic flow ofworkers walking back from the factories or docks, or commuters leavingtheir neighborhoods in the morning. As many “western” economies shiftedtowards globalized service- and knowledge-based work, such urban activitieshave now become largely invisible and homogenous, leaving little physicaltrace of production. If the character of a place is linked to its production,how is local character and culture generated when production becomes invis-ible? Leaving aside the possibility of rediscovering forms of production withmore discernible outputs, we believe this lack of character is perhaps bestcountered through tracking the continuous generation of “urban” data,which potentially contains the traces of productive activities and the manyunique characteristics of our built environment. Therefore, through applyingthe appropriate representative means, the identity of place could still be distin-guished and highlighted, making the identity of a place more tangible and rel-evant. To convey the implications of this changing nature of a city, aneighborhood, or a street, we thus propose to look for it through the lens ofurban data, in the form of real-time digital traces of urban activities, as wellas their qualitative impact on the local environment. By sharing this infor-mation through an expressive and socially shared medium such as a public
26 Journal of Urban Technology
Dow
nloa
ded
by [
K.U
.Leu
ven
- T
ijdsc
hrif
ten]
at 1
0:39
08
Oct
ober
201
2

display, we expect a sense of responsibility toward a place could be reinstated,which might even have the potential of changing local habits, attitudes, orbehaviors. In the language of urban planning and urban design, this mighteven become a new form of “place-making.”
The City as a Locale of Data about and for Its Inhabitants
Since the appearance of signage in the pre-industrial city to support spatial orien-tation and way-finding, valuable and situated information has been continuouslydisplayed within the urban environment. By exploiting digital advances in screenand networking technology, such representations now have the potential to revealinformation that is relevant, timely, and engaging for city inhabitants. Severalmovements and academic fields are currently converging around the idea ofpublic and situated visualization in the urban context. The following paragraphsprovide a short overview.
Open Data
“Open Data” is a philosophy that encourages the free and transparent distributionof data without restrictions of copyright, governmental oversight, or other mech-anisms of control. The open-data phenomenon has been motivated by socialmovements that favor openness and transparency and the recent push towardsencouraging technology-enhanced forms of participatory and public governing.While this ideology is well established in the context of scientific research andthe Web2.0 phenomenon, the open-data phenomenon is only recent in terms ofpublic governance and the built environment. The cities of San Francisco (datas-f.org) and London (data.london.gov.uk) have been some of the first official urbanauthorities that have opened up large datasets on, and about, the built environ-ment under the umbrella of facilitating transparent, accountable governing andparticipative citizenship. However, releasing such data to the public can hardlybe considered sufficient, since to be useful, these data need to be presented ineasily accessible and understandable ways. In recent years, various citizen initiat-ives worldwide have exploited the right to access and reuse public information asstrategic tools for political influence and social action. The graphical represen-tation of such data has led to significant changes in legislation, and has encour-aged debate, changes in public opinion, and true citizen participation. Theshared co-analysis of common data by participants forms a critical part of partici-patory action research and design (Bødker et al., 1988; Ehn, 1990). However, for aparticipative tool of this nature to be successful, it should be designed in a waythat fits into the existing communicative ecology of its “users,” here the cityinhabitants. For example, locally relevant information might be best positionedin places that residents pass everyday. We believe that citizens should be encour-aged to become more aware of current urban challenges through understandingthe meaning of the hidden data of a city, when they are physically presentwithin that city. Such an opportunistic way of presenting information that is essen-tially situated in a local environment should more easily overcome the obviousmotivational and accessibility issues that are faced by traditional media communi-cation formats, including mass mailings, online websites, or smart phone appli-cations.
Designing for the Situated and Public Visualization of Urban Data 27
Dow
nloa
ded
by [
K.U
.Leu
ven
- T
ijdsc
hrif
ten]
at 1
0:39
08
Oct
ober
201
2

Social Visualization
Visualization, the graphical representation of complex information, has alreadybeen used as a feedback tool in an urban context, such as communicating urbaninterventions to the public, or for facilitating forms of participatory design andplanning. However, most such visualizations have focused on realistic or experi-ential simulations of potential outcomes, such as for conveying the immediateimplications of climate change (Nicholson-Cole, 2005). Realistic visualization,however, tends to emphasize the visual aspects of change, which may exacerbatepeople’s existing tendency to relate reality solely to what they can “see” in theirown neighborhood. Unfortunately, most urban challenges are abstract in natureand relate to a wide combination of interrelated quantitative and qualitativefactors.
Non-realistic visualization, or by its more appropriate term, informationvisualization, has the power to convey “invisible” data, which has no directcounterpart in physical reality. Such abstract data typically requires some formof translation or mapping through an explicit visual metaphor to be perceivedand, potentially to be understood. Visualization of abstract information for citi-zens in not particularly new: social and cultural theories of everyday life havealways been interested in rendering the invisible visible, and exposing themundane (Galloway, 2004). This interest has created the field of “social visual-ization,” which tends to focus on enriching social, electronic communicationby making its rich and salient qualities visible in easily accessible and under-standable ways (Donath et al., 1999). More recent developments in this directionhave shifted towards democratizing the power of visualization and making itsadvanced features accessible and usable for the public at large. Accordingly,social visualization offers non-experts the chance to increase their understand-ing of complex information by the power of collective and collaborative efforts(Viegas et al., 2007). Moreover, recent research efforts in this direction havedemonstrated how lay people can be encouraged to create public visualizationsfor communicative and participative purposes, which by itself provokes suffi-cient motivation to even spur significant social activities (Danis et al., 2008;Gilbert and Karahalios, 2009; Heer et al., 2008). A few recent projects havedemonstrated how social visualization has the ability to engage people insocially relevant topics, such as “PathFinder,” which allows citizen scientiststo collaboratively discuss and analyze the data they collect (Luther et al.,2009), and “The Village Buzz,” an electronic notice board system that collects,shares, and visualizes user-generated multimedia content surrounding an exist-ing high-density urban community development (Button, 2008). In essence,there thus exist some early empirical indications that publicly available visual-izations can become appropriate communication media for sharing, discussing,and co-producing socially relevant data.
Urban Computing
Recent advances in sensing devices, wireless network connectivity, and displayhardware have made the ultimate vision of ubiquitous computing finally possible,in which the “computer” as we know it becomes embedded in the physical objectsand surfaces of everyday life (Greenfield and Shepard, 2007; Mitchell, 2004;Weiser, 1991). Similarly, “urban computing” is the research field that aims to
28 Journal of Urban Technology
Dow
nloa
ded
by [
K.U
.Leu
ven
- T
ijdsc
hrif
ten]
at 1
0:39
08
Oct
ober
201
2

apply this technological integration into urban settings and lifestyles, includingstreets, squares, pubs, shops, public transport, public buildings, and any otherspace in the semi-public realms of our cities (Foth, 2009; Kindberg et al., 2007).Driven by the increasing availability of urban data, together with the rising afford-ability of environmental sensors and the now ubiquitous use of mobile communi-cation devices, urban computing aims to instrument the human experience ofpublic space with digital information.
While most current research in urban computing focuses on improving theefficiency and productivity of activities in the city by the provision of locative ser-vices (e.g., mapping, way-finding), there is a recent understanding that contem-porary urban life consists of a much wider range of emotions and experiencesthat needs to be addressed (Paulos and Beckmann, 2006; Townsend, 2010). Forinstance, the public visualization of “urban” data can play an important role inproviding a better understanding of a place, as it has already been shown that,by combining existing data repositories with real-time sensor measurementsand qualitative citizen feedback, valuable alternative views of the city can becreated, potentially even in real-time (Calabrese et al., 2007). Such representationstypically aim to reveal the salient patterns of urban living or make the impact ofurban activities and their regulation understandable, such as to produce originalinsights into the nature of the contemporary city (Read and Pinilla, 2006), to digi-tally model and simulate the city (McGrath, 2008), or to investigate the spatio-temporal actions and opinions of city inhabitants (Vaccari et al., 2009).However, the resulting visual representations of the city still tend to be presentedon dedicated media such as websites or smartphone applications, which areconceptually as well as physically separated from the actual environmentfrom which the data originates, thereby turning the urban experience into avirtual one.
Urban Screens and Media Architecture
Today’s “urban displays” are publicly accessible interfaces that allow passers-byto observe and potentially interact with functional information, ranging from busschedules to dedicated tourism information (Fatah gen. Schieck, 2005). Such elec-tronic displays are becoming increasingly ubiquitous in our urban fabric, as theynow appear in squares and parks, around public transport platforms and, morerecently, on-board public transport itself (Fatah gen. Schieck et al., 2008).However, the ideas behind the urban screen are slowly entering the realm of archi-tectural design and construction: architectural facades, which traditionally eitherembodied the style of a specific time period (e.g., baroque, modernist), or rep-resented the public function of the building (e.g., bank, church) have reachedthe technological stage in which they can be constructed independently fromstructural building constraints. As the typical rigid, weight-bearing facade istransformed into a flexible, almost weightless skin, an increasing number of build-ings are becoming augmented with digital media. Technically, the nature of suchdisplays can reach well beyond the traditional flat LED screen and its derivativesand even become integrated within the actual architectural or urban design. Thesetreatments can range from subtly integrated interventions within the existingenvironment, by, for example, augmenting street furniture (Gaver, 2002); to “archi-tectural” information surfaces that exploit state-of-the-art developments in ther-
Designing for the Situated and Public Visualization of Urban Data 29
Dow
nloa
ded
by [
K.U
.Leu
ven
- T
ijdsc
hrif
ten]
at 1
0:39
08
Oct
ober
201
2

mochromatic panels (van der Maas et al., 2009); to dramatic mechanical and inha-bitable structures that are able to dynamically change their shape (Oosterhuis andBiloria, 2008).
Content-wise, the obtrusive nature of its typical large, light-emitting panels isturning “media architecture” into an expressive language in its own right, influen-cing our experience of public space (Venturi et al., 1977). However, the majority ofcurrently existing media architecture installations serve mainly commercial, artis-tic, or entertainment purposes. As research in this field has been mainly driven bytechnical challenges such as the development of fast-responding lighting systemsor kinetically moving structures, its potential impact within the social and urbancontext is still often overlooked. Yet, through its explicit public dimension, mediaarchitecture has the ability to reach beyond its functional aspects, which it has incommon with other human sciences. Through its particular way of expressingvalues, media architecture has the potential to stimulate and influence theurban experience without necessarily presuming that, in and of itself, it willpromote social development. By combining the concept of the urban screenwith the visualization of situated and contextual information, media architecturecan grow beyond the broadcasting of artistic visual imagery, public announce-ments, or persuasive slogans, as it could facilitate bringing about a new under-standing of complex local issues.
Persuasive Technology
While placing electronic displays in a semi-public space brings about new oppor-tunities in social, community-driven communication and collaboration, it alsoraises important questions about the actual social and interactive behaviors occur-ring around a shared, public screen (e.g., O’Hara et al., 2003), including the poten-tial to shape the opinions, attitudes, and behaviors of its audience. Because of itsunique qualities, an urban visualization has the theoretical ability to persuade,because it embodies the three functional roles of persuasion (Fogg, 2003):through sensing technology, a display can act as a tool that increases the capabilityto capture a behavior (e.g., measuring residential energy consumption, bicycleuse, etc.); through its visual imagery, it can function as a medium that providesuseful information, such as behavioral statistics or cause-and-effect relationships;and through its networking ability, it can become a social actor, encouraging com-munity-based feedback and social interaction.
However, the use of modern sensing and display technology for persuasivepurposes in an urban context seems still relatively unexplored and is stilllimited to two very specific types: commercial advertising, such as the use of inter-active visual effects to attract the viewer’s attention (Mubin et al., 2009); and nor-mative communication, including the widely adopted real-time roadside speedmeters (e.g., “Speed limit: 50/Your current speed is: 65”). Displays designed topersuade seem to focus on providing some immediate reaction to local actions.As demonstrated in online media, social networks can form a useful constructto support behavioral change that involves group dynamics and the sharingand emulating of values. While online social networks tend to track and highlightthe sharing of virtual values, similar concepts can be imagined in the physicalworld: an electronic car speed road sign would then not provide a numericalcar speed readout, but, might, for example, provide a rewarding experience
30 Journal of Urban Technology
Dow
nloa
ded
by [
K.U
.Leu
ven
- T
ijdsc
hrif
ten]
at 1
0:39
08
Oct
ober
201
2

only when a cumulative shared goal has been reached or contrast your car speedas a distant commuter with that of local residents.
Towards the Public and Situated Visualization of Urban Data
Visualizing complex information within everyday urban space is not a trivial task,as most city dwellers are well accustomed to ignore such public messaging, regard-less of how large, brightly, or interactively the imagery might be presented. Accord-ingly, recent research on public displays and interfaces has been investigating thecircumstances under which people actually “look” at such screens (as they tendnot to) (Huang et al., 2009), how people can be enticed to interact with them(Brignull and Rogers, 2003), how the interest of people can be sustained beyondtheir initial excitement (Morrison and Salovaara, 2008), and how the interactionwith public screens tends to change over time (Jurmu et al., 2009). While suchstudies reveal the driving influential factors behind the performance of suchdisplays, few working prototypes have been designed that demonstrate the novelconceptual possibilities of visualizing information within an urban context. There-fore, the following sections provide a short overview of the current state of publicvisualization, seen through the lenses of three different practices: private and gov-ernmental conceptual proposals and real-world implementations, research throughdesign studies, and educational design courses.
Best Practice: Current Concepts and Implementations of Urban Visualization
The U.S. Debt Clock (Wikipedia, 2011) located in New York is a continuouslyupdated large-size dot-matrix display that presents an estimation of thecurrent gross national debt in the United States, in addition to each family’sshare of that debt. (See Figure 1a.) Next to the immense size of the numericalvalues, the animated effect of the continuously increasing number is in itself aquite disconcerting way of alerting people of the relative speed of public debtacquisition. While its relevancy goes well beyond the immediate city neighbor-hood, its location in Manhattan, the financial center of the United States, is stillquite apt. The display conveys a sense of urgency on a personal level, as theelusive total debt number is averaged to that of the level of a single, averagefamily.
The Cykelbarometer (Mikael, 2009) in Copenhagen also displays numericaldata, though with a more localized relevance, as it broadcasts the daily andyearly total number of bicyclists that rode past. (See Figure 1b.) Located at oneof the main entrances of the city, the number counts upwards immediately aftera bicycle is sensed, providing a sense of participation and belonging. The goalof this display is to inform as well as persuade onlookers to commute morewith a bike: in fact, it is not about being the first, but about being the cyclistwith the number 500,000, who will receive a free bike from the local city adminis-tration.
CityWall (Morrison et al., 2008), in contrast, is a more elaborate screen in theform of a multi-touch surface installed in the center of Helsinki, giving access topast and present events that took place in the city. Due to its advanced interactivefeatures, it has been reported that passers-by seemed rather interested in thenovelty and the playfulness of the interface, rather than the actual content.
Designing for the Situated and Public Visualization of Urban Data 31
Dow
nloa
ded
by [
K.U
.Leu
ven
- T
ijdsc
hrif
ten]
at 1
0:39
08
Oct
ober
201
2

Analogue versions of public visualization displays exist as well, as shown inFigures 2a, b, and c. The Tidy Street project (Bird and Rogers, 2011) consists of ahuge historical line graph, painted with chalk on a common road, which revealsthe historical electricity usage of the street’s inhabitants, contrasted to theaverage values of other UK regions. Although the street display is temporary, it
Figures 1a and 1b: Examples of existing forms of urban visualization using digital display technology(a) U.S. Debt Clock in New York City and (b) Cykelbarometer in Copenhagen
Sources: (a) Wikipedia, 2011, (b) Mikael, 2009
32 Journal of Urban Technology
Dow
nloa
ded
by [
K.U
.Leu
ven
- T
ijdsc
hrif
ten]
at 1
0:39
08
Oct
ober
201
2

Figures 2a, 2b, and 2c: Figures 2a, 2b, and 2c are examples of urban visualization using “analogue”display technology. (a) Tidy Street, Brighton (U.K.), (b) “Pollstream-Nuage Vert,” Helsinki, and (c) “Big
Vortex,” CopenhagenSources: (a) Bird et al., 2011, (b) HeHe, 2008, and (c) realities united, 2011.
Designing for the Situated and Public Visualization of Urban Data 33
Dow
nloa
ded
by [
K.U
.Leu
ven
- T
ijdsc
hrif
ten]
at 1
0:39
08
Oct
ober
201
2
aims to motivate the local community to participate in lowering energy consump-tion and to support the display’s continued upkeep. (See Figure 2a.)
Ars Electronica 2008 laureate “Pollstream—Nuage Vert” (HeHe, 2008) is acity-scale visualization of sorts, which transformed a cloud emanating from anelectricity plant chimney into a meaningful projection surface: the more thelocal inhabitants saved energy, the larger the surface area that lit up through theuse of a powerful (though low-energy) laser light. (See Figure 2b.)
“Big Vortex” (realities united, 2011) is a soon to-be-built built waste-to-energyplant that will represent a quarter ton of processed CO2 emissions by regularlyemitting a visible gas cloud in the shape of a circular smoke ring (or toroidalvortex shape). (See Figure 2c.)
In the project “Melbourne Smart City” (Arup, 2011), the global engineeringfirm Arup proposed several urban visualization concepts within the strategicframing of a smart city vision for the city of Melbourne. The proposed ideasranged from relatively “traditional” large LED screens that reveal real-time,street-wide water and electricity use, to more futuristic public art installationssuch as a floating LED cloud that conveys patterns of urban activity as a formof shared artistic experience. (See Figures 3a and 3b.)
These examples, some already implemented, some still in a conceptual phase,demonstrate the relative infancy of urban visualization and the relatively limiteddata complexity (in terms of size and dimensionality) that has been exposed toinhabitants until now. It seems that the ideal vision of the so-called “real-timecity” (Foth, 2009; Ishida, 2002), in which continuous urban data flows are com-monplace and freely available, has yet to arrive. Instead, the data sources usedin currently existing urban visualizations are still relatively “simple” in terms oftheir technical implementation, though nevertheless still hard to come by.
Academic Research: Investigating the Urban Visualization of Private Data
In our recent in-the-wild design study (Vande Moere et al., 2011), we installed aseries of custom public displays on house facades in Sydney (Australia) to inves-tigate the effectiveness of explicitly externalizing household energy consump-tion—information that is normally kept well hidden and private. During the 10-week study, the daily electricity usage statistics of several households were dis-played on their respective houses, so that any positive or negative change intheir habits became immediately comparable to those of other nearby households.As shown in Figures 4a and 4b, the study comprised a set of custom-designedchalkboards, which were hung on the facades of five different houses and onwhich the information was updated by hand by the researchers, once per day.The boards included several visualization techniques in order to investigate thespecific factors that influence the effective perception of the information by inhabi-tants and passers-by.
We hypothesized that the public exposure of household energy statisticswould have a positive and possibly a sustained effect on electricity use by trigger-ing feelings of healthy competition, social comparison, or social pressure (Abra-hamse et al., 2005). However, the effectiveness of the “public” context, in termsof explicitly comparing the behavior of multiple persons with each other, is stillrelatively contested: while some past studies showed immediate and positiveeffects (Brandon and Lewis, 1999, Egan, 1999), others have revealed how people
34 Journal of Urban Technology
Dow
nloa
ded
by [
K.U
.Leu
ven
- T
ijdsc
hrif
ten]
at 1
0:39
08
Oct
ober
201
2

tend to be concerned about the apparent validity of the comparison groups(Roberts et al., 2004). Public and open comparison of behavioral data has someimportant drawbacks: while bad-performing participants might change their be-havior positively when being confronted with those of others, good-performingparticipants tend to do the opposite, as they feel much less encouraged when noti-cing their already positive behavior, and feel no immediate objection to movetowards the “average” (Brandon et al., 1999).
The design through research methodology demonstrated some of the real-world challenges of urban visualization and the effectiveness of in-situ evaluationstudies to measure the effectiveness of conceptually convincing ideas. Forinstance, while many real-time visualization techniques can be easily imagined,it becomes a challenge to design a publicly noticeable display that is cheap, sus-
Figures 3a and 3b: Figures 3a and 3b are conceptual ideas of urban visualization for Melbourne’sSmart City Program. (a) Civic Smart Meter: here streets and blocks broadcast their resource data (e.g.,
energy and water use), (b) The Net, a layered net of LED lights hangs over a Federation Square“laneway,” displaying civic data in real time.
Sources: (a) and (b) Arup, 2011
Designing for the Situated and Public Visualization of Urban Data 35
Dow
nloa
ded
by [
K.U
.Leu
ven
- T
ijdsc
hrif
ten]
at 1
0:39
08
Oct
ober
201
2

tainable in itself, easily updatable, acceptable by local residents, but also resistantto the urban environment, including “real” aspects as materials, safety, vandalism,weather, council approval, privacy issues, and so on. This project also revealedsome non-obvious motivational issues when urban data is put in the public
Figures 4a and 4b: Design research on urban visualization. Comparative public visualizations ofenergy use statistics in Sydney (Australia). The boards showed a set of visualization techniques,
including daily performances facts, a neighborhood ranking, an historical energy use graph, and avisual long-term reward in terms of a pictorial bar.
Source: (a) and (b) Vande Moere et al., 2011
36 Journal of Urban Technology
Dow
nloa
ded
by [
K.U
.Leu
ven
- T
ijdsc
hrif
ten]
at 1
0:39
08
Oct
ober
201
2

realm, most of which are related to how people interpret “change” instead ofabsolute use values, our inept method of rewarding sustained behavior, and aninability to connect the insights derived from the visualizations into direct, posi-tive actions. Accordingly, we believe more research is required on how to bestpresent complex data in a public context, in terms of being understood as wellas facilitating actionable sense-making.
Education: Design Studio Experimentation
“Urban Sensing” was a postgraduate design studio course organized within theMaster of Interaction Design and Electronics Arts (M.IDEA) program at the Uni-versity of Sydney (Vande Moere and Hill, 2009). Students were challenged todesign and build a working prototype of an urban visualization within the exist-ing context of a real-world urban location nearby the university campus.
The student design ideas were fine-tuned through iterative evaluation cyclesof successive low- and high-fidelity prototypes on the intended site location, andby personally observing and reflecting on the reactions and opinions of actualpassers-by. The course demonstrated the practical, real-world issues of designinga public and situated visualization, and the difficulties in inventing case scenariosthat are both meaningful and feasible. The issues we encountered ranged fromaccessing interesting urban datasets that were actually publicly available (thosethat were, were taken offline after discovering our use), to confronting police offi-cers worried about security who took down all our wireless sensor devices thatwere mounted on the site.
The following three student works, as shown in Figure 6, demonstrate theconceptual richness of “visualizing” urban data in more creative and artisticways, unrestrained from council policies or pragmatic functional considerations.The “Lonely Traffic Light,” designed by Silje Johansen, turned the inanimate andanonymous nature of an ubiquitous urban construct, a traffic light, upside down:an existing traffic light was electronically augmented to enable it to “interact” withits users, even appearing to express emotional responses to waiting pedestrians.Small proximity sensors recorded the requests from pedestrians to cross thestreet (i.e., when users pressed the green light request button), and the exactstates of the traffic lights themselves (i.e., captured by a light sensor attached tothe green pedestrian light). A rudimentary form of artificially intelligent person-ality was implemented through a rule-based behavior algorithm. The outputmechanism of the traffic light consisted of text-to-speech messages that wereemitted by a hidden, miniature speaker, as well as two real-time Twitterstreams, one of which revealed the actual binary state of the traffic light, andthe other its emotional response about the current situation (e.g., lonely, bored,stressed, all based on the sequence and time stamp of past events). The successfulimplementation proved the potential for augmenting existing urban furnitureinstead of developing dedicated displays, in particular as a way to exploit itsexplicit physical context (e.g., the combination of a waiting area, busy road, anda normally lifeless object) to encourage passers-by to contemplate the new situ-ation. In the context of interaction design, a typical traffic light could be con-sidered a relatively ideal “interaction interface,” as it is equipped with one ofthe largest and most intuitive forms of input mechanisms (i.e., a big, shiny,metal button), while it is relatively easy to capture the full attention of multiple
Designing for the Situated and Public Visualization of Urban Data 37
Dow
nloa
ded
by [
K.U
.Leu
ven
- T
ijdsc
hrif
ten]
at 1
0:39
08
Oct
ober
201
2

(and often bored) “users” during a relatively long period of time (at least when thelight is red). Here, this interaction opportunity was exploited to orally inform ped-estrians about their expected waiting time, which was calculated from past aver-aged measurements and the time since the light was last seen as green and to telltraffic-related jokes, whose duration depended on the expected waiting time.Occasionally, the traffic light communicated apparent emotional responses, suchas utter irritation when people indifferently pressed the button numerous times.(See Figure 5a.)
Student Steven Lukman augmented a common traffic light with a more func-tional goal in mind: to inform the people approaching the traffic light as well asalready waiting pedestrians about the expected waiting time for a green light.He implemented two wirelessly connected and “futuristic-looking” contraptionssuch that the approach and the waiting were transformed into a rather spectaculardata-gathering experience. This was conjured via the sequential blinking of aseries of red/green colored LED lights that denoted the passing of time, and acalmly rotating spiral of Perspex discs (causing a visual effect much like the rotat-ing “waiting” icons found in operating system interfaces or on the facade oftypical old barber-shops), all encapsulated in a protected transparent, vertical con-traption. The two output devices were distanced from each other such that theinterface attempted to convey the imminent change in traffic light state to oncom-ing pedestrians some distance away from the actual lights. While more subtle thanthe Lonely Traffic Light project, and undoubtedly more complex than necessary tocommunicate a waiting time, this project turned the everyday task of waiting intoan aesthetic experience that rapidly became a popular conversation topic withpassing strangers. (See Figure 5b.)
The “Urban Polling Device” by Jack Zhao, provides an alternative way toconduct and visualize opinion polls on public streets. The device enables ped-estrians an opportunity to vote “for” or “against” a certain issue through physicalinteraction with a tangible device that registers their vote and displays the overalltrend. Passers-by can rotate one of the two discs, which itself is accompanied by atactile “click” and a sound to acknowledge the recording action. The middle circlecontains a “¼” sign, of which the separate physical parts can be electronically ani-mated to resemble “. ,” “¼,” or “,,” depending on the acquired voting statistics.While the device has no direct interventions for obvious misuses like multiplevoting, it still opens up the question of agency and cooperative behavior inurban contexts. It also hints at an urban experience that is increasingly“metered” through the use of sensors and other input devices, as well as aculture of participation and public consultation. As such, the polling device pro-totype suggests a myriad of potential applications in terms of gauging theresponses of citizens via an opportunistic, everyday device in the street, and pro-viding the results back to the people at large. (See Figure 5c.)
As an exploratory and research-led teaching course, we realize that much ofthe perceived innovation of the proposed student projects rests with the relativenovelty of embedding alternative information displays in a real-world, urbancontext. Both the physical and social (Williams and Dourish, 2006) context playsa surprisingly important role in designing for urban computing: what mightwork fine in our design studio environment or a controlled laboratory environ-ment, was often perceived completely differently on-site. The typical goal-oriented character of an urban dweller, together with the continuous stimulationof our human senses by attention-grabbing advertising, noisy traffic, the harsh
38 Journal of Urban Technology
Dow
nloa
ded
by [
K.U
.Leu
ven
- T
ijdsc
hrif
ten]
at 1
0:39
08
Oct
ober
201
2
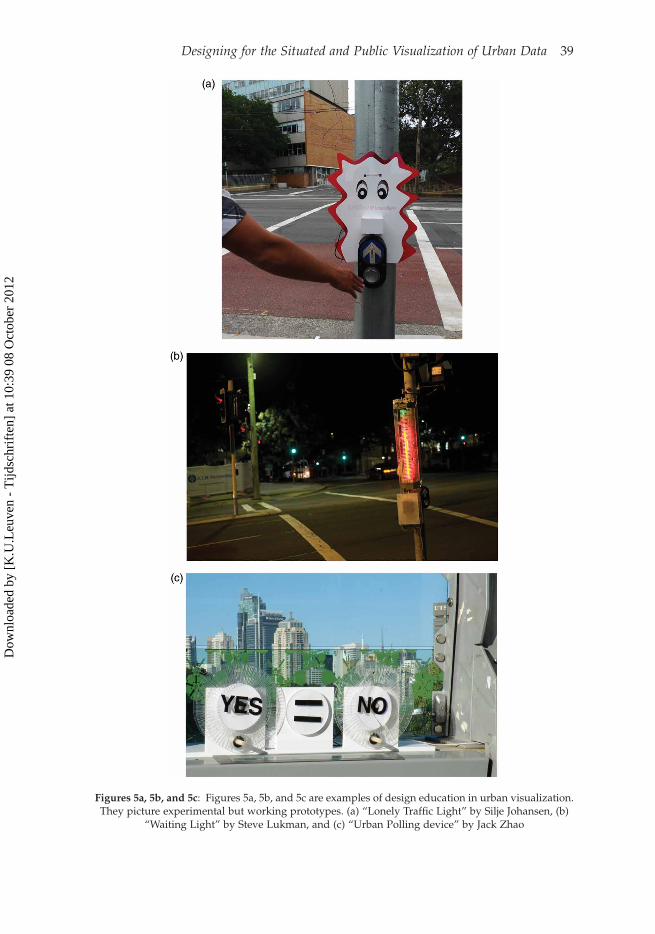
Figures 5a, 5b, and 5c: Figures 5a, 5b, and 5c are examples of design education in urban visualization.They picture experimental but working prototypes. (a) “Lonely Traffic Light” by Silje Johansen, (b)
“Waiting Light” by Steve Lukman, and (c) “Urban Polling device” by Jack Zhao
Designing for the Situated and Public Visualization of Urban Data 39
Dow
nloa
ded
by [
K.U
.Leu
ven
- T
ijdsc
hrif
ten]
at 1
0:39
08
Oct
ober
201
2
Australian sun, and an amalgam of smells, makes the urban environment a par-ticularly difficult context to design for. Accordingly, our students often did notanticipate how the vast majority of city dwellers would overlook their carefullycrafted displays. Design subtlety and whimsy often had to be replaced withstraightforward, large, robust, and “in-the-face” approaches that are difficult toignore.
Conducting research through design outside of the typical lab environmentproved to be a huge development challenge. As opposed to design interventionsthat tend to exist solely on paper or in virtual worlds, which all can be upgraded,downgraded, or tweaked at any time, the integration of “physical computing” inan urban context is often unforgivable in trivial issues, ranging from last-minutechanges, however small, to common physical occurrences like a missing powersource, an over-curious passer-by, a severe rain storm, or a nervous securityguard. Although many user-friendly and open-source software frameworks haveprovided creative designers with the opportunity to step into technological terri-tories normally reserved for the expert or hobby enthusiast, the key to successfullydevelop a convincing urban computing prototype seems to be mostly driven bythorough self-determination and the continuous urge to be critical of one’s ownwork. Even the slightest technical error, caused by inexperience, trial-and-error,or just the occasional accident, will typically make an experiment fail completely,often even to a point where repair is too complex, time-consuming, or costly.
It should come as no surprise that some of the student projects, not shown here,failed to convince in terms of producing plausible, useful, and elegant urban designsolutions that would genuinely enhance or contextualize the urban experience. Asteachers, we could frequently employ a “so what?” test in order to gauge many ofthe proposed ideas, i.e. “So what if your system tells us the road is busy or the bus isjust arriving; we can see that for ourselves. . .” or “So what if your data show a cor-relation between bike use and rainy weather; that is to be expected.” Obviousreasons for the lack of surprising applications of urban visualization mightinclude the high complexity of the design challenge itself, particularly for alargely foreign student cohort who had no personal experience with the urbancontext as a living environment, and, therefore, could not react to it as a design fra-mework. In addition, the issue of providing city occupants with a “feedback” mech-anism that transcended that of standard LED lights or LCD displays was oftenexperienced as a creatively insurmountable bottleneck. The simplicity of program-ming blinking lights and housing them by rudimentary cabling was often too per-suasive. In short, while these problems may reflect particularly on our studentsand/or us as teachers, still we get the sense that urban visualization itself couldbe caught between highly functional, almost banal components of urban infrastruc-ture on the one hand, and highly abstract or oblique design interventions, interac-tive or not, on the other. This phenomenon may be a reflection of the open-endedness of the still emerging field at this time, partly because few of the moreinteresting datasets are actually available, or that the range of possible interven-tions into the urban experience is vast and effectively unconstrained.
Characteristics of an Urban Visualization
How is a situated urban visualization different from an interactive advertisingbillboard, an electronic council announcement screen, or a public, roadside
40 Journal of Urban Technology
Dow
nloa
ded
by [
K.U
.Leu
ven
- T
ijdsc
hrif
ten]
at 1
0:39
08
Oct
ober
201
2

speed meter? Based on the related fields and the examples that were discussed inthe previous sections, we believe that its determinant design characteristics arethreefold:
Situated
Here, “situated” means that the visualization is embedded in a real-world, phys-ical environment.
Contextual. The visualization takes into account the unique characteristics of itsphysical location, in terms of both its explicit and implied meaning. An urbanvisualization often receives its meaning from the metaphorical context of itslocation, making detailed explanations unnecessary: a display attached to ahouse facade reflects the behavior of the resident household, smoke coming outof chimney represents pollution, a light-emitting artifact attached to a trafficlight depicts a waiting time, and so on.
Local. The information shown has a direct and immediate relationship to the localcontext. This often means the data is sensed, measured, or acquired within thephysical environment immediately surrounding the display, or has beenmodeled into values that reflect the particular circumstances of the people, build-ings, or activities within the local environment. The data sets can originate fromauthorities, such as governmental or advocacy organizations (e.g., open data inthe form of crime statistics, school inspection reports, etc.); crowd-sourced reposi-tories containing geo-located information (e.g., Flickr, FourSquare), or fromprivate or socially-motivated initiatives that employ their own environmentalsensing devices (e.g., mobile phones, pollution sensors).
Social. The visualization reflects on issues that are closely relevant to the social-cul-tural reality in its vicinity. The local population can easily identify with the issuesraised through the data, ensuring a level of usefulness and utility that goes beyonda specific time or a specific individual user (persona).
Informative
The data are different from those on posters and electronic announcement bill-boards in several ways.
Feedback. The visualization forms a direct feedback loop between the city, itsinhabitants and their actions. Urban data are created by city inhabitants and aredifferent from services, time schedules, or other urban phenomena that exist inde-pendent of urban inhabitants. An urban visualization thus forms a factual mirror,which must dynamically change according to the activities of inhabitants to betruly believable (and potentially persuasive). Equally, it may be that the form ofthe visualization itself needs to change over time, in order to retain the interestof its regular passers-by.
Insightful. The visualization allows onlookers to create meaningful insightsbeyond the retrieval of facts (e.g., events, routes, time schedules). Insights are dis-coveries of understanding that are essentially: complex, deep, qualitative, unex-pected, and relevant (North, 2006). Allowing insights to be discovered has twomain challenges: on one hand, the visualization should represent data phenomena
Designing for the Situated and Public Visualization of Urban Data 41
Dow
nloa
ded
by [
K.U
.Leu
ven
- T
ijdsc
hrif
ten]
at 1
0:39
08
Oct
ober
201
2

(e.g., trends, outliers, clusters, contrasts) that are sufficiently complex and mean-ingful, on the other, the visual representation should be sufficiently intuitive to becomprehensible.
Consistent. The visualization in itself does not negate the meaning it conveys.Accordingly, a display showing CO2 emissions needs to be sustainable in itself.
Functional
The following aspects assure the effective functioning of an urban visualization,which corresponds largely to the requirements of common urban displays, includ-ing advertisements, road signs, council announcement boards, graffiti, and so on.
Medium. The visualization is designed as to reach a sufficiently large audience,irrespective of their technical expertise, cultural background, or motivation.(Note: it may be that multi-sensory additions can successfully augment visualiza-tion.)
Participative. The visualization provides an experience that is shared by a commu-nity of people, potentially encouraging participative and collaborative action andthe sharing of common norms and values.
Opportunistic. The visualization does not impede other urban activities. It is per-ceivable in the periphery of human attention, allowing viewers a free choice todedicate their full focus or attention. Accordingly, its information is not of vitalor crucial nature.
Aesthetic. The visualization is adapted to the urban fabric. It takes into account theconstructive and aesthetic constraints of its surrounding environment and blendsin visually as well as physically, and thus ensures a sustained acceptance by thelocal population.
Trustworthy. As with any public intervention, the visualization shows informationin an objective, fair, and trustworthy way that accurately reflects the actual situ-ation. For instance, the sources of the data that were used are clearly mentionedand are publicly accessible.
Persuasive. Similar to advertising and announcement boards, an urban visualiza-tion calls for some sort of reflection, change, or action. Designing and buildingpublic displays requires considerable time and effort, which typically must becompared to some sort of future benefits that offsets these investments. Or, putanother way, the “value” of providing information to citizens centers aroundthe general expectation that a more informed population tends to be more satis-fied, more involved, leading to more informed discussion and participation inpublic discourse.
Following these design characteristics, it should be clear that an urban visu-alization should be ideally designed considering, or with the active participationof, the actual local citizens, in order to create a feeling of ownership and personalinvolvement. Notably, none of the characteristics defines the need for digitaldisplay technology: although the feedback loop between citizens and their activi-ties through their digital data traces requires some form of dynamic updating, itsdisplay does not necessarily need to be updated in real-time. Similarly, the topic ofinteractivity has not been directly discussed. Interactivity should be considered
42 Journal of Urban Technology
Dow
nloa
ded
by [
K.U
.Leu
ven
- T
ijdsc
hrif
ten]
at 1
0:39
08
Oct
ober
201
2

more widely than the standard keyboards, multi-touch surfaces, or smart phoneapplications in order to guarantee a wide public acceptance, by those “users”who typically are not conscious of current technological advances.
Conclusion
The increasing presence of electronic communication devices in urban settings hasthe unfortunate tendency to reduce sociality. As a result, the role of the builtenvironment as an ideal place for producing and sharing information is diminish-ing through the increasing interaction between computers and people. At thesame time, developments in sensing, networking, and displaying technologyhave led to new forms of media that can be located in public spaces. Placing infor-mation media within an urban environment has the advantage of keeping thespatial experience tangible and multimodal, as opposed to the relatively one-sided and passive interactions with smart phones, even those that use augmentedreality features.
The visualization of complex urban data on screens seems a promising tech-nique to shape the next generation of public feedback. In particular, the insightsfrom social visualization form a valuable platform on which applications can bebuilt that have the ability to motivate and engage people in topics relating tourban challenges. Many current examples of urban visualization exist (see alsoTownsend, 2010), though most seem limited to the presentation of single dataattributes (e.g., more or less energy consumption, total number of commutingbicyclists), that miss the opportunity to present more dimensional and richrelationships that form the very basis of the city as a complex system. Whatsuch visualizations should look like, where they should be located, and whatissues they would be ideally suited to tackle, however, are some of the open ques-tions that require further investigation, ideally through research on designmethods. Viable examples might include feedback loops on living quality and sat-isfaction versus historical city investments, the impact of urban and legislativedecision making, the effect of official traffic interventions on real-time traffic per-formance, the role of local inhabitants in creating a unique sense of place, and soon. Two of the fundamental prerequisites that would make this possible in thefuture are the opening of more public data with social interest and local relevancy,and an attitude change in tolerating citizen interventions in the public realm.Accordingly, not all of these applications can be commissioned, managed, orowned by city governments—indeed, an opportunity exists for non-governmentalbodies to publish and manage such civic data, upon which others could buildnovel applications for, and hopefully with the full support of, local citizens.Once a sufficient amount of socially relevant and situated data become freelyavailable, and local authorities have become more tolerant to bottom-up interven-tions within its, and our, public space, new kinds of urban applications willemerge that might even be able to compete with those that exist on today’smobile devices.
In the information society, it has become obvious that our cities are valuableand relevant sources of data that require rigorous aggregation, analysis, andpublic dissemination. This paper aimed to assess the still untapped opportunitiesof media channels other than the traditional computer and smartphone displays.We also argued that by returning urban data to citizens, those data can be used to
Designing for the Situated and Public Visualization of Urban Data 43
Dow
nloa
ded
by [
K.U
.Leu
ven
- T
ijdsc
hrif
ten]
at 1
0:39
08
Oct
ober
201
2

create meaningful insights about the city and to become a form of knowledge thatcan lead to civic action.
Note on Contributors
Andrew Vande Moere is an associate professor at the Department of Architecture,Urbanism and Planning of the University of Leuven (Belgium). He is also the mainauthor behind the weblog “Information Aesthetics” (http://infosthetics.com).
Dan Hill is at Strategic Design Lead, Sitra, Finland, and an adjunct professor in theFaculty of Design, Architecture & Building, UTS, Australia. While with Arup inSydney, he worked on major urban development and building projects world-wide, from Helsinki to Masdar to Barangaroo.
44 Journal of Urban Technology
Dow
nloa
ded
by [
K.U
.Leu
ven
- T
ijdsc
hrif
ten]
at 1
0:39
08
Oct
ober
201
2
Bibliography
W. Abrahamse, L. Steg, C. Vlek, and T. Rothengatter, “A Review of Intervention Studies Aimed atHousehold Energy Conservation,” Journal of Environmental Psychology 25:3 (2005) 273–291.
Arup, C40 Urban Life: Melbourne Smart City (2011).J. Bird and Y. Rogers, “The Pulse of Tidy Street: Measuring and Publicly Displaying Domestic Electri-
city Consumption,” paper presented at Workshop on Energy Awareness and Conservation throughPervasive Applications sat the Eighth International Conference on Pervasive Computing (Helsinki,2010).
S. Bødker, P. Ehn, J. Kammersgaard, M. Kyng, and Y. Sundblad, “A Utopian Experience,” in G. Bjerkneset al., eds., Computers and Democracy: A Scandinavian Challenge (Williston, VT: Avebury, 1988).
G. Brandon and A. Lewis, “Reducing Household Energy Consumption: A Qualitative and QuantitativeField Study,” Journal of Environmental Psychology 19:1 (1999) 75–85.
H. Brignull and Y. Rogers, “Enticing People to Interact with Large Public Displays in Public Spaces,”INTERACT’03 (December 2003) 17–24.
A. Button, “Designing Social Tools for the Bees, the Buzz and the Beehive,” Australasian Conference onComputer-Human Interaction: Designing for Habitus and Habitat, (ACM 2008), 323–326.
F. Calabrese, K. Kloeck, and C. Ratti, “Wikicity: Real-Time Urban Environments,” IEEE Pervasive Com-
puting 6:3 (2007) 52–53.C.M. Danis, F. Viegas, M. Wattenberg, and J. Kriss, “Your Place or Mine? Visualization as a Community
Component,” Conference on Human Factors in Computing Systems (CHI’08), (ACM 2008), 275–284.J. Donath, K. Karahalios, and F. Viegas, “Visualizing Conversation,” Journal of Computer-Mediated
Communication 4:4 (June 1999).C. Egan, Graphical Displays and Comparative Energy Information: What Do People Understand and Prefer?,
Summer Study of the European Coucil for an Energy Efficient Economy (Mandelieu, France, 1999).P. Ehn, Work-Oriented Design of Computer Artifacts (Amsterdam: Lawrence Erlbaum, 1990).A. Fatah gen. Schieck, “Animate Space: Urban Environments as Medium of Communication,” Proceed-
ings of the 5th Space Syntax Symposium, Techne Press 2005, 1019–1031.A. Fatah gen. Schieck, C. Briones, and C. Mottram, “The Urban Screen as a Socialising Platform: Explor-
ing the Role of Place within the Urban Space,” in F. Eckardt et al., eds., MEDIACITY: Situations, Prac-
tices and Encounters (Frank & Timme GmbH, 2008).B.J. Fogg, Persuasive Technology – Using Computers to Change What We Think and Do (San Francisco:
Morgan Kaufmann, 2003).M. Foth, Handbook of Research on Urban Informatics: The Practice and Promise of the Real-Time City
(Hershey, PA: Information Science Reference, 2009).A. Galloway, “Intimations of Everyday Life – Ubiquitous Computing and the City,” Cultural Studies
18:2-3 (2004) 384–408.B. Gaver, “Provocative Awareness,” Computer Supported Cooperative Work (CSCW) 11:3–4 (2002)
475–493.E. Gilbert and K. Karahalios, “Using Social Visualization to Motivate Social Production,” IEEE Trans-
actions on Multimedia 11:3 (2009) 413–421.A. Greenfield and M. Shepard, Situated Technologies Pamphlets 1: Urban Computing and its Discontents
(New York: The Architectural League of New York, 2007).J. Heer, F. Ham, S. Carpendale, C. Weaver, and P. Isenberg, “Creation and Collaboration: Engaging New
Audiences for Information Visualization,” in A. Kerren, J.T. Stasko, J.D. Fekete, C. North, eds., Infor-mation Visualization: Human-Centered Issues in Visual Representation, Interaction, and Evaluation 4950
(Berlin: Springer, 2008).HeHe, “Nuage Vert” (2008) ,www.nuagevert.org. Accessed September 1, 2012.E.M. Huang, A. Koster, and J. Borchers, “Overcoming Assumptions and Uncovering Practices: When
Does the Public Really Look at Public Displays? International Conference on Pervasive Computing,(Berlin: Springer 2009), 228–243.
T. Ishida, “Digital City Kyoto: Social Information Infrastructure for Everyday Life,” Communications ofthe ACM 45:7 (2002) 76–81.
M. Jurmu, H. Kukka, T. Ojala, S. Hosio, T. Heikkinen, T. Linden, and J. Riekki, “UBI-Pilot 2009: Longi-tudinal Living-Lab Deployment of aNetwork of Interactive Large Public Displays,” Street ComputingWorkshop, Co-Located with OZCHI’09 Melbourne, November 23–27, 2009.
T. Kindberg, M. Chalmers, and E. Paulos, “Guest Editors’ Introduction: Urban Computing,” IEEE Per-vasive Computing 6:3 (2007) 18–20.
Designing for the Situated and Public Visualization of Urban Data 45
Dow
nloa
ded
by [
K.U
.Leu
ven
- T
ijdsc
hrif
ten]
at 1
0:39
08
Oct
ober
201
2

K. Luther, S. Counts, K.B. Stecher, A. Hoff, and P. Johns, “Pathfinder: An Online Collaboration Environ-ment for Citizen Scientists,” Conference on Human Factors in Computing Systems (CHI’09), (ACM, 2009),239–248.
B. McGrath, Digital Modelling for Urban Design (London: John Wiley and Sons, 2008).Mikael, “Cykelbarometer – Bicyclists Count in Copenhagen” (2009) ,http://www.copenhagenize.
com/2009/05/bicyclists-count-in-copenhagen.html. Accessed September 1, 2012.W.J. Mitchell, Me++: The Cyborg Self and the Networked City (Boston: MIT Press, 2004).A. Morrison, G. Jacucci, and P. Peltonen, “CityWall: Limitations of a Multi-Touch Environment,”
Public and Private Displays workshop (PPD 08)(2008).A. Morrison and A. Salovaara, “Sustaining Engagement at a Public Display,” Workshop on Public and
Situated Displays to Support Communities. Co-located with OZCHI’08 (Cairns, Australia, December8–12, 2008).
O. Mubin, T. Lashina, and E.v. Loenen, “How Not to Become a Buffoon in Front of a Shop Window: ASolution Allowing Natural Head Movement for Interaction with a Public Display,” ProceedingsConference on Human-Computer Interaction (Interact’09) (Berlin: Springer, 2009), 250–263.
S.A. Nicholson-Cole, “Representing Climate Change Futures: A Critique on the Use of Images forVisual Communication,” Computers, Environment and Urban Systems 29:3 (2005) 255–273.
C. North, “Toward Measuring Visualization Insight,” IEEE Computer Graphics 26:3 (2006) 6–9.K. O’Hara, M. Perry, E. Churchill, and D. Russell, Public and Situated Displays: Social and Interactional
Aspects of Shared Display Technologies (Dordrecht, The Netherlands: Kluwer Academic Publishers,2003).
K. Oosterhuis and N. Biloria, “Interactions with Proactive Architectural Spaces: The Muscle Projects,”Communications of the ACM 51:6 (2008) 70–78.
E. Paulos and C. Beckmann, “Sashay: Designing for Wonderment,” Conference on Human Factors in
Computing Systems (CHI’06), (ACM, 2006), 881–884.S. Read and C. Pinilla, Visualizing the Invisible: Towards an Urban Space (Amsterdam: Techne Press, 2006).realities united, “Big Vortex” (2011) ,http://realities-united.de/#PROJECT,197,1?. Accessed
September 1, 2012.S. Roberts, H. Humphries, and V. Hyldon, Consumer Preferences for Improving Energy Consumption
Feedback, Ofgem – Centre for Sustainable Energy, 2004.A. Townsend, “The Future of Cities, Information and Inclusion” (2010) ,http://iftf.me/public/SR-
1352_Rockefeller_Map_reader.pdf. Accessed September 1, 2012.United Nations, World Urbanization Prospects: The 2007 Revision, UDoEaSA-P Division, 2007.A. Vaccari, F. Calabrese, B. Liu, and C. Ratti, “Towards the SocioScope: An Information System for the
Study of Social Dynamics through Digital Traces,” Proceedings of SIGSPATIAL International Conferenceon Advances in Geographic Information Systems (ACM, 2009), 52–61.
D. van der Maas, M. Meagher, C. Abegg, and J. Huang, “Thermochromic Information Surfaces: Inter-active Visualization for Architectural Environments,” Proceedings of the Conference on Education andResearch in Computer-Aided Architectural Design in Europe (eCAADe’09) 2009).
A. Vande Moere and D. Hill, “Research through Design in the Context of Teaching Urban Computing,”Street Computing Workshop (co-located with OZCHI’09) (Melbourne, Novermber 23–27, 2009).
A. Vande Moere, M. Tomitsch, M. Hoinkis, E. Trefz, S. Johansen, and A. Jones, “Comparative Feedbackin the Street: Exposing Residential Energy Consumption on House Facades,” Conference on Human-Computer Interaction (INTERACT’11) (Berlin: Springer, 2011), 470–488.
R. Venturi, D.S. Brown, and S. Izenour, Learning from Las Vegas: The Forgotten Symbolism of Architectural
Form (Cambridge: MIT Press, 1977).F. Viegas, M. Wattenberg, F. van Ham, J. Kriss, and M. McKeon, “Many Eyes: A Site for Visualization at
Internet Scale,” IEEE Transactions on Visualization and Computer Graphics 13:6 (2007) 1121–1128.M. Weiser, “The Computer for the 21st Century,” Scientific American 265:3 (1991) 94–104.Wikipedia, “National Debt Clock” (2011) ,http://en.wikipedia.org/wiki/National_Debt_Clock.
Accessed September 1, 2012.A. Williams and P. Dourish, “Imagining the City: The Cultural Dimensions of Urban Computing,”
Computer 39:9 (2006) 38–43.
46 Journal of Urban Technology
Dow
nloa
ded
by [
K.U
.Leu
ven
- T
ijdsc
hrif
ten]
at 1
0:39
08
Oct
ober
201
2