detecting changes in soil c pools and dynamics by means of stable isotopes and som fractionation...
TRANSCRIPT
Detecting changes in soil C pools and Detecting changes in soil C pools and dynamics by means of stable isotopes dynamics by means of stable isotopes
and SOM fractionationand SOM fractionation
M.Francesca CotrufoM.Francesca Cotrufo
Dip. Scienze Ambientali
Seconda Università di Napoli
3rd CARBOEUROPE Meeting, Finland 2005
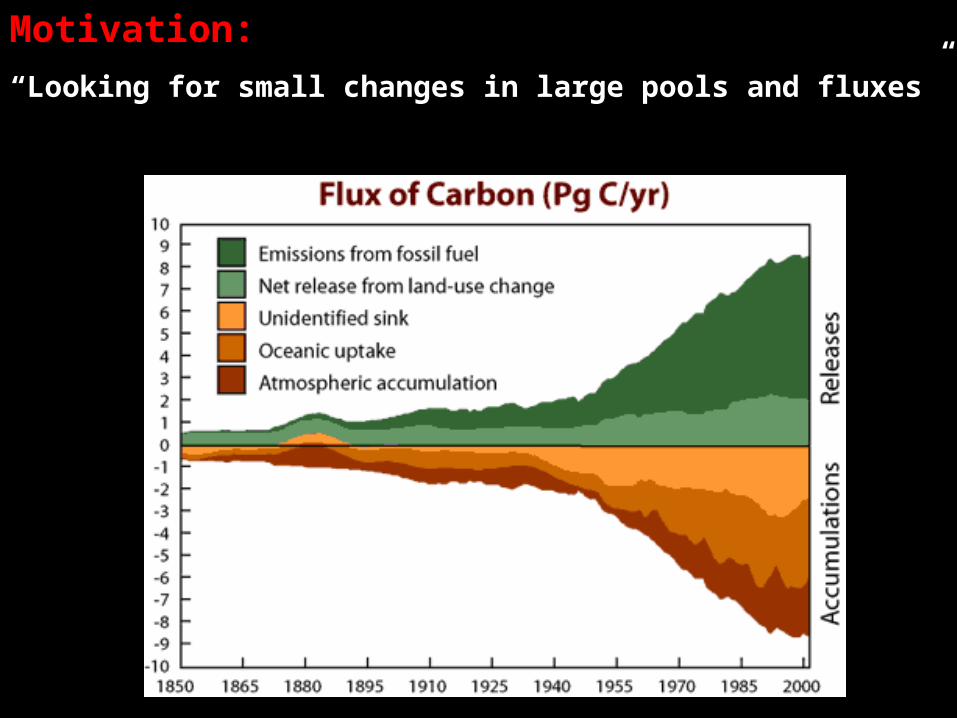
Motivation:
“Looking for small changes in large pools and fluxes”

Organic Matter
Stabilized soil organic carbon
turnover
Fresh soil carbon input
turnover
Soil respirationLitter fall
Wood & Litter decomposition
Root respiration & decomposition
Litter and soil C fluxes
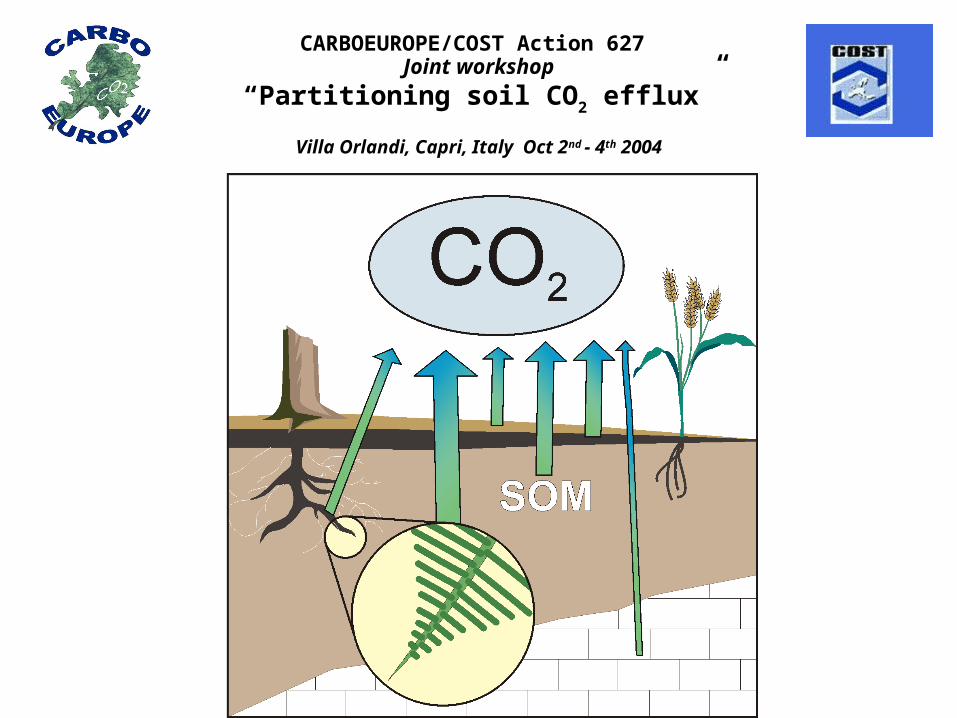
Joint workshop“Partitioning soil CO2 efflux”
Villa Orlandi, Capri, Italy Oct 2nd - 4th 2004
CARBOEUROPE/COST Action 627

0,0
0,2
0,4
0,6
0,8
1,0
1,2
0 500 1000 1500 2000 2500
RS (g C m -2 y-1)
RH /
RS
Heterotrophic contribution to soil respiration
Results of a meta-analytical review
RH/RS = -0.149 ln(RS) +1.569
Subke, Inglima & Cotrufo, GCB Annual Review, 2006

Plant and fungal debris
Clay microstructures
Fungal or microbial metabolites
Biochemically recalcitrant organic matterSilt-sized aggregates with microbially derived organomineral associations
Microaggregates ~ 50-250 m
Particulate organic matter colonized by saprophytic fungi
Decomposing roots and detritus become encrusted with mineral particles forming microaggregates
Decomposition continues at a slow rate in stable aggregates, due to formation of organomineral associations
Eventually, organic binding agents decompose sufficiently for aggregate to be destabilized, accelerating decomposition until new aggregate is formed
The SOM aggregation conceptThe SOM aggregation concept

Fractionation by size and density
scheme
Density flotation
Light fraction(< 1.85 g cm-3)
Intra-microaggregatePOM (iPOM)
Density flotation
Light fraction(< 1.85 g cm-3)
Intra-microaggregatePOM (iPOM)
>250 m fraction<53 m fraction
53-250 m fraction (m)
Wet sieving
Micro-aggregate isolator
Silt + clayCoarse POM
Micro’s (mM)
8 mm sieved soil

HYPOTHESES:
•Afforestation increases aggregate stability and soil C sequestration
• Elevated [CO2] increases aggregation and SOC pools through higher C input
Short-term effects on SOM dynamics after change in land use and exposure to increased [CO2]
The EUROFACE project

EUROFACE
Location: Tuscania, Central Italy (42° 22’ N 11° 48’ E 150 m asl) .
Climate: Annual rainfall 676 mm, annual mean temperature 15 °C.
Project PopFACE (EKV 4-CT96_0657)/ EUROFACE: from 1999 – Establisment of a poplar plantation (P.x euroamericana) on an agricultural region.
6 exsperimental plots, whitin the plantation, each with three poplar species (Populus alba, (clone A), P. nigra, (clone B), e P.x euroamericana, (clone C));
3 plots are exposed to ambient and 3 to elevated (+200 ppm) concentration of CO2 with a FACE (Free Air Carbon dioxide Enrichment) operating system
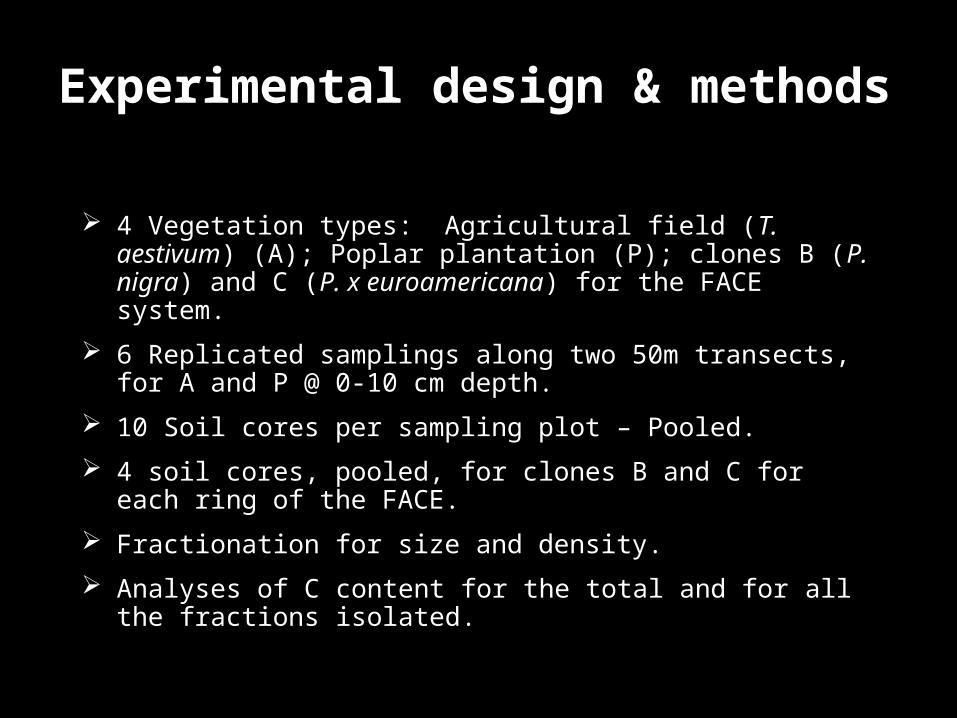
Experimental design & methods
4 Vegetation types: Agricultural field (T. aestivum) (A); Poplar plantation (P); clones B (P. nigra) and C (P. x euroamericana) for the FACE system.
6 Replicated samplings along two 50m transects, for A and P @ 0-10 cm depth.
10 Soil cores per sampling plot – Pooled.
4 soil cores, pooled, for clones B and C for each ring of the FACE.
Fractionation for size and density.
Analyses of C content for the total and for all the fractions isolated.
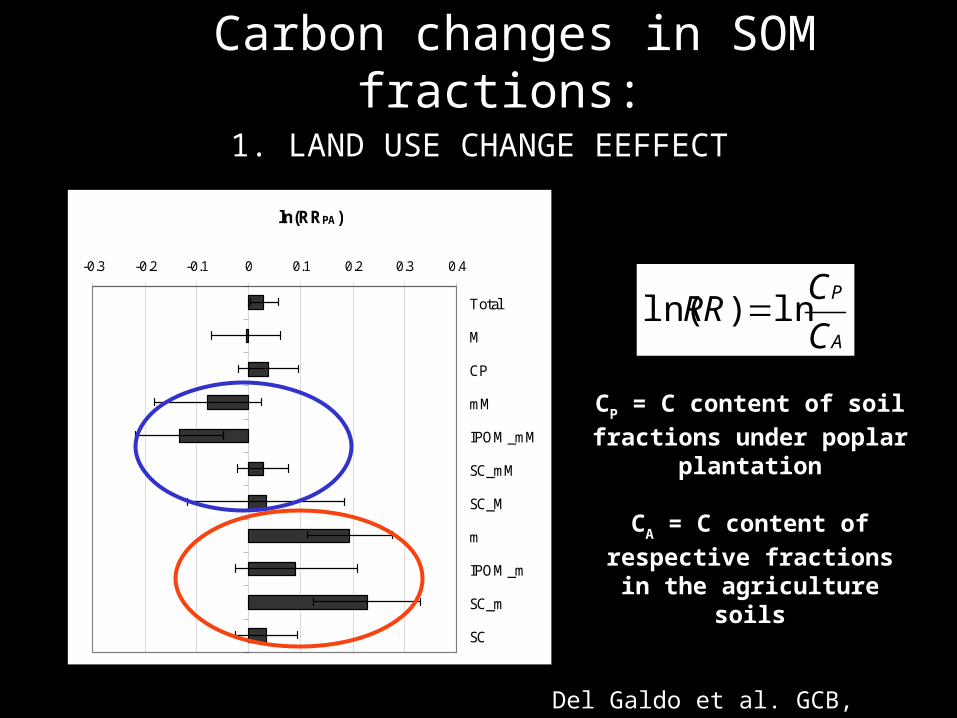
ln(RRPA)
-0.3 -0.2 -0.1 0 0.1 0.2 0.3 0.4
Total
M
CP
mM
IPOM_mM
SC_mM
SC_M
m
IPOM_m
SC_m
SC
Carbon changes in SOM fractions:
1. LAND USE CHANGE EEFFECT
A
P
C
CRR ln)ln(
CP = C content of soil fractions under poplar
plantation
CA = C content of respective fractions in the agriculture soils
Del Galdo et al. GCB, submitted
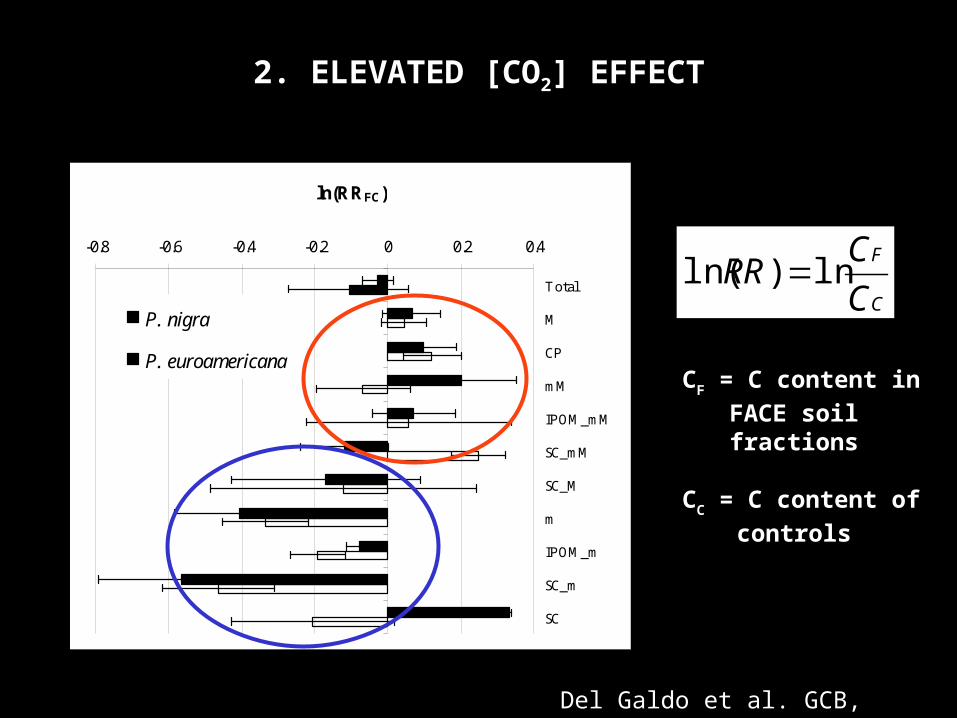
ln(RRFC)
-0.8 -0.6 -0.4 -0.2 0 0.2 0.4
Total
M
CP
mM
IPOM_mM
SC_mM
SC_M
m
IPOM_m
SC_m
SC
P. nigra
P. euroamericana
2. ELEVATED [CO2] EFFECT
CF = C content in FACE soil fractions
CC = C content of controls
C
F
C
CRR ln)ln(
Del Galdo et al. GCB, submitted
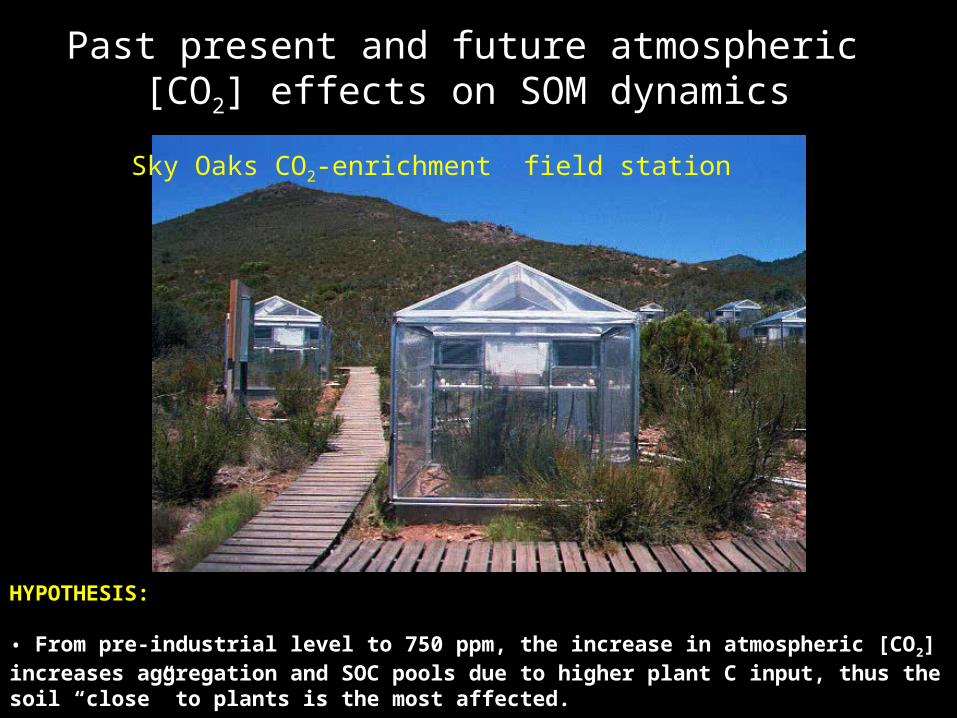
Past present and future atmospheric [CO2] effects on SOM dynamics
Sky Oaks CO2-enrichment field station
HYPOTHESIS:
• From pre-industrial level to 750 ppm, the increase in atmospheric [CO2] increases aggregation and SOC pools due to higher plant C input, thus the soil “close” to plants is the most affected.
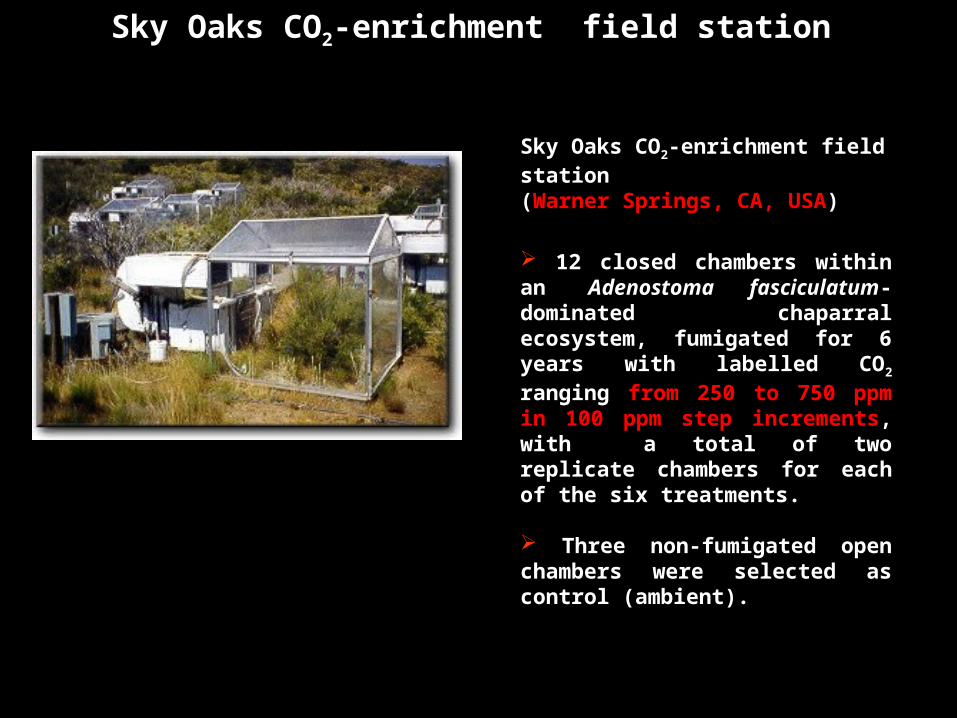
Sky Oaks CO2-enrichment field station (Warner Springs, CA, USA)
12 closed chambers within an Adenostoma fasciculatum-dominated chaparral ecosystem, fumigated for 6 years with labelled CO2 ranging from 250 to 750 ppm in 100 ppm step increments, with a total of two replicate chambers for each of the six treatments.
Three non-fumigated open chambers were selected as control (ambient).
Sky Oaks CO2-enrichment field station
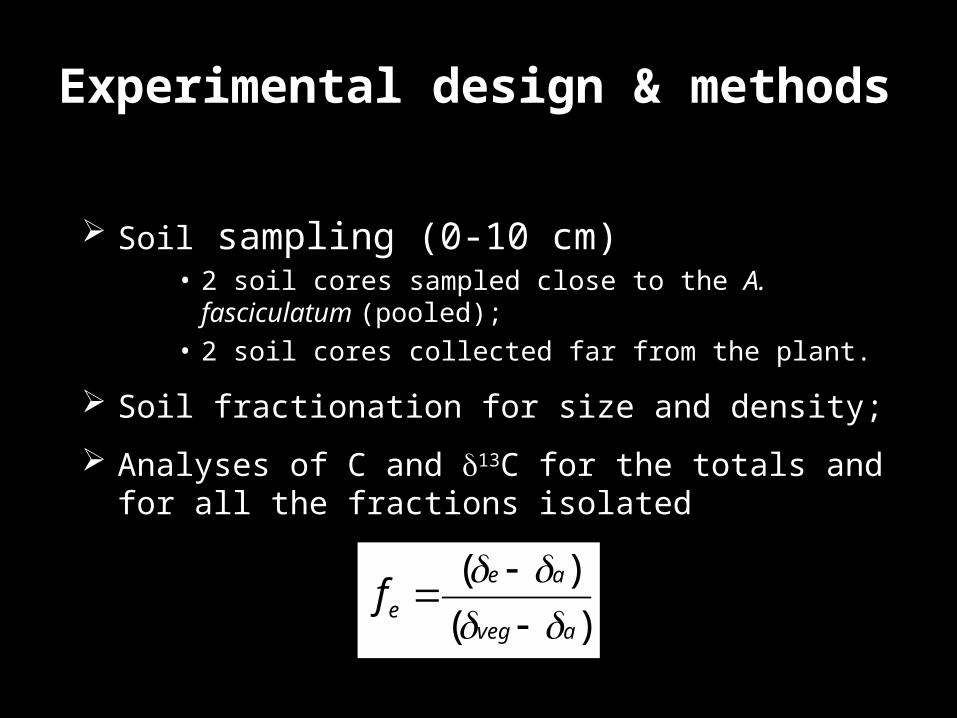
Soil sampling (0-10 cm)• 2 soil cores sampled close to the A. fasciculatum
(pooled); • 2 soil cores collected far from the plant.
Soil fractionation for size and density;
Analyses of C and 13C for the totals and for all the fractions isolated
)(
)(
aveg
ae
e f
Experimental design & methods
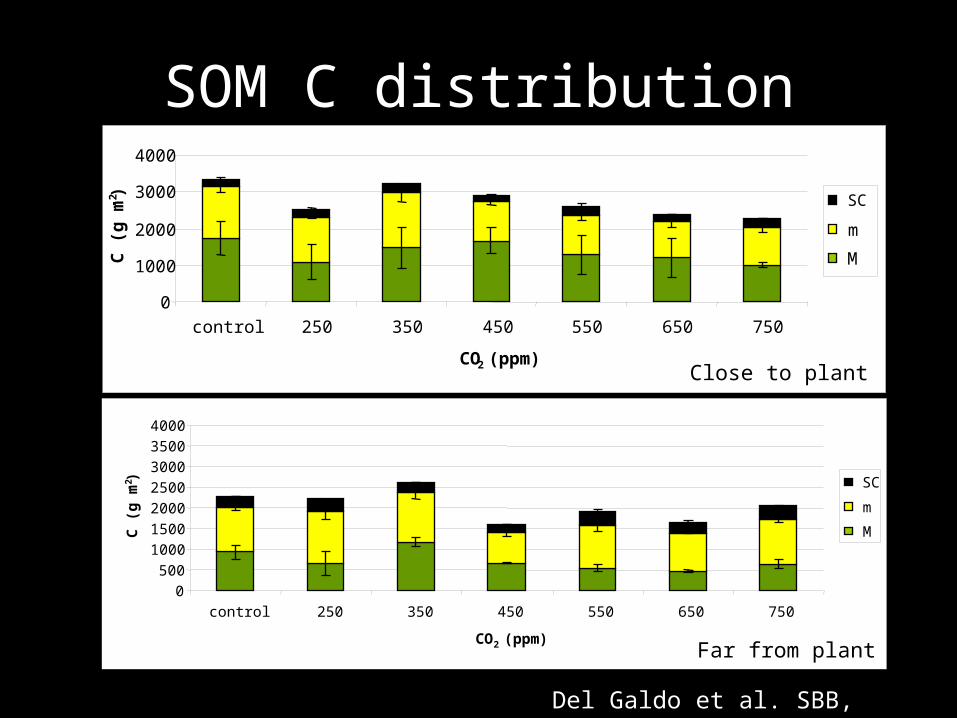
SOM C distribution:
0
1000
2000
3000
4000
control 250 350 450 550 650 750
CO2 (ppm)
C (
g m
-2)
SC
m
M
0
500
1000
1500
2000
2500
3000
3500
4000
control 250 350 450 550 650 750
CO2 (ppm)
C (
g m
-2) SC
m
M
Close to plant
Far from plant
Del Galdo et al. SBB, submitted

Total microaggregates C
R2 = 0.7188
0
500
1000
1500
2000
150 250 350 450 550 650 750 850
CO2 (ppm)
C (
g m
-2)
close
P<0.005
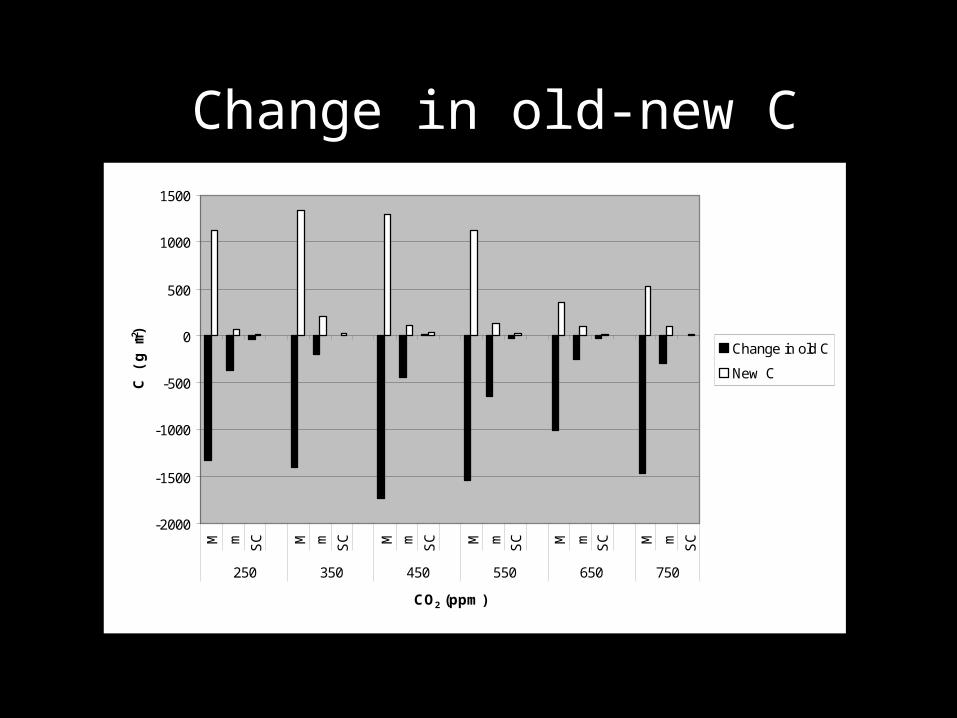
Change in old-new C
-2000
-1500
-1000
-500
0
500
1000
1500M m SC M m SC M m SC M m SC M m SC M m SC
250 350 450 550 650 750
CO2 (ppm)
C (
g m
-2)
Change in old C
New C
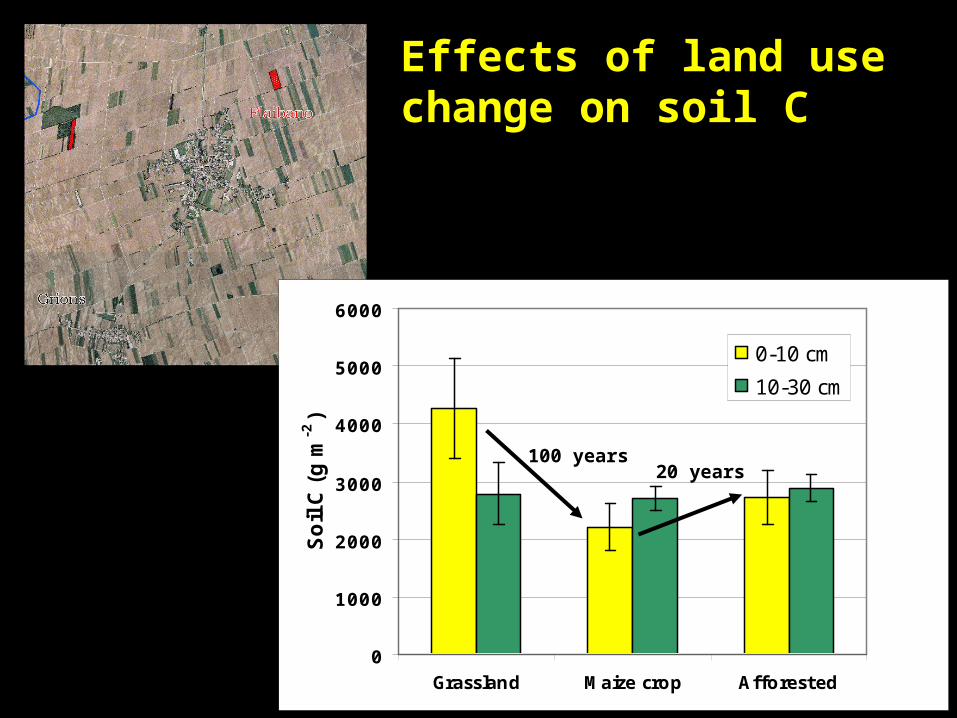
Effects of land use change on soil C
0
1000
2000
3000
4000
5000
6000
Grassland Maize crop Afforested
Soil
C (
g m
-2)
0-10 cm
10-30 cm
100 years 20 years
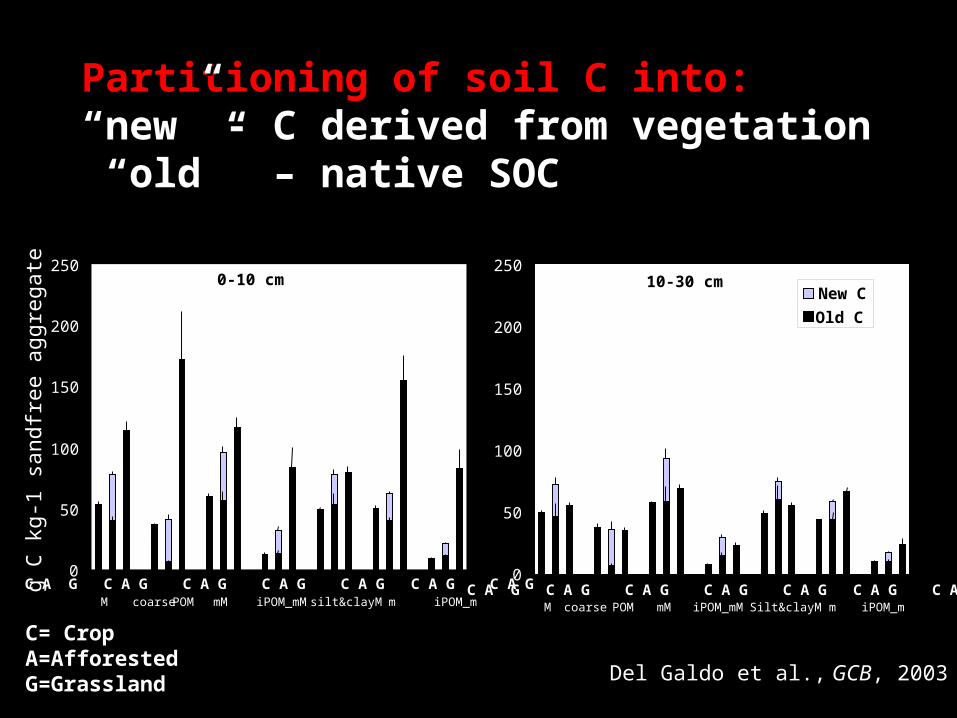
Partitioning of soil C into:Partitioning of soil C into:“new” - C derived from vegetation “new” - C derived from vegetation “old” – native SOC“old” – native SOC
10-30 cm
0
50
100
150
200
250
C A G C A G C A G C A G C A G C A G C A G M coarse POM mM iPOM_mM Silt&clayM m iPOM_m
0-10 cm
0
50
100
150
200
250
C A G C A G C A G C A G C A G C A G C A G M coarse POM mM iPOM_mM silt&clayM m iPOM_m
g C
kg-1
sandfr
ee a
ggre
gate
C= CropA=AfforestedG=Grassland
New C
Old C
Del Galdo et al., GCB, 2003
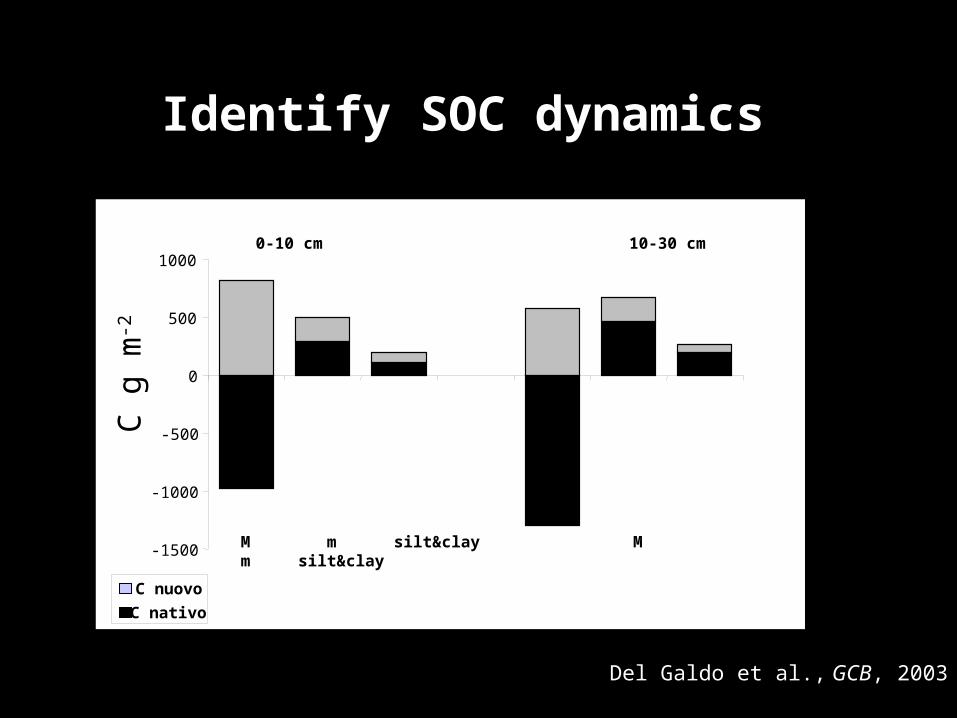
Identify SOC dynamics
-1500
-1000
-500
0
500
10000-10 cm 10-30 cm
M m silt&clay M m silt&clay
C g
m-2
C nuovo
C nativo
Del Galdo et al., GCB, 2003

Decomposition rate (y-1) calculated for the old carbon of all measured physical fractions of afforested soil assuming an eponential decay {k=-ln(Cold/Ctotal)/t}. Default values decomposition rates of Roth C model are reported for comparison. Standard errors in parenthesis.n.d.= not detectable.
Measured decomposition rate factors (y-1)
M
> 250 m
m
53-250 m
Silt&clay
< 53 m
Total
Fraction
Coarse
POM
mM
IPOM
mM
silt&clayM Total
Fraction
IPOM
m
Total
Fraction
0.039
(>0.3)
0.108
(>0.3)
0.042
(>0.3)
0.024
(>0.3)
0.008
(>0.3)
n.d.
n.d.
n.d.
RothC decomposition rate factors (y-1)
Decomposable
Plant Material
DPM
Resistant Plant
Material
RPM
Humified Organic
Matter
HUM
Microbial
Biomass
BIO
Inert Organic
Matter
IOM
10 0.3 0.02 0.66 0.00
Del Galdo et al., GCB, 2003
“Modelling the measurable” “Measuring the modellable”
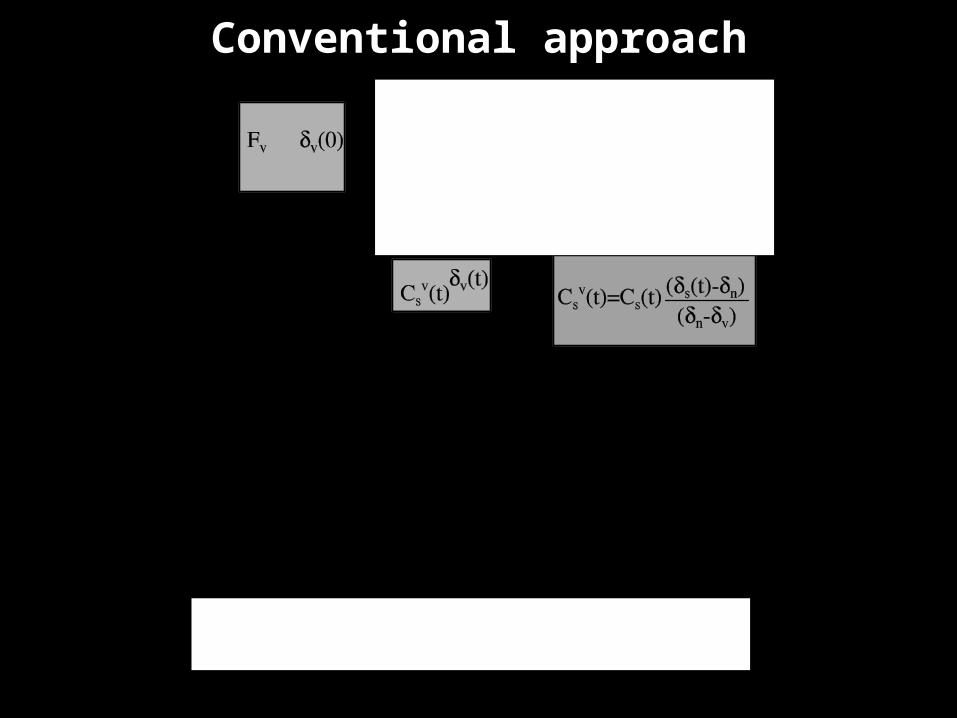
Fr(t)
r(t)
s(t)
Conventional approach

Fr(t)
r(t)
s(t)
The soil is a dynamic system!
Rubino et al., in progress
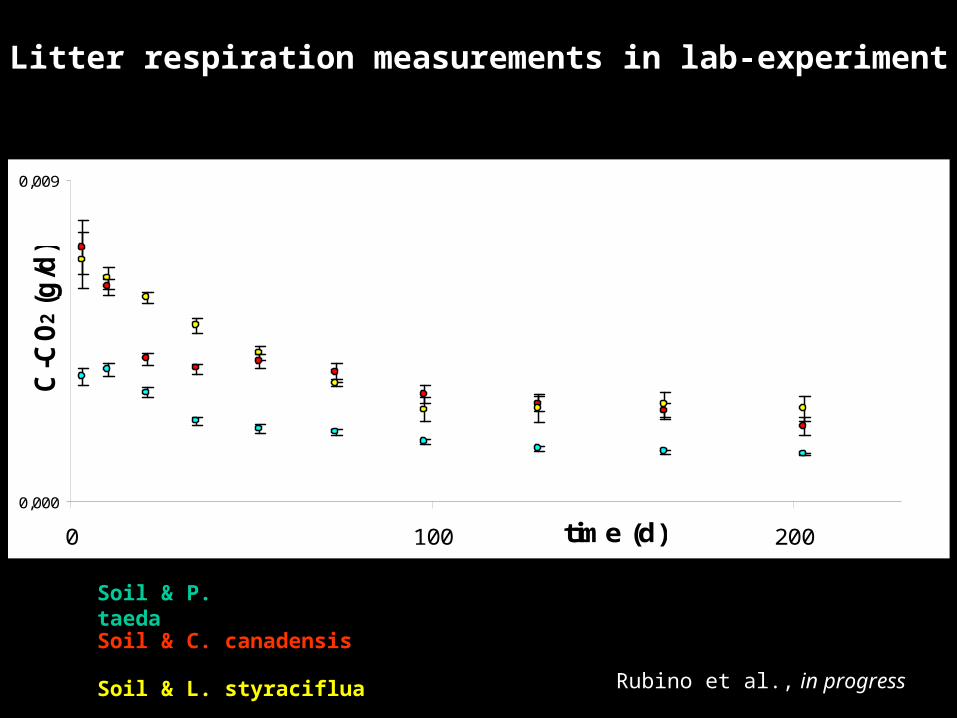
Litter respiration measurements in lab-experiment
0,000
0,009
0 100 200time (d)
C-C
O2
(g/d
)
Soil & P. Soil & P. taedataedaSoil & C. canadensisSoil & C. canadensis
Soil & L. styracifluaSoil & L. styraciflua

Rubino et al., in progress
Dynamics of 13C-CO2
-17,7 -17,9
-43,9
-43,0-43,4-43,3
-43,7
-47,0
-15,0
0 100 200time (d)
13
C-C
O2
(‰)
Soil & P. Soil & P. taedataedaSoil & C. canadensisSoil & C. canadensis
Soil & L. styracifluaSoil & L. styraciflua
Bulk soil
Bulk litters
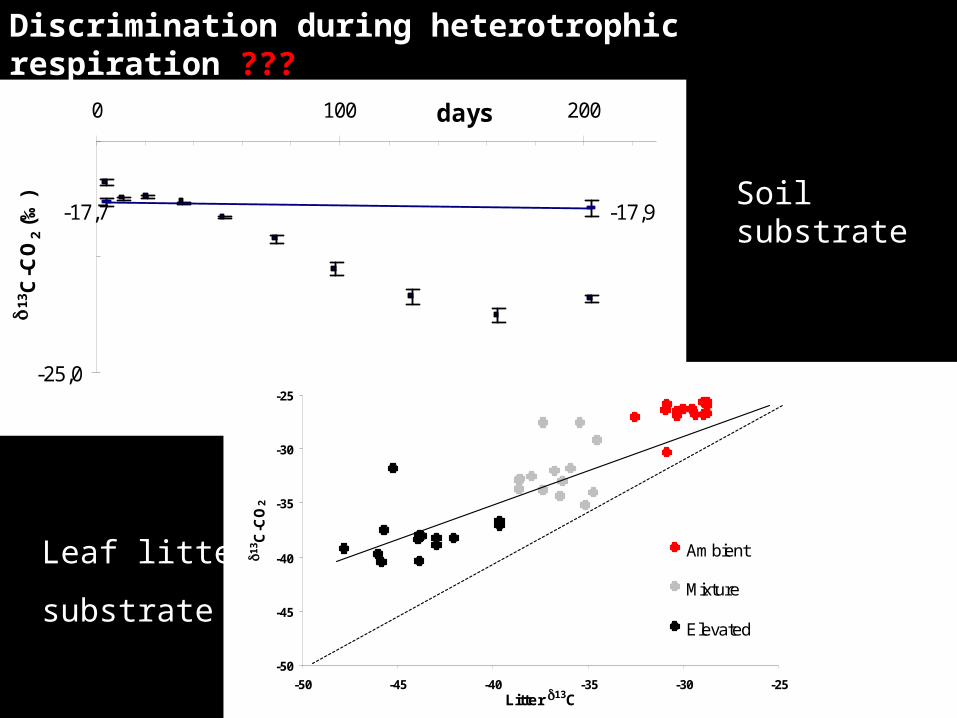
Discrimination during heterotrophic respiration ???
Soil substrate
1:1
J. phaenicia
P. lentiscus
C. mospeliensisLeaf litter
substrate
-17,7 -17,9
-25,0
0 100 200days
13C
-CO
2 (‰
)
-50
-45
-40
-35
-30
-25
-50 -45 -40 -35 -30 -25Litter 13C
13C
-CO
2
Ambient
Mixture
Elevated
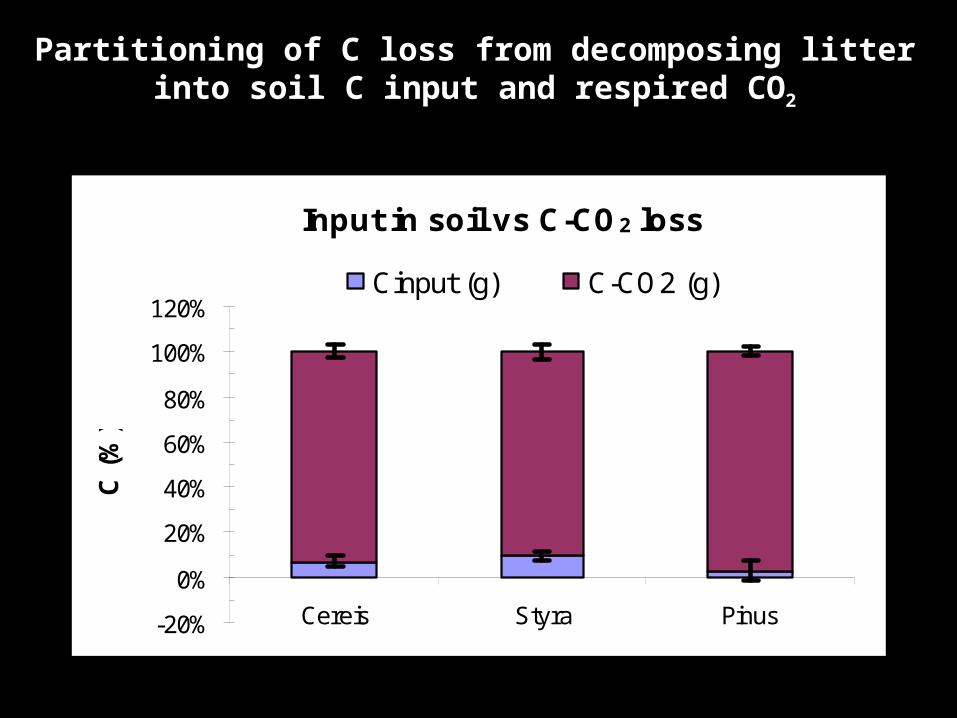
Partitioning of C loss from decomposing litter into soil C input and respired CO2
Input in soil vs C-CO2 loss
-20%
0%
20%
40%
60%
80%
100%
120%
Cereis Styra Pinus
C (
%)
Cinput (g) C-CO2 (g)
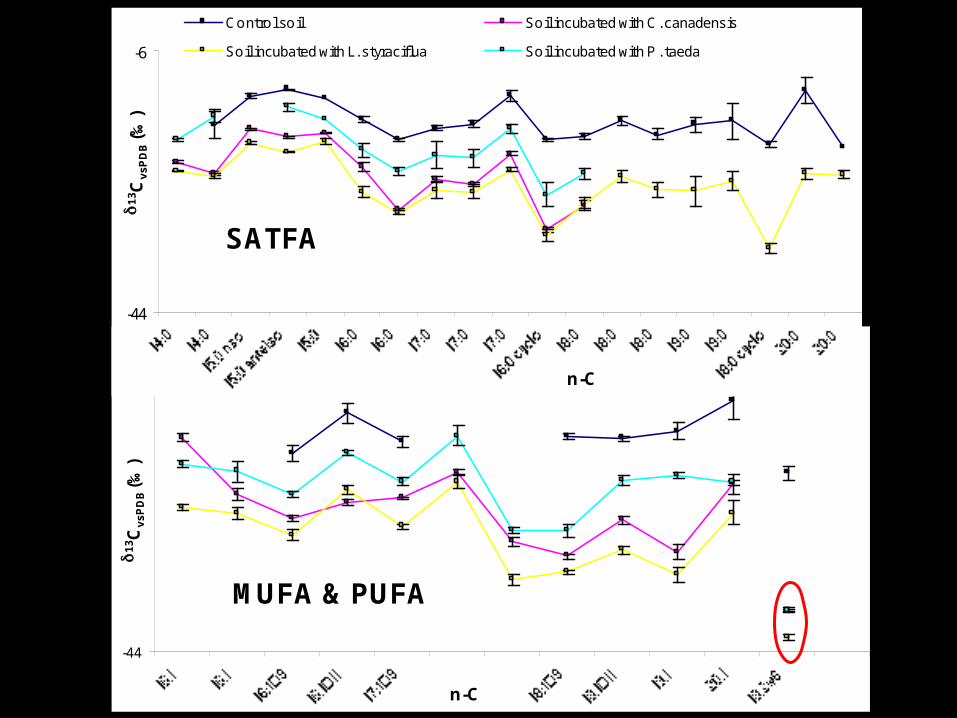
MUFA & PUFA
-44
-6
n-C
13C
vs
PD
B(‰
)
Control soil Soil incubated with C. canadensis
Soil incubated with L. styraciflua Soil incubated with P . taeda
SATFA
-44
-6
n-C
13C
vsP
DB
(‰)
Control soil Soil incubated with C. canadensis
Soil incubated with L. styraciflua Soil incubated with P . taeda

Rubino et al., in progress
Identification of SOM chemical
compounds where litter derived C is
allocated
Soil only
0
50
100
Are
a (%
)
-50
-25
13C
(p
er m
il)
Soil with litter-derived C
0
50
100
Are
a (%
)
-50,0
-25,0
13 C
(p
er
mil
)

CONCLUSIONS
Coupling of SOM fractionation by size and density and stable C isotope “labelling” proved to be a useful approach to quantify changes in soil organic C pools
Elevated atmospheric CO2 appears to increase soil C losses proportionally more than inputs, resulting in a net decrease of soil C. Is it a true effect or rather due to the “step change” of manipulation “step change” of manipulation studies??studies??
After 20 years, afforestation increased the total amount of soil C by 23% and 6% in the 0–10 and in the 10–30cm depth layer, respectively. Forest-derived carbon contributed 43% and 31% to the total soil C storage in the afforested systems in the 0–10 and 10–30cm depths, respectively. Furthermore, afforestation resulted in significant sequestration of new C and stabilization of old C in physically protected SOM fractions, associated with microaggregates (53–250 m) and silt&clay (<53 m).
II.. Del Galdo, Del Galdo, G. Battipaglia, T. Bertolini,G. Battipaglia, T. Bertolini, I I.. Inglima, M Inglima, M.. Rubino, Rubino, F. Marzaioli, D. Piermatteo, C. LubrittoF. Marzaioli, D. Piermatteo, C. Lubritto

APPENDIX
Cs(t) = Csv(t) + Cs
n(t)
s(t)Cs(t) = vCsv(t) + n(t)Cs
n(t)
f’ Csv(t)/Cs(t) = [s(t) - n(t)]/[v - n(t)]
f Csv(t)/Cs(t) = [s(t) - s(0)]/[v - s(0)]
Fr(t) =Frv(t) +Fr
n(t)
rFr(t) = rvFr
v(t) + rnFr
n(t)
Fr(t) [r(t) - s(0)] = Frv(t) [v - n(t)]
Frn(t) = ksCs
n(t) Frv(t) = Fvkv + ksCs
v(t)
ks = [Fr(t)/Cs(t)] * [δr(t)- δv]/[δs(t)- δv]
Cs(t) - Cs(0) = Csv(t) - Fr
s(t) dt
Cs(t) - Cs(0) = Cs(t) [δs(t) - δs(0)]/[ δv - δs(0)] - Fr(t) [δr(t) - δv]/[δs(0) - δv] dt
Cs(t) - Cs(0) = f · Cs(t) – Fr(t) · Rs/Rt dt
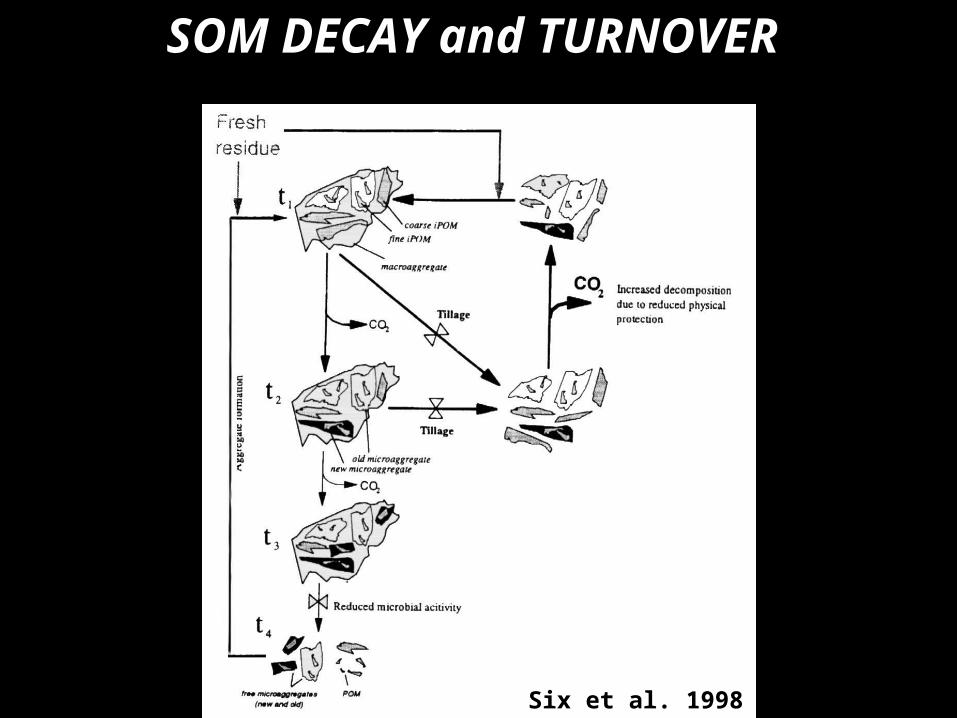
SOM DECAY and TURNOVER SOM DECAY and TURNOVER
Six et al. 1998