determining the maximal recoverable volume of … · determining the maximal recoverable volume of...
TRANSCRIPT

Western Washington UniversityWestern CEDAR
WWU Masters Thesis Collection WWU Graduate and Undergraduate Scholarship
Summer 2017
Determining the Maximal Recoverable Volume ofResistance Training in Tonnage during a StrengthPhasePatrick C. CastelliWestern Washington University, [email protected]
Follow this and additional works at: http://cedar.wwu.edu/wwuet
Part of the Kinesiology Commons
This Masters Thesis is brought to you for free and open access by the WWU Graduate and Undergraduate Scholarship at Western CEDAR. It has beenaccepted for inclusion in WWU Masters Thesis Collection by an authorized administrator of Western CEDAR. For more information, please [email protected].
Recommended CitationCastelli, Patrick C., "Determining the Maximal Recoverable Volume of Resistance Training in Tonnage during a Strength Phase"(2017). WWU Masters Thesis Collection. 603.http://cedar.wwu.edu/wwuet/603
Determining the Maximal Recoverable Volume of Resistance Training in Tonnage
during a Strength Phase
By
Patrick C. Castelli
In Partial Completion
Of the Requirements of the Degree
Masters of Science
Kathleen Kitto, Dean of the Graduate School
ADVISORY COMMITTEE
Chair, Dr. Dave Suprak
Dr. Lorrie Brilla
Ph.D. Candidate, Alex Harrison

MASTER’S THESIS
In presenting this thesis in partial fulfillment of the requirements for a master’s degree at
Western Washington University, I grant to Western Washington University the non‐
exclusive royalty‐free right to archive, reproduce, distribute, and display the thesis in any
and all forms, including electronic format, via any digital library mechanisms maintained by
WWU.
I represent and warrant this is my original work, and does not infringe or violate any rights
of others. I warrant that I have obtained written permissions from the owner of any third
party copyrighted material included in these files.
I acknowledge that I retain ownership rights to the copyright of this work, including but not
limited to the right to use all or part of this work in future works, such as articles or books.
Library users are granted permission for individual, research and non‐commercial
reproduction of this work for educational purposes only. Any further digital posting of this
document requires specific permission from the author.
Any copying or publication of this thesis for commercial purposes, or for financial gain, is
not allowed without my written permission.
Signature: Patrick C. Castelli
Date: July 21, 2017
Determining the Maximal Recoverable Volume of Resistance Training in Tonnage during a
Strength Phase
A Thesis
Presented to
The Faculty of
Western Washington University
In Partial Fulfillment
Of the Requirements for the Degree
Masters of Science
By
Patrick C. Castelli
July 2017

iv
Abstract
Maximal recoverable volume (MRV) has been described as the maximal volume
load an individual can accumulate, recover from, and respond to positively. There has been
little research conducted in attempts to quantify this load.
The purpose of this study was to determine the relative MRV of resistance training in
total volume load, and employ a multiple regression model consisting of initial volume load
(VL_initial) and maximum relative strength (RS) (1RM back squat divided by body weight)
to define a method to accurately predict this upper tolerable limit.
VL_initial for each exercise was calculated as the product of the number of sets
performed, the load on the bar, and three repetitions. The subjects performed sets of three
repetitions at 80% 1RM until the average barbell velocity decreased by 7% compared to the
fastest velocity collect during that session. While volume load was increased by 17% each
week after determining the VL_initial, subjects performed weekly performance tests until
overreaching was seen, marked as a 10% decrease in any two or three performance tests.
These performance tests included vertical jump height, single rep peak velocity and average
velocity of two sets of three repetitions of back squats at 80% of 1RM
Multiple regression analyses were conducted, with both VL_initial and RS as
predictors for total volume load (VL_total), and volume load of the final week (VL_final).
This model revealed that VL_initial and RS significantly predicted both VL_total (F[2,11] =
52.88, p < 0.001, R2-adj. = 0.89), and VL_final (F[2,11] = 59.54, p <0.001, R2-adj. = 0.90).

v
Acknowledgments
Thank you to Dr. Lorrie Brilla for all the help you’ve provided in the last two years
with regards to not only this master’s program, but many life lessons along the way. Thank
you for always keeping me honest, brutally honest when it’s most needed. Whether calling
out a particular writing style of mine, reminding me to expel any limitations I set, and
reminding me to demand more from myself. A real “paisano”.
Thank you to Dr. David Suprak, who is often deserving a lot more credit than is
given. It’s no surprise so many have taken to you as a mentor, yet often overlooked just how
many people you care after. I was fortunate to start my education in exercise science at
Western Washington University under your tutelage, and ironically enough, started what’s
become a near decade of history at this institution the same year as you. I think I owe you
more than a thank you, as I likely wouldn’t be finishing this master’s program without you
ever getting me back into school to continue my education without you.
With that said, I’d like to thank Howie “the Kid” Clark. In my gap years between
degrees working a full-time job, I don’t think anyone was as supportive as you were.
Undoubtedly the driving force in recommending I pursue this master’s degree. Thank you
for recognizing my potential and not letting me waste it working a less-than-fulfilling job
behind a desk, instead of learning and coaching.
I’d like to thank Alex Harrison for being so much more than a critical chair on this
committee. You’ve opened my eyes to so much more in this field, and every experience I’ve
ever had with you leaves me wanting more. I can’t tell you how many times I’ve been
quoted as saying, “I want to know what that guy knows!” in referring to you. Thank you for
being a friend, and a mentor, as someone I look up to in sport performance as an athlete, and
a coach.
Thank you to my research assistants. Josh “subject alpha” Boone, thank you for
being a constant positive influence throughout this entire study, not only as my assistant, but
thank you for being the guinea pig that let me try this crazy idea on you first. Annaliese
“Banana” Wegner, thank you for all your help and a constant excitement to learn. I don’t
think I’ve met anyone who has come along as far as you have in this program as fast as you
have and it is a testament to your work ethic.
To my parents, Carmela and Gennaro, relentless reminders of what can be
accomplished through hard, honest work. You’ve both been an absolute inspiration to me,
and fantastic role models. When things get tough, I can always look to my dad and
remember I have no excuse, when he has literally built a beautiful with my mom from
nothing but a suitcase off a boat, and not speaking the language. What excuse could I have,
when the two of you have broken every limitation or barrier set in front of you? I love you
both.
To my loving fiancé, this has been quite the rollercoaster of experiences. Finding you
again when I started this master’s program will always be one of the best things to ever
happen to me. Through late nights, coffee shortages, and constant travels, adventures, and
moves, you have been a true constant. I am always inspired you, and while others may have
helped me get to this program, no one helped me get through it with these marks like you
have. I love you, Nicole Yvette Kelp.
vi
Contents Abstract ................................................................................................................................... iv
Acknowledgments ................................................................................................................... v
List of Tables ........................................................................................................................ viii
List of Figures ......................................................................................................................... ix
List of Appendices ................................................................................................................... x
Chapter I .................................................................................................................................. 1
The Problem and Its Scope ...................................................................................................... 1
Introduction .......................................................................................................................... 1
Purpose of the Study ............................................................................................................ 4
Statement of the Hypothesis ................................................................................................ 5
Significance .......................................................................................................................... 5
Limitations of the Study ....................................................................................................... 5
Definition of Terms .............................................................................................................. 7
Chapter II ............................................................................................................................... 10
Review of Literature .............................................................................................................. 10
Introduction ........................................................................................................................ 10
Linear vs Undulating (Nonlinear) Periodization ................................................................ 11
Daily Readiness to Train Measurements ........................................................................... 16
Rating of Perceived Exertion (RPE). ............................................................................. 17
Performance Testing. ...................................................................................................... 19
Summary ............................................................................................................................ 20
Chapter III .............................................................................................................................. 23
Methods and Procedures ........................................................................................................ 23
Introduction ........................................................................................................................ 23
Description of Study Sample ............................................................................................. 23
Design of the Study ............................................................................................................ 24
Data Collection Procedures ................................................................................................ 25
Instrumentation. .............................................................................................................. 25
Measurement techniques and procedures. ......................................................................... 25
Training Program Description. ....................................................................................... 27

vii
Data Analysis ..................................................................................................................... 30
Chapter IV ............................................................................................................................. 32
Results and Discussion .......................................................................................................... 32
Introduction ........................................................................................................................ 32
Subject Characteristics ....................................................................................................... 33
Results ................................................................................................................................ 34
Multiple regression analysis. .......................................................................................... 34
Discussion .......................................................................................................................... 37
Limitations ......................................................................................................................... 41
Chapter V ............................................................................................................................... 44
Summary and Conclusions .................................................................................................... 44
Summary ............................................................................................................................ 44
Conclusion ......................................................................................................................... 45
Recommendations .............................................................................................................. 45
Future research. .............................................................................................................. 45
Practical applications. ..................................................................................................... 46
References .............................................................................................................................. 48
viii
List of Tables
Table 1. Subject Characteristics. ........................................................................................... 33
Table 2 Average weekly Volume Load, Rating of Perceived Exertion (RPEave), Peak
Velocity (Vpeak), Average Velocity (Vave), and Jump Height. ........................................... 35
Table 3 Displaying the average of all weekly performance tests, their percent change from
the previous week, average weekly RPE and the absolute weekly change, as the relative
volume load in tons increased by 17% each week. ............................................................... 36
Table 4. Comparing RS between all subjects and those who elected to re-test their 1RMs . 36

ix
List of Figures
Figure 1. A graphical representation of the changes in RPE and percent changes of the
performance tests over each week, as the relative tonnage achieved in week one was
increased each week by 17%. .................................................................................................38
x
List of Appendices
Appendix A: Human Subjects Review Form and Responses ................................................ 54
Appendix B: Informed Consent ............................................................................................. 67
Appendix C: NSCA Guidelines for 1RM Testing Protocol .................................................. 69
Appendix D: Sample training program load increase for the back squat .............................. 71
Appendix E: Weekly training program layout....................................................................... 73
Appendix F: Weekly training log .......................................................................................... 75
Appendix G: Pre- and post-training program testing of 1RM strength ................................. 77
Appendix H: Statistical Analysis and SPSS Outputs ........................................................... 79
Chapter I
The Problem and Its Scope
Introduction
When designing any resistance training program, general principles of progression,
overload, and specificity are a crucial foundation. Any resistance training program designed
for an individual should accomplish specific goals and be built with the specific purpose to
achieve them with intensities that overload and provide a stimulus for the individual to cause
super-compensation and adaptations. The intensities and demands placed on the individual
should increase progressively as the individual becomes adapted to the stimuli (Baechle &
Earle, 2015). However, progression is not always maintained in a steady fashion with
constant improvements over time (Baechle & Earle, 2015). It is important that the resistance
training programs take some form of periodization, and not just a random assortment of load
and volume, in order to prevent stagnation. Periodization itself is the structuring and
organization of planned variations in specificity, intensity, and volume over phases or
“periods” of training (Baechle & Earle, 2015). The avoidance of stagnation and plateaus in
positive adaptations is a primary purpose of applying periodization, and thus increases the
effectiveness of the time spent training (Baechle & Earle, 2015; Fleck, 1999; Hoffman,
2002; Kraemer, 2007).
Many studies have demonstrated that implementing a program strategy, such as
periodized training programs, are more effective than non-periodized training programs
(Baker, 1994; Kraemer, 1997; Rhea, Ball, Phillips, & Burkett, 2002a; Stone, et al., 2000),
however, there are multiple methods of implementing periodization. Two of the most

2
common periodization models include linear and daily undulating (non-linear) periodization
(Hoffman, 2002). When comparing the effectiveness of these two popular styles of
periodization, studies have shown improvements in performance, strength, endurance, and
power after examination with some studies showing undulating periodization to be superior
(Baker, 1994; Kraemer, 1997; Rhea, et al., 2002a) and some showing no significant
difference between the two (Buford, 2007; Hoffman, 2009; Peterson, 2008; Rhea, 2003). It
would appear that nonlinear periodization is just as, if not more, effective than the more
traditional linear periodization models.
When evaluating the effectiveness of training programs, a focus on avoiding
stagnation and plateaus is often as important as avoiding overtraining. On one side of the
spectrum, a lack of novel stimuli will not yield any progress in the adaptations derived from
training, while an over application of training stress, such as too many novel stimuli or too
much volume and/or intensity, may lead to negative effects, such as overtraining. One
method of monitoring the amount of stimulus from resistance training is to track the total
volume load, expressed as tonnage defined as summation of sets times repetitions multiplied
by the load for that set. When programmed with proper application, overreaching protocols
can have positive effects to break performance plateaus, however it could also be
detrimental to the individual’s performance if used incorrectly, which outlines the difference
between functional and non-functional overreaching. Overreaching itself is often described
as a physiological state in which an individual ceases to make performance increases, or
even experiences a temporary performance decrease when training stimuli is too high for a
prolonged period of time with volumes and intensities that are unmanageable at that given
time (Armstrong, 2002; Baechle & Earle, 2015; Borselen, 1992; Bushie, 2007).

3
When non-functional overreaching is left unmanaged for some time without a
decrease in training intensity, training volume, or both, subjects may transition into a state of
chronic fatigue known as overtraining syndrome (Hoffman, 2002). Overtraining syndrome is
a severe state that typically follows prolonged non-functional overreaching, in which, some
cases have taken several weeks or months of recovery before the individual returns to
his/her previous state (Armstrong, 2002; Borselen, 1992; Bushie, 2007; Fry, 1997; Lemyre,
2007; Stone, 1991; Urhausen, 2002). Symptoms of overtraining include increases in resting
heart rate, muscle soreness and pain, with decreases in sport performance, maximal power
output, muscular strength, appetite, as well as other symptoms such as weight loss, irregular
sleep patterns, decreased willingness to train, irritability, and frequent illness (Armstrong,
2002; Borselen, 1992; Fry, 1997; Stone, 1991; Urhausen, 2002).
The interest in resistance training among the recreational fitness enthusiast such as
amateur bodybuilding, strongman, powerlifting and weightlifting, and the use of resistance
training by a majority of athletes around the world, is growing. It would be useful to develop
methods of managing the training programs to avoid non-functional overreaching and
effectively administer planned methods of functional overreaching when appropriate, such
as in the case of a higher-level athlete who is in need of specialized stimuli for adaptation.
How to go about applying a functional overreaching dose is an on-going discussion among
strength coaches, personal trainers, and those in charge of program design. It has been
suggested that the use of monitoring the total volume load in tonnage of a program may
decrease the risk of overtraining, so long as an upper tolerable limit has been identified, and
increase the effectiveness and performance of the training cycle (Peterson, 2008).

4
While many strength coaches utilize methods of monitoring training programming
details as well as the total volume load their athletes experience, respond positively to, and
recover from, there is currently no way of determining exactly how much volume is
normally beneficial. This study considered the idea of defining an athlete’s relative
maximum recoverable volume of resistance training in tonnage per week, as well as the
cumulative tonnage over the course of the training program until subjects began to
demonstrate symptoms of functional overreaching. This was done with the use of weekly
readiness monitoring via performance measures to determine the total volume load
achievable before non-functional overreaching was demonstrated. Then a multiple
regression model was used in order to predict this volume beforehand to yield more
effective training programs and effective applications of functional overreaching.
Purpose of the Study
The purpose of this study was to determine the relative maximum recoverable
volume of resistance training in total volume load. This study sought to employ a multiple
regression model consisting of beginning work capacity and relative strength (1RM back
squat divided by body weight) to define a method to accurately estimate this upper tolerable
limit through regression equations to develop a novel approach to designing resistance
training programs. More specifically, to develop a system of easily collected outcome
measures to determine the appropriate maximal level of volume for a particular training
block. These measures included body weight, RPE, vertical jump height, and bar velocity
during a back squat. These measures have been used to determine athlete’s readiness to train
and respond positively to the training stimulus, or if adjustments need to be made to
decrease the stimulus of the upcoming training session. The effectiveness of the training

5
program was expressed via comparison of the pre- and post-training program strength
measurements and work capacity prior to non-functional overreaching.
Statement of the Hypothesis
A correlation that which will be tested across the subjects between their maximal
recoverable volume in training, and at least one other dependent variable, such as an
athlete’s one relative strength (RS), and starting work capacity (VL_initial). These two
variables, RS and VL_initial, will significantly predict total volume load, and final week
volume load.
Significance
This study is important to any athlete or any fitness enthusiast who partakes in
resistance training. It may reveal a method of easily determining the amount of volume an
individual can respond positively to, in their training program, without causing non-
functional overreaching or overtraining. The findings of this study could produce a viable
and easy to use method of incorporating more individualization to any training program, by
simply adjusting the maximum value of volume the athlete can work up to in any given
training phase. The possibility of going into a state of non-functional overreaching or
overtraining syndrome could also be reduced, saving weeks or even months of recovery and
increasing the overall effectiveness of any training program (Fry, 1997).
Limitations of the Study

6
1. The subjects in this study included Western Washington University students and only
represent a portion of the population between the ages of 18 and 25 years old. The results
of this study do not hold the same validity in other populations outside of this age group.
2. All subjects were required to have a minimum of one year of experience with resistance
training, and familiarity with the back squat, bench press, and deadlift, with proper form
being assessed during the first week of testing. However, subjects who were more
experienced with strength training may have a reduced training affect from the
intervention, where the less experienced subjects may show greater increases in test
results simply from technical improvements in the tested movements. It is also likely that
subjects with a longer training history will have developed a higher relative maximal
recoverable volume and higher maximum strength levels than those subjects with just one
year of resistance training experience.
3. Lack of adherence to the program could potentially impact the results. Subjects need to
complete all of the training set forth in the program provided by the researcher. For those
subjects who missed more than three training sessions, they were allowed to continue
with the training program, however, their data was omitted from the study.
4. Lack of honest self-reported evaluations on the RPE scale after each training session
could affect the data analyzed from these additional readiness indicators. This was
addressed by explaining to the subjects that there is no wrong answer or penalty
regardless of their answers, and that their RPE should be reported as honestly as possible.
5. Motivation within subjects could differ greatly in their intentions to train with serious
intensity and focus, especially during the pre- and post-intervention testing, or in their
7
efforts with regards to jump performance testing and sleep duration. This could not only
effect the testing measurements, but also the adaptations made throughout the training
intervention. A strategy implemented by the researcher included notifying the subjects of
their progress made from week to week.
6. Strength training was restricted in the training groups to only the training program
provided for this experiment, although other physical activities including cardiovascular
exercise were not restricted. This may impact the results if some subjects were
performing a greater volume of physical activity than others.
Definition of Terms
Basic Strength Training Phase: A resistance training period consisting of high loads and low
volume. This phase is done with the purpose of increasing strength (Baechle & Earle, 2015).
Central Fatigue: The fatigue hypothesis stating that muscles are believed to be capable of
greater output, but the central nervous system blocks continued extraordinary effort, whether
chronically or acutely. This may be done to prevent injury (Taylor, Allen, Butler, &
Gandevia, 2000).
Daily Undulating Periodization: The strategy of training periodization that involves large
daily fluctuations in the load, volume assignment, and set by rep organization, of exercises
from one training session to the next (Baechle & Earle, 2015).
Hypertrophy/Endurance Training Phase: A resistance training period consisting of very low
to moderate loads and moderately high to very high volume. The goals of this phase include

8
increasing lean body mass, increasing muscular and metabolic endurance, and developing a
training base for more intense training in later training phases (Baechle & Earle, 2015).
Hypertrophy: An increase in the size of cells or organs, especially muscle fibers
(Kraemer, 2007).
Linear Periodization: The strategy of purposely varying specificity, intensity, and volume of
a training program in a linear fashion with intensity increasing over time (Baechle & Earle,
2015).
Macrocycle: Training period that typically constitutes an entire training year or complete
training program (Baechle & Earle, 2015).
Microcycle: Training period that typically lasts between one and two weeks, depending on
the program (Baechle & Earle, 2015).
Mesocycle: Training period that typically lasts several weeks to several months depending
on the specific training focus of each mesocycle (Baechle & Earle, 2015).
Peripheral Fatigue: When a muscle’s homeostasis has been disturbed, through tissue
damage, decreased pH, or some other factor, to the point that the muscle is incapable of
responding to loading stimuli effectively as it does when rested (MacIntosh & Rassier,
2002).
Strength/Power Training Phase: A resistance training period consisting of high loads, or
low to moderate loads and high velocities, paired with low volume, usually utilizing some
combination of strength exercises and power/explosive exercises. This phase is utilized to
increase an athlete’s expression of power (Baechle & Earle, 2015).

9
Standing Vertical Jump: A test used to measure lower body power output. This test is
performed beginning with an individual standing on a force plate holding a PVC pipe on
their back to control for arm-swing. The participant is allowed to perform a
countermovement composed of bending the lower extremities before jumping in an attempt
to jump as high as possible. Data ground reaction forces from the force plate will be used to
determine jump height. (Kraemer, 2007).
Tonnage: The total mass lifted in a given training session, week, or block of training defined
by the summation of the number of sets multiplied by the number of repetitions multiplied
by the load of the bar in pounds, in each respective set, to calculate the total mass lifted.
Weekly Undulating Periodization: The strategy of training periodization that involves
variations in the load, volume assignment, and set by rep organization of exercises from one
week to the next (Buford, 2007).
10
Chapter II
Review of Literature
Introduction
Block periodized training is characterized by various blocks or cycles of training
known as “mesocycles.” Each mesocycle focuses on a specific training goal and can last
anywhere from a couple weeks to months at a time. By manipulating the volume, intensity,
rest periods, and exercise selection within sessions during a mesocycle, it is possible to bring
about specific performance improvements. Various types of foci during mesocycles include
a hypertrophy/endurance, strength, power, and peaking (Baechle & Earle, 2015; Kraemer,
2007). Some of the most common forms of periodization used in resistance training program
implementation today include linear and nonlinear (undulating) periodization (Hoffman,
2002).
Undulating periodization is the strategy of organizing training that involves large
daily or weekly fluctuations in the load, volume assignment, and set by rep organization of
exercises from one training session to the next. Linear periodization is the strategy of
purposely varying specificity, intensity, and volume of a training program in a linear fashion
with intensity increasing over time (Baechle & Earle, 2015). In determining the
effectiveness of these two styles of periodization, studies have compared the two against one
another to determine which yields the best results in multiple performance measures
including strength, endurance, and power (Baker, 1994; Buford, 2007; Hoffman, et al.,
2009; Peterson, 2008; Rhea, 2003; Rhea, et al., 2002a; Stone, et al., 2000).

11
The two sections of this review focus on Linear vs. Undulating (Nonlinear)
Periodization, and The Effects on Daily Readiness, with the latter being organized into
subsections of factors that will be considered in the monitoring of the individual’s recovery
from the previous training load and readiness including Rating of Perceived Exertion, and
Performance Testing, followed in closing with a Summary section.
The first section reviews the literature related to the effectiveness and performance
improvements caused by the two common methods of periodization. Linear periodization is
often considered to be the most “traditional” method among the studies, while undulating
periodization is then compared in order to explore its relative effects (Baker, 1994; Buford,
2007; Hoffman, Wendell, Cooper, & Kang, 2003; Peterson, 2008; Rhea, 2003; Rhea, et al.,
2002a).
There is an examination of various measurements that have been used in previous
studies to identify readiness to train and respond positively to training while managing the
fatigue caused by the training stimuli. These measurements are further discussed in
subsections including RPE and Performance Testing (Alcaraz, 2008; Dressendorfer, 1985;
Foster, 1998; Fry, 1994a; Fry, 1994b; Fry, 2000; Hoffman, 2000; Jeukendrup, 1998;
Jeukendrup, 1992; Snyder, et al., 1993; Warren, 1992).
Linear vs Undulating (Nonlinear) Periodization
Arguably two of the most common forms of periodization used today in resistance
training are linear periodization and non-linear or undulating periodization (Hoffman, 2002).
Linear periodization is the more traditional periodization model developed by the former
Soviet Union and has been used extensively by athletes and recreationally trained

12
individuals. This model is characterized by various blocks or cycles of training known as
“mesocycles.” Each mesocycle focuses on a specific training goal and can last anywhere
from a couple weeks to months at a time. By manipulating the volume, intensity, rest
periods, and exercises of a mesocycle, it is possible to bring about specific performance
improvements in the human body. These mesocycles typically include a
hypertrophy/endurance phase, strength phase, power phase, and peaking phase (Baechle &
Earle, 2015; Kraemer, 2007). A typical way in which the traditional linear periodization
model is implemented is to perform the hypertrophy/endurance phase for a number of
weeks, followed by the strength phase, then the power phase, and so on. The thinking behind
this progression was that the athlete aimed to increase muscle mass (hyptertrophy), increase
strength, convert the expression of that strength into powerful movements, then to achieve
peak condition for competition. A commonly cited downside for this type of periodization is
that it is not practical for people who either compete often, or who are in a competitive
season (Baechle & Earle, 2015; Kraemer, 2007; Peterson, 2008).
Rhea et al. (2002) compared linear and daily undulating periodization effects on
strength gains using 20 male subjects recruited from college weight training classes. All
subjects had a minimum of 2 years of weight training experience. Subjects were required to
resistance train three times a week for 12 weeks using the leg press and bench press.
Abdominal crunches, bicep curls, and lat pull-downs were also performed, but any other
resistance training was prohibited. The daily undulating periodization group cycled from set
schemes of 3 sets of 8 repetitions to 3 sets of 6 repetitions to 3 sets of 4 repetitions on each
consecutive workout. The linear periodization model used these same set and repetition
schemes, but stayed consistent with one scheme for 4 weeks at a time. This allowed the two

13
training groups to have equated intensity and volume over the 12-week study. Testing of the
two groups was performed pre-training, 6 weeks into the intervention, and at week 12.
Testing consisted of 1-repetition max on the bench press and a Cybex incline leg press
machine, body composition assessment by way of air plythesmyography (Bod Pod), and
chest and thigh circumference measurements. Both the LP and DUP groups increased their
strength significantly in the bench press by 14.4% and 28.8%, respectively; as well as by
25.7% and 55.8% in the leg press, respectively. The DUP group experienced significantly
greater strength gains in terms of percentage than the LP group from weeks 1 to 6 and weeks
6 to 12. No significant differences were observed with body composition. The subjects in
the DUP group did begin to report extended muscle soreness and fatigue in weeks 10-12.
This may have been an indication of overreaching, even though strength tests did not appear
to be considerably affected. This study showed that a 12-week DUP program was more
effective at increasing strength than a LP program using a college-aged male population.
However, the DUP program may have begun to show signs of overtraining late in the study.
A study by Buford et al. (2007) compared the effects of 9 weeks of resistance
training using either a linear periodization model (LP), weekly undulating periodization
model (WUP), or daily undulating periodization (DUP) model. The subjects consisted of 20
men and 10 women from college weight training classes with previous weight training
experience, but not within the past 2 months. All three groups trained 3 times a week using a
full body free-weight routine consisting of exercises that included bench press, leg press,
seated row, lat pulls, upright rows, lunges, leg extension, leg curls, standing calf raises,
preacher curls, triceps extension, incline sit ups, back extension, and knee raises. Volume
and intensity were equated over the 9-week period between the two conditions. Subjects

14
were tested pre- mid- and post-training by way of skinfold body fat measurements, thigh and
chest circumference, and 1RM testing on both the bench press and leg press exercise. RPE
was also recorded using the Borg CR-10 scale to monitor subjects’ perceived difficulty of
each exercise set and exercise session. The LP, DUP, and WUP groups all experienced
significant increases over the 9 weeks of 24.2%, 17.5%, and 24.5% in the bench press and
85.3%, 79%, and 99.7%, in the leg press, respectively (Buford et al. 2007). Additionally,
thigh and chest circumferences also showed a significant time effect in the LP, DUP, and
WUP groups. Chest circumferences increased from 91.94±7.28 cm to 93.78±7.61 cm in the
LP group, 96.75±9.91 cm to 96.95±9.74 cm in the DUP group, and 94.89±9.49 to
95.72±8.19 cm in the WUP group. Thigh circumferences increased from 49.44±4.65 cm to
52.72±5.40 cm in the LP group, 51.90±4.45 cm to 53.80±5.37 cm in the DUP group, and
50.22±5.31 cm to 53.89±3.79 cm in the WUP group. The average RPE rating of an exercise
session decreased in the linear periodization and weekly periodization groups over the 9
weeks by 5.4% and 6.1%, but increased by 3.5% in the daily undulating periodization group.
This finding indicates that undulating periodization may increase individuals’ session RPE,
although this was not found in another study comparing the same three periodization models
(Rossi, 2007). Their study demonstrated that significant strength and size increases can be
observed over the course of 9 weeks in both male and female college students using linear,
daily undulating, and weekly undulating periodization programs.
Hoffman et al. (2009) compared the effectiveness of two different periodization
models as well as a non-periodized model of resistance training on 51 NCAA Division III
football players. The training groups consisted of a non-periodized program (NP),
periodized linear program (PL), and a planned nonlinear periodized (PNL) program. All

15
three groups performed resistance training for 12 weeks, 4 days a week, with days one and
three focusing on the chest, shoulders, and triceps, and days two and four focusing on the
legs, back, and biceps. The NP group used the same training “intensity” throughout the
study. The same set and rep schemes, as well as rest periods between sets, were used. The
PL group performed a 4-week hypertrophy phase, 6-week strength phase, and a 4-week
power phase. The PNL group changes its volume and intensity from workout to workout,
alternating between a power workout and a hypertrophy workout. This is referred to in some
other literature as daily undulating periodization (Baker, 1994; Rhea, 2003; Rhea, et al.,
2002a).
Testing was performed pre- mid- and post testing (Hoffman, 2009). The testing
consisted of 1RM bench press and back squat, vertical jump using a countermovement and a
seated medicine ball throw. All three groups experienced significant improvements in 1RM
in both the back squat and bench press from pre- to post-testing. The NP, PL, and PNL
groups increased their 1RM bench from 125.9±12.2 kg to 136.8±9.5 kg, 118.5±18.3 kg to
127.7±20.7 kg, and 124.0±25.0 kg to 134.3±27.1 kg, respectively. The same groups
increased their 1RM squat from 161.8±16.6 kg to 194.8±24.5 kg, 149.5±25.0 kg to
180.5±17.6 kg, and 164.2±23.2 kg to 182.5±25.6 kg, respectively. The majority of these
improvements occurred between pre- and mid-testing. Vertical jump height also increased
significantly in all three groups, but only from pre- to mid-testing. From pre- to mid-testing,
values in the NP, PL, and PNL groups from 61.0±8.0 cm to 63.5±7.4 cm, 63.6±7.1 cm to
65.1±7.8 cm, and 59.1±11.2 cm to 61.0±10.8 cm, respectively. From mid-testing to post-
testing, the vertical jump heights for the three groups either stayed the same or decreased
non-significantly. The medicine ball toss increased significantly from pre- to post- for the

16
PL group from 537±49 cm to 570±45 cm. For the NP and PNL groups, the medicine ball
toss increased nonsignificantly from 566±53 cm to 577±45 cm and 556±73 cm to 576±53
cm, respectively. All three groups appeared to show similar strength improvements after 12
weeks of training. The results of this study demonstrated that all three periodization models
were effective at increasing strength and jumping ability from week one to six. After week
six, there appeared to be very little improvement, possibly due to the high training level of
these athletes. A population with as much training experience as these athletes may show
initial improvements due to off-season detraining and then require a longer amount of time
to improve their already substantial strength and power levels.
According to the results of these studies, whether implementing a linear or non-
linear periodization strategy, the results appear to be comparable. In some studies, non-
linear periodization yielded desired improvements either equal to or greater than linear
periodization models. For the sake of this study, the importance of equating total volume
load suggests that the subjects should follow a linear increase in relative tonnage each week.
So long as the weekly total volume load is increasing linearly across all subjects, the within-
week periodization can follow an undulating style.
Daily Readiness to Train Measurements
As weekly total volume increases within a training program, daily readiness markers
and recovery will be affected with the accumulation of fatigue. This section of the literature
review focuses on the variables that reflects the subjects’ changes in readiness to train and
their recovery following previous training stimuli.

17
Rating of Perceived Exertion (RPE). One monitoring tool used to evaluate athlete
readiness is the Borg Rating of Perceived Exertion used to aid in the prescription of exercise
intensity (Baechle & Earle, 2015; Borg, 1998; Hoffman, 2002). The two Borg RPE scales
most commonly used in exercise management and evaluation are referred to as the “Borg
CR-10 scale” and the 6-20 scale which is referred to as the “Borg RPE” scale (Borg, 1998).
The CR-10 scale indicates the perceived exertion where 0 is rated as “no exertion at all” and
10 being “extremely hard”, where the corresponding values on the Borg RPE scale are 6 and
20, respectively (Hoffman, 2002). Correlation has been made between the 6-20 scale and
heart rate as it is reflection of central fatigue, and has been most commonly used in
prescribing cardiovascular exercise intensities (Taylor, et al., 2000). In activities which
induce more peripheral fatigue, such as resistance training, the Borg CR-10 scale has been
used more commonly (Day et al., 2004; MacIntosh & Rassier, 2002). Self-reported RPE has
been analyzed in detail in many resistance training studies in attempts to quantify each set
within a training session (Gearhart et al., 2002; Lagally et al., 2004) and of the overall
training session (Day et al., 2004; Lagally et al., 2007; Sweet et al., 2004).
In an analysis of the reliability of the 0-10 Borg RPE scale, Day et al. (2004)
attempted to quantify the intensity of an entire resistance training session, and each
resistance training set within each session. The study sample was comprised of 21 male and
female subjects in their early 20’s with a minimum of six months of resistance training
experience. Each of the subjects participated in six separate resistance training sessions over
the course of a week, with the sessions divided into two days of high intensity, two days of
moderate intensity, and two days of low intensity training. At the end of each set, the
subjects reported their RPE values and then once more at the end of the entire training

18
session each day. When comparing the given RPE values to the training sessions prescribed,
the results suggested that the CR-10 is a reliable measure of a resistance training session’s
intensity, and that monitoring the RPE of the entire training session is just as effective as
reporting the RPE of each individual set.
Another study comprised of 20 male and female subjects in their 20’s was conducted
using the 15-point 6-20 RPE scale by Gearhart, et al. (2002), with subjects who had at least
three weeks of resistance training experience. The design of this study had all subjects
complete both a high intensity and a low intensity training protocol, where RPE was
reported after every repetition in the high intensity protocol and again after every third
repetition in the low intensity protocol. In both high- and low-intensity training sessions,
subjects performed seven exercises with reported results showing higher RPE values for the
high intensity protocol and the low intensity protocol. This suggests that the 6-20 RPE scale
is also effective at measuring perceived exertion of a resistance training session (Gearhart et
al., 2002).
While there may be a personal bias when using self- reported RPE scales, studies
have repeatedly shown that RPE may provide valuable, reliable data when considering the
assessment of training session intensity. Whether using a 6-20 RPE scale for more aerobic
based activities, or a Borg 0-10 RPE scale for resistance training, both are reliable, so long
as the subject is honest in their self-reported evaluations (Day et al., 2004; Gearhart et al.,
2002).

19
Performance Testing. A marked decrease in performance is often a primary
indicator than an individual has reached a state of non-functional overreaching or
overtraining and has led to the use of simple performance measures as a way to easily
administer tests to practically measure when an individual may be overreaching or at risk of
entering a state of overtraining (Halson, 2004; Hoffman, 2000). These performance tests
have been researched for over two decades, with tests ranging from variable sprint lengths,
one-repetition maximum strength tests, vertical jumps, dynamic movements, reaction time
tests, and repetition until failure tests (Alcaraz et al., 2008; Fry et al., 1994a; Fry et al.,
1994b; Fry et al., 2000; Hoffman et al., 2000; Warren et al., 1992). How well each test may
carry over to a particular individual’s sport or fitness goals may vary, with some being better
indicators than others in some instances. For the purpose of this review, focus was
maintained more so on performance testing with regards to resistance training programs.
In a small research study of six men by Fry et al. (2000), an attempt was made to
monitor the onset of overreaching during a resistance training program. The participating
male subjects, ages 22 to 33 years old, took part in a three-week high intensity resistance
training program, with performance tests prior to program’s initiation, and again at the end
of each training week. A battery of performance tests was conducted, including lower body
reaction time, vertical jump, two sprint variations, a lateral agility test, and a back squat one-
repetition maximum test, which was selected because it was the primary exercise of the
resistance training program.
By the end of the three-week training intervention, performance tests showed both
increases and decreases, as well as stagnation and lack of change from week to week, with
no consistency across subjects. Lower body reaction time did increase overall by the end of
20
the study, but without any statistical significance. Vertical jump showed no significant
increases or decreases, however there was a recorded significant increase in non-counter-
movement vertical jumps. Sprint tests showed significant increases in time for both 9.1-m
and 36.6-m distances tested, with an average of 7.18% and 4.09% increase in sprint times
for the respective distances. The mean 1RM back squat values showed significant increases
between the pre-intervention test and following the completion of week one where training
consisted of one day of three sets of 10 reps and another day of three sets of five repetitions,
but did not show any significant change for the remainder of the three-week study where
training consisted of much higher intensities performing two sets of one rep at 95% of 1RM.
While not clearly indicating overtraining as defined by decrease in performance while some
test measures improved, and some showed no change, it has been suggested that plateaus in
performance could also reflect overreaching (Lehmann, 1993; Stone, 1991). This study was
also limited by its short duration, and the increases in performance measures could be
attributed to developing familiarity with the tests if they did not have a significant training
history or exposure to the performance tests prior to this study.
Summary
When comparing the effectiveness of both training periodization modalities, studies
have shown nonlinear undulating periodization to be just as effective, if not more effective
than the more common method of linear periodization when evaluating the increases in
strength and performance (Baker et al., 1994; Buford et al., 2007; Hoffman, et al., 2009;
Rhea, et al., 2002a). It has been suggested that a main factor relating to the efficacy of
undulating periodization is its ability to decrease the probability of stimulating individuals to
the point of reaching a state of overtraining (Peterson, 2008). It has been well documented

21
that overreaching can indeed leave the individual to express decreases in performance
contrary to the objective of training (Armstrong, 2002; Baechle & Earle, 2015; Borselen et
al., 1992; Bushie et al., 2007; Urhausen et al., 2002). This dilemma could be avoided if there
were a well-established set of tools that could detect and prevent unplanned overreaching
and overtraining from occurring (Costa et al., 2005; Fry, & Kraemer, 1997; Fry et al., 1994;
Meeusen et al., 2004; Moore et al., 2007; Snyder et al., 1993; Warren et al., 1992).
However, the largest noticeable difference in training programs is the daily volume load.
While a linear program may steadily increase total volume load each with similar relative
loads and intensities between training sessions that week, an undulating program cannot
equate for volume and intensity each day within a week simply due to the definition of the
program having a level of stimulus that changes from day to day. However, volume load can
certainly be equated between block and non-linear programs over the course of a week in a
pre-planned undulated program. It would be important to consider the total volume over the
course of the week, and what is the upper tolerable limit that can be reached before non-
functional overreaching or overtraining sets in.
The review of the literature has shown that some easily administered tests to evaluate
and identify overreaching and overtraining include training session ratings of perceived
exertion (Foster et al., 1998; Hoffman et al., 2000; Snyder et al., 1993; Urhausen et al.,
2002), and simple performance tests (Alcaraz et al., 2008; Fry et al., 1994a; Fry et al.,
1994b; Fry et al., 2000; Hoffman et al., 2000; Warren et al., 1992).
Measures that have shown promise in identifying overreached or soon to be
considered overreached individuals have included training session rating of perceived
exertion (Foster et al., 1998; Hoffman et al., 2000; Snyder, et al., 1993; Urhausen et al.,

22
2002), and simple performance tests (Alcaraz et al., 2008; Fry et al., 1994a; Fry et al.,
1994b; Fry et al., 2000; Hoffman et al., 2000; Warren et al., 1992). Research indicates that
the usefulness of training readiness measures hinges on their ability to distinguish when to
decrease training volumes and intensities to optimize the training stimulus, resulting in
continuously improved performance and avoidance of non-functional overreaching, and
overtraining syndrome.
While many of these measures have been used in an attempt to identify either
aerobic or resistance training athletes who may be overreaching, they have not been
combined in an attempt to find an athlete-specific maximal recoverable volume of resistance
training. The goal of the present study is to provide tools to define this athlete-specific limit
and correlate it to other standard physical fitness measures, such as a 1 repetition maximum
back squat and initial work capacity.
23
Chapter III
Methods and Procedures
Introduction
The purpose of this study was to develop a novel approach to determining weekly
volume loads with the use of daily readiness markers as reference points within the program
to determine the maximal recoverable volume. More specifically, to predict the upper
tolerable limit of a subject’s recoverable resistance training volume and through the use of a
regression equation, find a correlation to a previously measured point of reference. This was
achieved by having subjects record the RPE following each of their training sessions, and
conducted performance tests, which included bar speed during a back squat measured using
a Tendo Sports Machine Tendo Unit (Trencin, Slovak Republic), and a vertical jump on an
AMTI Force Plate (Advanced Mechanical Technologies, Inc.; Watertown, MA, USA), at
various points throughout the study. These measurements were all used to identify signs of
overreaching as weekly changes in volume load and volume load accumulation over the
course of the training program were recorded. These performance tests were conducted at
the beginning of the first training session each week, as well as before and after the training
program intervention. In addition to the performance tests, subjects’ 1RM back squat, bench
press, deadlift and overhead press were also conducted pre- and post-training to measure any
changes in maximal strength.
Description of Study Sample

24
The sample consisted of 14 male students from Western Washington University who
volunteered to participate in the study (𝑋 ± SD; age = 21.29 ± 1.53 years; body weight =
77.77 ± 8.05 kg; height = 1.77 ± 0.08 m; training age = 4.09 ± 1.90 years). Each subject was
familiar with the back squat, bench press, and deadlift exercises with a minimum one year of
resistance training. Subjects had no previous history of orthopedic injuries that would cause
exercise selection limitations. Participants were instructed to not perform any other
resistance training in addition to this program and to abstain from cardiovascular activity
prior to weight training sessions and testing sessions. Cardiovascular activity as a warm up
prior to resistance training sessions was included in the training program prescription.
Design of the Study
A multiple participant multiple regression study was conducted to determine an
equation to find a relationship between a maximal recoverable volume and the previous
physical markers and performance measures, such as the relative strength (RS) defined as
the 1 repetition maximum (1RM) back squat divided by body weight, and starting work
capacity (VL_initial) as predictors of maximal recoverable volume. Two 1-repetition
maximum tests were completed, one before the training intervention began, and another
optional 1RM test after the completion of the training program, following an unloading
period to allow subjects to recover following the training program. The unloading period
consisted of two sets of three repetitions at 60% of 1RM on back squat, bench press,
deadlift, and overhead press. The performance tests of vertical jump and bar velocity during
a back squat at 80% of 1RM were performed during the testing day, as well as at the
beginning of each training week as a method of evaluating readiness as well as recording
self-reported RPE values at the end of each training session.

25
Data Collection Procedures
Instrumentation. Maximum strength was measured using 1-repetition maximum
lifts for the back squat, bench press, deadlift and overhead press in the Applied
Biomechanics Lab on the campus of Western Washington University inside the squat rack,
on the available bench and on the deadlift platform. The vertical jump was conducted on an
AMTI Force Plate (Advanced Mechanical Technologies, Inc.; Watertown, MA, USA).
These tests required the use of a stop watch to control rest periods, and a standard 20-
kilogram Olympic barbell, locking barbell collars, and standard Olympic free-weight plates.
Barbell velocity was measured using a Tendo Sports Machine Tendo Unit (Trencin, Slovak
Republic) which had been previously validated in a study by Garnacho-Castaño et al.
(2015).
Measurement techniques and procedures. The researcher began with an
introduction of the study and its time commitment to the subjects. Before any testing or
training was conducted, the participants were informed of the testing procedures and
provided with an informed consent document to sign (Appendix B), approved by the
Western Washington University Internal Review Board, who approved the study. The
participants were informed that they would be participating in a study including four days
per week of resistance training, for up to 10 weeks. The researcher made it clear that if
subjects missed more than three training sessions as prescribed, it would result in them being
dropped from the study. They would be welcome to complete the training program;
however, their data could no longer be included in the study. It was explained to the subjects

26
that the first four training sessions would be monitored and assisted by the researcher. This
was done to ensure that the correct technique was used according to NSCA guidelines and
that the participants were following the correct acute training variables (volume, intensity,
and rest periods) (Baechle & Earle, 2015). Depth of the squat was standardized and
explained to the participants as the crease of the hip being lower that the top of the knee, or
when the femur was parallel to the ground. If the subject typically squatted to any depth
lower than the described minimum, they were encouraged not to change their practiced
squatting pattern, and that level of depth should not change for the duration of the study. If
participants wanted help or assistance with additional workouts, the researcher made himself
available to do so. After the completion of each workout, the participants filled in the
session rating of perceived exertion (RPE) on a provided table. The correct use of this scale
was explained at the initial training session (Borg, 1998).
Subjects began testing in the Applied Biomechanics Laboratory of Western
Washington University to perform the vertical jump under the supervision of the lead
researcher, following an appropriate dynamic warm-up provided by the researcher. The
vertical jump was conducted by having the subject stand on the AMTI Force Plate, with a
PVC pipe in their hands across their shoulders like they would in a back squat. When ready,
they would then use a countermovement before jumping as high as possible. The PVC pipe
was used to control for arm-swing in a countermovement jump, which had been previously
validated as a method for testing vertical jump height without the need for familiarization as
a reliable method for comparing force variables (Moir et al., 2005). The ground reaction
forces, time from beginning of the jump to toe-off, and mass of the subject were used to
calculate vertical height displacement via the impulse-momentum relationship. The vertical
27
jump test was performed three times with an upper limit of 4-minutes rest between trials,
with a minimum rest of one minute between attempts. The best of the three trials was
recorded for each subject. This testing process occurred once before the training program
began, and was repeated at the beginning of each training week for the duration of the
training program.
One-repetition maximum (1RM) lifts using the back squat, bench press, and deadlift
were performed by each participant at the beginning of the study. Subjects had the option to
participate in re-testing their 1RM lifts following a mandatory week-long unloading period
after training was completed if they were interested. This was performed in the Applied
Biomechanics Laboratory or in the Wade King Student Recreation Center under the
supervision of the lead researcher. The protocol for accomplishing this involved a light
dynamic warm up followed by a light 10 repetition set on the exercise that was being tested.
The load was then increased according to the NSCA guidelines for 1RM testing until a 1RM
was attained (Baechle & Earle, 2015). These guidelines can be found in Appendix C.
These maximum strength performance tests were conducted a total of two times in
the study. This included at the beginning of the study, and at the conclusion of the study.
Training Program Description. After initial testing, subjects were asked to perform
three repetition squats at 80% of the established 1RM while monitoring the velocity of the
movement for the concentric portion of each repetition via the Tendo Unit connected to the
barbell, and repeated sets until the average velocity of a three-rep set decreased by 7%
compared to the best average set of that session, at which point the session was completed.
On consecutive days, this was repeated with the bench press, deadlift, and overhead press,

28
with a rest day between the bench press and deadlift testing days. The total volume load,
expressed as sets, multiplied by repetitions, multiplied by weight or load in kilograms, was
used to establish a starting training volume, and divided by 1000 to be expressed in terms of
metric tons, or tonnage. Volume load was increased each week by 17% until the cessation of
the program, with the exercise load starting at 67.5% of 1RM, and increasing each week by
2.5-5% of 1RM. Sets and reps for each following week were prescribed accordingly to
ensure a 17% increase in total volume load from the previous week, depending on the initial
work capacity of each subject identified in the first week of training. An example can be
found in table 1 of Appendix D. Subjects trained 4 days per week with a minimum of 24
hours between sessions, with sessions taking place on Monday, Tuesday, Thursday, and
Friday. Training sessions consisted of one of the main lifts, such as the back squat, bench
press, or deadlift, followed by one multi-joint accessory movement depending on the main
lift, and one single- joint or abdominal auxiliary exercise. A sample of the training week
program layout can be found in Table 2 of Appendix E.
The beginning of each microcycle began with a back squat training session, which
consisted of working up to 80% of the subject’s 1RM that was performed for 3 repetitions
while peak single-repetition bar velocity and average bar velocity of all six repetitions were
measured using the Tendo Unit potentiometer, before continuing with the prescribed
training plan for that microcycle. These peak and average bar velocities were compared each
week to the original peak single-rep velocity and average velocity found during the initial
testing phase as a readiness indicator and performance measure. Vertical jump testing was
also recorded at this time, prior to squatting each week after the dynamic warm-up was
performed.

29
The total numbers of repetitions, % of 1RM, sets, total number of sets increased for
all subjects from the previous week. Subjects were instructed to keep a workout log for each
training session to ensure that they were aware of the weights they used for every set on
each exercise. A copy of this log was given to each participant and it was explained how to
use the log effectively. This ensured that the subjects knew exactly what weights they were
prescribed, but also helped the researcher in compiling the subject’s RPE following each
session.
Subjects were given the training log to fill in their rating of perceived exertion (RPE)
following every training session using the Borg CR-10 scale, and at the end of the week the
researched calculated an average RPE of the four training sessions. This was done in an
attempt to monitor any changes in perceived effort while using the same percent 1RM for
the week. A copy of this training log can be found in Appendix F.
The training program was discontinued when subjects reached a state of
overreaching, as defined by a 10% decrease from the previous best performance in any two
of the three performance tests, consisting of the peak and average bar velocities during a
back squat three repetition set at 80% of 1RM, and vertical jump height. Another variable
used to track changes in training status readiness included the subject’s RPE scores.
Changes in this variable were used as an additional indicator of overreaching in support of
the performance measures if a significant change between the initial and final training
weekly average RPE scores was found. Subjects had the option of discontinuing the
program once they reached a determined state of overreaching, or continuing to follow a
resistance training program under the direction of the lead researcher, that would include a
week-long unloading phase once they reached a state of overreaching, followed by a week

30
of 1RM testing. Resistance training programming under the direction of the research would
cease after the 10-week mark, if the subject elected to continue training after overreaching.
Data Analysis
The pre-training data were compared with post-training data to see if there was any
correlation among all the subjects’ total volume achieved (VL_total) by the end of the
training program and their final week volume achieved (VL_final), and their pre-training
performances measures, such as their relative strength (RS) (1RM squat divided by body
weight), and first week total volume achieved (VL_initial). Researchers conducted a
multiple regression analysis (significance level was set at α = 0.05) to determine if there was
any predictive relationship between the total volume load, and their previous performance
markers, and to develop an equation to predict tonnage lifted in the final week and total
tonnage over the course of the study that can be achieved prior to overreaching from pre-
training volume load achieved in their first week of testing. Subjects’ 1RM strength on the
back squat, bench press, deadlift and overhead press were also measured to monitor any
strength changes for those interested in retesting their 1RM tests following an unloading
period to allow for proper recovery after the subjects reached their maximum recoverable
volume, however these changes were 1RM strength were not a part of the regression
analysis. An independent t-test was used to compare the relative strength of the whole group
and the relative strength of the subjects who elected to participate in the optional retesting of
1RM strength to ensure they represented to difference from the whole group, with a
significance level set at α = 0.05. Paired samples t-test was used to compare the change in
RPE following the first week of training and the final week of training, with a significance
level set at α = 0.05. All of the statistics were calculated by using Microsoft Excel 2010

31
(Microsoft Corp., Redmond, Washington, USA) and SPSS version 21 (IBM Corp., Armonk,
New York, USA).
32
Chapter IV
Results and Discussion
Introduction
The purpose of this study was to use a multiple regression analysis to determine a
prediction equation using relative strength (RS) and initial volume load (VL_initial) to
predict maximum recoverable volume as the highest single-week volume (VL_final), and
the total volume load accumulated over the course of the training program (VL_total). Initial
volume load was determined by having the subjects perform sets of three repetitions at 80%
of 1RM for the back squat, bench press, deadlift, and overhead press on separate days, until
the average set bar velocity decreased 7% from their best. The summation of the total sets
achieved for each exercise × three repetitions per set × the load on the bar in pounds for each
exercise was the initial volume load in pounds. Relative strength was determined by
dividing the subject’s previously established 1RM back squat by their body weight. Each
week, the subject’s volume load increased by 17% until they were deemed as functionally-
overreached, which was determined when two of three weekly performance tests decreased
by 10% of their best testing results, at which point they were moved to an unloading phase
ending their participation in the study. The performance tests performed at the beginning of
each week included a maximum vertical jump height of three attempts calculated using a
force plate, single-rep peak barbell velocity during two sets of three reps at 80% of 1RM in
the back squat, and the average barbell velocity of all six reps tested. The volume load of the
last week of training prior to being deemed as functionally-overreached represented the
subject’s VL_final, and the summation of volume load of every week of training represented
33
the subject’s VL_total. For each regression analysis, the significance level was set at α =
0.05. Paired samples t-test was used to compare the change in RPE following the first week
of training and the final week of training, with a significance level set at α = 0.05. Complete
statistical analysis tables can be viewed in Appendix H.
Subject Characteristics
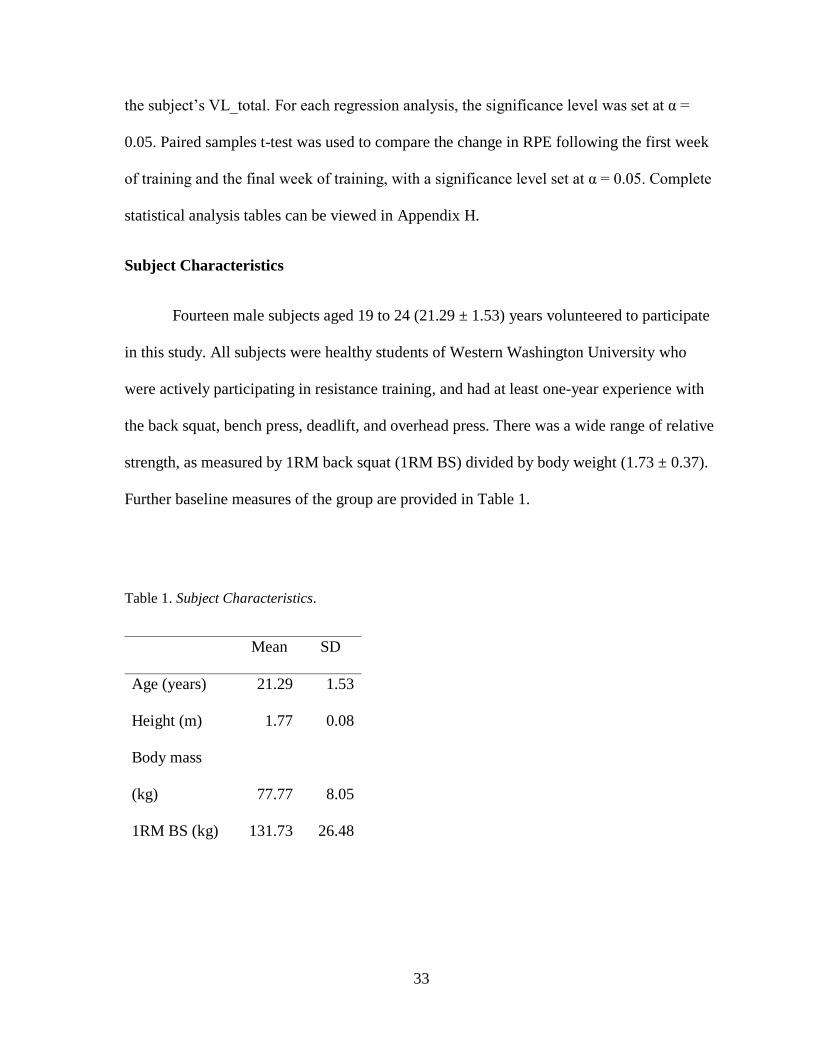
Fourteen male subjects aged 19 to 24 (21.29 ± 1.53) years volunteered to participate
in this study. All subjects were healthy students of Western Washington University who
were actively participating in resistance training, and had at least one-year experience with
the back squat, bench press, deadlift, and overhead press. There was a wide range of relative
strength, as measured by 1RM back squat (1RM BS) divided by body weight (1.73 ± 0.37).
Further baseline measures of the group are provided in Table 1.
Table 1. Subject Characteristics.
Mean SD
Age (years) 21.29 1.53
Height (m) 1.77 0.08
Body mass
(kg) 77.77 8.05
1RM BS (kg) 131.73 26.48

34
Relative
Strength (1RM
BS/BW)* (%) 1.73 0.37
*1RM BS: 1 repetition maximum back squat, BW: body weight
Results
Upon completion of the training programs, the average VL_total achieved was
167,020 ± 56,333.16 lbs. accumulated over the course of 5.14 ± 0.99 weeks. The average
VL_final achieved was 45,509.5 ± 13,812.07 lbs. in their final week of training.
Multiple regression analysis. Two forced entry multiple regression analyses were
conducted, with both VL_initial and RS as predictors for VL_total, and VL_final. This
model revealed that VL_initial and RS significantly predicted both VL_total (F[2,11] =
52.88, p < 0.001, R2-adj. = 0.89), and VL_final (F[2,11] = 59.54, p <0.001, R2-adj. = 0.90).
However, T-tests revealed that only VL_initial contributed to the prediction, as RS was not a
significant predictor of either VL_final (t(13) = 0.773, p = 0.456) or VL_total (t(13) = 0.152,
p = 0.882). Therefore, a linear regression was conducted using only VL_initial to predict
VL_final and VL_total. The results revealed that VL_initial alone significantly predicted
both VL_total (F[1,12] = 115.11, p < 0.001, R2-adj. = 0.898) and VL_final (F[1,12] =
122.60, p < 0.001, R2-adj. = 0.903). The prediction equations below are a result of the
regression models calculated.
VL_total (lb) = −57614.62 + 2705.23×RS + 7.95×VL_initial (lb)

35
VL_final (lb) = −11745.80 + 3187.56×RS + 1.87×VL_initial (lb)
VL_total (lb) = −55448.94 + 8.04×VL_initial (lb)
VL_final (lb) = −9194.04 + 1.98×VL_initial (lb)
The above equations were calculated in total pounds lifted. In order to express the
predicted values for VL_total and VL_final in metric tons lifted, the value would be divided
by 2,205 lbs.
Table 2 Average weekly Volume Load, Rating of Perceived Exertion (RPEave), Peak Velocity
(Vpeak), Average Velocity (Vave), and Jump Height.
Volume Load (lb) RPEave
Vpeak (m/s) Vave (m/s) Jump Height (cm)
Week MEAN SD MEAN SD MEAN SD MEAN SD MEAN SD
1 27666 6667
0.639 0.058 0.610 0.054 39.98 6.55
2 30942 7661 5.13 0.76 0.659 0.053 0.614 0.056 38.67 5.59
3 34692 8817 5.72 0.89 0.666 0.078 0.621 0.076 39.91 4.98
4 39863 10024 6.52 0.82 0.676 0.072 0.641 0.077 39.07 6.92
5 46714 11506 6.94 0.82 0.678 0.066 0.631 0.067 39.76 5.05
6 51024 9162 7.79 1.11 0.669 0.074 0.621 0.076 40.52 5.34
7
0.584 0.061 0.552 0.067 40.22 6.59

36
Table 3 Displaying the average of all weekly performance tests, their percent change from the
previous week, average weekly RPE and the absolute weekly change, as the relative volume load in
tons increased by 17% each week.
Table 4. Comparing RS between all subjects and those who
elected to re-test their 1RMs
t-Test: Two-Sample Assuming Unequal Variances
1.956521739 1.956521739
Mean 1.716315711 1.805100243
Variance 0.142127659 0.136279481
Observations 13 7
Hypothesized Mean
Difference 0
df 13
t Stat -0.509202539
P(T<=t) one-tail 0.309571509
t Critical one-tail 1.770933396
W1 W2 W3 W4 W5 W6 W7
ave % change in JH -2.48% 3.61% -2.22% 4.64% -1.02% -4.74%
Jump Height (cm) 39.98 38.67 39.91 39.07 39.77 40.59 40.22
ave % change in Peak V 2.96% 0.51% 1.31% -0.25% -2.83% -19.11%
Peak V (m/s) 0.64 0.66 0.67 0.68 0.68 0.67 0.58
ave % change in aveV 0.60% 0.60% 2.44% -2.18% -4.25% -19.17%
Ave V (m/s) 0.61 0.62 0.62 0.64 0.63 0.62 0.55
Ave RPE 5.13 5.72 6.52 6.94 7.79
Relative Tons 1 1.17 1.3689 1.601613 1.873887 2.192448 1.096224

37
P(T<=t) two-tail 0.619143017
t Critical two-tail 2.160368656
Discussion
The two multiple regressions showed that RS and VL_initial were correlated to
maximal recoverable volume as a significant prediction equation. This is in agreement with
the experimental hypothesis that at least one marker, either a subject’s relative strength or
initial volume load, will significantly predict maximal recoverable volume. However, a T-
test analysis revealed that while the prediction equation itself was significant, RS was not a
significant contributor to the prediction of either VL_final (t(13) = 0.773, p = 0.456) or
VL_total (t(13) = 0.152, p = 0.882). Therefore, a linear regression using only VL_initial to
predict VL_final and VL_total was conducted.
RS was expected to be a significant predictor variable, as it would take into account
a subject’s experience and familiarity of the movement. Training age was thought to be too
subjective. RS posed as an option to objectively consider how trained a subject was in the
back squat, where subjects with more experience and training in the back squat may have a
higher RS value than those less experienced.
One reason RS may not have been a significant predictor variable could be that all
subjects’ starting work capacity was determined by testing at 80% of their relative 1RM
back squat, and the volume load increased by 17% each week. Since the weights prescribed
and the volume load each week were all based on relative percentages, the most variable
number across the subjects was their starting work capacity.

38
The changes in the subject’s self-reported RPE increased linearly while the volume
load increased each week. This was plotted to demonstrate the average change in RPE as the
volume load increased by 17% each week. The average percent change in performance tests
was plotted on a secondary axis to show the changes in performance from the previous week
of training (Figure 1).
Figure 1. A graphical representation of the changes in RPE and percent changes of the performance
tests over each week, as the relative tonnage achieved in week one was increased each week by 17%.
Performance tests include average percent change in single-repetition peak velocity (Vpeak), average
percent change in six repetition average velocity (Vave), and average percent change in jump height.
The average percent change in the back squat average and peak barbell velocities
showed a positive change over the first four weeks. Although RPE and total volume was

39
increasing, a positive adaptation was occurring (represented as any point value above the 0%
line, which would equate to no change occurring). Each of the first four weeks, the subjects
improved their barbell velocity, and did not show signs of fatigue having a negative effect
on their performances until weeks five, six, and seven. No subject made it past the testing at
the beginning of week seven, which is why no subject had any RPE values to report at the
end of week seven.
The performance testing in the vertical jump did not follow the same trends as the
barbell velocities. This may be due in part to the lack of practice among subjects in the
vertical jump, which consisted of five total jumps each week including the two practice
jumps. The back squat technique was practiced with considerably more repetitions each
week, and increased in the number to total repetitions and load as the training program
progressed.
In a study attempting to elicit overtraining responses through high-volume back
squatting by Fry et al. (1994b), a battery of performance tests was administered each week
including sprints, jumps, and 1RM strength tests. While the occurrence of overtraining was
not reported during this four-week training prescription, performance test scores decreased
after the first two weeks. While the findings of overreaching and overtraining differed in
comparison to this study due to the parameters defining these training states, it is possible
that the duration of the program by Fry et al. was simply not long enough, or the total
volume load was not high enough.
Another study by Fry et al. (2000) sought to determine what types of performance
would be affected when subjects were exposed to three weeks of high relative intensity

40
(percent of one repetition maximum) parallel barbell squats to the point of overtraining.
Sprint times increased, and peak isokinetic squat force decreased after three weeks of high-
intensity training. While the current study did not analyze sprint performances or squat
force, it did consider performance variables such as squat velocity and ground reaction
forces to calculate jump heights, which decreased following four weeks of training. Similar
to Fry et al., the results of this study found after being exposed to more stimuli over a similar
number of weeks, velocities and force outputs decreased.
While Urhausen et al. (2002) found only minor changes in RPE in athletes deemed
overtrained through actual exercise intensity expressed in watts or measured by blood lactate
concentration measures, statistical analysis of this study revealed a significant increase in
RPE throughout the training duration until subjects were classified as functionally
overreached. A study by Foster (1998) used a modified RPE where session RPE was
multiplied by session duration. They found training load was successfully related to
performance. This is similar to the findings of the current study. The largest decreases in
performance testing followed the week of training with the largest change in RPE, as seen in
the Table 3.
The data does suggest that functional overreaching was achieved, as demonstrated by
a temporary decrease in performance. Subjects who chose to participate in a post-testing of
their 1RMs were encouraged to do so under the supervision of the researcher following a
week-long unloading period. The subjects who elected to retest their 1RMs strength showed
an average increase of 6.15% in their 1RMs. Pre- and post-testing results of 1RM strength
tests can be found in Appendix G. An independent t-test was conducted to compare the
relative strength of the whole group against the group of subjects who elected to retest their
41
1RMs, and no significant difference was found (p > 0.05), with the average RS of the whole
group being 1.72 with a variance of 0.14, and a higher average RS of 1.81 in the retest group
with a variance of 0.14.
Given that the design of the training program was focused as a strength block, this
increase in 1RM strength not only helps to validate the efficacy of the training program, but
also that the accumulated fatigue was indeed functional overreaching, as the end goal of the
training program was to increase maximal strength while determining the maximum
recoverable volume. The subjects in this study not only recovered quickly following a single
week of unloading, but also responded positively to the preceding training program after a
brief exposure to high stimuli. Overtraining syndrome, on the other hand, has been described
as non-functional, often taking several weeks to recover before returning to a previous state
of performance (Armstrong, 2002; Borselen, 1992; Bushie, 2007; Fry, 1997; Lemyre, 2007;
Stone, 1991). The findings of this study not only imply that the volume load achieved
resulted in functional overreaching in the subjects, but also shows that the subjects were
indeed able to recover from the maximum volume load accumulated within a single week of
unloading.
Limitations
The subjects in this study were all male students of Western Washington University
between the ages of 19 and 24 years old. Any findings of this study cannot be assumed to
apply to females, or other males outside of this age group. While all subjects were required
to have a minimum of one year of experience with resistance training and familiarity in the
barbell back squat, bench press, deadlift, and overhead press, there was variety in training

42
age ranging from one to six years of experience, and relative strength ratio of 1RM back
squat to body weight ranging from 1.21 to 2.33. Although this range in strength and
experience did not show to have an effect on RS as a predictor variable, it does lend the
successful application of the prediction equations found to a larger population. It could,
however, have played a role in the subjects’ initial volume load testing results as the more
experienced lifters may have achieved a larger starting volume load due to technical
proficiency and exposure to higher volumes.
One concern of this study was a possible lack of adherence to the training program,
which could potentially impact the results. Subjects did not skip training sessions as
originally hypothesized, but some expressed interest in wanting to accumulate more volume
than prescribed early in the training program.
During any of the performance tests, and the initial week of volume load testing,
subjects were always coached and encouraged to move the barbell with maximum effort
pertaining to their back squat velocities, and to jump as high as they could during their
vertical jump tests. The differing levels of motivation within the subjects and their intentions
to test and to train with the highest of intensity and focus is a limitation of this study. These
differences in effort and motivation could influence the testing measurements and the
adaptations made through the training program.
One potential limitation regarding the performance testing was the use of high-
velocity movements as tested measurements during a strength phase training block. With
chronic strength training, the pennation angle of the muscle fiber changes to a more oblique

43
angle which are not advantageous for the production of speed or high-velocities (Folland &
Williams, 2007).
44
Chapter V
Summary and Conclusions
Summary
The purpose of this study was to determine a prediction equation to identify
maximum recoverable volume (MRV) with simple performance tests that could be easily
administered. To do so, MRV was defined as the total volume load in tons lifted in the
course of a single week and an entire training block until functional overreaching was
reached. This MRV was defined as a volume load that a subject could recover from quickly,
and respond positively to following the training program.
The parameters for defining functional overreaching in this study included a 10%
decrease in any two of three performance tests, with increases in one repetition maximum
strength testing as an indicator of a positive response to the training following an appropriate
recovery period of unloading for a single week. Total volume load was increased each week
by 17% from the starting work capacity, which was set as the total volume load of
successful three-repetition sets at 80% of 1RM until bar velocities dropped by 7% or more.
Two forced entry multiple regressions were conducted to predict the maximum
recoverable volume in a single week, and the accumulation of volume in a training block
using relative strength and initial volume load as predictors. Further analysis illustrated that
relative strength was not a significant variable in the prediction equation, and that when
considering a subject’s maximum recoverable volume, the most significant predictor

45
analyzed in this study was their starting work capacity. Those capable of a higher initial
volume load are likely to have a higher MRV.
Conclusion
The experimental hypothesis was confirmed in that both maximum recoverable
volume load in a single week and over the course of a training block can be determined
through a prediction equation derived from a linear regression analysis using initial work
capacity. These prediction equations are statistically significant and accounted for a large
majority of variance among subjects. These prediction equations may be useful when
strategically applying a period of functional overreaching to avoid performance stagnation
or break plateaus, as well as avoiding any incidences of overtraining syndrome.
Recommendations
Future research. While this study was conducted during a maximal strength phase,
to better understand maximum recoverable volume, future research should be conducted
during other block phases of training. More research is required in this area when
considering the population examined in this study, whether that includes research on female
subjects, different age groups, and more homogenous relative strength levels and training
experience.
One aspect that should be included in future research is considering subjects’
training history. What type of training block they had just completed may have a significant
effect on their ability to handle higher volumes or higher intensities. This study did not
control for pre-training history, and required a low level of training age as the minimum
required for inclusion into this study.
46
If this same testing protocol is used again in future research, it should be stressed that
subjects should be constantly reminded and encouraged to move the barbell as fast as
possible during the concentric phase of the movements. Failure to do so can lead to
inaccurate performance testing results and MRV data, whether from underestimated
maximum velocities if the subject did not give maximal efforts from the beginning of the
study, or if the subject is deemed overreached under false pretenses due to lack of effort or
motivation during testing.
This study focused on the MRV using resistance training only, and future research
should be done on volume loads and fatigue accumulation with regards to resistance training
when paired with sport skills practice for this to carry over to athletic populations in sports
other than powerlifting. Future research should also be done in this area with regards to the
weightlifting movements; the snatch and the clean and jerk. Movements such as these
depend more on technique and bar velocity for a successful lift than the exercises conducted
in this study, as well as a much lesser component of eccentric loading.
Practical applications. The prediction equations derived from this study could be
beneficial to those who need to apply a functional overreaching strategy in order to
overcome plateaus or stagnation in their resistance training adaptations, so long as an
appropriate recovery period is also considered. These equations can be used to predict MRV
of a training block, following the protocol executed in this study. For any person who has
similar characteristics to the population in this study, who is particularly prone to non-
functional overreaching, high fatigue accumulation, or injuries resulting from overuse or
overtraining, these prediction equations may help to appropriately administer training
volume loads. The findings and protocols of this study can certainly be used to increase

47
performance in 1RM resistance training within a six-week strength training block, the
application of the prediction equations can be a useful tool in fatigue management, and in
designing future resistance training programs.

48
References
Alcaraz, P. E., Sanchez-Lorente, J., & Blazevich, A. J. (2008). Physical performance and
cardiovascular responses to an acute bout of heavy resistance circuit training versus
traditional strength training. Journal of Strength & Conditioning Research, 22(3),
667-671.
Armstrong, L. E., & VanHeest, J. L. (2002). The unknown mechanism of the overtraining
syndrome. Sports Medicine, 32(3), 185-209.
Baechle, T. R., & Earle, R. W. E. (2015). Essentials of Strength and Conditioning (2nd ed.).
Champaign, IL: Human Kinetics.
Baker, D., WIlson, G., & Carlyon, R. (1994). Periodization: The effect on strength of
manipulating volume and intensity. Journal of Strength & Conditioning Research,
8(4), 235-242.
Borg, G. (1998). Borg's perceived exertion and pain scales. Champaign, Ill.; United States:
Human Kinetics.
Borselen, F., Vos, N. H., Fry, A. C., & Kraemer, W. J. (1992). The role of anaerobic
exercise in overtraining. National Strength and Conditioning Association Journal,
14(3), 74-79
Buford, T. W., Rossi, S. J., Smith, D. B., & Warren A. J. (2007). A comparison of
periodization models during nine weeks with equated volume and intensity for
strength Journal of Strength & Conditioning Research, 21(4), 1245-1250.
Bushie, J. L., C. (2007). Are we training smart, or just hard? Athletic Therapy Today; the
Journal for Sports Health Care Professionals., 12(3), 6-8.
Costa, R. J. S., Jones, G. E., Lamb, K. L., Coleman, R., & Williams, J. H. H. (2005). The
49
Effects of a High Carbohydrate Diet on Cortisol and Salivary Immunoglobulin A
(sIgA) During a Period of Increase Exercise Workload Amongst Olympic and
Ironman Triathletes. International Journal of Sports Medicine, 26(10), 880-885.
Day, M. L., McGuigan, M. R., Brice, G., & Foster, C. (2004). Monitoring exercise intensity
during resistance training using the session RPE scale. Journal of Strength &
Conditioning Research, 18(2), 353-358.
Dressendorfer, R. H., Wade, C. E., Schaff, J. H. (1985). Increased heart rate in runners: a
valid sign of overtaining? Physician & Sports Medicine, 13, 77-86.
Fleck, S. J. (1999). Periodized strength training: a critical review. Journal of Strength &
Conditioning Research, 13(1), 82-89.
Folland, J. P., & Williams, A. G. (2007). The adaptations to strength training: morphological
and neurological contributions to increased strength. Sports Medicine, 37(2), 145-
168.
Foster, C. (1998). Monitoring training in athletes with reference to overtraining syndrome. /
Enregistrement de l ' entrainement d ' athletes avec reference au syndrome de
surentrainement. Medicine & Science in Sports & Exercise, 30(7), 1164-1168.
Fry, A. C., Kraemer, W. J., Borselen, F. V., Lynch, J. M., Marsit, J. L., Roy, P. E., Triplett,
T. N., Knuttgen, H. G. (1994a). Performance decrements with high-intensity
resistance exercise overtraining. Medicine & Science in Sports & Science, 26(9),
1165-1173.
Fry, A. C., Kraemer, W.J., Lynch, M.J., Triplett, T.N., & Koziris, P.L. (1994b). Does short-
term near-maximal intensity machine resistance training induce overtraining?
Journal of Strength & Conditioning Research, 8(3), 188-191.
Fry, A. C., & Kraemer, W.J. (1997). Resistance exercise overtraining and overreaching:
Neuroendocrine responses. Sports Medicine, 23(2), 106-129.
50
Fry, A. C., Webber, J. M., Weiss, L. W., Fry, M. D., & Yuhua, L. (2000). Impaired
performances with excessive high-intensity free-weight training. Journal of Strength
& Conditioning Research, 14(1), 54-61.
Gearhart, R., F., Goss, F. L., Lagally, K. M., Jakicic, J. M., Gallagher, J., Gallagher, K. I., &
Robertson, R. J. (2002). Ratings of perceived exertion in active muscle during
highintensity and low-intensity resistance exercise. Journal of Strength &
Conditioning Research, 16(1), 87-91.
Garnacho-Castaño, M. V., López-Lastra, S., & Maté-Muñoz, J. L. (2015). Reliability and
validity assessment of a linear position transducer. Journal of Sports Science &
Medicine, 14(1), 128.
Halson, S. L., Jeukendrup, A. E. (2004). Does overtraining exist? Sports Medicine, 34(14),
967-981.
Hoffman, J. R. (2002). Physiological Aspects of Sport Training and Performance.
Champaign, IL: Human Kinetics.
Hoffman, J. R., Kaminsky, M. (2000). Use of performance testing for monitoring
overtraining in elite youth basketball players. Strength and Conditioning Journal,
22(6), 54-62.
Hoffman, J. R., Ratamess, N. A., Klatt, M., Faigenbaum, A. D., Ross, R. E., Tranchina, N.
M., McCurley, R. C., Kang, J., & Kraemer, W. J. (2009). Comparison between
different off-season resistance training programs in divison III american college
football players. Journal of Strength & Conditioning Research, 23(1), 11-19.
Hoffman, J. R., Wendell, M., Cooper, J., & Kang, J. (2003). Comparison between linear and
nonlinear in-season training programs in freshman football players. Journal of
Strength & Conditioning Research, 17(3), 561-565.
Jeukendrup, A. D., A. V. (1998). Heart rate monitoring during training and competition in
cyclists. Journal of Sports Sciences, 16, 91-99.

51
Jeukendrup, A. E., Hesselink, M. K., Snyder, A. C., Kuipers, H., & Keizer, H. A. (1992).
Physiological changes in male competitive cyclists after two weeks of intensified
training. International Journal of Sports Medicine, 13(7), 534-541.
Kraemer, W. J. (1997). A series of studies - the physiological basis for strength training in
American football: fact over philosophy. Journal of Strength & Conditioning
Research, 11(3), 131-142.
Kraemer, W. J. F., S. J. (2007). Optimizing Strength Training: Designing Nonlinear
Periodization Workouts. Champaign, IL: Human Kinetics.
Lagally, K. M., & Amorose, A. J. (2007). The validity of using prior ratings of perceived
exertion to regulate resistance exercise intensity. Perceptual and Motor Skills,
104(2), 534-542.
Lagally, K. M., McCaw, S. T., Young, G. T., Medema, H. C., & Thomas, D. Q. (2004).
Ratings of perceived exertion and muscle activity during the bench press exercise in
recreational and novice lifters. Journal of Strength & Conditioning Research, 18(2),
359-364.
Lehmann, M., Foster, C., & Keul, J. (1993). Overtraining in endurance athletes: a bief
review. Medicine & Science in Sports & Exercise, 25, 854-862.
Lemyre, P. N., Roberts, G. C., & Stray-Gundersen, J. (2007). Motivation, overtraining, and
burnout: Can self-determined motivation predict overtraining and burnout in elite
athlete? European Journal of Sport Science, 7(2), 115-126.
MacIntosh, B. R., & Rassier, D. E. (2002). What is fatigue? / Qu ' est-ce que la fatigue?
Canadian Journal of Applied Physiology, 27(1), 42-55.
Meeusen, R., Piacentini, M. F., Busschaert, B., Buyse, L., Schutter, G. D., &
StrayGundersen, J. (2004). Hormonal responses in athletes: the use of a two bout
exercise protocol to detect subtle differences in (over)training status. European
Journal of Applied Physiology, 91, 140-146.

52
Moir, G., Sanders, R., Button, C., & Glaister, M. (2005). The influence of familiarization on
the reliability of force variables measured during unloaded and loaded vertical
jumps. Journal of Strength and Conditioning Research, 19(1), 140-145.
Moore, C. A., Fry, A. C. (2007). Nonfunctional overreaching during off-season training for
skill position players in collegiate american football. Journal of Strength &
Conditioning Research, 21(3), 793-800.
Peterson, M. D., Dodd, D. J., Alvar, B. A., Rhea, M. R., & Favre, M. (2008). Undulating
training for the development of hierarchical fitness and improved firefighter job
performance. Journal of Strength & Conditioning Research, 22(5), 1683-1695.
Rhea, M., R., Phillips, W. T., Burkett, L. N., Stone, W. J., Ball, S. D., Alvar, B. A., &
Thomas, A. B. (2003). A comparison of linear and undulating periodized progams
with equated volume and intensity for local muscular endurance. Journal of Strength
& Conditioning Research, 17(1), 82-87.
Rhea, M. R., Ball, S. D., Phillips, W. T., & Burkett, L. N. (2002a). A comparison of linear
and daily undulating periodized programs with equated volume and intensity for
strength. Journal of Strength & Conditioning Research, 16(2), 250-255.
Rhea, M. R., Ball, S. D., Phillips, W. T., & Burkett, L. N. (2002b). A comparison of linear
and daily undulating periodized programs with equated volume and intensity for
strength. Journal of Strength & Conditioning Research, 16(2), 250-255.
Snyder, A. C., Jeukendrup, A. E., Hesselink, M. K. C., Kuipers, H., & Foster, C. (1993). A
physiological/psychological indicator of over-reaching during intensive training. /
Un indicateur physiologique-psychologique de surentrainement de courte duree
pendant un entrainement intensif. International Journal of Sports Medicine, 14(1),
29-32.
Stone, M. H., Keith, R. E., Kearney, J. T., Fleck, S. J., Wilson, G. D., & Triplett, N. T.
(1991). Overtraining: A review of the signs, symptoms and possible causes. Journal
of Applied Sport Science Research, 5(1), 35-50.

53
Stone, M. H., Potteiger, J. A., Pierce, K. C., Proulx, C. M., O'Bryant, H. S., Johnson, R. L.,
et al. (2000). Comparison of the effects of three different weight-training programs
on the one repetition maximum squat. Journal of Strength & Conditioning Research,
14(3), 332-337.
Sweet, T. W., Foster, C., McGuigan, M. R., & Brice, G. (2004). Quantitation of resistance
training using the session rating of perceived exertion method. Journal of Strength &
Conditioning Research, 18(4), 796-802.
Taylor, J. L., Allen, G. M., Butler, J. E., & Gandevia, S. C. (2000). Supraspinal fatigue
during intermittent maximal voluntary contractions of the human elbow flexors.
Journal of Applied Physiology, 89(1), 305-313.
Urhausen, A., & Kindermann, W. (2002). Diagnosis of overtraining: What tools do we
have? Sports Medicine, 32(2), 95-102.
Warren, B. J., Stone, M. H., Kearney, J. T., Fleck, S. J., Johnson, R. L., Wilson, G. D., &
Kraemer, W. J. (1992). Performance measures, blood lactate and plasma ammonia as
indicatiors of overwork in elite junior weightlifters. International Journal of Sports
Medicine, 13(5), 372-376.

54
Appendix A
Human Subjects Review Form and Responses

55
1. What is your research question, or the specific hypothesis?
Specific Aim: Develop a system of easily collected outcome measures in determining the
appropriate level of training volume through readiness-adjusted tonnage for each week.

56
2. What are the potential benefits of the proposed research to the field?
When designing any resistance training program, general principles of progression, overload,
and specificity are a crucial foundation. Any resistance training program designed for an
individual should accomplish specific goals and be built with the specific purpose to achieve
them with intensities that overload and push the individual to super-compensate and adapt.
The intensities and demands placed on the individual should increase progressively as the
individual becomes adapted to the stimuli (Baechle & Earle, 2015). However, progression is
not always maintained in a steady fashion with constant improvements over time (Baechle &
Earle, 2015). It is important that the resistance training programs take some form of
periodization, and not just a random assortment of load and volume, in order to prevent
stagnation. Periodization itself is the structuring and organization of planned variations in
specificity, intensity, and volume over phases or “periods” of training (Baechle & Earle,
2015). The avoidance of stagnation and plateaus in positive adaptations is a primary purpose
of applying periodization, and thus increases the effectiveness of the time spent training
(Baechle & Earle, 2015; Fleck, 1999; Hoffman, 2002; Kraemer, 2007).
When evaluating the effectiveness of training programs, a focus on avoiding stagnation and
plateaus is often as important as avoiding overtraining. On one side of the spectrum, a lack of
novel stimuli will not yield any progress in the adaptations derived from training, while an
over application of training stress may lead to negative effects, such as overtraining. One
method of monitoring the amount of stimulus from resistance training is to track the total
volume load, expressed as tonnage defined as summation of sets times repetitions multiplied
by the load for that set.
When programmed with proper application, overreaching protocols can have positive effects
to break performance plateaus, however it could also be detrimental to the individual’s
performance if used incorrectly, which outlines the difference between functional and non-
functional overreaching. Overreaching itself is often described as a physiological state in
which an individual ceases to make performance increases, or even experiences a temporary
performance decrease when training stimuli is too high for a prolonged period of time with
volumes and intensities that are unmanageable at that given time (Armstrong, 2002; Baechle
& Earle, 2015; Borselen, 1992; Bushie, 2007).
When non-functional overreaching is left unmanaged for some time without a decrease in
training intensity, training volume, or both, subjects may transition into a state of chronic
fatigue known as overtraining syndrome (Hoffman, 2002). Overtraining syndrome is a more
severe state than non-functional overreaching, in which, some cases have taken several weeks
or months of recovery before the individual returns to his/her previous state (Armstrong, 2002;
Borselen, 1992; Bushie, 2007; Fry, 1997; Lemyre, 2007; Stone, 1991; Urhausen, 2002).
Symptoms of overtraining include increases in resting heart rate, muscle soreness and pain,
with decreases in sport performance, maximal power output, muscular strength, appetite, as
well as other symptoms such as weight loss, irregular sleep patterns, decreased willingness to
train, irritability, and frequent illness (Armstrong, 2002; Borselen, 1992; Fry, 1997; Stone,
1991; Urhausen, 2002).
It would be useful to develop methods of managing the training programs to avoid
overtraining syndrome and effectively administer planned methods of functional overreaching

57
when appropriate, such as in the case of a higher-level athlete who is in need of specialized
stimuli for adaptation. How to go about applying a functional overreaching dose is an on-
going discussion amongst strength coaches, personal trainers, and those in charge of program
design. It has been suggested that the use of monitoring the total volume load in tonnage of a
program may decrease the risk of overtraining, so long as an upper tolerable limit has been
identified, and increase the effectiveness and performance of the training cycle (Peterson,
2008).
While many strength coaches utilize methods of monitoring training programming details as
well as the total volume load their athletes experience, respond positively to, and recover from,
there is currently no way of determining exactly how much volume is normally beneficial.
This study will be considers the idea of defining an athlete’s relative maximum recoverable
volume of resistance training in tonnage per week, as well as the cumulative tonnage over the
course of the training program until subjects begin to demonstrate symptoms of non-functional
overreaching. This will be done with the use of weekly readiness monitoring via performance
measures to determine the total volume load achievable before non-functional overreaching
ensues, and using a multiple regression model in order to predict this volume beforehand to
yield more effective training programs and effective applications of functional overreaching.
3. What are the potential benefits, if any, of the proposed research to the subjects?
Individual subjects in this study will gain direct benefits by identifying their own personal
maximum recoverable volume, which can be used to better plan future training programs, as
well as receive free periodized training programming for 10 weeks.
4a. Describe how you will identify the subject population, and how you will contact key
individuals who will allow you access to that subject population or database.
Subjects will be recruited via flyers posted on the WWU campus.
4b. Describe how you will recruit a sample from your subject population, including possible
use of compensation, and the number of subjects to be recruited.
Subjects will be included only if they have no history of orthopedic injury requiring surgery.
Subjects will be excluded from the study if they have less than one year of resistance training.
A total of 40 subjects will be recruited.
5. Briefly describe the research methodology. Attach copies of all test
instruments/questionnaires that will be used. Note: All attachments must be in final form;
drafts are unacceptable.
The purpose of this study was to develop a novel approach to determining weekly volume
loads with the use of daily readiness markers as reference points within the program to
determine the maximal recoverable volume. More specifically, to predict the upper tolerable
limit of a subject’s recoverable resistance training volume and through the use of a regression
equation, find a correlation to a previously measured point of reference. This was achieved by
having subjects monitor their average resting heart rate using a wireless Polar H7 Bluetooth
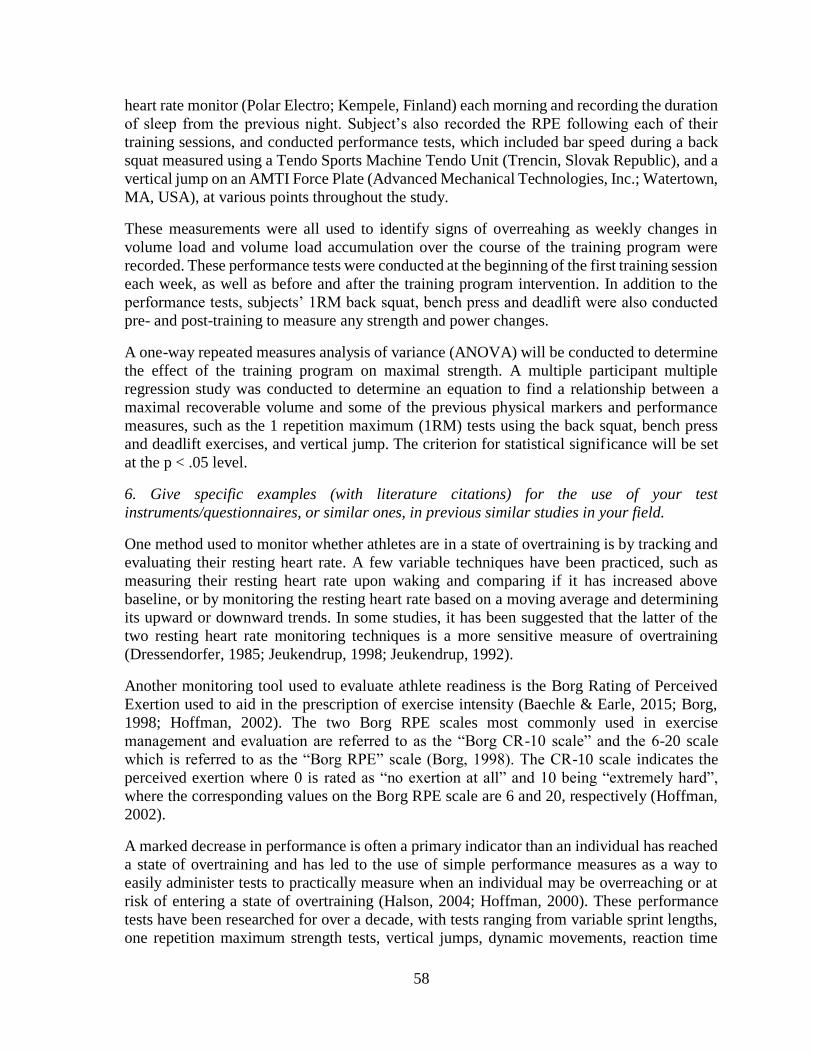
58
heart rate monitor (Polar Electro; Kempele, Finland) each morning and recording the duration
of sleep from the previous night. Subject’s also recorded the RPE following each of their
training sessions, and conducted performance tests, which included bar speed during a back
squat measured using a Tendo Sports Machine Tendo Unit (Trencin, Slovak Republic), and a
vertical jump on an AMTI Force Plate (Advanced Mechanical Technologies, Inc.; Watertown,
MA, USA), at various points throughout the study.
These measurements were all used to identify signs of overreahing as weekly changes in
volume load and volume load accumulation over the course of the training program were
recorded. These performance tests were conducted at the beginning of the first training session
each week, as well as before and after the training program intervention. In addition to the
performance tests, subjects’ 1RM back squat, bench press and deadlift were also conducted
pre- and post-training to measure any strength and power changes.
A one-way repeated measures analysis of variance (ANOVA) will be conducted to determine
the effect of the training program on maximal strength. A multiple participant multiple
regression study was conducted to determine an equation to find a relationship between a
maximal recoverable volume and some of the previous physical markers and performance
measures, such as the 1 repetition maximum (1RM) tests using the back squat, bench press
and deadlift exercises, and vertical jump. The criterion for statistical significance will be set
at the p < .05 level.
6. Give specific examples (with literature citations) for the use of your test
instruments/questionnaires, or similar ones, in previous similar studies in your field.
One method used to monitor whether athletes are in a state of overtraining is by tracking and
evaluating their resting heart rate. A few variable techniques have been practiced, such as
measuring their resting heart rate upon waking and comparing if it has increased above
baseline, or by monitoring the resting heart rate based on a moving average and determining
its upward or downward trends. In some studies, it has been suggested that the latter of the
two resting heart rate monitoring techniques is a more sensitive measure of overtraining
(Dressendorfer, 1985; Jeukendrup, 1998; Jeukendrup, 1992).
Another monitoring tool used to evaluate athlete readiness is the Borg Rating of Perceived
Exertion used to aid in the prescription of exercise intensity (Baechle & Earle, 2015; Borg,
1998; Hoffman, 2002). The two Borg RPE scales most commonly used in exercise
management and evaluation are referred to as the “Borg CR-10 scale” and the 6-20 scale
which is referred to as the “Borg RPE” scale (Borg, 1998). The CR-10 scale indicates the
perceived exertion where 0 is rated as “no exertion at all” and 10 being “extremely hard”,
where the corresponding values on the Borg RPE scale are 6 and 20, respectively (Hoffman,
2002).
A marked decrease in performance is often a primary indicator than an individual has reached
a state of overtraining and has led to the use of simple performance measures as a way to
easily administer tests to practically measure when an individual may be overreaching or at
risk of entering a state of overtraining (Halson, 2004; Hoffman, 2000). These performance
tests have been researched for over a decade, with tests ranging from variable sprint lengths,
one repetition maximum strength tests, vertical jumps, dynamic movements, reaction time

59
tests, and repetition until failure tests (Alcaraz, 2008; Fry, 1994a; Fry, 1994b; Fry, 2000;
Hoffman, 2000; Warren, 1992).
7. Describe how your study design is appropriate to examine your question or specific
hypothesis. Include a description of controls used, if any.
The literature suggests that performance tests can be used as readiness indicators when
monitoring subject’s response to training stimuli, and manage training load according to
performance tests to avoid non-functional overreaching and overtraining. However, in
previous studies, no correlation has been identified between maximum recoverable volume
and subject’s beginning work capacity, maximum relative strength, and training age in order
to predict upper tolerable limits.
8. Give specific examples (with literature citations) for the use of your study design, or similar
ones, in previous similar studies in your field.
Decreases in performance is often used to monitor athlete readiness and as a primary indicator
than an individual has reached a state of non-functional overreaching or overtraining. This
has led to the use of simple performance measures as a way to easily administer tests to
practically measure when an individual may be overreaching or at risk of entering a state of
overtraining (Halson, 2004; Hoffman, 2000). These performance tests have been researched
for over a decade, with tests ranging from variable sprint lengths, one repetition maximum
strength tests, vertical jumps, dynamic movements, reaction time tests, and repetition until
failure tests (Alcaraz, 2008; Fry, 1994a; Fry, 1994b; Fry, 2000; Hoffman, 2000; Warren,
1992).
While these other studies have used these similar performance tests as readiness indicators,
no previous study has determined maximum recoverable volume using these readiness
indicators to predict the upper tolerable limit of a subject’s recoverable resistance training
volume through the use of a regression equation to find a correlation to a previously measured
point of reference, such as a subject’s beginning work capacity, maximum relative strength,
and training age.
9. Describe the potential risks to the human subjects involved.
Because multiple sets, repetitions, and exercises will be performed, there is a risk of
developing muscle fatigue.
10. If the research involves potential risks, describe the safeguards that will be used to
minimize such risks.
To minimize the risk of muscle fatigue, rest periods of a minimum 60 seconds following each
set, and 5 minutes between exercises will be employed. A rest period of a minimum of 24
hours between training sessions will also be employed
11. Describe how you will address privacy and/or confidentiality.
Each subject will be assigned a unique subject number. Only the principal investigator and
his faculty advisor will have access to information matching particular data sets to individual

60
subjects. All protected health information (PHI) will be assigned the appropriate subject’s ID
and identifiers will be removed to protect the subject’s confidentiality.
Each subject will be given a subject ID that will identify the study, and the subject’s number.
For example, subject IDs will appear similar to that below:
MRV23
The above code indicates that this subject was involved in the study of determining an
equation to calculate maximum recoverable volume (MRV), and that he/she was the 23rd
subject tested (23).
Computer data files will be backed up on appropriate media (zip disks or CD’s) and kept
locked in a filing cabinet in the Biomechanics Laboratory at Western Washington University.
12. If your research involves the use of schools (pre-kindergarten to university level) or other
organizations (e.g.,community clubs, companies), please attach a clearance letter from an
administrator from your research siteindicating that you have been given permission to
conduct this research. For pre-kindergarten to grade 12 level Protocol #
__________________2 of 307/01/05 schools, an administrator (e.g. principal or higher)
should issue the permission. For post-secondary level schoolsthe class instructor may grant
permission. For Western Washington University, this requirement of a clearance letter is
waived if you are recruiting subjects from a scheduled class. If you are recruiting subjects
from a campus group (not a class) at Western Washington University, you are required to
obtain a clearance letter from aleader or coordinator of the group.
N/A
13. If your research involves the use of schools (pre-kindergarten to university level) or other
organizations (e.g.,community clubs, companies), and you plan to take still or video pictures
as part of your research, please complete a) to d) below:
a. Who have you contacted at the school district or organization involved, to determine the
policy on the useof photography in the school or organization?
b. Explain how your research plan conforms to the policy on the use of photography in the
school or organization.
c. Attach a copy of the school district or organization policy on the use of photography at the
schools or organization.
d. Explain how you will ensure that the only people recorded in your pictures will be the ones
that have signed a consent form.
N/A
References
61
Alcaraz, P. E., Sanchez-Lorente, J., & Blazevich, A. J. (2008). Physical performance and
cardiovascular responses to an acute bout of heavy resistance circuit training versus
traditional strength training. Journal of Strength & Conditioning Research, 22(3),
667-671. doi: 10.1519/JSC.0b013e31816a588f
Armstrong, L. E., & VanHeest, J. L. (2002). The unknown mechanism of the overtraining
syndrome. Sports Medicine, 32(3), 185-209.
Baechle, T. R., & Earle, R. W. E. (2015). Essentials of Strength and Conditioning (2nd ed.).
Champaign, IL: Human Kinetics.
Baker, D., WIlson, G., & Carlyon, R. (1994). Periodization: The effect on strength of
manipulating volume and intensity. Journal of Strength & Conditioning Research,
8(4), 235-242.
Borg, G. (1998). Borg's perceived exertion and pain scales. Champaign, Ill.; United States:
Human Kinetics.
Borselen, F., Vos, N. H., Fry, A. C., & Kraemer, W. J. (1992). The role of anaerobic
exercise in overtraining. National Strength and Conditioning Association Journal,
14(3), 74-79
Buford, T. W., Rossi, S. J., Smith, D. B., & Warren A. J. (2007). A comparison of
periodization models during nine weeks with equated volume and intensity for
strength Journal of Strength & Conditioning Research, 21(4), 1245-1250.
Bushie, J. L., C. (2007). Are we training smart, or just hard? Athletic Therapy Today; the
Journal for Sports Health Care Professionals., 12(3), 6-8.
Costa, R. J. S., Jones, G. E., Lamb, K. L., Coleman, R., & Williams, J. H. H. (2005). The
Effects of a High Carbohydrate Diet on Cortisol and Salivary Immunoglobulin A
(sIgA) During a Period of Increase Exercise Workload Amongst Olympic and
62
Ironman Triathletes. International Journal of Sports Medicine, 26(10), 880-885. doi:
10.1055/s-2005-837467
Day, M. L., McGuigan, M. R., Brice, G., & Foster, C. (2004). Monitoring exercise intensity
during resistance training using the session RPE scale. Journal of Strength &
Conditioning Research, 18(2), 353-358. doi: 10.1519/R-13113.1
Dressendorfer, R. H., Wade, C. E., Schaff, J. H. (1985). Increased heart rate in runners: a
valid sign of overtaining? Physician & Sports Medicine, 13, 77-86.
Fleck, S. J. (1999). Periodized strength training: a critical review. Journal of Strength &
Conditioning Research, 13(1), 82-89.
Folland, J. P., & Williams, A. G. (2007). The adaptations to strength training: morphological
and neurological contributions to increased strength. Sports Medicine, 37(2), 145-
168.
Foster, C. (1998). Monitoring training in athletes with reference to overtraining syndrome. /
Enregistrement de l ' entrainement d ' athletes avec reference au syndrome de
surentrainement. Medicine & Science in Sports & Exercise, 30(7), 1164-1168.
Fry, A. C., Kraemer, W. J., Borselen, F. V., Lynch, J. M., Marsit, J. L., Roy, P. E., Triplett,
T. N., Knuttgen, H. G. (1994a). Performance decrements with high-intensity
resistance exercise overtraining. Medicine & Science in Sports & Science, 26(9),
1165-1173.
Fry, A. C., Kraemer, W.J., Lynch, M.J., Triplett, T.N., & Koziris, P.L. (1994b). Does short-
term near-maximal intensity machine resistance training induce overtraining?
Journal of Strength & Conditioning Research, 8(3), 188-191.
Fry, A. C., & Kraemer, W.J. (1997). Resistance exercise overtraining and overreaching:
Neuroendocrine responses. Sports Medicine, 23(2), 106-129.

63
Fry, A. C., Webber, J. M., Weiss, L. W., Fry, M. D., & Yuhua, L. (2000). Impaired
performances with excessive high-intensity free-weight training. Journal of Strength
& Conditioning Research, 14(1), 54-61.
Gearhart, R., F., Goss, F. L., Lagally, K. M., Jakicic, J. M., Gallagher, J., Gallagher, K. I., &
Robertson, R. J. (2002). Ratings of perceived exertion in active muscle during
highintensity and low-intensity resistance exercise. Journal of Strength &
Conditioning Research, 16(1), 87-91.
Garnacho-Castaño, M. V., López-Lastra, S., & Maté-Muñoz, J. L. (2015). Reliability and
validity assessment of a linear position transducer. Journal of Sports Science &
Medicine, 14(1), 128.
Halson, S. L., Jeukendrup, A. E. (2004). Does overtraining exist? Sports Medicine, 34(14),
967-981.
Hoffman, J. R. (2002). Physiological Aspects of Sport Training and Performance.
Champaign, IL: Human Kinetics.
Hoffman, J. R., Kaminsky, M. (2000). Use of performance testing for monitoring
overtraining in elite youth basketball players. Strength and Conditioning Journal,
22(6), 54-62.
Hoffman, J. R., Ratamess, N. A., Klatt, M., Faigenbaum, A. D., Ross, R. E., Tranchina, N.
M., McCurley, R. C., Kang, J., & Kraemer, W. J. (2009). Comparison between
different off-season resistance training programs in divison III american college
football players. Journal of Strength & Conditioning Research, 23(1), 11-19. doi:
10.1519/JSC.0b013e3181876a78
Hoffman, J. R., Wendell, M., Cooper, J., & Kang, J. (2003). Comparison between linear and
nonlinear in-season training programs in freshman football players. Journal of
Strength & Conditioning Research, 17(3), 561-565.

64
Jeukendrup, A. D., A. V. (1998). Heart rate monitoring during training and competition in
cyclists. Journal of Sports Sciences, 16, S91-S99.
Jeukendrup, A. E., Hesselink, M. K., Snyder, A. C., Kuipers, H., & Keizer, H. A. (1992).
Physiological changes in male competitive cyclists after two weeks of intensified
training. International Journal of Sports Medicine, 13(7), 534-541.
Kraemer, W. J. (1997). A series of studies - the physiological basis for strength training in
American football: fact over philosophy. Journal of Strength & Conditioning
Research, 11(3), 131-142.
Kraemer, W. J. F., S. J. (2007). Optimizing Strength Training: Designing Nonlinear
Periodization Workouts. Champaign, IL: Human Kinetics.
Lagally, K. M., & Amorose, A. J. (2007). The validity of using prior ratings of perceived
exertion to regulate resistance exercise intensity. Perceptual and Motor Skills,
104(2), 534-542.
Lagally, K. M., McCaw, S. T., Young, G. T., Medema, H. C., & Thomas, D. Q. (2004).
Ratings of perceived exertion and muscle activity during the bench press exercise in
recreational and novice lifters. Journal of Strength & Conditioning Research, 18(2),
359-364. doi: 10.1519/R-12782.1
Lehmann, M., Foster, C., & Keul, J. (1993). Overtraining in endurance athletes: a bief
review. Medicine & Science in Sports & Exercise, 25, 854-862.
Lemyre, P. N., Roberts, G. C., & Stray-Gundersen, J. (2007). Motivation, overtraining, and
burnout: Can self-determined motivation predict overtraining and burnout in elite
athlete? European Journal of Sport Science, 7(2), 115-126.
MacIntosh, B. R., & Rassier, D. E. (2002). What is fatigue? / Qu ' est-ce que la fatigue?
Canadian Journal of Applied Physiology, 27(1), 42-55.
Meeusen, R., Piacentini, M. F., Busschaert, B., Buyse, L., Schutter, G. D., &
StrayGundersen, J. (2004). Hormonal responses in athletes: the use of a two bout

65
exercise protocol to detect subtle differences in (over)training status. European
Journal of Applied Physiology, 91, 140-146. doi: 10.1007/s00421-003-0940-1
Moir, G., Sanders, R., Button, C., & Glaister, M. (2005). The influence of familiarization on
the reliability of force variables measured during unloaded and loaded vertical
jumps. Journal of Strength and Conditioning Research, 19(1), 140-145.
Moore, C. A., Fry, A. C. (2007). Nonfunctional overreaching during off-season training for
skill position players in collegiate american football. Journal of Strength &
Conditioning Research, 21(3), 793-800. doi: 10.1519/R-20906.1
Peterson, M. D., Dodd, D. J., Alvar, B. A., Rhea, M. R., & Favre, M. (2008). Undulating
training for the development of hierarchical fitness and improved firefighter job
performance. Journal of Strength & Conditioning Research, 22(5), 1683-1695. doi:
10.1519/JSC.0b013e31818215f4
Rhea, M., R., Phillips, W. T., Burkett, L. N., Stone, W. J., Ball, S. D., Alvar, B. A., &
Thomas, A. B. (2003). A comparison of linear and undulating periodized progams
with equated volume and intensity for local muscular endurance. Journal of Strength
& Conditioning Research, 17(1), 82-87.
Rhea, M. R., Ball, S. D., Phillips, W. T., & Burkett, L. N. (2002a). A comparison of linear
and daily undulating periodized programs with equated volume and intensity for
strength. Journal of Strength & Conditioning Research, 16(2), 250-255.
Rhea, M. R., Ball, S. D., Phillips, W. T., & Burkett, L. N. (2002b). A comparison of linear
and daily undulating periodized programs with equated volume and intensity for
strength. Journal of Strength & Conditioning Research, 16(2), 250-255.
Snyder, A. C., Jeukendrup, A. E., Hesselink, M. K. C., Kuipers, H., & Foster, C. (1993). A
physiological/psychological indicator of over-reaching during intensive training. /
Un indicateur physiologique-psychologique de surentrainement de courte duree
pendant un entrainement intensif. International Journal of Sports Medicine, 14(1),
29-32.

66
Stone, M. H., Keith, R. E., Kearney, J. T., Fleck, S. J., Wilson, G. D., & Triplett, N. T.
(1991). Overtraining: A review of the signs, symptoms and possible causes. Journal
of Applied Sport Science Research, 5(1), 35-50.
Stone, M. H., Potteiger, J. A., Pierce, K. C., Proulx, C. M., O'Bryant, H. S., Johnson, R. L.,
et al. (2000). Comparison of the effects of three different weight-training programs
on the one repetition maximum squat. Journal of Strength & Conditioning Research,
14(3), 332-337.
Sweet, T. W., Foster, C., McGuigan, M. R., & Brice, G. (2004). Quantitation of resistance
training using the session rating of perceived exertion method. Journal of Strength &
Conditioning Research, 18(4), 796-802. doi: 10.1519/14153.1
Taylor, J. L., Allen, G. M., Butler, J. E., & Gandevia, S. C. (2000). Supraspinal fatigue
during intermittent maximal voluntary contractions of the human elbow flexors.
Journal of Applied Physiology, 89(1), 305-313.
Urhausen, A., & Kindermann, W. (2002). Diagnosis of overtraining: What tools do we
have? Sports Medicine, 32(2), 95-102.
Warren, B. J., Stone, M. H., Kearney, J. T., Fleck, S. J., Johnson, R. L., Wilson, G. D., &
Kraemer, W. J. (1992). Performance measures, blood lactate and plasma ammonia as
indicatiors of overwork in elite junior weightlifters. International Journal of Sports
Medicine, 13(5), 372-376.

67
Appendix B
Informed Consent

68
Western Washington University
Consent to Take Part in a Research Study
Project: Determining the Maximum Recoverable Volume of Resistance Training in Tonnage
during a Strength Phase
You are invited to participate in a research study investigating the effects of volume load on recovery
and performance. To improve upon previous studies, this analysis aims to objectively provide a
direct comparison of the upper tolerable limits of resistance training volume and use a multiple
regression model in order to predict this maximum recoverable volume. The results of this study will
enhance our understanding of what limits can be reached in resistance training to yield more
effective training programs and effective applications of functional overreaching.
I UNDERSTAND THAT:
This experiment will involve the completion of a series of tasks that include a brief, low intensity
warm-up on a cycle ergometer, maximum vertical jump tests, resistance training with the intent to
move the bar as fast as possible, and a brief low-intensity cool down. Additionally this experiment
will require me to follow a resistance training program for up to 10-weeks, four days per week. My
participation will require approximately 60 minutes of my time for each testing sessions, and each
training session during the training program.
There may be risks during strength training and will be minimized by asking for a spotter when
needed. I understand that exercise can lead to muscular soreness, cramping, pain, and fatigue. During
testing, there is a risk of experiencing muscle soreness that should disappear after a period of rest. I
understand that if exercise testing is painful, I can stop at any time. In addition, I am aware that I
could experience delayed onset muscle soreness (DOMS) after the session that could last for 24-72
hours. The safeguards that will be used minimize potential muscle soreness include a warm-up,
acclimation, and cool down period. If I feel like I cannot or should not perform any of these tasks, I
could opt out from the participation in this study.
My participation is voluntary. I am able to withdraw from the study at any point in time without
penalty.
All information is confidential. My signed consent form will be kept in a locked cabinet separate
from any information tying me to this study. Only the primary researcher and assistants will have
access to any data gathered in this study. My name will not be associated with any performances or
relevant data to the study.
My signature on this form does not waive my legal rights of protection.
This experiment is conducted by Patrick Castelli under the supervision of Dr. Dave Suprak. Any
questions that you may have about the experiment or your participation may be directed to the
investigators at (425)381-5556.
If you have any questions about your participation or your right as a research participant, you can
contact the WWU Human Protections Administrator (HPA), (360)650-3220. If during or after
participation in this study you suffer from any adverse effect as a results of participation, please
notify the researcher directing the study or the WWU Human Protections Administrator.
I have read the above description and agree to participation in this study.
________________________________________________________________________
Participant’s Signature Date
__________________________________________________
Participant’s PRINTED NAME
Note: Please sign both copies of the form and retain the copy marked “Participant”

69
Appendix C
NSCA Guidelines for 1RM Testing Protocol
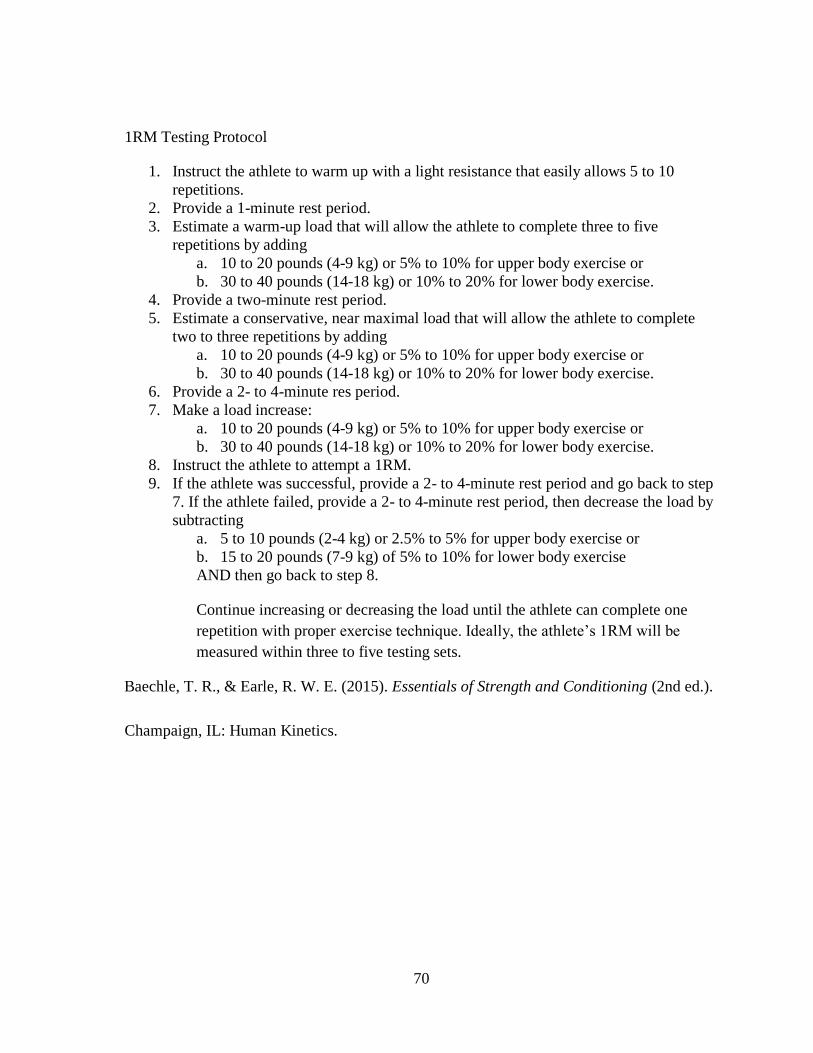
70
1RM Testing Protocol
1. Instruct the athlete to warm up with a light resistance that easily allows 5 to 10
repetitions.
2. Provide a 1-minute rest period.
3. Estimate a warm-up load that will allow the athlete to complete three to five
repetitions by adding
a. 10 to 20 pounds (4-9 kg) or 5% to 10% for upper body exercise or
b. 30 to 40 pounds (14-18 kg) or 10% to 20% for lower body exercise.
4. Provide a two-minute rest period.
5. Estimate a conservative, near maximal load that will allow the athlete to complete
two to three repetitions by adding
a. 10 to 20 pounds (4-9 kg) or 5% to 10% for upper body exercise or
b. 30 to 40 pounds (14-18 kg) or 10% to 20% for lower body exercise.
6. Provide a 2- to 4-minute res period.
7. Make a load increase:
a. 10 to 20 pounds (4-9 kg) or 5% to 10% for upper body exercise or
b. 30 to 40 pounds (14-18 kg) or 10% to 20% for lower body exercise.
8. Instruct the athlete to attempt a 1RM.
9. If the athlete was successful, provide a 2- to 4-minute rest period and go back to step
7. If the athlete failed, provide a 2- to 4-minute rest period, then decrease the load by
subtracting
a. 5 to 10 pounds (2-4 kg) or 2.5% to 5% for upper body exercise or
b. 15 to 20 pounds (7-9 kg) of 5% to 10% for lower body exercise
AND then go back to step 8.
Continue increasing or decreasing the load until the athlete can complete one
repetition with proper exercise technique. Ideally, the athlete’s 1RM will be
measured within three to five testing sets.
Baechle, T. R., & Earle, R. W. E. (2015). Essentials of Strength and Conditioning (2nd ed.).
Champaign, IL: Human Kinetics.

71
Appendix D
Sample training program load increase for the back squat

72
Wk
1
Wk 2 Wk 3 Wk 4 Wk 5 Wk 6 Wk 7 Wk 8 Wk 9 Wk 10
Back
Squat
5x3
@
80%
2x3 @
80%,
2x5,
1x4 @
67.5%
2x3 @
80%,
3x5,
1x2 @
72.5%
2x3 @
80%,
4x5 @
77.5%
2x3
@
80%,
3x5,
2x4,
1x1
@
80%
2x3 @
80%,
2x5,
4x4,
1x3 @
82.5%
2x3
@
80%,
1x5,
3x4,
4x3,
2x2
@
60%
2x3 @
80%,
2x4,
4x3,
9x2,
1x1, @
85%
2x3 @
80%,
1x4,
3x3,
16x2,
@
87.5%
2x3 @
80%,
2x3,
23x2,
1x1 @
90%
Good
Morning
3x8
@
55%
3x8 @
57.5 %
3x8 @
60%
3x6 @
62.5%
3x6
@
65%
3x6 @
67.5%
3x4
@
70%
3x4 @
72.5%
3x4 @
75%
3x4 @
77.5%

73
Appendix E
Weekly training program layout

74
Monday Tuesday Thursday Friday
Back Squat Bench Press Deadlift Standing Strict Press
Good Morning BB Bent Over Row Front Squat Lat Pull Down
Planks Triceps Extensions Planks Biceps Flexions

75
Appendix F
Weekly training log
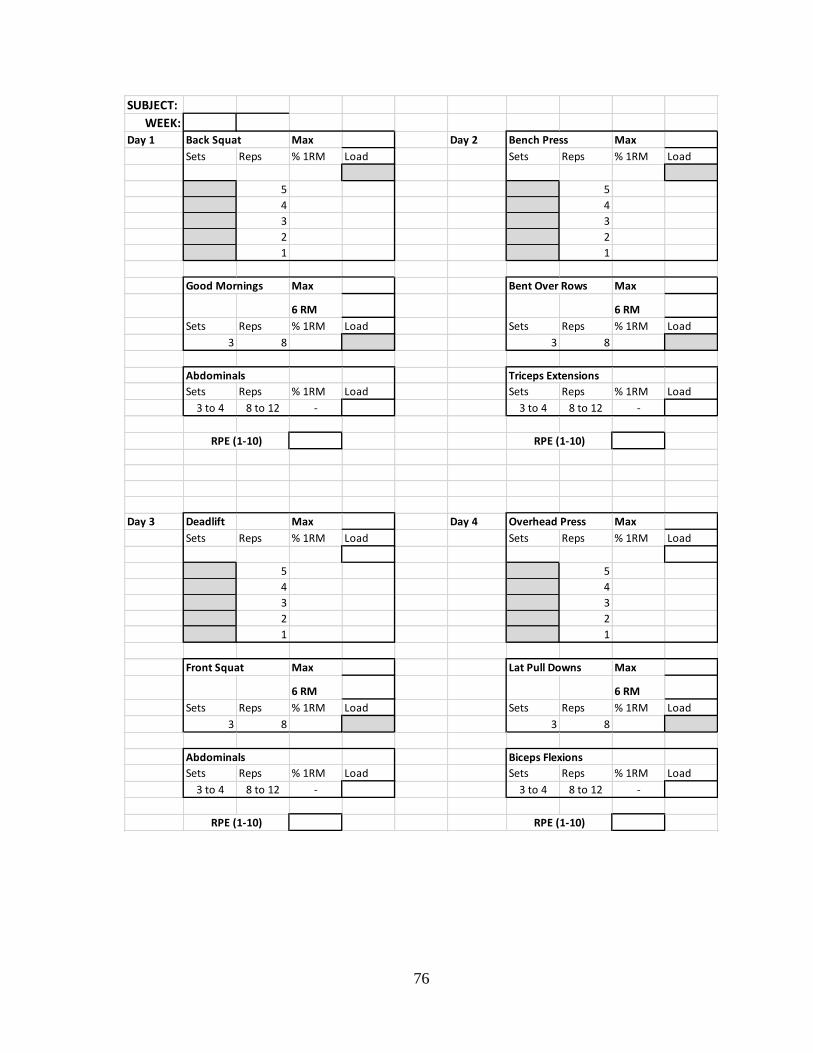
76
SUBJECT:
WEEK:
Day 1 Back Squat Max Day 2 Bench Press Max
Sets Reps % 1RM Load Sets Reps % 1RM Load
5 5
4 4
3 3
2 2
1 1
Good Mornings Max Bent Over Rows Max
6 RM 6 RM
Sets Reps % 1RM Load Sets Reps % 1RM Load
3 8 3 8
Abdominals Triceps Extensions
Sets Reps % 1RM Load Sets Reps % 1RM Load
3 to 4 8 to 12 - 3 to 4 8 to 12 -
Day 3 Deadlift Max Day 4 Overhead Press Max
Sets Reps % 1RM Load Sets Reps % 1RM Load
5 5
4 4
3 3
2 2
1 1
Front Squat Max Lat Pull Downs Max
6 RM 6 RM
Sets Reps % 1RM Load Sets Reps % 1RM Load
3 8 3 8
Abdominals Biceps Flexions
Sets Reps % 1RM Load Sets Reps % 1RM Load
3 to 4 8 to 12 - 3 to 4 8 to 12 -
RPE (1-10) RPE (1-10)
RPE (1-10) RPE (1-10)

77
Appendix G
Pre- and post-training program testing of 1RM strength

78
Pre-1RM Post-1RM % change
MRV01
Squat 360 380 6%
Bench 275 290 5%
Deadlift 441 460 4%
MRV02
Squat 263 275 5%
Bench 196 210 7%
Deadlift 270 330 22%
OHP 121 135 12%
MRV06
Squat 265 275 4%
Bench 185 195 5%
Deadlift 335 355 6%
OHP 120 130 8%
MRV08
Squat 265 275 4%
Bench 215 225 5%
Deadlift 345 365 6%
OHP 133 140 5%
MRV09
Squat 325 340 5%
Bench 215 225 5%
MRV10
Squat 405 435 7%
Deadlift 545 565 4%
MRV11
Squat 385 405 5%
Deadlift 405 425 5%
MRV15
Squat 235 240 2%
Bench 200 205 2%
Deadlift 290 315 9%
Average % Change in 1RM 6.15%

79
Appendix H
Statistical Analysis and SPSS Outputs

80
T-Test aveRPE pre vs post
Mean N
Std.
Deviation
Std. Error
Mean
RPE_pre5.1339 14 .76029 .20320
RPE_post 6.9911 14 1.13029 .30208
N Correlation Sig.
Pair 1 RPE_pre &
RPE_post 14 .595 .025
Lower Upper
Pair 1 RPE_pre -
RPE_post-1.85714 .91312 .24404 -2.38436 -1.32992 -7.610 13 .000
Paired Samples Statistics
Pair 1
Paired Samples Correlations
Paired Samples Test
Paired Differences
t df
Sig. (2-
tailed)Mean
Std.
Deviation
Std. Error
Mean
95% Confidence
Interval of the

81
Multiple Regression VL_initial & Relative Strength to determine VL_total
Variables Entered Variables Removed Method
1 VL_initial,
Relative_Strengthb Enter
R R Square
Adjusted R
Square
Std. Error of the
Estimate
1 .952a .906 .889 18796.97508
Sum of Squares df Mean Square F Sig.
Regression37368216809.524 2 18684108404.762 52.881 .000b
Residual 3886588992.476 11 353326272.043
Total 41254805802.000 13
Standardized
Coefficients
B Std. Error Beta
(Constant) -57614.619 26367.656 -2.185 .051
Relative_Strength 2705.286 17751.686 .018 .152 .882
VL_initial 7.950 .984 .941 8.081 .000
Model
Variables Entered/Removeda
Model
a. Dependent Variable: VL_total
b. All requested variables entered.
Model Summary
1
a. Predictors: (Constant), VL_initial, Relative_Strength
ANOVAa
Model
1
a. Dependent Variable: VL_total
b. Predictors: (Constant), VL_initial, Relative_Strength
a. Dependent Variable: VL_total
Coefficientsa
Model
Unstandardized Coefficients
t Sig.
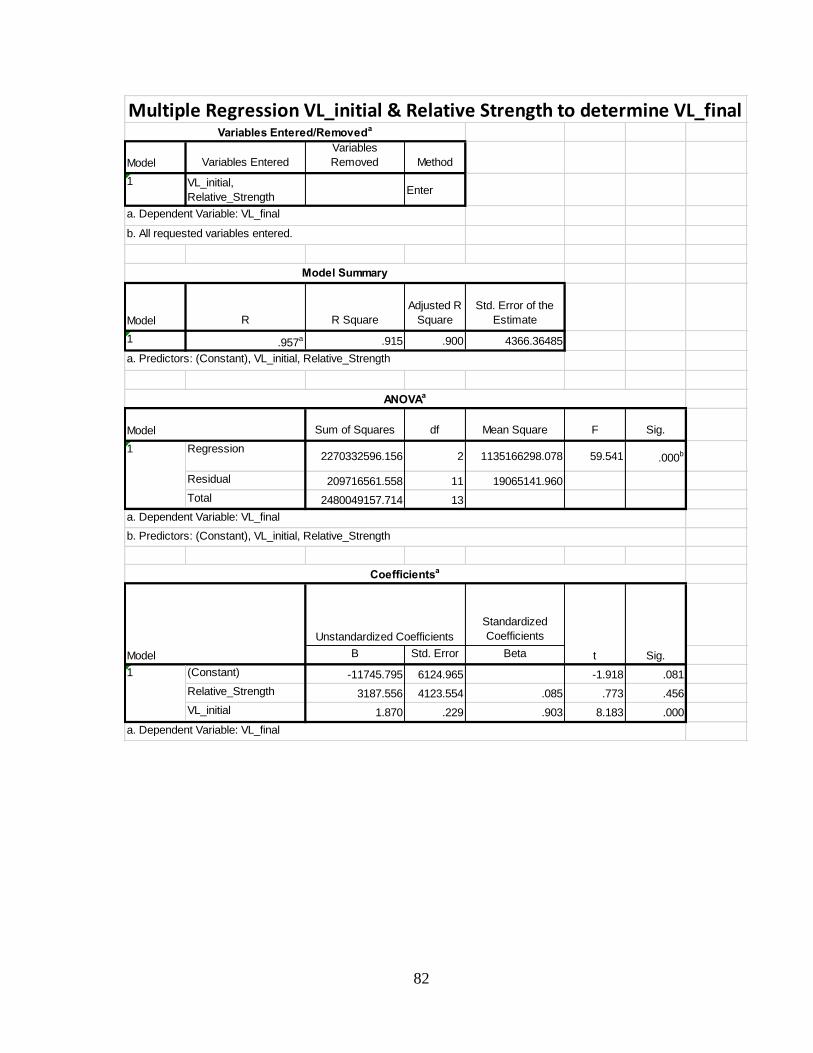
82
Multiple Regression VL_initial & Relative Strength to determine VL_final
Variables Entered
Variables
Removed Method
1 VL_initial,
Relative_StrengthEnter
R R Square
Adjusted R
Square
Std. Error of the
Estimate
1 .957a .915 .900 4366.36485
Sum of Squares df Mean Square F Sig.
Regression2270332596.156 2 1135166298.078 59.541 .000b
Residual 209716561.558 11 19065141.960
Total 2480049157.714 13
Standardized
Coefficients
B Std. Error Beta
(Constant) -11745.795 6124.965 -1.918 .081
Relative_Strength 3187.556 4123.554 .085 .773 .456
VL_initial 1.870 .229 .903 8.183 .000
Sig.
Variables Entered/Removeda
Model
a. Dependent Variable: VL_final
b. All requested variables entered.
Model Summary
Model
a. Predictors: (Constant), VL_initial, Relative_Strength
ANOVAa
Model
1
a. Dependent Variable: VL_final
1
a. Dependent Variable: VL_final
b. Predictors: (Constant), VL_initial, Relative_Strength
Coefficientsa
Model
Unstandardized Coefficients
t

83
Linear Regression VL_initial to determine VL_total
Variables Entered Variables Removed Method
1VL_initial Enter
R R Square
Adjusted R
Square
Std. Error of the
Estimate
1 .952a .906 .898 18015.72192
Sum of Squares df Mean Square F Sig.
Regression37360010966.238 1 37360010966.238 115.108 .000b
Residual 3894794835.762 12 324566236.314
Total 41254805802.000 13
Standardized
Coefficients
B Std. Error Beta
(Constant) -55448.938 21287.327 -2.605 .023
VL_initial 8.041 .749 .952 10.729 .000
Variables Entered/Removeda
Model
a. Dependent Variable: VL_total
b. All requested variables entered.
1
a. Dependent Variable: VL_total
a. Dependent Variable: VL_total
b. Predictors: (Constant), VL_initial
Model Summary
Model
a. Predictors: (Constant), VL_initial
ANOVAa
Model
1
Coefficientsa
Model
Unstandardized Coefficients
t Sig.

84
Linear Regression VL_initial to determine VL_final
Variables
Entered
Variables
Removed Method
1VL_initialb Enter
R R Square
Adjusted R
Square
Std. Error of the
Estimate
1 .954a .911 .903 4292.52148
Sum of Squares df Mean Square F Sig.
Regression2258940269.515 1 2258940269.515 122.597 .000b
Residual 221108888.200 12 18425740.683
Total 2480049157.714 13
Standardized
Coefficients
B Std. Error Beta
(Constant) -9194.039 5072.031 -1.813 .095
VL_initial 1.977 .179 .954 11.072 .000
Variables Entered/Removeda
Model
a. Dependent Variable: VL_final
b. All requested variables entered.
Model Summary
Model
a. Predictors: (Constant), VL_initial
a. Dependent Variable: VL_final
ANOVAa
Model
1
a. Dependent Variable: VL_final
b. Predictors: (Constant), VL_initial
Model
Unstandardized Coefficients
t Sig.
1
Coefficientsa