developing and validating an instrument for student evaluation of
TRANSCRIPT
Developing and Validating an Instrument for Student Evaluation of Teaching
A Final Report from the Student Experience and Ratings of Teaching Committee
A subcommittee of the Faculty of Science Academic Standards Committee
Members: Lyn Baldwin, Chair, (Biological Sciences) Les Matthews (Respiratory Therapy) Ernest Tsui (Physics), Gary Hunt (Center for Teaching and Learning)
Winter 2011
Executive Summary
In May 2007, the Faculty of Science Academic Standards committee established an ad hoc subcommittee to develop a new student evaluation of faculty teaching. After careful review of the literature evaluating the effectiveness of student evaluations, we decided that our student evaluation should focus on the dimensions of teaching that had been shown in previous studies to be highly correlated with student achievement. We also decided to develop statements that were student-centred, discipline and pedagogically neutral and were aspects of teaching that could be reasonably evaluated by students. With this overall philosophy, we embarked on the following steps to develop the survey: (1) review TRU mission statement, (2) identify teaching dimensions to include in the survey, (3) prepare statements, (4) review draft survey with faculty and student focus groups, (5) modify statements, if necessary, (6) run field test of draft survey, (7) analyze results of field test according to established methods and (8) review statements and finalize form. Based on the results of our literature survey, the committee decided to include the following six dimensions of teaching in the survey: preparation and organization, clarity and understandableness, perceived outcome or importance, stimulation of interest in content, encouragement and openness, and availability and helpfulness. We received input from 26 students and 17 faculty during focus groups. More than 300 students in 14 different classes participated in our field test of the draft survey. Based on the results of the field test and the focus groups, statements were re-written, assigned to different dimensions or eliminated from the survey. In total, the proposed survey includes 40 statements. The first eight statements ask that students provide background information regarding why they took the course and their level of involvement with the course. The subsequent 32 statements ask the students to rate their experience of the course. Finally, we included four open-ended questions that asked students to reflect upon their experience within the course. The following report summarizes the findings of the committee and includes our final recommendations to the Science Faculty Council.

Table of Contents
Pg
I. Introduction
1
II. Methods
7
II. Summary Results
9
IV. Recommendations
10
V. References 11
Appendix A: Proposed student evaluation form
13
Appendix B: Results of Field Test
16
Appendix C: Draft student evaluation form used in field test
22
Student Experience and Ratings of Teaching Committee Final Report 1
I. Introduction
Collective Agreement Language In May 2007 the TRU Science Faculty Council Academic Standards Committee created an ad hoc subcommittee with the mandate to accept, develop or acquire an instrument for use in evaluating its members’ teaching performance. This action was mandated by the new TRU / TRUFA collective agreement which required the inclusion of student evaluations as part of teaching portfolios that would be used for summative purposes but allowed individual departments, faculties or schools to develop their own student evaluation tools. Article 7.3.6.2. states “ Student evaluations are mandated to be a part of teaching portfolio
� Summative purposes (personnel decisions) Article 7.3.6.2. The summative performance review for each Member shall be based on:
(a) The Member’s Annual Professional Activity Report per Article 7.2 (b) Evaluation of Member’s performance in teaching for the calendar year under review,
as evidenced by student questionnaires [new instruments and procedures to be developed based upon department requirements]; and
(c) Class room visitation and assessment by colleague; Any other evidence that might be relevant.” Committee Membership This committee was initially established as a subcommittee of Science Academic Standards with Ernest Tsui, Les Matthews, and Lyn Baldwin as representatives of the larger committee. In addition Gary Hunt was invited to join the committee. While he was Resource Librarian at TRU Library, Daniel Brendle-Moczuk was a member of this committee and was especially helpful in locating background literature for the committee. Initially, Penny Heaslip, as Coordinator of the Centre for Teaching and Learning, participated in the committee. Gary Hunt continued on in Penny’s role following his acceptance of the Coordinator of the Teaching and Learning Center position. Underlying philosophy and rationale The need for a new student evaluation of teaching form can be met through one of several ways: (1) TRU Science could continue to use the existing student evaluation form, (2) TRU Science could purchase a commercially produced evaluation form, (3) TRU Science could modify an existing form, or (4) TRU Science could research and develop its own form. Although the existing evaluation form has been in place for many years, an informal poll of Science faculty quickly convinced us that the general attitude towards the document was negative. It became apparent that
Student Experience and Ratings of Teaching Committee Final Report 2
the existing tool did not meet our needs. We were also unable to locate the original development and validation documentation for the existing form.
The option of adopting a published instrument was appealing because it appeared to be a
simple and practical way to complete our mandate. We gave this option very serious consideration while weighing the potential time commitment inherent in development of our own evaluation tool. After reviewing many of the forms used by other universities we came to believe that no existing form addressed the unique and diverse academic environments represented by TRU Science. In addition, we also realized that many forms do not incorporate the findings of the latest research on student evaluation forms into their design. Finally, as this form would be an important tool by which student input would be gathered for summative evaluations of Science faculty, we believed that it was critically important for Science faculty to be active participants in the development of this form. Thus, we decided to develop our own evaluation form.
Our recognition of the failings of many existing evaluation forms made it critical that this committee delve into the vast body of research surrounding the use of student evaluation forms. However, given the extraordinary amount of research that has been completed in this area, we realized that our first task was to clearly articulate the role that we wanted a new student evaluation form to play within the Faculty of Science. The committee decided that an important goal of the form would be that it support the educational intent of the Faculty of Science (Gravestock and Gregor-Greenleaf 2008). While the Faculty of Science currently lacks a mission statement, committee members felt that we could use TRU’s learner-centred mission statement to guide our process:
Thompson Rivers University is a comprehensive, learner-centred, environmentally responsible institution that serves its regional, national, and international learners and their communities through high quality and flexible education, training, research and scholarship.
Although learner-centred teaching has many components (Barr and Tagg 1995), we felt that a
critical aspect of learner-centred teaching was linking the influence of teaching activities to student learning. Given that learner-centred teaching requires that teachers evaluate the role that teaching activities play in student learning, the committee decided that it would focus the evaluation on those dimensions of teaching that previous research has found to be most strongly linked to student learning. By actively tailoring the evaluation to aspects (or dimensions) of teaching that have been found to support student learning, we believed that we would be constructing a student evaluation of teaching form that would best support the goals of TRU Science. However, we also recognized that in order to effectively evaluate their experience within a course, students cannot be asked to respond to questions for which they are not qualified to answer. Students are most qualified to report on their experience within the class and are not qualified to report on the experience of other students (Murray 2005). Thus, we decided that our student evaluation tool would only include statements that directly reflect a student’s experience within a
Student Experience and Ratings of Teaching Committee Final Report 3
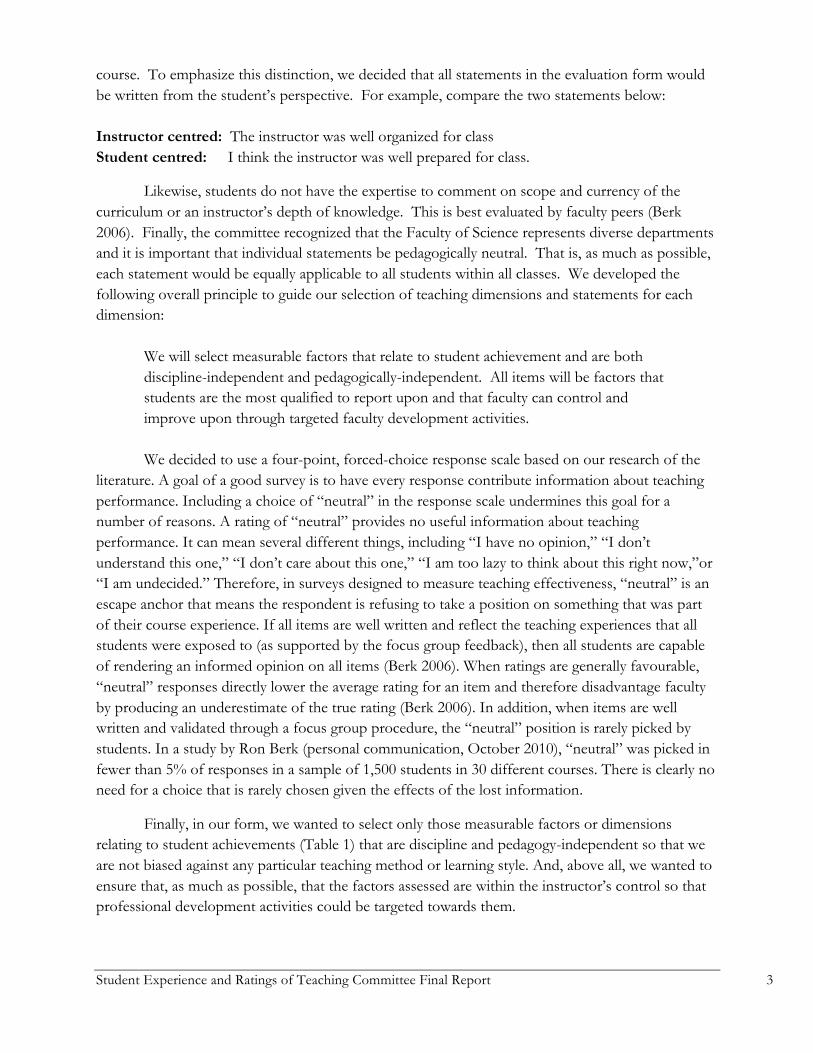
course. To emphasize this distinction, we decided that all statements in the evaluation form would be written from the student’s perspective. For example, compare the two statements below: Instructor centred: The instructor was well organized for class Student centred: I think the instructor was well prepared for class.
Likewise, students do not have the expertise to comment on scope and currency of the curriculum or an instructor’s depth of knowledge. This is best evaluated by faculty peers (Berk 2006). Finally, the committee recognized that the Faculty of Science represents diverse departments and it is important that individual statements be pedagogically neutral. That is, as much as possible, each statement would be equally applicable to all students within all classes. We developed the following overall principle to guide our selection of teaching dimensions and statements for each dimension:
We will select measurable factors that relate to student achievement and are both discipline-independent and pedagogically-independent. All items will be factors that students are the most qualified to report upon and that faculty can control and improve upon through targeted faculty development activities.
We decided to use a four-point, forced-choice response scale based on our research of the
literature. A goal of a good survey is to have every response contribute information about teaching performance. Including a choice of “neutral” in the response scale undermines this goal for a number of reasons. A rating of “neutral” provides no useful information about teaching performance. It can mean several different things, including “I have no opinion,” “I don’t understand this one,” “I don’t care about this one,” “I am too lazy to think about this right now,”or “I am undecided.” Therefore, in surveys designed to measure teaching effectiveness, “neutral” is an escape anchor that means the respondent is refusing to take a position on something that was part of their course experience. If all items are well written and reflect the teaching experiences that all students were exposed to (as supported by the focus group feedback), then all students are capable of rendering an informed opinion on all items (Berk 2006). When ratings are generally favourable, “neutral” responses directly lower the average rating for an item and therefore disadvantage faculty by producing an underestimate of the true rating (Berk 2006). In addition, when items are well written and validated through a focus group procedure, the “neutral” position is rarely picked by students. In a study by Ron Berk (personal communication, October 2010), “neutral” was picked in fewer than 5% of responses in a sample of 1,500 students in 30 different courses. There is clearly no need for a choice that is rarely chosen given the effects of the lost information.
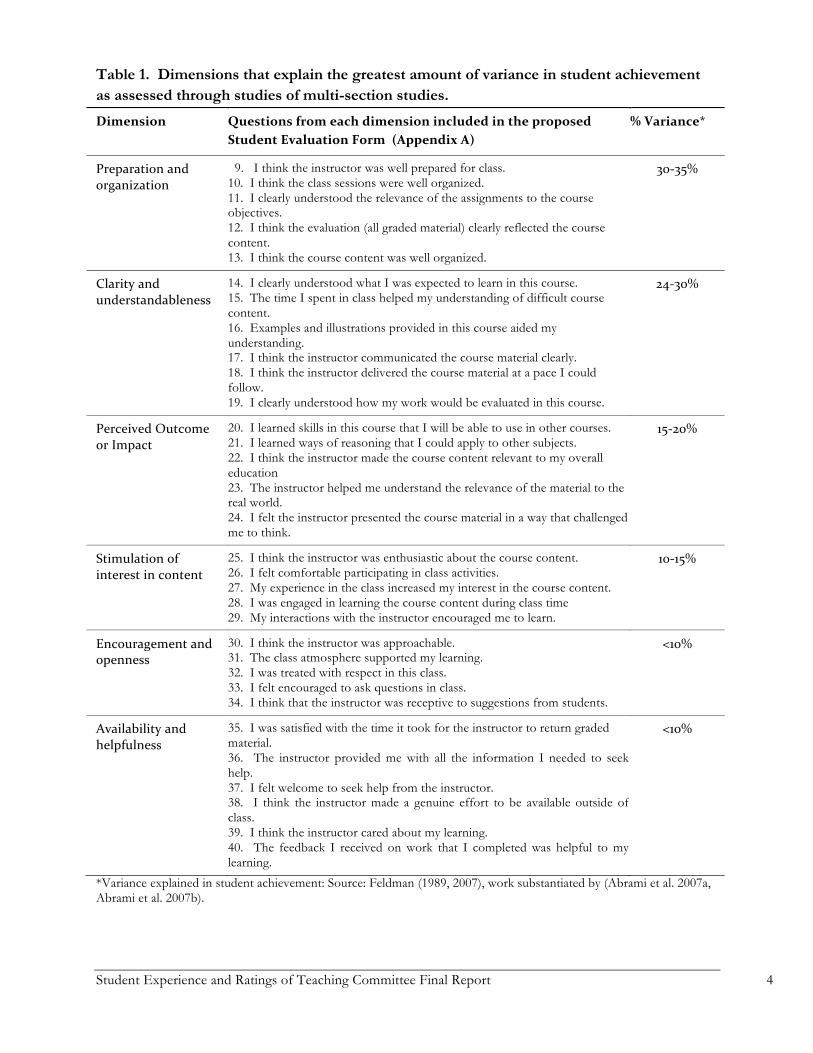
Finally, in our form, we wanted to select only those measurable factors or dimensions relating to student achievements (Table 1) that are discipline and pedagogy-independent so that we are not biased against any particular teaching method or learning style. And, above all, we wanted to ensure that, as much as possible, that the factors assessed are within the instructor’s control so that professional development activities could be targeted towards them.
Student Experience and Ratings of Teaching Committee Final Report 4
Table 1. Dimensions that explain the greatest amount of variance in student achievement as assessed through studies of multi-section studies.
Dimension Questions from each dimension included in the proposed Student Evaluation Form (Appendix A)
% Variance*
Preparation and organization
9. I think the instructor was well prepared for class. 10. I think the class sessions were well organized. 11. I clearly understood the relevance of the assignments to the course objectives. 12. I think the evaluation (all graded material) clearly reflected the course content. 13. I think the course content was well organized.
30-‐35%
Clarity and understandableness
14. I clearly understood what I was expected to learn in this course. 15. The time I spent in class helped my understanding of difficult course content. 16. Examples and illustrations provided in this course aided my understanding. 17. I think the instructor communicated the course material clearly. 18. I think the instructor delivered the course material at a pace I could follow. 19. I clearly understood how my work would be evaluated in this course.
24-‐30%
Perceived Outcome or Impact
20. I learned skills in this course that I will be able to use in other courses. 21. I learned ways of reasoning that I could apply to other subjects. 22. I think the instructor made the course content relevant to my overall education 23. The instructor helped me understand the relevance of the material to the real world. 24. I felt the instructor presented the course material in a way that challenged me to think.
15-‐20%
Stimulation of interest in content
25. I think the instructor was enthusiastic about the course content. 26. I felt comfortable participating in class activities. 27. My experience in the class increased my interest in the course content. 28. I was engaged in learning the course content during class time 29. My interactions with the instructor encouraged me to learn.
10-‐15%
Encouragement and openness
30. I think the instructor was approachable. 31. The class atmosphere supported my learning. 32. I was treated with respect in this class. 33. I felt encouraged to ask questions in class. 34. I think that the instructor was receptive to suggestions from students.
<10%
Availability and helpfulness
35. I was satisfied with the time it took for the instructor to return graded material. 36. The instructor provided me with all the information I needed to seek help. 37. I felt welcome to seek help from the instructor. 38. I think the instructor made a genuine effort to be available outside of class. 39. I think the instructor cared about my learning. 40. The feedback I received on work that I completed was helpful to my learning.
<10%
*Variance explained in student achievement: Source: Feldman (1989, 2007), work substantiated by (Abrami et al. 2007a, Abrami et al. 2007b).
Student Experience and Ratings of Teaching Committee Final Report 5
Literature Review A. Effectiveness of student evaluations
It is now well established that there is a general positive correlation between student ratings and student achievements as measured by test scores (Cohen 1981, Kulik 2001). This means that for teachers who had been rated highly by their students, their students tended to perform better in turn. This trend had been confirmed by over 40 surveys conducted in the last 20-30 years. On the whole, this indicates that student ratings do provide relatively reliable information on teaching effectiveness.
Much of current research establishes that teaching is a highly complex and multifaceted activity. Among the very many things that instructors do, it is not possible to select just one and use it as a measure for effective teaching. Cohen (1981), Feldman (1989), Marsh (2007) and others have identified certain “instructional dimensions” (e.g., traits and practices of the instructor) that correlate best with student achievement and learning (e.g. organization, clarity, and stimulation). So, for student evaluation of teaching (SET) to be useful, it must reflect this inherent multidimensionality of teaching.
Another important point that the research literature (Murray 2005, Adams et al. 2008) makes is that the best SET instruments are those that reflect the learners’ class experiences or perspectives, and not the instructor’s. Students can only comment on factors that are observable in class. Therefore, questions concerning non-classroom factors, such as course design and instructor knowledge, should be left out of the ratings forms.
Given the complexity of teaching, it is vital that any student feedback be complemented by evaluations from peer and expert observers, as well as self-evaluations (Murray 2005, Adams et al. 2008). This is necessary to ensure that the whole picture of an instructor’s teaching is evaluated. However, one must be careful about any “overall” or “global” statements such as, “Overall, I would rate this instructor’s teaching performance as …” These are quite common items in student questionnaires, but since they do not reflect the multidimensionality of teaching, the information they provide may not be very meaningful at best, and can be misleading at worst (Murray 2005). Global items are recommended by some experts (Abrami 2001, Arreola 2007) because they are correlated moderately with student learning and they provide a single-value summary of teaching (Berk 2006). Because global items provide no value for formative feedback and are less reliable than subscale and total scale scores, we chose not to include them in this survey.
Recent research shows a well designed SET tool is possible and it can provide valid and reliable information on teaching; but its impact on instructional improvement is limited if it is not accompanied by the necessary professional development activities (Cohen 1981, Feldman 1989, 2007, Wachtel 1998, Kulik 2001, Murray 2005, Marsh 2007). When we were thinking about the design of our new ratings form, it is precisely this formative side of the form that we wanted to emphasize. In other words, we would like the SET instrument to be used as a tool to help instructors improve their teaching skills, in addition to its current use in summative or personnel decision processes. Furthermore, we needed to ensure the teaching practices addressed in the form align with the educational goals and objectives of TRU Science (e.g., learner-centredness and student
Student Experience and Ratings of Teaching Committee Final Report 6
learning). Our decision to make the new ratings form based primarily on learners’ experiences addresses this.
B. Effectiveness of online student evaluations
A review of the literature summarizing advantages and disadvantages of administering surveys online can be found in Gravestock and Greenleaf (2008). Advantages of the online format include:
• Provision of security through unique login codes for each student.
• Reducing cost compared to paper, but there is a significant cost to manage and distribute the data (Donmeyer et al. 2004).
• Not requiring use of class time (but see below for response rate comments).
• Rapid processing of results and no manual typing of comments.
• Generating customized reports, including graphical representation of changes over years for each item (Llewellyn 2003).
• Allowing more extensive and thoughtful comments on open-ended, online questions when students are not restricted by time (Sorenson and Reiner 2003, Donmeyer et al. 2004).
• Facilitating the addition of items specific to programs, courses, and individuals (Sorenson and Reiner 2003, Donmeyer et al. 2004).
• Standardizing the introduction and instructions for taking the survey, which makes them less susceptible to faculty influence (Donmeyer et al. 2004).
The experience at other institutions shows that the response rate for online surveys decreases dramatically compared to surveys completed during class time (see Avery et al. 2006 for a review of related research). Decreases in response rate have been attributed to concern for anonymity (Avery et al. 2006), students having to use their own time (Sorenson and Reiner, 2003), and technical problems (Sorenson and Reiner 2003). Online surveys can be completed during class time if classes complete them as a group in a computer lab. Large classes would need to be divided into separate groups. When students are asked to take the survey outside of class, positive incentives and reminders can be used to encourage participation and these can increase response rates (Donmeyer et al. 2004). Studies have examined the validity and reliability of online evaluation systems compared to paper-based surveys. Although the research is limited, results suggest that ratings are generally consistent and that variations are statistically insignificant (Donmeyer et al. 2004, Avery et al. 2006).
Student Experience and Ratings of Teaching Committee Final Report 7
It is important that the software for online surveys allows for secure data storage and controlled distribution of data to specific individuals. It must be able to generate useful and complete summary reports of the results. It should have the flexibility to add items specific to programs, courses, and individuals according to the desires of faculty.
II. Methods
Based on the methods clearly outlined in (Berk 2006) and (Gravestock and Gregor-Greenleaf 2008), the committee adopted the following steps to develop a new student evaluation form
1. Review TRU mission statement in light of literature concerning student evaluations, Summer 2008.
2. Identify teaching dimensions to be included in student evaluation, Summer 2008
Based on our survey of the literature, we chose the dimensions that showed the highest correlation with student learning in multi-section classes. While the committee recognizes that “learning” is extraordinarily difficult to quantify, we felt that these studies provided the best estimate of the teaching dimensions that fit with the overall purpose of our new student evaluation form.
3. Prepare statements, Fall 2008
To prepare statements, we compiled a list of statements that had been used in student evaluations at other universities—particularly those universities such as the University of Victoria and the California State University Channel Islands (Adams et al. 2008) that had recently evaluated and reconfigured their student evaluation forms. Once we had a master list of potential statements, we classified them by dimension. Furthermore, we also rewrote each question to be student-centred. Because statements can suffer from a multitude of problems that limit their effectiveness, we used the list of rules that Berk (2006) compiled from numerous sources to ensure that our draft statements were as problem-free as possible. These rules for writing statements range from grammatical guidelines to rules regarding the relevance or applicability of each statement to potential student respondents.
4. Hold focus groups with faculty and students, Fall 2009
In Sept/Oct 2009, the committee organized focus groups with both Science students and Science faculty. In order to encourage participation, we posted signs advertising the focus groups within the Science Building and asked faculty to announce it to their students. Faculty were invited to participate via email solicitations. In total, 17 faculty and 26 students participated in the focus groups. Both students and faculty in each focus group were asked to complete three separate tasks:
1. Rank the importance of all statements in each dimension 2. Respond to a series of questions regarding the applicability and neutrality of all statements.
Student Experience and Ratings of Teaching Committee Final Report 8
3. In groups, compile a list of behaviors that would comprise “high-ranking” and “low-ranking” behaviors for each statement in each dimension.
5. Modify statements based on focus groups, if necessary.
6. Run field test with approx. 300 students, Winter 2009.
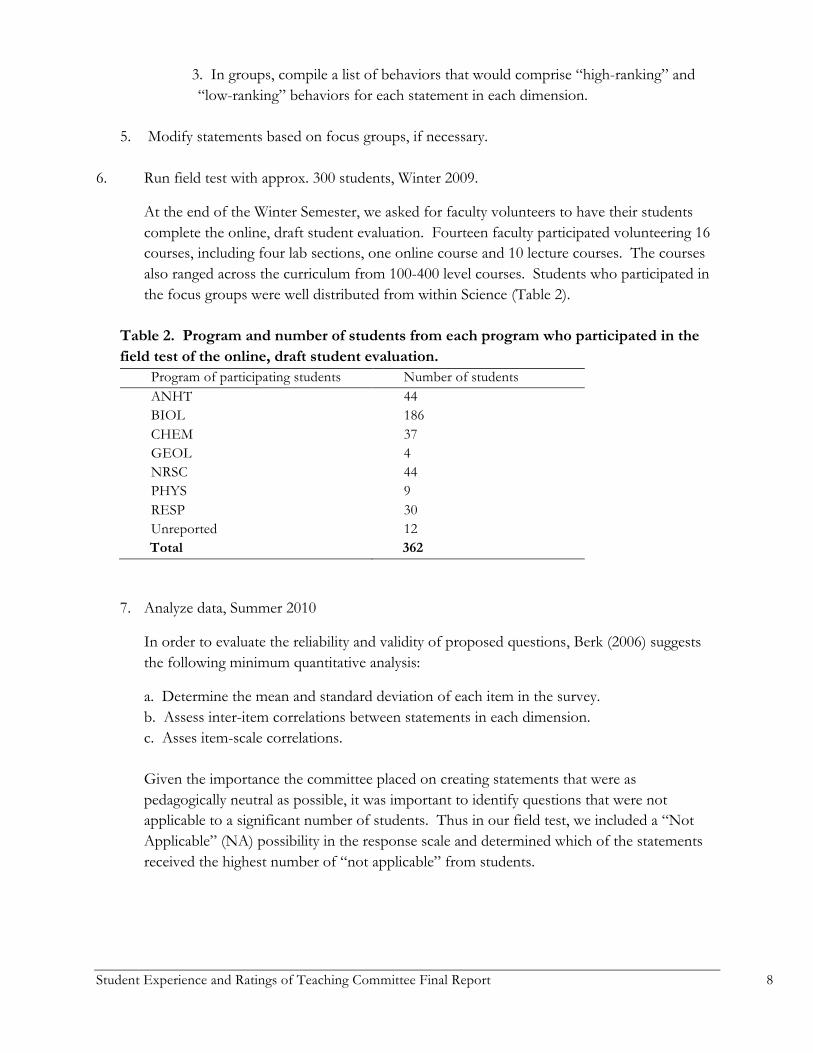
At the end of the Winter Semester, we asked for faculty volunteers to have their students complete the online, draft student evaluation. Fourteen faculty participated volunteering 16 courses, including four lab sections, one online course and 10 lecture courses. The courses also ranged across the curriculum from 100-400 level courses. Students who participated in the focus groups were well distributed from within Science (Table 2).
Table 2. Program and number of students from each program who participated in the field test of the online, draft student evaluation.
Program of participating students Number of students ANHT 44 BIOL 186 CHEM 37 GEOL 4 NRSC 44 PHYS 9 RESP 30 Unreported 12 Total 362
7. Analyze data, Summer 2010
In order to evaluate the reliability and validity of proposed questions, Berk (2006) suggests the following minimum quantitative analysis:
a. Determine the mean and standard deviation of each item in the survey. b. Assess inter-item correlations between statements in each dimension. c. Asses item-scale correlations.
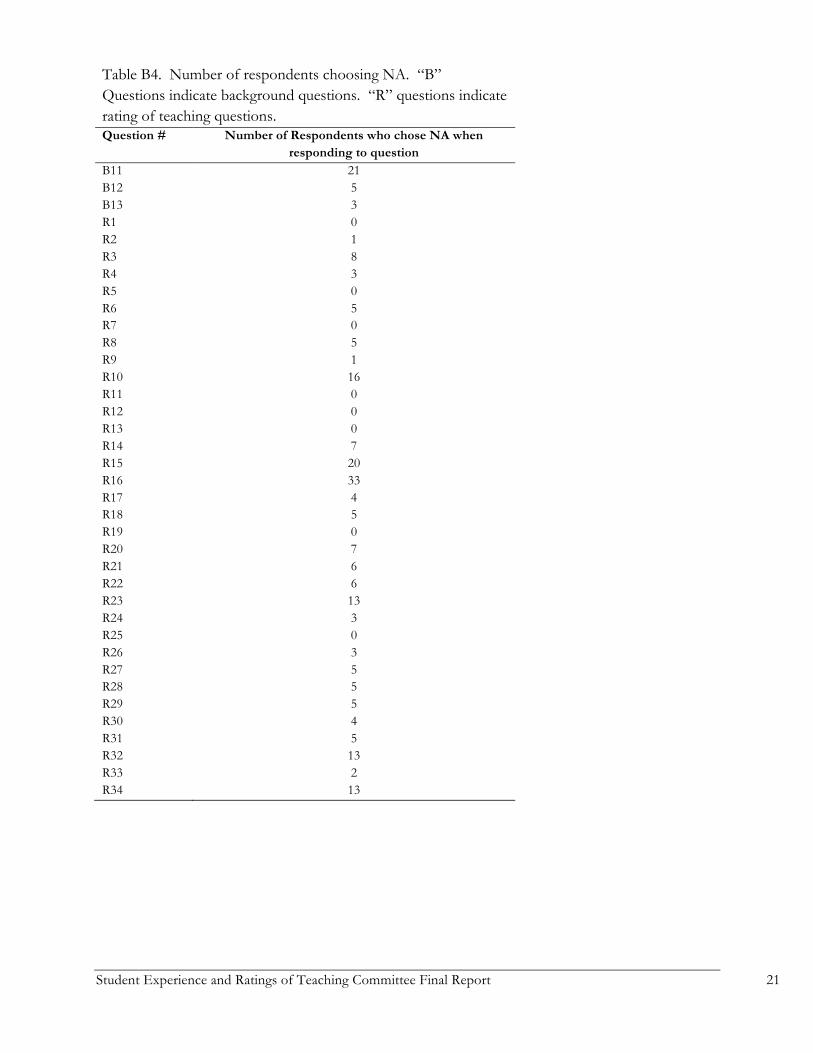
Given the importance the committee placed on creating statements that were as pedagogically neutral as possible, it was important to identify questions that were not applicable to a significant number of students. Thus in our field test, we included a “Not Applicable” (NA) possibility in the response scale and determined which of the statements received the highest number of “not applicable” from students.
Student Experience and Ratings of Teaching Committee Final Report 9
8. Review statements and finalize form, Fall 2010. Based on the results of the field test (see below), the committee selected several statements
to eliminate from the final proposed evaluation form based on their correlation (or lack of correlation) with other items on the scale.
9. Develop “report” for faculty/admin, Fall 2010/Winter 2011
III. Summary results of the field test
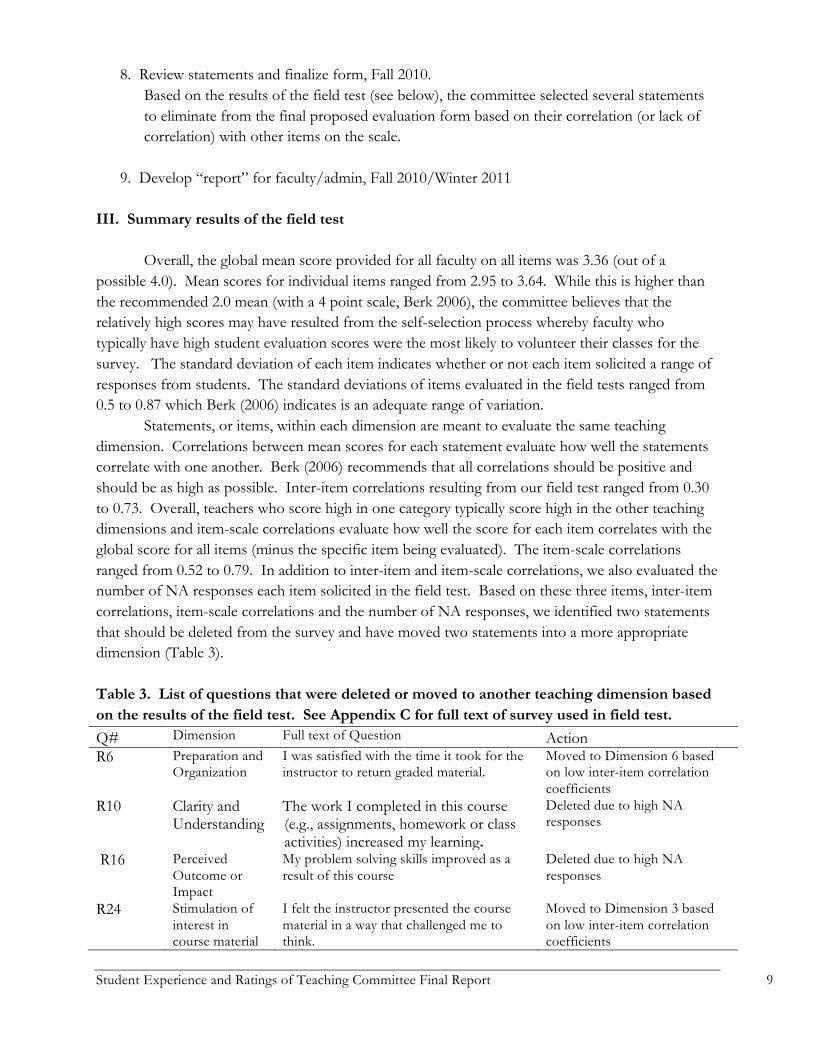
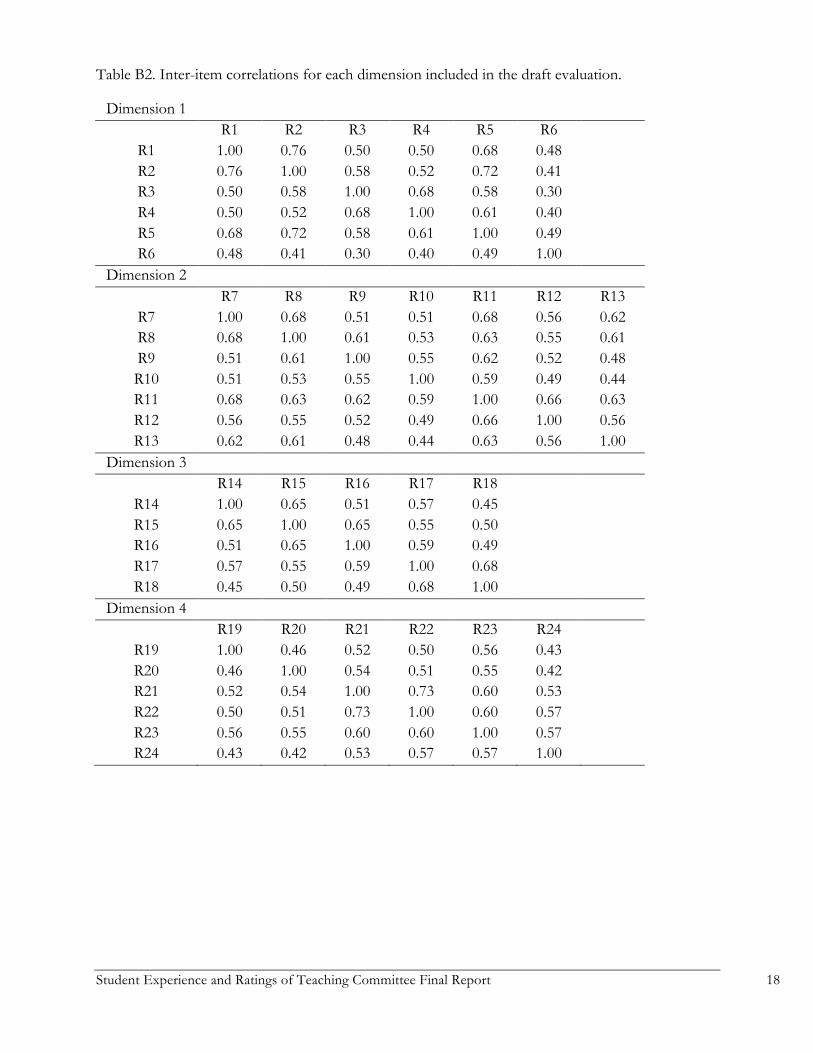
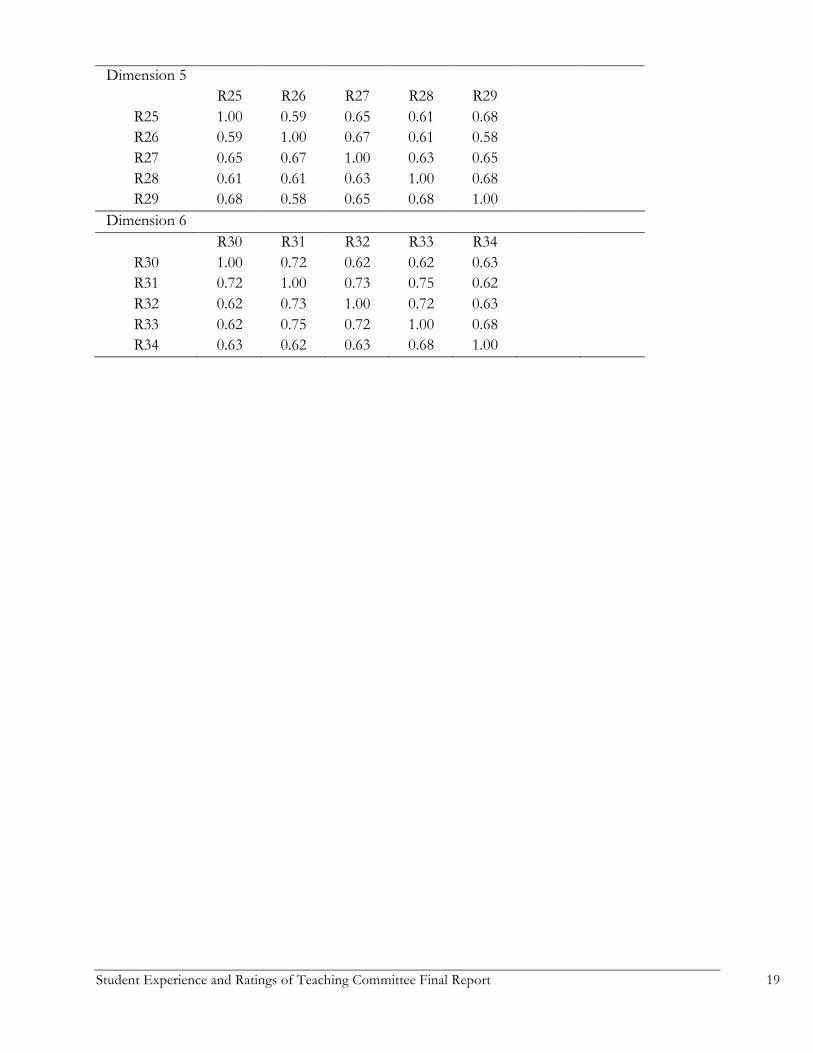
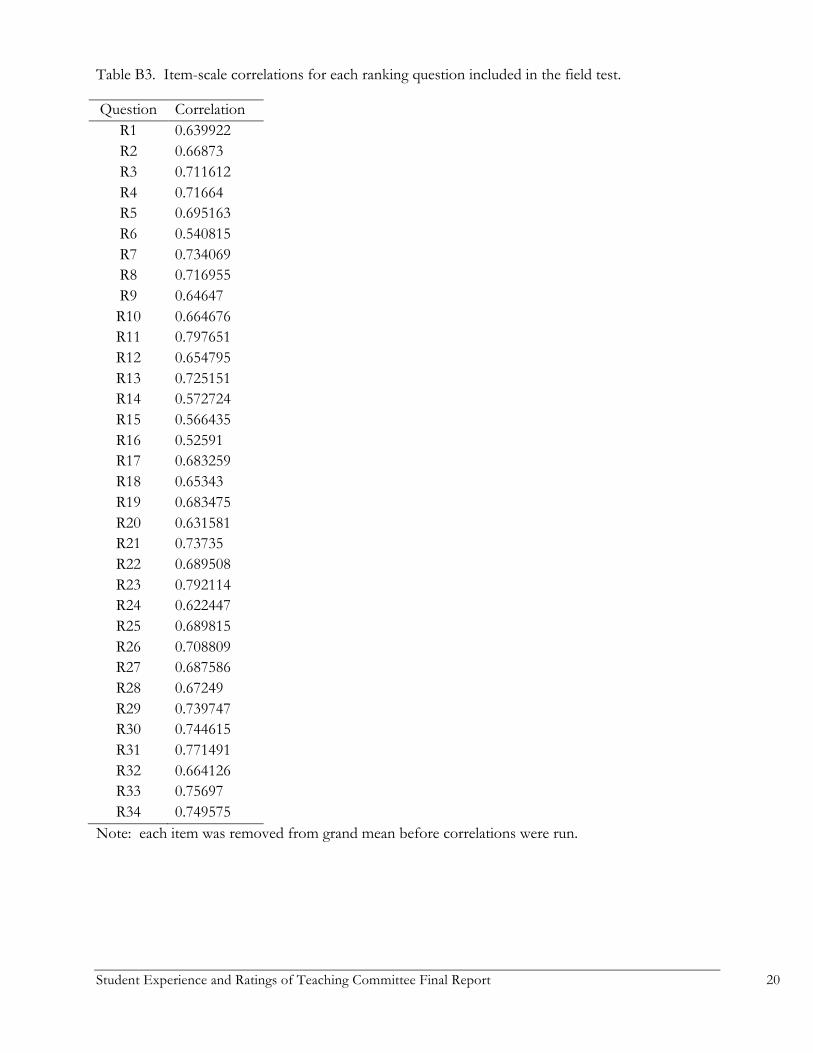
Overall, the global mean score provided for all faculty on all items was 3.36 (out of a possible 4.0). Mean scores for individual items ranged from 2.95 to 3.64. While this is higher than the recommended 2.0 mean (with a 4 point scale, Berk 2006), the committee believes that the relatively high scores may have resulted from the self-selection process whereby faculty who typically have high student evaluation scores were the most likely to volunteer their classes for the survey. The standard deviation of each item indicates whether or not each item solicited a range of responses from students. The standard deviations of items evaluated in the field tests ranged from 0.5 to 0.87 which Berk (2006) indicates is an adequate range of variation. Statements, or items, within each dimension are meant to evaluate the same teaching dimension. Correlations between mean scores for each statement evaluate how well the statements correlate with one another. Berk (2006) recommends that all correlations should be positive and should be as high as possible. Inter-item correlations resulting from our field test ranged from 0.30 to 0.73. Overall, teachers who score high in one category typically score high in the other teaching dimensions and item-scale correlations evaluate how well the score for each item correlates with the global score for all items (minus the specific item being evaluated). The item-scale correlations ranged from 0.52 to 0.79. In addition to inter-item and item-scale correlations, we also evaluated the number of NA responses each item solicited in the field test. Based on these three items, inter-item correlations, item-scale correlations and the number of NA responses, we identified two statements that should be deleted from the survey and have moved two statements into a more appropriate dimension (Table 3). Table 3. List of questions that were deleted or moved to another teaching dimension based on the results of the field test. See Appendix C for full text of survey used in field test.
Q# Dimension Full text of Question Action R6 Preparation and
Organization I was satisfied with the time it took for the instructor to return graded material.
Moved to Dimension 6 based on low inter-item correlation coefficients
R10 Clarity and Understanding
The work I completed in this course (e.g., assignments, homework or class activities) increased my learning.
Deleted due to high NA responses
R16 Perceived Outcome or Impact
My problem solving skills improved as a result of this course
Deleted due to high NA responses
R24 Stimulation of interest in course material
I felt the instructor presented the course material in a way that challenged me to think.
Moved to Dimension 3 based on low inter-item correlation coefficients
Student Experience and Ratings of Teaching Committee Final Report 10
IV. Recommendations 1. Adoption of new tool Based on the completed work, the committee recommends that the Faculty of Science adopt the proposed student evaluation (Appendix A) as their new tool to evaluate faculty teaching. We recommend that summary statistics (item and global means) be monitored for several years on a faculty-wide level so that baseline data can be collected to establish faculty wide means. This information will provide critical benchmarks to both external and internal reviewers of our faculty teaching. 2. Global vs. sub-scale means As indicated above, the committee intentionally avoided the use of global statements to evaluate student experience within classrooms. Sub-scale means are often averaged across student evaluation tools to provide a global mean for individual faculty. However, global means estimated across all statements obscure the relative importance of each dimension (i.e., Preparation and Organization explains 30-35% of student achievement, while Availability and Helpfulness explains <10% of student achievement). While global means may be weighted by the amount each dimension explains of overall student achievement (Table 1), any single value produced by a student evaluation masks the details of variation among the dimensions. The committee is concerned that reviews of faculty member’s teaching (especially summative reviews such as those involved in promotion and tenure), would rely too heavily upon a global mean, if produced. Overall, the committee strongly recommends that the Faculty of Science not include global means in any report on a faculty member’s teaching. 3. Online versus paper implementation Based on our review of the literature, we believe there are distinct obstacles and advantages to using online surveys. Given the potential environmental advantage of a paper-less form, we decided to field test our survey using an online approach. During both the field test and focus groups, students responded very favorably to online surveys. However, as our understanding of the logistics of implementing online surveys has developed, we recognized that there is no current software on campus that will allow an online implementation. Based on this, the committee recommends that the Faculty of Science collectively decide how to proceed with implementation.
Acknowledgements
We gratefully acknowledge the contribution of the students and faculty who participated in either the focus groups or the field test. This work would not have been possible without their participation. We would also like to acknowledge the Dean of Science for providing financial support for hosting the focus groups. Finally, we thank the Faculty of Science for their patience during the three years of this project.
Student Experience and Ratings of Teaching Committee Final Report 11
V. References Abrami, P. 2001. Improving judgements about teaching effectiveness using rating forms. in M.
Theall, P. Abrami, and L. Mets, editors. The student ratings debate: are they valid? How can we best use them? Jossey-Bass, San Francisco, CA.
Abrami, P., S. d’Apollonia, and S. Rosenfield. 2007. The Dimensionality of Student Ratings of Instruction: What We Know and What We Do Not*. Pages 385–456 in R. Perry and J. Smart, editors. The Scholarship of Teaching and Learning in Higher Education: An Evidence-Based Perspective.
Abrami, P., S. Rosenfield, and H. Dedic. 2007. The dimensionality of student ratings and instruction: an update on what we know, do not know and what we need to do. in R. Perry and J. Smart, editors. The Scholarship of Teaching and Learning in Higher Education: An Evidence-Based Perspective. Springer.
Adams, V., R. Bleicher, M. Buchanan, E. Nuhfer, J. Elliot, M. Furmanski, C. Renny, P. Smith, and G. Wood. 2008. Final report of the Task Force to Create a New Student Ratings for California State University Channel Islands.
Arreola, R. 2007. Developing a comprehensive faculty evaluation system: a handbook for college faculty and administrators on designing and operating a comprehensive faculty evaluation system. Anker Publishing Co., Bolton, MA.
Avery, R., W. Bryan, A. Mathios, H. Kang, and D. Bell. 2006. Electronic course evaluation: does an online delivery system influence student evaluation? Journal of Economic Education 37:21-37.
Barr, R., and J. Tagg. 1995. From teaching to learning: a new paradigm for undergraduate education. Change Nov/Dec:13-25.
Berk, R. 2006. Thirteen strategies to measure college teaching. Stylus, Sterling, VA. Cohen, P. A. 1981. Student ratings of instruction and student achievement: a meta-analysis of
multisection validity studies. Review of Educational Research 51:281 -309. doi: 10.3102/00346543051003281.
Donmeyer, C., P. Baum, R. Hanna, and K. Chapman. 2004. Gathering faculty teaching evaluations by in-class and online surveys: their effects on response rates and evaluations. Assessment and Evaluation in Higher Education 29:611-623.
Feldman, K. 1989. The association between student ratings of specific instructional dimensions and student achievement: refining and extending the synthesis of data from multisection validity studies. Research in Higher Education 30:583-645.
Feldman, K. 2007. Identifying exemplary teachers and teaching: evidence from student ratings. Pages 93-143 in R. P. Perry and J. C. Smart, editors. The Scholarship of Teaching and Learning in Higher Education: An Evidence-Based Perspective. Springer Netherlands, Dordrecht.
Gravestock, P., and E. Gregor-Greenleaf. 2008. Student course evaluations: research, models and trends. Higher Education Quality Council of Ontario.
Kulik, J. A. 2001. Student ratings: validity, utility, and controversy. New Directions for Institutional Research 2001:9–25.
Llewellyn, D. C. 2003. Online reporting of results for online student ratings. New Directions for
Student Experience and Ratings of Teaching Committee Final Report 12
Teaching and Learning 2003:61–68. Marsh, H. 2007. Students' evaluation of university teaching,: dimensionality, reliability, validity,
potential biases and usefulness. Pages 319-383 in R. P. Perry and J. C. Smart, editors. The scholarship of teaching and learning in higher education: An evidence-based perspective. Springer Verlag, Dordrecht.
Murray, H. 2005. Student evaluation of teaching: has it made a difference? Paper presented at the Annual Meeting of the Society for Teaching and Learning, Charlottetown, PEI.
Sorenson, D. L., and C. Reiner. 2003. Charting the uncharted seas of online student ratings of instruction. New Directions for Teaching and Learning 2003:1–24.
Wachtel, H. K. 1998. Student evaluation of college teaching effectiveness: A brief review. Assessment & Evaluation in Higher Education 23:191–212.
Student Experience and Ratings of Teaching Committee Final Report 13
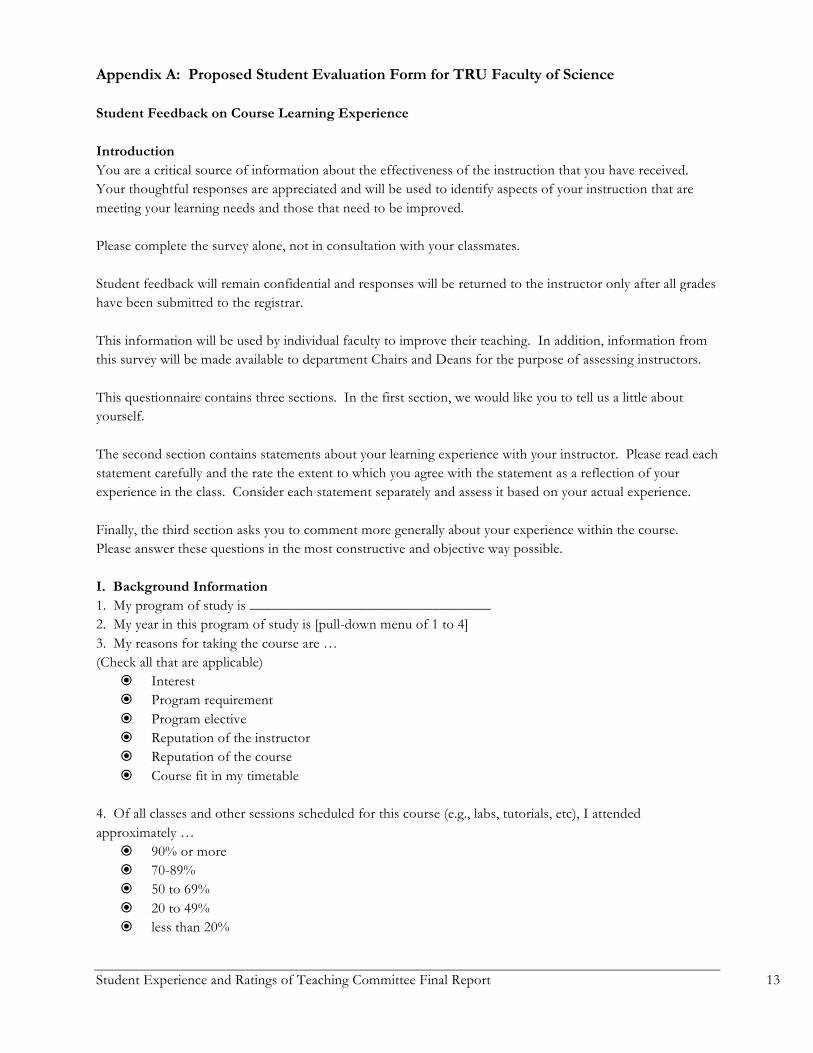
Appendix A: Proposed Student Evaluation Form for TRU Faculty of Science Student Feedback on Course Learning Experience Introduction You are a critical source of information about the effectiveness of the instruction that you have received. Your thoughtful responses are appreciated and will be used to identify aspects of your instruction that are meeting your learning needs and those that need to be improved. Please complete the survey alone, not in consultation with your classmates. Student feedback will remain confidential and responses will be returned to the instructor only after all grades have been submitted to the registrar. This information will be used by individual faculty to improve their teaching. In addition, information from this survey will be made available to department Chairs and Deans for the purpose of assessing instructors. This questionnaire contains three sections. In the first section, we would like you to tell us a little about yourself. The second section contains statements about your learning experience with your instructor. Please read each statement carefully and the rate the extent to which you agree with the statement as a reflection of your experience in the class. Consider each statement separately and assess it based on your actual experience. Finally, the third section asks you to comment more generally about your experience within the course. Please answer these questions in the most constructive and objective way possible. I. Background Information 1. My program of study is _________________________________ 2. My year in this program of study is [pull-down menu of 1 to 4] 3. My reasons for taking the course are … (Check all that are applicable)
� Interest � Program requirement � Program elective � Reputation of the instructor � Reputation of the course � Course fit in my timetable
4. Of all classes and other sessions scheduled for this course (e.g., labs, tutorials, etc), I attended approximately …
� 90% or more � 70-89% � 50 to 69% � 20 to 49% � less than 20%
Student Experience and Ratings of Teaching Committee Final Report 14
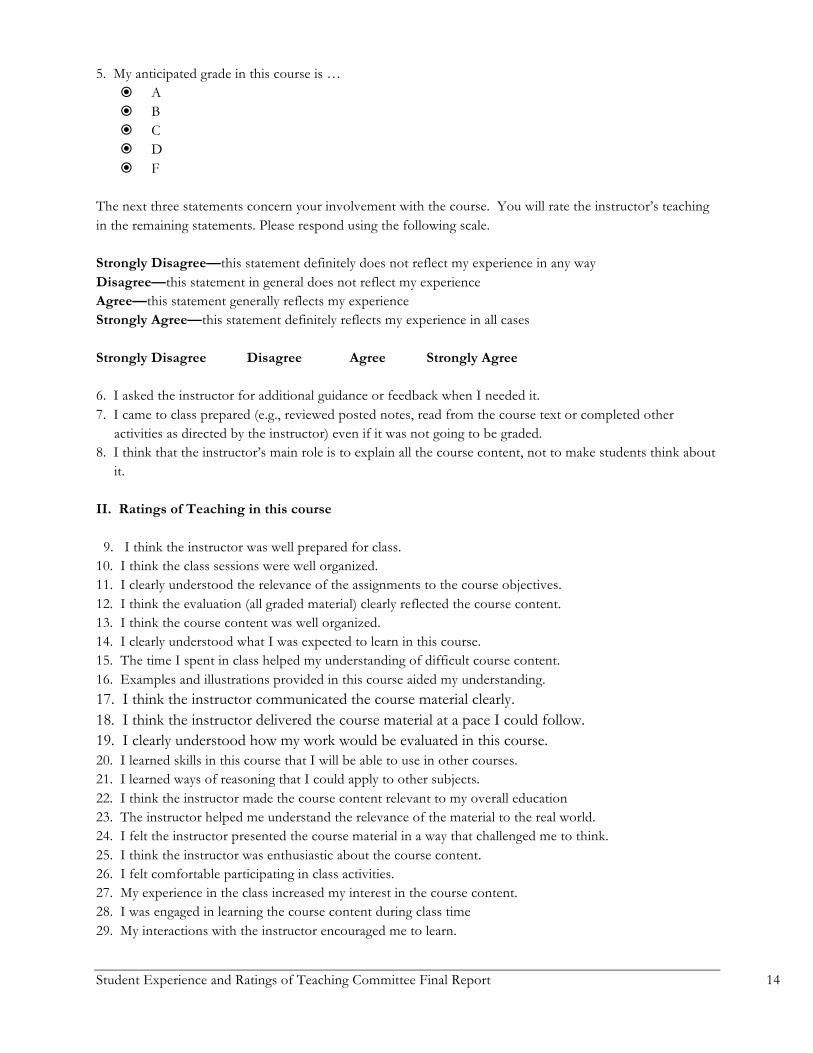
5. My anticipated grade in this course is … � A � B � C � D � F
The next three statements concern your involvement with the course. You will rate the instructor’s teaching in the remaining statements. Please respond using the following scale. Strongly Disagree—this statement definitely does not reflect my experience in any way Disagree—this statement in general does not reflect my experience Agree—this statement generally reflects my experience Strongly Agree—this statement definitely reflects my experience in all cases Strongly Disagree Disagree Agree Strongly Agree 6. I asked the instructor for additional guidance or feedback when I needed it. 7. I came to class prepared (e.g., reviewed posted notes, read from the course text or completed other
activities as directed by the instructor) even if it was not going to be graded. 8. I think that the instructor’s main role is to explain all the course content, not to make students think about
it. II. Ratings of Teaching in this course 9. I think the instructor was well prepared for class. 10. I think the class sessions were well organized. 11. I clearly understood the relevance of the assignments to the course objectives. 12. I think the evaluation (all graded material) clearly reflected the course content. 13. I think the course content was well organized. 14. I clearly understood what I was expected to learn in this course. 15. The time I spent in class helped my understanding of difficult course content. 16. Examples and illustrations provided in this course aided my understanding. 17. I think the instructor communicated the course material clearly. 18. I think the instructor delivered the course material at a pace I could follow. 19. I clearly understood how my work would be evaluated in this course. 20. I learned skills in this course that I will be able to use in other courses. 21. I learned ways of reasoning that I could apply to other subjects. 22. I think the instructor made the course content relevant to my overall education 23. The instructor helped me understand the relevance of the material to the real world. 24. I felt the instructor presented the course material in a way that challenged me to think. 25. I think the instructor was enthusiastic about the course content. 26. I felt comfortable participating in class activities. 27. My experience in the class increased my interest in the course content. 28. I was engaged in learning the course content during class time 29. My interactions with the instructor encouraged me to learn.
Student Experience and Ratings of Teaching Committee Final Report 15
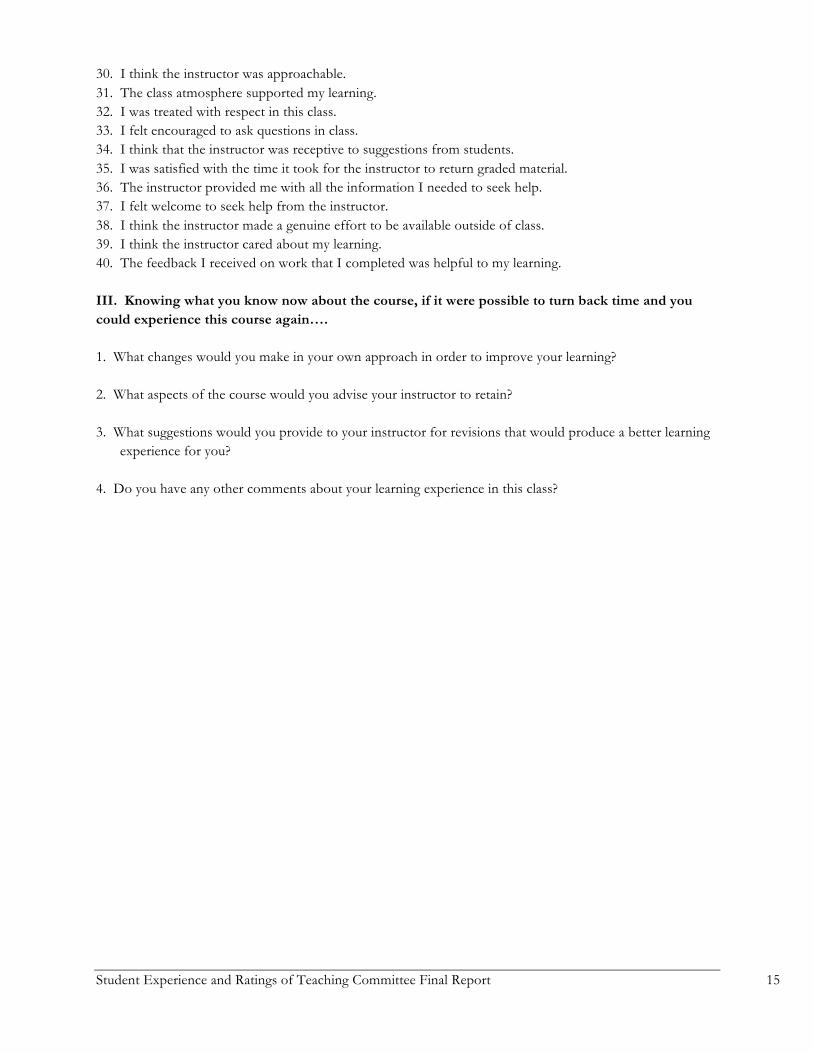
30. I think the instructor was approachable. 31. The class atmosphere supported my learning. 32. I was treated with respect in this class. 33. I felt encouraged to ask questions in class. 34. I think that the instructor was receptive to suggestions from students. 35. I was satisfied with the time it took for the instructor to return graded material. 36. The instructor provided me with all the information I needed to seek help. 37. I felt welcome to seek help from the instructor. 38. I think the instructor made a genuine effort to be available outside of class. 39. I think the instructor cared about my learning. 40. The feedback I received on work that I completed was helpful to my learning.
III. Knowing what you know now about the course, if it were possible to turn back time and you could experience this course again….
1. What changes would you make in your own approach in order to improve your learning?
2. What aspects of the course would you advise your instructor to retain?
3. What suggestions would you provide to your instructor for revisions that would produce a better learning experience for you?
4. Do you have any other comments about your learning experience in this class?
Student Experience and Ratings of Teaching Committee Final Report 16
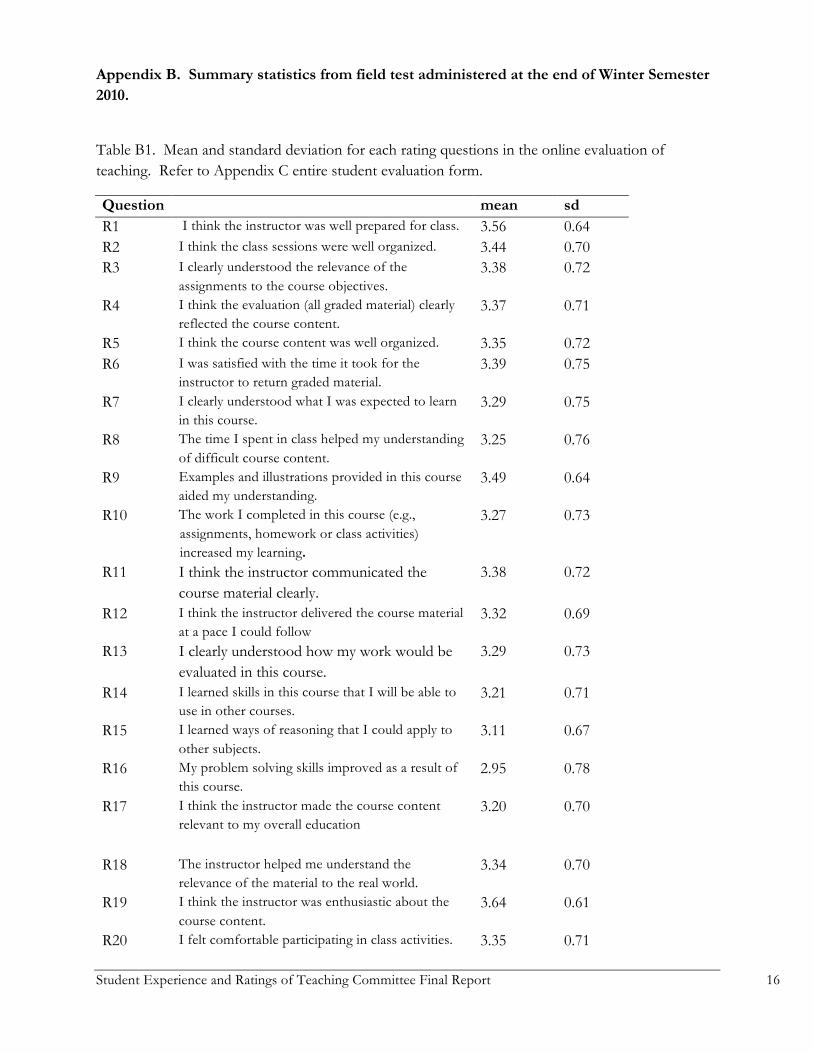
Appendix B. Summary statistics from field test administered at the end of Winter Semester 2010.
Table B1. Mean and standard deviation for each rating questions in the online evaluation of teaching. Refer to Appendix C entire student evaluation form.
Question mean sd R1 I think the instructor was well prepared for class. 3.56 0.64 R2 I think the class sessions were well organized. 3.44 0.70 R3 I clearly understood the relevance of the
assignments to the course objectives. 3.38 0.72
R4 I think the evaluation (all graded material) clearly reflected the course content.
3.37 0.71
R5 I think the course content was well organized. 3.35 0.72 R6 I was satisfied with the time it took for the
instructor to return graded material. 3.39 0.75
R7 I clearly understood what I was expected to learn in this course.
3.29 0.75
R8 The time I spent in class helped my understanding of difficult course content.
3.25 0.76
R9 Examples and illustrations provided in this course aided my understanding.
3.49 0.64
R10 The work I completed in this course (e.g., assignments, homework or class activities) increased my learning.
3.27 0.73
R11 I think the instructor communicated the course material clearly.
3.38 0.72
R12 I think the instructor delivered the course material at a pace I could follow
3.32 0.69
R13 I clearly understood how my work would be evaluated in this course.
3.29 0.73
R14 I learned skills in this course that I will be able to use in other courses.
3.21 0.71
R15 I learned ways of reasoning that I could apply to other subjects.
3.11 0.67
R16 My problem solving skills improved as a result of this course.
2.95 0.78
R17 I think the instructor made the course content relevant to my overall education
3.20 0.70
R18 The instructor helped me understand the relevance of the material to the real world.
3.34 0.70
R19 I think the instructor was enthusiastic about the course content.
3.64 0.61
R20 I felt comfortable participating in class activities. 3.35 0.71
Student Experience and Ratings of Teaching Committee Final Report 17
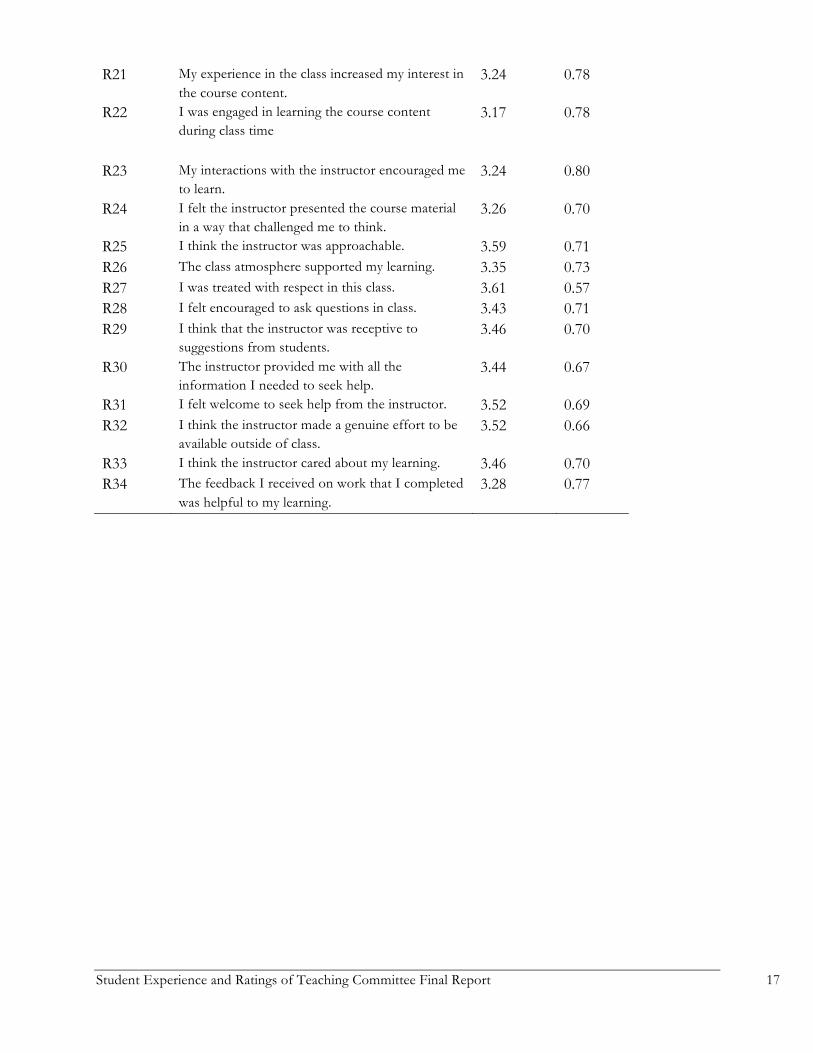
R21 My experience in the class increased my interest in the course content.
3.24 0.78
R22 I was engaged in learning the course content during class time
3.17 0.78
R23 My interactions with the instructor encouraged me to learn.
3.24 0.80
R24 I felt the instructor presented the course material in a way that challenged me to think.
3.26 0.70
R25 I think the instructor was approachable. 3.59 0.71 R26 The class atmosphere supported my learning. 3.35 0.73 R27 I was treated with respect in this class. 3.61 0.57 R28 I felt encouraged to ask questions in class. 3.43 0.71 R29 I think that the instructor was receptive to
suggestions from students. 3.46 0.70
R30 The instructor provided me with all the information I needed to seek help.
3.44 0.67
R31 I felt welcome to seek help from the instructor. 3.52 0.69 R32 I think the instructor made a genuine effort to be
available outside of class. 3.52 0.66
R33 I think the instructor cared about my learning. 3.46 0.70 R34 The feedback I received on work that I completed
was helpful to my learning. 3.28 0.77
Student Experience and Ratings of Teaching Committee Final Report 18
Table B2. Inter-item correlations for each dimension included in the draft evaluation.
Dimension 1
R1 R2 R3 R4 R5 R6
R1 1.00 0.76 0.50 0.50 0.68 0.48 R2 0.76 1.00 0.58 0.52 0.72 0.41 R3 0.50 0.58 1.00 0.68 0.58 0.30 R4 0.50 0.52 0.68 1.00 0.61 0.40 R5 0.68 0.72 0.58 0.61 1.00 0.49 R6 0.48 0.41 0.30 0.40 0.49 1.00 Dimension 2
R7 R8 R9 R10 R11 R12 R13 R7 1.00 0.68 0.51 0.51 0.68 0.56 0.62 R8 0.68 1.00 0.61 0.53 0.63 0.55 0.61 R9 0.51 0.61 1.00 0.55 0.62 0.52 0.48 R10 0.51 0.53 0.55 1.00 0.59 0.49 0.44 R11 0.68 0.63 0.62 0.59 1.00 0.66 0.63 R12 0.56 0.55 0.52 0.49 0.66 1.00 0.56 R13 0.62 0.61 0.48 0.44 0.63 0.56 1.00
Dimension 3
R14 R15 R16 R17 R18
R14 1.00 0.65 0.51 0.57 0.45 R15 0.65 1.00 0.65 0.55 0.50 R16 0.51 0.65 1.00 0.59 0.49 R17 0.57 0.55 0.59 1.00 0.68 R18 0.45 0.50 0.49 0.68 1.00 Dimension 4
R19 R20 R21 R22 R23 R24 R19 1.00 0.46 0.52 0.50 0.56 0.43 R20 0.46 1.00 0.54 0.51 0.55 0.42 R21 0.52 0.54 1.00 0.73 0.60 0.53 R22 0.50 0.51 0.73 1.00 0.60 0.57 R23 0.56 0.55 0.60 0.60 1.00 0.57 R24 0.43 0.42 0.53 0.57 0.57 1.00
Student Experience and Ratings of Teaching Committee Final Report 19
Dimension 5
R25 R26 R27 R28 R29
R25 1.00 0.59 0.65 0.61 0.68 R26 0.59 1.00 0.67 0.61 0.58 R27 0.65 0.67 1.00 0.63 0.65 R28 0.61 0.61 0.63 1.00 0.68 R29 0.68 0.58 0.65 0.68 1.00 Dimension 6
R30 R31 R32 R33 R34 R30 1.00 0.72 0.62 0.62 0.63 R31 0.72 1.00 0.73 0.75 0.62 R32 0.62 0.73 1.00 0.72 0.63 R33 0.62 0.75 0.72 1.00 0.68 R34 0.63 0.62 0.63 0.68 1.00
Student Experience and Ratings of Teaching Committee Final Report 20
Table B3. Item-scale correlations for each ranking question included in the field test.
Question Correlation R1 0.639922 R2 0.66873 R3 0.711612 R4 0.71664 R5 0.695163 R6 0.540815 R7 0.734069 R8 0.716955 R9 0.64647 R10 0.664676 R11 0.797651 R12 0.654795 R13 0.725151 R14 0.572724 R15 0.566435 R16 0.52591 R17 0.683259 R18 0.65343 R19 0.683475 R20 0.631581 R21 0.73735 R22 0.689508 R23 0.792114 R24 0.622447 R25 0.689815 R26 0.708809 R27 0.687586 R28 0.67249 R29 0.739747 R30 0.744615 R31 0.771491 R32 0.664126 R33 0.75697 R34 0.749575
Note: each item was removed from grand mean before correlations were run.
Student Experience and Ratings of Teaching Committee Final Report 21
Table B4. Number of respondents choosing NA. “B” Questions indicate background questions. “R” questions indicate rating of teaching questions. Question # Number of Respondents who chose NA when
responding to question B11 21 B12 5 B13 3 R1 0 R2 1 R3 8 R4 3 R5 0 R6 5 R7 0 R8 5 R9 1 R10 16 R11 0 R12 0 R13 0 R14 7 R15 20 R16 33 R17 4 R18 5 R19 0 R20 7 R21 6 R22 6 R23 13 R24 3 R25 0 R26 3 R27 5 R28 5 R29 5 R30 4 R31 5 R32 13 R33 2 R34 13
Student Experience and Ratings of Teaching Committee Final Report 22
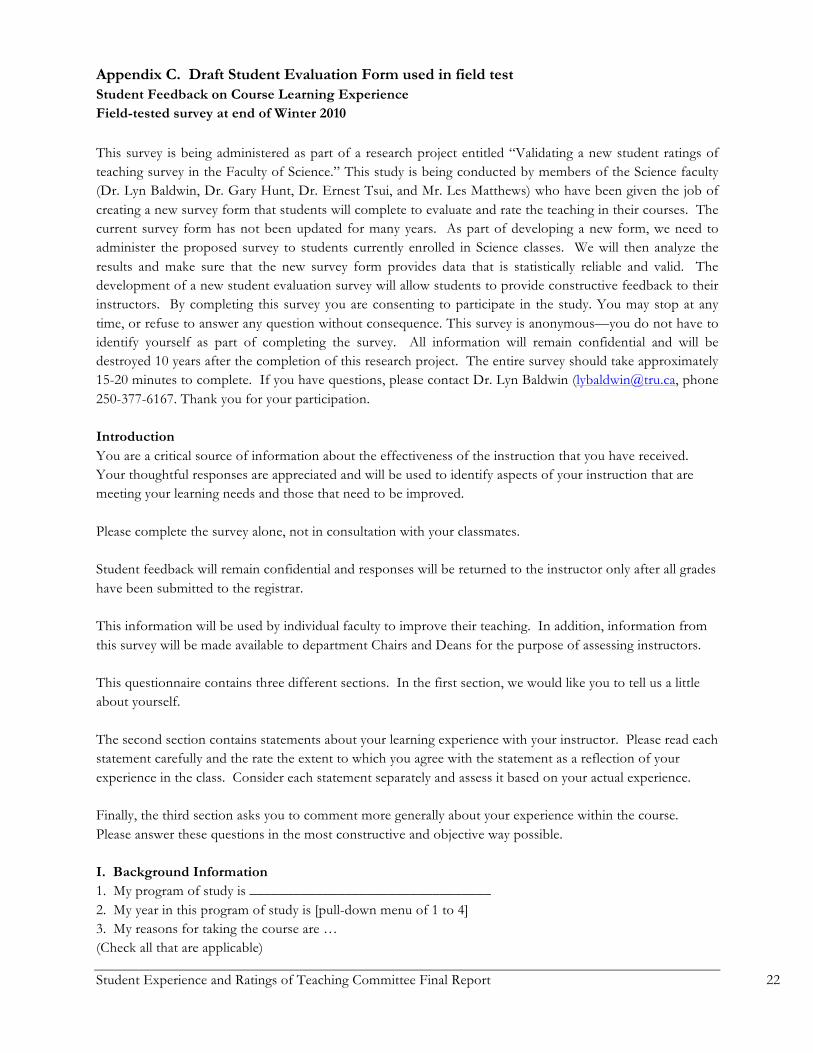
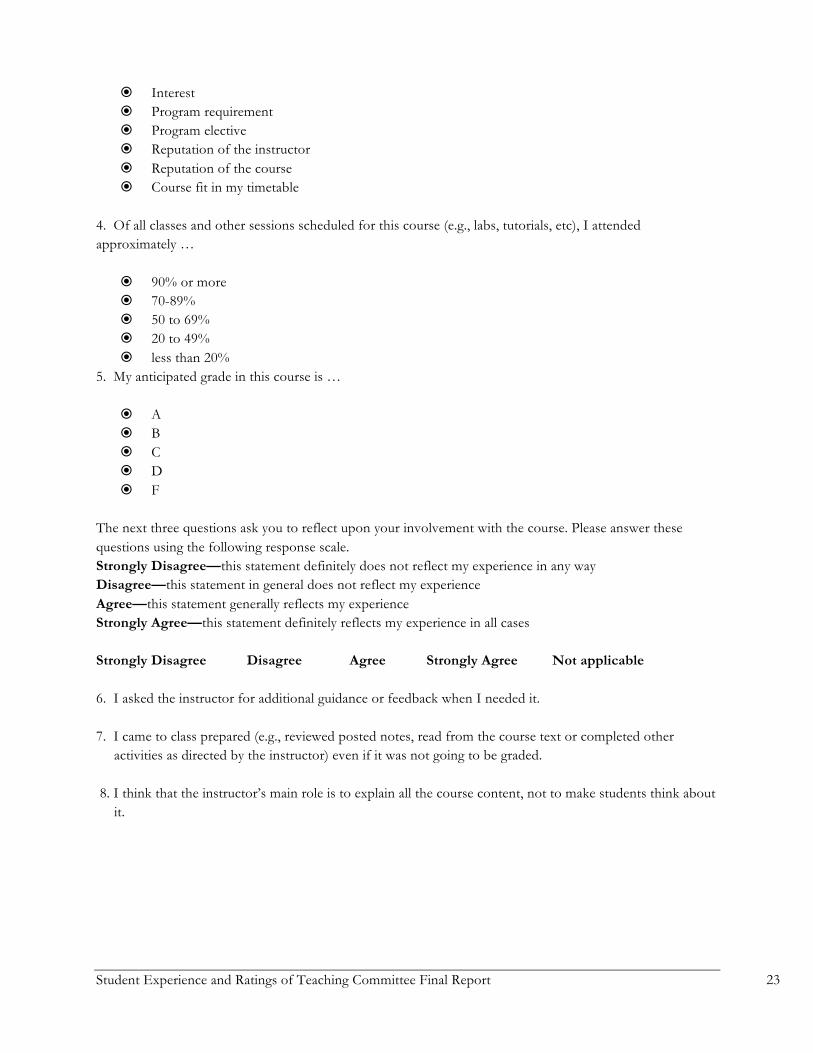
Appendix C. Draft Student Evaluation Form used in field test Student Feedback on Course Learning Experience Field-tested survey at end of Winter 2010 This survey is being administered as part of a research project entitled “Validating a new student ratings of teaching survey in the Faculty of Science.” This study is being conducted by members of the Science faculty (Dr. Lyn Baldwin, Dr. Gary Hunt, Dr. Ernest Tsui, and Mr. Les Matthews) who have been given the job of creating a new survey form that students will complete to evaluate and rate the teaching in their courses. The current survey form has not been updated for many years. As part of developing a new form, we need to administer the proposed survey to students currently enrolled in Science classes. We will then analyze the results and make sure that the new survey form provides data that is statistically reliable and valid. The development of a new student evaluation survey will allow students to provide constructive feedback to their instructors. By completing this survey you are consenting to participate in the study. You may stop at any time, or refuse to answer any question without consequence. This survey is anonymous—you do not have to identify yourself as part of completing the survey. All information will remain confidential and will be destroyed 10 years after the completion of this research project. The entire survey should take approximately 15-20 minutes to complete. If you have questions, please contact Dr. Lyn Baldwin ([email protected], phone 250-377-6167. Thank you for your participation. Introduction You are a critical source of information about the effectiveness of the instruction that you have received. Your thoughtful responses are appreciated and will be used to identify aspects of your instruction that are meeting your learning needs and those that need to be improved. Please complete the survey alone, not in consultation with your classmates. Student feedback will remain confidential and responses will be returned to the instructor only after all grades have been submitted to the registrar. This information will be used by individual faculty to improve their teaching. In addition, information from this survey will be made available to department Chairs and Deans for the purpose of assessing instructors. This questionnaire contains three different sections. In the first section, we would like you to tell us a little about yourself. The second section contains statements about your learning experience with your instructor. Please read each statement carefully and the rate the extent to which you agree with the statement as a reflection of your experience in the class. Consider each statement separately and assess it based on your actual experience. Finally, the third section asks you to comment more generally about your experience within the course. Please answer these questions in the most constructive and objective way possible. I. Background Information 1. My program of study is _________________________________ 2. My year in this program of study is [pull-down menu of 1 to 4] 3. My reasons for taking the course are … (Check all that are applicable)
Student Experience and Ratings of Teaching Committee Final Report 23
� Interest � Program requirement � Program elective � Reputation of the instructor � Reputation of the course � Course fit in my timetable
4. Of all classes and other sessions scheduled for this course (e.g., labs, tutorials, etc), I attended approximately …
� 90% or more � 70-89% � 50 to 69% � 20 to 49% � less than 20%
5. My anticipated grade in this course is …
� A � B � C � D � F
The next three questions ask you to reflect upon your involvement with the course. Please answer these questions using the following response scale. Strongly Disagree—this statement definitely does not reflect my experience in any way Disagree—this statement in general does not reflect my experience Agree—this statement generally reflects my experience Strongly Agree—this statement definitely reflects my experience in all cases Strongly Disagree Disagree Agree Strongly Agree Not applicable 6. I asked the instructor for additional guidance or feedback when I needed it. 7. I came to class prepared (e.g., reviewed posted notes, read from the course text or completed other
activities as directed by the instructor) even if it was not going to be graded. 8. I think that the instructor’s main role is to explain all the course content, not to make students think about
it.
Student Experience and Ratings of Teaching Committee Final Report 24
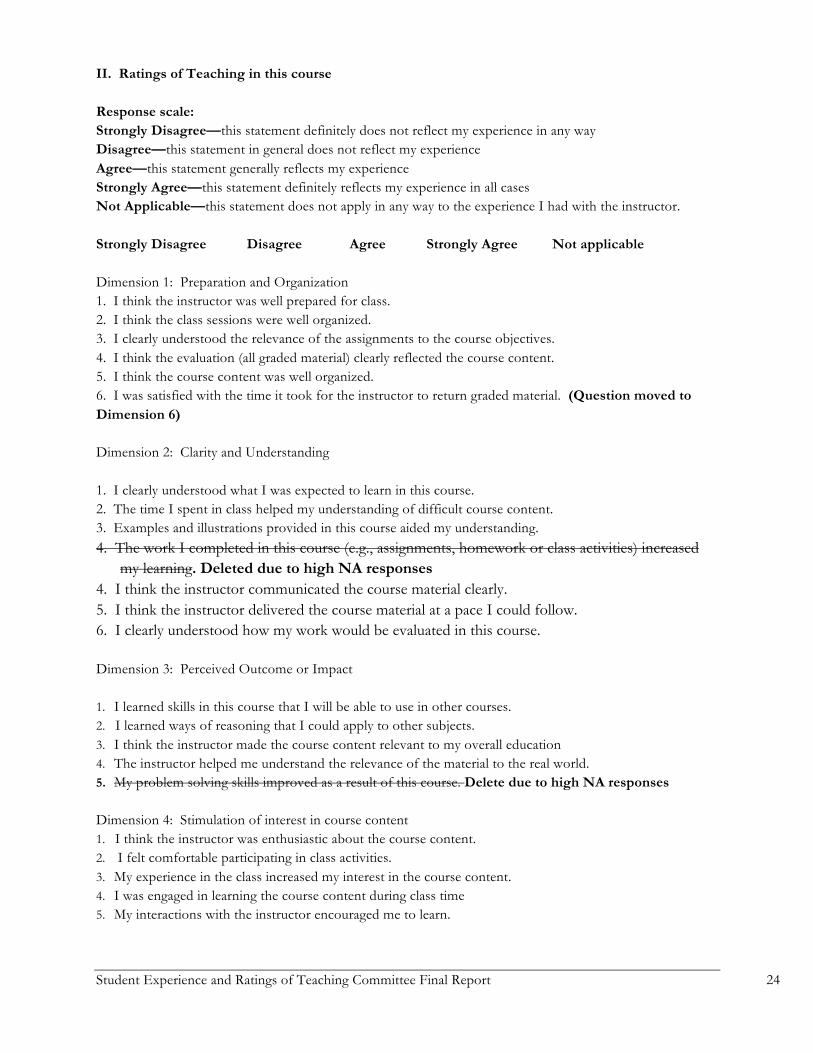
II. Ratings of Teaching in this course Response scale: Strongly Disagree—this statement definitely does not reflect my experience in any way Disagree—this statement in general does not reflect my experience Agree—this statement generally reflects my experience Strongly Agree—this statement definitely reflects my experience in all cases Not Applicable—this statement does not apply in any way to the experience I had with the instructor. Strongly Disagree Disagree Agree Strongly Agree Not applicable Dimension 1: Preparation and Organization 1. I think the instructor was well prepared for class. 2. I think the class sessions were well organized. 3. I clearly understood the relevance of the assignments to the course objectives. 4. I think the evaluation (all graded material) clearly reflected the course content. 5. I think the course content was well organized. 6. I was satisfied with the time it took for the instructor to return graded material. (Question moved to Dimension 6) Dimension 2: Clarity and Understanding 1. I clearly understood what I was expected to learn in this course. 2. The time I spent in class helped my understanding of difficult course content. 3. Examples and illustrations provided in this course aided my understanding. 4. The work I completed in this course (e.g., assignments, homework or class activities) increased
my learning. Deleted due to high NA responses 4. I think the instructor communicated the course material clearly. 5. I think the instructor delivered the course material at a pace I could follow. 6. I clearly understood how my work would be evaluated in this course. Dimension 3: Perceived Outcome or Impact
1. I learned skills in this course that I will be able to use in other courses. 2. I learned ways of reasoning that I could apply to other subjects. 3. I think the instructor made the course content relevant to my overall education 4. The instructor helped me understand the relevance of the material to the real world. 5. My problem solving skills improved as a result of this course. Delete due to high NA responses
Dimension 4: Stimulation of interest in course content 1. I think the instructor was enthusiastic about the course content. 2. I felt comfortable participating in class activities. 3. My experience in the class increased my interest in the course content. 4. I was engaged in learning the course content during class time 5. My interactions with the instructor encouraged me to learn.
Student Experience and Ratings of Teaching Committee Final Report 25
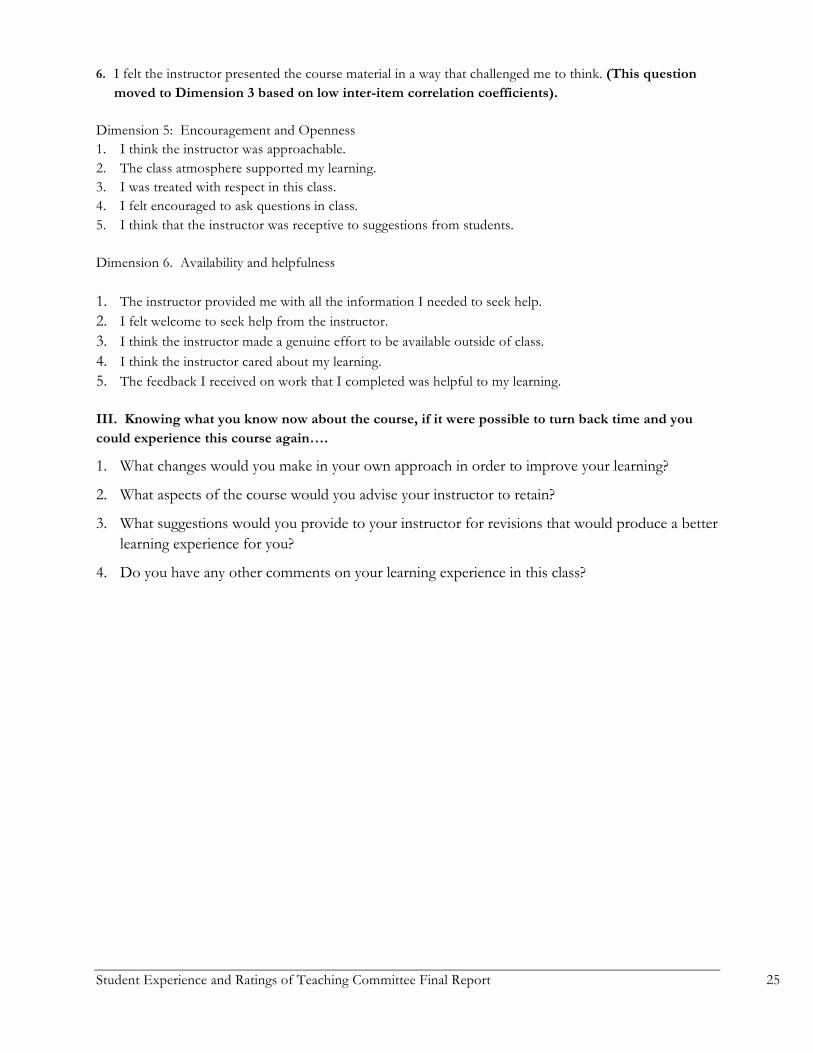
6. I felt the instructor presented the course material in a way that challenged me to think. (This question moved to Dimension 3 based on low inter-item correlation coefficients).
Dimension 5: Encouragement and Openness 1. I think the instructor was approachable. 2. The class atmosphere supported my learning. 3. I was treated with respect in this class. 4. I felt encouraged to ask questions in class. 5. I think that the instructor was receptive to suggestions from students. Dimension 6. Availability and helpfulness
1. The instructor provided me with all the information I needed to seek help. 2. I felt welcome to seek help from the instructor. 3. I think the instructor made a genuine effort to be available outside of class. 4. I think the instructor cared about my learning. 5. The feedback I received on work that I completed was helpful to my learning.
III. Knowing what you know now about the course, if it were possible to turn back time and you could experience this course again….
1. What changes would you make in your own approach in order to improve your learning?
2. What aspects of the course would you advise your instructor to retain?
3. What suggestions would you provide to your instructor for revisions that would produce a better learning experience for you?
4. Do you have any other comments on your learning experience in this class?