development and validation of gamma … · iii version abregee les modifications envisagées pour...
TRANSCRIPT

THÈSE NO 1854 (1998)
ÉCOLE POLYTECHNIQUE FÉDÉRALE DE LAUSANNE
PRÉSENTÉE AU DÉPARTEMENT DE PHYSIQUE
POUR L'OBTENTION DU GRADE DE DOCTEUR ÈS SCIENCES
PAR
Ingénieur physicien diplômé EPF
originaire de Rohrbach (BE)
acceptée sur proposition du jury:
Prof. R. Chawla, directeur de thèseDr R. Brogli, rapporteur
Dr M. Martini, rapporteurDr G. Rimpault, rapporteurProf. M.Q. Tran, rapporteur
Lausanne, EPFL1999
DEVELOPMENT AND VALIDATION OF GAMMA-HEATINGCALCULATIONAL METHODS FOR PLUTONIUM-BURNING
FAST REACTORS
Anton LÜTHI


i
ABSTRACT
The need for accurate calculational tools for the determination of gamma heating in fast
reactors has increased considerably in recent years following the planned modification of
certain existing fast breeders into plutonium-burning configurations. The latter are
characterized by a steel/sodium reflector (replacing the fertile blanket) and a large number of
core diluting sodium/steel sub-assemblies, i.e. regions in which gammas account for about 90
% of total heating. In the current doctoral research, a new calculational scheme for the accurate
determination of gamma heating in fast reactors has been implemented and its validation for
Pu-burning configurations accomplished through comparisons with integral measurements in
representative critical assemblies.
The particularity of the new calculational methodology is that gamma production
multiplicities for fission, capture and inelastic scattering are folded with the corresponding
effective (self-shielded) neutron cross-sections and then summed up to yield the total gamma
production matrices. This allows one to take advantage of the latest improvements in
computing effective cross-sections at the cell level, in particular the consideration of spatially
varying cross-sections in non-fuel regions such as reflectors. The new methodology requires
gamma production multiplicities separately for fission, capture and inelastic scattering, and
accordingly a special library containing these nuclear data was generated from the latest and
most appropriate data evaluations, mainly JEF2.2 and ENDF/B-VI. Furthermore, the delayed
emission through disintegration of fission and activation products was explicitly considered. In
the course of creating the gamma production library, a careful check could be made on the
quality of the basic data available. It was found that a major shortcoming in this context is the
large uncertainty (~ 8 %) on the gamma production in fission, since total gamma fission
emission values given by various authors differ significantly.
The validation of the currently developed calculational tool was accomplished through
comparisons with new gamma-heating measurements conducted in the framework of the
CIRANO experimental programme at the MASURCA facility, as well as with reevaluated
earlier measurements by Calamand et al. in the BALZAC1-DE1 configuration of the same
facility. The latter had a steel/sodium (diluent) zone at the center of the core region. In the
current CIRANO measurements, absolute gamma-heating rates were determined in PuO2/UO2
fueled cores surrounded by a steel/sodium reflector using TLD-700 thermoluminescent
dosimeters. Thereby, a considerable effort was undertaken to minimize systematic errors in the
measurements and to reduce the statistical uncertainty, in order to ensure a total experimental
error smaller than the target accuracy for the gamma-heating calculations. To achieve this goal,
a highly reproducible measuring procedure was established (statistical error < 2 %), individual
TLD calibration was carried out in a consistent way with respect to the reactor measurements

ii
and the various correction factors (determined using the latest calculational methods and data)
were investigated in detail. The correction most in doubt, viz. the cavity relation, was derived
by applying both Burlin cavity theory and MCNP coupled photon-electron calculations, with
TLD irradiations in various surroundings providing a check on the latter. The total
experimental error (1 σ) on the TLD measurements has been estimated to be less than 6 %.
The calculation/experiment (C/E) values determined from the analysis of the critical
experiments are 0.90 for the PuO2/UO2 core region, 0.84 for the steel/sodium reflector and
0.89 for the steel/sodium diluent zone. The most plausible causes for the observed differences
have been identified to be data related, viz. too low fission gamma energies and too low
capture cross-sections for the structural elements. Thereby, the data for Pu239 and Fe56 are the
most suspect, since the former nuclide is the dominant contributor to the gamma production in
the core while the latter is that for the reflector and diluent regions.
The transferability of the current validation findings to the SUPER-PHENIX power plant
(in its planned modified form as Pu-burner) and the 1500 MWe CAPRA 4/94 reference design
has been demonstrated by comparing the experimental configurations with the full-scale power
reactors in a quantitative manner with respect to gamma-heating characteristics. With the
transferability established, a set of correction factors (fpower=E/C) can be defined for application
to calculational results. This enables the prediction of gamma heating in the various regions of
the considered power reactors to within the current target accuracy of ~ 7.5 %.

iii
VERSION ABREGEE
Les modifications envisagées pour transformer certains surgénérateurs existants en
"brûleurs de plutonium" ont accru, dans les dernières années, le besoin de nouveaux outils de
calcul permettant de déterminer avec précision l'échauffement gamma dans les réacteurs
rapides. Les configurations "brûleurs de plutonium" sont caractérisées par un réflecteur en
acier/sodium (qui remplace la couverture fertile) et l'introduction d'un nombre considérable
d'assemblages diluant en sodium/acier dans le coeur. Dans ces régions, les gammas contribuent
environ à 90 % de l'échauffement total. Lors de cette thèse, un nouveau schéma de calcul pour
la détermination précise de l'échauffement gamma dans les réacteurs rapides a été développé et
validé pour des configurations "brûleurs de plutonium" par comparaison avec des mesures
intégrales dans des assemblages critiques représentatifs.
La particularité de la méthodologie de calcul présenté dans ce travail est que les
multiplicités de production gamma ("gamma production multiplcities") pour la fission, capture
et diffusion inélastique sont multipliées par les sections efficaces auto-protégées
correspondantes, puis additionnées afin d'obtenir les matrices de production gamma totales.
Ceci permet de tirer profit des dernières améliorations dans les calculs des sections efficaces
effectives, en particulier la considération de la variation spatiale des section efficaces dans des
régions comme le réflecteur. Dans le nouveau schéma, les multiplicités de production gamma
sont requises séparément pour la fission, la capture et la diffusion inélastique. Une
bibliothèque spéciale contenant ces données nucléaires a été générée à partir des évaluations
les plus récentes et appropriées, principalement JEF2.2. et ENDF/B-VI. La contribution
"retardée" due à la désintégration des produits de fission et d'activation a également été inclue.
Au cours de la génération de la bibliothèque, la qualité des données de base disponibles a pu
être testée. Le problème majeur décelé est l'incertitude importante (~ 8 %) sur la production
gamma par fission. En effet, les valeurs données par différents auteurs varient
significativement.
L'outil de calcul developpé actuellement a été validé par comparaison avec des nouvelles
mesures d'échauffement gamma effectuées lors du programme CIRANO au réacteur
expérimental MASURCA, et avec des mesures réévaluées, effectuées antérieurement par
Calamand et al. dans la configuration BALZAC1-DE1 de la même installation. Cette dernière
configuration avait une zone diluant en acier/sodium au centre du coeur. Dans les mesures
CIRANO actuelles, la valeur absolue de l'échauffement gamma a été déterminée dans des
coeurs PuO2/UO2 entourés par un réflecteur en acier/sodium, en utilisant des dosimètres
thermoluminescents TLD-700. Un effort considérable a été fait pour minimiser les erreurs
systématiques et réduire les erreurs statistiques, afin d'obtenir une erreur expérimentale totale
inférieure à l'incertitude maximale visée sur les calculs d'échauffement gamma. Dans ce but,

iv
une procédure de mesure hautement reproductible (erreur statistique < 2 %) a été établie, les
TLD calibrés individuellement d'une manière consistante avec les mesures dans le réacteur, et
les divers facteurs correctifs (déterminés en utilisant les méthodes et données les plus récentes)
étudiés en détail. Le facteur correctif le plus mis en doute, c.à.d. le facteur de cavité, a été
déterminé en utilisant la théorie de cavité de Burlin et des calculs MCNP couplés photon-
éléctron, vérifiés par des irradiations de TLD entourés par différents matériaux. L'erreur
expérimentale totale (1 σ) sur les mesures TLD est estimée inférieure à 6 %.
Les valeurs calcul/expérience (C/E) dérivées de l'analyse des expériences critiques sont
0.90 pour la région coeur en PuO2/UO2, 0.84 pour le réflecteur acier/sodium et 0.89 pour la
zone diluant acier/sodium. Les causes les plus plausibles pour les différences observées sont
des erreurs dans les données de base utilisées, c.à.d. des énergies gamma émises par fission et
des sections efficaces de capture des éléments de structure trop petites. Les données les plus
mises en question sont celles de Pu239 et Fe56, le premier étant l'isotope le plus important pour
la production gamma dans le coeur et le deuxième jouant le rôle essentiel dans le réflecteur et
les diluants.
La possibilité d'extrapoler les résultats de la validation aux réacteurs de puissance
SUPER-PHENIX (dans sa configuration envisagée comme brûleur de plutonium) et au projet
CAPRA 4/94 à 1500 MWe a été démontrée en comparant les caractéristiques d'échauffement
gamma des configurations expérimentales avec celles des réacteurs de puissance. La
transférabilité étant vérifiée, il est possible de définir un jeu de facteurs correctifs (fpower=E/C)
pour application aux valeurs de l'échauffement gamma calculés. Ceci permet de prédire
l'échauffement gamma dans les diverses régions des réacteurs de puissance considérés avec
une incertitude plus petite que l'incertitude maximale visée sur les calculs (~ 7.5 %).

v
CONTENTS
ABSTRACT.............................................................................................................................................................i
VERSION ABREGEE ......................................................................................................................................... iii
1. INTRODUCTION..............................................................................................................................................1
1.1 OVERVIEW OF THE PRESENT WORK...........................................................................................................2
2. GENERAL BACKGROUND............................................................................................................................5
2.1 THE CAPRA PROJECT...............................................................................................................................5 2.1.1 Motivation and Research Topics.......................................................................................................5 2.1.2 Basic Physics of Plutonium-Burning Fast Reactors and Impact on Core Design ............................7 2.1.3 The 4/94 Oxide Reference Core ......................................................................................................10 2.1.4 Gamma-Heating Calculational Needs for the CAPRA Project .......................................................12
2.2 THE MASURCA FACILITY AND THE CIRANO EXPERIMENTAL PROGRAMME .......................................14 2.2.1 The MASURCA Facility ..................................................................................................................15 2.2.2 The CIRANO Experimental Programme .........................................................................................17
2.3 GAMMA-RAY PHYSICS IN FAST REACTORS .............................................................................................18 2.3.1 Gamma-Ray Sources .......................................................................................................................18
2.3.1.1 The fission reaction .................................................................................................................................. 19 2.3.1.2 Neutron capture........................................................................................................................................ 21 2.3.1.3 Inelastic scattering.................................................................................................................................... 22 2.3.1.4 Gamma-source components and distributions in fast reactors ................................................................. 22
2.3.2 Gamma-Ray Interaction Processes .................................................................................................28 2.3.3 Propagation of Gamma Rays in Fast Reactor Media .....................................................................29 2.3.4 Heat Deposition by Gamma Rays and Its Contribution to Total Heating.......................................32
2.4 A REVIEW OF EARLIER GAMMA-HEATING EXPERIMENTS AND CALCULATIONS FOR FAST REACTORS....34 2.4.1 ZPPR ...............................................................................................................................................34 2.4.2 ZEBRA.............................................................................................................................................36 2.4.3 FBBF...............................................................................................................................................37 2.4.4 MASURCA.......................................................................................................................................38
2.4.4.1 RACINE-1Abis ........................................................................................................................................ 38 2.4.4.2 BALZAC1-DE1 ....................................................................................................................................... 40
2.4.5 General Observations .....................................................................................................................43 2.5 THE FRENCH "FORMULAIRE" CONCEPT FOR REACTOR CALCULATIONS..................................................44
2.5.1 Essential Elements...........................................................................................................................44 2.5.1.1 Calculational tool ..................................................................................................................................... 45 2.5.1.2 Integral experiments................................................................................................................................. 45 2.5.1.3 Transposition to power reactors ............................................................................................................... 45
2.5.2 The ERANOS Formulaire................................................................................................................47 2.5.2.1 Calculational tool ..................................................................................................................................... 47 2.5.2.2 Validation................................................................................................................................................. 49
2.5.3 The Earlier Methodology for Gamma-Heating Calculations, VASCO-1 ........................................50 2.5.3.1 Calculational scheme and associated data libraries .................................................................................. 50 2.5.3.2 Validation................................................................................................................................................. 53 2.5.3.3 Transposition............................................................................................................................................ 54 2.5.3.4 Deficiencies.............................................................................................................................................. 55
vi
3. DEVELOPMENT AND IMPLEMENTATION OF THE NEW CALCULATIONAL SCHEME FOR DETAILED NEUTRON AND GAMMA HEATING IN ERANOS ...........................................................61
3.1 DEFINITION OF THE CALCULATIONAL SCHEME USED FOR DETAILED NEUTRON AND GAMMA-HEATING
CALCULATIONS .......................................................................................................................................62 3.2 CREATION OF THE BASIC DATA LIBRARIES NEEDED ...............................................................................67
3.2.1 Definition of Data To Be Created ...................................................................................................68 3.2.2 Gamma Production and Decay Data Available in Evaluated Nuclear Data Files .........................68
3.2.2.1 Gamma production data ........................................................................................................................... 69 3.2.2.2 Decay data................................................................................................................................................ 70
3.2.3 Problems Related to the Creation of the Data Libraries.................................................................70 3.2.4 Creation of the Data Libraries........................................................................................................71
3.2.4.1 Data processing using NJOY ................................................................................................................... 72 3.2.4.2 Data conversion........................................................................................................................................ 80 3.2.4.3 Inclusion of delayed contribution............................................................................................................. 82
3.3 IDENTIFIED REMAINING SHORTCOMINGS AND UNCERTAINTIES ASSOCIATED WITH THE USE OF THE DATA
LIBRARIES ................................................................................................................................................88 3.3.1 Testing of the Created Data Files, Identified Shortcomings and Estimation of Impact ..................88 3.3.2 Estimation of the Uncertainty on Computing the Gamma Energy Emission ..................................91 3.3.3 Estimation of the Uncertainty on Computed Gamma Heating........................................................92
4. GAMMA-HEATING MEASUREMENTS AT THE MASURCA FACILITY ...........................................97
4.1 EXPERIMENTAL TOOLS FOR GAMMA-HEATING MEASUREMENTS ...........................................................98 4.1.1 Thermoluminescent Dosimeters (TLDs) ..........................................................................................99
4.1.1.1 TLD-700 .................................................................................................................................................. 99 4.1.1.2 Response to gamma rays and neutrons................................................................................................... 101 4.1.1.3 Oven and reader equipment used ........................................................................................................... 104 4.1.1.4 Measuring Procedure Using TLD-700 ................................................................................................... 105
4.1.2 Ionization Chambers .....................................................................................................................110 4.2 CALIBRATION USING THE CO
60 SOURCE AT PSI .....................................................................................111
4.2.1 Description of the Irradiation and Its Numerical Analysis ...........................................................111 4.2.2 Results ...........................................................................................................................................114
4.3 INTEGRAL MEASUREMENTS...................................................................................................................116 4.3.1 ZONA5K Experiments ...................................................................................................................116
4.3.1.1 Description of the experimental configuration and the TLD measurements .......................................... 116 4.3.1.2 Results.................................................................................................................................................... 119
4.3.2 ZONA2B Experiments ...................................................................................................................120 4.3.2.1 Description of the experimental configuration and the measurements................................................... 120 4.3.2.2 Results.................................................................................................................................................... 122
4.4 CALCULATIONAL CORRECTION FACTORS..............................................................................................124 4.4.1 Corrections for TLD Measurements..............................................................................................125
4.4.1.1 Correction for neutron sensitivity .......................................................................................................... 125 4.4.1.2 Cavity (spectral) correction .................................................................................................................... 126 4.4.1.3 Heterogeneity correction ........................................................................................................................ 130 4.4.1.4 Correction for non-saturation of the delayed gamma emission.............................................................. 134 4.4.1.5 Application of the correction factors to the ZONA5K and ZONA2B measurements ............................ 137
4.4.2 Corrections for Ionization Chamber Measurements .....................................................................141 4.4.2.1 Cavity correction.................................................................................................................................... 141 4.4.2.2 Correction for neutron sensitivity .......................................................................................................... 142 4.4.2.3 Heterogeneity correction ........................................................................................................................ 143 4.4.2.4 Correction for non-saturation of the delayed gamma emission.............................................................. 145

vii
4.5 EXPERIMENTAL UNCERTAINTIES ...........................................................................................................145 4.5.1 Measurement Uncertainties ..........................................................................................................146
4.5.1.1 Absolute calibration and TLD technique ............................................................................................... 146 4.5.1.2 Measurements in the reactor................................................................................................................... 147
4.5.2 Uncertainties Associated with Calculational Corrections ............................................................148 4.5.3 Total Estimated Experimental Uncertainties ................................................................................149
5. VALIDATION OF THE CALCULATIONAL SCHEME THROUGH COMPARISONS WITH EXPERIMENTS...........................................................................................................................................153
5.1 COMPARISON OF CALCULATIONS WITH ZONA5K AND ZONA2B MEASUREMENTS.............................153 5.1.1 Calculations ..................................................................................................................................154 5.1.2 Comparison with Measurements ...................................................................................................156
5.2 COMPARISON OF CALCULATIONS WITH BALZAC1-DE1 MEASUREMENTS ..........................................159 5.2.1 Calculations ..................................................................................................................................159 5.2.2 Comparison with Measurements ...................................................................................................160
5.3 ANALYSIS OF DIFFERENCES BETWEEN EXPERIMENTS AND CALCULATIONS..........................................162 5.4 CORRECTION FACTORS FOR COMPUTED GAMMA HEATING IN CORE, REFLECTOR AND DILUENT
REGIONS ...............................................................................................................................................169 5.5 TRANSFERABILITY TO POWER REACTORS ..............................................................................................169
5.5.1 Gamma Heating in Steel/Sodium Reflectors .................................................................................171 5.5.2 Gamma Heating in Diluent Sub-Assemblies .................................................................................175
6. CONCLUSIONS AND RECOMMENDATIONS .......................................................................................181
APPENDIX A: NEUTRON (ECCO) AND GAMMA (VASCO) MULTI-GROUP STRUCTURES..........187
APPENDIX B: EVALUATIONS USED FOR THE CREATION OF KERMA AND SPECTRA FILES. 189
APPENDIX C: COMPARISON WITH VASCO CALCULATIONS ...........................................................193
C.1 DESCRIPTION OF THE ZONA2A CONFIGURATION .................................................................................193 C.2 THE ERANOS CALCULATIONS .............................................................................................................193 C.3 THE CARNAVAL-IV/ PROPANE-D2/VASCO-1 CALCULATIONS .....................................................194 C.4 COMPARISON AND DISCUSSION OF THE DIFFERENCES ...........................................................................196
APPENDIX D: VERIFICATION OF BURLIN CAVITY THEORY FOR CORE AND REFLECTOR...201
D.1 MEASUREMENTS...................................................................................................................................201 D.2 MCNP MODELING................................................................................................................................202 D.3 RESULTS AND COMPARISON TO MEASUREMENTS.................................................................................204 D.4 VERIFICATION OF BURLIN CAVITY THEORY WITH MCNP ....................................................................209
APPENDIX E: ANALYSIS OF ZONA5K CENTRAL SUBSTITUTION ZONE MEASUREMENTS .....213
ACKNOWLEDGMENTS .................................................................................................................................217
CURRICULUM VITAE....................................................................................................................................218


1
1. INTRODUCTION
The main goal of the current doctoral research has been to develop an accurate methodology for gamma-heating calculations for fast reactors, and to validate it for plutonium-burning configurations.
Gamma heating accounts for about 13 % of total heating in a conventional liquid metal fast breeder reactor. However, locally, it can provide the major contribution to heating in certain regions (diluent sub-assemblies and shielding: ~ 90 %, rod followers: ~ 80 %, fertile blankets: 40 - 50 %). From the viewpoint of defining appropriate cooling requirements and determining thermal stresses, the accurate assessment of the gamma-heating distribution is thus an essential aspect of fast reactor design.
The need for accurate calculational tools for the determination of gamma heating in fast reactors has increased considerably in recent years following the planned modification of the existing French fast breeder reactors PHENIX and SUPER-PHENIX into plutonium-burning configurations (CAPRA project, § 2.1). Such burner reactors are characterized by the replacement of the fertile blankets by steel/sodium reflectors, and a higher Pu-enrichment which implies the need for a relatively high dilution of the core by employing a large number of sodium/steel sub-assemblies (diluent S/As). In both of the latter regions, viz. reflector and diluent zones, gammas contribute about 90 % to total heating. Furthermore, the propagation of neutrons into the shielding is enhanced by the replacement of the fertile blanket and leads to a significant increase of gamma heating in this region.
The former European tool for gamma-heating calculations, VASCO-1 (§ 2.5.3), was especially developed and validated for the design of the SUPER-PHENIX fast breeder power plant. However, this code has important shortcomings in both its calculational algorithms and the basic data used. In particular, these are the use of infinite dilution total gamma-production matrices (which necessitates the determination of supplementary self-shielding correction factors) and incorrect (underestimated) iron gamma production cross-sections. This makes use of the code particularly difficult when aiming at the accurate determination of gamma heating in specific zones such as the steel/sodium sub-assemblies and reflectors characteristic of plutonium burners. This follows from the fact that, in these regions, a major contribution to heating comes from capture and inelastic reactions in iron, the self-shielding for which varies spatially in an important way. All this has justified the development, implementation and validation of a new calculational tool for gamma heating as accomplished in this thesis.

2 Chapter 1
The accuracy of a given reactor analysis methodology needs to be established through comparisons with integral measurements, usually carried out in critical configurations representative of the power reactor of interest. In the past, there have been several series of experiments in conventional (breeder) fast reactor criticals for the validation of various gamma-heating calculational schemes and their associated data (§ 2.4). In general, calculations were found to underestimate gamma heating (C/E < 1), although the gamma production data used were believed to be too high. Furthermore, relatively large differences were reported between measured values obtained with different techniques. This is probably related to the fact that not all of the calculational correction factors needed in the measurements had been determined in a satisfactory way. Significant doubt on the quality of absolute results reported in some of the earlier gamma-heating experiments has thus to be expressed and justifies the careful review which has been made of the principal experimental technique applied in this work, viz. ThermoLuminescent Dosimeters (TLDs). Thus, in the course of the current validatory experiments conducted in critical configurations representative of Pu-burning fast reactors, various possible sources of systematic errors in the TLD measurements themselves, in the calibration (and its analysis), and in the calculational determination of the various correction factors, have been investigated in detail.
Although this thesis work was initially motivated by the planned modification of certain fast breeder reactor into Pu-burners, the need for improved accuracies in the determination of gamma heating is more general. Indeed, gammas make a major contribution to heating in non-fissile regions of any nuclear system. Thus, for example, this is the case for the special minor-actinide incineration sub-assemblies (containing americium pins surrounded by steel) planned to be introduced into the PHENIX power plant in the near future.
1.1 Overview of the Present Work
The present thesis work consists of three major parts, viz.: 1) Development and implementation of a new calculational tool for detailed gamma- and neutron-heating calculations (Chapter 3):
A new calculational tool has been implemented for separate calculation of gamma- and neutron heating in fast reactors. The particularity of the new methodology is that gamma production multiplicites for fission, capture and inelastic scattering are folded with the corresponding effective (self-shielded) neutron cross-sections and then summed up to yield the total gamma production matrices (used to generate the gamma source from the neutron flux). Similar algorithms are applied to compute the total neutron KERMA (Kinetic Energy Released to MAterials). This allows to take advantage of the latest improvements in computing effective cross-sections at the cell level (ECCO cell code, § 2.5.2.1), in particular the consideration of spatially varying cross-sections in non-fuel regions such as reflectors.

Introduction 3
The new methodology has required the generation of appropriate gamma production and neutron KERMA libraries. These were produced using the most recent nuclear data evaluations. Thereby, delayed gamma production due to disintegration of fission and activation products was explicitly considered.
Besides making the new calculational tool operational, the creation of an appropriate gamma-production library has allowed a careful check to be made on the quality of the basic data available. This, in turn, has provided an estimate of the uncertainty on computing gamma sources due purely to errors in the gamma-production data. 2) Planning and execution of gamma-heating measurements at the MASURCA facility (Chapter 4):
With the main aim of establishing a sound experimental basis against which the currently developed calculational methodology could be tested, a new series of gamma-heating measurements have been carried out in the framework of the CIRANO programme at the MASURCA critical facility at CEN Cadarache.
The CIRANO programme was launched in support of the planned modification of PHENIX and SUPER-PHENIX into plutonium burners. The reference configuration in this programme is a clean PuO2/UO2 core surrounded by a steel/sodium reflector. Considerable effort has been made to achieve accurate gamma-heating measurements not only in the reflector, but also in the core region. The determination of gamma emission in the core is important because a large fraction of the heating in non-fuel regions (diluent sub-assemblies, reflectors) is due to gammas created in the core. Measurements have been made using TLDs and ionization chambers, with emphasis placed on the TLDs since it is this technique which has been applied for the absolute dose determination. Ionization chambers have served to obtain independent relative results (traverses).
As indicated earlier, a major aim has been to minimize systematic errors in the measurements, and to reduce the statistical uncertainty, in order to ensure a total experimental error smaller than the target accuracy for the calculational determination of gamma heating. Clearly, with the integral measurements being used to validate the calculational tool, the total experimental error gives a lower limit for the accuracy to be assigned to the calculations. To achieve the goal of a sufficiently low experimental error, a highly reproducible measuring procedure was established, the TLD calibration was carried out in a consistent way with respect to the reactor measurements, and the various correction factors (determined using the latest calculational methods and data) were investigated in detail. The correction most in doubt, viz. the cavity relation, was derived by applying both Burlin cavity theory and MCNP coupled photon-electron calculations, with TLD irradiations in various surroundings providing a check on these calculations.
4 Chapter 1
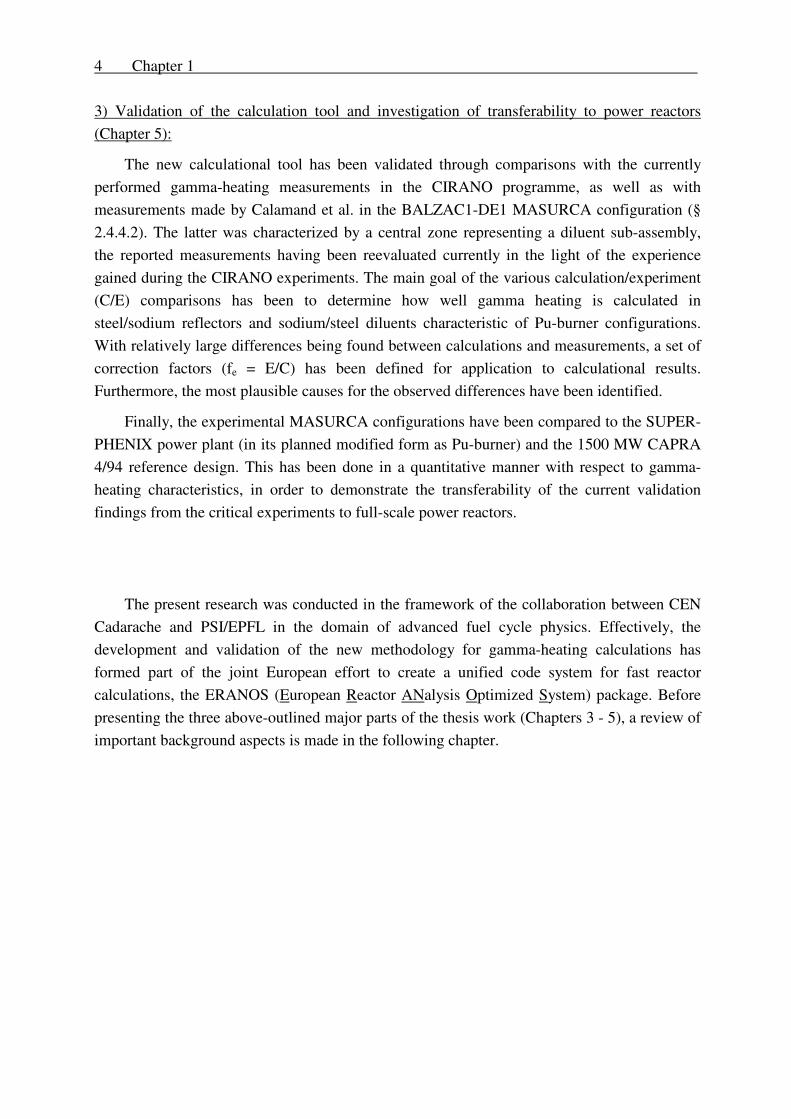
3) Validation of the calculation tool and investigation of transferability to power reactors (Chapter 5):
The new calculational tool has been validated through comparisons with the currently performed gamma-heating measurements in the CIRANO programme, as well as with measurements made by Calamand et al. in the BALZAC1-DE1 MASURCA configuration (§ 2.4.4.2). The latter was characterized by a central zone representing a diluent sub-assembly, the reported measurements having been reevaluated currently in the light of the experience gained during the CIRANO experiments. The main goal of the various calculation/experiment (C/E) comparisons has been to determine how well gamma heating is calculated in steel/sodium reflectors and sodium/steel diluents characteristic of Pu-burner configurations. With relatively large differences being found between calculations and measurements, a set of correction factors (fe = E/C) has been defined for application to calculational results. Furthermore, the most plausible causes for the observed differences have been identified.
Finally, the experimental MASURCA configurations have been compared to the SUPER-PHENIX power plant (in its planned modified form as Pu-burner) and the 1500 MW CAPRA 4/94 reference design. This has been done in a quantitative manner with respect to gamma-heating characteristics, in order to demonstrate the transferability of the current validation findings from the critical experiments to full-scale power reactors.
The present research was conducted in the framework of the collaboration between CEN Cadarache and PSI/EPFL in the domain of advanced fuel cycle physics. Effectively, the development and validation of the new methodology for gamma-heating calculations has formed part of the joint European effort to create a unified code system for fast reactor calculations, the ERANOS (European Reactor ANalysis Optimized System) package. Before presenting the three above-outlined major parts of the thesis work (Chapters 3 - 5), a review of important background aspects is made in the following chapter.

5
2. GENERAL BACKGROUND
In this second chapter, several general aspects of importance to the present work are discussed. The first section (§ 2.1) addresses the CAPRA project, aimed at demonstrating the feasibility of Pu-burning fast reactors, because it provided the major motivation for the present thesis. In the second section (§ 2.2), the CIRANO experimental programme at the MASURCA facility is described since this was the main framework in which the current validation effort was made. In the third section (§ 2.3), the basic gamma-ray physics phenomena important for the determination of gamma heating in a fast reactor are discussed, while the fourth section (§ 2.4) reviews earlier gamma-heating experiments and their analysis. In the fifth section (§ 2.5), the French "formulaire" concept for fast reactor physics calculations is introduced, the present work being a contribution towards the development of the latest formulaire, ERANOS. Also addressed in this section is the former European formulaire for gamma-heating calculations, VASCO-1, together with its main deficiencies which have largely been removed in the course of developing the current methodology.
2.1 The CAPRA Project
The project CAPRA (Concept to Amplify Plutonium Reduction in Advanced fast reactors) [1,2,3,4] is an international R & D program which aims at demonstrating the feasibility of a fast reactor in which net burning of plutonium would be as high as possible and which could, moreover, contribute to the transmutation of Minor Actinides (MAs)1.
2.1.1 Motivation and Research Topics
The development of fast reactor technology was initially motivated by the possibility of breeding new fuel, i.e. of generating fissile Pu239 and U233 from the fertile isotopes U238 (99.27 % of natural uranium) and Th232 (100 % thorium), respectively, the latter being very much more abundant than the only naturally occurring fissile nuclide U235. In most current-day Nuclear Power Plants (NPPs), i.e. thermal reactors, basically only the latter isotope is burned and the energy production potential of the fertile isotopes remains largely unused. Through breeding, Fast Reactors (FRs) allow to use this potential fully and thus to extract 80 to 100 times more energy from the same resources. In the long term, therefore, FRs will have to replace the thermal reactor park in order to render nuclear energy (fission) "sustainable" from the resource viewpoint. However, the much slower than anticipated growth of nuclear power, the current glut in the uranium market and the relatively high capital cost of the Liquid Metal 1 MAs are heavy isotopes produced through neutron capture and contribute in an important way to the long-term toxicity of nuclear waste.

6 Chapitre 2
Fast Breeder Reactor (LMFBR) are factors which have postponed the era of large-scale exploitation of FR technology by several decades.
Presently, the interest in FRs has been renewed due to their flexibility with respect to the regulation of plutonium inventories. In fact, for the near-term future, it is not so much the shortage of fissile materials but, ironically, their surplus (of plutonium, in particular) which has become a major concern. The cumulative amount of plutonium generated by NPPs worldwide is estimated to be over 1000 t currently, and this amount continues to increase by about 60 t every year [5]. Most of the plutonium is in the form of irradiated fuel lying in intermediate-storage pools at the NPP sites themselves. However, there are significant amounts (~ 150 t) which have been separated by fuel reprocessing. If one considers, in addition to this commercial source, the 100 t of military plutonium shortly to be released from dismantled nuclear weapons [6], an effective regulation of plutonium stocks worldwide is seen as an urgent need from the viewpoint of non-proliferation.
Several countries have decided to take effective steps for the management of the long term growth of their plutonium stock piles. There are several options to tackle the problem, one of them being to treat plutonium as waste and to search for a permanent or temporary storage. A more attractive solution is to use the plutonium as fissile material, thus making the maximum use of its energy content. With light water reactors (LWRs) currently dominating the nuclear energy scene, the first step in this approach consists of recycling plutonium as PuO2/UO2 (mixed oxide, or MOX) in these NPPs. This step has been effectively demonstrated for limiting the growth of stockpiles. Nevertheless, core design and safety constraints limit the amount of plutonium present in the core, as well as the number of possible LWR recycles due to the build-up of higher Pu-isotopes. This build-up degrades the plutonium "quality", i.e. its fissile content in terms of Pu239 and Pu241 fractions.
Fast reactors, on the other hand, are more advantageous for regulating the stock of plutonium. Due to the hard neutron spectrum, practically all the plutonium isotopes can be fissioned, so that multiple recycling is no problem. FRs are very flexible. They can burn high grade (weapons) plutonium and can also be used to burn the degraded Pu resulting from LWR recycling. This makes them very useful when looking for a consistent strategy for the back-end of the fuel cycle in conjunction with the recycling of processed fuel in LWRs. Furthermore, they can be used to transmute the MAs (neptunium and americium).
Due to the considerable interest in the possibility of using FRs to burn plutonium, the CAPRA project was launched by the CEA (Commissariat à l'Energie Atomique, France) in February 1993 to demonstrate the feasibility of a fast plutonium-burner reactor. Although initiated by the CEA, it has quickly become a large international R & D program through various specific bi- and multilateral collaborations with its partners, including the Paul Scherrer Institute (PSI), Switzerland.

General Background 7
During the first phase of the project, completed by the end of 1994, basic design options for a plutonium-burning FR were studied and led to the definition and thorough study of the reference option characterized by cores employing a high plutonium-content oxide fuel and the use of the so-called dilution concept (§2.1.2). Preference was given to the latter concept because of its high potential for increasing the fuel enrichment and because it can be applied to large core sizes while preserving acceptable safety features (Doppler and sodium void worth) [7]. A reference design was defined, the so called 4/94 Oxide Reference Core [8] (§ 2.1.3), and a detailed report prepared [9] related to the various studied aspects (neutronics, fuel design, safety, integration into the European Fast Reactor (EFR) nuclear island). Effectively, the report indicated the basic feasibility of a fast plutonium-burner reactor using a high plutonium-content oxide fuel which could be operated within acceptable safety margins and economics considerations.
The second phase, currently ongoing, represents the active part of a large international R & D effort aimed at validating various new features considered in the CAPRA project. The main components of the research are:
• Development and qualification of the European code system ERANOS (§ 2.5.2) with its associated basic nuclear data for the calculation of plutonium-burning FR configurations with their novel physics characteristics (§ 2.2.2).
• Provision of integral experimental data through the CIRANO experimental programme at the MASURCA critical facility (§ 2.2).
• Use of the PHENIX and SUPER-PHENIX plants to demonstrate the CAPRA options on a realistic scale: blanket removal and large-scale introduction of higher enriched heterogeneous CAPRA subassemblies.
• Highly enriched plutonium-fuel fabrication (homogeneous MOX of 45 % plutonium content and advanced fuels without uranium) and irradiation.
• Continued research on advanced burner cores based on the concept of plutonium fuel without uranium.
• More general studies concerning strategies and scenarios for future nuclear parks with the objective of defining precisely the expected role for the FR (performance and complementarity of FRs and LWRs).
2.1.2 Basic Physics of Plutonium-Burning Fast Reactors and Impact on Core Design
The net plutonium production/consumption of a fast reactor core results from the balance of the following two opposing effects:
1. The plutonium production by neutron capture in U238.
2. The plutonium destruction mainly through fission, neutron capture and radioactive decay.

8 Chapitre 2
Converting a conventional fast breeder reactor into a burner thus consists of taking two natural steps. The first step is to significantly reduce the plutonium production, viz. by removing the radial and axial fertile blankets. The core thus becomes, to a slight degree, a plutonium burner (of the order of 20 kg/TWeh for an EFR design without blankets). In the second step, the plutonium destruction has to be increased. To achieve significant plutonium consumption, the fissile part of the core needs to be modified. Seeking high consumption rates again means in fact minimizing the production term, which requires low uranium content, i.e. high plutonium enrichment of the fuel. Figure 2-1 gives an overview of the CAPRA results [10] for the various core design options investigated. It shows that the plutonium burning rate depends mainly on the Pu-enrichment, E, of the fuel and increases as (1-E)/E. This means that even a moderate increase in the enrichment leads to a relatively large increase in the burning rate. It is seen that ~ 80 kg of plutonium per TWeh can be burnt in a fast reactor core, if the fuel enrichment is raised to between 40 and 45 %. This corresponds to an annual Pu-consumption of ~ 670 kg for a SUPER-PHENIX-sized NPP. This highlights the interest of investigating MOX enrichments above the well known 25 % to 32 % range. In the limiting case of a fuel without uranium, the consumption rate would be ~ 960 kg annually.
Figure 2-1: Plutonium consumption as a function of fuel enrichment in a Pu-incinerating fast reactor.
Any increase in the Pu-content must of course be adapted to the need for achieving a balance divided equally between neutron generation, on the one hand, and neutron absorption and leakage on the other hand. Neutron generation is given by the mass of plutonium (or more precisely, fissile plutonium), i.e. the product of the Pu-enrichment and the mass of oxide.

General Background 9
Increasing the Pu-enrichment, while maintaining a constant mass of oxide, results in an increase of the generation which has to be compensated by an increase of the absorption and/or leakage. On the contrary, if an increase of absorption or leakage is not possible or not wanted, an increase of the Pu-enrichment can be "simply" compensated by a decrease of the mass of oxide. These considerations are to be found in the different design orientations that have been studied: reduction of the oxide inventory with no change in core volume or shape (dilution concept), introduction of a neutron absorber (poisoning concept), adaptation of the core shape (pancake core concept) in order to increase the neutron leakage, etc. So far, the most thoroughly studied concept is the dilution concept.
The major impacts of the modification of the conventional FBR (fast breeder reactor) design to burner reactor concept are listed below [11,12]:
1. Effects due to the increase in Pu-enrichment. In fact, most of the listed effects (Doppler, sodium void, βeff ) are due to the reduction of the U238 content:
• A higher core reactivity.
• A decrease of the Doppler effect which is directly related to the U238 content (U238 contributes 95 % to the Doppler in SUPER-PHENIX). The introduction of absorber induces an even larger decrease due to the spectrum hardening, but a heterogeneous mode of introduction (absorber separated from the fuel) reduces the impact. Addition of some moderator can counterbalance the absorbing materials effects.
• A tendency of the sodium void effect to decrease since U238 makes a strong contribution to the positive sodium void reactivity. Note however that the sodium void reactivity can vary over a large range of values depending on the burner design. It depends on the amount of absorbing materials in the core and is directly linked to the decrease of their effective cross-section with the spectrum hardening due to the sodium voiding. As a consequence, the Na void is less positive in the dilution approach (U238 decrease) but the introduction of an absorber ("poison") increases the positive value. As for the Doppler coefficient, both the introduction of moderators and a heterogeneous introduction of the absorber reduce the penalty.
• An increase of the burn-up reactivity loss as this is strongly dependent on the U238 conversion into Pu239. The increase in burn-up reactivity loss will lead to a reduction in the fuel cycle length. The addition of a burnable poison allows the burn-up loss to be reduced or stabilized despite the increase in plutonium consumption.
• A decrease in βeff ( U238 contributes 75 % to the SUPER-PHENIX βeff ).
2. Effects due to the replacement of the fertile breeding blanket with a steel/sodium reflector. In a FBR, the presence of large quantities of U238 in the blanket leads to significant captures in the resonance range and thereby a large decrease of the neutron flux beyond the blankets. When steel/sodium subassemblies are substituted for the blankets, capture is

10 Chapitre 2
significantly decreased, back scattering into the core increases and finally a larger fraction of neutrons are transmitted beyond the blanket region to the outer shield. In other words, the effects are:
• Increase of total flux and of neutron and gamma heating in the shielding region beyond the steel/sodium assemblies which have replaced the fertile blanket region.
• Modification of the "reflector gain".
• A change of the overall power distribution which becomes flatter: the flux at the core reflector interface is increased due to the increased back scattering of neutrons of lower energy.
In the case of SUPER-PHENIX, the removal of the radial blanket will have consequences as regards the burned fuel which is temporarily placed for cooling at the so-called internal storage positions located beyond the blanket. In fact, fission in the stored fuel will increase, leading to a higher fast neutron flux beyond the storage position and finally to increased structural damage and secondary sodium activation.
Gamma heating becomes an important concern in fast burner concepts due to the many non-fuel regions in which it makes the dominant contribution to heating. More details on this issue are given in § 2.1.4.
2.1.3 The 4/94 Oxide Reference Core
Figure 2-2 illustrates the design of the 4/94 Reference Core. The utilization of 45 %-Pu MOX in a 1500 MWe core implies a reduction by a factor of 2 of the fuel inventory as compared to a fast breeder core of equivalent size and power. This was achieved by reducing the fuel inventory at three combined levels: 1) At pin level with the choice of pins of small diameter containing oxide pellets with a large central hole, 2) at sub-assembly (S/A) level with the choice of a heterogeneous bundle containing a large number of pins (496) about one third of which (149) contain no fuel and are filled with an inert material (MgAl2O4) instead, and 3) at core level with the presence of 52 permanent diluent (i.e. unfuelled) S/As.
Figure 2-3 gives the RZ model of the 4/94 Reference Core used for heating studies in the present work.
We note the following characteristics of the core:
1. By choosing oxide fuel one takes advantage of current fuel cycle technology (manufacturing and reprocessing), although with 45 % enrichment one takes it to its limits.
2. The chosen power of 1500 MWe corresponds to a high power core which is compatible with the EFR nuclear island.
3. Minor actinides can be easily taken into account and multiple plutonium recycling is quite conceivable.

General Background 11
Figure 2-2: Design of the CAPRA 4/94 Reference Core.
Inner CoreOuter CoreRadial ReflectorAxial Reflector 1Axial Reflector 2DiluentsRod FollowersAbsorber Rods 1Absorber Rods2
260.0
183.0180.0
80.0
75.0
0.0
0.09.52 41.52
46.62
53.03
57.93
90.8697.36
101.47107.33
142.23147.86
151.49 202.26 250.0
Z [cm]
R [cm]
Figure 2-3: RZ model of the CAPRA 4/94 Reference Core used for heating studies in the present work.

12 Chapitre 2
4. The technology implemented is rather conventional and makes it possible to go back to lower Pu-burning situations or even to breeder situations.
5. The chosen design is able to deal with a large range of Pu-qualities.
6. The weak points of the design are the high reactivity swing of the core (that requires temporary poisoning of about half of the diluent subassemblies which are replaced at mid-cycle) and the reduction in the in-pile residence time of the fuel. The short residence time, as well as the more sophisticated S/A design, will furthermore have an impact on the fuel cycle cost and the price of electricity produced will exceed that of an EFR by a few percent.
2.1.4 Gamma-Heating Calculational Needs for the CAPRA Project
Table 2-1 gives total gamma and neutron heating in different regions of the CAPRA 4/94 Reference Core. The values were obtained using the calculational scheme presented in Chapter 3 and the RZ model given in Figure 2-3.
Table 2-1: Neutron, gamma and total heating in different regions of the CAPRA 4/94 Reference Core in units of [MWth]. The results are normalized to a nominal power of 3600 MWth. The percentage contribution of gamma heating to the total heating is also indicated.
Region Neutron Gamma Total % gamma in total Inner Core 1701.7 176.5 1878.2 9.4% Outer Core 1497.2 154.8 1652.0 9.4% Radial Reflector 2.1 20.8 22.9 91.0% Axial Reflector 1 2.1 14.4 16.5 87.2% Axial Reflector 2 0.6 4.7 5.3 89.5% Central Diluent 0.0 0.2 0.3 87.5% Diluent Ring 1 0.3 2.5 2.8 87.7% Diluent Ring 2 1.1 7.7 8.8 87.7% Rod Follower 1.4 5.4 6.8 79.5% Absorber Rod 1 3.8 0.7 4.4 15.2% Absorber Rod 2 1.7 0.3 2.0 13.7% TOTAL 3212.0 388.0 3600.0 10.8%
It is seen that gamma heating is the dominant contribution to total heating in the diluent sub-assemblies and the various reflector regions. Thus, in order to define the cooling requirements and to determine thermal stresses, it is necessary to be able to compute the gamma-heating component adequately in these regions, the major goal of the present thesis being to provide an appropriate methodology for this purpose. However, it is estimation not

General Background 13
only of the gamma heating which is thereby required, but also of the accuracy with which this quantity is calculated.
The uncertainty in the prediction of reactor characteristics has an important impact on design margins and reactor control, and finally on the cost of produced electricity. For example, the uncertainty on the computed reactivity worth of shutdown control rods will determine how many rods have to be constructed. As regards the heating of reactor assemblies, the cooling has to ensure that the heating does not lead to an assembly temperature higher than the maximum temperature at which there are important changes in the properties of the used materials. On the other hand, too much cooling leads to an unnecessarily low temperature of the coolant leaving the assembly2. This decreases the overall core performance which is the best when the temperature of the coolant is approximately the same at the outlet of each assembly. Moreover, too much cooling can lead to unnecessary thermal stresses. Summarizing, a too high uncertainty on the heating will lead to overcooling so that, in principle, it is desirable to compute the (gamma) heating as accurately as possible. Nevertheless, it should be mentioned that there is no need to aim at calculational accuracies beyond a certain limiting value, viz. that imposed by technological limitations such as the accuracy with which one can control the coolant flow.
One thus has to address the question as to with which accuracy the quantity of interest, i.e. gamma-heating, needs to be determined. This target accuracy, in turn, determines the accuracy one should meet in measurements of gamma-heating: Since the quality of gamma-heating calculations are tested by comparison to measurements, a lower limit for the uncertainty on the calculated gamma heating is given by the experimental error. Thus, the experimental uncertainty has to be lower than the target accuracy one wants to achieve.
The task of determining the target accuracy for gamma-heating calculations in non-fuel regions such a diluent sub-assemblies and steel/sodium reflectors is not an easy one. No indications are found in the literature, although target accuracies are given for quantities such as keff, breeding ratio, Doppler coefficient, power distributions and decay heat [13,14]. Personal judgment had therefore to be applied, the performance of the previous European formulaire for gamma-heating calculations, VASCO-1 (§ 2.5.3), providing a useful basis in this context. Considering that this formulaire was used for the design of SUPER-PHENIX, the uncertainties indicated in Table 2-12 can indeed be expected to serve as reasonable guidelines.
1) Target accuracy for steel/sodium reflector: From a comparison of gamma-heating traverses (obtained using ionization chambers) in the CIRANO ZONA2A assembly (plutonium-oxide core surrounded by a fertile blanket) and ZONA2B (having the same core but with a steel/sodium reflector), it has been seen that absolute gamma-heating values in the
2 In SUPER-PHENIX, the ‘cold’ sodium coolant enters the sub-assemblies at the lower end and leaves them at the upper end at a higher temperature, thus evacuating the produced heat.

14 Chapitre 2
steel/sodium reflector and in the fertile blanket are almost the same. Based on this, it seems justified to take the VASCO uncertainty on gamma heating in the first row of the fertile blanket, i.e. 7.5 % (1 σ) 3, as target accuracy for the steel/sodium reflector.
2) Target accuracy for diluent sub-assemblies: For diluent sub-assemblies in SUPER-PHENIX, the VASCO uncertainty is 12.5 %. However, in CAPRA cores, there are significantly more diluents present than in the current SUPER-PHENIX core configuration, and a better performance of the formulaire is desirable. As indicated in Table 2-11, gamma-heating measurements were performed in the central steel/sodium diluent of the BALZAC1-DE1 configuration, and the corresponding VASCO uncertainty was 7.5 %. It thus seems reasonable to take 7.5 % as the target precision for diluents in CAPRA configurations.
For the core, the performance of the VASCO formulaire is about 5 %. As gamma heating contributes about the same amount to total heating in CAPRA cores as in the case of SUPER-PHENIX cores, 5 % can be taken as the target accuracy in the core region of plutonium-burning FRs.
To achieve the above target accuracies, an effort was made in this thesis work to achieve an experimental uncertainty lower than 7.5 % in the non-fuel regions (reflectors) and less than 5 % in the core.
2.2 The MASURCA Facility and the CIRANO Experimental Programme
The critical facility MASURCA (MAquette de SURgénérateur à Cadarache) is dedicated to neutronic studies of FR lattices. It is intended to provide experimental results for the development and validation of nuclear data and calculational tools needed for the design of fast reactors.
Since its first start-up in 1966, many experimental programmes have been conducted at the MASURCA facility. The R-Z (1966 - 1973) and PLUTO (1973 - 1977) programmes provided the basis for the CARNAVAL III and IV data libraries used for the design of the PHENIX and SUPER-PHENIX reactors. RACINE (1976 - 1984) was devoted to the study of a heterogeneous core concept for SUPER-PHENIX 2, and supported the start-up of SUPER-PHENIX. The BALZAC (1984 - 1988) programme had among other objectives the study of phenomena related to the heterogeneity of control rods and sub-critical diluent assemblies. During the CONRAD programme (1989 - 1992), the axially heterogeneous core concept was studied. BERENICE (1993) was related to investigations of the delayed neutron fraction. The latest experimental programme, CIRANO, is detailed in § 2.2.2.
3 Throughout this thesis, all uncertainties are given as 1 standard deviation (1 σ).

General Background 15
2.2.1 The MASURCA Facility
The overall concept of the MASURCA facility [15] is shown in Figure 2-4. The core is built by assembling (wrapper) tubes having a square section (10.5 x 10.5 cm) and a length of about 4 m. The tubes are filled with rectangular or cylindrical rodlets of various compositions and lengths (between 4 and 24 inches4) as shown in Figure 2-5. The cylindrical shape is used for fissile materials, the rectangular shape for sodium, fertile and structural materials. The rodlets have a lateral dimension of 1/2 inch (1.27 cm), thus leading to a lattice of 8 x 8 rodlets inside the tubes. The tubes can also be filled by rectangular plates of 2 x 2 inch lateral dimensions or blocks of square section (4 x 4 inch). Once the tubes have been charged as desired, they are suspended vertically from an upper horizontal steel plate, which is supported by a structure made out of concrete. When setting up a new core, the tubes are loaded from the bottom to prevent an increase in reactivity should one of the tubes fall during loading. Once the whole core is assembled, it is closed at the bottom by another plate.
The core can be composed of up to 1116 tubes. This and the fact that each tube can be charged individually leads to a high degree of adaptability for the MASURCA installation and allows the study of a large variety of core designs.
The safety system consists of absorber rods in varying number depending on core type and size. The safety rods are composed of fuel material in their lower part (charged in the same way as for the fissile material containing tubes) and absorber material in their upper part, so that the homogeneity of the core is kept when the rods are withdrawn. The safety rods fall into the reactor by gravity. Once they are withdrawn from the core, the use of a pilot rod (having a maximal worth of 0.5 $) allows the reactor to become critical.
The neutron flux is monitored using 10 - 12 fission chambers and BF3 counters of various diameters and lengths, and thus of different sensitivities. They are placed at various locations covering the mid-plane of the core, blanket/reflector and shielding regions.
Various experimental channels can be installed to allow in-situ measurements. Two radial channels can be accommodated traversing the core in the N-S and the E-W directions. They are separated axially by about 10 cm and cross the core close to the mid-plane. The channels have 11.6 mm x 11.6 mm square cross-sections. Axially, one or several measuring channels can be installed in each MASURCA tube, replacing the tube rodlets at the channel position. Such channels have 12.3 mm x 12.3 mm square cross-sections.
4 1 inch = 2.54 cm

16 Chapitre 2
Figure 2-4: The MASURCA facility.
Figure 2-5: Charging of a MASURCA tube using fissile (rectangular) and non-fissile (square) rodlets of 1.27 cm x 1.27 cm lateral dimensions.
1 Sliding Shield 2 Source 3 Biological Shielding 4 Fast Rod Mechanism 4 Slow Rod Mechanism 6 Regulating Rod Mechanism 7 Level + 4.94 m 8 Fast Rod 9 Slow Rod 10 Regulating Rod 11 Hanging Nozzle 12 Tube 13 Core Outlet Air Cooling 14 Core Inlet Air Cooling 15 Moving Biological Shielding 16 Radial Chanal 17 Centering Plate 18 Level 0.00 m 19 East XY Handling Arm 20 XY Carriage 21 East Vertical Tube Storage 22 West Vertical Tube Storage 23 Centering Plate Mechanism 24 Rocking-Lever 25 Tube Head

General Background 17
2.2.2 The CIRANO Experimental Programme
The CIRANO experimental programme at the MASURCA facility was proposed in support of the CAPRA project and dedicated to the study of characteristics relevant to plutonium and minor actinide burning cores (removal of the fertile blankets, variation of the plutonium isotopic vector and increased plutonium enrichment). The main aims have been 1) to study the consequences related to the planned transformation of the existing PHENIX and SUPER-PHENIX plants into CAPRA-type cores, in order to ensure meeting the necessary safety and operational constraints, and 2) to provide relevant experimental results for code and data validation. Three major phases of the programme have been completed so far.
Phase 1 was devoted to studying the effects of removing the blankets and replacing them with reflectors, which is the first step to be taken when converting a breeder reactor into a plutonium burner. Three successive cores were built with the same Pu-enrichment (27 %) and isotopic vector (Pu240 fraction of 19 %). ZONA2A had radial and axial blankets, ZONA2A3 radial reflector and axial blankets, and ZONA2B radial and axial reflectors.
Phase 2 was devoted to the measurement of effects on the internal storage, as the replacement of the fertile blankets leads to a significant increase of heating before, at and beyond the internal storage position, as well as to an increase of the secondary sodium activation. Three successive cores were built with Pu-enrichment and isotopic vectors identical to Phase 1. ZONA2B-SIREF was similar to ZONA2B, but with the steel/sodium reflector extended at one side of the core; ZONA2B-SI1 had moreover a row of fuel assemblies placed at around 108 cm from the core center. These fissile tubes represent fuel assemblies removed from the core and put into a temporary storage position for cooling down before taking out of the reactor; ZONA2B-SI2 had an additional row of B4C between the core and this internal storage location. These configurations were representative of an internal storage configuration of PHENIX.
Phase 3 was devoted to studying fuel compositions of higher Pu-enrichment (with corresponding higher dilution) and different isotopic vectors. As mentioned earlier, a high Pu-enrichment (EPu up to 45 %) is proposed in the CAPRA project in order to get high plutonium burning rates. As it is planned to burn mainly low-grade plutonium originating from operating LWRs, the Pu240 content will be higher in a CAPRA core (33 % Pu240) than in SUPER-PHENIX (8 % Pu240). Substitution of various fuel types was undertaken in a small central zone (∅ ≅ 30 cm) of the ZONA2B configuration. The substitution "zones" were ZONA2A POA (EPu 27 %, Pu240 fraction 8 %) and ZONA2 P2K POA (EPu 30 %, Pu240 fraction 35 %) to study the effect of the Pu240 fraction. In ZONA2 K (EPu 26 %, Pu240 fraction 8 %, use of PuO2/UO2 plates) and in ZONA2 W (EPu 33 %, Pu240 fraction 16 %, Pumetal plates), the effects of using plates instead of the usual rodlets, were investigated. The use of plates is necessary as the available MASURCA rodlets do not allow to assemble cells with higher plutonium enrichments than 27 %. Cells ZONA5K (EPu 44 %, Pu240 fraction 14 %) , ZONA4K (EPu 53

18 Chapitre 2
%, Pu240 fraction 16 %), ZONA4 (EPu 54 %, Pu240 fraction 19 %) were used to study the effect of increasing Pu-enrichment.
A fourth phase of experiments was initially planned to study a full-core simulation of a CAPRA core. Due to changing priorities, this phase has not yet been accomplished.
Experiments performed during the CIRANO programme include the determination of the critical radius, reaction rate traverses, spectral indices, reactivity worths of substitution zones, and Na void coefficients. Extensive gamma heating measurements were done during Phases 1 and 2, as well as in the ZONA5K substitution configuration, using ionization chambers (radial and axial traverses) and thermoluminescent dosimeters (radial traverses in the N-S channel).
2.3 Gamma-Ray Physics in Fast Reactors
The basic physics of gamma heating in fast reactors is reviewed in this section. Firstly, the different mechanisms of gamma-ray production and their spatial distributions are discussed. Then, the different types of interactions of importance for gamma propagation and energy deposition are listed. The results of certain numerical investigations on gamma transport in FR configurations and materials are presented. Finally, the gamma-heat deposition, which is in fact a two-step process involving the production of secondary electrons, is explained.
2.3.1 Gamma-Ray Sources
The gamma-ray sources of importance in a FR are the gammas emitted in fission, capture and inelastic interactions of neutrons with the fuel or the structural materials. The intensity and the emission spectrum depends on the target isotope, the interaction type and the energy of the incident neutron. These various neutron-induced gamma sources are discussed individually later in this section.
Other gamma-ray sources are annihilation radiation, fluorescence gammas and bremsstrahlung. In a FR, these radiations result primarily from the interaction with matter of electrons created through gamma interactions. Thus, they are part of the so-called secondary gamma source. They can be taken into account in the transport calculations through inclusion into the transfer matrices [16]. However, this is usually only done for the energetic (511 keV) electron-positron annihilation gamma rays. In FR applications, the propagation of bremsstrahlung and fluorescence gammas is usually neglected as these low-energy gamma rays are easily absorbed and can be regarded as locally deposited. Moreover, bremsstrahlung is important only for electron energies above 10 MeV. Most of the primary gammas in a FR have energies below 10 MeV and cannot create such energetic electrons.
Annihilation and bremsstrahlung radiations can also be produced through the interaction of charged particles emitted in the disintegration process of radioactive isotopes, but these
sources can be neglected. In fact, β+ emitters leading to annihilation gammas are rare in a
reactor (fission and neutron capture reactions tend to lead to isotopes with a surplus of

General Background 19
neutrons, i.e. to β− emitters). On the other side, active isotopes with emitted electron energies
greater than 10 MeV are rare and therefore the bremsstrahlung is not important.
2.3.1.1 The fission reaction
One distinguishes between prompt and delayed fission gamma rays. The prompt gamma rays from fission are emitted in apparent coincidence with the fission event (within 10-8 s). Following fission, the fission fragments are unstable and may emit at least one gamma while decaying (delayed gamma rays). The period over which the corresponding energy is released is determined by the half-lives of the nuclei in the decay chains. A theoretical shape of the prompt emission spectrum was proposed by Fort and Long [17]:
P E
E
EE
N
E
C
N
E
t
t
p
( )
.
.
/
,
,
γ
γγ
γ
γγ
γ
γ
γ
γ γ
ν
energy distribution for single quantum emission
=e
for E MeV
P(0.7 MeV) for E MeV
with
= average energy of the emitted quantum =
= average emitted total prompt gamma energy
= C
= average number of emitted quanta
-E
1
=
< >>
≤
< >< >< >
< >
⋅ +
< >
< >0 7
0 7
2
(2-1)
In this formalism, prompt neutron and gamma emissions in fission are treated in a
consistent way. The total prompt gamma fission energy (and the associated emission spectra) depend on the energy of the incident neutron through the introduction of the energy
dependence on the number of prompt neutrons, νp. For Pu239, for example, we find an average
total prompt energy of 6.74 MeV at thermal incident neutron energy (C1 = 0.815 MeV, C2 =
4.4 MeV, νp = 2.876, <Nγ> = 6.497). The average energy of the emitted gammas is then 1.04
MeV, a rather low value compared to the usually more energetic gammas emitted in neutron capture (§ 2.3.1.2). Note that although C1 and C2 are two isotope dependent constants, the formalism can be applied to all fissile isotopes. In particular, the shape of the emission spectrum is the same for all fissile nuclides, which is consistent with earlier findings [18].
The delayed spectrum is made up from a large number of gamma rays and can be taken as continuous. The number of emitted gammas and their energies depend on the fission-product yields and the decay data of the various isotopes involved in the decay chains. When a reactor is operated for a sufficiently long period at constant flux level, the delayed emission spectrum
20 Chapitre 2
will tend towards an asymptotic shape due to stabilization of the fission-product population (§ 3.2.4.3). The delayed emission spectrum at saturation and the prompt fission spectrum were reported to be similar in shape [19]. This was confirmed in the present work (§ 3.2.4).
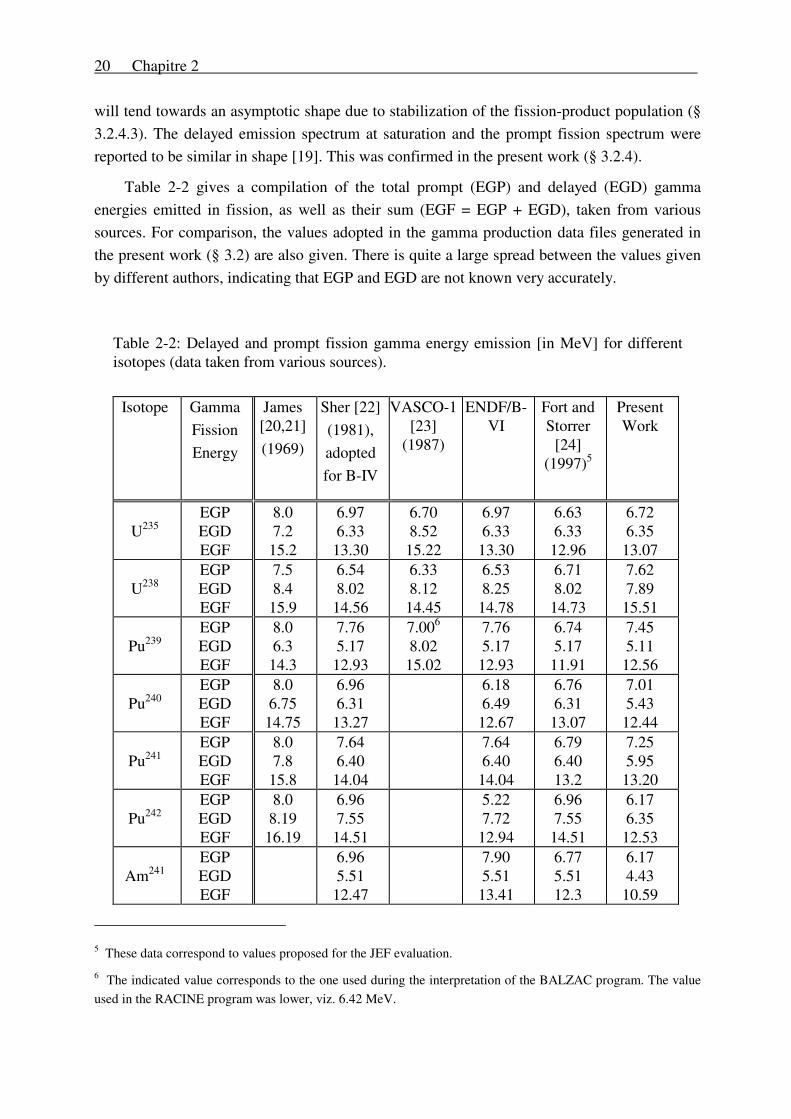
Table 2-2 gives a compilation of the total prompt (EGP) and delayed (EGD) gamma energies emitted in fission, as well as their sum (EGF = EGP + EGD), taken from various sources. For comparison, the values adopted in the gamma production data files generated in the present work (§ 3.2) are also given. There is quite a large spread between the values given by different authors, indicating that EGP and EGD are not known very accurately.
Table 2-2: Delayed and prompt fission gamma energy emission [in MeV] for different isotopes (data taken from various sources).
Isotope Gamma
Fission Energy
James [20,21] (1969)
Sher [22] (1981), adopted for B-IV
VASCO-1 [23]
(1987)
ENDF/B-VI
Fort and Storrer
[24] (1997)5
Present Work
U235
EGP EGD EGF
8.0 7.2
15.2
6.97 6.33
13.30
6.70 8.52
15.22
6.97 6.33
13.30
6.63 6.33
12.96
6.72 6.35
13.07
U238 EGP EGD EGF
7.5 8.4
15.9
6.54 8.02
14.56
6.33 8.12
14.45
6.53 8.25
14.78
6.71 8.02
14.73
7.62 7.89
15.51
Pu239 EGP EGD EGF
8.0 6.3
14.3
7.76 5.17
12.93
7.006 8.02
15.02
7.76 5.17
12.93
6.74 5.17
11.91
7.45 5.11
12.56
Pu240 EGP EGD EGF
8.0 6.75 14.75
6.96 6.31
13.27
6.18 6.49
12.67
6.76 6.31
13.07
7.01 5.43
12.44
Pu241 EGP EGD EGF
8.0 7.8
15.8
7.64 6.40
14.04
7.64 6.40
14.04
6.79 6.40 13.2
7.25 5.95
13.20
Pu242 EGP EGD EGF
8.0 8.19 16.19
6.96 7.55
14.51
5.22 7.72
12.94
6.96 7.55
14.51
6.17 6.35
12.53
Am241 EGP EGD EGF
6.96 5.51
12.47
7.90 5.51
13.41
6.77 5.51 12.3
6.17 4.43
10.59
5 These data correspond to values proposed for the JEF evaluation.
6 The indicated value corresponds to the one used during the interpretation of the BALZAC program. The value used in the RACINE program was lower, viz. 6.42 MeV.

General Background 21
2.3.1.2 Neutron capture
The initial result of a neutron capture event is the formation of an excited compound nucleus. This nucleus can lose its excitation energy in various ways, i.e. through emission of different types of radiation ( α, β , γ , etc.). If deexcitation occurs through the emission of
gammas only, one speaks of neutron radiative capture. The gamma emission is prompt emission, i.e. takes place about 10-12 s after the capture event. Only a few elements emit a single gamma ray, and deexcitation usually goes through intermediate excited states producing up to four gammas. As the nuclear level scheme is characteristic of each nucleus, the emission spectrum depends on the target isotope. It also depends on the incident neutron energy which determines the level to which the compound nucleus is excited. The energy liberated is equal to the neutron binding energy Bn (in the compound nucleus) plus the kinetic energy of the incident neutron7. The binding energy varies between 2.2 MeV (hydrogen) and 11 MeV (silicon) and lies on average between 6 - 7 MeV. It can be determined precisely (by comparing the rest masses of the target and the compound nuclei) and thus the total gamma energy emitted in radiative neutron capture (EGC) is well know. Table 2-3 gives the EGC values for the most important nuclides in FR studies for thermal incident neutron energy.
Table 2-3: Total gamma energy emitted in radiative capture of thermal neutrons.
Isotope EGC [MeV] Isotope EGC [MeV] Isotope EGC [MeV] B10 11.46 Cr54 6.246 Ni62 6.839
B11 3.370 Mn
7.270 Ni64 6.098
C 4.947 Fe54 9.299 U235 6.545
O16 4.143 Fe56 7.646 U238 4.806
Na23 6.959 Fe57 10.04 Pu239 6.534
Al 7.724 Fe58 6.581 Pu240 5.242
Cr50 9.261 Ni58 9.000 Pu241 6.301
Cr52 7.940 Ni60 7.820 Pu242 5.034
Cr53 9.719 Ni61 10.60 Am241 5.541
The capture emission spectrum is in general harder than the fission or inelastic emission spectrum. Further, capture spectra of structural elements are harder than those of fissile and fertile isotopes.
After deexcitation through gamma emission, the compound nucleus may be unstable (due to the surplus of neutrons) and may decay further on through β− emission. In most cases, such
7 The recoil of the compound nucleus is neglected.

22 Chapitre 2
decay is accompanied by the emission of the so-called radioactive decay or activation gammas. In a FR, the most important activation gammas arise through the decay of U239/Np239 (activation of U238), Na24 (activation of Na23) and Mn56 (activation of Mn55). Other isotopes can be activated, but these can usually be neglected due to one of the following reasons: a low activation cross-section, a long half-life, a low gamma-emission probability, or emission of low-energy gammas deposited locally.
Gamma rays can also be produced through capture reactions such as (n, α), (n,p), (n,t), etc. However, thresholds for these reactions are high and cross-sections low, making their contributions negligible in most situations. An exception is the B10(n,α) reaction. This reaction is possible even at thermal incident neutron energy and is important in control rods. In 93 % of the reactions, the capture leads to an excited Li7 nucleus which deexcites through the emission of a 0.478 MeV gamma.
2.3.1.3 Inelastic scattering
When a neutron undergoes inelastic scattering, it is first captured to form a compound nucleus. A neutron of lower kinetic energy is then expelled, leaving the target nucleus in an excited state. The target nucleus returns to its ground state by emitting one or more gamma rays approximately 10-14 s after the scattering event. The gamma emission energy corresponds to the excitation energy of the target nucleus, the emission spectrum depending on its nuclear level and decay scheme. Depending on the incident neutron energy, the nucleus can be excited to various states. Emission energy and spectrum are thus also dependent on the incident neutron energy. Finally, excitation can only take place at an incident neutron energy which is greater than the threshold energy Es given by Es=(1+1/A)El, where E1 is the energy of the first excited state and A corresponds to the number of nucleons in the target isotope. Therefore, inelastic gamma production only takes place if the incident neutron spectrum is hard enough.
2.3.1.4 Gamma-source components and distributions in fast reactors
It has been seen in the preceding paragraphs that gammas in a (fast) reactor originate mainly from fission, capture and inelastic neutron interactions with various target nuclides. The total gamma source is the sum of all the different contributions.
Table 2-4 shows the relative contributions (separately for each isotope and reaction type) to the total (integrated over the whole volume) gamma energy source (i.e. the energy emitted in the form of gammas) in the plutonium oxide core, the radial steel/sodium reflector and the radial shielding region of the ZONA2B assembly of the MASURCA fast critical facility (see § 4.3.2.1 for a detailed description). The results were obtained through the application of the calculational method implemented in this thesis (Chapter 3). In the core region, fission is the dominant production process and contributes 66 % to the total source. 21 % of the source is due to neutron captures and 13 % due to inelastic scattering. Delayed production is important and amounts to 29 %. Fissile isotopes contribute 93 % of the total source. In the reflector and

General Background 23
shielding regions, only neutron capture and inelastic scattering produce gammas. In both these regions, the dominant production process is neutron capture. Inelastic scattering contributes 22 % in the reflector. Its contribution is almost negligible (1%) in the shielding region due to the slowing down of the neutrons while traversing the reflector (a soft spectrum enhances captures, and inelastic scattering is only possible above the reaction threshold). As regards the overall gamma production in the various regions, the most important isotopes are Pu239 (41 % of the total), Fe56 (18 %) and U238 (17 %).
Table 2-5 gives the different contributions to the total source for the inner core, the central diluent and the reflector region of the CAPRA 4/94 Reference Core. In the core region, the importance of the different reactions to the total gamma source is similar to those in ZONA2B (fission 63.7 %, capture 24.2 %, inelastic scattering 11.7 % ). Compared to ZONA2B, the importance of Pu239 and U238 is less pronounced, with Pu240, Pu241 and Pu242 being significantly more important. The structurals (e.g. Fe56) also contribute more. In the reflector region, the situation is essentially the same as in the ZONA2B reflector. In the central diluent, the inelastic scattering source (44.5 %) is almost as important as capture (55.5 %) due to the relatively hard neutron spectrum. The most important isotopes determining the total gamma source over the various regions are Pu239 (37 %), Pu241 (17 %), U238 (13 %), Fe56 (9 %) and Pu240 (8 %).
The gamma production at a given position depends on the neutron flux and the medium composition at this point. Both these quantities vary spatially and thus both the gamma source intensity and the emission spectrum are space-dependent. Figure 2-6 shows the spatial variation of the total gamma energy emission per unit volume resulting from fission, capture and inelastic scattering reactions along the core mid-plane of the ZONA2B assembly. In the core, the relative intensities due to the different reactions remain constant. All sources decrease towards the reflector according to the decrease of the neutron flux. After the core, there is a strong decrease of the total source as there are no fission reactions anymore. In the reflector, the inelastic contribution decreases continuously due to the slowing down of the neutrons. This slowing down has the opposite effect for the neutron capture contribution. The latter first rises in the reflector and then decreases following the attenuation of the neutron flux.
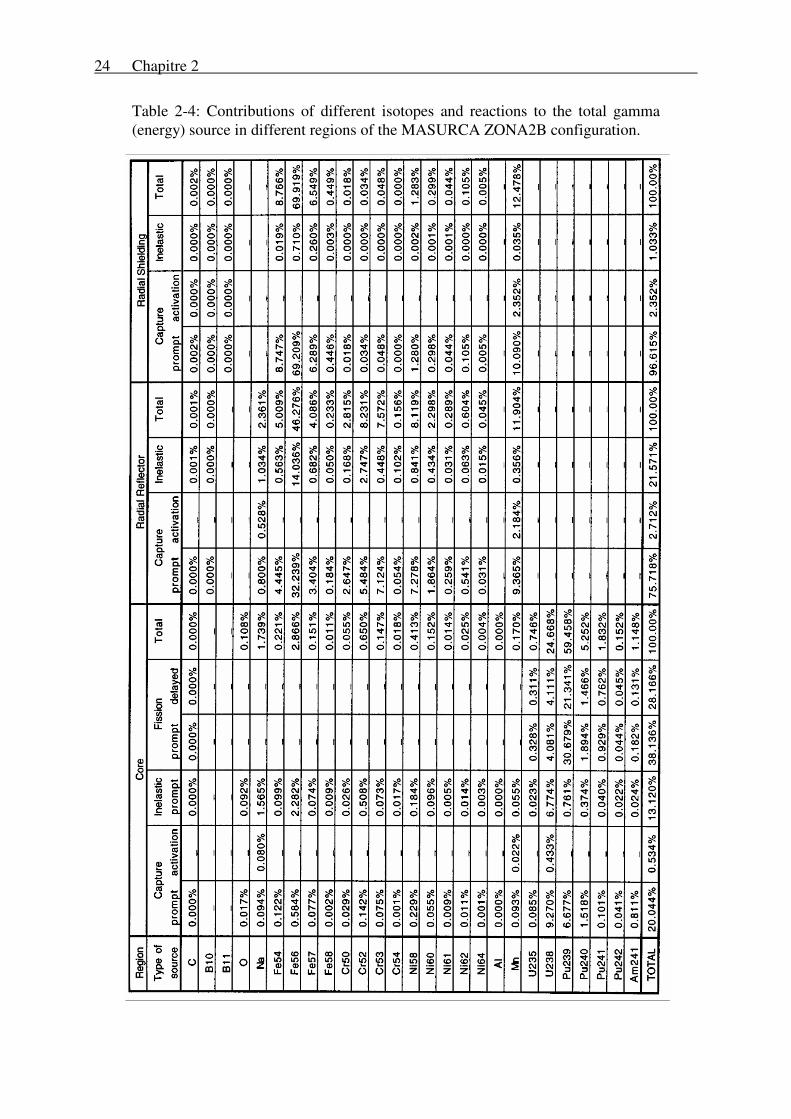
24 Chapitre 2
Table 2-4: Contributions of different isotopes and reactions to the total gamma (energy) source in different regions of the MASURCA ZONA2B configuration.

General Background 25
Table 2-5: Contributions of different isotopes and reactions to the gamma (energy) source in different regions of the CAPRA 4/94 Reference Core.
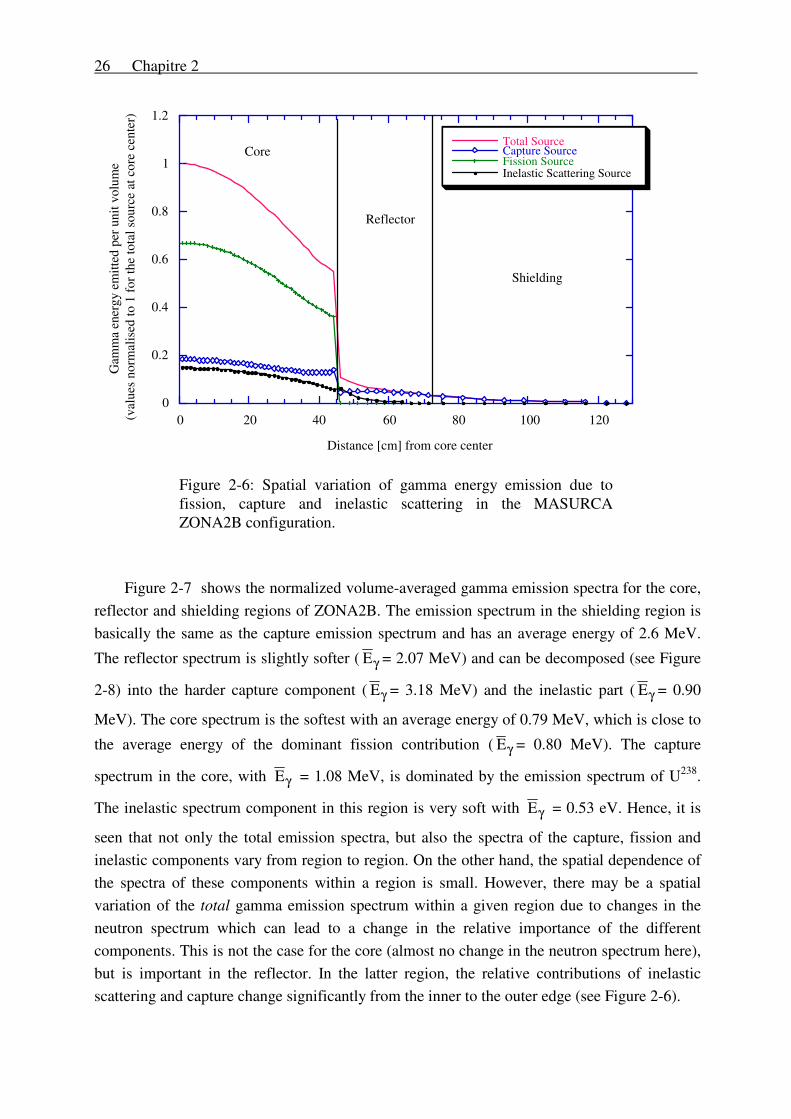
26 Chapitre 2
0
0.2
0.4
0.6
0.8
1
1.2
0 20 40 60 80 100 120
Total SourceCapture SourceFission SourceInelastic Scattering Source
Gam
ma
ener
gy e
mitt
ed p
er u
nit v
olum
e(v
alue
s no
rmal
ised
to 1
for t
he to
tal s
ourc
e at
cor
e ce
nter
)
Distance [cm] from core center
Reflector
Core
Shielding
Figure 2-6: Spatial variation of gamma energy emission due to fission, capture and inelastic scattering in the MASURCA ZONA2B configuration.
Figure 2-7 shows the normalized volume-averaged gamma emission spectra for the core, reflector and shielding regions of ZONA2B. The emission spectrum in the shielding region is basically the same as the capture emission spectrum and has an average energy of 2.6 MeV.
The reflector spectrum is slightly softer ( Eγ = 2.07 MeV) and can be decomposed (see Figure
2-8) into the harder capture component ( Eγ = 3.18 MeV) and the inelastic part ( Eγ = 0.90
MeV). The core spectrum is the softest with an average energy of 0.79 MeV, which is close to
the average energy of the dominant fission contribution ( Eγ = 0.80 MeV). The capture
spectrum in the core, with Eγ = 1.08 MeV, is dominated by the emission spectrum of U238.
The inelastic spectrum component in this region is very soft with Eγ = 0.53 eV. Hence, it is
seen that not only the total emission spectra, but also the spectra of the capture, fission and inelastic components vary from region to region. On the other hand, the spatial dependence of the spectra of these components within a region is small. However, there may be a spatial variation of the total gamma emission spectrum within a given region due to changes in the neutron spectrum which can lead to a change in the relative importance of the different components. This is not the case for the core (almost no change in the neutron spectrum here), but is important in the reflector. In the latter region, the relative contributions of inelastic scattering and capture change significantly from the inner to the outer edge (see Figure 2-6).

General Background 27
0
0.05
0.1
0.15
0.2
0.25
0.01 0.1 1 10
ShieldingCoreReflector
Num
ber o
f gam
mas
em
itted
in th
e gr
oup
Group energy boundaries [MeV]
Figure 2-7: Normalized volume-averaged gamma emission spectra in the ZONA2B assembly.
0
0.05
0.1
0.15
0.2
0.25
0.3
0.35
0.4
0.01 0.1 1 10
Inelastic ScatteringNeutron Capture
Num
ber o
f gam
mas
em
itted
in th
e gr
oup
Group energy boundaries [MeV]
Figure 2-8: Normalized volume-averaged inelastic scattering and neutron capture emission spectra in the radial reflector region of ZONA2B.

28 Chapitre 2
It is important to note that the emission spectrum differs from the gamma flux energy distribution. In particular, the average gamma energy is not the same. For example, the average emission energy in the ZONA2B core region is 0.79 MeV, whereas the average energy of the gamma flux spectrum is about 1.3 MeV. This reflects the spectrum hardening which occurs due to the considerable absorption of low-energy gammas by the high-Z fissile and fertile isotopes.
2.3.2 Gamma-Ray Interaction Processes
There are various ways in which gammas can interact with matter. The three dominant modes of interaction are 1) the photo-electric effect, 2) Compton (or incoherent) scattering and 3) pair production [25,26]. Each of these results in a transfer of energy to electrons, which then impart this energy to matter by excitation and ionization and thus contribute to heating. There are various other possible types of interactions (coherent or Rayleigh scattering, Thomson scattering from the nucleus, Delbrück or potential scattering, coherent molecular or crystal scattering, the nuclear photo-effect, nuclear scattering). In Rayleigh scattering, the gamma is scattered by the atom as a whole. The event is elastic in the sense that the gamma essentially loses none of its energy. The atom moves just enough to conserve momentum. The effect is of minor importance because the gamma is usually deviated only through a small angle and there is no contribution to heating. The other types of interactions mentioned occur to some extent in the energy range of interest (below 10 MeV), but are usually so infrequent that they can be neglected.
0.0001
0.01
1
100
104
0.01 0.1 1 10
Coherent ScatteringCompton ScatteringPhotoelectric AbsorptionPair ProductionTotal
Mic
rosc
opic
cro
ss-s
ectio
n [b
arn]
Photon energy [MeV]
Figure 2-9: Gamma interaction cross-sections for iron.

General Background 29
In general, the total gamma cross-section, which is the sum of the cross-sections for different interactions, is a smooth function of the incident gamma energy and decreases from low to high gamma-energy values. As an example, Figure 2-9 shows the gamma interaction cross-sections for iron. At low energy, the interaction is dominated by the photoelectric process. The Compton process is the dominant interaction process over a wide energy range. Beyond the threshold energy of 1.02 MeV, pair production becomes important. It is worthwhile to note that the same cross-sections apply to all the isotopes of a given element since gamma interactions take place with the electrons (or the atom as whole) and not with the nucleus. In gamma-interaction tabulations, the cross-sections are thus given for the various elements. Finally, the total cross-section for a mixture of elements will simply be the sum of the different elemental contributions.
2.3.3 Propagation of Gamma Rays in Fast Reactor Media
The propagation of gammas through matter involves both diffusion (Compton scattering) and absorption (photoelectric effect, pair production) processes and is completely analogous to the propagation of neutrons. Like neutrons, gammas can be considered as neutral point-particles traveling quite large distances (typically on the order of centimeters) between successive interactions with the atoms (or electrons) of the medium. An exact formalism for describing the propagation of neutrons is provided by the neutron transport equation [27]. Without modification, the same formalism can be applied to determine the distribution of gammas in a reactor. Thereby, one usually takes the gamma production as a fixed external source, and one has to solve the transport equation in its inhomogeneous form.
In order to provide some indication for how far gammas can travel from their place of birth and the implication this has on the quantity of interest, viz. the gamma-heating, the following simple numerical investigations were carried out: A point source was placed at the center of a homogeneous sphere, and the total gamma heating was computed in concentric spherical layers of 0.5 cm thickness around the point source. The Monte-Carlo neutral particle transport code MCNP [28] was used for the simulation. Four different calculations were done. The attenuation was computed for two different emission spectra and for two different compositions of the sphere, viz. the homogeneous core and reflector compositions of ZONA2B. The two different emission spectra tested were the average core emission spectrum (with a mean energy of 0.79 MeV) and the harder source spectrum at the outer edge the
reflector ( Eγ = 2.5 MeV). The results are shown in Figure 2-10 which gives the percentage of
the total emission energy deposited in the various spherical layers around the source. Four main conclusions can be drawn: 1) The attenuation is approximately exponential. 2) The reflector spectrum, with a higher average energy, is slightly more penetrating. 3) The attenuation does not depend much on which of the two attenuating media is considered. 4) 98 % of the total core emission energy are deposited within a 18.5 cm thick layer around the source (within 14.5 cm for 95 %). For the reflector source, one needs a 22 cm thick sphere to
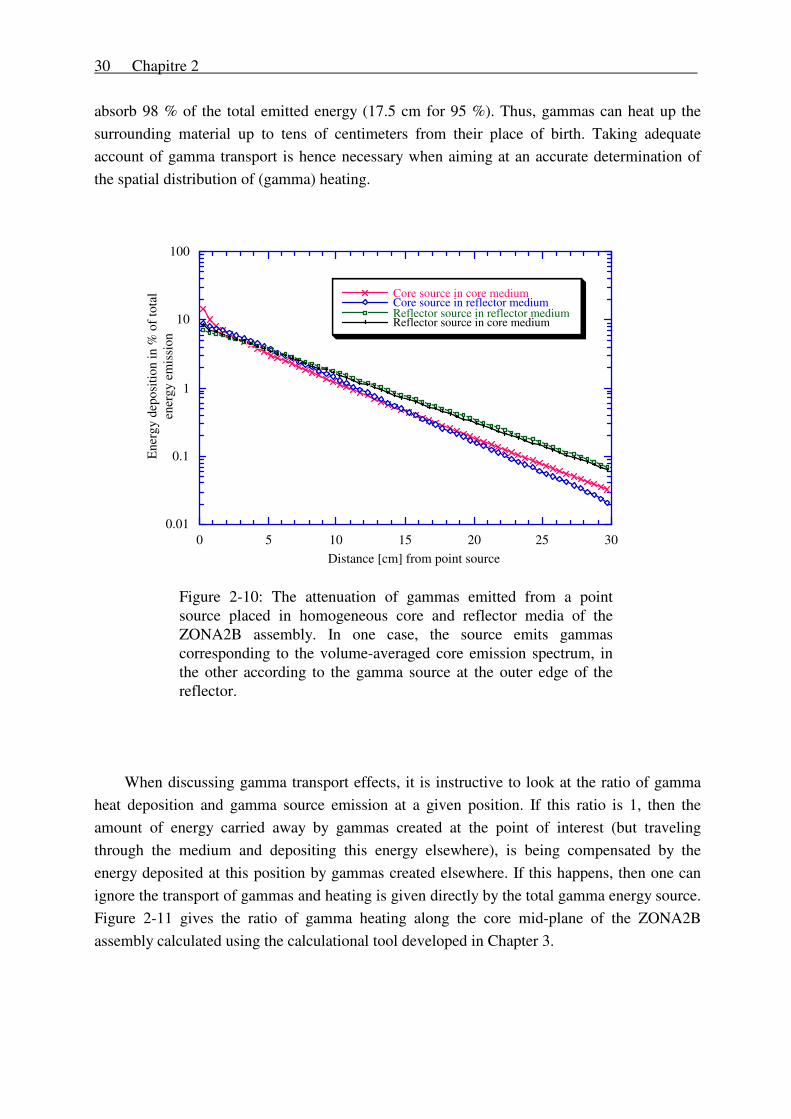
30 Chapitre 2
absorb 98 % of the total emitted energy (17.5 cm for 95 %). Thus, gammas can heat up the surrounding material up to tens of centimeters from their place of birth. Taking adequate account of gamma transport is hence necessary when aiming at an accurate determination of the spatial distribution of (gamma) heating.
0.01
0.1
1
10
100
0 5 10 15 20 25 30
Core source in core mediumCore source in reflector mediumReflector source in reflector mediumReflector source in core medium
Ene
rgy
depo
sitio
n in
% o
f tot
alen
ergy
em
issi
on
Distance [cm] from point source
Figure 2-10: The attenuation of gammas emitted from a point source placed in homogeneous core and reflector media of the ZONA2B assembly. In one case, the source emits gammas corresponding to the volume-averaged core emission spectrum, in the other according to the gamma source at the outer edge of the reflector.
When discussing gamma transport effects, it is instructive to look at the ratio of gamma
heat deposition and gamma source emission at a given position. If this ratio is 1, then the amount of energy carried away by gammas created at the point of interest (but traveling through the medium and depositing this energy elsewhere), is being compensated by the energy deposited at this position by gammas created elsewhere. If this happens, then one can ignore the transport of gammas and heating is given directly by the total gamma energy source. Figure 2-11 gives the ratio of gamma heating along the core mid-plane of the ZONA2B assembly calculated using the calculational tool developed in Chapter 3.
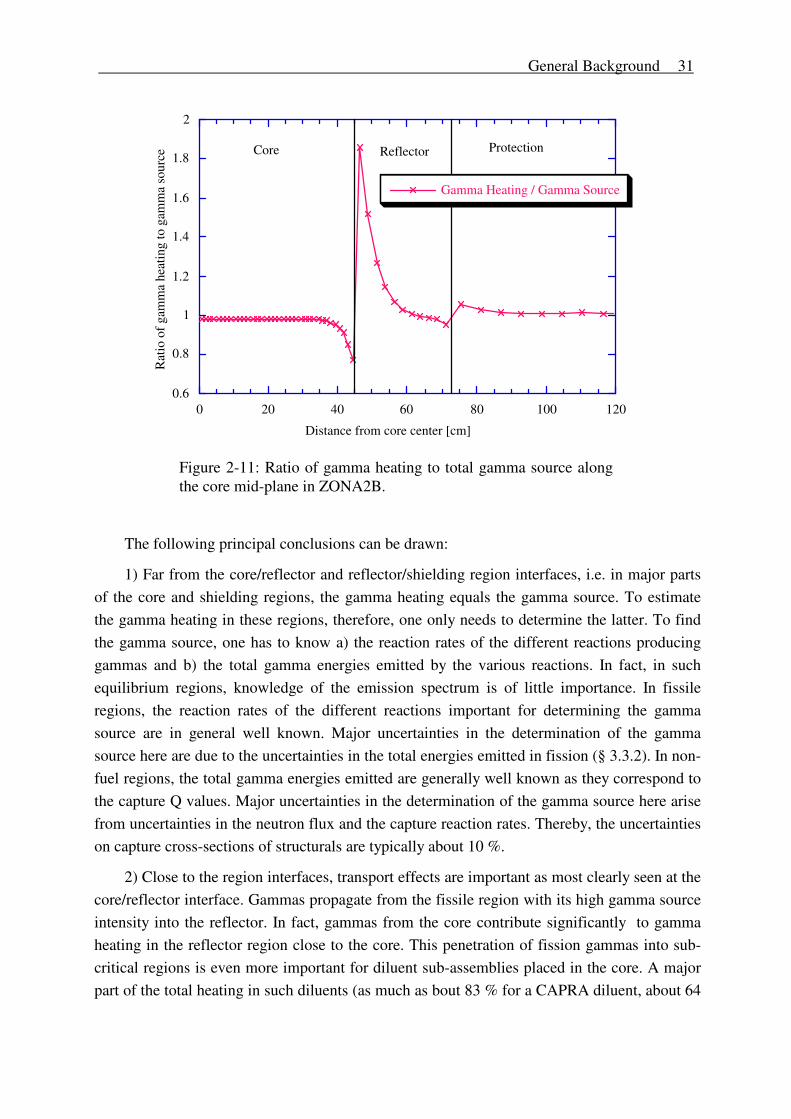
General Background 31
0.6
0.8
1
1.2
1.4
1.6
1.8
2
0 20 40 60 80 100 120
Gamma Heating / Gamma Source
Rat
io o
f gam
ma
heat
ing
to g
amm
a so
urce
Distance from core center [cm]
Core Reflector Protection
Figure 2-11: Ratio of gamma heating to total gamma source along the core mid-plane in ZONA2B.
The following principal conclusions can be drawn:
1) Far from the core/reflector and reflector/shielding region interfaces, i.e. in major parts of the core and shielding regions, the gamma heating equals the gamma source. To estimate the gamma heating in these regions, therefore, one only needs to determine the latter. To find the gamma source, one has to know a) the reaction rates of the different reactions producing gammas and b) the total gamma energies emitted by the various reactions. In fact, in such equilibrium regions, knowledge of the emission spectrum is of little importance. In fissile regions, the reaction rates of the different reactions important for determining the gamma source are in general well known. Major uncertainties in the determination of the gamma source here are due to the uncertainties in the total energies emitted in fission (§ 3.3.2). In non-fuel regions, the total gamma energies emitted are generally well known as they correspond to the capture Q values. Major uncertainties in the determination of the gamma source here arise from uncertainties in the neutron flux and the capture reaction rates. Thereby, the uncertainties on capture cross-sections of structurals are typically about 10 %.
2) Close to the region interfaces, transport effects are important as most clearly seen at the core/reflector interface. Gammas propagate from the fissile region with its high gamma source intensity into the reflector. In fact, gammas from the core contribute significantly to gamma heating in the reflector region close to the core. This penetration of fission gammas into sub-critical regions is even more important for diluent sub-assemblies placed in the core. A major part of the total heating in such diluents (as much as bout 83 % for a CAPRA diluent, about 64

32 Chapitre 2
% in a SUPER-PHENIX diluent subassembly8) is due to the gammas created in the surrounding core region. It follows that the accurate estimation of gamma heating here requires accurate determination of the gamma sources in the adjacent fissile region and adequate treatment of the gamma transport into the diluent. The latter computation requires the knowledge of the emission spectra involved.
2.3.4 Heat Deposition by Gamma Rays and Its Contribution to Total Heating
As indicated earlier, gamma heating is a two-step process. Gammas create secondary electrons (through the photoelectric effect, Compton scattering and pair production), which then lose their energy to matter in many successive interactions. However, when the dimensions of the problem of interest are much larger than the electron range, the transport of the electrons can be neglected and their energy can be assumed to be deposited at the place of their creation. This, in general, is the case for reactor studies, with the electron range being of the order of a few mm. The gamma-heating, which is proportional to the gamma flux, can then be obtained simply by multiplying the gamma flux with the gamma KERMA (Kinetic Energy Released to MAterial) factors according to:
H r E r N r K E ri i x
xiγ ( ) ( , ) ( ( ) ( , ))dE,& & & &= ⋅ ∑∑∫ Φ (2-2)
where N ri ( )
&
is the number density of element i, K Ei x, ( ) the gamma KERMA factor for
element i and reaction x at incident energy E, and Φ( , )E r&
is the gamma scalar flux. Note that
in reactor studies, KERMA is used just like a microscopic reaction cross-section except that its unit is energy-cross-section (usually [eV-barns]). The gamma KERMA (can be obtained from the basic gamma interaction cross-sections according to: K E r E E E E ri x i x i x, , ,( , ) ( ( )) ( , )
& &= − ⋅ σ (2-3)
where σi x E, ( ) is the microscopic cross-section and E Ei x, ( ) the average energy of the gammas
produced as a consequence of reaction type x. For the different gamma interactions of interest, one has:
8 estimated using the RZ model of CAPRA 4/94 shown in Figure 2-3 and the RZ model of SUPER-PHENIX shown in Figure 5-10, and the calculational tool developed in this work
General Background 33
E
E E
E E E E E E
E
i p e
i c s
i i s i s i s
i p p
, . .
, . .
, . . . . . .
, . .
( , )d / ( )
.
=
=
= ′ ′ ′
=
∞∫
0
10220070
σ σ
MeV
(2-4)
where p.e. stands for the photoelectric effect, c.s. for coherent scattering, i.s. for incoherent (Compton) scattering, and p.p. for pair production.
In tabulations of gamma interaction data, one does not usually find the gamma KERMA factors but rather quantities of dosimetric interest such as the mass energy-transfer coefficient µtr/ρ)i(E) or the mass energy-absorption coefficient µen/ρ)i(E). The KERMA factors are related to the mass energy-transfer coefficients by:
µρtr
iA
ii x
xE
ENM
k E) ( ) ( ),= ⋅ ∑1 (2-5)
where Mi is the atomic mass of element i and NA the Avogadro constant.
Total heating in a reactor can be divided into neutron heating and gamma heating. In a FR without fertile blankets (ZONA2B is taken as representative), heating due to gammas accounts for about 13 % of total heating but can be much more important locally. In particular, gamma heating is the dominant component to heating in non-fuel regions such as diluents or the reflector. Figure 2-12 shows both neutron and gamma heating along the radial mid-plane in the ZONA2B configuration. The relative contribution of gamma heating to the total heating is indicated as well. Neutron heating is dominant in the core. In the reflector and the shielding, the situation is reversed. In general, gamma heating is an important contribution to heating in all non-fissile regions (see, for example, Table 2-1).
If the dimensions of the problem of interest are small compared to the electron range9, then the transport of the secondary electrons has to be taken into account. The determination of the spatial distribution of heating due to gammas becomes a coupled gamma-electron problem. In the present studies, this was the case in the context of using thermoluminescent dosimeters (of dimensions 1 mm x 1 mm x 6 mm). The transport of electrons (and other charged particles) is fundamentally different from that of neutral particles because it is dominated by the long-range Coulomb force, resulting in large numbers of small interactions. It is convenient to think of the particle as losing its kinetic energy gradually in a friction-like process. Thereby, the predominant mechanism for energy transfer to matter at reactor energies is provided by 9 In iron, electron ranges are 0.5 cm at 6 MeV, 0.17 cm at 2 MeV, 0.08 cm at 1 MeV, 0.04 cm at 0.6 MeV and 0.008 cm at 0.2 MeV.

34 Chapitre 2
inelastic collisions with atomic electrons, the incident electron both losing energy and changing direction. If the energy transferred to an electron is only enough to raise it to a higher energy level in the atom, the process is called excitation (or soft collision). However, if the electron can separate completely from the atom, the process is called ionization (hard collision). Energetic electrons that are ejected in the process are termed delta-rays.
10 -6
10 -5
0.0001
0.001
0.01
0.1
1
1
10
102
0 20 40 60 80 100 120
Neutron heatingPhoton heating
% of gamma heating in total
Nor
mal
ized
hea
ting
per u
nit v
olum
e % of gam
ma heating in total heating
Distance [cm ] from core center
Core Reflector Shielding
Figure 2-12: Neutron and gamma heating (total normalized to unity at core center) along the mid-plane of the MASURCA ZONA2B configuration. The relative contribution of gamma heating to the total heating is also indicated.
2.4 A Review of Earlier Gamma-Heating Experiments and Calculations for Fast Reactors
In the past, gamma-heating experiments have been carried out in various facilities in order to validate the adequacy of calculational methods and data intended for the design of conventional fast breeder reactors. Below, selected gamma-heating measurements and their analysis in four different experimental facilities are described.
2.4.1 ZPPR
Gamma-heating measurements were done by Simons and Olson in Assembly 2 of the Zero Power Plutonium Reactor (ZPPR, USA) in the early seventies [29]. Measurements were done in three different loadings. Loading 90 was a clean PuO2/UO2 fueled core (containing

General Background 35
sodium as coolant), surrounded by radial and axial blankets and having a reflector (~ 12 cm thick) on the outside. Gamma heating was determined radially and axially using Li7F TLDs embedded in stainless steel sleeves. Loading 156 had a B4C-sodium control-rod-mockup at its center. TLDs were irradiated inside the control rod mock-up embedded in a B4C holder, and just outside the rod region in a Teflon holder. Loading 157 was a tantalum-sodium mock-up and measurements were conducted in a manner similar to the B4C-sodium rod experiments, with the TLDs irradiated in the rod region surrounded by tantalum.
For all measurements, the doses in the surrounding walls were obtained by applying Burlin cavity theory as described by Simons and Yule [30] (see also § 4.4.1.2.). The effect of correcting for the neutron contribution was estimated, but the correction was not explicitly applied because the neutron sensitivity of the TLDs employed was not known precisely. The correction for non-saturation of the delayed emission, assumed in the calculations, was avoided by letting the TLDs remain in the reactor for 44 hours after the irradiation. The reactor background emission10 was estimated by a supplementary measurement. Furthermore, it was found that the delayed activity which would have been missed if the TLDs had been removed soon (30 min.) after reactor shut-down would have been 6 % in the core, 10 % in the axial blanket and 8 % in the axial reflector.
The neutronics and gamma-related calculations were done in RZ geometry using the DOT SN transport code [31] . For the neutron flux calculations, self-shielded multi-group cross-sections generated from ENDF/B-I were used. From the neutron reaction rates, the gamma sources were generated using the POPOP4 library provided by the Oak Ridge Computer Technology center. This library contains gamma multiplicities for capture and inelastic scattering for various structural elements, as well as for U235 and U238 for which also fission production data are given. U235 data was actually also used for Pu239 and Pu241, and U238 data for Pu240. From the gamma sources, the gamma flux was computed using the DOT code and gamma heating obtained by folding the gamma energy fluence with the mass-energy absorption coefficients of the corresponding (TLD surrounding) materials.
Measurements and calculations compared very well in all loadings both in a relative as well as absolute sense (average C/E = 1.03 in the B4C/Na rod, C/E = 1.01 in the tantalum/Na rod, C/E = 0.97 in Teflon near the B4C/Na rod), except in the reflector region adjacent to the blanket. This discrepancy was expected by the authors because the calculational model did not correctly model the scattering of gammas back into the reflector. Also, the cavity correction is very important in the reflector and the authors state that the gamma spectrum has to be known precisely to determine the correction correctly.
10 due to the previous irradiation history

36 Chapitre 2
2.4.2 ZEBRA
Gamma-ray energy deposition studies were done by Knipe and DeWouters in the BZC/1 assembly of ZEBRA at Winfrith (UK) as part of the BIZET experimental programme [32]. The BZC/1 was a heterogeneous fast assembly with a central fertile zone and 14 other such zones distributed in a single-enrichment circular core of 1035 mm radius. Li7F TLDs were irradiated in the mid-plane along a radial direction traversing two inner breeder islands and a fissile zone, and also at the center of two special steel sub-assemblies. The TLDs were irradiated in mild steel cylinders 23.6 mm in diameter and 12.5 mm high with access for up to five TLDs. The cylinders were inserted into special sodium or steel ZEBRA plates containing holes to accommodate the cylinders.
The experimental results were corrected for the missed delayed gamma emission depending on the irradiation history and the unloading time, for the reactor background emission, and for the neutron sensitivity of the TLDs using the work of Furuta and Tanaka [33]. The cavity relation was calculated using the Monte-Carlo electron tracking program PROCEED developed by Knipe in his former ZEBRA work [34]. The cavity correction computed in this manner was found to be significantly different (by 13 %) as compared to calculations using Burlin cavity theory.
The neutron flux was obtained using diffusion theory and a XY model representing the core mid-plane (in half-core symmetry). Thereby, 37-group cross-sections generated using the MURAL cell code were employed. Microscopic fission and capture rates, as well as the local neutron flux, were extracted from the XY calculation to compute the gamma source. For the computation of the fission sources from fission rates, total fission energies reported by James [20] (Pu239: 13.8 MeV, U235: 15.2 MeV, U238: 15.9 MeV) and the exponential fits of Goldstein [18] to the spectra measured by Maienschein [35] were used. Capture multiplicities were taken from the compilation of Sidebotham [36]. Inelastic gamma production cross-sections were derived from the UK Nuclear Data Library. Investigations showed that the size of the geometrical model set up for the gamma calculations could be limited and that a 1-dimensional model would be accurate enough to represent the radial traverse of the TLD measurements. The steel sub-assembly was represented in XY geometry surrounded by a row of fissile core cells. The gamma transport calculations were performed with the Monte-Carlo code MCBEND using photon cross-section data from the UK Nuclear Data Library. The gamma heating in iron was finally obtained by folding the gamma energy fluence with the mass-energy absorption coefficients of iron.
A supplementary calculation using a 2-dimensional XZ model was done to investigate the effect of the axial heterogeneity of the cell structure (ZEBRA plates). Significant (up to 13 %) differences in the heat deposition relative to a homogenized model were found and the calculations were accordingly corrected for this heterogeneity effect.

General Background 37
For the radial traverse, measurements and calculations agreed within their respective statistical errors (1.9 % for the measurements, about 3 % for the MCBEND calculations). The authors concluded that there were no serious systematic uncertainties in the source data. In the steel sub-assembly, the calculations overpredicted gamma heating by 15 %, the inelastic gamma production data of iron being found most suspect by the authors.
2.4.3 FBBF
Experimental and computational studies of the gamma-ray energy deposition rate in the Fast Breeder Blanket Facility (FBBF) at the Purdue University (USA) were performed by Wang at al. [37]. The FBBF was a sub-critical cylindrical facility driven by a central source holder containing four Cf252 spontaneous fission neutron sources (~ 1010 n/s total source strength). The central sources were surrounded by a 4.8 %-enriched UO2 transformer region, followed by the experimental blanket region which contained aluminum-clad natural UO2 fuel rods. Gamma dose measurements were made using TLD-200 (CaF2:Dy) and TLD-700 chips with nominal dimensions of 3.2 x 3.2 x 0.89 mm. To estimate the gamma heating in stainless steel (FBR cladding and structural material) and in the UO2 fuel, measurements were made using sets of four TLDs encased in either stainless steel or lead (simulating UO2) sleeves. The latter were designed to fit between the UO2 fuel pellets in a FBBF fuel rod and were 12.7 mm diameter x 4.37 mm high with 1.50 mm thick walls to provide electron equilibrium for electrons generated in the sleeve material. The TLDs were irradiated at 17 radial position in the core mid-plane.
The measurements were corrected for natural activity of the fuel, as well as for the neutron contribution using calculated sensitivities of CaF2 and Li7F as reported by Rinard and Simons [38]. The measured doses were converted to gamma heating in the surrounding sleeve material by applying Burlin cavity theory.
The neutronics calculation for the FBBF configuration investigated was done using a RZ model and the diffusion code 2DB. 50-group self-shielded cross-sections generated from ENDF/B-IV data were employed. From the computed reaction rates, the gamma sources were obtained using the total gamma fission energies given by Sher [22], the capture energy given by Sidebotham [36] and the emission spectra derived from the DLC-37 EPR coupled neutron-gamma library [39]. The transport of the gamma source was done in 1-dimensional geometry using the ANISN code [40] in an S4P3 approximation. Finally, gamma-ray energy deposition rates were obtained by folding the gamma flux with the gamma KERMA factors of the EPR library.
The quality of the calculations was found to be significantly improved as compared to the analysis of previous measurements [41] through 1) self-shielding the gamma production, in particular the capture production by U238 in a consistent way with the neutronics calculations, and 2) taking into account the delayed gamma emission through disintegration of fission products.

38 Chapitre 2
Both measurements in stainless steel and lead surroundings, and with both types of TLD (CaF2, Li7F) were compared to calculations. The findings were consistent between the two TLD types. However, there was a significant difference (10 - 15 %) between C/E values found for TLDs surrounded by lead and those with stainless steel. The discrepancy was removed by doing a series of supplementary measurements with TLDs again surrounded by stainless steel, but with a doubled sleeve thickness compared to the preceding experiments. The conclusion was drawn that the sleeve wall needs to be thick enough not only to establish equilibrium for electrons generated in the sleeve, but also to eliminate, through sufficient attenuation, electrons coming from the surrounding material. Unless the latter criterion is met, a significant fraction of the TLD dose may be due to external electrons. This problem is not present if the sleeve material is similar to the surrounding medium (e.g. lead/UO2), but has to be taken into account when there is a large difference in atomic numbers (e.g. stainless steel/UO2).
C/E values were found to be close to unity in the inner part of the blanket and then decreased continuously to about 0.7 in the outer part (after ~ 50 cm thickness). A very similar behavior was observed for measured capture rates in U238. As U238 capture is the major source for gamma production in the blanket, this similarity in behavior clearly indicated that the deterioration in C/E values resulted mainly from errors in the neutronics part of the calculation. In fact, it was found that the use of SN transport calculations (instead of the diffusion calculation) could remove 40 to 50 % of the discrepancies.
2.4.4 MASURCA
At the MASURCA facility (§ 2.2.1) , extensive experimental and analytical studies on gamma heating involving several European laboratories and organizations (CEA Cadarache, CEA Fontenay-aux-Roses, BELGONUCLEAIRE Bruxelles, UKAEA Winfrith, CEN/SCK Mol) were performed in the course of the RACINE and BALZAC experimental programmes (§ 2.2). Here, the discussion is limited to two configurations of special interest, viz. the RACINE-1Abis and the BALZAC1-DE1 configurations. The results obtained in RACINE-1Abis [42] were used to validate the earlier European method for computing gamma-heating, VASCO-1 (§ 2.5.3). The experimental results obtained in BALZAC1-DE1 [43] have currently been reevaluated to provide a part of the validation basis for the newly developed calculational scheme.
2.4.4.1 RACINE-1Abis
RACINE-1Abis was a heterogeneous assembly of annular design. The fissile rings, separated by a 10 cm thick fertile ring, surrounded a central fertile island. The basic cell was loaded with PuO2/UO2 mixed oxide of 20 % enrichment. The core was surrounded by radial and axial fertile blankets and a shielding region. The gamma-heating measurement techniques involved the use of a range of TLDs (TLD-700, LiF, CaSO4, Al2O3) and an iron-walled

General Background 39
ionization chamber of 10 mm diameter, 30 mm active length and a circulating argon gas filling. Both chamber and TLDs were calibrated in order to yield absolute results. The chamber provided scans along the E-W radial access channel as well as an axial access channel located at the center of the inner fissile ring. Taking advantage of their small size, axial and radial scans were also carried out with TLDs located in mild-steel sample holders which were located between sodium rodlets in the actual fuel elements. For comparison with these "in-lattice" measurements, TLDs were also irradiated in mild-steel holders inside the access channels. Finally, for comparison with the chamber technique, TLDs were irradiated in chamber mock-ups in the access channels.
The experimental results were corrected for the reactor background activity and the non-saturation of fission-product emission, based on calculations with the FISPIN burn-up code and taking into account the irradiation history. The heterogeneity correction, which relates the homogenized calculational model and the true heterogeneous nature of the experimental configuration, was computed using the MCBEND Monte-Carlo code and XYZ models of the immediate surroundings of the TLDs for the "in-lattice" measurements. RZ models and the DOT SN code were used for modeling the chamber and mock-up measurements in the access channels. TLD measurements were further corrected for their neutron sensitivity using the two-temperature technique established by Knipe [44]. Finally, the cavity correction was determined using the photon-electron module of the MCBEND code.
After correction, ionization chamber measurements and TLD measurements in the mock-ups and the mild steel holders in the access channels were compared. Chamber values and TLD-700 results agreed well (although the latter tended to be somewhat higher in the fissile zones), thus broadly confirming the equivalence of the experimental techniques as long as suitable calibration and correction procedures are applied. However, the TLD results from holders irradiated within the fuel elements were found to lie systematically above the channel results in the fissile zones indicating that some heterogeneity effect had not been taken into account properly.
The calculational analysis was performed following several independent routes:
1) KFK and UK methods: 26 neutron group cross-sections were generated using KFK standard methods (KFKINR/001 data set, processing code GRUCAL and lattice code KAPER) for the analysis of the critical experiments. The neutron flux and reaction rate distributions were computed with the diffusion theory program DIXY in RZ and XY geometries. Gamma sources, gamma flux, and gamma heating were computed as in the previously described analysis of the BIZET measurements. Before actually doing the gamma source calculations, the main neutron reaction rates responsible for gamma energy release were corrected on the basis of the experimental results for reaction rate scans and spectral indices.
2) KFK and INTERATOM methods: Starting from the neutron flux generated in the first calculational route, gamma sources were also computed employing the gamma production

40 Chapitre 2
matrices used at INTERATOM (based on ENDF/B-IV, collapsed to 26 energy groups and self-shielded). As compared to the UK results, the thus computed gamma sources were higher by 11 % in the inner breeder and plutonium-fueled zones, and by 2 % in the enriched uranium zone. The differences could be explained by differences in the photon source libraries (50 % less inelastic production in UK library, fission energies for Pu239 and U238 lower by 8 % and 4 %, respectively) and in neutron cross-sections. The gamma transport calculation with the INTERATOM sources was carried out in 1-dimensional cylindrical geometry using the ANISN code in P3S8 approximation.
3) CEA methods: The neutron flux was computed using the transport code DOT 3.5 in RZ geometry, with 25-group cross-sections provided by the HETAIRE cell code used in conjunction with the CARNAVAL-IV data library [58]. The VASCO-1 formulaire, discussed in detail in § 2.5.2.2, was then used to compute gamma sources, fluxes and heating rates. Thereby, bias factors (Table 2-9) were applied to self-shield the gamma-production for Pu239, U238 and iron. Furthermore, experimental reaction rates for U235, U238 and Pu239 were used to correct computed values.
Table 2-6 gives a summary of the comparisons of measurements with calculations. Results obtained at INTERATOM and at CEA were very similar. This was not surprising as the gamma production libraries in both calculational routes had been created from the same basic data (ENDF/B-IV). The UK results were systematically lower, an expected consequence of the differences in source data. However, the significantly lower C/E values, as compared to those obtained in the BIZET work discussed above, could not be explained satisfactorily.
Table 2-6: Summary of calculation/experiment (C/E) results for gamma heating in the central fertile island and the first fissile annulus of RACINE-1Abis.
Technique
KFK/UK INTERATOM CEA/VASCO
Center of TLD 0.79 0.92 0.92 fertile Island chamber 0.78 0.91 0.90 Center of TLD 0.79 0.90 0.88 PuO2/UO2 annulus chamber 0.86 0.98 0.95
2.4.4.2 BALZAC1-DE1
The RZ model of the BALZAC1-DE1 configuration is shown in Figure 2-13. The fissile core was divided into three different zones. The ZONA1 POA and PIT regions were PuO2/UO2 fueled with plutonium enrichments of 22 % (Pu with 8 % Pu240) and 24 % (Pu with 18 % Pu240), respectively. The R1 zone was fueled with uranium of 30 % average enrichment. The core was surrounded by a fertile blanket and steel shielding. The particularity of the configuration was the presence of a diluent region at the center of the core. The diluent was in

General Background 41
fact composed of three zones, containing sodium (central and outer zones) and iron (in-between zone), respectively. It simulated a diluent sub-assembly of SUPER-PHENIX.
Inner Sodium
Stainless Steel
Outer Sodium
Core (ZONA1 POA)Core (ZONA1 PIT)Core (R1)
Axial BlanketRadial BlanketSpent Uranium
Axial ShieldingRadial Shielding
112.48
66.84
45.72
0.0
1.41
2.82
4.23
5.55
6.87
8.19
9-46 22.38 43.95 58.90 70.00 127.2
Z [cm]
R [cm]
Vacuum boundary
Vaccum boundary
Reflective boundary
Reflective boundary
0.0
Figure 2-13: RZ model of the BALZAC1-DE1 configuration.
Gamma-heating measurements were done using both TLDs and ionization chambers [45]. As regards the TLD measurements, TLD-700 were encapsulated in the same mild-steel holders as used earlier in the RACINE programme. "In-lattice" measurements were done in one of the four central MASURCA tubes constituting the diluent region. These measurements were limited to six positions. At each position, two holders were used, axially separated from each other by a 4'' rodlet centered at the core mid-plane. Furthermore, aluminum rods containing two cavities for the TLD holders were inserted in the axial channels of 6 different MASURCA tubes. The in-lattice and channel measurements were complemented by a single measurement at the center of the E-W channel.

42 Chapitre 2
Chamber measurements were carried out along both the N-S and E-W radial channels, as well as in two axial channels, one in the core region and the other in the diluent. Apart from the chamber used in RACINE , a sealed chamber made out of stainless steel and having an active length of 100 mm was also used . The results obtained with the two chambers compared well.
The experimental results were corrected in a manner similar to the RACINE analysis. The major changes were the recomputation of region-dependent cavity factors by Cleri and Calamand [46] using the modified photon-electron Monte-Carlo program ACCEPT [47], a correction (- 4%) to the chamber measurements for the supplementary response due to gammas generated in the chamber wall, and the correction of TLD measurements using an updated response function [48].
The calculational analysis was carried out employing the three separate calculational routes applied earlier in RACINE. The KFK/UK analysis [49,50] was done using the same data files, but with both the neutron and gamma transport calculations done this time with DOT-IV in XY geometry. The INTERATOM analysis started again from the KFK neutron flux and used its independent ENDF/B-IV gamma production library. The CEA analysis [51] was done employing the same data files as in RACINE, but using the BISTRO SN code (§ 2.5.2.1) instead of DOT for the transport calculations.
Table 2-7 summarizes the comparisons of measured and calculated gamma-heating rates. It is seen that C/E values based on TLD measurements in the fissile region compare well with the values obtained in the RACINE work (the observed increase being explained by a 6 % lower cavity correction). On the other hand, there are unexplained changes in the C/E values based on the ionization chamber measurements, indicating that the chamber characteristics varied strongly between the two experiments. The CEA methods strongly underpredict heating in the diluent. As the U235 fission rates were well predicted, thus indicating a well computed neutron flux, the conclusion was drawn that capture and inelastic gamma production in iron (cross-sections and/or yields) was too low when derived from ENDF/B-IV.
Table 2-7: Summary of calculation/experiment (C/E) results for gamma heating in different regions of BALZAC1-DE1.
C/E Technique
KFK/UK INTERATOM CEA/VASCO
Center of TLD 0.86 0.97 0.76 diluent chamber 0.85 0.96 0.75 PuO2/UO2 TLD 0.87 0.95 0.92 (average) chamber 0.81 0.88 0.86

General Background 43
2.4.5 General Observations
From the above review of earlier gamma-heating experiments and their analysis, some general observations can be made, and these have served as useful guidelines for the present work:
1. The major problem in gamma-heating calculations is the accurate determination of the gamma source. This necessitates a) the accurate determination of the neutron flux, b) the accurate determination of fission, capture and inelastic reaction rates, which implies the use of accurate and correctly self-shielded cross-sections, and c) the use of accurate gamma multiplicities for fission, capture and inelastic scattering. In particular, the delayed contribution has to be included into the fission and capture multiplicities.
2. There are large differences between different gamma production libraries and therefore gamma production data should be carefully reviewed and/or revised. Thereby, special attention should be paid to total fission gamma energies (in particular for Pu239). Furthermore, attention should be paid to the basic neutron (capture and inelastic) cross-sections for iron.
3. In general, calculations seem to underestimate gamma heating (C/E < 1), although the gamma production data in the used libraries are believed to be too high, e.g. according to the more recent evaluation work by Fort et al. [17,24,52]. Attention should therefore be paid to the absolute calibration in the integral measurements, as well as to the normalization made for comparisons with calculations.
4. There are differences between C/E values based on measurements employing TLDs and those determined using ionization chambers. Furthermore, there are unexplained differences between C/E values reported for ZEBRA and MASURCA experiments, in which the same measuring technique and calculational methods were employed. Some doubt has therefore to be expressed on the accuracy of the absolute gamma-heating measurements carried out, i.e. there might have been unidentified systematic errors in the experiments.
5. Relatively large calculational correction factors need to be applied to the measured values and not all of these seem to have been determined in a satisfactory way. The corrections most in question are those needed to account for heterogeneity effects and the cavity relation. Thus, for example, corrected results from TLD measurements made inside actual MASURCA loading tubes and in the experimental access channels were found to be significantly different, hence indicating the inaccuracy of the computed heterogeneity corrections. Table 2-8 shows the relatively large differences between cavity corrections computed using different methods/codes in the case of Li7F irradiated in mild steel holders in the PuO2/UO2 fueled core region.

44 Chapitre 2
Table 2-8: Cavity correction (dose in wall medium divided by dose in TLD) for Li7F irradiated in mild steel holders located in the PuO2/UO2 fueled MASURCA core.
Method Dose in wall / dose in TLD MCBEND Monte-Carlo photon-electron tracking module 1.10 ACCEPT Monte-Carlo photon-electron code 1.04 Burlin cavity theory 0.96
6. When doing TLD measurements, it is essential to "surround" the TLD in an appropriate manner. Attention has to be paid to the dimensions (sufficient thickness to shield the TLD from external electrons and to generate an equilibrium spectrum) and the material of the holder surrounding (preferably a material which matches the TLD well from the consideration of cavity theory, or the material in which one would like to determine the gamma heating).
7. Fast reactor gamma-heating experiments have, in the past, been devoted to support conventional LMFBR design, i.e. have essentially been carried out in fissile and fertile zones, as well as in diluent and control rod sub-assemblies. There was, however, practically no work done for reflector regions.
8. C/E values reported for steel regions (especially diluent zones) have been particularly poor.
2.5 The French "Formulaire" Concept for Reactor Calculations
The "formulaire" concept was introduced by the French CEA in the context of fast reactor studies [53]. A formulaire is defined as a calculational tool which allows to determine, with a known uncertainty, the physics parameters necessary for safety evaluation and operation of a certain type of reactor. In this section, the key elements which go into the realization of a formulaire are first discussed. Then, the new ERANOS formulaire, to the development of which this thesis contributes, is introduced. Finally, the former formulaire for gamma-heating calculations, VASCO-1, is described and its major deficiencies listed.
2.5.1 Essential Elements
Three elements are essential for the realization and application of a formulaire: 1) A calculational tool composed of well defined calculational schemes with their associated basic data libraries; 2) The interpretation of integral experiments which allows to define the accuracy with which the calculational tool determines the quantities of interest; 3) The determination of these quantities (and their associated uncertainty) in the case of the power reactor under study.

General Background 45
2.5.1.1 Calculational tool
The calculational tool allows to determine the parameter of interest from basic data using well defined methods and procedures. The most important example in reactor studies is the determination of the neutron flux distribution in the reactor, i.e. the solution of the Boltzmann transport equation. Here, the procedure consists in first computing the flux distribution for a basic, usually repetitive cell of the reactor, and to use this result for the determination of multi-group cross-sections. Using these constants, the neutron flux is then computed for the whole reactor. The basic data needed for this procedure are the neutron interaction cross-sections. These are available in the ENDF files which employ a well defined format [54], but cannot generally be used directly by the computational tools. The data is therefore extracted from the ENDF files and transformed into so-called "basic data libraries". It is important to point out that the latter libraries are associated with (and hence specific to) the calculational methods and procedures. Their contents may be adjusted (modified) in order to minimize differences between calculated values and the results of integral experiments.
2.5.1.2 Integral experiments
The accuracy of the calculational tool is estimated through the interpretation of integral experiments performed in various installations throughout the world. The interpretation consists in using the calculational tool to determine the difference between calculated (C) and experimental (E) values for a given integral parameter. This difference is usually expressed in terms of a C/E value, its uncertainty being the uncertainty σE associated with the
experimental result. In other words, the interpretation yields the so-called bias or experimental correction factors fe used to correct calculated integral parameters such that they become consistent with measured ones:
fECe e= ± σ (2-6)
These experimental correction factors are different from the so-called calculational correction factors which correct the calculational results for known methods deficiencies (such as a correction for simplifications made in representing the real geometry).
The analysis of integral experiments can also in principle be used to adjust basic data libraries.
2.5.1.3 Transposition to power reactors
Transposition consists in the calculation of the quantity of interest in the case of a full-scale power reactor, and the determination of the accuracy with which the value is obtained. In fact, one has to determine the transposed bias factor:
46 Chapitre 2
fECpower power= ± σ (2-7)
Thereby, the uncertainty σpower takes into account:
• The experimental uncertainty σE .
• Additional calculational uncertainties σc introduced if the calculational method used to
determine the quantity of interest in the case of the power reactor is not the same as in the interpretation of the integral experiments. In fact, for the interpretation one often uses the most sophisticated and appropriate methods and this might not be possible in the power reactor calculations. As an example, the integral experiment might have been analyzed in 2 dimensions, using fine meshes and the S16P5 approximation, whereas the power reactor calculation was done using a 1-dimensional model, a larger spatial meshing and a S8P3 angular discretization. Often, "calculational" correction factors are then used to correct for the simplification in the power reactor calculation, which leads to additional uncertainties.
• An additional uncertainty σ transp due to the extrapolation of the E/C value (usually
determined as indicated through experiments in critical assemblies) to that applicable to the full-scale power reactor, i.e. an uncertainty due to the method of transposition.
It is important to point out that the transposition is usually a delicate task since the analyzed integral experiments are often only partially representative of the power reactor.
Ideally, one should have fpower = 1, with an associated uncertainty σpower as small as
possible. To accomplish this goal, the calculational tool has to be appropriate, with all important phenomena correctly taken into account. The integral experiments should be as representative of the power reactor situation as possible in order to reduce the uncertainty σtransp due to the method of transposition. Moreover, the experimental uncertainty has to be
as small as possible. Finally, the same calculational method should be used in the interpretation of the experiments as for the transposition in order not to introduce any additional calculational uncertainties σc .
During the present work, all the above factors were addressed to get the best performance possible. Firstly, a calculational tool was developed which takes all important phenomena into account and employs the latest nuclear data. Integral measurements were carried out in MASURCA configurations representative of a FR with its fertile blankets replaced by a steel/sodium reflector, and considerable effort was undertaken to reduce the experimental uncertainty. Finally, the same calculational tool was used for the interpretation of the experiments and their transposition.

General Background 47
2.5.2 The ERANOS Formulaire
The ERANOS formulaire [55,56,57] is the new European calculational tool for fast reactor studies. It replaces the old set of formulaires, CARNAVAL-IV/CCRR [58,59] (intended for core calculations), PROPANE [60] (intended for shielding calculations), and VASCO (intended for gamma-heating calculations, § 2.5.3), which were used for the design of the SUPER-PHENIX power plant.
It was developed with the aim, not only to accurately predict all important operational and safety-related physics parameters for existing fast reactor concepts, but also to address the new physics aspects of advanced concepts such as plutonium-burning fast reactors (CAPRA project, § 2.1) and accelerator-driven hybrid systems. Analysis of the advanced concepts requires the use of adequate cross-section sets and computer codes which allow refined modeling [11].
2.5.2.1 Calculational tool
The reference calculational tool is an assembly of different calculational modules and data libraries which permit the computation of all important reactor parameters in a consistent way. It takes advantage of the most recent developments in calculational methods and nuclear data evaluation. Essential elements of the tool are:
• Basic data libraries created from the JEF2.2 data evaluation [61]
• The ECCO cell code [62] which produces multi-group cross-sections
• The TGV/VARIANT nodal variation transport code [63,64] and the BISTRO SN discrete ordinate transport code [68,69] used to solve the Boltzmann transport equation in full reactor geometry.
The calculational method developed currently for the determination of gamma heating is explained in detail elsewhere (§ 3.1). However, it is important to note that this forms an integral part of the ERANOS package as a whole. For example, the gamma sources are computed from the neutron scalar flux using the ECCO multi-group cross-sections and reduced (see § 3.1) gamma production matrices. In this way, the calculations take full advantage of the sophisticated cell modeling to correctly self-shield the production matrices. Such embedding of the gamma-heating part within the whole package ensures that the gamma heating is computed in a manner consistent with other calculations such as that of neutron heating.
It is of interest to briefly discuss both the ECCO and the BISTRO codes here, with special attention being paid to features of importance for gamma-heating calculations in plutonium-burning FRs.

48 Chapitre 2
The ECCO cell code
The ECCO cell code produces self-shielded multi-group cross-sections and transfer matrices used in the subsequent full-reactor solution of the Boltzmann transport equation. The algorithms used are described in detail in [65].
The code solves the integral form of the transport equation at the cell level using the collision probability method. A very detailed description of the cell heterogeneity is possible. Thereby, a refined treatment of the neutron slowing down is done using a fine discretization of the energy variable. In the reference calculation, 1968 energy groups with an average lethargy width of 1/120 = 0.0083 are used. The choice of such a fine group structure has two major advantages: 1) The weighting flux used for the determination of the broad group cross-section can be quite accurately determined. 2) The narrow resonance approximation can be applied within a fine group, i.e. the flux shows variations which are exactly opposite to the variations of the total cross-sections. This approximation is justified if the neutron source within a group is constant as is the case if the width of the group is small compared to the average lethargy gain through elastic scattering.
The slowing down treatment in many groups is combined with the sub-group method to compute the self-shielding accurately for both wide and narrow resonances. Wide resonances are treated explicitly using several fine groups with the resonances in that case having a width larger than the groups. If the resonances are narrow (i.e. the cross-sections show important variations within a fine group which is the case for heavy isotopes), they are represented by probability tables and the sub-group method is used to compute self-shielding using the narrow resonance approximation. This method allows to significantly reduce the data needed to describe the fine fluctuations within a group.
Once the effective cross-sections have been determined for the fine group structure and the given heterogeneous geometry, they are condensed and smeared to provide effective cross-sections and matrices in the user-required broad group scheme.
For its computations, ECCO needs infinite dilution cross-sections, fission spectra and transfer matrices, as well as probability tables in the 1968-fine group structure. These data have been created from the recent JEF2.2 evaluation, and put into a form directly usable by ECCO, to produce the basic library of the ERANOS formulaire, ECCOLIB2. This library contains data for the 37 most important nuclides for FR studies. In addition, several other basic data libraries have been created which contain many more nuclides, but use broad group structures (33, 172 or 175 groups). These libraries do not contain any gamma production data, and separate libraries for the gamma-heating calculations were created currently (§ 3.2).
The basic data libraries in ERANOS are being improved by applying nuclear data adjustment procedures. The experimental basis for the adjustment is provided by a wide range of integral measurements made in clean critical core configurations of the MASURCA, ZEBRA and SNEAK facilities. The first version of the adjusted ECCOLIB2 library is called

General Background 49
ERALIB1 [66]. Core characteristics obtained with this library have reduced bias factors and uncertainties.
The ECCO cell code has several features which are important in the context of this thesis. These are:
• The capability of accurately representing the very heterogeneous structure of the CAPRA sub-assemblies [67].
• A special treatment of non-fuel sub-assemblies by means of an external source representing the neutron current entering the assembly from the surrounding core region. This option is of interest for the calculation of cross-sections for the numerous diluent regions of the CAPRA core.
• A special "macrocell" option to treat the spatial variation of the cross-section across large regions of the same homogeneous composition. Such a treatment is necessary for the steel/sodium reflector regions which replace the fertile blankets in plutonium-burning FR concepts.
The BISTRO SN transport code
The BISTRO code [68,69] is a finite difference code with a highly efficient convergence algorithm with both SN transport and diffusion options. The standard SN method (see for example [27,70] for more information on this method) is used to discretize the Boltzmann equation in two-dimensional (X-Y, R-Z) or one-dimensional (spherical, cylindrical, planar) geometry. Anisotropic scattering is handled by expanding the transfer cross-sections in a finite series of Legendre polynomials Pn before doing the actual angular discretization. The code also allows to find a correct solution of the inhomogeneous transport equation. These two latter features are of great importance for gamma transport calculations as one needs to take into account the considerable anisotropy of Compton scattering (which increases with increasing gamma energy), and since the gamma source is a fixed external source given by the neutron interactions in the various regions. Note that the anisotropy is especially important in steel regions where the gamma source emission spectrum is hard.
2.5.2.2 Validation
Validation efforts in the context of the ERANOS formulaire are presently proceeding in two main directions:
1. The validation of computed safety and operational parameters for the existing fast reactors PHENIX and SUPER-PHENIX. Thereby, the validation takes advantage of the large dossier existing on the previous CARNAVAL-IV/CCRR formulaire so that straightforward comparisons can be performed for a wide range of parameters. However, for some parameters with known difficulties, i.e. requiring many corrections with the old formulaire, a direct analysis of the experiments is performed. This is the case for the critical mass of the

50 Chapitre 2
SUPER-PHENIX start-up core, for the reactivity worth of the control rods, for the power distribution map and for the burn-up reactivity swing. All results obtained up to now are highly satisfactory and demonstrate a significant improvement as compared with the results from the previous formulaire, in particular due to the fact that the start-up core experiments can be calculated directly without the application of numerous calculational corrections.
2. The validation of the formulaire for plutonium-burning cores (i.e. configurations with higher enrichment, degraded plutonium quality, high fuel dilution and steel/sodium reflectors). The recent CIRANO (see § 2.2.2) experimental programme at the MASURCA facility provides the necessary experimental data. The analysis of experiments performed so far has allowed the establishment and development of a reference calculational scheme for the accurate prediction of configurations with steel/sodium reflectors [71]. In parallel to the comparison to experiments, a numerical validation of the ERANOS formulaire by comparison with reference Monte-Carlo calculations has been undertaken in order to enable the reduction of uncertainties due to any remaining methods approximations [72,73].
The future objectives of the validation programme are to provide experimental data on mock-up configurations of incineration sub-assemblies and hybrid reactors, so that the qualification of the data libraries and calculational modules can be extended further. The COSMO and MUSE experimental programmes at the MASURCA facility will provide the necessary information.
2.5.3 The Earlier Methodology for Gamma-Heating Calculations, VASCO-1
VASCO-1 is the earlier developed and validated CEA formulaire for gamma-heating calculations in FRs. It is presented in detail in [74]. The essential elements of the formulaire are discussed below, after which its major deficiencies are listed for justifying the current development of the new formulaire.
2.5.3.1 Calculational scheme and associated data libraries
The organization of the VASCO-1 calculational tool, i.e. the calculational scheme and the associated data libraries are shown in Figure 2-14. Data libraries
As seen in Figure 2-14, the VASCO-1 basic data library is part of the BABEL [75] library. The latter was created to accurately simulate the deep penetration of neutrons into regions of various proportions of sodium and iron, as found in the shielding region of SUPER-PHENIX. The library is composed of sub-libraries containing neutron interaction data, neutron-gamma production matrices, gamma interaction data, neutron KERMA and other response functions, as well as gamma KERMA factors. All these data have been produced from the ENDF/B-IV evaluated nuclear data file. The neutron energy structure consists of 113

General Background 51
groups chosen to correctly represent the iron and sodium resonances. Gamma data is given in the Oak Ridge VITAMIN-C 36 group structure which allows in particular to correctly represent 511 keV annihilation gamma rays.
Figure 2-14: The organization of the VASCO-1 calculational tool for gamma-heating calculations in fast reactors as presented in [74].

52 Chapitre 2
The gamma production for various energies of the incident neutron is given as neutron-gamma production matrices. Production through fission, radiative capture and inelastic scattering is taken into account. Delayed production through disintegration of fission and activation products is added as well. Data for 24 nuclides found in FRs are available. However, the production matrices are given at infinite dilution (i.e. self-shielding of the resonances is not taken into account) and therefore lead to an overestimation of the computed gamma source if no correction is done. The basic 113 x 36 group library has been further condensed to 45 x 36 and 25 x 36 group libraries. Condensation spectra characteristic of various regions occurring in SUPER-PHENIX are used and thus the libraries contain specific production matrices for its core, blanket, shielding and heat exchanger region.
The gamma-gamma interaction data are given as transfer matrices. In order to correctly treat the high anisotropy of Compton scattering as needed for the high-energy gammas created in steel regions, the transfer matrices consider up to order 5 of the Legendre polynomial expansion of the scattering cross-section. Moreover, the gamma-gamma transfer matrices take into account secondary gamma production through bremsstrahlung and annihilation.
The basic data library is complemented by a special library containing gamma KERMA factors in units of [eV barn] for 46 elements and/or mixtures. Calculational Scheme
The computation of gamma heating is done in three steps: 1) The calculation of the gamma sources using the neutron-gamma production matrices: In the core and fertile blankets, the calculation starts from a 25-group CARNAVAL-IV/CCRR neutron flux distribution, whereas in the shielding region, the 45-group PROPANE neutron flux is used to compute the sources. The code PRESGA-1 is used to determine the source in a 1-dimensional situation, the PRESGADOT code being used for 2-dimensional problems. 2) The transport of the gammas and their absorption: Starting from the created gamma sources, the gamma flux distribution is computed using the 36 x 36 group gamma interaction library and the transport codes C.ANISN (1-dimensional) or CA.DOT (2-dimensional). 3) The computation of the heat deposition: The programs TRANIDO (1-dimensional) and PRESGADOT (2-dimensional) are used for multiplying the gamma flux with the gamma KERMA values to get the gamma heating.
It is important to note that two corrections are usually applied during the creation of the gamma sources. Firstly, the infinite dilution production matrices of the most important and/or sensitive isotopes, viz. Pu239, U238 and iron, are corrected for self-shielding. Such correction factors have been computed for the core and blanket regions of MASURCA's RACINE configurations used to validate the formulaire (§ 2.5.3.2.). These factors are shown in Table 2-9. They can also be applied to SUPER-PHENIX since the latter's material zone compositions are very similar to those of RACINE. For reactors with very different material compositions, however, new sets of correction factors have to be computed.

General Background 53
Table 2-9: Correction factors to correct for self-shielding for the gamma-production matrices in SUPER-PHENIX.
Isotope Pu239 U238 Iron
Core ZONA RACINE / Core SUPER-PHENIX 0.990 0.878 0.900
Blanket CRI RACINE / Blanket SUPER-PHENIX 0.842 0.685 -
A second correction can be applied if measured reaction rates are available, as is usually the case for validation experiments in critical mock-ups. Using measured fission rates of Pu239, U238 and U235, as well as the capture rate in U238, to correct computed reaction rates allows to adjust 75 % of the gamma sources in fissile and fertile regions.
2.5.3.2 Validation
The major part of the validation [76] of the VASCO-1 formulaire was done by comparison to gamma chamber (and a limited number of TLD) measurements in the RACINE-1Abis (described in § 2.4.4.1) and RACINE-1D configurations, the latter having an 70 % B10
enriched B4C absorber zone of 280 cm2 at the core center (representing a SUPER-PHENIX-type control-rod assembly).
Performance of the VASCO-1 formulaire is shown in Table 2-10. The overall experimental uncertainty includes uncertainties due to the calibration of the gamma chamber, the energy response of the chamber, the correction of the chamber current for pressure and temperature effects, the non-saturation correction, as well as the comparison of chamber results to TLD measurements at some points [76]. The calculational uncertainty includes uncertainties due to the correction of the gamma source for self-shielding, the adjustment of the source using measured reaction rates, the fact that a part of the source was not adjusted or corrected at all, the absolute normalization using U235 fission rates, and the approximations in the calculational method (such as the size of meshes, SN and Pn approximations). The overall uncertainty on the C/E values is then obtained through quadratic addition of the experimental and the calculational uncertainties.
The validation base for the VASCO-1 formulaire was enlarged by carrying out gamma-heating measurements in the BALZAC1-DE1 and BALZAC1-DE2 configurations [77]. The DE1 experiments were described in § 2.4.4.2. BALZAC1-DE2 was like DE1 but with a B4C-absorber zone of 274 cm2 (with 90 % enrichment in B10) at the core center, representing a control-rod assembly of SUPER-PHENIX, instead of the steel/sodium diluent mock-up of BALZAC1-DE1. The performance of the formulaire is presented in Table 2-11. The overall uncertainty indicated has been computed in a consistent manner with that for the RACINE analysis.

54 Chapitre 2
Table 2-10: Performance of the VASCO-1 formulaire for the gamma-heating measurements during the RACINE programme at MASURCA. All uncertainties are given as 1 σ.
Region
E− CC
maximum σC σE
σ CE
PuO2/UO2 core + 4.5 % 2.9 % 4.6 % 5.4 % Inner fertile zones + 8.1 % 4.3 % 4.7 % 6.4 %
Radial and axial fertile blanket + 4 % 4.9 % 4.8 % 6.9 % Shielding + 5 % 8.2 % 5.0 % 9.6 % B4C rod - 9.9 % 9.1 % 5.0 % 10.4 %
Table 2-11: Performance of the VASCO-1 formulaire for the gamma-heating measurements during the BALZAC programme at MASURCA. All uncertainties are given as 1 σ.
Region CE
σ C
E
PuO2/UO2 core - 18.5 % Pu/(U+Pu) 0.89 5.4 % PuO2/UO2 core - 20.5 % Pu/(U+Pu) 0.89 5.4 %
Steel/sodium diluent - 58 % / 42 % vol. 0.83 7.5 % Absorber B4C/Na/Steel - 30 % / 44 % / 26 % 1.00 19 %
2.5.3.3 Transposition
Using the aforementioned results from the interpretation of the RACINE experiments, the performance of the VASCO-1 formulaire for SUPER-PHENIX was determined [78]. The results are shown in Table 2-12.
Table 2-12: Uncertainties (1 σ) associated with gamma-heating calculations for SUPER-PHENIX assemblies using the VASCO-1 formulaire.
Assembly Uncertainty Fissile assembly far from singularities 5.4 % Fissile assembly close to singularities or interfaces
5.4 %
Fertile assembly 1st row 2nd row 3rd row
7.5 % 8.5 % 10 %
Shielding First two rows Beyond first two rows
10 % 20 %
Control rods 12.5 % Steel diluent assembly 12.5 %

General Background 55
2.5.3.4 Deficiencies
The following deficiencies of the formulaire may be listed:
• The use of basic data libraries created using condensation spectra and medium compositions characteristic of SUPER-PHENIX, thus limiting the application of the formulaire to similar configurations.
• The use of infinite dilution total gamma production cross-sections which need to be corrected for self-shielding. Thereby, the correction factors depend on the configuration and are available only for SUPER-PHENIX-type reactors.
• High uncertainty on gamma-heating determination in reflectors and steel/sodium sub-assemblies.
• Weak algorithms for addressing the new features of plutonium-burning fast reactors. Correctly taking into account self-shielding and the spatial variation of multi-group cross-sections is important when addressing heating in steel/sodium reflectors and core diluents.
• Incorrect iron data. Gamma production in iron is strongly underestimated due to the low capture and inelastic scattering cross-sections for iron in ENDF/B-IV.
Furthermore, the formulaire is only validated against experiments in critical configurations representative of the SUPER-PHENIX breeder configuration (no validation for plutonium-burning fast reactors).
It is effectively the above deficiencies which, coupled with the need of the CAPRA project to correctly determine gamma heating in core diluents and steel/sodium reflector regions, have justified the development of the new formulaire as described in the next chapter.
[1] First International CAPRA Seminar, CEN Cadarache (France), March 24-25, 1994
[2] J.Rouault, M.Salvatores, "The CAPRA Project: Status and Perspectives", Nuclear Europe Worldscan 9-10/1995
[3] C.P.Zaleski, "Fast Neutron Reactors: Development in Future Decades", International Journal of Global Energy Issues 8, 133 (1995/1996)
[4] J.Rouault et al., "Physics of Plutonium Burning in Fast Reactors: Impact on Burner Cores Design", Topical Meeting on Advances in Reactor Physics, Knoxville, Tennessee (USA), April 11-15, 1994
[5] G.Vendryes, "World Order and Nuclear Energy in the Future", Trans. Am. Nucl. Soc. 67, 66 (1993)
[6] "Management and Disposition of Excess Weapons Plutonium", National Academy of Sciences Report, Washington D.C. (1994)
[7] J.C.Garnier, R.Sunderland, T.Newton, E.Kiefhaber, D.Verrier, "CAPRA Preliminary Feasibility Studies - Oxide Reference Option: Neutronics and Design Studies", Technical Note, CEN Cadarache (1994)
[8] J.C.Garnier, "CAPRA - Reference Core Data File", Technical Note, CEN Cadarache (1994)

56 Chapitre 2
[9] J.Rouault, A.Judd, J.C.Lefevre, G.Muehling, "CAPRA Preliminary Feasibility Studies - Synthesis And Conclusions", Technical Report, CEN Cadarache (1994)
[10] A.Stanculescu, A.Languille, "CAPRA Project - Basic Elements For Burner Core Design", Technical Note, CEN Cadarache (1994)
[11] P.J.Finck, J.C.Cabrillat, M.Martini, R.Soule, G.Rimpault, R.Jacqmin, "The CIRANO Experimental Program in Support of Advanced Fast Reactor Physics", International Conference on the Physics of Reactors, PHYSOR 96, Mito (Japan), September 16-20, 1996
[12] G.Rimpault, D.Calamand, P.Smith, "Projet de Programme Experimental CIRANO dans MASURCA pour 1994", Technical Note, CEN Cadarache (1993)
[13] J.L.Rowlands, "Nuclear Data For Reactor Design, Operation and Safety", International Conference on Neutron Physics and Nuclear Data for Reactors and other Applied Purposes, Harwell (UK), September 1978
[14] C.R.Weisbin, G.de.Saussure, R.T.Santoro, "Meeting cross-section Requirements for Nuclear-Energy Design", Annals of Nuclear Energy 9, 615 (1973)
[15] J.Pierre, "Le Réacteur Maquette MASURCA", Technical Note, CEN Cadarache (1996)
[16] S.Kitsos, C.M.Diop, A.Assad, J.C.Nimal, P.Ridoux, "Improvement of Gamma-Ray SN Transport Calculations Including Coherent and Incoherent Scatterings and Secondary Sources of Bremsstrahlung and Fluorescence: Determination of Gamma-Ray Buildup Factors", Nuclear Science and Engineering 123, 215 (1996)
[17] E.Fort, P.Long, "Prompt Gammas emitted in Fission: Phenomenological Model Proposed for JEF2 Evaluations", Technical Note, CEN Cadarache (1988)
[18] H.Goldstein, "Fundamental Aspects of Reactor Shielding", Pergamon Press (1959)
[19] T.Yoshida, J.Katakura, "Calculation of the Delayed Gamma-Ray Energy Spectra from Aggregate Fission Product Nuclides", Nuclear Science and Engineering 93, 193 (1986)
[20] M.F.James, "Energy Released in Fission", Journal of Nuclear Energy 23, 517 (1969)
[21] M.F.James, "The Useful Energy Released in the Fission of Th232, U233, U236, Np237, Pu238, Pu240, Pu242", Journal of Nuclear Energy 25, 513 (1971)
[22] R.Sher, C.Beck, "Fission Energy Release for 16 Fissioning Nuclides", Final Report NP-1771 Research Project 1074-1 N, Stanford University, California (1981)
[23] R.deWouters, "Minutes of the AGT 3 Specialist Meeting of the WPOO4 (Gamma Heating)", Brussels, November 10, 1987, Report No. 326.01/17/m7516, Belgonucléaire (1987)
[24] E.Fort, F.Storrer, Internal Memorandum, CEN Cadarache (1997)
[25] G.F.Knoll, "Radiation Detection and Measurements", ISBN 0-471-81504-7, John Wiley & Sons (1989)
[26] A.Lüthi, "Heat Deposition Rate Measurements in a Large Graphite Block due to Gamma Radiations of the LOTUS Facility by Employing Thermoluminescent Dosimeters", Travail de Diplôme, DP-IGA-LPR, EPFL, Lausanne (1994)
[27] E.E.Lewis, W.F.Miller Jr., "Computational Methods of Neutron Transport", ISBN 0-471-09245-2, John Wiley & Sons, Inc. (1984)
[28] J.F.Briesmeister, "MCNP - A General Monte Carlo N-Particle Transport Code Version 4B", Technical Report LA-12625-M, Los Alamos National Laboratory (1997)
[29] G.G.Simons, A.P.Olson, "Analysis and Measurements of Gamma-Ray Heating in the Demonstration Benchmark Plutonium-Fueled Critical Assembly", Nuclear Science and Engineering 53, 176 (1974)

General Background 57
[30] G.G.Simons, T.J.Yule, "Gamma-Ray Heating Measurements in Zero-Power Fast Reactors with Thermoluminescent Dosimeters", Nuclear Science and Engineering 53, 162 (1974)
[31] W.A.Rhoades et al. "The DOT III code", Oak Ridge National Laboratory Technical Report TM-4280 (1973)
[32] A.D.Knipe, R.deWouters, "Gamma-Ray Energy Deposition Measurements in a Heterogeneous Core and Analysis", International Symposium on fast Reactor Physics, Aix-en-Provence (France), September 24-28, 1979, IAEA report IAEA-SM-244/35
[33] Y.Furuta, S.Tanaka, "Response of 6LiF and 7LiF thermoluminescence dosimeters to fast neutrons", Nuclear Instruments and Methods 104, 365 (1972)
[34] A.D.Knipe, "Gamma-Ray Energy Deposition in Fast Nuclear Reactors", PhD Thesis, University of London (September 1976)
[35] F.C.Maienschein, R.W.Peelle, W.Zobel, T.A.Love, "Gamma Rays Associated with Fission", 2nd Int. Conf. on the Peaceful Uses of Atomic Energy, Geneva, 1958
[36] E.W.Sidebotham, "Spectra of Energy Released by Thermal Neutron Capture", UKAEA Report TRG 2189 (R) (1972)
[37] Tien-Ko Wang, F.M.Clikeman, K.O.Ott, "Experimental and Computational Studies of the Gamma-Ray Energy Deposition Rate in the Purdue Fast Breeder Blanket Facility", Nuclear Science and Engineering 93, 262 (1986)
[38] R.M.Rinard, G.G.Simons, Nuclear Instruments and Methods 158, 545 (1979)
[39] "DLC-37/EPR, Coupled 100-Group Neutron 21-Group Gamma-Ray Cross Section for EPF Neutronics", Radiation Shielding Information Center - Oak Ridge National Laboratory
[40] W.W.Engle, Jr. "A User's Manual for ANISN, A One-Dimensional Discrete Ordinate Transport Code with Anisotropic Scattering", Report K-1693, Union Carbide Corporation (1967)
[41] K.R.Koch, F.M.Clikeman, R.H.Johnson, "Gamma-Ray Energy Deposition Measurements in the Fast Breeder Blanket Facility", Nuclear Science and Engineering 92, 596 (1986)
[42] D.Calamand, R.deWouters, A.D.Knipe, R.Menil, "Measurements of Gamma-Ray Energy Deposition in a heterogeneous Reactor Experimental Configuration and their Analysis", 27. NEARCP meeting, Aix-en-Provence (France), October 22-26, 1984
[43] R.deWouters, D.Calamand, F.Cleri, P.D'Hondt, G.Granget, A.Stanculescu, "Measurements and Analysis of Gamma-Ray Energy Deposition in a Critical Assembly Containing a Central Simulated Diluent", International Conference on the Physics of Reactors: Operation, Design and Computation, PHYSOR 90, Marseille (France), April 23-27, 1990
[44] A.D.Knipe, "Absolute Energy Deposition Measurements in a Mixed Gamma-ray and Fast Neutron Environment", 7th International Conference on Solid State Dosimetry, Ottawa (USA), September 1983
[45] P.Bertrand, A.Brocart, A.Cottin, F.Lopez, G.Granget, R.deWouters, "Ensemble des résultats expérimentaux nécessaires a l'interprétation des mesures gamma effectuées dans MASURCA, coeur BALZAC1-DE1 en décembre 1986", Technical Note, CEN Cadarache (1987)
[46] F.Cleri, D.Calamand, "Analysis of the BALZAC1-DE1 Experimental Results on Gamma-Rays Heating Measurments with C.E.A.-E.N.E.A. Methods", Technical Note, CEN Cadarache (1988)
[47] F.Cleri, "Improvements to the 3-D Monte Carlo Module 'ACCEPT' for Coupled Photon-Electron Transport", ENEA Report FT-WHC-00045, CRE Cassaccia (1988)
[48] F.Cleri, "Group-Averaged Calculation of the Neutron Response Functions for TL Dosimeters 7LiF and Al2O3 from Published Data", Technical Note, CEN Cadarache (1987)

58 Chapitre 2
[49] R.deWouters, "Analysis of the Gamma Energy Deposition Measurements in BALZAC1-DE with UK-DeBeNe Methods", Technical Note BN 325.11/65/n/7035, Belgonucléaire (1987)
[50] R.deWouters, G.Evrard, "Revised Analysis of Neutron Reaction Rates and Gamma Doses in BALZAC1-DE1", Technical Note BN 017522/122, Belgonucléaire (1989)
[51] D.Calamand, F.Cleri, "Formulaire Gamma VASCO-1 : Dégagement d'énergie gamma dans des assemblages diluant et absorbant", Technical Note, CEN Cadarache (1989)
[52] E.Fort, P.Long, "Evaluation of the gamma energy released in prompt fission of Pu239", Technical Note, CEN Cadarache (1988)
[53] J.C.Cabrillat, "Fast Reactors: CEA Data and Methods for Core, Shielding, and Gamma Heating Calculations after the Start-up of SUPER-PHENIX", Technical Note, CEN Cadarache (1992)
[54] V.McLane, C.L.Dunford, P.F.Rose, "ENDF-102 - Data Formats and Procedures For the Evaluated Nuclear Data File ENDF-6", Informal Report BNL-NCS-44945 Rev. 2/97, Brookhaven National Laboratory (1997)
[55] G.Rimpault et al., "The ERANOS Method and Data System for Reference and Design Calculations of LMFR Reactors", CAPRA Seminar, June 1997
[56] S.Pelloni, O.P.Joneja, A.Lüthi, G.Rimpault, E.Fort, R.Jacqmin, "Methods and Data Investigations for Pu-Burning Fast Reactor Configurations", Workshop on Advanced Fuel Cycles, PSI Villigen (Switzerland), 1995
[57] G.Rimpault, P.Smith, R.Jacqmin, F.Malvagi, J.M.Rieunier, D.Honde, G.Buzzi, P.J.Finck, "Schéma de Calcul de Référence du Formulaire ERANOS et Orientations pour le Schéma de Calcul de Projet", Technical Note, CEN Cadarache (1997)
[58] J.P.Chaudat et al., "The CARNAVAL 4 Adjusted Library", Trans. Am. Nuclear Society 27, 877 (1977)
[59] C.Giacometti et al., "CCRR - Calculation Codes For Fast Reactors", ANS Topical Meeting on Advances in Nuclear Engineering Computational Method, Knoxville, Tennessee (USA), April 1985
[60] J.C.Estiot, M.Salvatores, J.P.Trapp, "Basic Nuclear Data and the Fast Reactor Shielding Design Formulaire PROPANE D0", International Conference on Nuclear Cross-Sections for Technologies, Knoxville, Tennessee (USA), October 22-26, 1979
[61] J.L.Rowlands, N.Tubbs, "The Joint Evaluated File", International Conference on Nuclear Data for Basic and Applied Sciences, Santa Fe-New Mexico (USA), May 1985
[62] M.J.Grimstone et al. "The Geometrical Treatment in the New European Cell Code ECCO", Topical Meeting on Advances in Nuclear Engineering Computation and Radiation Shielding", Santa Fe, New Mexico (USA), April 9-13, 1989
[63] C.B.Carrico, E.E.Lewis, G.Palmiotti, "Three-Dimensional Variational Nodal Transport Methods for Cartesian, Triangular, and Hexagonal Criticality Calculations", Nuclear Science and Engineering 111, 168 (1992)
[64] G.Palmiotti, C.B.Carrico, E.E.Lewis, "Variational Nodal Transport Methods with Anisotropic Scattering", Nuclear Science and Engineering 115, 233 (1993)
[65] G.Rimpault, "Spécifications du Code de Cellule ECCO", Technical Note, CEN Cadarache (1987)
[66] E.Fort, W.Assal, G.Rimpault, J.Rowlands, P.Smith, R.Soule, "Réalisation and Performance of the Adjusted Nuclear Data Library ERALIB1 for Calculating Fast Reactor Neutronics", International Conference on the Physics of Reactors, PHYSOR 96, Mito (Japan), September 16-20, 1996
[67] G.Rimpault, "Algorithmic Features of the ECCO Cell Code for Treating Heterogeneous Fast Reactor Subassemblies", International Topical Meeting on Reactor Physics and Computations, Portland, Oregon (USA), May 1-5, 1995

General Background 59
[68] G.Palmiotti, J.M.Rieunier, "Optimized Two-Dimensional SN Transport (BISTRO)", Nuclear Science and Engineering 104, 26 (1990)
[69] C.Gho, G.Palmiotti, "BISTRO Note No.4 - Définition des Algorithmes Nécessaires au Calcul de Configurations à Spectre Thermique (Traitement du Groupe Thermique, Upscattering) et du Transport des Rayons Gamma (Formalisme SN Pn)", Technical Note, CEN Cadarache (1986)
[70] R.D.O'Dell, F.W.Brinkley, D.R.Marrm R.E.Alcouffe, "Revised User's Manual for ONEDANT: A Code Package for One-Dimensional, Diffusion-Accelerated, Neutral-Particle Transport", Los Alamos Report LA-9184-M, Rev. (1985)
[71] G.Rimpault, M.Martini, R.Jacqmin, J.C.Bosq, P.J.Finck, S.Pelloni, O.P.Joneja, A.Ziver, A.Lüthi, A.Stanculescu, R.Chawla, P.Smith, "Experimental Validation of Nuclear Data and Methods for Steel Reflected Plutonium-Burning Fast Reactors", International Conference on the Physics of Reactors, PHYSOR 96, Mito (Japan), September 16-20, 1996
[72] J.C.Bosq, R.Jacqmin, Technical Note to appear, CEN Cadarache
[73] O.P.Joneja, S.Pelloni, "Investigations of Pu-Burning Fast Reactor Configurations with Monte Carlo and Deterministic Methods in Support of the Validation of Codes and Data", Technical Note TM-41-96-28, PSI Villigen (1997)
[74] D.Calamand, "VASCO 1 - Formulaire de Calcul du Dégagement de Puissance Photonique dans les Réacteurs à Neutrons Rapides - Note de Présentation", Technical Note, CEN Cadarache (1986)
[75] V.Rado, G.Reynaud, M.Salvatores, J.P.Trapp, "Données et Méthodes pour le Calcul des Shieldings de la Filière Rapide - Partie 1: BABEL - Une Nouvelle Bibliothèque Couplée, 113 Groupes Neutroniques et 36 Groupes Gamma", Technical Note, CEN Cadarache (1979)
[76] D.Calamand, Note SYFRA
[77] D.Calamand, "Formulaire Gamma VASCO-1 - Dégagement d'Energie dans des Assemblages Diluant et Absorbant", Technical Note, CEN Cadarache (1989)
[78] D.Calamand, "Données et Méthodes pour le Calcul de l'Echauffement dû aux Rayons Gamma (Formulaire VASCO 1) - Transposition à un Réacteur de Puissance", Technical Note, CEN Cadarache (1986)


61
3. DEVELOPMENT AND IMPLEMENTATION OF THE NEW CALCULATIONAL SCHEME FOR DETAILED NEUTRON AND GAMMA HEATING IN ERANOS
Nuclear heating can be conveniently divided into neutron heating and gamma heating. Neutron heating at a given location arises from the kinetic energy loss of the charged particles resulting from neutron induced reactions (including both charged secondary particles and the recoil nucleus itself). Apart from the charged particles created, gammas are produced through the neutron interactions. Contrary to the charged particles, which practically deposit their energy at the location of the neutron interaction, the gammas travel several centimeters through matter before being absorbed. Thus, the energy transferred to the generated gammas cannot be considered as part of the neutron heating, and gamma heating has to be treated separately if a correct calculation of the local heat deposition is desired. This separation is particularly important for determining the heating in the core diluents and steel/sodium reflectors characteristic of Pu-burner reactors, for which the explicit consideration of gamma transport effects is essential (§ 2.3.3).
In the former European methodology for fast reactor analysis, the gamma part of nuclear heating was computed with the VASCO-1 formulaire (§ 2.5.3). However, there have been major deficiencies in both the calculational algorithms and basic data used (§ 2.5.3.4). In particular, these are the use of infinite dilution total gamma-production matrices (which necessitates the supplementary calculations of self-shielding correction factors), and incorrect (underestimated) iron gamma production cross-sections.
In the current work, a new calculational tool for detailed gamma and neutron heating calculations in fast reactors has been implemented to form an integral part of the unified European code system ERANOS (§ 2.5.2) and, as such, to replace the VASCO-1 formulaire with its deficiencies. The particularity of the new methodology is that gamma production multiplicites for fission, capture and inelastic scattering are folded with the corresponding effective (self-shielded) neutron cross-sections computed by the ECCO cell code (§ 2.5.2.1) and then summed up to yield the total gamma production matrices. Similar algorithms are applied to compute the total neutron KERMA (Kinetic Energy Released to Materials) factors. Thus, both the gamma production matrices and the neutron KERMA are self-shielded in a consistent way with respect to the self-shielding calculations done for the neutronics analysis. Clearly, this allows to take advantage of the latest improvements in computing effective cross-sections at the cell level, in particular the consideration of spatially varying cross-sections in non-fuel regions such as reflectors characteristic of Pu-burners.

62 Chapter 3
The new methodology necessitates the knowledge of reduced (see § 3.1) neutron KERMA and gamma production multiplicities for all reactions contributing to neutron heating and gamma production. Libraries containing these required data were generated from the most recent nuclear data evaluations. Thereby, delayed gamma production due to disintegration of fission and activation products was explicitly considered as it forms an important contribution (~ 30 %) to the total gamma emission. In the course of creating the data libraries, a careful check could be made on the quality of the basic gamma production available, and this has provided an estimate of the uncertainty on computing gamma sources due purely to errors in the gamma-production data.
This chapter is divided into three sections. In the first section (§ 3.1), the calculational methodology as implemented and used in the present work for the separate determination of gamma and neutron heating is defined. In the second section (§ 3.2), the creation of the neutron KERMA and gamma production data libraries necessary for the new scheme is discussed. In the third section (§ 3.3), the uncertainty in computing the gamma energy emission and gamma heating, due only to uncertainties in the gamma production data generated, is estimated.
3.1 Definition of the Calculational Scheme Used for Detailed Neutron and Gamma-Heating Calculations
The calculational scheme currently implemented for detailed neutron and gamma heating in fast reactors is shown in Figure 3-1.
The starting point is a 33-group1 neutron scalar flux Φi g, computed using the BISTRO
SN transport module (§ 2.5.2.1) of ERANOS in a (usually) 2-dimensional RZ representation of the reactor geometry. Neutron heating is proportional to the neutron scalar flux and is obtained
through multiplication with the neutron KERMA Kn ,i ,e ,g :
H N Kn i i g i e n i e g
eg, , , , , ,= ⋅ ⋅∑∑ Φ (3-1)
The indices used denote the neutron group (g), the isotope (e) and the spatial mesh (i). Ni,e is the isotope density. The neutron KERMA is obtained from the microscopic effective multi-group cross-sections computed by the ECCO cell code (§ 2.5.2.1) as follows:
K kn i e g i e X g n e X g
X, , , , , , , , ,= ⋅∑ σ (3-2)
1 The multi-group structure is given in Appendix A.

Development and Implementation of New Calculational Scheme 63
Figure 3-1: Calculational scheme for detailed neutron- and gamma-heating calculations in the core region, fertile blanket, steel/sodium reflectors, and core diluents and absorber rods of fast reactors.
33 group Neutron flux
φi g,
Reduced Neutron KERMA kn,i,e,g
Neutron Heating Hn,i
ECCO Self-shielded Cross-Sections σi e X g, , ,
Gamma Production Data Q g ge X gγ γχ, , , ( ) , e,X →
Creation of Gamma Source Sg iγ ,
Creation of Gamma Flux φi g, using
BISTRO RZ S16P5
Gamma KERMA K r gγ γ, ,
Gamma Heating H iγ ,
Total heating H H Htot i n i i, , ,= + γ
Gamma-Gamma Interaction Data

64 Chapter 3
kn,e,X,g corresponds to the total kinetic energy given to charged particles and is referred to as
reduced neutron KERMA. The reactions taken into account in the above sum (X denotes the reaction type2) are fission, capture (which includes all capture reactions such as (n,γ ), (n,p),
(n,α ), etc.), as well as elastic and inelastic scattering. It is worthwhile to underline that the expression "KERMA" is used throughout this thesis to give an energy release cross-section (in units of [ eV barn⋅ ]), whereas the "reduced KERMA" corresponds to the energy released (given in units of [eV]).
The neutron scalar flux is then used to compute the gamma sources according to:
( )S N P g gg i i g i eeg
i eγ γ, , , ,= ⋅ ⋅ →∑∑ Φ (3-3)
The total gamma production matrix, ( )P g gi e, → γ , is obtained from the effective microscopic
multi-group cross-sections as follows: P g g g g Qi e i e X g e X
Xe X g, , , , , , , ,( ) ( )→ = ⋅ → ⋅∑γ γ γσ χ (3-4)
The sum is over fission, capture and inelastic scattering, which are the dominant reactions in gamma production (§ 2.3.1). Q e X gγ , , , corresponds to the average total gamma energy (in units
of [eV]) emitted by an interaction of type X of a neutron in group g with isotope i. χ γe X g g, ( )→ is the emission spectrum (in units of [eV-1])3, which is normalized according to:
χ γ γγ
e X gg
g g E, ( )→ ⋅ =∑ 1 (3-5)
E g γ is the average gamma energy in group gγ
4:
EE E
gupper grou lower grou
γγ γ=
+, ,p boundary p boundary
2 (3-6)
2 Throughout this chapter, a small x is used to indicate a single reaction. A capital X stands for a sum over several partials in a summing reaction, such as capture.
3 The product of Qγ,e,X,g and χ e,X (g→ gγ ) effectively corresponds to the "gamma production multiplicity", and
the product of σi,e,X,g, Qγ,e,X,g and χ e,X (g→ gγ ) corresponds to the "gamma production cross-section" or "gamma
production matrix".
4 There is some ambiguity in defining the average energy. Having a priori no information about the shape of the gamma flux within the groups, a flat flux was assumed to compute the average energy.

Development and Implementation of New Calculational Scheme 65
It is important to note that the above described formalism considers the correct self-shielding of all the different reactions producing gammas by using the self-shielded cross-sections computed by the ECCO cell code.
Starting from the gamma source Si, g γ , the gamma flux distribution in the reactor, Φi g, γ
,
is computed using the BISTRO SN transport module already used to compute the neutron flux. As mentioned in § 2.3.3, the propagation of gammas through matter is analogous to that of neutrons. This analogy allows use of the same numerical code, but with a fixed source (
Si, g γ )
for the treatment of the gamma transport. The gamma flux is computed in the 36-group VITAMIN-C structure (see Appendix A) using the gamma-gamma interaction data taken from the existing VASCO-1 formulaire5. The total microscopic cross-section corresponds to the sum of the photo-electric, incoherent (and coherent) scattering and pair production cross-sections. The transfer matrix is given by the incoherent (Compton) scattering cross-section, modified to take into account 511 keV annihilation gamma rays and secondary bremsstrahlung production. To compute macroscopic gamma cross-sections for the various reactor regions, no cell calculation has to be done. In fact, as gamma cross-sections do not show a resonance structure6, the problem of self-shielding does not arise. Also, the influence of the heterogeneous cell structure on computing homogenized gamma cross-sections, through the use of a spatial flux weighting, has been found to be negligible for gamma-heating determination in the core, blanket and reflector regions of fast reactors [1]. Hence, the gamma microscopic multi-group cross-sections can be computed once and for all using an appropriate weighting flux, and the macroscopic cross-section of the homogenized reactor regions can be obtained as the sum of the microscopic cross-sections of the various elements weighted by their homogenized cell densities. It is important to point out that the gamma scattering process exhibits strong anisotropy. This is particularly important while considering the propagation of energetic gammas such as those produced by neutron capture in iron. As compared to the computation of the neutron propagation, usually done using a S4P1 approximation, a finer treatment of the scattering cross-section (i.e. a higher order Legendre expansion) and a corresponding higher order of the SN quadrature set is necessary. The angular approximation used is S16P5.
The gamma heating is obtained by multiplying the gamma scalar flux with the gamma KERMA according to:
5 Gamma interaction data (and KERMA) are in general well known, and the data used in the VASCO-1 formulaire are not questioned in this context. Indeed, it was the need to improve the methodology used to create the gamma source, and not the treatment of the gamma transport, which urged the current development.
6 The photoelectric absorption cross-sections shows a sharp peak when the photon energy approaches the binding energy of the K-shell electrons, thus possibly leading to a self-shielding effect. However, no influence was found [1].

66 Chapter 3
H N Ki i g i e e geg
γ γγ γγ
, , , , ,= ⋅ ⋅∑∑ Φ (3-7)
Here, K e gγ γ, , corresponds to the multi-group form of the total gamma KERMA defined in
relations (2-2) and (2-3). These values are available in the VASCO-1 gamma-gamma library.
Finally, total heating is obtained by adding neutron and gamma heating:
H H Htot i i n i, , ,= +γ (3-8)
Comments
1) In the calculational scheme defined above, neutron and gamma heating are computed in a consistent way. In fact, both neutron and gamma heating are determined starting from the same neutron scalar flux. The self-shielding of the neutron KERMA and that of the gamma production matrix are consistent through the use of the same effective microscopic reaction cross-sections formerly determined by the ECCO cell code.
2) In the described calculational scheme, the gamma calculation is decoupled from the neutronics calculation in the sense that neutron flux and gamma flux are calculated separately7. Compared to coupled neutron-gamma calculations, this has the advantage of well separating the different physical phenomena. Further, the decoupling avoids the use of voluminous coupled neutron-gamma cross-section tables.
3) It is not always necessary (or desirable for simplicity) to compute nuclear heating in such detail. If the transport of gammas can be neglected (as for example at locations far from region interfaces, see § 2.3.3), the gamma energy generated can be considered as deposited at the place the gammas are created, and the total heating can be obtained directly from the scalar neutron flux:
H N Ktot i i g i e tot i e geg
, , , , , ,= ⋅ ⋅∑∑ Φ (3-9)
The total KERMA, Ktot ,i ,e ,g , is obtained from the microscopic effective multi-group cross-
sections according to:
K ktot i e g i e X g tot e X gx
, , , , , , , , ,= ⋅∑ σ (3-10)
ktot,e,X,g corresponds to the total energy liberated by neutron reaction X and available as
kinetic energy of charged particles or as emitted gammas. The reactions to be taken into
7 Obviously, coupling is implicit in the fact that the neutron flux is used to compute the gamma sources, as well as in the use of appropriate neutron cross-sections to correctly self-shield the gamma production matrices.
Development and Implementation of New Calculational Scheme 67
account are fission, capture, as well as elastic and inelastic scattering. Energy conservation
implies the following relation between the reduced total KERMA, ktot,e,X,g , the reduced
neutron KERMA, kn,e,X,g , and the total energy emitted in the form of gammas, Q e X gγ , , , :
k k Qtot e X g n e X g X e g, , , , , , , , ,= + γ (3-11)
4) The calculational scheme defined above allows the accurate determination of neutron
and gamma heating in regions where the neutron flux can be determined accurately using an energy discretization into 33 groups, i.e. in practically all regions (core, diluent sub-assemblies, absorber rods, fertile blanket and reflectors) of current fast reactors and of the advanced Pu-burner configurations, except in the shielding. For this zone, ERANOS foresees the determination of the neutron flux in 175 groups [2]. Neutron and gamma heating can then be computed using the same calculational scheme as shown in Figure 3-1, but starting from a 175 group neutron scalar flux. However, it has been mentioned that far from surfaces, as is the case for large parts of the shielding regions, the transport of gammas can be neglected and the total heating can thus be obtained directly from the neutron flux using relation (3-9). In fact, the heating is principally due to radiative capture. As the capture Q-values are well known, the major problem in the determination of heating in the shields is the determination of the neutron flux and the capture reaction rates (in the structural materials).
3.2 Creation of the Basic Data Libraries Needed
Apart from the basic neutron-neutron and gamma-gamma cross-sections, the method of separate calculation of neutron and gamma heating as defined in § 3.1 necessitates the knowledge of:
1. The reduced neutron KERMA, kn e X g, , , , separately for fission, capture, elastic and inelastic
scattering, and for 33 neutron groups.
2. The average total gamma energy emitted, Q e X gγ , , , , separately for fission, capture and
inelastic scattering, and the associated normalized emission spectra, χ γe X g g, ( )→ , and for
33 neutron and 36 gamma groups (group structures given in Appendix A).
This section describes the creation of the required data. The creation was based on an exact definition of the data to be created (§ 3.2.1) , a review of the data available in the basic evaluated nuclear data files (§ 3.2.2) and a thorough study of the problems related to the data creation (§ 3.2.3). Following this, a method for creating the data was developed and applied (§ 3.2.4).

68 Chapter 3
3.2.1 Definition of Data To Be Created
Neutron KERMA and gamma production data are needed for the isotopes contributing in an important way to heating in the existing power plants PHENIX and SUPER-PHENIX and in the critical facilities used to validate the calculational tool. These are: B10, B11, C, O, Na, Al, Cr50, Cr52, Cr53, Cr54, Mn, Fe54, Fe56, Fe57, Fe58, Ni58, Ni60, Ni61, Ni62, Ni64, U235, U238, Pu239, Pu240, Pu241, Pu242 and Am241. Thereby, it has to be remembered that fission and capture (in Na23, Mn55 and U238) lead to the formation of radioactive fission and activation products, respectively. The disintegration of these isotopes leads to delayed emission which has to be added to the prompt gamma emission.
The importance of other isotopes such as H, N14, N15, Si, Ca, Ti, Cu, Mo, Nb was investigated in the case of the ZONA2A MASURCA configuration [3] and found to be negligible (< 0.15 % of total heating). Heating effects due to gamma production through interaction with fission products were investigated in the case of the EBR-II critical mock-up [4] and found to be negligible, although it was mentioned that this might not be true for reactors in which higher burn-up levels (and fission product concentrations) are reached. In the present studies, gamma production by fission products was neglected.
The data needed are transferred to the calculational modules of ERANOS using two external files: 1. A KERMA file containing the neutron reduced KERMA. 2. A spectra file containing the gamma production data. In order to enable the calculation of total heating without the separate determination of neutron and gamma contributions, the total reduced
KERMA ktot,e,X,g (in addition to the reduced neutron KERMA) has also to be present in the
KERMA file.
3.2.2 Gamma Production and Decay Data Available in Evaluated Nuclear Data Files
Evaluated Nuclear Data Files, such as JEF2, ENDF/B-VI and JENDL-3, are compilations of basic nuclear data important for applications of nuclear technology (neutron and photon interaction data, photon production data, decay data, etc.). The nuclear data are based on various earlier measurements. Before being incorporated into the evaluated files, these measured data are analyzed and completed using theoretical models and extrapolation procedures. After this evaluation is done, the data is incorporated into the ENDF files using a well defined format (the ENDF6 format being the actual one) and procedures [5].
An evaluation is divided into various sub-libraries containing data of a special type (incident neutron data, fission product yields, radioactive decay data, photo-atomic interaction data, etc.). The sub-libraries are then divided into material sections (identified by MAT), containing data for a given isotope or element. The material sections are divided into files (identified by MF), containing the data for a certain class of information. Finally, these files are divided into sections (identified by MT), usually containing the data for a given interaction

Development and Implementation of New Calculational Scheme 69
type. To be used in practical calculations, the data in the ENDF format have to be processed to forms appropriate for actual applications using codes such as NJOY (§ 3.2.2).
3.2.2.1 Gamma production data
Usually, photon production data can be found in files MF 12 - 15 of the evaluation. In these files, the formalism used to express the gamma production matrices is the following:
P E E E Y E f E Ek k
k( ) ( ) ( ) ( )→ = ⋅ →∑γ γσ (3-12)
Here, σ( )E is the usual cross-section, k designates a particular discrete photon or a continuum,
Yk(E) is the photon production multiplicity of the kth component, and fk refers to the energy distribution of the kth (continuous) component. fk is normalized to unity according to: f E Ek
E( )dE→ =∫ γ γ
γ
1 (3-13)
For each interaction type, MF 12 gives the photon production multiplicity in the form of
tabulated pairs, ( , ( ))E Y Ek , for each discrete photon and continuum8. MF 13 gives the photon
production cross-sections, σY Ek ( ) . As in MF 12, the data is tabulated as pairs for each
discrete photon and continuum. MF 14 gives the angular distributions, which are normally isotropic. If MF 12 or 13 contains data for a continuum, then MF 15 gives the continuum photon energy spectra fk. It is important to note that the same gamma production data is not given twice. For example if data is present for a given reaction on MF 12, then no data is given on MF 13 for the same reaction. MF 12 is often used to represent photon production for reactions showing an important resonance behavior such as fission and capture. In fact, using MF 12 (instead of MF 13) avoids representing the energy dependence of the neutron cross-section. When data is given using MF 12, the neutron cross-section is taken from the neutron cross-section files MF 2 and 3 to compute the photon production matrix.
Common MT numbers with photon production available are MT 18 (fission), MT 102 (radiative capture), MT 4 (total inelastic scattering). MT 3 can be used to give the gamma emission data for the total non-elastic cross-section, and is used when the gamma production cannot be separated into its various components.
Starting with the ENDF6 format, there is a very general way to give particle production using MF 6. This file allows to represent the distribution of reaction products, in particular
8 MF 12 can also be used to represent level energies, de-excitation transition probabilities, and (where necessary) conditional photon emission probabilities for the excited target nucleus, from which the emitted gamma energies and their multiplicities can be computed.
70 Chapter 3
also gammas, in energy and angle. Some of the most recent evaluations use MF 6 to describe gamma production (e.g. ENDF/B-VI for iron, nickel and chromium isotopes).
3.2.2.2 Decay data
Radioactive decay data for single nuclides in their ground state or an isometric state (i.e. a "long lived" excited state of the nucleus) are given in section MT 457 of file MF 8. Important data available are the half-lives, the decay modes, the average decay energies, E"β", E"γ", E"α", and the resulting radiation spectra. E"β" stands for the average energy of all "electron-related" radiation such as β−, β+, conversions-electrons, Auger, etc. E"γ" denotes the average energy of all "electromagnetic" radiation such as gamma rays, X-rays, and annihilation radiation. E"α" is the average energy of all heavy charged particles and delayed neutrons, including the recoil energy. The sum of these three quantities is the total average energy (neutrino energies excluded) available per decay. The gamma emission spectrum is usually given in the form of tabulated pairs of discrete rays of energy ER with their associated relative intensity RI. The absolute intensity, IA, is obtained by multiplication with the discrete spectrum normalization factor FD also given.
3.2.3 Problems Related to the Creation of the Data Libraries
KERMA and gamma production data files in the format requested by ERANOS have been formerly created by Cavarec [6,7] from JEF1, for the CARNAVAL-IV/VASCO multi-group structure, and by Peerani et al. [8] at ENEA, for both the VITAMIN-J (175 neutron groups)/VASCO and the 33-group ECCO/VASCO structure, using JEF2.2. These existing files were not useful for the present work because they are in a different multi-group structure (in the case of the JEF1 files), or were found to be incomplete in particular with respect to gamma production by Pu-isotopes [9] and showed energy balance problems (JEF2.2 files).
As indicated above, Cavarec and Peerani et al. both produced their KERMA and spectra files from the JEF evaluation. A thorough study [9] of their work showed that major problems in the data creation are due to incompleteness or inconsistency of this basic evaluation. Some other problems such as the violation of the energy conservation relation (3-11) may arise if the data processing of the ENDF files is inappropriately done. Below, the problems due to the basic data files are listed and ways to overcome them are indicated.
Problems due to the basic data files (ENDF)
1. Incompleteness: JEF does not contain any gamma production data for plutonium isotopes. Other evaluations have therefore to be used for these isotopes. Rowlands [10] has proposed the use of the ENDF/B-VI evaluation and also suggested that the total fission energy components, such as EGP and EGD given in MT 458 of MF 1, be adopted from this evaluation.

Development and Implementation of New Calculational Scheme 71
2) Prompt data only: JEF (and also the other evaluations) do not contain delayed emission (such as the emission spectrum of the fission products at steady state). These data have to be computed from the fission product yields and the decay data.
3) Lumped reaction (MF 3): Above a given energy limit (some hundreds of keV to some MeV), gamma production data (e.g. for U238 in JEF2.2 from 933.94 keV onwards) are not given separately anymore for the various reactions and occur only for the total non-elastic reaction MT 3. However, this is not a big problem. For non-fissile isotopes, the radiative capture contribution is usually negligible above the energy limit and other capture reactions such as (n,p), (n, α ) become only important above several MeV. The lumped reaction is thus approximately equal to the inelastic production and can be attributed to this reaction. For fissile isotopes, this is not possible as fission and inelastic scattering at high energies show cross-sections of similar magnitude. The lumped reaction can be separated into its components using a theoretical spectrum for fission such as the one given in § 2.3.1.1. Cavarec tried to separate MT 3 of U235 into fission and inelastic contributions assuming a constant fission spectrum, but failed (non-physical, i.e. negative inelastic emission). If a physically consistent separation is not possible, one can omit the separation and attribute MT 3 to the inelastic production. Total gamma production will then be correct in the calculations, although self-shielding is not correctly done (this, however, is usually not important in the energy range under consideration), and the non-elastic emission represents the total emission and not just the inelastic.
4) Inconsistency: Peerani et al. showed that neutron cross-sections and gamma production data for Cr50, Fe57, Fe58, Cr53, Cr54 and Mn in JEF2.2 are inconsistent. This can be done by testing neutron KERMA generated by NJOY against kinematics limits (see § 3.2.4.1). For isotopes with such problems, data from other evaluations can be used. MacFarlane [11] checked the neutron KERMA of ENDF/B-VI and did not find any problems for nickel, iron and chromium isotopes (nor for Li6, Li7, B10, B11, C, O, Na and Mn).
5) Inconsistent inelastic thresholds between neutron cross-section and gamma production data. In this case, the threshold in one of the two sub-libraries of the evaluation has to be adjusted before doing the data processing.
3.2.4 Creation of the Data Libraries
The creation of the required data KERMA and spectra library files was done in three main steps. Firstly, data available in ENDF files were processed using the NJOY code. Secondly, the processed data was put into the form required by the calculational modules and checked for quality. Finally, the delayed contribution was generated from fission yield and decay data, and added to the prompt data.

72 Chapter 3
3.2.4.1 Data processing using NJOY
The two essential modules of NJOY [12] used for generating KERMA and gamma production data from ENDF files are HEATR and GROUPR, and it is useful to briefly review their functioning before describing the data processing scheme which was set up and employed.
HEATR
HEATR allows one to compute both total and neutron KERMA. The total KERMA of summation reaction X is calculated according to:
( )K E E Q E Y E E E Etot e X e x e x n e x n e x
x X, , , , , , , ,( ) ( ) ( ) ( ) ( )= + −
∈∑ σ (3-14)
where x runs over all neutron partials in X9. Qe x, is the mass-difference Q-value for material e
and reaction x, Ee,x n, is the average energy of secondary neutrons and Y Ee x n, , ( ) their yield
(or multiplicity).
To get the neutron KERMA, the energy carried away by gammas is subtracted from the total KERMA:
K E K E Y E E E En e X tot e X e x e x e xx X
, , , , , , , , ,( ) ( ) ( ) ( ) ( )= −
∈∑ γ γ σ (3-15)
where x runs over all photon partials in X. Ee x, ,γ is the average energy of secondary gammas
with the associated multiplicityY Ee x, , ( )γ . Ee x, ,γ and Y Ee x, , ( )γ are derived from the data
available in MF 12,13 and 15. This method of computing neutron KERMA is known as the "energy balance method": The energy allocated to neutrons and gammas is simply subtracted from the total available energy (given by the reaction Q-value) to obtain the energy associated with charged particles.10
HEATR allows a check of the neutron KERMA, computed using relation (3-15), versus kinematics limits. Indeed, there exist upper and lower kinematics limits for the neutron KERMA which can be computed using simply kinematics formulas (and without the use of photon production data). For elastic and inelastic scattering, there exist even exact formulas for
9 Clearly, the sum is only carried out for summation reactions such as the total inelastic reaction MT 4 which is the sum of MT 51 - 91. For other reactions such as fission (MT 18), there is usually no summation.
10 Starting with ENDF6, complete energy-angle distributions for all of the particles produced by a reaction can be given in MF 6. Neutron KERMA can then be computed directly (without energy balance considerations) from this data.

Development and Implementation of New Calculational Scheme 73
the calculation of the neutron KERMA. Checking against these limits is thus a way to detect inconsistencies between photon-production and neutron cross-section data (§ 3.3.1).
The computation of the total KERMA using relation (3-14) needs the knowledge of the reaction Q-value. This value is zero for elastic and inelastic scattering. For other reactions it is taken from MF 3. There are special problems with obtaining the Q-value for fission. First, the pseudo Q-value of MF 3 corresponds to the total energy available after fission at "zero" (thermal) incident energy minus the antineutrino energy, which is lost due to the inevitable escape of neutrinos out of the reactor, but includes the delayed contribution. Second, the fission Q-values are energy dependent11. Therefore, HEATR computes an effective energy dependent fission Q'(E)-value according to:
Q E Q E E E EB EGD'( ) ( ) . ( ( ) ( )) .= − − − − −0 8 07 6 0 0 043ν ν (3-16)
where EGD corresponds to the total delayed gamma-ray decay energy and EB to the beta-ray decay energy per fission. EGD and EB are taken from MT 458 of MF 1, which gives the components of energy release due to fission.
GROUPR
GROUPR allows to produce self-shielded multi-group cross-sections, anisotropic group-to-group transfer matrices and anisotropic gamma production matrices for neutrons. Thereby, neutron and gamma-production data are processed in a parallel manner using the same weight function. This helps to assure consistent cross-section sets. Multi-group reaction cross-sections are computed according to:
σ
σ φ
φe x g
e xg
g
E E
E, ,
, ( ) ( )dE
( )dE=
∫
∫
0
0 (3-17)
where φ0 is the first moment of the Legendre expansion of the angular neutron flux. Multi-
group gamma production matrices are computed according to:
σ
σ φ
φγ
γ γ γγ
e x
e x e x e xgg
g
g g
dE dE E Y E E E E
dE E,
, , , ,
( )
( ) ( )f ( ) ( )
( )→ =
→∫∫
∫
0
0 (3-18)
11 The energy dependence can be seen when writing the mass balance equation for the fission reaction. In energy units: Q = ma+mn-mfp- ν mn. ma is the mass energy of the target, mn is the mass energy of the neutron, mfp is the
total mass energy of the fission products, and ν is the fission neutron yield. Both mfp and ν are energy dependent.

74 Chapter 3
where the gamma production data are obtained from MF 12 (Y Ee x, , ( )γ ) , MF 13
( σ γe x e xY E, , , ( ) ) and MF 15 ( f E Ee x, ( )→ γ ).
Processing using NJOY
From the multi-group KERMA and neutron-cross-sections computed by GROUPR, the reduced KERMA values required by the new calculational scheme can be computed according to:
kK K
tot e X gtot e X g
e X gn e X g
n e X g
e X g, , ,
, , ,
, ,, , ,
, , ,
, ,= =
σ σ and k (3-19)
The averaged total gamma energies emitted, Q e X gγ , , , , and the associated emission
spectra, χ γe X g g, ( )→ , can be obtained from the gamma production matrices computed by
GROUPR using the gamma production multiplicity:
M g gg g
e Xe X
e X g,
,
, ,( )
( )→ =
→γ
γσσ
(3-20)
Then one gets:
Q M g g Ee X g e X gg
γ γ γγ
, , , , ( )= →∑ (3-21)
and χ γγ
γe X
e X
e X gg g
M g g
Q,,
, , ,( )
( )→ =
→ (3-22)
In Figure 3-2, the complete processing of the ENDF data files using NJOY is schematized.

Development and Implementation of New Calculational Scheme 75
Figure 3-2: Creation of multi-group data files containing total and neutron KERMA, as well as gamma production data from evaluated nuclear data files using the NJOY data processing code.
Choice of evaluation
ENDF data file
RECONR
BROADR
UNRESR
Pointwise cross-section file PENDF
Modification of fission energies on MF 1, 3
HEATR with local deposition
of gamma energy
HEATR with gamma production
subtracted
PENDF file1 with MT 1, 2, 4, 18, etc.
+ total KERMA
MT 302, 304, (318), 401
PENDF file2 with MT 1, 2, 4, 18, etc.
+ neutron KERMA
MT 302, 304, (318), 401
ENDF Photon production data
MF (6), 12, 13, 15
Modify PENDF files: Adjust KERMA MT 304 to have zero value at threshold
GROUPR
GROUPR with creation of
gamma production matrices
GENDF file 1 containing - MT 1,2,4, 18, etc.
- Total KERMA MT 302, 304, (318), 401
GENDF file 2 containing - MT 1,2,4,18, etc.
- neutron KERMA MT 302, 304, (318), 401 - gamma production data on MF 16
76 Chapter 3
The creation started with the choice of the evaluation to be processed. Criteria for the selection were a) completeness with respect to gamma production, b) presence of data separately for all reactions of interest, i.e. absence of the lumped reaction MT 3, and c) consistency of gamma production and neutron interaction data. If possible, JEF2.2 data were chosen in order to be consistent with the standard ERANOS libraries such as ECCOLIB2 which were created from JEF2.2. This was not possible for plutonium isotopes for which JEF2.2 does not contain gamma production. Except for Pu239, ENDF/B-VI data was chosen as proposed by Rowlands [10]. For Pu239, JENDL-3 data was taken because this evaluation, contrary to ENDF/B-VI, does not contain MT 3. ENDF/B-VI data were chosen for chromium isotopes, Mn and Al. In fact, JEF2.2 scored poorly for chromium isotopes in the kinematics test by Peerani et al. [8]. As regards Mn, JEF2.2 has the lumped reaction MT 3 whereas ENDF/B-VI does not. Finally, JEF2.2 data for Al gave rise to numerical processing errors in NJOY, indicating that the ENDF format was not correctly followed. Appendix B gives the chosen evaluation for each of the processed isotopes. Also indicated is the type of gamma production present and taken into account during the data processing. Gamma production present in the evaluation, but not taken into account, is indicated in parenthesis. This concerns gamma production through the threshold reactions MT 16 (n,2n), MT 17 (n,3n), MT 22 (n,nα ) and MT 28 (n,np). Their contributions are only important at high energies and can be neglected in fast reactor applications.
ERANOS foresees a simply way of computing energy release by taking into account the energy release in fission and capture. In this method, the total KERMA are computed by the ECCO cell code as follows:
K Q Qtot i e g i e f g e fission i e c g e capture, , , , , , , , , , ,= ⋅ + ⋅σ σ - corrleakage,g (3-23)
Here, Qe,fission is the fission Q-value, reduced by the energy lost in form of anti-neutrinos, which escape from the reactor. Qe,capture is the capture Q-value. Both values are taken to be independent of the incident neutron energy12. corrleakage,g corrects for the energy lost by neutrons leaking out of the reactor. The use of these KERMA gives a correct value of total heating (power) in the whole system, and is used in ERANOS in particular for burn-up calculations.
For the computation of the total KERMA given by relation (3-23), fission energy values proposed by Fort and Storrer [13] are used in ECCO. On the other hand, HEATR uses the pseudo fission Q-value of MF 3 and the fission energy release components in MT 458 in MF 1 for fissile isotopes to compute KERMA according to relation (3-14). Therefore, in order to stay consistent with the ERANOS calculations, MF 1 and MF 3 were modified before actually
12 This is correct for the capture Q-values. As mentioned before, the fission Q-values shows a slight dependence on the incident neutron energy through the energy dependence of the prompt-neutron and fission-product yields.

Development and Implementation of New Calculational Scheme 77
running NJOY. The values proposed by Fort and Storrer and used for the modification are given in Table 3-1. Apart from the pseudo Q-value, ER, as well as EGD and EB, this table gives also EFR, the kinetic energy of the fission fragments, ENP and END, the kinetic energy of the "prompt" and delayed fission neutrons, respectively, EGP, the total energy released by the emission of "prompt" gamma rays, ENU, the energy carried away by the neutrinos, and ET, which is the sum of all the partial energies and corresponds to the conventionally defined Q-value of the fission reaction. ER is equal to ET - ENU. For the fertile isotopes, these data are given at non-zero incident energies and relation (3-16) was used to compute the pseudo fission Q-value at zero energy. For isotopes without MT 458 of MF 1, the delayed contributions EGD and EB had to be subtracted from the pseudo fission Q-value in MF 3. In fact, in the absence of MT 458 in MF 1, HEATR does not subtract these values from Q, and the correction for the delayed components had to be made manually.
Table 3-1: Fission energy values [MeV] proposed by Fort and Storrer [13] at CEN Cadarache and adopted in ERANOS for the computation of total KERMA in ECCO.
Energy U235 U238 Pu239 Pu240 Pu241 Pu242 Am241 Einc* thermal 3 thermal 2.39 thermal 2.32 thermal
EB 6.5 8.25 5.31 6.44 6.58 7.70 5.62 EGD 6.33 8.02 5.17 6.31 6.40 7.55 5.51 ENU 8.75 11.08 7.14 8.64 8.85 8.64 7.54 END 0.0074 0.018 0.0028 0.004 0.005 0.004 - EFR 172 172.5 178.6 177.9 178.8 178.8 182 EGP 6.63 6.71 6.74 6.76 6.79 6.96 6.77 ENP 4.8 5.51 5.8 6.77 5.99 6.98 6.53 ER 196.26 201.0 201.63 204.18 204.56 208.1 206.4 ET 205.01 212.08 208.77 212.81 213.14 216.74 213.94
* incident neutron energy (thermal, or in MeV)
Once the modification of the fission energies was done (for fissile/fertile isotopes), the RECONR, BROADR, UNRESR modules were used to reconstruct point-wise neutron cross-sections from ENDF files. The RECONR module reconstructs resonance cross-sections from the resonance parameters and reconstructs cross-sections from ENDF nonlinear interpolation schemes. The BROADR module generates Doppler-broadened cross-sections. The UNRESR module produces effective self-shielded cross-sections for resonance reactions in the unresolved energy range. Point-wise cross-section were generated at 300 °C and infinite dilution, and stored in a PENDF (Point-wise Evaluated Nuclear Data File) file.
Next, the HEATR module was used to generate point-wise total and neutron KERMA cross-sections and to add them to the existing PENDF tape. HEATR was used to generate 1) the elastic scattering KERMA MT 302, 2) the inelastic scattering KERMA MT 304 (sum of MT 51-91), 3) the fission KERMA MT 18 (MT 18 or sum of MT 19, 29, 21, 38), and 4) the

78 Chapter 3
total disappearance KERMA MT 401 (sum of MT 102 - 120). In fact, for each isotope processed, two different PENDF tapes were created, one containing the neutron KERMA (in addition to the neutron interaction cross-sections already present), and one containing the total KERMA.
In the next step, the GROUPR module was used to process the two earlier generated PENDF tapes and to get multi-group cross-section files in the GENDF (group-wise ENDF) format. Two GENDF files were produced. The first one contains, apart from the usual neutronic cross-sections, the multi-group total KERMA for MT 302, 304, (318), 401. The second one contains the corresponding multi-group neutron KERMA and the associated gamma production matrices. Cross-sections were produced at 300 °C and only the first moment of the Legendre expansion was treated. Further, the cross-sections were processed at infinite dilution, i.e. no self-shielding treatment (e.g. the Bondarenko formalism) was applied.
To compute multi-group cross-sections, one needs to specify a weight function. However, this is actually the neutron flux one determines by solving the transport equation. One therefore has to choose an appropriate form of the still to be determined flux within the groups. In order to remain consistent, the same weighting flux as used for the creation of the standard ERANOS library was adopted in the present work. This is a [thermal Maxwellian + 1/E + fission spectrum] weighting flux. However, the choice of weight function is not a very crucial issue. The influence of the weighting flux was investigated explicitly in the case of Fe56. The total and neutron reduced KERMA were calculated using a constant weighting flux, as well as with the VITAMIN-E weighting flux option (which is the function generally chosen at PSI to compute fast reactor cross-sections). The differences were generally found to be small (of the order of 2 %), except for the inelastic KERMA (differences up to 20 %) as well as in thermal and high energy groups for the elastic and capture KERMA.
A further problem is the choice of the multi-group neutron and gamma energy structure. Clearly, it would be most convenient to choose directly the group structures (Appendix A) in which the KERMA and gamma data are expected by ERANOS. This is possible for the neutron energy structure, and the 33-group ECCO structure was used accordingly. On the other hand, it is not possible to directly use the 36-group gamma energy structure if one wants to guarantee the conservation of energy through the relation (3-11), which can be rewritten as:
K Ktot e X g
e X g
n e X g
e X g
, , ,
, ,
, , ,
, ,σ σ γ = Q ,e,X,g− (3-24)
Using relations (3-14) and (3-17), the left hand side of this equation can be written as:
φ σ
φ σ
γ γ0
0
( ) , , , , ,
( ) ,
( ) ( )
( )dE
E e X e X e Xg
E e Xg
E Y E E dE
E
∫
∫ (3-25)

Development and Implementation of New Calculational Scheme 79
Using (3-18), (3-20) and (3-21), the right hand side becomes:
dE E E Y E E dE f E E
E E
e x e X gg
e Xgg
e Xg
φ σ
φ σ
γ γ γγγγ
0
0
( ) ( ) ( ) ( ( ))
( ) ( )dE
, , , ,
,
∫∑∫
∫
→
(3-26)
The energy conservation relation (3-24) is thus verified if one has:
E E dE f E Ee X gg
e Xg
, , ,( ( ))γ γ γγγγ
= ∫∑ → (3-27)
Because f is not really a continuous function but rather gives the photon spectrum as a tabulation of points (the interpolation recommended being usually linear), the above relation can be verified if the gamma multi-group structure is chosen to be consistent with the discretization of the continuous spectra in MF 15, i.e. with the structure of the f-tabulation.
Another problem when choosing the gamma structure are discrete rays. When treating discrete rays, GROUPR just modifies the multiplicity of the gamma group into which the
discrete ray is emitted. In such a way, a discrete ray of energy Ek, emitted into group gγ , is
considered to be emitted with energy Eg γ. Therefore, one should work with a multi-group
gamma structure as fine as possible. This avoids getting large differences between Ek and Eg γ.
Based on the above discussion, a multi-group gamma structure containing 385 gamma groups was defined. Using such a fine structure allows a reduction of eventual errors in representing the energy of discrete rays to less than 1.5 % in most groups. Furthermore, the group boundaries were chosen to well represent the tabulated spectra (in MF 15) for the most important isotopes. Finally, the group boundaries of the 36 group VASCO structure were included to enable correct condensation from 385 to 36 groups (§ 3.2.4.2).
Before actually running GROUPR, the content of the PENDF files with respect to the threshold KERMAs (in particular the inelastic KERMA MT 304) had to be modified. The KERMA value at threshold was put to zero in order to guarantee a correct computation of the condensation relation (3-17) for the threshold group. This was necessary because, on the PENDF tape, there was no zero KERMA at threshold, but rather a non-zero KERMA just above it. GROUPR then does a linear interpolation between the zero value at the lower group boundary. As a consequence, GROUPR "sees" non-zero KERMA below the threshold resulting in an incorrect multi-group constant for the threshold group.

80 Chapter 3
3.2.4.2 Data conversion
In this step, the content of the GENDF tapes created using NJOY were processed to get the KERMA and gamma spectra files in the format required by the calculational modules. The processing, done separately for each isotope, is schematized in Figure 3-3.
First, the new auxiliary program PROGINMT3 read the two newly generated GENDF
tapes and computed reduced KERMA, ktot,e,X,g and kn e X g, , , , as well as the gamma
production data , Q e X gγ , , , and χ γe X g g, )( → , using relations (3-19) through (3-22). Reduced
total and neutron KERMA are computed for elastic and inelastic scattering, total disappearance and fission, and put into a single file. Gamma production data are created for inelastic scattering, total disappearance and fission, and put into a second file. It is important to remember that the index X in the relations used stands for a summation over all partials in the considered reaction. This summation is done before the application of the reduction relations. For example, to compute the reduced disappearance KERMA, the disappearance cross-section is first computed by summing over the partials MT 102 - 120 (whenever present), and then the disappearance KERMA MT 304 is divided by this sum to get the reduced value.
PROGINMT3 provides a special treatment of the lumped gamma production reaction MT 3 used in the ENDF files for Na23, U235, Pu240, Pu241, Pu242, Am241. For non-fissile isotopes, this contribution is simply attributed to the inelastic production. For the fissile/fertile isotopes, it is divided into inelastic and fission parts assuming a constant fission component taken from the fission production data below the MT 3 energy limit.
Next, the self-written multi-purpose program CHECKLIB [9] was used to check the quality of the created reduced KERMA and spectra files. In particular, the checks were intended to get insight into the quality of the gamma production data. The various checks done and their outcome are discussed in § 3.3.1.
In the following step, the new auxiliary program CONDENSE was used to condense the gamma spectra files from 385 gamma groups to the 36-group VASCO structure (Appendix A). The condensation was done using the following relations:
Q Q g g Ee X g VASCO e X gg G
e X gγ γ γγ γ
γχ, , , , , ,
(,) ( )
)
= ⋅ →∈∑�
(3-28)
and χχ
γγ
γ γ γ
γγ γe X
e X g VASCO
e Xg e X g
Gg Gg G
Q
Q g g E
E,, , ,
, , ,( )
)
( )→ = ⋅
→
∈∑1
(3-29)

Development and Implementation of New Calculational Scheme 81
Figure 3-3: Processing of GENDF files produced by NJOY to get reduced KERMA and spectra files in the format required by ERANOS.
CHECKLIB checks quality of produced data
GENDF file 1 containing - MT 1, 2, 4, 18, etc.
- Total KERMA MT 302, 304, (318), 401
GENDF file 2 containing - MT 1, 2, 4, 18, etc.
- neutron KERMA MT 302, 304, (318), 401 - gamma production data on MF 16
PROGINMT3
Reduced KERMA file containing
k tot e X g, , , ; kn,e,X,g
for 33 neutron groups
Spectra file containing
Q g ge X gγ γχ, , , ( ) ; e,X →
for 33 neutron groups and 385 gamma groups
CONDENSE Condensation from 385 to
36 gamma groups
Spectra file containing
Qγ ,e,X ,g ; χe,X (g→ gγ ) for 33 neutron groups and 36 gamma groups
CHECKLIB - energy balances files
- checks quality of produced data
Final spectra file containing
Q g ge X gγ γχ, , , ( ) ; e,X →
for 33 neutron groups and 36 gamma groups
Final reduced KERMA file containing
k tot e X g, , , ; kn,e,X,g
for 33 neutron groups

82 Chapter 3
where gγ stands for a fine gamma group and Gγ a group of the VASCO structure. These
relations ensure that the energy emitted is conserved. However, not all fine gamma groups lie within the VASCO structure. There is a risk of losing gamma emission energy by doing the condensation. This would then mean that the VASCO structure is not sufficiently broad to treat the emission. However, no problems have been detected, except for Na23 (capture condensation of gr. 3 - 7), Fe57 (gr. 11-15 for inelastic scattering, 27 - 33 for capture), Pu239 (gr. 5 -12 for inelastic scattering). Some other isotopes not mentioned here showed energy lost, but only in capture at high incident neutron energy. On the whole, these problems have little impact on the calculational determination of gamma heating.
Next, CHECKLIB was used to energy balance KERMA and spectra files, i.e. data were modified to satisfy relation (3-24). This adjustment removes any remaining energy balance problems and ensures that energy is conserved when computing the total heating by determining both neutron and gamma components. The adjustment was mainly important for isotopes with MT 3 as this lumped gamma production is not taken into account when generating the KERMA values. (For other isotopes, there were generally only minor modifications as the energy balance was found to be verified.) There is ambiguity in the adjustment. Although, the total reduced KERMA should not be modified, there is still the choice between modifying the neutron KERMA, kn e X g, , , , or the total gamma energy emitted,
Q e X gγ , , , . In the present work, preference was given to modify neutron KERMA and leave the
gamma production data unchanged, as one aims at checking the quality of the gamma production data, and giving indications for further data evaluations. In the case of Fe57, adjustment was done by keeping the neutron KERMA. For this isotope, the gamma data was found to be completely erroneous.
Finally, the thus created KERMA and spectra data were once again checked using CHECKLIB, to make sure that no additional problems were introduced by condensation and energy balancing. No problems were detected.
3.2.4.3 Inclusion of delayed contribution
In nuclear power reactors, the gamma emission through disintegration of fission and activation products amounts to about 30 % of the total gamma emission. This delayed emission cannot be neglected. However, the gamma production data found on MF 12,13 and 15 of the ENDF files describes only prompt emission. Thus, the KERMA and gamma production libraries created so far contain no delayed contribution. This component had to be generated from decay data libraries and added in a supplementary step.
The delayed emission is time-dependent because the production and disintegration of radioactive isotopes varies in time. However, for long-time stable operation of a reactor, it approaches an asymptotic value. For explanation, the simple case of an unstable activation

Development and Implementation of New Calculational Scheme 83
product e, which decays to a stable daughter nucleus, is considered. Assuming a constant neutron flux and a one-group treatment, the atomic density of the activation product, Ne is given by the following differential equation:
dNdt
N N tei c e e= −φσ λ ( ) (3-30)
λe is the disintegration constant of isotope e, and Ni the density of the target isotopes i. The
solution of this equation reads:
N tN
e Nei c
e
te
te e( ) ( ) ( )e= − +− −φσλ
λ λ1 0 (3-31)
Assuming Ne(0) = 0, the delayed gamma emission rate then becomes: � ( ) ( ), , , ,E t N e Ee delayed i c
te delayedeγ
λγφσ= − −1 (3-32)
where E e delayedγ , , is the total gamma energy emitted by the disintegration. Taking into
account the prompt contribution, E e promptγ , , , the total time-dependent gamma emission
through capture in isotope i becomes: � ( ) ( ), , , , , ,E t N E N e Ee total i c e prompt i c
te delayedeγ γ
λγφσ φσ= + − −1 (3-33)
For long-time operation, e et− →λ 0 . Production of the activation product becomes equal to its disintegration, and the emission rate tends towards the asymptotic value given by:
� ( ) ( ), , , , , ,E t N E Ee total i c e prompt e delayedγ λ λφσ→ ∞ = + (3-34)
Once the asymptotic value is reached, the delayed contribution is emitted in apparent coincidence with the prompt emission.
Although only a very simple case was treated above, these results hold true for the more complicated real situation, in which hundreds of radioactive fission products and activation products are produced and may decay via complicated decay chains to become stable isotopes. At steady state, production and disintegration, of all unstable isotopes are equal. The delayed emission is equal to its asymptotic value. As this value is constant in time, it must be equal to the sum of all decay energies emitted by the complete disintegration of all unstable isotopes (fission and activation products) produced at a given moment.
Throughout the present work, steady state was assumed for treating the delayed gamma emission. Obviously, this state cannot, strictly speaking, be fully reached in a reactor as there

84 Chapter 3
are fission products with very long half-lives. However, the contribution of these isotopes is not important. In fact, it has been stated by James [14] that only about 0.032 MeV/fission is emitted by the decay of long-lived fission products for times greater than 108 s after the fission event. This number was verified by doing computations of the total decay energy, with and without the accounting of the decay energies of isotopes (and their daughters) with half-lives greater that 30 years. It was found that the latter contribution was smaller than 1 % of the total decay energy obtained assuming complete disintegration.
The delayed emission due to the disintegration of fission products was calculated separately for each fissile isotope from independent fission yields and decay data. The independent fission yields were extracted from MT 454 of MF 8 of JEF2.2. This evaluation has yields for thermal, fast (400 keV) and fusion neutrons. For fast reactor studies, the 400 keV yields are the appropriate ones. On the other hand, the decay data of interest (decay modes and branching ratios, average decay energies E" " " " " ", ,β γ α E E , gamma emission spectra) were
extracted from the JEF2.2 decay data evaluation. The self-written program SPECTRE2 was used to compute the total alpha, beta and gamma decay energies, EA, EB and EGD, emitted through the complete disintegration of all fission products produced in one fission event of the considered fissile isotope. Furthermore, the gamma emission spectrum was calculated. To be more precise, the program does a summation over all fission products. For each fission product, the program sums all E" " " " " ", ,β γ α E E energy values found by following the
disintegration chain until a stable isotope is reached. Branching ratios are taken into account. When a gamma emission spectrum is present, it is added to form the total delayed emission spectrum in the VASCO multi-group structure. Usually, decay spectra are given using discrete emission lines with an intensity IA. If a ray with energy Ek lying in VASCO group gγ is found,
the multiplicity of the total emission spectrum is increased by I E EA k g⋅ /γ
. For some
isotopes, especially for fission products with short half-lives, both discrete and continuous spectra are present on the ENDF decay files. Thereby, most of the continuous spectra have been measured by Rudstam et al. at Studsvik [15]. In the present work, an attempt was first made to use the more recent continuous data of Rudstam et al.. However, this led to total gamma emission energies significantly lower than the delayed gamma emission values proposed by various authors. Only discrete spectra were finally adopted to compute the delayed data.
As regards the delayed contribution due to the disintegration of the activation products U239, Na24 and Mn56, a modification of SPECTRE2 was used to create these data assuming complete disintegration as in the case of the fissile isotopes, with the exception of U239 for which the decay chain was stopped at Pu239.
The results of the calculations are shown in Table 3-2. The total decay energies EA, EB, EGD are given. EGDspec is the total delayed gamma emission energy computed from the total gamma emission spectrum. For the fissile isotopes, it is seen that this energy is not exactly

Development and Implementation of New Calculational Scheme 85
equal to EGD, which indicates that the decay spectra given in the JEF2.2 evaluation are not
completely consistent with the average gamma decay energies E"γ " .
Table 3-2: Decay energies [MeV] of fission (and activation) products obtained by one single fission (or capture), assuming complete disintegration.
Type of data EA EB EGD EGDspec
Fast fission U235 0.385 6.59 6.39 6.35 Fast fission U238 0.539 8.55 7.94 7.89 Fast fission Pu239 0.269 5.29 5.20 5.11 Fast fission Pu240 0.306 5.78 5.59 5.43 Fast fission Pu241 0.357 6.65 6.19 5.95 Fast fission Pu242 0.401 7.22 6.59 6.35 Fast fission Am241 0.239 4.73 4.54 4.43 Activation of U238 - 0.818 1.69 1.69 Activation of Na23 - 0.552 4.12 4.12 Activation of Mn55 - 0.673 0.234 0.232
In Table 3-3, the delayed fission gamma emission energies are compared to values proposed by Fort and Storrer at CEN Cadarache [13], and the values computed by Yoshida et al. at JAERI [16,17]. In the latter work, the concentration of radioactive nuclide e at time t, Ne(t) is computed first. Then, the aggregated delayed gamma-ray spectrum is calculated by summing up over all the contributing nuclides as follows:
S E t N t E Ee e e e
e( , ) ( ) ( ),γ γ γλ χ= ∑ (3-35)
where χ γe E( ) is the normalized delayed gamma-ray spectrum of the eth nuclide. For short-
lived fission products with unknown gamma-ray spectra, theoretical spectra were used. To get the equilibrium (or steady-state) spectrum, Yoshida et al. assumed a three-year irradiation period. Table 3-3 shows that the data obtained in the present work are quite consistent for U235, U238 and Pu239. This is a very satisfying result in the sense that U238 and Pu239 are the two most important contributors to the delayed fission gamma emission in fast reactor cores. Differences are more important for the other isotopes. In general, data created are lower than the values proposed by the other authors. These differences might be due to the method of summation over individual fission products, for which data is not always very well known [18]. In particular, fission yields for Pu240, Pu241, Pu242 and Am241 have not yet been sufficiently measured.

86 Chapter 3
Table 3-3: Total delayed gamma emission [MeV] in fission of U235, U238, Pu239, Pu240, Pu241, Pu242 and Am241 as given by various authors.
Isotope Present Work JAERI Fort/Storrer
U235 6.35 6.42 6.33 U238 7.89 7.80 8.02 Pu239 5.11 5.33 5.17 Pu240 5.43 5.74 6.31 Pu241 5.95 6.45 6.40 Pu242 6.35 - 7.55 Am241 4.43 - 5.51
In Figure 3-4, the computed delayed emission spectrum of Pu239 is compared to the result obtained by Yoshida et. al. The overall shape of the spectra compare well, thus validating the current method of calculation. In Figure 3-5, the prompt and delayed gamma emission spectra are shown for Pu239. We find that these two spectra are very similar. This implies that, as a first approximation, one could assume the same shape for the prompt and delayed emission spectra when computing total gamma emission sources.
-0.5
0
0.5
1
1.5
2
2.5
3
0 2 4 6 8 10 12
Present WorkJAERI
[MeV
/Fis
sion
]
Energy [MeV]
Figure 3-4: Delayed (steady state or equilibrium) gamma emission spectrum for thermal fission of Pu239.

Development and Implementation of New Calculational Scheme 87
0
0.02
0.04
0.06
0.08
0.1
0.12
0.01 0.1 1 10
Delayed Fission SpectraPrompt Fission Spectra
Num
ber o
f gam
mas
em
itted
in th
e gr
oup
Group energy boundaries [MeV]
Figure 3-5: Delayed (at steady state) and prompt fission gamma emission spectrum for Pu239 at 400 keV incident neutron energy.
At steady state, the delayed contributions can be considered as emitted in apparent coincidence with the prompt emission, and can thus be treated in exactly the same way as prompt emission in the calculations. Accordingly, the computed delayed contributions were simply added to the prompt KERMA and spectra data created earlier. The prompt values were modified as follows using the multi-purpose self-written program CHECKLIB:
k k EA EB EGDtot e X g tot e X g prompt spectrum, , , , , , )= + + + (3-36)
k k EA EBn e X g n e X g prompt, , , , , , )= + + (3-37)
Q Q EGDe X g e X g prompt spectrumγ γ, , , , , , )= + (3-38)
χχ χ
γγ γ γ
γe X
e X e X g prompt e X spectrum
e X g prompt spectrumg g
g g Q g g EGD
Q EGD,, , , , ,
, , ,( )
( ) ) ( )
)→ =
→ ⋅ + → ⋅+
(3-39)
These modifications guarantee the energy balance between KERMA and spectra. An eventual dependence of the delayed data on the incident neutron energy is neglected.
A comment needs to be made regarding the consistency of the created reduced total fission KERMA with respect to the total KERMA calculated in ECCO, as the latter KERMA

88 Chapter 3
are used for the computation of the total heating in burn-up calculations. The ECCO KERMA are computed from (3-23) using the pseudo fission Q-value proposed by Fort and Storrer [13] and given in Table 3-1. As mentioned in § 3.2.4.1, care has been taken to be consistent, and the total fission KERMA in the present work were accordingly computed using the same pseudo Q-values. However, a slight inconsistency was introduced during the processing in that the delayed contribution EB+EGD, derived from the proposal of Fort and Storrer, was first subtracted to get a "prompt" fission KERMA, and later the delayed sum EA+EB+EGDspectrum, computed from the JEF2.2 decay data was added to get the total KERMA. Differences between the subtracted delayed contribution (EB+EGD) and the added delayed sum (EA+EB+EGDspectrum) are 0.5 MeV for U235, 0.7 MeV for U238, 0.2 MeV for Pu239, 1.2 MeV for Pu240, and 0.02 MeV for Pu241. These differences are small (less than 0.6 %) in comparison to the total energy emitted in fission of about 200 MeV. Thus, the described inconsistency should not lead to significant discrepancies when computing the total reactor power using the ECCO total KERMA, as compared to results obtained with the currently created reduced KERMA. This was verified for the ZONA2B CIRANO configuration, for which the use of the reduced KERMA set led to a 0.8 % lower computed total heating, as well as for the case of a simple RZ model of SUPER-PHENIX where the reduced KERMA heating was found to be lower by 1.5 %. The interest in mentioning the difference, between the delayed sums (EB+EGD) and the sum (EA+EB+EGDspectrum) computed from JEF2.2, is more to show that there are certain, although small, inconsistencies between the values proposed by Fort and Storrer (and possibly to be adopted for JEF2.2) and those derived from the decay data in the JEF2.2 evaluation. Thus, by adopting the proposal of Fort and Storrer for JEF2.2, one risks to create inconsistencies within the evaluation. In fact, such inconsistencies are found in the case of the prompt fission energies in ENDF/B-VI: The total prompt fission energy value, EGP, found in MAT 452 of MF 1 MT, is inconsistent with the prompt fission energy computed form the gamma emission spectrum given on MF 12/15.
3.3 Identified Remaining Shortcomings and Uncertainties Associated with the Use of the Data Libraries
In this section, the impact of remaining shortcomings in the produced gamma production files on computation of the gamma source is discussed first. Then, the uncertainty in computing gamma energy emission and gamma heating, due only to uncertainties in the gamma production data , are estimated.
3.3.1 Testing of the Created Data Files, Identified Shortcomings and Estimation of Impact
Despite the fact that major problems in creating reduced KERMA and gamma production data for use in ERANOS, have been identified and removed, there remain certain shortcomings in the created files. These shortcomings were detected through an extensive

Development and Implementation of New Calculational Scheme 89
testing of the created KERMA and SPECTRA files with the self-written CHECKLIB code. All of the shortcomings found are due to problems in the basic gamma production data (ENDF files) used. Below, we list the identified shortcomings and estimate their impact on the computation of gamma sources in fast reactors. The estimation was done in the context of the ZONA2B MASURCA configuration, which is characterized by a PuO2/UO2 core surrounded by a steel/sodium reflector.
List of tests, identified shortcomings and estimation of impact
1) Test for the presence of negative reduced neutron KERMA values: As neutron KERMA are computed according to the energy balance method, relation (3-15), the presence of negative neutron KERMA implies that the gamma production in the basic data file is too high. Negative neutron KERMA were found only for the inelastic reaction. More precisely, erroneous inelastic scattering gamma production data were detected in the case of Fe54, Fe57, Fe58, U235, U238, Pu239 and Pu240 over certain parts of the energy range of interest
Inelastic gamma production data have to satisfy the following energy balance relation:
K E K E Y E E Etot e inel n e inel kine e inel e inel e inel, , , , , , , , , ,( ) ( ) ( ) ( )− = σ γ γ (3-40)
where K En e inel kine, , , ( ) is the inelastic scattering neutron KERMA computed by a kinematics
formula without the use of gamma production data. Hence, in order to estimate the impact of these inconsistencies, the gamma production values Q e inel gγ , , , were modified to be consistent
with the kinematics neutron KERMA, and then the inelastic scattering source was computed with modified and non-modified data for the core region of ZONA2B. The impact of modifying inelastic data should be the most pronounced in this region as the spectrum is harder than in other regions. The results are shown in Table 3-4. The modification leads to a 10 % decrease of the total inelastic source in the core region of ZONA2B.
Table 3-4: Impact of modifying inelastic gamma production data of various isotopes on the computed inelastic gamma ray emission in the core region of ZONA2B.
Isotope Change in inelastic scattering
source due to the modification Na - 1 %
Fe54 + 2 % Fe56 + 2 % Fe57 - 9 % U238 -20 % Pu239 -5 % Pu240 + 0 %

90 Chapter 3
2) Check of the energy conservation relation (3-24): In the case of the capture reaction, this allows to check the gamma production in MF 12,(13),15. In fact, these data are used in GROUPR for the computation of the right hand side of (3-24), whereas the following, physically correct relation, which is only slightly dependent on gamma production data, is used for the computation of the KERMA values (left hand side) in HEATR:
Y E E E E E Q
EA
E
A mcY E E
E QE
AE
e c e c e c e ce c
e c e c
e c e c
, , , , , ,, ,
, , ,
, ,
( ) ( ) ( )( )
( ) ( )
( )
γ γγ
γσ σ
σ
= + −+
++
≅ + −+
1 2 1
1
2
2
(3-41)
where A is the number of nucleons in the target nucleus and mc2 is the neutron rest mass.
Isotopes found to have problems in satisfying the energy conservation over certain parts of the energy range13 are O, Na , Mn55, Fe57, Fe58, Ni61, Ni64, U238, Pu239 and Pu240. The impact of the inconsistencies on the computed capture source is small. In fact, O, Na, Fe58, Ni61 and Ni64 do not contribute in a significant way to the capture emission. U238 and Pu239 show discrepancies only in the high energy groups 1 and 2 . Mn55 and Pu240 contribute in the order of 10 % to the capture source in the reflector and core regions, respectively. Inconsistencies in their data are generally smaller that 10 %, thus leading to a maximal error of 1 % in the capture source.
As regards fission and inelastic scattering, no significant problems were found. Obviously, the energy conservation relation is not guaranteed for isotopes with MT 3 (lumped gamma production), because this contribution was simply added to the inelastic (and fission) production without modifying the KERMA values. However, in this case final consistency was achieved through energy balancing (second CHECKLIB block in Figure 3-3).
3) Check of the capture Q-values: At thermal energy, the capture gamma emission must equal the capture Q-value. This was verified for all isotopes, except a few for which the gamma production was lower than the Q-value. These are: Na23 (10.3 %), Fe54 (2.0 %), Fe56 (1.3 %), Fe57 (wrong gamma production data), U235 (1.3 %), Pu241 (2.4 %). When looking at these differences, it has to be kept in mind that differences of 1 - 2 % can result from the multi-group representation (with the associated mean energies) of gamma production data. The slightly too low capture gamma emission intensities lead to a maximal underestimation of the capture gamma emission of about 1 %.
4) Smooth behavior of fission data: These data should in general increase slowly with increasing incident energy. This was the case for all isotopes.
13 Discrepancies were generally found to increase with the incident neutron energy, reaching several % at a few MeV.

Development and Implementation of New Calculational Scheme 91
5) Elastic data: In elastic scattering, no gammas are produced. Total and neutron reduced KERMA are equal. They should smoothly increase from a practically zero value at thermal incident neutron energy to a few tens of keV (in the case of heavy isotopes) or almost 1 MeV (for light isotopes) at 20 MeV incident neutron energy. This was verified for all isotopes.
Summarizing the above discussion, the overall impact of identified problems in the ENDF gamma production data is small in the case of Pu-burner configurations. Nevertheless, an effort should be undertaken by the evaluators to correct the (too low) inelastic data of U238, because this is an important gamma source in the fertile blanket of breeder configurations (about 10 % of the total gamma emission).
3.3.2 Estimation of the Uncertainty on Computing the Gamma Energy Emission
The uncertainty (1 σ) on computing the gamma energy emitted in fission, capture and inelastic scattering, using the currently created data library, is estimated below. Thereby, only the uncertainties due to gamma production data are taken into account. Other sources of uncertainty, such as the neutron flux and neutron cross-sections, are not considered. Furthermore, uncertainties due to the shape of the emission spectrum do not intervene when discussing the uncertainty on the gamma energy emission. Thus, effectively, only the uncertainties on the Q e X gγ , , , values have been considered. Again, the ZONA2B configuration
is taken to be representative.
1) Uncertainty on computing the fission gamma energy emission: As shown in Table 2-2, values proposed by different authors for the prompt and delayed total gamma energy emission in fission, EGP and EGD, show quite a large spread. As Q e fission gγ , , , is basically the sum of
EGD and EGP (the energy dependence can in general be neglected), the uncertainty on the computed fission energy emission can be estimated by comparing (EGP+EGD) values from different sources. This is done, relative to values adopted in the present work, in Table 3-5.
Table 3-5: Differences of (EGP+EGD) values taken from various sources, with respect to the values adopted in the present work.
Isotope James (1969) Sher (1981) VASCO-1 (1987)
ENDF/B-VI Fort and Storrer (1997)
U235 + 16.3 % + 1.8 % + 16.5 % + 1.8 % - 0.8 % U238 + 2.5 % - 6.1 % -6.8 % - 4.7 % - 5.0 % Pu239 + 13.9 % + 3.0 % + 19.6 % + 3.0 % - 5.0 % Pu240 + 18.6 % + 6.7 % - + 1.8 % + 5.1 % Pu241 + 19.7 % + 6.4 % - + 6.4 % + 0.0 %

92 Chapter 3
With respect to the most recent sources (ENDF/B-VI, and Fort and Storrer), the total fission energies adopted in the present work differ by up to 6.4 %. For the dominant isotope in the fission emission, Pu239, the value from ENDF/B-VI and that of Fort and Storrer differ by 8 %. The latter may be taken as a reasonable estimate of the uncertainty on the fission source. In fact, it corresponds to the uncertainty (7 %) given by Fort and Long [19] on the total prompt gamma energy.
2) Uncertainty on computing the capture gamma energy emission: Capture Q-values are in general well known. The capture gamma emission is then in principle given by the analytical relation (3-41) and thus precisely know. The created values have been tested against this relation. In general, the data were found to be correct. The impact of the few deficiencies found was shown to be an underestimation of the gamma source by at most 1 %. The estimated uncertainty on the capture gamma energy emission is accordingly taken to be 1 % - 2 %. This corresponds, qualitatively, in fact, to the maximum precision which can be obtained by representing gamma emission using the multi-group formalism.
3) Uncertainty on computing the inelastic scattering gamma energy emission: Isotopes contributing in an important way to the inelastic scattering source are Na, Fe54, Fe56, Fe57, Cr52, Cr53, Ni58 and Ni60, and (in fissile zones) U238, Pu239 and Pu240. The correctness of inelastic gamma production data used for Ni isotopes was tested by Peerani et al. [8] and that of the chromium data (taken from ENDF/B-VI) by MacFarlane [11]. Problems in computing the inelastic emission may thus be expected mainly from iron and fissile isotopes. As indicated earlier, the precision with which the inelastic source is computed was shown to be about 10 % in the core region. In the reflector region, U238 is not present. The impact of modifying Na and iron data was found to increase the inelastic source by 1 % in the inner part of the reflector and to decrease it by 2 % in the outer part. Accordingly, the uncertainty on the inelastic source is taken to be 2 % in non-fuel regions and 10 % in fuel regions.
3.3.3 Estimation of the Uncertainty on Computed Gamma Heating
When estimating the uncertainty on computed gamma heating due to uncertainty on gamma production data, the relative contributions of the different gamma production sources have to be taken into account. In the case of the ZONA2B assembly, the relative contributions of the different gamma production processes along the core mid-plane are shown in Figure 3-6.

Development and Implementation of New Calculational Scheme 93
0
20
40
60
80
100
0 10 20 30 40 50 60 70 80
FissionCaptureInelastic Scattering
% o
f tot
al g
amm
a he
atin
g
Distance from core center [cm]
Core Reflector
Figure 3-6: Relative contributions to total gamma heating along the core mid-plane of ZONA2B by gammas created in different reactions.
In the core region, fission gammas contribute about 66 % to the heating, capture gammas 19 % and inelastic gammas 15 %. Addition of the estimated uncertainties on the different gamma source components (8 % for fission, 2 % for capture, 10 % for inelastic scattering) leads to an uncertainty of 7.2 % on calculated heating in the core region. In the reflector region, far from the core, the dominant contribution is capture and the uncertainty on the gamma heating becomes 2 %. Close to the core, gamma rays coming from the core contribute in an important way to heating and the uncertainty will be of the same order of magnitude as in the core. The same estimation holds true for diluent sub-assemblies placed in the core where a major part of the heating is due to the gammas created in the surrounding core region (§ 2.3.3). It thus needs to be borne in mind that the relatively high uncertainty on the gamma source in the core will not only have an impact on the computed heating in the core region, but also lead to a relatively high uncertainty on the computed gamma heating in diluents and in the reflector region adjacent to the core.
There is an additional uncertainty on computed gamma heating due to the uncertainty on the emission spectra. This effect was not studied in detail. However, it has to be kept in mind that the detailed shape of the emission spectrum will affect the propagation of gammas from their place of birth. Therefore, imprecise knowledge of the emission spectrum will lead to an additional uncertainty on computing total gamma heating at locations for which transport effects are important, i.e. mainly close to region interfaces. Furthermore, the shape of the emission spectra will determine to some extent the form of the gamma spectrum locally. This

94 Chapter 3
form is of importance when multiplying the gamma flux with a response function such as the KERMA values of a given material (e.g. iron).
In Table 3-6, the currently estimated uncertainty values on the computed total gamma heating for different regions of a Pu-burning fast reactor configuration are summarized. It should be stressed that the given values only take into account errors in the gamma production data and that too, effectively, only those on the total gamma emission energies, Q e X gγ , , , .
Effects of uncertainties on the emission spectra, χ γe X g g, ( )→ are not included.
Table 3-6: Uncertainty (1 σ) on computed total gamma heating due to uncertainties in gamma production data in different regions of a Pu-burning fast reactor configuration.
Region Estimated uncertainty
on computed total gamma heating Core 7.2 % Inner Reflector 7.2 % Outer Reflector 2 % Diluent Sub-assembly 7.2 %
[1] M.S.Kalra, M.J.Driscoll, "Gamma Heating in LMFBR Media", Report MITNE-179, Massachusetts Institute of Technology (1976)
[2] E.Lefèvre, "Mise au Point et Validation d'un Nouveau Formulaire Adapté au Calcul des Protections Neutroniques des Réacteurs à Neutrons Rapides", Ph.D. Thesis, Université de Provence Aix-Marseille I (1996)
[3] A.Lüthi, G.Rimpault, "Inventory of the Nuclear Data Libraries Used for Energy Release Calculations with the Formulaire JEF2/ECCO/ERANOS", JEF Meeting, Paris (1995)
[4] L.C.Leal, R.N.Hill, H.S.Khalil, "An Evaluation of Neutron and Gamma Heating in Fission Product Isotopes", Transactions of the American Nuclear Society 68, 467 (1993)
[5] P.F.Rose and C.L.Dunford, "ENDF-102 - Data Formats and Procedures for the Evaluated Nuclear Data File ENDF-6", Informal Report BNL-NCS-44945, Brookhaven National Laboratory (1990)
[6] C.Cavarec, "Some Comparisons: Gamma Production Gamma Data in the JEF1 Library", Internal Memorandum, CEN Cadarache (1988)
[7] C.Cavarec, "Calcul des Spectres Gamma", Internal Memorandum, CEN Cadarache
[8] P.Peerani, G.C.Panini, M.Frisoni, "Kerma and Photon Production Data for the ECCO Shielding Library", Technical Note QT WCD 00004, ENEA Cassaccia, (1993)
[9] A.Lüthi, "Creation of Temporary Reduced Kerma and Spectra Files in the 33 Group ECCO Structure", Internal Memorandum, CEN Cadarache (1995)
[10] J.L.Rowlands, "Energy Produced in Reactions with Heavy Isotopes: Proposed Choice of Data for JEFF-3.0", JEF Document JEF/DOC-564

Development and Implementation of New Calculational Scheme 95
[11] R.E.MacFarlane, "Energy Balance of ENDF/B-VI", International Conference on Nuclear Data for Science and Technology, Gatlinburg-Tennessee (USA), March 9-13, 1994
[12] R.E.MacFarlane, D.W.Muir, "The NJOY Nuclear Data Processing System, Version 91", Report LA-12740-M, Los Alamos National Laboratory (1991)
[13] E.Fort, F.Storrer, Internal Memorandum, CEN Cadarache (1997)
[14] M.James, "Energy Released in Fission", Journal of Nuclear Energy 23, 517 (1969)
[15] G.Rudstam, P.Johansson, O.Tengblad, P.Aagaard, J.Eriksen, "Beta and Gamma Spectra of Short-lived Fission Products", Atomic Data and Nuclear Data Tables 45 (2), 239 (1990)
[16] T.Yoshida, J.Katakura, H.Ihara, "Calculation of the Delayed Fission Gamma-Ray Spectra From U-235, U-238, Pu-239, Pu-240, and Pu-241: Tabular Data", Report JAERI-M-89-037, Japan Atomic Energy Research Institute (1989)
[17] T.Yoshida, J.Katakura, "Calculation of the Delayed Gamma-Ray Energy Spectra from Aggregate Fission Product Nuclides", Nuclear Science and Engineering 93, 193 (1986)
[18] F.Storrer, personal communication
[19] E.Fort, P.Long, "Prompt Gammas emitted in Fission: Phenomenological Model Proposed for JEF2 Evaluations", Technical Note, CEN Cadarache (1988)


97
4. GAMMA-HEATING MEASUREMENTS AT THE MASURCA FACILITY
This chapter covers the experimental part of the present thesis, which was orientated in two main directions:
1) Establishment of an experimental validation basis for the calculational scheme developed and described in Chapter 3: For this, a large number of absolute gamma-heating measurements using ThermoLuminescent Dosimeters (TLD) were performed in various configurations of the fast critical facility MASURCA at CEN Cadarache. The measurements were part of the CIRANO experimental programme (§ 2.2.2), in support of the modification of the existing fast reactors PHENIX and SUPER-PHENIX into plutonium-burning reactors. It is important to point out that these measurements were designed to yield results for gamma heating in iron, since the latter is the major constituent of the non-fuel regions (reflector, diluent sub-assemblies) of Pu-burning fast reactors. Calculations and measurements have been compared accordingly (Chapter 5).
2) Investigation of possible sources of systematic errors: As discussed in the review of former gamma-heating measurements using TLDs and their analysis (§ 2.4), calculations have usually been underestimating gamma heating (C/E < 1), although on the basis of recent assessments of basic data (gamma energy released in fission) one would expect an overestimation. Consequently, the question of systematic errors in the experiments had to be addressed. After a detailed analysis [1], three possible sources of systematic errors were identified. These were: (i) the TLD measurement itself which was found to be susceptible to the risk of systematic drifts, (ii) the absolute calibration of the TLDs and (iii) the computation of correction factors which are needed to derive the quantity of interest, i.e. gamma heating, from the raw experimental readings. An effort has therefore currently been made to minimize the effect of these possible systematic errors. This was accomplished by: a) establishing a fully reproducible TLD measuring procedure, taking advantage of newly purchased equipment (TLD reader and annealing oven), b) doing repeated TLD calibrations, c) carrying out calibration and reactor irradiations and their analysis as consistently as possible, d) verifying the numerical analysis of the calibration by analyzing a supplementary irradiation at the calibration facility, carried out in a different geometry, e) computing the calculational correction factors employing the most recent methods/data and f) doing supplementary measurements to verify the most questioned calculated correction, viz. the cavity relation.
Apart from the effort made to increase the reliability of the absolute dose determination, care was also taken to reduce the statistical, and hence overall, error in the experiments.
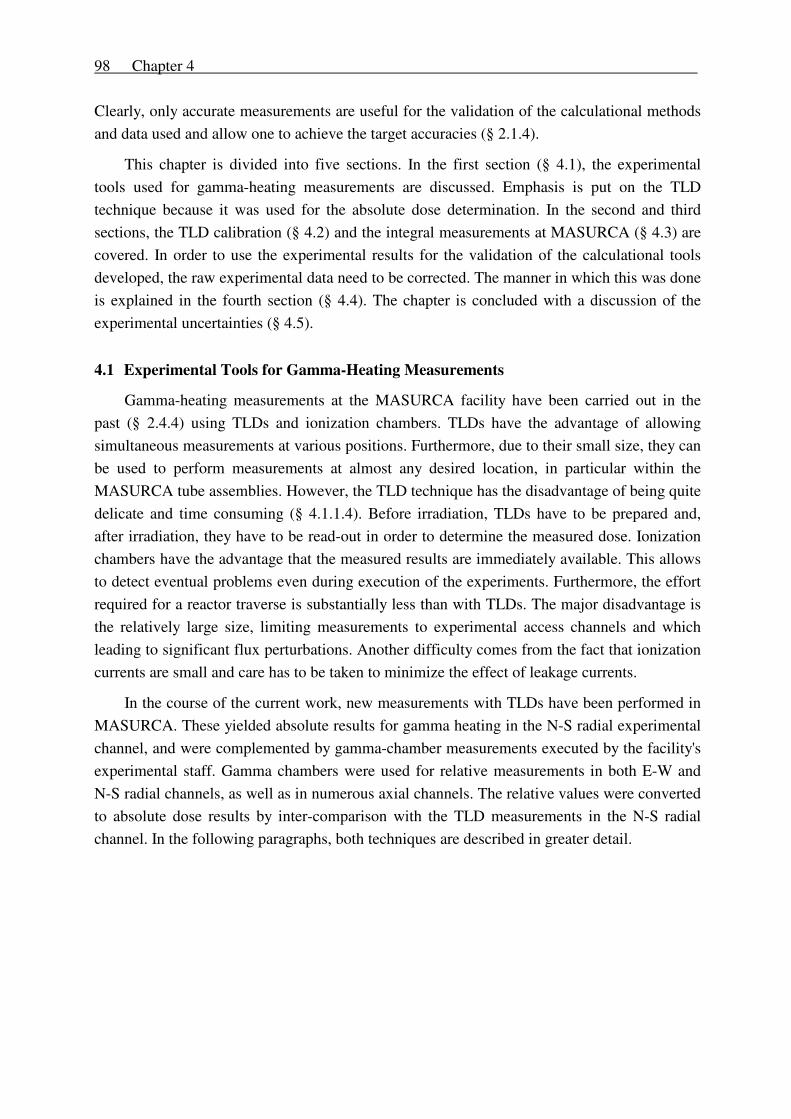
98 Chapter 4
Clearly, only accurate measurements are useful for the validation of the calculational methods and data used and allow one to achieve the target accuracies (§ 2.1.4).
This chapter is divided into five sections. In the first section (§ 4.1), the experimental tools used for gamma-heating measurements are discussed. Emphasis is put on the TLD technique because it was used for the absolute dose determination. In the second and third sections, the TLD calibration (§ 4.2) and the integral measurements at MASURCA (§ 4.3) are covered. In order to use the experimental results for the validation of the calculational tools developed, the raw experimental data need to be corrected. The manner in which this was done is explained in the fourth section (§ 4.4). The chapter is concluded with a discussion of the experimental uncertainties (§ 4.5).
4.1 Experimental Tools for Gamma-Heating Measurements
Gamma-heating measurements at the MASURCA facility have been carried out in the past (§ 2.4.4) using TLDs and ionization chambers. TLDs have the advantage of allowing simultaneous measurements at various positions. Furthermore, due to their small size, they can be used to perform measurements at almost any desired location, in particular within the MASURCA tube assemblies. However, the TLD technique has the disadvantage of being quite delicate and time consuming (§ 4.1.1.4). Before irradiation, TLDs have to be prepared and, after irradiation, they have to be read-out in order to determine the measured dose. Ionization chambers have the advantage that the measured results are immediately available. This allows to detect eventual problems even during execution of the experiments. Furthermore, the effort required for a reactor traverse is substantially less than with TLDs. The major disadvantage is the relatively large size, limiting measurements to experimental access channels and which leading to significant flux perturbations. Another difficulty comes from the fact that ionization currents are small and care has to be taken to minimize the effect of leakage currents.
In the course of the current work, new measurements with TLDs have been performed in MASURCA. These yielded absolute results for gamma heating in the N-S radial experimental channel, and were complemented by gamma-chamber measurements executed by the facility's experimental staff. Gamma chambers were used for relative measurements in both E-W and N-S radial channels, as well as in numerous axial channels. The relative values were converted to absolute dose results by inter-comparison with the TLD measurements in the N-S radial channel. In the following paragraphs, both techniques are described in greater detail.

Gamma-Heating Measurements 99
4.1.1 Thermoluminescent Dosimeters (TLDs)
Thermoluminescence dosimeters are widely used, especially in personal dosimetry. There exists an extensive literature and discussions of the technique can be found in many references, e.g. [2,3].
The basic idea underlying gamma-heating determination by TLDs is the same as for an ionization chamber. A solid dosimeter is introduced as a cavity into the material in which one wants to determine gamma heating. Secondary electrons produced in the surrounding material and the TLD itself (through primary gamma radiation) will then deposit a certain amount of energy in the dosimeter material. Part of this energy is stored in the TLD through the creation of electron/hole pairs trapped at various levels. Heating up the dosimeter (in the TLD reader device) leads to recombination of the electron/hole pairs and the so-called "thermoluminescent" light emission. This light emission, which is proportional to the gamma dose deposited in the TLD, is measured via photo-multiplier optics. Problems arise because the dosimeter's sensitivity strongly depends on experimental conditions such as handling, heating and annealing procedures, and on the energy and type of the incident radiation.
In the following paragraphs, the dosimeter type currently used (TLD-700) is described first, and special attention is paid to the response characteristics of this TLD to gamma and neutron irradiation. These are clearly important in the context of the gamma-heating measurements having been carried out in the mixed gamma/neutron field of the MASURCA facility. Then the oven and reader equipment used is presented, followed by a detailed description of the measuring procedure.
4.1.1.1 TLD-700
TLD-700 is an enriched (99.96-99.99% Li7, 0.01-0.04% Li6) lithium fluoride thermoluminescent dosimeter produced by the Bicron/Harshaw company, which contains magnesium (Mg) and titanium (Ti) as activators. In the present work, TLD-700 rods, having a square cross-section of 1 mm x 1 mm and a length of 6 mm were used. The choice of this TLD was justified by the fact that TLD-700 is by far the most widely used material, and thus its main characteristics are well known. Furthermore, TLD-700 has only a low sensitivity to neutrons. Table 4-1 summarizes some of the physical and dosimetric properties of LiF:Mg,Ti dosimeters. The glow curve of LiF:Mg,Ti is complex with a number of glow peaks in the temperature range of 20°C to 400°C. Table 4-2 gives the location of the peaks obtained by reading several TLD-700 from 100 °C to 400 °C at a linear heating rate of 10 °C/s. It should be borne in mind that the precise location of the glow peaks depends on the reader and the heating rate.

100 Chapter 4
Table 4-1: Physical and general dosimetric characteristics of LiF:Mg, Ti [4,5].
Density 2.64 g cm-1 Melting point 846°C
Light transmission 110 to 7000 nm Lattice cubic (NaCl), a = 4.0269 A
o
Effective Z 8.2 Energy gap 10 eV
Photon energy response without added filter (30 keV/60Co)
1.25
Useful Range 0.01 rad - 100 rad (linear) 100 - 1000 rad (supra-linear)
Fading 20 % / 3 months : peaks 2 - 5 10 % / 3 months : peaks 3 - 5
< 5 % / year : peaks 4 - 5 Residual TL less than 2 % Reusability >500 uses: <0.02% TL loss/use
TL emission spectra 350 - 600 nm, max. at 400 nm Dose rate independence up to 1011 rad s-1
Table 4-2: Measured locations of peak maxima of TLD-700 at a linear heating rate of 10 °C/s, obtained with the equipment used in the present work.
Peak Peak Location 2 140 °C - 161 °C 3 182 °C - 203 °C 4 216 °C - 238 °C 5 231 °C - 256 °C 6 298 °C - 324 °C 7 approx. 380 °C

Gamma-Heating Measurements 101
4.1.1.2 Response to gamma rays and neutrons
For measurements in a mixed gamma and fast neutron environment (such as the one found within zero-power fast reactor assemblies), it is necessary to know the sensitivity of the TLDs used to both types of radiation. The quantities of interest are ηγ and ηn, which are
defined as the efficiency for converting gamma ( Kγ ) and neutron (Kn) KERMA to light
photons and hence TLD output:
[ ] [ ]
η
η η
η
γγ
γ
γ
= Q
K
= = nC rad
= QK
n-1
n
nn
(4-1)
where Qγ and Qn denote the reader output in units of nC. As seen later on (§ 4.4.1.1), the
important quantity in mixed-field dosimetry is the relative efficiency ηn/ηγ. In general, one expresses the efficiency for detecting neutrons relative to that for 60Co γ-rays (as standard). This latter quantity is denoted by ηn/ηs.
The problem is thus to find, or at least experimentally determine, the relation between the energy deposited in the dosimeter (K) and its response (Q). In a fast reactor assembly, practically the entire gamma dose is due to gammas with energies between 100 keV and 10 MeV. This holds true for LiF, as well as the surrounding media (iron, Teflon, core and reflector homogenized compositions). Therefore, ηγ has to be known in this range. As regards
ηn, the range of interest is from a few keV to about 6 MeV as the neutron KERMA in LiF is
mainly due to neutrons between these energies.
LiF: Mg,Ti Response to Gamma Radiation
The response of LiF-TLD to gamma radiation exhibits two very important properties, which simplify the gamma dosimetry significantly. Firstly, for a given absorbed dose, the response is essentially independent of the incident photon energy for photons above 10 keV. This characteristic is shown in Figure 4-1 (the response per rad is of interest, i.e. curve C). Secondly, below a certain threshold dose level, the TL light output per unit mass is proportional to the absorbed dose. This is shown in Figure 4-2. Obviously, this linear region suits dosimetric purposes best. The practical consequence of Figures 4-1 and 4-2 is that a 60Co γ-ray source calibration can be used, as first approximation, to determine ηγ in the linear
range for all photons above about 10 keV.

102 Chapter 4
Figure 4-1: TL response of LiF per roentgen and per rad [2].
Figure 4-2: Relative response of TLD-700 (3.2 mm x 3.2 mm x 0.9 mm ribbons) as a function of gamma exposure [6].
Li7F Response to Neutrons
In 1985, a detailed review of the relative sensitivity of commonly available TLD materials to neutrons was carried out by Gibson [7,8] on behalf of CENDOS (Co-operative European Research Program on the Collection and Evaluation of Neutron Dosimetry Data). The compiled measured neutron responses of a given TLD show quite large spreads, and this is most probably due to variations in the following parameters/factors: composition and geometry of the TLD (e.g. minor constituents, powder or solid, dimensions and shape), read-
10 100 1000 10000 100000 1000000 Cs137 Gamma Exposure in [R]
Linear Region
Supra-linear Region
Saturation

Gamma-Heating Measurements 103
out method (e.g. reader type, heating cycle, glow curve analysis), general experimental procedures (e.g. new or previously irradiated TLDs, annealing, contamination, fading), neutron and photon calibration techniques (e.g. surrounding materials, absolute standards, analysis methods and data).
The most widely investigated TL material with respect to its response to fast neutrons was Li7F 1 and, in the energy range from 0.15 MeV to 7.5 MeV, the compilation comprised 44 measurements. The compilation contained a preliminary evaluation of a study by A.Knipe conducted in the framework of European zero-power fast reactor gamma-ray energy deposition studies [9]. Having identified the neutron contribution as a possible reason for the discrepancies between measured and calculated gamma heating, Knipe investigated the neutron response to fast neutrons in detail. As it was recognized that the experimental technique is an important factor in the determination of the response, a series of measurements of the neutron response of TLD-700 was performed using procedures identical to those employed in studies at both the ZEBRA and MASURCA zero-power fast reactor facilities. The Dynamitron machine at the Birmingham Radiation Center was used, with neutrons
generated in the range 200 keV to 6 MeV from the t(p,n)He3and t(d,n)He3 reactions. Later
on, Knipe updated his results [10,11] and compared them to the four other major independent studies of Wingate et al. [12] (TLD-700), Furuta and Tanaka [13] (Mathushita TLD), Portal [14] (PTL 717), and Scarpa [15] (TLD-700), which make up the CENDOS database for Li7F TLDs. Figure 4-3 shows the measured efficiency ηn/ηs to fast neutrons, in the range 0.154 to
7.5 MeV, as determined by the various authors. From this comparison, the following conclusions can be drawn:
1. The data indicate a constant relative efficiency in the range 0.15 to 7.5 MeV.
2. As there is no clear evidence for energy dependence, it is reasonable to compute mean efficiencies. The mean relative efficiencies for the three TLD-700 data sets are in very close agreement (Wingate et al. 0.115 ± 12 %2; Scarpa 0.114 ± 39 %; Knipe 0.118 ± 4 %). The values for other TLDs are significantly different (Furuta and Tanaka 0.168 ± 15 %; Portal 0.085 ± 13 %). This highlights the importance of selecting relative efficiencies appropriate to the particular detector and procedures being employed when measuring efficiencies.
3. The data by Knipe show the greatest internal consistency, with a relative error on the mean relative efficiency of 4%. This is consistent with the uncertainty on the individual response values measured which amount to typically ± 15 % [10].
11 The notation Li7F is used to design Li7 based LiF dosimeters from different manufactures. TLD-700 indicates the Li7F dosimeter produced by Harshaw/Bicron.
2 The uncertainty indicated corresponds to the statistical error on the mean value.

104 Chapter 4
0
0.05
0.1
0.15
0.2
0.25
0.3
0.35
0.4
0 1 2 3 4 5 6 7 8
Furuta & Tanaka (Matushita TLD)Knipe (TLD-700)Portal (PTL 717)Wingate et al. (TLD-700)Scarpa (TLD-700)
Rel
ativ
e N
eutr
on S
ensi
tvity
Energy [MeV]
Figure 4-3: The measured relative neutron efficiency of Li7F from 0.154 to 7.5 MeV as a function of incident neutron energy.
Although the TLDs have currently been used in a fast neutron environment, the question of sensitivity to thermal neutrons has to be addressed briefly. TLD-700 contains Li6, although only in traces (0.01 - 0.04% mass percent Li6). Nevertheless, the thermal neutron interaction
probability of Li6 is so large (945 barn for Li6(n,α )) that its presence even in small traces is sufficient to give a significant response to thermal neutrons. An average relative sensitivity to thermal neutrons can be extracted from the CENDOS report and is about 1.5 x 10⁴. Although this is several orders of magnitude higher than the sensitivity to fast neutrons, thermal neutrons do not cause an important contribution to the neutron response in a fast neutron spectrum. In the case of the ZONA2B MASURCA configuration, it was verified that the thermal neutron KERMA is very small, so that the thermal neutron contribution is less than 0.4 % at any position in the core or reflector. Hence, it was neglected.
4.1.1.3 Oven and reader equipment used
Throughout the present work, a PTWO annealing oven [16] manufactured by the PTW-Freiburg company was used. This oven has an insulated annealing chamber of approximate dimensions 11 cm x 8 cm x 10 cm. The oven contains a heating element producing a temperature-controlled hot air stream. A built-in fan circulates the hot air and ensures a

Gamma-Heating Measurements 105
uniform temperature distribution throughout the oven volume. For annealing, the TLDs were put on stainless steel trays which can be placed at three different levels.
For reading out the TLDs, the Harshaw-3500 Manual TL reader [5] was used. This is a PC-driven, manually operated system. The technical architecture of the system includes both the reader and a DOS-based IBM-compatible computer connected through a standard RS-232 serial communication port. The dosimetry functions are divided between the reader and the software that runs on the PC. Dosimetric data storage, instrument control and operator inputs are handled by the PC, while signal acquisition and conditioning are tasks performed by the reader. The software provides real-time monitoring of the instrument's operating conditions and display of the glow curves and response values. The reader functions basically according to the scheme given in Figure 4-4. One TLD is read per loading. Thereby, the TLDs are put on an interchangeable heater pan. The reader uses contact heating with a closed loop feedback system that produces linearly ramped temperatures accurate to within ± 1 °C up to 400 °C. The time temperature profile has three segments (preheat, acquire, anneal), for each of which the user can choose time and temperature. During acquisition (second segment), the emitted TL light is measured by a photo-multiplier tube (PMT), thereby collecting 200 data points and generating the glow curve. The performance of the PMT can be monitored by a built-in test light. The reader provides for nitrogen to flow around the heater pan. By eliminating oxygen in the pan area, the nitrogen flow eliminates unwanted oxygen-induced TL signals.
Figure 4-4: Schematic diagram showing the typical arrangement for a TLD reader.
4.1.1.4 Measuring Procedure Using TLD-700
Measuring gamma heating using TLDs is a delicate task. Nevertheless, it is claimed that TLD measurements can be done with a statistical accuracy lower than a few percent [17]. Usually, it is said that the key to successful use of TLDs are consistent, well-controlled and

106 Chapter 4
repeatable procedures. In addition, one must use a clean optical system and a stable, sensitive photo-multiplier tube. However, usually no detailed indications are given as to how to obtain high accuracy. Accordingly, an important part of the current experimental work was dedicated to the definition of a reproducible and accurate experimental procedure for TLD measurements in a fast critical reactor environment.
The definition of the final TLD measuring procedure was based on the experience gained during the application of a preliminary procedure [18] to a large number of TLD irradiations in different regions of the ZONA2B-SIREF and -SI1 configurations of the MASURCA facility [19,20]. After these measurements, the preliminary procedure was optimized and tested by a series of 7 repeated irradiations of a set of 8 TLD-700 employing a low-activity Eu152 gamma source. Below, the final procedure used for TLD calibration (§ 4.2), as well as for the integral measurements in the ZONA5K (§ 4.3.1) and ZONA2B (§ 4.3.2) CIRANO configurations, is described.
Anneal(1 h 400 °C, 2 h 100 °C)
Irradiation(Reactor and/or Calibration)
Choice of TLDs
Initalisation Annealing4 x (1 h 400 °C, 2h 100 °C)
TLD Selection
No-Irradiation(BackgroundDetermination)
Read-Out(Preheat 20 s at 160 °C, read-outduring 30 s from 160 °C to260 °C, heating rate: 10 °C/s)
6 days
2 days
Irradiation inStandard field
Rep
eate
d se
vera
l tim
es fo
r cal
ibra
tions
and
inte
gral
mea
sure
men
ts
TLD selection and preparation
Figure 4-5: TLD measuring procedure.
Figure 4-5 gives the overall sequence of events for TLDs employed in this work. First, the
TLDs to be used were selected and prepared. This was actually a very time-consuming step but was essential when aiming at high accuracy. No new TLDs were available and dosimeters

Gamma-Heating Measurements 107
already used in former MASURCA work (BALZAC) were used. The TLDs were first selected according to their appearance. Only clean TLDs of excellent shape (no scratches) and no change in color were chosen. For initialization, the TLDs were annealed several times to stabilize their sensitivity. After this preparation, the TLDs were examined again and those showing obvious defects (cracks or coloration) were rejected. The finally selected TLDs were annealed once again before irradiation.
For the initialization anneals, as well as the anneal before irradiation, one of the standard oven anneals prescribed for TLD-700 [21,22], i.e. 1 h at 400 °C followed by 2 h at 100 °C, was employed. The high temperature part of the anneal removes any residual thermoluminescence due to former irradiations and restores the TLDs to their initial properties, whereas the low temperature part leads to a well-resolved main dosimetric peak 5. As there is evidence that cooling rates during annealing influence the TLD sensitivity [21], the temperature profile for the anneal (measured using a thermocouple) was controlled via a PC, and a typical profile is shown in Figure 4-6. No significant differences between different anneals were found. However, the temperature profile varies slightly between different positions in the oven and this affects the TLD sensitivity [23]. Therefore, the TLDs were always annealed at the same position in the oven.
0
100
200
300
400
0 50 100 150 200 250 300 350 400
Tem
pera
ture
of o
ven
[°C
]
Time after start of anneal [minute]
Figure 4-6: Temperature profile acquired during the 1 h 400 °C / 2 h 100 °C anneal proposed for TLD-700.
The question was raised as to whether the TLDs should be reader-annealed to reduce statistical dispersion. In fact, reader anneal was shown to lead to very reproducible results for repeated TLD irradiations at EPFL [32]. Nevertheless, it was decided to prescribe the standard

108 Chapter 4
1 h at 400 °C / 2 h at 100 °C oven anneal because: 1) oven-annealed TLDs show the least (i.e. not detectable) dependence on time intervals between anneal and irradiation, and between irradiation and read-out [24,29], 2) reader-annealed TLDs show an increase in sensitivity when irradiated several times with doses slightly in the supra-linear region (200 rad, see Figure 1, [27] and Figure 5 [22]), whereas the proposed oven anneal is believed to restore the sensitivity [21] and to remove the influence of previous irradiations [22,25,26]. Oven anneal thus renders it unnecessary to keep track of the exact irradiation history. In fact, oven annealing seems to be particularly advisable for dosimetry in the mixed gamma/neutron field of a reactor where the high temperature traps of the TLDs get populated mainly due to the neutrons.
After the anneal, the TLDs were stored in general for two days, which allowed the crystalline structure to well stabilize. Then, they were irradiated in the reactor (§ 4.3) or for calibration (§ 4.2). In parallel to the irradiation, a few of the TLDs were kept aside for "background" determination.
Although the risk of changes in the apparent3 TLD sensitivity was limited by always following the same procedure, and by regularly checking the reader sensitivity, it was felt that the TLD measurements remain susceptible to sporadic effects (e.g. a bad TLD/heater contact). Thereby, drifts in the apparent TLD sensitivity between the TLD calibration and the reactor measurements can lead to systematic errors. However, such changes can be detected [27,28] (and subsequently corrected) by irradiating a few TLDs in the calibration facility, in parallel to the main irradiation in the reactor, thereby using exactly the same conditions as in the reference calibration irradiations. Such a control irradiation was performed in case of the ZONA2B MASURCA measurements (§ 4.3). No significant differences in the TLD response with respect to the reference calibration irradiations (§ 4.2) were observed, hence confirming the overall stability of the TLD procedure.
After the irradiation had taken place, the TLDs were in general stored for 5 days before read-out, in order to minimize fluctuations in response due to fading effects. The latter are most significant shortly after irradiation and therefore TLDs should not be read immediately after irradiation. It should be mentioned that an effort was made to always keep the same time interval between anneal, irradiation and read-out, although [29] shows that under usual ambient conditions no significant fading effect or dependence on storage intervals is found for oven-annealed TLDs.
The read-out consisted of a 20 s preheat at 160 °C, followed by linear heating at a rate of 10 °C/s up to a maximal temperature of 260 °C during 30 s. No reader anneal was done. The pre-heating served to empty the low temperature (and thus fast fading) peaks 1 & 2, thereby
3 The sensitivity of a TLD is generally defined as its light output per unit dose deposited in the dosimeter. The word "apparent" is used to indicate that the detected change in sensitivity might not really be due to changes in the dosimeter sensitivity, but due to some other reason such as the change in the sensitivity of the TLD reader device.

Gamma-Heating Measurements 109
further reducing any risk of fading. Peak 3, which might cause some fading problems, was basically removed by the annealing. The thermoluminescence emitted was integrated during the heating up. During this read-out, the main dosimetric peak 5 (and also 4 which lies close to 5) was emptied. The maximal temperature was chosen not to lie much above the temperature of peak 5 in order to reduce any eventual read-out of the low lying tail of peak 6. It is important to note that the read-out profile was defined in accordance with the locations of the TL peaks formerly determined (Table 4-2). For illustration, Figure 4-7 gives the PC display after having read-out a TLD-700 using the described temperature profile. The main dosimetric peak 5 is well resolved.
Figure 4-7: Glow curve of a TLD-700 read-out (acquisition of thermoluminescence emission from 160 °C to 260 °C during 30 s at a constant heating rate of 10 °C/s).
For the read-out, great care was taken to keep the reader electronics as stable as possible
and to check its sensitivity (in particular the PMT sensitivity) not only at the beginning of the read-out, but also regularly throughout it. These results were then used to correct the TLD readings and to normalize all of them to the same PMT sensitivity. Furthermore, the TLDs were handled with great care in order not to damage them mechanically and to keep them clean. Finally, the identity of each TLD was kept track of, in order to allow the individual calibrations to be taken into account.
The reproducibility of the TLD measurement procedure (oven anneal and read-out) can be estimated from the repeated irradiations carried out at the standard Co60 irradiation facility at PSI (§ 4.2). The irradiation conditions here were extremely reproducible, and hence the spread of the responses of a single TLD around its average response is essentially due to the TLD technique itself. On average, this dispersion was found to be 1.6 % (1 σ). This showed that the

110 Chapter 4
TLD technique is indeed well reproducible if a) a strict procedure is followed in all measurements (in order to keep all parameters influencing the measurement constant), b) care is taken to keep the reader electronics as stable as possible, c) the TLD readings are corrected for the measured drifts in the reader sensitivity and d) the TLDs used are carefully selected and appropriately prepared.
The remaining dispersion (< 2 %) is due to factors difficult to control, e.g. the placement of the TLD on the heater tray, variations in the heating profile and slight variations of the TLD efficiency due to annealing. In fact, there is a lower limit for the maximal accuracy (dispersion of results) possible due to factors such as the light detection geometry of the reader which cannot be influenced.
4.1.2 Ionization Chambers
An ionization chamber basically consists of a gas cavity surrounded by a chamber wall. Gammas incident on the chamber will create secondary electrons. Electrons reaching the cavity will ionize the gas. This ionization can easily be measured by applying a voltage to collect the created pairs of ion/electrons. The number of ionizations is directly proportional to the energy lost by the electrons crossing the gas because the energy needed for the creation of an ion/electron pair, W, is a constant of the gas and independent of the type and energy of the ionizing radiation. Therefore, the measured current, I, is proportional to the dose rate in the gas, D tc / ∆ , neglecting recombination of ion/electron pairs. The following relation holds:
D
tI W
e Vc
∆= ⋅
⋅ ⋅ρ (4-2)
where e is the charge of an electron, ρ the density of the gas and V the sensitive volume of the
cavity.
The gamma chamber used for gamma-heating measurements at the MASURCA facility is shown in Figure 4-8. It has a cylindrical shape with a 11.5 mm diameter, a total length of 194.5 mm and an active length of 77 mm. The chamber has a cylindrical annular cavity filled with argon gas at 6 bars and sandwiched between inner and outer electrodes made of stainless steel 304L. The outer electrode is isolated from the chamber body by a tube of aluminum-oxide, the chamber body being made out of stainless steel. The electrodes have a double function. They are used to collect the ionization charge and serve at the same time as the principal source of secondary electrons (i.e. they form the above mentioned chamber wall). For the measurements, the chamber was connected to a preamplifier PI-148 manufactured by the Novelec SA company, France. This preamplifier was connected to the "MINC" (Mesureur - Intégrateur Numérique de Courant continu) device, also furnished by Novelec. The MINC supplies the necessary high voltage for the charge collection and measures the ionization current. The

Gamma-Heating Measurements 111
linearity in dose rate of the integral system was tested in the MASURCA reactor by carrying out irradiations at different gamma-flux levels.
Figure 4-8: Drawing of the ionization chamber used for gamma-heating measurements during the CIRANO programme at the MASURCA facility.
4.2 Calibration Using the Co60 Source at PSI
For all TLDs intended for absolute dose measurements, the efficiency for converting gamma KERMA to TL light output, ηs i, , had to be determined. As discussed in § 4.1.1.2., this
can be achieved experimentally by using a standard gamma source.
4.2.1 Description of the Irradiation and Its Numerical Analysis
Each TLD was calibrated twice using the standard Co60 irradiation facility at PSI. The irradiation conditions were exactly the same for both irradiations. The irradiation geometry is shown in Figure 4-9. A parallel beam of gamma rays was incident perpendicular to a rectangular holder containing the TLDs. The distance between holder and source was about

112 Chapter 4
205 cm, thus reducing positioning errors to a minimum. The holder had lateral dimensions of 4.7 cm x 11.3 cm x 0.8 cm and was made out of mild steel. It consisted of two plates which could be screwed together. One of them had channels of square section 1.2 mm x 1.2 mm to accommodate over 100 TLDs. As over 300 TLDs had to be calibrated, three successive irradiations were necessary during each calibration.
X [cm]
Z [cm]
X [cm]
Y [cm]
4.7
0.0
0.00.3
0.5
TLD
Incident Co60gamma-ray field
TLD holder with channel to accomodate TLDs
0.0
11.3
Figure 4-9: Geometric arrangement for the TLD calibration at PSI.
Great care was taken to carry out the calibration in a consistent way with respect to the
reactor irradiation, in order to minimize sources of systematic error in the determination of the absolute dose. The thermal treatment and TLD handling were exactly the same in both the calibration and reactor irradiations. The irradiation dose was chosen to be 49.95 rads (Co60 air equiv.), which lies approximately in the middle of the range of doses acquired during the reactor irradiations. In this manner, the risk of errors due to eventual non-linearity of the dose response was reduced to a minimum. Finally, the irradiation time was also chosen to be the same (13.5 min.).
The reason for putting the TLDs in an iron container needs some explanation: As the aim of this thesis work was to determine gamma heating in core diluents and reflector regions which are essentially made out of iron, TLDs were irradiated inside iron holders in most of the reactor irradiations. Neglecting for the moment the neutron contribution, the gamma heating in iron for the reactor irradiation is obtained from the raw TLD reading, Qi,reactor, as:
Df
Qironreactor s i
i reactorγ η,,
,=< >
1 1 (4-3)

Gamma-Heating Measurements 113
where <f>reactor relates the dose in the TLD to the dose in the surrounding iron in the reactor and corresponds to the cavity correction discussed in detail in § 4.4.1.2. The reason for embedding the TLD in iron in the calibration irradiation is that (4-3) can then be rewritten as:
D =,ironγ< >
< >
⋅ ⋅f
ff Qcalib
reactorcal i i reactor,'
, (4-4)
where <f>calib relates the dose in the TLD to the dose in the surrounding iron in the calibration
irradiation and the calibration factor fcal i,' is defined as:
ffcal i
calib s i,
'
,=
< >⋅1 1η
(4-5)
fcal, i' can be derived experimentally from the calibration irradiation as:
fD
Qcal iiron calib
i calib,
' , ,
,= γ (4-6)
where D iron calibγ , , denotes the dose in iron at the TLD location in the iron holder used for the
calibration and Qi,calib is the TLD reading from the calibration irradiation.
The advantage of being able to determining fcal, i' experimentally is that, in order to
obtain the gamma heating in iron for the reactor irradiation, the uncorrected experimental
result f Qcal i i reactor,'
,⋅ can be multiplied by the ratio of <f>calib to <f>reactor as per relation (4-4),
instead of having to be divided by <f>reactor as in relation (4-3). Eventual errors in determining the cavity factor <f> may thus be expected to partly cancel, and it stands to reason that a lower overall uncertainty is introduced.
The experimental determination of fcal, i' necessitates a numerical analysis of the
calibration irradiation. In fact, the experimental staff at the calibration facility provides the
gamma KERMA in air at the position of the TLD holder: To determine fcal i,' , however, one
needs to know the gamma heating in iron at the TLD position in the TLD holder. The Monte-Carlo code MCNP [30] has been used for the analysis of the calibration situation. Two different calculations were done in photon-electron coupled mode. In the first, the holder was not present at all and the dose in air was determined at the 7 TLD locations (channels). In the second calculation, the holder was present, but the TLD channels were modeled as filled up with iron. From the two calculations, the average ratio of the gamma heating in iron to the

114 Chapter 4
dose in air calculated for the 7 TLD channels could be determined and was found to be 0.953 ± 0.9 % (1 σ).
Verification of MCNP analysis
The adequacy of the MCNP interpretation of the calibration irradiation was tested by analyzing a supplementary experiment at the Co60 irradiation facility. In this experiment, TLDs were placed inside the holder device used for the ZONA2B integral measurements (Figure 4-13) and irradiated surrounded by iron (mild steel), aluminum and Teflon. Table 4-3 gives the comparison of the measured doses in the TLDs and values computed by MCNP. In determining the experimental values, the raw TLD readings were converted to dose values in LiF by using the individual TLD efficiencies ηs i,
4. The calculated values of Table 4-3 were
obtained by doing a MCNP analysis analogous to the one performed for the calibration irradiation. The experimental uncertainties indicated correspond to the statistical dispersion on the responses of 6 TLDs irradiated with the same surrounding. The calculational uncertainties correspond to the dispersion of the corresponding 6 computed TLD doses. Measurements and calculations are consistent within the indicated uncertainties, which demonstrates the capability of MCNP to correctly simulate the irradiation geometry.
Table 4-3: Comparison of measured and computed (MCNP) dose in TLD-700 when irradiated inside the holder device used for the ZONA2B integral measurements with the Co60 source at PSI.
Medium surrounding the TLD
Measured dose [rad(LiF)]
Calculated dose [rad(LiF)]
C/E
Teflon 44.82 ± 1.4 % 45.81 ± 1.2 % 1.023 ± 1.8 % Aluminum 45.47 ± 4.0 % 47.86 ± 2.3 % 1.053 ± 4.6 % Iron (mild steel) 47.34 ± 2.7 % 47.75 ± 1.1 % 1.009 ± 2.9 %
4.2.2 Results
Table 4-4 summarizes certain global results from the two series of TLD calibrations. For computing the indicated values, the readings of 282 TLDs have been taken into account.
The two irradiations were found to be extremely reproducible. The difference between the average response of all the TLDs was found to be only 0.7 %.
The overall dispersion on the TLD responses obtained during an irradiation was found to be rather high, being about 11 % (1 σ) in both series of calibrations. This is because the
4 These were derived from the calibration irradiations and a supplementary MCNP simulation modeling the TLDs in the calibration holder (Figure 4-9) to determine the relation between the dose in LiF and the KERMA in air.

Gamma-Heating Measurements 115
dispersion is due to both the variation in sensitivity between different TLDs5, and the statistical uncertainty on the TLD technique.
The statistical uncertainty of the TLD technique alone can be estimated by computing the dispersion of the responses of a single TLD around its average response obtained in the two irradiations. On average, a dispersion of 1.6 % (1 σ) was found.
It is seen that only a small fraction of the overall dispersion of 11 % is due to the TLD technique. This justifies the individual calibration of each TLD, which leads to an important reduction of the experimental error. In fact, the uncertainty to be expected for individual calibration factors will be of the order of the uncertainty of the TLD technique, whereas the uncertainty on a global batch calibration factor would be due to the statistical uncertainty of the TLD technique, and moreover due to the spread in sensitivity of the different TLDs within the batch, and thus would be of the order of 11 %.
Table 4-4: Summary of results obtained in the two (repeated) calibration irradiations of the TLDs used for the integral experiments.
Calibration 1 Calibration 2 Results obtained by not Average response of all TLDs [nC] 2772 nC 2792 nC looking at the responses Dispersion (1 σ) on all responses 11.1 % 11.2 % of individual TLD Absolute difference between average
responses in the 2 irradiations
0.7 %
Results obtained by looking at TLDs individually
Average dispersion (1 σ) on the responses of a single TLD in the 2 irradiations
1.6 %
A further conclusion which can be drawn from the two repeated calibrations is that the
reactor irradiation by neutrons and gammas did not change the TLD sensitivity. This follows from the fact that the two calibrations were done before and after the ZONA2B irradiation (§ 4.3.2), respectively, with no major differences between individual TLD responses being observed.
Finally, individual average calibration factors were derived from the two repeated calibrations as:
f f fcalib i calib i calibration calib i calibration,'
, , .'
, , .'( )= +1
2 1 2 (4-7)
5 This is rather high because TLDs from different batches were used.

116 Chapter 4
Applying these factors to the raw TLD readings yields the dose in iron in units of [rad(iron) Co60 equivalent]. This means that one gets the dose in iron while supposing that the TLD was surrounded by iron and irradiated with Co60 gamma rays:
D f Q
iron calib i iγ , , ,'
Co eq.,i60 = ⋅ (4-8)
4.3 Integral Measurements
In this section, the most important integral gamma-heating measurements carried out during this thesis work are discussed. These are TLD measurements which took place in two different configurations of the CIRANO experimental programme (§ 2.2.2), viz. the ZONA5K (§ 4.3.1) and the ZONA2B configurations (§ 4.3.2).
4.3.1 ZONA5K Experiments
The ZONA5K experiments were designed to yield a large number of gamma dose measurements in both the core and the reflector region characteristic of the CIRANO cores, as well as in the central substitution zone having a Pu-enrichment typical of plutonium-burning cores. In total, the gamma dose was determined at 33 different positions along the N-S radial access channel. Special attention was paid to achieve accurate determination of the absolute dose values. Thus, for example, thermal treatment and handling of the TLDs were exactly the same as for the calibration irradiation. The detailed study of the core/reflector interface was of particular interest. At this interface, there is a strong gradient in the gamma dose which cannot be determined accurately using the gamma chamber because its active length is too long. Also, as compared to other regions in the reflector and shielding, the reflector zone directly adjacent to the core sees the highest gamma flux and is thus the most heated.
4.3.1.1 Description of the experimental configuration and the TLD measurements
A horizontal cut across the core mid-plane of the ZONA5K CIRANO configuration is shown in Figure 4-10. The ZONA5K configuration consists essentially of a PuO2/UO2 fueled core (enrichment: 24.5 % Pu) region, reflected by a steel/sodium reflector. In the center of the core, the ZONA5K substitution zone is located. With its high Pu-enrichment of 44 %, this zone is representative of the plutonium-burning core composition foreseen in the CAPRA project. The equivalent cylindrical radii of the different regions are 14.65 cm for the substitution zone, 44.73 cm for the core region and 72.5 cm for the reflector. The height of the core is 60.96 cm and the axial reflector has a thickness of 30.48 cm. The whole configuration is surrounded by a steel shielding. Also shown in Figure 4-10 are the positions of the neutron monitors, and the control and pilot rods. The cell structures for the core and reflector are also indicated. The core cell consists of a chess-like pattern of sodium and fuel rodlets. The reflector cell is composed of stainless steel and sodium rodlets in the ratio 3:1.

Gamma-Heating Measurements 117
-95,4 -84,8 -74,2 -63,6 -53,0 -42,4 -31,8 -21,2 -10,6 0,0 10,6 21,2 31,8 42,4 53,0 63,6 74,2 84,8 95,4 [cm]
-95,4
-84,8
-74,2
-63,6
-53,0
-42,2
-31,8
-21,2C R C R
1 2
-10,6
E-W
0,0 channel
10,6C R C R
2 1
21,2P R
31,8
42,4
53,0
63,6
74,2
84,8
95,4[cm] - Neutron Monitors
N-S ChannelC R Control Rods
P R Pilot Rod
MASURCA tube (10.6 cm x 10.6 cm) Shielding Reflector Cell Z2PIT core cell ZONA5K substitution zonesfilled with (SNEAK) plates
UO2PuO2 Fuel Pin (Diameter 1.27 cm)Sodium Pin (1.27 cm x 1.27 cm)Stainless Steel Pin (1.27 x 1.27 cm)
Filling Pattern of Reflector and Z2PIT core cells
A
C
J K
H G
D
IL
F
B
KA
Figure 4-10: Horizontal sectional view of the ZONA5K CIRANO configuration. The structures of the core and reflector cells are indicated as well.
The measurements took place in the N-S radial access channel. For this, the TLD holder
device shown in Figure 4-11 was used. This basically consists of a cylindrical rod which could slide into an outer, hollow cylindrical tube. The inner rod has triplets of holes of 1.6 mm diameter spaced 2.5 mm apart to accommodate the TLDs. The holder device is made out of mild steel, with an outer diameter of 11.3 mm. This is small enough to slide into the radial access channel, but thick enough to guarantee the build-up of the characteristic electron spectrum for iron.

118 Chapter 4
Hollow mild steel tube TLD holder withholes for TLD
Holes to accomodateTriplet of TLD
Figure 4-11: Cylindrical mild steel holder device used for the TLD irradiation in ZONA5K.
Two consecutive irradiations were carried out. The reactor was first stabilized at constant
power for a sufficiently long duration to achieve a steady (small drift) gamma flux. The TLD holder device was then inserted rapidly into the radial channel and withdrawn as fast as possible immediately after the irradiation. This was repeated for the second irradiation, which was done with the holder device reintroduced exactly into the same position.
The irradiation time (13.5 minutes) and the reactor power (about 20 W) were adjusted so as not to get doses higher than 100 rads(LiF) to avoid large corrections for supra-linearity in the response. Some authors [31] claim that the supra-linearity starts at doses higher than 1000 rad. However, there is evidence [6,32] that supra-linearity starts well below this level, namely at about 100 rads (or even lower). The ZONA2B-SI irradiations [19] gave clear evidence that there is a significant supra-linearity effect for doses higher than 100 rads.
The irradiation time was chosen as long as possible in order to reduce uncertainties due to errors on the irradiation time. In principle, the irradiation time could have been increased by lowering the neutron flux level. However, at the same time, care had to be taken to choose the reactor power in such a way that the background activity (due to the disintegration of fission and activation products produced during earlier periods of reactor operation) remained small compared to the gamma level during the irradiation.
During the irradiation, both neutron and gamma flux levels were monitored. The neutron flux was measured using the standard neutron monitors of MASURCA. The acquisition of the neutron flux level from reactor start-up onwards is important for the accurate calculation of the non-saturation corrections described in detail in § 4.4.1.4. The gamma flux was measured with an ionization chamber placed in the E-W channel. The evolution is shown in Figure 4-20. The figure shows two power steps. The first step corresponds to a stabilization of the reactor at 50 W during which the U235 fission rate at the center of the N-S channel was measured using a well calibrated fission chamber. Both TLD irradiations took place during the second step. It can be seen that during the irradiations, the gamma flux was very stable. From the comparison of the average neutron monitor readings during the two power steps, the fission rate at the core center during the TLD irradiation was deduced. The determination of this value is essential for the absolute comparison of the measured doses to calculations (Chapter 5).

Gamma-Heating Measurements 119
The gamma monitor also allowed determination of the level of the background activity before reactor start-up, relative to the gamma emission intensity during irradiation. This effect was about 1 % and was taken into account in the subsequent analysis (§ 4.4.1.5).
4.3.1.2 Results
In Figure 4-12, the results obtained in the two repeated irradiations are shown6. The indicated (uncorrected) results correspond to the average response of the 3 TLDs irradiated at the same position. The individual TLD readings were converted to the dose in iron (equiv. Co60) using relation (4-8) and applying the individual average calibration factors determined as described in § 4.2. The indicated error bars correspond to the statistical dispersion on the three TLDs irradiated at a given position. On average, a dispersion of 2.5 % is found. Practically all results from the two separate irradiations are consistent within 1 σ, underlying the good agreement obtained. Furthermore, the importance of employing individual calibration factors is clearly put in evidence: although the TLDs used have strongly varying sensitivities, only a small dispersion is found for the dose results.
0
20
40
60
80
100
0 20 40 60 80 100
1. Irradiation2. Irradiation
Gam
ma
dose
in ir
on [r
ad C
o60
equi
v.]
Distance from core center [cm]
ZONA5Ksubstitution
Z2PITcore region
Reflector Shielding
Figure 4-12: Uncorrected measured gamma heating along N-S channel of ZONA5K.
6 The ZONA5K irradiations were initially set up to study the central substitution zone in detail. Unfortunately, due to a manipulation error, all measurement points were displaced by 22.8 cm and only two measuring points were finally obtained in the substitution zone. Nevertheless, these two points have been analyzed and compared to calculations (Appendix E) in order to provide some useful CAPRA-core-specific information.

120 Chapter 4
4.3.2 ZONA2B Experiments
In the ZONA2B configuration, the TLD measurements performed were intended to yield an experimental validation basis for the calculational tools and methods used for the determination of the cavity correction factor (Appendix D), as well as to serve as a cross-check of the absolute dose measurements in ZONA5K.
Quantitatively, one expects the responses of TLDs irradiated in different materials to be different, since the cavity factor <f>, which relates the dose in the surrounding to the dose in the TLD, is material dependent. Thus, a method to check the determination of the cavity relation (and the calculation of the dose in the surrounding medium) is to irradiate TLDs in different surroundings. Accordingly, in ZONA2B, TLDs were not only irradiated in iron, but also in Teflon and aluminum.
Apart from the gamma heating measurements by TLDs, a series of ionization chamber measurements was executed by the experimental staff at the MASURCA facility. The measurements were intended to yield a relative mapping of gamma heating across the whole configuration. Thus, traverses were done in both the N-S and the E-W radial channel, as well as in three axial access channels. The detailed description of these measurements, which are documented fully in [33], is omitted here.
4.3.2.1 Description of the experimental configuration and the measurements
The ZONA2B configuration is very similar to the ZONA5K configuration described in § 4.3.1.1, with the difference that there is no substitution zone at the core center. Thus, it is a clean PuO2/UO2-fueled core, reflected by a steel/sodium reflector. Compared to ZONA5K, there are a few supplementary core cells at the core periphery, and the core has a critical radius of 45.0 cm instead of 44.73 cm. Otherwise, the various dimensions are the same as for ZONA5K.
For the TLD measurements, the special holder device shown in Figure 4-13 was designed. Basically, it consists of a tube which can be loaded with holder pieces to accommodate TLDs and with filling pieces to separate them. This modular construction has the advantage of maximal flexibility: the tube can be loaded with pieces of various geometrical shapes and made out of different materials.
The outer diameter of the holder-carrying tube was chosen to be 10 mm. This allowed one to slide the holder device smoothly into the experimental channel (having a square opening 11.6 mm x 11.6 mm), and thus reduced handling errors (as regards irradiation time and positioning).
Gamma-Heating Measurements 121
Figure 4-13: TLD holder device used for the TLD irradiations in ZONA2B.

122 Chapter 4
For the ZONA2B measurements, two different holder types (shown in Figure 4-13) were used. Holder type A allows to accommodate three 1 mm x 1 mm x 6 mm TLDs orientated perpendicular to the axis of the holder-carrying tube. Holder type B has locations for 4 TLDs orientated parallel to the axis. The irradiation of 4 TLDs at the same position decreases the statistical uncertainty on the mean dose response.
The outer tube, the filling pieces and the holders of type B were made out of mild steel, in accordance with the principal goal of determining gamma heating in steel/sodium reflectors and sodium/steel diluent sub-assemblies. In these regions, the use of an iron device leads to the least perturbation. Holders of type A were fabricated not only out of iron, but also out of Teflon and aluminum.
The irradiations were done as in ZONA5K by placing the holder device in the N-S channel. Four consecutive irradiations of different holder loadings were performed at constant neutron flux. In the first three irradiations, TLDs were irradiated in different surroundings, namely iron (1. irradiation), Teflon (2. irradiation), and aluminium (3. irradiation). In each case, the TLD tube was loaded with holders of type A at 4 positions in the core and 6 positions in the reflector. Moreover, at 4 other positions, TLDs were irradiated in holders of type B, in order to have internormalisation points in all 3 irradiations. All 13 irradiation positions were exactly the same in the three irradiations to allow comparison between irradiations in different surroundings. In the 4th irradiation, the holder tube was filled with TLD holders of type B at 17 positions, 12 of them being the same as in the first three irradiations, in order to allow comparison between irradiations in holders A and B.
During the irradiation, the neutron flux stability was excellent (± 0.2 %). The increase in gamma level was about 1 % from the beginning of the first irradiation to the end of the last irradiation. This slow drift was confirmed by comparing the results at the inter-normalization position. No correction for the drift was applied for the results as presented in § 4.3.2.2.. However, for the comparison with calculations, the drift in the gamma emission was taken into account through the separate determination of the non-saturation correction (§ 4.4.1.4) for each irradiation.
4.3.2.2 Results
Figure 4-14 gives the results for TLDs irradiated when surrounded by iron. The indicated (uncorrected) results correspond to the average response of the three (holder type A) and four (holder type B) TLDs irradiated at each location. (The individual TLD results were obtained employing (4-8)). The indicated error bars correspond to 1 σ, which was on average 2.6 % for TLDs in holder type A and 2.2 % for TLDs in holder type B. The average responses of TLDs irradiated in holder type A and in holder type B are in agreement within these experimental uncertainties at all but one position. This means that the orientation of the TLDs within the holder is of no consequence, which in turn reflects a homogeneous distribution of the gamma dose within the holder.

Gamma-Heating Measurements 123
0
10
20
30
40
50
60
70
10 20 30 40 50 60 70
ZONA2B (4 TLD)ZONA2B (3 TLD)ZONA5K
Gam
ma
heat
ing
[rad
(iro
n) C
o60
equi
vale
nt]
Distance from core center [cm]
Core Reflector
Figure 4-14: Average readings of TLDs irradiated in the N-S channel of ZONA2B when surrounded by iron. For comparison, the average readings from the ZONA5K irradiation are indicated as well (after normalization to the same neutron flux).
As cross check, the average responses obtained in ZONA5K are also given in Figure 4-14. In fact, comparison of the loading pattern of ZONA2B and ZONA5K shows that, apart form the central substitution zone, the two configurations are basically the same. Furthermore, when filled with iron pieces, the TLD holder device used in the ZONA2B measurements corresponds closely to that used in the ZONA5K irradiation. Finally, the execution procedure and irradiation time were the same in both integral experiments. Thus, results from the ZONA2B and ZONA5K measurements should be directly comparable when normalized to the same neutron flux.
Figure 4-14 shows that, in general, agreement between experimental values from ZONA2B and ZONA5K is good, which confirms the reproducibility of the TLD technique. Agreement is even excellent in the reflector zone not directly adjacent to the core. In the core, ZONA2B values are somewhat more spread out than those for ZONA5K but lie on both sides of the fictive, smooth curve one could fit through the ZONA5K points. The measurements are consistent within 1 σ. Systematic differences (of the order of 6 %) are found within the first 5-7 cm of the reflector. Here, the ZONA2B values are higher than the ZONA5K measurements. Possible reasons for the discrepancies are the supplementary fissile core cell in ZONA2B at the core periphery and close to the N-S channel. However, it seems more plausible that the differences reflect the fact that accurate measurements at the core/reflector interface are

124 Chapter 4
difficult to achieve. In fact, in this zone, the gradient in gamma heating is very strong. Even a small displacement (positioning error) will lead to significant errors in the measured dose (see § 4.5.1.2).
The results of the 3 irradiation runs with TLDs irradiated in different surroundings are discussed in Appendix D.
4.4 Calculational Correction Factors
The gamma-heating measurements performed were principally intended to validate the determination of gamma heating employing the calculational scheme developed in Chapter 3. However, the measurements do not directly yield the quantity of interest, viz. the gamma heating in iron as determined by the calculations, i.e. obtained by folding the whole-reactor gamma flux (computed using a usually 2-dimensional RZ model with the different reactor regions homogenized) with the gamma iron KERMA (see also § 5.1.1). This section deals with the question as to how to derive this quantity from the measured values. The derivation is similar for both TLD and ionization chamber measurements because the basic measuring principle in both techniques is the same (see § 4.1.1 and 4.1.2). Thus, in each case, the measured quantity is approximately proportional to the gamma dose (rate) in a solid state (TLD) or gas (chamber) cavity introduced into the medium7 in which one wants to determine the gamma heating (here iron). In order to get the gamma heating from the measured values, the following conversion factors or corrections have to be determined for both techniques:
1. The neutron correction: Both TLDs and gamma chambers are sensitive to neutrons and this contribution has to be subtracted from the measured dose (rate).
2. The cavity correction: This factor relates measured gamma dose (rate) in the cavity to that in the surrounding wall medium. More precisely, it gives the relation between the dose (rate) in the cavity and the value one would have if the cavity were filled with the surrounding wall medium.
3. The heterogeneity correction: This factor relates the gamma dose (rate) in the fully heterogeneous experimental situation (i.e. the gamma dose (rate) in the surrounding wall medium as determined via the cavity correction from the measured gamma dose (rate) in the cavity) to the gamma heating (rate) computed in the whole-reactor model, in which the different reactor regions are homogenized.
4. The non-saturation correction: This corrects for the fact that saturation of the delayed emission is assumed in the calculation, whereas in the experiment this is not the case.
7 "Medium" throughout the present write-up denotes the material in which one wants to determine gamma heating. "Wall" denotes the immediate surrounding of the cavity, and "wall medium" refers to the material of the wall. In the current measurements, the wall medium was the medium of interest, since TLDs were surrounded by iron and the chamber (electrodes, body) made out of iron.
Gamma-Heating Measurements 125
Saturation is indeed reached for long-operation times such as found in power reactors at steady state. However, for short irradiation times, as encountered in the MASURCA experiments, saturation is not achieved and the evolution of the gamma emission has to be taken into account.
4.4.1 Corrections for TLD Measurements
In this section, the determination of the various corrections for the TLD measurements is first discussed. The deduced corrections are then used to derive the corrected gamma-heating values from the various TLD measurements carried out in ZONA5K and ZONA2B.
4.4.1.1 Correction for neutron sensitivity
For an irradiation in the reactor environment, the response of a TLD i is due to both the dose deposited in the TLD by gammas, D TLDγ , , and the dose deposited by neutrons, Dn,TLD.
Using the definitions given in (4-1), the TLD response can be expressed as:
Q E D E dE E D E dEi reactor i TLD n i n n TLD n n, , , , ,( ) ( ) ( ) ( )= +∫ ∫η ηγ γ γ γ γ (4-9)
Thereby, it is assumed that the two contributions are additive, a fact which seems to be well established [10]. In the energy range of interest, the efficiency for converting gamma KERMA to TLD response, ηγ , is energy independent. Hence, (4-9) can be converted to yield the
gamma dose in the TLD as:
D Q corrTLDs i
i reactor neutrγ η,,
,= −1 (4-10)
with the neutron correction term given by:
corr E D E dEneutrn
sn n TLD n n= ∫
ηη
( ) ( ), (4-11)
As regards the relative efficiency for neutrons, η ηn s/ , the discussion in § 4.1.1.2 has
shown that there is no experimental evidence for an energy dependence in the range of interest. The efficiency can be taken as constant. Thereby, it seems most advisable to use the mean value computed from the measurements by Knipe, 0.118, because 1) he investigated the same type of TLD (TLD-700) as used in the present study, 2) similar experimental procedures were applied and 3) his data shows the best internal consistency. As regards the neutron dose in the TLD, Dn,TLD, this can be assumed to be equal to the neutron KERMA because secondary charged particles produced through neutron interactions have short ranges. Thus, the neutron correction (4-11) was computed according to:

126 Chapter 4
corr Kneutr i g n Li F gg
= ⋅ ⋅∑0118 7. ( ), , ,Ψ (4-12)
Here, Ψi g, corresponds to the integrated neutron flux during the TLD irradiation at the
detector location. It was computed in 33 neutron groups using the RZ model representing the whole reactor. Kn Li F g, ,7 corresponds to the Li7F multi-group neutron KERMA. These values
have been generated from a tabulation by Knipe (Table 1, reference [9]), which gives neutron KERMA of Li7 and F, as well as the KERMA for Li7F (obtained by combining the KERMA of Li7 and F in atomic weight proportions of 0.2697 and 0.7303) in 116 groups. The condensation to 33 groups was done using weighting fluxes obtained from ECCO cell calculations for the core and reflector regions of the ZONA2B configuration. The final KERMA factors did not basically depend on whether they were condensed using a core spectrum or a reflector spectrum.
Two points are noteworthy concerning the KERMA values for Li7F: 1) The use of the data set tabulated by Knipe guarantees consistency with his reported value for the relative sensitivity, which was deduced using the listed KERMA values. 2) TLD-700 contains not only Li7 and F, but also Li6 (0.01 to 0.04 weight percent) and minor constituents such as Na, Mg, Al and Si. Of these traces, Li6 is the most important and leads to highly enhanced sensitivity of TLD-700 at low neutron energies. This effect, however (as already discussed in § 4.1.1.2), was found to be negligible in the current fast reactor experiments.
4.4.1.2 Cavity (spectral) correction
To obtain the gamma dose in the medium surrounding the TLD cavity, the dose in the TLD has to be divided by the cavity correction, <f>, defined as:
fGamma dose= in the TLD
Gamma dose in the cavity filled with the wall medium (4-13)
As discussed in § 4.2.1, the use of the TLD calibration factor fcal, i
' (instead of ηs, i , see
relation (4-5)), implies that the uncorrected experimental reading, instead of having to be divided by <f>reactor to get the gamma dose in the TLD surrounding, can be multiplied by a "spectral" correction defined by:
corr =sp< >
< >f
fcalib
reactor (4-14)
This factor corrects for the fact that the cavity correction depends on the gamma spectrum (see below), which is not the same in the reactor and calibration irradiations. Clearly, in order to minimize the systematic error, <f>reactor and <f>calib have to be determined in a consistent

Gamma-Heating Measurements 127
way [34], and this was achieved through application of the below discussed Burlin cavity theory in both cases.
Burlin cavity theory as presented in the paper by Simons and Yule [35]
Burlin developed a theory which gives the relationship between the dose in the wall medium and that in the dosimeter (for a given gamma energy Eγ ) via the expression:
f E d E E d E E( ) ( ( ) ( ( ( )γ γ γ γ γ= ⋅ + − ⋅, cavity) f , cavity)) fs l1 (4-15)
This is effectively a combination of the so-called small cavity (fs) and large cavity (fl) relations. It is important to point out that the weighting factor d depends both on the incident gamma energy, as well as the cavity size and composition. If the size of the cavity is small compared to the range of the secondary electrons, f approaches the small cavity relation, which is given by the Bragg-Gray equation (4-27) (the appropriate cavity relation for ionization chambers, § 4.4.2.1). On the other hand, if the range of the most energetic electrons is small compared to the cavity dimensions, f is basically given by the large cavity relation, viz. the ratio of the mass-energy absorption coefficients:
f El
en
Dosimeter E
en
Wall E
( ),
,
γ
µρ
µρ
γ
γ
=
(4-16)
To derive expression (4-15), Burlin assumed that the electron spectrum within the cavity
is separable into two components, one characteristic of the surrounding wall medium and the other characteristic of the cavity material. The shape of the surrounding-medium spectral component is assumed constant throughout the cavity. However, the intensity is assumed to decrease exponentially with distance into the cavity, a result that is observed to be approximately true for beta-ray spectra. From this, the weighting factor d can be derived. Effectively, the average intensity of the surrounding-medium spectral component is reduced to a fraction d of its unperturbed value with:
d
x
dx
gg
g
g=
−= − −
∫
∫
exp( )dxexp( )
ββ
β0
0
1 (4-17)

128 Chapter 4
where β is the electron attenuation coefficient and the problem has been reduced to a one-
dimensional one by choosing as the equivalent linear dimension of the cavity the mean chord length, g, across the cavity, given by:
gVS
= 4 (4-18)
Here, V is the volume and S is the surface area. By using the same arguments, it can be shown that the electron spectral component characteristic of the cavity material attains only a fraction (1-d) of the large cavity value.
The attenuation coefficient can be derived from the electron range R. In fact, since the attenuation of electrons is approximately an exponential function, R and β can be related by having the range correspond to a fixed attenuation. Ninety-nine percent were chosen by Burlin, which leads to the relation:
exp( ) .− ⋅ =β R 0 01 (4-19)
Given R, β is determined. From 0.01 to 3 MeV, the electron range can be approximated by:
R g cm n( / ) .2 0 0412= E ; n = 1.265 - 0.0954 ln(E) (4-20)
where E is the electron energy in MeV. From ~ 1 MeV to 20 MeV, the following approximation holds:
R g cm E( / ) . .2 0 530 0106= − (4-21)
The maximum energy in a spectrum of electrons is the dominant parameter in determining
the range R. Therefore, when determining d for a given incident gamma energy Eγ, the range R has to be determined at Eγ because the maximum electron energy is approximately equal to the incident gamma energy.
Application of the Burlin cavity theory
Burlin cavity theory can be applied if the wall surrounding the cavity is thick enough not only to establish the secondary electron spectrum characteristic of the wall medium, but also thick enough to eliminate, through sufficient attenuation, the electrons generated outside the surrounding wall (and in media different from the wall medium). For the current integral measurements in MASURCA, the TLDs were surrounded by enough iron to satisfy these two conditions (see Appendix D). The same holds true for the calibration irradiation.
Using Burlin cavity theory, cavity factors <f>reactor and <f>calib have been computed for 1 mm x 1 mm x 6 mm Li7F TLDs surrounded by iron, and then combined to yield the spectral

Gamma-Heating Measurements 129
correction given by relation (4-14). For this, group-wise cavity factors fgγ were first obtained
employing expression (4-15). The small cavity factor fs was taken from Figure 2 of the paper by Simons and Yule, which gives the small cavity factor as a function of the incident gamma energy for the desired situation (1 mm x 1 mm x 6 mm Li7F in iron). For the determination of the large cavity factor, mass-energy absorption coefficients were computed from the gamma KERMA values of the VASCO formulaire using relation (2-5). The weighting factor d was evaluated using relations (4-17) to (4-21). Thereby, the electron range was computed for the mid-energy of each gamma group. The computed group-wise cavity factors are shown in Figure 4-15. The general behavior of the cavity factor is well represented: At high gamma-ray energies (long electron ranges), the general cavity theory and small cavity theory approach each other. At low energies, the general cavity result reduces to the large cavity prediction. It is thus approximately given by the ratio of the mass-energy absorption coefficients. In this range, the dominant interaction is the photoelectric effect, the cross-section for which is approximately proportional to Z4. Since the effective atomic numbers of LiF and iron differ significantly (8.2 vs. 26), the mass-energy absorption coefficients will differ considerably and there is a large deviation of f from unity.
0.1
1
10
100
0.01 0.1 1 10
Small Cavity TheoryLarge Cavity TheoryBurlin Cavity Theory
1/f
Energy [MeV]
Figure 4-15: Variation of small, large and general cavity factors as a function of gamma energy for a 1 mm x 1 mm x 6 mm Li7F dosimeter surrounded by iron.

130 Chapter 4
Using the group-wise cavity factors fg γ , the dose-weighted8 average cavity factor
<f>reactor and <f>calib were then computed according to:
< >=
⋅ ⋅
⋅
∑
∑f
K f
K
g iron g gg
g iron gg
Φ
Φ
γ γ γγ
γ γγ
γ
γ
, ,
, , (4-22)
where Kγ , iron,gγ is the gamma KERMA for iron and
Φgγ is the gamma scalar flux at the TLD
location. For the computation of <f>reactor for each TLD location, the weighting flux Φgγ was
determined using the whole-reactor RZ model. To determine <f>calib, the gamma spectrum was deduced from the MCNP analysis of the calibration irradiation. The result thus obtained was <f>calib = 1.016.
Verification of the current application of Burlin cavity theory to core and reflector regions was achieved through a combination of Monte Carlo analysis and the supplementary MASURCA measurements mentioned earlier with TLDs irradiated in different surroundings (§ 4.3.2). These aspects are documented in Appendix D. In addition, the Burlin value for the calibration irradiation was verified through comparison with a MCNP coupled photon-electron calculation which yielded <f>calib as 1.002 ± 0.6 %.
4.4.1.3 Heterogeneity correction
All TLD irradiations were done in the N-S radial access channel. The heterogeneity correction relates the gamma heating in the cylindrical TLD holder device to that computed employing the homogeneous RZ model of the reactor.
The heterogeneity correction was studied by decoupling the effect of the heterogeneity of the MASURCA tube loadings from the perturbation due to the presence of the TLD holder device in the experimental channel. The MASURCA tubes are filled with 8 x 8 rodlets of varying compositions (fissile material, sodium, iron, etc.) and are therefore basically heterogeneous in character. The heterogeneity is particularly important in the core region. Here, the experimental radial channel alternatively crosses fissile and sodium rodlets. The gamma sources are several orders of magnitude stronger in the former than in the latter rodlet type. One might thus expect a significant variation in gamma dose depending on the rodlet being crossed. To study this effect, a 2-dimensional, cartesian XY model, representing the core-mid-plane of the ZONA2B configuration, was employed. First, the neutron flux was computed for a homogenized representation of the different material zones. The axial buckling was adjusted to obtain radial fission rate traverses consistent with those computed for a RZ
8 In their paper, Simons and Yule propose weighting by flux instead, but this seems to be wrong.
Gamma-Heating Measurements 131
representation of the configuration. This neutron flux solution was then used to compute the gamma source inside a sub-region equivalent to a 2 x 2 arrangement of MASURCA tubes, using the scheme developed in Chapter 3. The gamma source was created twice, once for a homogenous description of the sub-region, and then for a fully heterogeneous description (representing the different rodlets and the MASURCA tube sheaths). Then, the gamma flux distribution was computed for both sources created. By considering together the results for various sub-regions, the gamma heating in iron along the N-S radial channel was determined. A comparison of the homogeneous and heterogeneous models indicated that the tube heterogeneity leads to variations of the gamma heating of the order of ± 2% with respect to the smooth value obtained in the homogenous case. The "heterogeneous" heating was greater at fuel rodlet positions (+2 %), and lower at those for sodium (-2 %). The fluctuations were found to be less pronounced in the reflector region where an increase (+ 2 %) was seen at positions of the iron rodlets. Generally speaking, the rather low gamma-heating fluctuations can be explained by the fact that gammas travel quite far from their place of origin (§ 2.1.3). Furthermore, the significantly stronger gamma source in the fissile rodlets (leading, a priori, to a higher gamma flux in the rodlet) is compensated by the much stronger absorption in the high-Z material, leading to a strong flux depression. These factors, as well as the fact that the core tubes are loaded in a chess-like pattern of different rodlets, results in a relatively flat gamma flux across the tubes. Therefore, it was concluded that no special correction is needed for the cell heterogeneity. In fact, an attempt was made to correct the different TLD measurements performed in the core region of the ZONA2B internal stockage configurations for cell heterogeneity. No clear "smoothing" of the measured values could be observed, which may be taken as experimental evidence that the cell heterogeneity is negligible for measurements in the radial channel.
The effect of the TLD holder device inside the access channel was investigated using the MCNP code. The 3-dimensional model used for the investigation is shown in Figure 4-16. This corresponds practically to the homogeneous RZ model used in the deterministic ERANOS whole-reactor calculation, with the exception that the channel with the TLD holder device is present. In particular, the MCNP "cells"9 correspond to the spatial meshes of the deterministic model. This correspondence was chosen in order to use the ERANOS calculation for the definition of the gamma-source distribution, the source distribution for the "starting" gamma "particles" being obtained by simply transferring the ERANOS source computed for the different meshes to the MCNP cells. With the gamma source thus defined, the MCNP calculations were run in photon transport mode. Two calculations were done, one with the TLD holder device and channel present, the other without them, the heterogeneity correction factor being obtained by comparing the two simulations.
9 In a MCNP Monte-Carlo simulation, the integral 3-dimensional space is divided into sub-regions, which are referred to as "cells" in the MCNP terminology.

132 Chapter 4
Reflector
Core
Radial Shielding
Axial Shielding
Boron Absorber
Radial Acess Channel with TLD Holder Device
0.0
39.04
69.52
99.04
150.80160.96171.12
200.0
Z [cm]
X [cm]
X [cm]
Y
0.0 45.12 74.20 131.0
Figure 4-16: 3-dimensional model used in MCNP for the investigation of the effect of the TLD holder device inside the radial access channel in ZONA2B.
As an independent check, the effect of the TLD holder device in the access channel was also investigated using 2-dimensional BISTRO SN transport calculations. The RZ model shown in Figure 4-17 was used to represent the holder device inside the access channel crossing the various reactor regions. This situation was compared to a second calculation done using basically the same model, but without the channel present. The calculational scheme described in Chapter 3 was applied to compute neutron flux, gamma source and gamma flux, and finally gamma heating. In fact, the neutron flux was computed only for the RZ model without the channel, and this flux was used to generate the gamma source for both cases. Neutron flux perturbation was thus completely neglected10, and there was no need for internormalisation. (For the neutron flux calculation, the buckling value was adjusted to get fission rates along the Z axis corresponding to those computed in the whole-reactor RZ model.)
The heterogeneity correction factors derived from both the MCNP and BISTRO calculations are shown in Figure 4-18. There is a relatively large effect due to the presence of the holder device in the core region, where the gamma flux is significantly perturbed. On the
10 The perturbation of the neutron flux was investigated by comparing U235 fission and U238 capture rates computed along the Z-axis in the homogenous and heterogeneous models (Figure 4-17), and found to be of the order of 1 %. Neglecting such a small perturbation will lead to a small error in the determination of the gamma source, which, however, is hardly detectable in the gamma heating.

Gamma-Heating Measurements 133
other hand, the effect is not significant in the reflector. This is due to the fact that the holder device, made up of iron mainly, is place in an iron surrounding. The deterministic and MCNP calculations agree well in the reflector region. In the core, the MCNP calculation predicts (on average) a 3% stronger perturbation.
R [cm]
Z [cm|
30.0
0.7790.5740.0
0.045.0 72.5 131.0
Core Reflector Shielding
TLD Holder
Channel (Sheet + air gab)
White boundary
Reflective boundary
Ref
lect
ive
boun
dary
Vac
cum
bou
ndar
y
Figure 4-17: RZ deterministic model used to investigate the effect of the TLD holder device inside the radial access channel crossing ZONA2B.
0.9
0.95
1
1.05
1.1
1.15
1.2
0 10 20 30 40 50 60 70
MCNP modelisationBISTRO SN modelisation
Het
erog
enity
cor
rect
ion
fact
or
Distance from core center [cm]
Figure 4-18: Heterogeneity correction factor for TLD measurements in the radial access channel of ZONA2B.

134 Chapter 4
A further outcome of the above investigations was the Monte-Carlo verification of the SN BISTRO gamma transport calculations. As the MCNP model without the access channel was the same as the RZ model for the whole-reactor deterministic calculations, and because the gamma sources were exactly the same in both cases, the comparison of the computed gamma- heating values was a valuable check of the gamma transport calculations and the used gamma interaction (and KERMA) data. Gamma heating was compared along the core mid-plane, and good agreement was obtained (agreement within the statistical error of the MCNP calculations of 1 - 2 %, except at one position in the reflector were the difference was 5 %).
4.4.1.4 Correction for non-saturation of the delayed gamma emission
In the calculation, it is assumed that delayed gammas are emitted in apparent coincidence with the prompt emission (as is the case at steady state). On the other hand, the TLD irradiations are carried out over a period during which the delayed gamma emission has not reached its asymptotic value, and hence it is necessary to correct the measurements for the delayed emission missed, i.e. the gammas emitted after the TLDs have been withdrawn from the reactor11.
The first step taken in deriving the correction factor needed is to multiply the total gamma emission for each isotope having a delayed contribution with an isotope-dependent correction factor given by:
corre = (prompt emiprompt emi
ssion rate) dt + (delayed emission rate at time t) dt( ssion rate + delayed emission rate at steady state) dt
∫ ∫∫
(4-23)
The integrals are over the duration of the TLD irradiation. The correction thus takes into account (in the calculation) the evolution of the gamma emission during the in-core residence time of the TLD, which is appropriate since TLDs are integrating dosimeters12. Next, with the gamma emission of the different isotopes corrected, the gamma flux distribution is computed (by applying the calculational scheme developed in Chapter 3) and the gamma heating in iron at the measuring positions determined. These results are then compared to those of a similar calculation, but without any correction factors applied. The non-saturation correction factor, corrn-s, for each measuring position is obtained as the ratio of the non-corrected to corrected results.
11 The non-saturation correction can be avoided by letting the TLDs remain in the reactor sufficiently long after shut-down. However, this is usually not practical (one has to let the TLDs remain in the assembly for several days), and moreover can lead to significantly erroneous results if the reactor background activity due to former reactor operation is important.
12 Clearly, this approach of correcting the total emission is not rigorously correct. A more exact way would be to correct only the delayed part of the emission. Furthermore, any evolutionary effect of the emission spectrum is neglected. Nevertheless, the approach should be adequate since the total source intensity is correctly modified.

Gamma-Heating Measurements 135
To compute the isotope-dependent correction factors corre, the evolution of the delayed gamma emission after reactor start-up has to be computed. This was done using the MECCYCO code [36], which was written for the computation of parameters of relevance to the fast reactor fuel cycle. Basic input data are initial fuel concentration, neutron cross-sections, fission yields, decay data, affiliation chains, and the irradiation history (neutron flux, duration). Starting from these data, the code basically determines the concentration of the various heavy isotopes, as well as of fission and activation products. From the computed concentrations, various quantities of interest can then be derived. In particular, the delayed gamma emission source due to isotope e, at time t, is given by:
S t N t Ee delayed j j e delayed
j, , ,( ) ( )= ⋅ ⋅∑ λ γ (4-24)
where the sum is over all radioactive isotopes produced through fission or capture in isotope e.
Nj(t) is the density of isotope j, λ j its disintegration constant, and E e delayedγ , , is the energy
emitted in the form of gammas through the disintegration. This formulation in MECCYCO yields correct results for the computation of the delayed emission through activation of U238, Mn55 and Na23. However, the approach is not followed for the total delayed emission by the disintegration of fission products. In fact, the code does not compute the concentration of short-lived fission products because the basic nuclear data of these isotopes are not well known. For the computation of the total emission by fission products, the concept of elementary fission curves is used. These curves give, for a single fission event of a given fissile isotope, the total (by all fission products and their daughters) gamma emission in function of the time t after the fission event. Elementary fission curves have been computed by Gillet [37] from JEF1 decay data. Using these curves, and corresponding to the number of fission events at any given instant during the irradiation history, the total delayed emission resulting from the disintegration of fission products can be computed.
For illustration, the evolution of the delayed gamma emission has been computed separately for the isotopes for which elementary fission curves are available, assuming a constant rate of 1 fission per second. The results are presented in Figure 4-19. The figure shows the evolution, in each case, of the delayed emission towards its asymptotic value, viz. 6.23 MeV/fission for U235, 7.99 MeV for U238, 5.16 MeV for Pu239, 5.57 MeV for Pu240 and 6.22 MeV for Pu241. One notes that these asymptotic values are somewhat (although only slightly) different from those computed from JEF2 in the present work (Table 3-3). Accordingly, for the computation of the non-saturation factors, the elementary fission curves employed by MECCYCO were adjusted using constant factors in order to be completely consistent with the currently created gamma production libraries.

136 Chapter 4
3
4
5
6
7
8
0.001 0.01 0.1 1 10 100 1,000 10,000 100,000
U235U238Pu239Pu240Pu241
Del
ayed
fiss
ion
gam
ma
emis
sion
[MeV
/s]
Days after fission start-up
Figure 4-19: Evolution of the total delayed gamma emission of all fission products, computed assuming a constant rate of 1 fission per second.
It is important to point out that the computation of the isotope-dependent correction
factors corre depends on the irradiation history, i.e. the knowledge of the neutron flux level as a function of time. Accordingly, the correction factors were computed separately for each irradiation, taking into account the exact irradiation history as recorded by the neutron monitors. Furthermore, the factors were calculated assuming that there was no variation in the concentration of the parent isotopes, this assumption being amply justified by the low flux level. The formalism of relation (4-24) was applied for delayed emission by activation products (U238, Mn55, Na23), and the fission-curve methodology was used for the delayed fission emission (U235, U238, Pu239, Pu240, Pu241). It should also be noted that for the evaluation of (4-23), the contribution of the delayed emission in the total emission has to be known, and this depends on the region (spectrum) in which the measurements are done.
As an example, Table 4-5 gives the computed isotope-dependent correction factors for different isotopes in the core region of ZONA2B for the first of the four TLD irradiation runs.
The accuracy of the methodology used for the computation of the correction factors corre can be tested experimentally by computing the evolution of the total gamma emission and comparing the result to the measured evolution. This was done for the TLD irradiations in ZONA5K (§ 4.3.1). Figure 4-20 compares the measured and computed evolutions in the Z2PIT core region of ZONA5K and confirms that the measured evolution is well represented by the calculations.

Gamma-Heating Measurements 137
Table 4-5: Isotope-dependent correction factors corre for isotopes (with a significant delayed emission) present in the core region of ZONA2B, for the irradiation history of the first TLD irradiation run.
Isotope corre U235 0.891 U238 0.952 Pu239 0.896 Pu240 0.926 Pu241 0.903 Na23 0.956 Mn55 0.894
-0.5
0
0.5
1
1.5
2
2.5
-20 0 20 40 60 80 100 120
Computed total gamma emissionIonization chamber reading
Val
ues
inte
rnor
mal
ized
bet
wee
n53
- 10
5 m
inut
es a
fter
sta
rt-u
p
Time after start-up [min.]
Figure 4-20: Computed and measured evolution of the total gamma emission in the Z2PIT core region of ZONA5K during the TLD irradiations.
4.4.1.5 Application of the correction factors to the ZONA5K and ZONA2B measurements
The quantity of interest for validation purposes is the gamma heating in iron in the core and reflector regions of the MASURCA configurations. This was derived from the TLD measurements carried out in iron surroundings as follows: First, the dose in iron (in units of [rad(iron) Co60 equivalent]) was obtained from the individual TLD readings, Qi, using relation
(4-8) and the individual calibration factors f calib i,'
determined as described in § 4.2.1. Several

138 Chapter 4
TLDs were irradiated at the same position, and the average dose was then computed according to:
DN
DN
f Qi
Ncalib i
i
Niγ γ, ,
' iron, Co60 eq. , iron, Co60 eq., i= = ⋅
= =∑ ∑1 1
1 1 (4-25)
where N is the number of TLDs irradiated at the same location. From this average dose, the corrected measured gamma heating, D ironγ , , was derived applying the various correction
factors discussed above, viz. as:
Dγ,iron = corrsp . corrhet . corrn-s . D
fcorriron Co60
calneutrγ , eq. −
< >
1 ( 4-26)
Here, it is worthwhile to recall, that the use of the calibration factors f calib i,'
implies that
Dγ , iron, Co60 eq. is not multiplied by the cavity correction as defined by relation (4-13), but
with the spectral correction given by relation (4-14) instead. This further implies that the neutron correction (§ 4.4.1.2) has to be divided by the cavity factor for the calibration irradiation, <f>calib, to arrive at an overall consistent formulation.
The numerical values and results for the application of relation (4-26) to the ZONA5K and ZONA2B measurements are summarized in Tables 4-6 and 4-7, respectively. In the latter case, the interpretation has been done separately for the first irradiation with 3 TLDs in iron holder type A and the irradiation with 4 TLDs in holder type B. In both tables, column 2 gives the distance from the core center along the N-S radial channel. Column 3 gives the average iron dose in rad Co60 equiv. computed from the TLD readings using relation (4-25). The indicated statistical uncertainty is the dispersion (1 σ) for the TLDs irradiated at the same position (ZONA5K: 6, ZONA2B holder type A: 3, ZONA2B holder type B: 4). Column 4 gives the neutron correction divided by the cavity term <f>calib . In column 5, the spectral (cavity) correction is given. Column 6 gives the heterogeneity correction, based upon the smooth, BISTRO-derived correction curve in Figure 4-18. Thereby, to be consistent with the MCNP calculations, the curve was scaled up by 3.2 % in the core region. In column 7, the non-saturation correction determined as described in § 4.4.1.4 is given. Finally, column 8 gives the experimental value for gamma heating in iron, obtained by applying all the various correction factors as per relation (4-26)13.
Tables 4-6 and 4-7 show that, in the core region, the importance of the different corrections is almost totally spatially independent. In the reflector, mainly at the beginning,
13 A supplementary correction of 1 % was applied to results in the core region and the inner part (~ 45 - 55 cm) of the reflector, in order to correct for the residual gamma activity due to the disintegration of fission and activation products generated in reactor operation preceding the TLD irradiations (§ 4.3.1.1).

Gamma-Heating Measurements 139
there is spatial dependence due to changing gamma and neutron spectra. Although the TLD sensitivity to neutrons is about 10 times lower than that to gammas, the neutron contribution accounts for 8 - 17 % of the thermoluminescent output. The spectral correction is important at the core/reflector interface. The heterogeneity effect is mainly important in the core where it amounts to about 10 %. The non-saturation correction mainly affects the core and the region adjacent to it, leading here to a decrease of the total gamma emission source by 6 - 8 %. Due to the largely compensating individual effects, the total correction is relatively small at each of the measurement points. An overall picture of the various TLD measurement corrections is presented in Table 4-8.
Table 4-6: Corrected measured gamma heating in the core and reflector of the CIRANO ZONA5K configuration.
Region
Distance from core
center
Uncorrected measured
gamma heating
Neutron contribution
Spectral correction
Hetero- geneity
correction
Non-saturation correction
Corrected measured gamma heating
[cm] [rad(iron) Co60 eq.]
[rad(iron) Co60 eq.]
[rad(iron)]
18.13 69.84 ± 1.7% 9.210 0.986 1.101 1.082 70.41 20.67 66.90 ± 1.7% 8.874 0.986 1.101 1.081 67.36 24.93 63.37 ± 3.8% 8.245 0.986 1.101 1.081 64.02
C 27.47 59.50 ± 1.6% 7.828 0.986 1.102 1.081 60.02 O 30.01 56.20 ± 2.3% 7.382 0.986 1.102 1.081 56.73 R 32.55 52.21 ± 2.1% 6.907 0.986 1.103 1.082 52.68 E 35.53 49.22 ± 1.5% 6.308 0.986 1.105 1.082 49.99 38.07 44.97 ± 1.6% 5.758 0.986 1.109 1.082 45.84 40.61 39.58 ± 3.0% 5.152 0.987 1.117 1.081 40.56 44.86 26.19 ± 3.6% 3.763 1.031 1.113 1.065 27.10 46.13 20.90 ± 4.5% 3.313 1.051 1.034 1.060 20.03 47.40 16.87 ± 3.5% 2.762 1.090 1.018 1.049 16.22 48.67 14.77 ± 3.2% 2.475 1.081 1.010 1.045 13.85
R 49.94 12.80 ± 2.8% 2.142 1.068 1.017 1.037 11.86 E 51.21 11.30 ± 2.1% 1.936 1.065 1.017 1.035 10.38 F 52.48 10.22 ± 3.8% 1.729 1.062 1.015 1.033 9.336 L 53.75 9.398 ± 2.1% 1.524 1.058 1.019 1.030 8.641 E 56.73 7.846 ± 4.1% 1.174 1.047 1.022 1.027 7.326 C 61.81 6.077 ± 5.0% 0.7545 1.036 1.026 1.025 5.795 T 66.06 5.052 ± 1.8% 0.5237 1.031 1.027 1.024 4.911 O 67.33 4.634 ± 2.4% 0.4719 1.030 1.028 1.024 4.511 R 68.60 4.469 ± 3.2% 0.4213 1.029 1.028 1.024 4.387 69.87 4.149 ± 3.4% 0.3790 1.028 1.029 1.024 4.083 71.14 3.959 ± 1.3% 0.3375 1.028 1.029 1.023 3.917 72.41 3.578 ± 4.6% 0.2898 1.030 1.029 1.020 3.555 73.68 3.314 ± 3.6% 0.2691 1.029 1.023 1.020 3.270

140 Chapter 4
Table 4-7 : Corrected measured gamma heating in the core and reflector regions of the ZONA2B configuration.
Region
Distance from core
center
Uncorrected measured
gamma heating
Neutron contribution
Spectral correction
Hetero- geneity
correction
Non-saturation correction
Corrected measured gamma heating
[cm] [rad(iron) Co60 eq.]
[rad(iron) Co60 eq.]
[rad(iron)]
1. Irradiation: 3 TLDs in iron holder type A 28.41 52.42 ± 1.7% 7.058 0.986 1.100 1.086 52.83
C 30.95* 52.61 ± 2.6% 6.646 0.986 1.101 1.086 53.58 O 33.93 45.70 ± 1.6% 6.126 0.986 1.102 1.086 46.18 R 36.47* 41.80 ± 2.0% 5.650 0.986 1.104 1.086 42.27 E 39.01 41.62 ± 1.1% 5.135 0.986 1.108 1.086 42.82 44.53 26.62 ± 8.1% 3.715 1.001 1.122 1.077 27.38
R 48.34 15.78 ± 5.4% 2.398 1.085 1.015 1.049 15.28 E 52.15 10.58 ± 3.7% 1.674 1.064 1.021 1.035 9.892 F 56.40 7.496 ± 2.4% 1.130 1.048 1.025 1.030 7.042 L 58.94* 6.696 ± 2.3% 0.9010 1.043 1.027 1.029 6.388 E 61.48 5.930 ± 2.1% 0.7254 1.036 1.028 1.029 5.708 C 64.46* 5.053 ± 2.4% 0.5640 1.033 1.029 1.029 4.913 T 67.00 5.015 ± 5.1% 0.4542 1.030 1.029 1.029 4.976 R 72.08 3.619 ± 1.4% 0.2831 1.029 1.031 1.025 3.626
2. Irradiation: 4 TLDs in iron holder type B 28.41 53.18 ± 1.4% 7.058 0.986 1.100 1.060 52.43
C 30.95 53.64 ± 2.6% 6.646 0.986 1.101 1.060 53.46 O 33.93 45.43 ± 3.5% 6.126 0.986 1.102 1.060 44.77 R 36.47 43.74 ± 2.8% 5.650 0.986 1.104 1.060 43.46 E 39.01 42.22 ± 1.8% 5.135 0.986 1.108 1.060 42.47 41.55 36.04 ± 5.0% 4.562 0.987 1.115 1.060 36.30 44.53 27.96 ± 1.5% 3.715 1.001 1.122 1.054 28.36 45.80 24.22 ± 0.7% 3.240 1.040 1.046 1.046 23.62
R 47.07 19.66 ± 2.0% 2.751 1.076 1.026 1.039 19.17 E 48.34 16.05 ± 1.0% 2.398 1.086 1.015 1.034 15.38 F 49.61 13.68 ± 0.7% 2.096 1.073 1.022 1.030 12.93 L 50.88 11.93 ± 2.8% 1.864 1.067 1.024 1.027 11.16 E 52.15 10.73 ± 2.2% 1.674 1.064 1.021 1.026 9.971 C 56.40 7.663 ± 1.4% 1.130 1.048 1.025 1.022 7.174 T 61.48 5.575 ± 3.3% 0.7254 1.036 1.028 1.022 5.282 O 67.00 4.552 ± 3.2% 0.4542 1.030 1.029 1.022 4.440 R 72.08 3.567 ± 1.8% 0.2831 1.029 1.031 1.018 3.547
* holder type B was employed

Gamma-Heating Measurements 141
Table 4-8: Global overview of the different corrections in the TLD measurements.
Neutron Spectral Hetero- geneity
Non- Saturation
Total
Core -13 % - 2 % +10% +8% -2 % Reflector -17% to -8% +9 % to +3% +2% +6% to +2% -9% to 0%
4.4.2 Corrections for Ionization Chamber Measurements
This section discusses the corrections needed in the case of gamma-heating measurements using the CIRANO ionization chamber. The latter was used in the present work to provide an independent set of relative experimental results, i.e. gamma-heating traverses. Nevertheless, the correction factors were determined with a view to possibly provide a later absolute comparison to calculations (based on a subsequent absolute calibration of the chamber).
4.4.2.1 Cavity correction
For an ionization chamber functioning according to the Bragg-Gray principle [2], as is the case for the CIRANO chamber, the dose deposited in the gas, Dc, is related to the dose deposited in the wall medium surrounding the cavity, Dw, by the following cavity relation:
( )
( )D
dEdx
Q E dE
dEdx
Q E dE
DwW E
e
E
C,Ee
E c=
⋅∫
∫
ρ
ρ
,
max
max
0
0
(4-27)
where ( / ) ,dE dx X Eρ is the mass stopping power of electrons of energy E in medium X, and
Qe(E) is the spectrum of secondary electrons produced in the wall and crossing the cavity. Here, it is assumed that 1) the thickness of the cavity is so small in comparison with the range of the charged particles striking it that its presence does not disturb the charged particle field, and that 2) the absorbed dose in the cavity is deposited entirely by the charged particles crossing it. It is seen that, in principle, the Bragg-Gray cavity factor depends on Qe(E) and thus on the gamma spectrum generating the secondary electron field. However, the dependence on the incident gamma energy is only weak, and the changes in the gamma spectrum from the core center to the outer zone of the reflector as encountered in the CIRANO configurations have only a small effect (shown to be lower than 1.5 %). Thus, the cavity correction could be adequately taken into account in the context of an eventual absolute calibration of the chamber, and this aspect was not further investigated currently.
142 Chapter 4
4.4.2.2 Correction for neutron sensitivity
Part of the ionization current is induced by 1) charged particles created through neutron interactions in the chamber wall, 2) charged particles created by neutron interactions with atoms of the gas and 3) supplementary gammas produced through capture and inelastic neutron interactions with the chamber itself. These three spurious contributions are discussed below.
The supplementary current due to charged particles produced by neutron interactions in the wall can be neglected because a) charged-particle neutron reactions are usually threshold reactions, not important in the neutron energy range of interest, b) charged particles produced in threshold reactions have low energy, and c) neutron-induced charged particles have a much smaller range as compared to secondary electrons produced in gamma interactions, and thus the probability of their reaching the cavity from the wall material is rather low.
By interaction with atoms of the gas, neutrons mainly produce recoils through elastic scattering. Knipe, in his thesis work [38], investigated this contribution in detail for the case of a zirconium-walled ionization chamber filled with argon. For his experiments in the MCZ ZEBRA assembly, he determined a maximal contribution of 3.1 % in the core region. In the blanket region, the contribution was lower (maximal 1.8%) because elastic neutron KERMA factors decrease with energy. Taking these findings as representative for the CIRANO measurements, one might expect a correction of the order of 3 % in the core region, and about 1 % in the reflector region (due to the relatively soft neutron spectrum).
The supplementary ionization current due to gammas produced by (n,γ ) and (n,n'γ )
interactions with the chamber was investigated using simple, 1-dimensional cylindrical models representing the various constituent regions of the chamber placed in different environments of interest. A typical model is shown in Figure 4-21, the calculational scheme presented in Chapter 3 being used for the study. For each of the models, the neutron flux was computed first and then used to create the gamma source. Gammas produced by Al were neglected. The gamma propagation was considered for two different cases, one with no modification, and once with the gamma source set to zero except in the chamber regions. This latter calculation clearly yields the transport of gammas created by the neutron interactions with the chamber. It is reasonable to assume that the ionization of the gas is proportional to the heat deposited by gammas within a thickness of 1 mm of the electrodes surrounding the cavity, since the major contribution to the gas ionization comes from electrons produced close to the cavity. Thus, the neutron contribution to the chamber current can be obtained by comparing the gamma heating (deposited within 1 mm layers of the electrodes surrounding the cavity) with and without the gamma source in the chamber body taken into account. The results are shown in Table 4-9. For the chamber embedded in the shielding and reflector, the calculations were done for various thicknesses of the surrounding zones but the sensitivity to this parameter was found to be unimportant.

Gamma-Heating Measurements 143
Table 4-9: Percentage of gamma heating in a 1 mm thickness of the electrodes surrounding the chamber cavity by gammas created in the chamber itself.
Region Chamber environment Neutron contribution
Core 9 cm core 3.2 % Reflector 13 cm reflector, 10 cm core 7.8 %
20 cm reflector, 10 cm core 8.6 % Shielding 10.6 cm shielding, 26.5 cm reflector, 10 cm core 10.6 %
10,6 cm shielding, 26.5 cm reflector, 20 cm core 10.6 % 21.2 cm shielding, 26.5 cm reflector, 10 cm core 10.7 % 31.8 cm shielding, 26.5 cm reflector, 10 cm core 10.7 %
Inne
r Ele
ctro
de (S
tain
less
Ste
el)
Arg
on
Out
er E
lect
rode
(Sta
inle
ss S
teel
)
Alu
min
a
Cha
mbe
r bod
y (S
tain
less
Ste
el)
Cha
nnel
(Cha
nnel
She
ets
+ ai
r gap
)
Homogeneised core
0.0
0.22
1
0.3
0.4
0.5
0.57
4
0.77
9
10.0
R [cm]
Ref
lect
ive
boun
dary
Ref
lect
ive
boun
dary
Figure 4-21: Typical 1-dimensional (cylindrical) model used to investigate the neutron contribution to the chamber current. (The case modeled is the first one in Table 4-9).
It should be mentioned that the models used for the computation of the neutron correction were also used to investigate the perturbation of the neutron flux. No significant effect (< 1-2 %) on computed reaction rates was found when comparing results with and without the chamber regions. Thus, neutron flux perturbation effects were neglected in the computation of the heterogeneity correction factors discussed below.
4.4.2.3 Heterogeneity correction
The heterogeneity correction relates the gamma heating in the chamber wall to the computed gamma heating. It has to correct for 1) the heterogeneous structure of the MASURCA tubes, 2) the presence of the chamber itself and 3) the presence of the experimental access channel.

144 Chapter 4
As regards the cell structure, it has to be kept in mind that the ionization chamber integrates the dose rate over an active length of 7.7 cm. Thus, the fine structure of the gamma flux due to the different rodlets present in the MASURCA tubes is not seen, and no correction for cell heterogeneity is needed.
No correction for the gamma flux perturbation due to the presence of the ionization chamber needs to be applied if one assumes equal perturbation of the gamma flux in both the calibration and reactor irradiations, and moreover does not correct for the flux perturbation in the analysis of the calibration irradiation. Effectively then, the calibration itself takes into account the flux depression. For the current use of the chamber for relative measurements only, it was verified (using simple 1-dimensional models similar to those used for the determination of the neutron correction) that the flux perturbation in the core and reflector zone is of the same magnitude (flux depression of about 8 %).
0.95
1
1.05
1.1
0 20 40 60 80 100 120
1/(h
eter
ogen
ity c
orre
ctio
n fa
ctor
)
Distance from core center[cm]
Core Reflector Shielding
Figure 4-22: Ratio of calculated gamma heating in stainless steel 304 L in ZONA2B with explicit representation of the radial access channel, relative to that with the channel absent.
Neglecting cell heterogeneity, as well as neutron and gamma flux perturbation due to presence of the chamber, the only heterogeneity effect needing to be considered is the impact of the experimental access channel. This effect was investigated by carrying out BISTRO SN neutron and gamma transport calculations following the same methodology as the one used to study the effect of the TLD holder device in the radial access channel (§ 4.4.1.3). The heterogeneous model used was basically the same as that shown in Figure 4-17, with the exception that the access channel was just filled with air. The results are presented in Figure 4-22. In the core, presence of the channel leads to a reduction of the gamma dose by about 1 %.
Gamma-Heating Measurements 145
In the shielding, the effect is an increase in the gamma heating by about 1 %. In the reflector, the ratio of gamma heating with representation of the channel to that without it is far from being constant (as approximately the case for the core and shielding). This suggests significant gamma streaming effects from the core into the reflector region which lead to a smoothening of the gamma-heating gradient at the interface.
4.4.2.4 Correction for non-saturation of the delayed gamma emission
The methodology for taking into account the non-saturation of the delayed gamma emission was very similar to that for the TLDs. There were two differences, viz.:
1) For simplification, the same irradiation history was assumed for the computation of the isotope-dependent correction factors corre in all ionization chamber traverses. This should not lead to significant error because, in general, each traverse was carried out in the same manner: After start-up, the reactor was stabilized for about 0.5 h. The execution of the traverse then lasted about 1.5 h during which the evolution of the gamma flux was measured with a second irradiation chamber. At the end of the traverse, all values were normalized to the last gamma monitor reading. In accordance with the above procedure, which was followed each time, the correction factors (for the different isotopes) were computed corresponding to 2 hours after start-up.
2) As gamma chambers are not integrating dosimeters, relation (4-23) was modified to:
corre(t) = prompt emi
prompt emission + delayed emission at time t
ssion + delayed emission at steady state (4-28)
4.5 Experimental Uncertainties
In this section, the experimental uncertainty in the absolute determination of gamma heating is estimated. The discussion is limited to the absolute measurements made using TLDs. As mentioned earlier, gamma chambers were currently only used for relative measurements, i.e. obtaining dose distributions. In principle, the uncertainty on the latter measurements should be lower as calibration aspects do not intervene.
For the sake of the present discussion, it is useful to recall the main steps in deriving the absolute gamma-heating values form the TLD readings. The uncorrected dose in iron is obtained from the TLD reading Qi using relation (4-8), i.e. employing the individual average
calibration factor fcalib i,' . Usually, several TLDs are irradiated at the same position, and the
average dose, Dγ , iron, Co60 eq. , is computed according to relation (4-25). The corrected dose
in iron, D ironγ , , is then obtained using relation (4-26), i.e. by applying the neutron, spectral,
heterogeneity and non-saturation corrections. Thus, the uncertainty on the final result, Dγ , iron,

146 Chapter 4
may be associated with two broad types of errors: 1) errors in determining the average dose,
Dγ , iron, Co60 eq. , which are purely measurement uncertainties in the sense that no numerical
calculations are involved14 and 2) uncertainties in the calculational determination of the correction factors. Below, the various sources of uncertainty are discussed and their magnitude is estimated.
4.5.1 Measurement Uncertainties
The sources of uncertainty in determining Dγ , iron, Co60 eq. can again be divided into two
categories, viz. those associated with: 1) the "out of reactor" treatment, i.e. the absolute calibration of the TLDs and the experimental technique itself, and 2) the execution of the measurements in the reactor.
4.5.1.1 Absolute calibration and TLD technique
The individual calibration factors are determined according to:
f DD
DQ D R Qcal i air calib
iron calib
air calibi calib air calib i calib,
', ,
, ,
, ,, , , ,= ⋅
⋅ = ⋅ ⋅γ
γ
γγ (4-29)
The different sources of uncertainty in determining fcal, i
' are thus:
1) D air calibγ , , , the irradiation KERMA in air at the holder location, as specified by the
experimental staff at the calibration facility. The uncertainty on D air calibγ , , is quoted to be 2
%. Thereby the main source of uncertainty is the standard used to measure out the calibration field. Effects of positioning errors could be neglected since the TLDs were irradiated far from the source (> 2 m) and positioning of the TLD holder was sufficiently accurate.
2) Qi,calib, the TLD response for the calibration irradiation. The statistical uncertainty on Qi,calib is given by the dispersion on repeated TLD measurements under the same conditions. This was estimated in § 4.2.2 and found to be of the order of 2 %.
3) The ratio R was computed by MCNP, and relates the KERMA in air and the dose in the iron holder. The ratio was calculated with a statistical accuracy of 1 %, which was taken as the uncertainty on R. (In general, gamma-ray interaction cross-sections and KERMA factors are known to an accuracy of better than 2 % [39]).
14 except the MCNP determination of the relation between the dose in air and the dose in iron during the calibration.

Gamma-Heating Measurements 147
The usual propagation-of-error relations15 for statistical errors lead to an uncertainty on the individual calibration factor of 3 %. As indicated earlier (§ 4.2.2), average calibration factors were determined from two separate irradiations. The uncertainty on the average calibration factors thus become 2.1%
From each TLD reading, the dose is computed using relation (4-8). With the statistical error on the reading itself being 2 %, quadratic addition with the uncertainty on the individual calibration factors yields an uncertainty of 2.9 % on the individual uncorrected dose values16.
Finally, from the uncertainty on the individual doses, the uncertainty on the average dose computed according to (4-25) can be derived. With the number of TLDs usually irradiated at the same position being 3, the latter becomes 1.7 %.
4.5.1.2 Measurements in the reactor
The different sources of uncertainty (and their estimated magnitude) in the execution of the reactor measurements are:
1) Positioning error: The precision, with which the TLD holder device was placed in the experimental access channel is about 3 mm. The impact of placement errors of this magnitude was investigated by computing the gamma heating not only at the various measuring positions but also at ± 3 mm. For this distance variation, the effect on dose was found to be less than 1 % in most of the core region, and about 1.5 % in the outer half of the reflector. In the first 10 cm of the reflector, variations between 2.5 % and 7.5 % were found.
2) Errors in irradiation time: The fact that the TLD holder device is slid into the experimental access channel and withdrawn from it when the reactor is critical is a source of
15 If a and b are two independent, stochastic quantities with associated standard deviations σa and σb , then the
following relations hold true:
σ σ σσ σ σ σ
a b a ba b a b a b
a b a b a b+⋅= +
⋅
=
=
+
2 2 22 2 2 2
; //
From these relations, the standard deviation on the mean value is easily derived. If the variable a was determined in N measurements, then one has:
σ σa aN
= 1
16 It is interesting to note that neglecting the uncertainties on D air calibγ , , and R (which are to be viewed more as
systematic errors) would lead to an uncertainty on the individual dose values of 2.4 %. Dispersions of this magnitude were found in all the currently performed integral measurements for individual doses of TLDs irradiated at the same position and in the same run. This provides experimental confirmation of the above estimation of the statistical error on a given TLD reading.

148 Chapter 4
uncertainty. The error in timing is at most 5 seconds. With an irradiation duration of 13.5 minutes, this corresponds to an error of 0.6 %.
3) Normalization of the neutron power. The parameter used for power normalization is the fission rate of 1 micro-gram U235 and/or Pu239 at the center of the N-S radial access channel. The value to be used is specified by the experimental staff at the MASURCA facility. It is derived from the readings of the permanently installed neutron monitors and an earlier determination of the relation between these readings and the fission rates at core center. For the latter determination, well calibrated fission chambers are employed. The experimental uncertainty on the fission rates to be used is typically 2 % [33] and results mainly from the uncertainty in the calibration of the fission chambers.
4.5.2 Uncertainties Associated with Calculational Corrections
The application of calculational correction factors increases the uncertainty on the measured gamma heating. Below, the supplementary uncertainties introduced by the application of the different correction factors are estimated.
1) Neutron correction: The uncertainty in computing the neutron correction is due to both the uncertainty in the relative KERMA sensitivity of the TLD and that in computing the neutron dose (which, in turn, is due to errors in the Li7F KERMA values and the neutron flux). The uncertainty on the mean relative sensitivity derived from the experimental data by Knipe is 4 %. As regards the neutron dose determination, it is assumed that the major source of uncertainty are the KERMA values used. The uncertainty on these is about 10 % [40]. Quadratic addition thus leads to an uncertainty on the neutron contribution of about 11 %, which corresponds to the estimate made by Knipe in his work [10]. The neutron contribution amounts at most to 17 % of the total TLD response. Viewing the neutron correction as a subtraction of this supplementary contribution, the application of the usual propagation-of-error relations leads to an estimated uncertainty of maximal 1.5 % for the neutron correction.
2) Non-saturation correction: If the neutron flux diagram is well known (as is the case at the MASURCA facility through the continuous monitoring of the neutron flux), the uncertainty on the non-saturation correction is mainly due to that on the elementary fission curves used for its computation. The latter uncertainty has been estimated by Gillet [37] to be about 10 %. One can view the non-saturation correction as the addition of the amount of delayed emission missed by the TLDs. In the core region and in the inner reflector, this amounts to about 6-8 % of the total dose, so that the estimated uncertainty on the non-saturation correction becomes ~ 0.8 %. In the outer reflector, the delayed gamma contribution is much lower and the uncertainty on the non-saturation factor can be neglected.
3) Cavity correction: The cavity relation was determined from Burlin cavity theory and verified by MCNP coupled photon-electron calculations (Appendix D). As the Monte-Carlo calculations can be regarded as reference, the statistical accuracy in the MCNP calculations

Gamma-Heating Measurements 149
can be taken as an estimation of the uncertainty on the cavity relation. The statistical accuracy was about 3 %, which is also the order of magnitude of the maximal differences between Burlin cavity theory and MCNP results.
4) Heterogeneity correction: This correction was computed using the BISTRO SN and MCNP codes. As for the cavity correction, the Monte-Carlo calculational accuracy (~ 2.5 %) is taken as an estimation of the uncertainty on the heterogeneity correction. Again, this is also the order of magnitude of the differences found between the BISTRO and the MCNP results.
4.5.3 Total Estimated Experimental Uncertainties
In Table 4-10, a compilation of the different sources of uncertainty and their estimated magnitude is given. Also listed is the resulting estimation of the total uncertainty on the experimental determination of gamma heating in iron using TLDs. This is simply the quadratic sum of the various individual errors. The uncertainties are tabulated separately for the core, the reflector region adjacent to the core and the outer reflector zone.
Table 4-10: Compilation of different sources of uncertainty in gamma-heating measurements using TLDs and their estimated magnitude.
Source of uncertainty Core Reflector close to the
core
Outer reflector
TLD calibration and technique 1.7 % 1.7 % 1.7 % Measurement Positioning errors 1 % 2.5 - 7.5 % 1.5 %
Errors Errors on irradiation time 0.6 % 0.6 % 0.6 % Power normalization 2 % 2 % 2 % Neutron contribution 1.5 % 1.5 % 1.5 %
Calculational Non-saturation correction 0.8 % 0.8 % - Corrections Cavity relation 3 % 3 % 3 %
Heterogeneity correction 2.5 % 2.5 % 2.5 % Total Uncertainty 5.1 % 5.6 - 9.0 % 5.2 %
In the core and in the outer reflector, the total uncertainty on the experimental determination of gamma heating is about 5 %. This is of the same order of magnitude as reported by Calamand for earlier MASURCA experiments (Table 2-10) and by Knipe and DeWouters for their ZEBRA measurements [41]. The experimental uncertainty in the reflector zone close to the core is larger because the gamma-heating gradient is very strong in this region. Here, even slight positioning errors lead to a relatively large variation in the measured gamma dose.
150 Chapter 4
A reduction of the total experimental uncertainty seems difficult except for measurements in the reflector zone close to the core where a better determination of the position of the TLDs could be achieved, for example by doing measurements inside the MASURCA loading tubes themselves. The possible error on the irradiation position would be very small in such measurements.
[1] A.Lüthi, "Estimation of the Experimental Uncertainty on Photon Heating Measurements using TLD700 - Planification of Measurements to Support the Qualification of Photon Heating Calculations in ERANOS", Internal Memorandum, CEN Cadarache (1997) [2] F.H.Attix, "Introduction to Radiological Physics and Radiation Dosimetry", ISBN 0-471-01146-0, John Wiley & Sons, Inc. (1986) [3] A.F.McKinlay, "Thermoluminescent Dosimetry", ISBN 0-85274-520-6, Adam Hilger Ltd. (1981) [4] M. Moscovitch, "TLD-100, 600, 700 Characteristics, Limitations and Controls", A compilation of the Engelhard Corporation, Harshaw Crystal & Electronic Products, presented at the 1990 User Group Meeting, Albuquerque, New Mexico (USA), June 7, 1990 [5] "Model 3500 Manual TLD Reader", Harshaw/Bicron Radiation Measurement Products [6] E.Piesch, B.Burgkhardt, S.Kabadjova, "Supralinearity and Re-Evaluation of Different LiF Dosimeter Types", Nuclear Instruments and Methods 126, 563 (1975) [7] J.A.B.Gibson, "The Relative Tissue-Kerma Sensitivity of Thermoluminescent Materials to Neutrons", CEC Report EUR 10105, Luxembourg: CEC (1985) [8] J.A.B.Gibson, "The Relative Tissue Kerma Sensitivity of Thermoluminescent Materials to Neutrons", Radiation Protection Dosimetry 15, 253 (1986) [9] A.D.Knipe, "The Neutron Response of 7LiF Thermoluminescent Dosmeters for Fast Reactor Studies", Technical Note FRDCC7PPWG/P(88)149, AEE Winfrith (1988) [10] A.D.Knipe, "The Fast Neutron Response of 7LiF Thermoluminescent Dosemeters", Report AEEW-R 2584, AEE Winfrith (1990) [11] A.D.Knipe, "The Non-Universality of the Fast Neutron Response of 7LiF Thermoluminescent Detectors", Radiation Protection Dosimetry 37 (1), 19 (1991) [12] C.L.Wingate, E.Tochilin, N.Goldstein, "Response of Lithium Fluoride to Neutrons and Charged Particles", International Conference on Luminescence Dosimetry, Stanford University, California (USA), June 21-23, 1965 [13] Y.Furuta, S.Tanaka, "Revised Energy Response of 6LiF and 7LiF Thermoluminescence Dosimeters to Neutrons", Nuclear Instruments and Methods 140, 395 (1977) [14] G.Portal, "Etude et Développement de la Dosimétrie par Radiothermoluminescence", CEA Report (1978) [15] G.Scarpa, "New Experimental Data on the Sensitivity to Fast Neutrons of a Number of Sintered Commercial TL Phosphors", 7th International Conference on Solid State Dosimetry, Ottawa (USA), September 27 - 30, 1983, Radiation Protection Dosimetry 6, 313 (1984) [16] "Instruction Manual, TLD-Ofen [D273.131.0/1]", PTW-Freiburg manual [17] W.Y.Yoon, "Gamma Heating Measurements in LMFBR Shields with Thermoluminescent Dosimeters", PhD thesis, University of Tennessee (1978) [18] A.Lüthi, "Points importants pour des mesures d'échauffement gamma", Internal Memorandum, CEN Cadarache (1995) [19] P.Bertrand, P.Chaussonnet, A.Lüthi, M.Martini, H.Philibert, J.Pierre, A.Yoshida, "Coeur ZONA2-B - Stockage Interne - Refrence - Résultats des Mesures", Technical Note, CEN Cadarache (1995) [20] P.Bertrand, P.Chaussonnet, A.Lüthi, M.Martini, H.Philibert, J.Pierre, A.Yoshida, "Coeur ZONA2-B - Stockage Interne - 1 - Résultats des Mesures", Technical Note, CEN Cadarache (1995) [21] C.M.H.Driscoll, J.R.Barthe, M.Oberhofer, G.Busuoli, C.Hickmann, "Annealing Procedures for Commonly used Radiothermoluminescent Materials", Radiation Protection Dosimetry 14(1), 17 (1986)

Gamma-Heating Measurements 151
[22] Y.S.Horowitz, "The Annealing Characteristics of LiF:Mg,Ti", Radiation Protection Dosimetry 30, 219 (1990) [23] T.Schmuhl, R.Schmidt and L.Lüdermann, "Temperature Profiles of an Annealing Oven and Effects on TL Signals", Radiation Protection Dosimetry 71 (2), 147 (1997) [24] H.W.Julius, G.dePlaque, "Influence of Annealing and Readout Procedures on Fading and Sensitivity Changes in LiF for Temperatures and Humidities Typical for Environmental and Personnel Dosimetry", Radiation Protection Dosimetry 6 (1/4), 253 [25] G.S.Linsley, E.W.Mason, "Sensitization in LiF: Teflon Dosimeters", Physics in Medicine and Biology 16, 695 [26] M.R.Mayhugh, G.D.Fullerton, "Thermoluminescence in LiF: Sensitization Useful at Low Exposures", Health Physics 28, 299 (1975) [27] M.J.Toivonen, "Improving the Accuracy of TLD Systems in Clinical Applications", Radiation Protection Dosimetry 47 (1/4), 497 (1993) [28] D.F.Regulla, "Remarks on the Present State of Thermoluminescent Dosimetry", Nuclear Instruments and Methods 175, 98 (1980) [29] G.dePlanque, H.W.Julius, C.W.Verhoef, "Effects of Storage Intervals on the Sensitivity and Fading of LiF TLDs", Nuclear Instruments and Methods 175, 177 (1980) [30] J.F.Briesmeister, "MCNP - A General Monte Carlo N-Particle Transport Code", Los Alamos Technical Report LA-12625-M, Version 4B [31] L.Benmansour, A.Santamarina, "Development of Gamma-Heating Measurement Techniques. Experimental Results and EFF1 Qualification from the FNG SS Shield Benchmark", Technical Note, CEN Cadarache (1994) [32] S.Crevoiserat, "Mesures et Simulations des Doses en Radiothérapie par la Méthode Monte-Carlo", Travail de Diplôme, DP-IGA-LPR, EPFL, Lausanne (1997) [33] P.Bertrand, A.Lüthi, M.Martini, J.Pierre, A.Yoshida, "Coeur ZONA2B - Résultats des Mesures", Technical Note, CEN Cadarache (1995) [34] A.D.Knipe, "Absolute Energy Deposition Measurements in a Mixed Gamma-Ray and Fast Neutron Environment", 7th International Conference on Solid State Dosimetry, Ottawa (USA), September 27 - 30, 1983 [35] G.G.Simons, T.J.Yule, "Gamma-Ray Heating Measurements in Zero-Power Fast Reactors with Thermoluminescent Dosimeters", Nuclear Science and Engineering 53, 162 (1974) [36] J.P.Grouiller ,"Cycle du Combustible des Réacteurs à Neutrons Rapides - Code MECCYCO - Note de Présentation", Technical Note, CEN Cadarache (1987) [37] G.Gillet, "Calcul des Courbes de Fission Elementaries par Méthode Numérique - Données J.E.F 1", Technical Note, CEN Cadarache (1989) [38] A.D.Knipe, "Gamma-Ray Energy Deposition in Fast Nuclear Reactors", PhD Thesis, University of London (1976) [39] J.H.Hubbell, "Photon Mass Attenuation and Energy-Absorption Coefficients from 1 keV to 20 MeV", Int.J.Appl.Radiat.Isot. 33, 1269 (1982) [40] R.S.Casewell, J.J.Coyne, M.L.Randolph, "Kerma Factors for Neutron Energies belwo 30 MeV", Radiation Research 83, 217 (1980) [41] A.D.Knipe, R.deWouters, "Gamma-Ray Energy Deposition Measurements in a Heterogeneous Core and Their Analysis", International Symposium on Fast Reactor Physics, Aix-en -Provence (France), September 24-28, 1979 (IAEA-SM-244)


153
5. VALIDATION OF THE CALCULATIONAL SCHEME THROUGH COMPARISONS WITH EXPERIMENTS
In this chapter, the newly developed calculational scheme for the determination of gamma heating is validated through comparisons with integral measurements. Emphasis is placed on testing the performance of the calculational tool in the context of steel/sodium reflectors and core diluents. These non-fuel regions are characteristic of plutonium-burning fast reactor configurations, and most of the heat deposition in them is due to gammas. Attention was also paid to the core, mainly to test the gamma production data in this region. This is of relevance because a relatively large contribution to gamma heating in the non-fuel zones adjacent to the fissile region (reflector) or inserted in it (diluents) is made by gammas created in the core.
In the first section of the chapter (§ 5.1), comparison is made with the currently performed measurements in the ZONA5K (§ 4.3.1) and ZONA2B (§ 4.3.2) configurations of the CIRANO programme at the MASURCA facility. In these experiments, gamma heating was determined in a core surrounded by a steel/sodium reflector region. In the second section (§ 5.2), comparison is made with reevaluated experimental results from earlier measurements conducted by Calamand et al. in the BALZAC1-DE1 configuration of MASURCA. In these experiments, gamma heating was determined (in particular) in a zone representing a diluent sub-assembly. From analysis of both the CIRANO and BALZAC experiments, it is found that the currently developed calculational scheme underestimates gamma heating by 10 to 15 %, and the possible reasons for the differences are discussed in the third section (§ 5.3). In the fourth section (§ 5.4), a set of correction or adjustment factors (and their associated uncertainty) are defined. These factors need to be applied when computing gamma heating in the different reactor regions studied and, as such, form an integral part of the calculation tool. In the fifth section (§ 5.5), the transferability of the correction factors to the computation of gamma heating in the case of SUPER-PHENIX and the 1500 MW CAPRA 4/94 reference design is investigated.
5.1 Comparison of Calculations with ZONA5K and ZONA2B Measurements
The ZONA5K and ZONA2B CIRANO configurations, as well as the gamma-heating measurements performed in these assemblies, have been described earlier (§ 4.3.1.1 and § 4.3.2.1, respectively). The configurations were essentially the same, except for the central high-enrichment substitution zone in ZONA5K, and so were therefore the principal measurements, which consisted in the determination of gamma heating along the N-S experimental channel traversing both the core and reflector regions.

154 Chapter 5
5.1.1 Calculations
Figure 5-1 gives the RZ model used for the neutronic and photonic calculations in the case of ZONA5K. The model used for ZONA2B was basically the same but without the central substitution zone and with a slightly larger critical radius (45.0 instead of 44.73 cm).
Core (ZONA5K)
Core (ZONA2 PIT)
Boron (B4C)Radial ShieldingAxial Shielding
Reflector zones
200.0
171.12160.96150.8
140.63135.54132.99
130.45
69.5266.9864.44
59.36
49.20
39.04
0.0 14.65 44.7
347
.25
49.7
854
.83
59.8
8
131.0
R [cm]
Z [cm] Vacuum boundary
Vacuum boundary
Vacuum boundary
Reflectiveboundary
Figure 5-1: RZ model of the ZONA5K configuration for the gamma-heating calculations.
The neutron flux was computed using the methodology developed in a parallel thesis [1] for the accurate neutronics treatment of the SUPER-PHENIX core surrounded by steel/sodium reflector zones. First, 33-group cross-sections were computed for the homogenized regions of interest using the ECCO cell code (§ 2.5.2.1) and JEF2.2 data. For the core region, a simple 1-dimensional, two-region cylindrical cell model was used. A special treatment was applied to the steel/sodium reflector because there is a large variation of the neutron spectrum from the beginning to the end of this zone. The 1-dimensional, planar cell model used in the ECCO calculation is shown in Figure 5-2. It is seen that the reflector was sub-divided into various zones, cross-sections being computed for each to take into account the spatial variation of self-

Validation of the Calculational Scheme 155
shielding and of the neutron spectrum. The latter was computed using a very fine group structure (1968 groups) to well represent the slowing down of the neutrons penetrating from the core region into the reflector.
0.0 7.5 12.5 17.52.5 5.0 30.0
X [cm]
Reflective boundary Reflective boundary
Core Reflector zones
Figure 5-2: 1-dimensional, planar model used in ECCO to compute 33-group cross-sections for the radial steel/sodium reflector.
Once the multi-group cross-sections had been created, the neutron flux was computed using the BISTRO SN code (§ 2.5.2.1) in S4P1 approximation. From the neutron flux, the gamma flux was computed using the calculational methodology developed in Chapter 3, the flow-diagram of which is given in Figure 3-1. The quantity comparable to the corrected experimental results, viz. the gamma heating in iron, was finally obtained by folding the local gamma flux at the measuring positions, Φi g, γ
, with the iron gamma KERMA, Kγ , iron,gγ ,
according to:
H conv Kiron i i g iron gg
γ γγ γγ
, , , , ,( )= ⋅ ⋅∑ Φ (5-1)
Here, conv is a conversion factor to obtain the heating in units of [rad(iron)/h] as the iron KERMA used is given in units of [ eV barn⋅ ]:
convradh
cm sbarn
= ⋅ ⋅ ⋅⋅ ⋅
−6 219 10 133
.cm eV
The absolute normalization of the calculations was done with respect to the fission rate of
1 micro-gram U235 at the center1 of the N-S experimental channel. As mentioned earlier, this parameter is determined using a calibrated fission chamber and is specified to an accuracy of 2 % (1 σ). In the calculations, the fission rate was determined according to:
1 The fact that normalization was done with respect to the fission rate at core center is effectively equivalent to normalizing to total core fissions. This follows from the fact that the ratio of calculated and measured fission rates through the core region (Figure 5-6) is almost constant.

156 Chapter 5
Fission rate (1 micro-gram U235) = ( ) ., , , ,Φi g core U fission g
g⋅ ⋅ ⋅∑ σ 235 2 562 1015 (5-2)
where Φi,g is the neutron flux at the center of the N-S channel, σcore,U235,fission,g the microscopic
fission cross-section of U235, and 2 562 1015. ⋅ the number of U235 atoms in 1 micro-gram. For σcore,U235,fission,g, the fission cross-sections computed in the ECCO cell calculation for the homogenized core region were used. These cross-sections are adequately self-shielded from the viewpoint of representing the fission chamber response2.
It should be mentioned that the presence of the chamber does lead to a neutron flux perturbation. However, this perturbation is found to be small (less than 1 % compared to the unperturbed case, estimated with respect to U235 fission rates). In any case, the effect is expected to be of the same order of magnitude as in the absolute calibration of the chamber and can hence be neglected.
The experimental staff at MASURCA also specifies the fission rate of Pu239 at the center of the N-S experimental channel during the irradiation. The normalization factor determined from this reaction rate was found to be consistent, within experimental uncertainties, with respect to that determined via U235 fission.
5.1.2 Comparison with Measurements
For the ZONA5K configuration, results for the ratio of the calculated gamma heating in iron to that measured using TLDs are shown in Figure 5-3. The indicated uncertainty on the C/E values corresponds to the total experimental uncertainty which is about 5 % (§ 4.5.3). Clearly, it is the corrected experimental results which have been used for the comparison, i.e. the TLD measurements have been corrected for the neutron contribution to the response, the spectral (cavity) effect, the non-saturation of the delayed emission and for the geometrical heterogeneity. The corrected experimental values are given in Table 4-6. The corresponding comparison of calculational and TLD measurement results along the N-S channel in ZONA2B is shown in Figure 5-4. The corrected experimental results used in this comparison are given in Table 4-7.
Also shown in Figure 5-4 is the comparison of the calculations to the gamma chamber measurements done in both radial access channels. For the comparison, the locally calculated gamma heating had to be integrated over a distance of 77 mm, which corresponds to the active length of the chamber used. Furthermore, the chamber measurements had to be corrected for neutron sensitivity, non-saturation of the delayed emission, and for the heterogeneity effect as
2 Using U235 cross-sections corresponding to trace quantities of U235 in a steel diluent zone (i.e. more representative of the thin U235 deposit in the chamber) yielded fission rates less than 0.4 % higher than those obtained using the homogenized cell cross-sections.

Validation of the Calculational Scheme 157
0
0.2
0.4
0.6
0.8
1
20 30 40 50 60 70
C/E
(Gam
ma
heat
ing
in ir
on)
Distance from core center [cm]
Core Reflector
Figure 5-3: Ratio of calculational to experimental (C/E) results for gamma heating along the N-S radial channel in ZONA5K.
0
0.2
0.4
0.6
0.8
1
0 10 20 30 40 50 60 70
C/E TLDC/E Chamber, E-W channelC/E Chamber, N-S channel
C/E
(Gam
ma
heat
ing
in ir
on)
Distance from core center [cm]
Core Reflector
Figure 5-4: Ratio of calculation to experimental (C/E) results for gamma heating along the N-S and E-W radial channels in ZONA2B.

158 Chapter 5
discussed in § 4.4.2. However, as the chamber has a considerable active length, and because the different corrections are spatially dependent, it is more practical to apply the corrections on the calculational side. Thus, to obtain the 'corrected' calculational values, the gamma source was corrected for non-saturation before carrying out the gamma transport. Then, the locally calculated gamma-heating rates were corrected for the neutron contribution and for the heterogeneity effect. Clearly, the latter two corrections were in the opposite sense to those one would have applied to the chamber readings. For example, the neutron contribution was added to the calculated dose instead of being subtracted. Finally, the locally corrected values were integrated over the active chamber length.
Also shown in Figure 5-4 is the comparison of the calculations to the gamma chamber measurements done in both radial access channels. For the comparison, the locally calculated gamma heating had to be integrated over a distance of 77 mm, which corresponds to the active length of the chamber used. Furthermore, the chamber measurements had to be corrected for neutron sensitivity, non-saturation of the delayed emission, and for the heterogeneity effect as discussed in § 4.4.2. However, as the chamber has a considerable active length, and because the different corrections are spatially dependent, it is more practical to apply the corrections on the calculational side. Thus, to obtain the 'corrected' calculational values, the gamma source was corrected for non-saturation before carrying out the gamma transport. Then, the locally calculated gamma-heating rates were corrected for the neutron contribution and for the heterogeneity effect. Clearly, the latter two corrections were in the opposite sense to those one would have applied to the chamber readings. For example, the neutron contribution was added to the calculated dose instead of being subtracted. Finally, the locally corrected values were integrated over the active chamber length.
Chamber measurements were usually done at symmetric locations with respect to the core center. For the comparison, the average current for each radial position was deduced from the measurements at the corresponding symmetric points. The individual values at these points were usually in good agreement (differences < 2 %).
As the chamber measurements were only intended for yielding relative gamma-heating values, both calculations and measured results were first normalized to unity at the core center. From these relative values, a preliminary (relative) C/E traverse was derived. The absolute C/E values shown in Figure 5-4 were then obtained by multiplying the relative C/E traverse with the average C/E deduced from the TLD measurements in the core region.
Table 5-1 summarizes the average C/E values obtained in ZONA5K and ZONA2B. Average values are given separately for the core region, and for the inner and outer parts of the reflector. The consideration of such average values is meaningful since the C/E values are almost constant in the different zones. The results obtained in the two configurations, and with both the TLD and the ionization chamber techniques, are consistent, except for the inner reflector where the TLD results in ZONA5K are significantly higher than those in ZONA2B. The ZONA2B chamber results lie in-between the two values and can therefore be taken as a

Validation of the Calculational Scheme 159
representative mean. The differences reflect the difficulties in accurately determining the dose in this zone with its strong spatial variation of gamma heating.
Table 5-1: Summary of average C/E values in the core and reflector regions of ZONA5K and ZONA2B, deduced from both TLD and ionization chamber measurements.
Configuration Technique Core Inner Reflector
(45 - 55 cm)
Outer Reflector
(55 - 74 cm) ZONA5K TLD 0.89 0.89 0.85 ZONA2B TLD 0.90 0.80 0.82
Chamber 0.90 0.84 0.84
5.2 Comparison of Calculations with BALZAC1-DE1 Measurements
In this section, gamma-heating calculations are compared to reevaluated experimental results deduced from the measurements done in the BALZAC1-DE1 configuration of the MASURCA facility by Calamand et al. [2]. These measurements, as well as the reactor configuration, were described in § 2.4.4.2. The particularity of the assembly is a steel/sodium diluent zone in the center of the PuO2/UO2 fissile core.
5.2.1 Calculations
The RZ description of the BALZAC1-DE1 configuration shown in Figure 2-13 was used for the calculations, which were done in a completely analogous manner to the analysis of the CIRANO cores. First, 33-group cell cross-sections were computed for the various regions of the reactor using the ECCO cell code and JEF2.2 data. For the core cells, 1-dimensional, two-region cylindrical models were used and the ECCO options chosen according to the prescription given in [3]. The cross-sections for the diluent singularity were computed using the 'macro-cell' option of the cell code, i.e. spatially dependent cross-section sets were created for a sub-division of the diluent region into various zones (see Figure 2-13). Using the neutron multi-group cross-sections created in this way, the neutron flux was computed with BISTRO, and the gamma flux was obtained by applying the calculational methodology described in Chapter 3. Finally, the local gamma heating was computed by applying relation (5-1).
The absolute normalization of the calculations was done with respect to measured U235 fission rates. Calculated rates were obtained in the same way as in the CIRANO analysis (§ 5.1.1). As regards the measured rates, foil activation and fission chamber techniques were applied, both yielding results for spatial distributions in the core consistent with calculations (see also Figure 5-7). As in the CIRANO configurations, a calibrated fission chamber allowed the conversion to absolute fission rate values.

160 Chapter 5
5.2.2 Comparison with Measurements
Figure 5-5 shows the ratio of calculated to measured gamma heating in iron in the diluent and core regions of BALZAC1-DE1. The experimental values used are based on a re-evaluation of the measurements by Calamand et al. employing TLDs and a gas-circulating ionization chamber along both radial channels [4,5]. The uncertainties indicated correspond to the total error in the experiments with TLDs as given in Table 5 of reference [5]. This uncertainty is in general of the order of 5 to 6 %.
0
0.2
0.4
0.6
0.8
1
0 10 20 30 40
C/E Chamber, N-S ChannelC/E Chamber, E-W ChannelC/E TLD
C/E
(Gam
ma
heat
ing
in ir
on)
Distance from core center [cm]
Inne
r Sod
ium
Stai
nles
s St
eel
Out
er S
odiu
m ZONA1 POA ZONA1 PIT
Figure 5-5: Ratio of calculated and measured gamma heating in the diluent on plutonium fueled core regions of BALZAC1-DE1.
The reinterpretation of the raw experimental TLD data obtained by Calamand et al. (Table 13 of ref. [6]), i.e. subtraction of the neutron contribution, application of the cavity, non-saturation and heterogeneity corrections, was done in a manner ensuring that the BALZAC and the current CIRANO measurements have been corrected in a consistent way. The cavity correction was recomputed using Burlin cavity theory as described in § 4.4.1.2. This led to results significantly different from those obtained by Calamand et al. using simple models (which just simulated the TLD-carrying iron piece, the gamma flux being generated by a point source at its center) and the modified photon-electron transport code ACCEPT. The differences were particularly large for the diluent region (current correction factor typically 25 % smaller). The fact that the adequacy of Burlin theory was tested in the present work through

Validation of the Calculational Scheme 161
comparison with detailed MCNP photon-electron coupled calculations, which in turn were validated through supplementary experiments (Appendix D), justifies the new cavity corrections which have been applied.
The neutron correction was recomputed using the method described in § 4.4.1.1. This led to an about 10 % lower neutron contribution compared to the values computed by Calamand et al. This, however, only changes the final results marginally because the neutron contribution was typically less than 16 % of the total response.
Non-saturation and heterogeneity corrections were taken without modification from the interpretation of Calamand et al. They generally compared well with the corresponding results found during the interpretation of the CIRANO experiments. The non-saturation correction was slightly lower than that obtained for the CIRANO measurements, the difference to be explained by the fact that the TLDs were left for some time in the reactor after it had been shut-down so that a part of the delayed emission was "experimentally integrated".
In summary, the reevaluation of the corrections done by Calamand et al. showed that the main difference in their interpretation of TLD measurements as compared to the present work was the determination of the cavity correction.
As regards the chamber measurements, the corrected experimental values were taken without modification from the final analysis by Calamand et al. (Table 8, ref. [6]). In this analysis, the raw experimental results given in ref. [4] were corrected for the neutron contribution, non-saturation of the delayed contribution and heterogeneity effects. The neutron contribution and the non-saturation correction were of similar magnitude as the corrections calculated in § 4.4.2 for the CIRANO chamber measurements. However, the heterogeneity correction was taken as unity in the steel/sodium diluent region and did not, as such, account for the important streaming effect along the radial channel (see Figure 4-22) of gammas leaking out of the core into the diluent region. This might explain the drop in the chamber C/E values at the beginning of the diluent, as indicated in Figure 5-5.
As in the case of the ZONA2B chamber measurements, the BALZAC1-DE1 chamber results were only used in a relative sense. Thus, both calculations and measured values were first inter-normalized in the core region, and then a preliminary (relative) C/E traverse was derived. The absolute C/E values shown in Figure 5-5 were finally obtained by multiplying the relative C/E traverse with the average C/E value deduced from the comparison of calculated and TLD-measured results in the core region.
In general, the ratio of calculated to experimental gamma-heating results for the BALZAC1-DE1 configuration is almost flat, as in the case of the CIRANO experiments. Average C/E values may therefore be considered, and the results are summarized in Table 5-2. The calculations underestimate the gamma heating by about 11 % in both the core region and the central diluent. These findings are consistent with those found for the CIRANO

162 Chapter 5
configurations: A general underestimation of gamma heating by the calculations in both the PuO2/UO2 fueled core and the non-fuel regions (steel/sodium diluent, steel/sodium reflector).
Table 5-2: Average C/E in the PuO2/UO2 fueled core region and the central steel/sodium diluent zone of BALZAC1-DE1, deduced from both TLD and ionization chamber measurements.
Technique Core Steel/Sodium Diluent TLD 0.89 0.89 Chamber 0.89 0.88
It should be noted that the BALZAC chamber measurements could have been analyzed without an inter-normalization to the TLD results. In fact, the BALZAC chambers were calibrated using a Co60 source. This would have led to C/E values lower by about 13 % (C/E of about 0.77 in the core region). This tendency is also found when using the CIRANO chamber results in an absolute way, based on a preliminary calibration of the chamber using the Co60 source of SPR Cadarache. The large difference with respect to the TLD results most probably reflects the fact that the analysis of the chamber calibration has not been done in a consistent way with that of the reactor irradiation. In particular, an appropriate analysis needs to take into account the fact that the gamma field is usually strongly anisotropic during the calibration, whereas in the reactor irradiation the gamma field is incident from all sides. Clearly, such problems associated with the calibration do not influence the quality of relative chamber measurements as affected currently.
5.3 Analysis of Differences Between Experiments and Calculations
The possible sources of the differences between the measured and calculated gamma-heating values are:
1) On the experimental side, systematic errors in:
• The absolute power normalization. • The absolute calibration of the TLDs. • The calculation of the different corrections. • The TLD technique itself.
2) On the calculational side:
• The incorrect determination of the reaction rates of the neutron interactions producing gammas, viz. fission, capture, and inelastic scattering. Thereby, errors in determining the
Validation of the Calculational Scheme 163
reaction rates can be due to a) an incorrect calculation of the neutron flux (spectrum, magnitude) and/or b) incorrect reaction cross-sections.
• Incorrect gamma production data, i.e. errors in the total gamma emission energies, Q eX gγ , , , or in the associated normalized emission spectra, χ γe X g g, ( )→ .
• Errors in the computation of the gamma propagation. • Errors in the gamma KERMA values.
The possibility of large systematic errors on the experimental side can be discarded. The absolute calibration was done with respect to U235 fission rates measured with fission chambers. The absolute calibration of these chambers has been verified through comparison with fission chambers of other laboratories [7]. As regards the absolute calibration of the TLDs, care was taken to carry this out in a very consistent way with respect to the in-reactor irradiations. In particular, the irradiation dose in both calibration and reactor measurements was about the same, thus reducing the risk of any supra-linearity effect. Co60 was used as calibration source because the average emitted energy lies close to the mean spectrum energy in the reactor. TLDs were encapsulated in iron for the calibration as in the reactor. Furthermore, the numerical interpretation of the calibration was verified by supplementary measurements. Finally, repeated calibrations were found to be in excellent agreement. All necessary calculational corrections to the TLD measurements were computed employing the most recent calculational tools and data. The correction most in doubt, viz. the cavity relation, was verified through supplementary measurements and sophisticated photon-electron coupled Monte-Carlo simulations. Great care was taken to establish a highly reproducible measuring procedure, thereby taking advantage of the latest reader and oven instrumentation available. The good agreement between the ZONA5K and the ZONA2B measurements, as well as the excellent consistency with respect to the reevaluated earlier measurements of Calamand et al. in a PuO2/UO2 fueled core region, can be considered as an adequate check of the TLD technique3.
On the calculational side, the possibility of errors in the gamma transport and/or in the gamma KERMA used can be discarded. Gamma interaction data, including KERMA, are in general well known, with an uncertainty of less than 2 % [8]. As a check, the iron multi-group gamma KERMA extracted from the VASCO formulaire, and currently used to compute the local gamma heating in iron according to relation (5-1), were verified through comparison with values created from ENDF/B-VI data using the GAMINR module of NJOY. The values were consistent within about 1 %.
3 The ZONA1 BALZAC core cell was very similar to the core cell (ZONA2) of the CIRANO ZONA5K and ZONA2B configurations shown in Figure 4-10, with the difference that 2 out of the 8 fuel rodlets were not PuO2/UO2 but natural UO2 pins instead. Gamma-heating measurements in the BALZAC and CIRANO cores should thus indeed lead to similar results.

164 Chapter 5
As regards the calculation of the gamma propagation, the BISTRO SN code was used in the present work. The code's performance was checked versus Monte-Carlo (MCNP) calculations (§ 4.4.1.3) and close agreement was found. In addition, effects of the numerical approximations in the SN method (angular discretization, truncation of Legendre expansion) were investigated by comparing, for both the ZONA2B and the BALZAC1-DE1 configurations, calculations using S8P3 and S16P5 approximations. Differences in results were found to be negligibly small (< 0.3 %).
It follows from the above discussion that the differences between calculated and measured gamma heating are most probably due to errors in computing the gamma source, i.e. due to errors in the computation of reaction rates and/or errors in the gamma production data. Below, an attempt is made to identify more precisely the possible causes for the discrepancies in the different regions of interest.
Core
In the core, transport effects are not important (Figure 2-11) and the main gamma source is due to fission reactions (Figure 2-6). Thus, it stands to reason that the observed discrepancies are due to an incorrect, i.e. a too low, calculation of the gamma emission through fission. The principal fission reaction rates are in general found to be well computed in fueled regions. This is shown to be the case from C/E comparisons for both reaction rate ratios and distributions [9,10]. Thus for example, calculated and measured U235 and U238 fission rates along the N-S channel in the core regions of ZONA2B and BALZAC1-DE1 compare well as shown in Figures 5-6 and 5-7. For these comparisons, measurements and calculations were normalized to unity at core center in the case of ZONA2B, while for BALZAC1-DE1 an arbitrary inter-normalization over the core region was carried out.
As fission rates seem to be computed correctly in the core, a major part of the differences found between calculated and measured gamma heating in this region is most probably due to incorrect fission gamma production data, in particular too low total fission gamma emission energies, Q e fission gγ , , , . In fact, increasing fission gamma energy emission by 8 % (a value
acceptable with respect to the estimated uncertainty on the total fission gamma energy emission, § 3.2.5.3) would lead to a 5 % higher gamma heating in the core. Measurements and calculations would then be consistent within the experimental uncertainties.
This finding is in contradiction to the latest evaluation of fission gamma emission by Fort et al. (Table 2-2), which suggests total fission gamma emission energies leading to an even lower fission source, and thus to even lower C/E values.
Another source of the discrepancies could be incorrect fission emission spectra. In fact, it was shown that changing the prompt fission spectrum of Pu239 (from the one computed from the currently used JENDL-3 evaluation) to the analytical form given by relation (2-1), leads to a change in computed gamma heating in iron by 3.5 %.
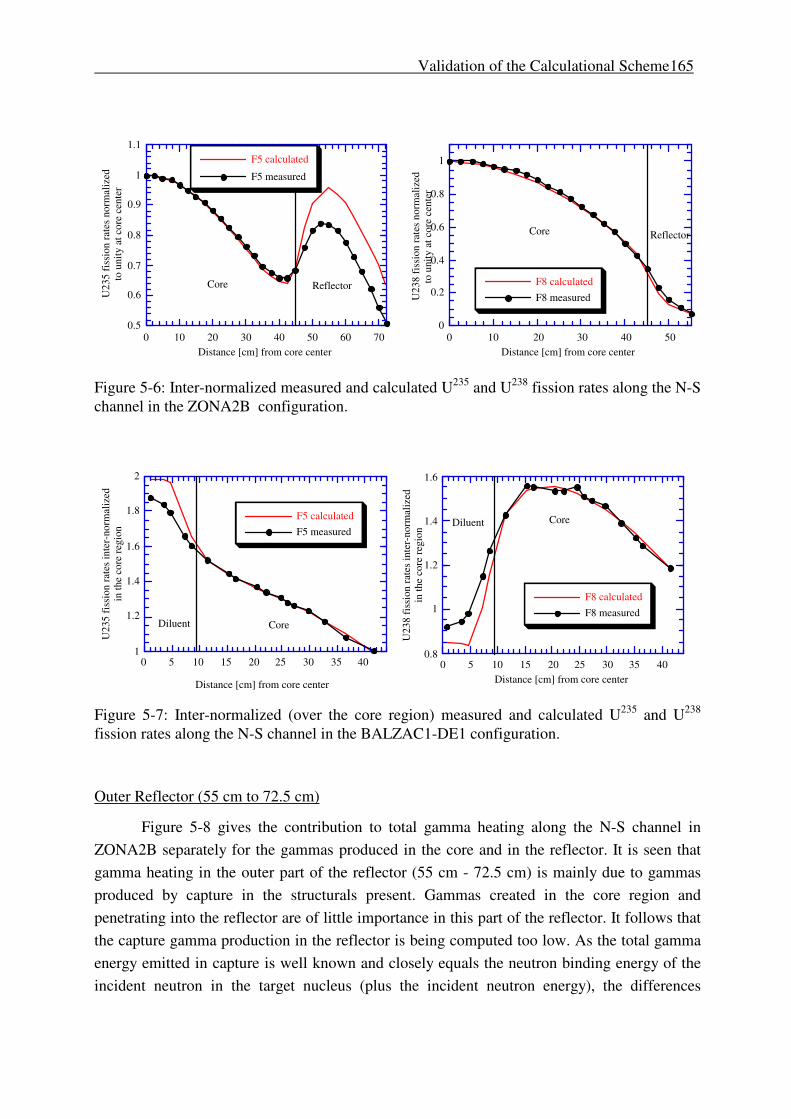
Validation of the Calculational Scheme 165
0.5
0.6
0.7
0.8
0.9
1
1.1
0 10 20 30 40 50 60 70
F5 calculated
F5 measured
U23
5 fi
ssio
n ra
tes
norm
aliz
edto
uni
ty a
t cor
e ce
nter
Distance [cm] from core center
Core Reflector
0
0.2
0.4
0.6
0.8
1
0 10 20 30 40 50
F8 calculatedF8 measuredU
238
fiss
ion
rate
s no
rmal
ized
to u
nity
at c
ore
cent
er
Distance [cm] from core center
Core Reflector
Figure 5-6: Inter-normalized measured and calculated U235 and U238 fission rates along the N-S channel in the ZONA2B configuration.
1
1.2
1.4
1.6
1.8
2
0 5 10 15 20 25 30 35 40
F5 calculatedF5 measured
U23
5 fi
ssio
n ra
tes
inte
r-no
rmal
ized
in th
e co
re re
gion
Distance [cm] from core center
Diluent Core
0.8
1
1.2
1.4
1.6
0 5 10 15 20 25 30 35 40
F8 calculatedF8 measured
U23
8 fi
ssio
n ra
tes
inte
r-no
rmal
ized
in th
e co
re re
gion
Distance [cm] from core center
Diluent Core
Figure 5-7: Inter-normalized (over the core region) measured and calculated U235 and U238 fission rates along the N-S channel in the BALZAC1-DE1 configuration.
Outer Reflector (55 cm to 72.5 cm)
Figure 5-8 gives the contribution to total gamma heating along the N-S channel in ZONA2B separately for the gammas produced in the core and in the reflector. It is seen that gamma heating in the outer part of the reflector (55 cm - 72.5 cm) is mainly due to gammas produced by capture in the structurals present. Gammas created in the core region and penetrating into the reflector are of little importance in this part of the reflector. It follows that the capture gamma production in the reflector is being computed too low. As the total gamma energy emitted in capture is well known and closely equals the neutron binding energy of the incident neutron in the target nucleus (plus the incident neutron energy), the differences
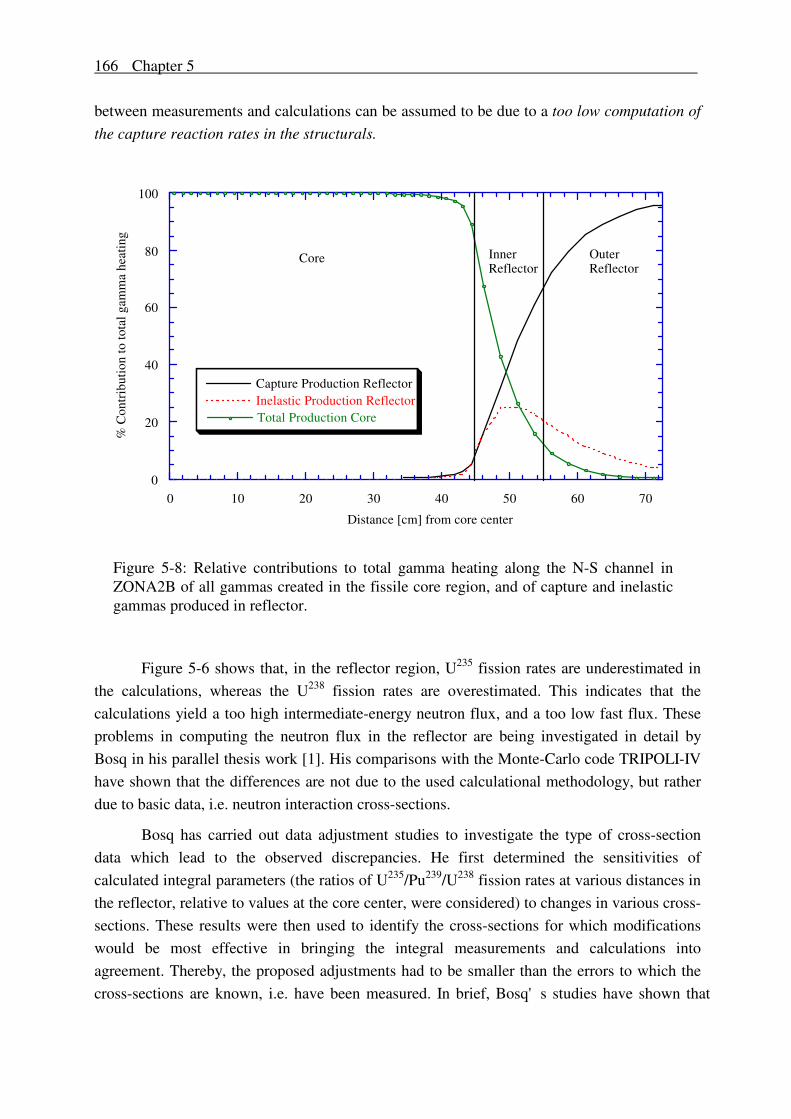
166 Chapter 5
between measurements and calculations can be assumed to be due to a too low computation of the capture reaction rates in the structurals.
0
20
40
60
80
100
0 10 20 30 40 50 60 70
Capture Production ReflectorInelastic Production ReflectorTotal Production Core
% C
ontr
ibut
ion
to to
tal g
amm
a he
atin
g
Distance [cm] from core center
Core InnerReflector
OuterReflector
Figure 5-8: Relative contributions to total gamma heating along the N-S channel in ZONA2B of all gammas created in the fissile core region, and of capture and inelastic gammas produced in reflector.
Figure 5-6 shows that, in the reflector region, U235 fission rates are underestimated in the calculations, whereas the U238 fission rates are overestimated. This indicates that the calculations yield a too high intermediate-energy neutron flux, and a too low fast flux. These problems in computing the neutron flux in the reflector are being investigated in detail by Bosq in his parallel thesis work [1]. His comparisons with the Monte-Carlo code TRIPOLI-IV have shown that the differences are not due to the used calculational methodology, but rather due to basic data, i.e. neutron interaction cross-sections.
Bosq has carried out data adjustment studies to investigate the type of cross-section data which lead to the observed discrepancies. He first determined the sensitivities of calculated integral parameters (the ratios of U235/Pu239/U238 fission rates at various distances in the reflector, relative to values at the core center, were considered) to changes in various cross-sections. These results were then used to identify the cross-sections for which modifications would be most effective in bringing the integral measurements and calculations into agreement. Thereby, the proposed adjustments had to be smaller than the errors to which the cross-sections are known, i.e. have been measured. In brief, Bosq's studies have shown that

Validation of the Calculational Scheme 167
possible reasons for the too high intermediate-energy neutron flux are 1) generally too low capture cross-sections (Fe56: too low by 15 - 20 % below 10 keV; Ni58: too high by 15 % above 10 keV; Cr52: too low by 5 % at all energies), 2) generally too high elastic scattering cross-sections (Fe56: 4 % too high below 200 keV; Ni58: 2 % too high at all energies; Cr52: too high with discrepancies increasing with energy and reaching up to 30 % at 500 keV) and 3) too low inelastic scattering cross-sections (Fe56: too low by 6 % between 2 to 20 MeV, Ni58 and Cr52 too low by 2 - 3 %).
These findings are consistent with the deduction which can be made from the present work. Indeed, the generally too low capture and inelastic cross-sections (in particular those for Fe56) would explain the differences in measured and computed gamma heating. Thus, for example, the effect of increasing the iron capture gamma production by 20 % below 10 keV has been shown to lead to an increase of 6 - 12 % in the gamma heating in the outer reflector.
Inner reflector (45 cm to 55 cm)
This region can be considered as transient zone between the two regions discussed above. Both the gammas produced in the core, and the gammas created through capture (and inelastic) reactions in the structurals of the reflector, contribute in a significant way to heating in this zone, as shown graphically in Figure 5-8. The core contribution, underestimated in the calculations by about 10 %, amounts to 82 % of total gamma heating at the beginning of the zone (45 cm) and then decreases to 13 % at its end (55 cm). Correspondingly, the contribution by gammas produced in the reflector increases from 18 % to 87 %. Thereby, the capture contribution (probably underestimated in the calculations by about 15 % as argued above) increases from 9 % to 67 %. The overall effect in this intermediate zone is thus an underestimation of the gamma heating by about the same order of magnitude (10 to 15 %) as in the core and outer reflector.
Core diluent
Figure 5-9 shows the relative contributions to the total gamma heating of gammas produced in the core and inner diluent regions in the BALZAC1-DE1 configuration.
It is seen that, for the diluent, the contribution of gammas produced in the core is very high, i.e. 86 % at the outer boundary of the diluent and as much as 48 % at the center. On the whole, the core source accounts for 61 % of the total gamma heating in the diluent. A significant part of the calculational underestimation in this zone can thus be explained by the too low gamma production in the core. As regards the contribution of gammas produced in the diluent itself, the situation is analogous to that found in the CIRANO reflector zone. Figure 5-7 shows that measured U235 fission rates are underestimated by the calculations, and U238 rates overestimated. As the same data sets have been used for these calculations as in the CIRANO analysis, it is reasonable to assume that the differences have the same probable cause, viz. too low capture cross-sections for the structurals. Assuming an underestimation of the capture source by about 15 %, and that of the core source by about 10 %, the relative contributions
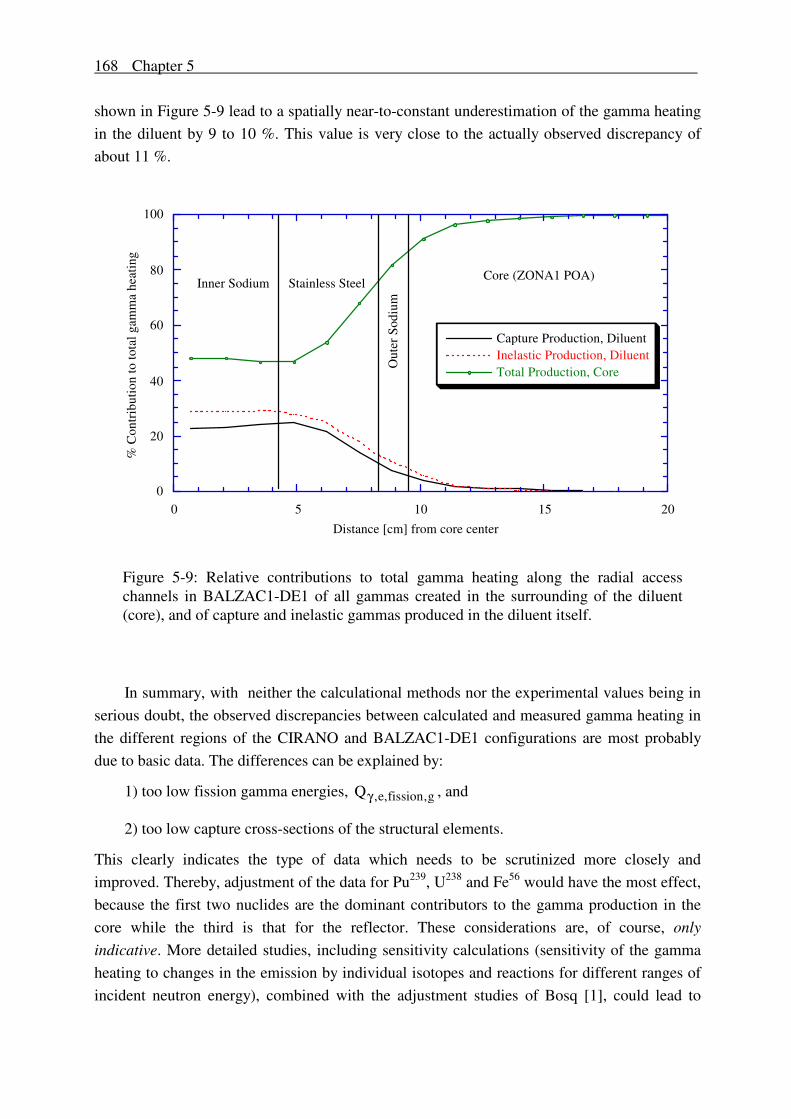
168 Chapter 5
shown in Figure 5-9 lead to a spatially near-to-constant underestimation of the gamma heating in the diluent by 9 to 10 %. This value is very close to the actually observed discrepancy of about 11 %.
0
20
40
60
80
100
0 5 10 15 20
Capture Production, DiluentInelastic Production, DiluentTotal Production, Core
% C
ontr
ibut
ion
to to
tal g
amm
a he
atin
g
Distance [cm] from core center
Inner Sodium Stainless Steel
Out
er S
odiu
m
Core (ZONA1 POA)
Figure 5-9: Relative contributions to total gamma heating along the radial access channels in BALZAC1-DE1 of all gammas created in the surrounding of the diluent (core), and of capture and inelastic gammas produced in the diluent itself.
In summary, with neither the calculational methods nor the experimental values being in serious doubt, the observed discrepancies between calculated and measured gamma heating in the different regions of the CIRANO and BALZAC1-DE1 configurations are most probably due to basic data. The differences can be explained by:
1) too low fission gamma energies, Q e fission gγ , , , , and
2) too low capture cross-sections of the structural elements.
This clearly indicates the type of data which needs to be scrutinized more closely and improved. Thereby, adjustment of the data for Pu239, U238 and Fe56 would have the most effect, because the first two nuclides are the dominant contributors to the gamma production in the core while the third is that for the reflector. These considerations are, of course, only indicative. More detailed studies, including sensitivity calculations (sensitivity of the gamma heating to changes in the emission by individual isotopes and reactions for different ranges of incident neutron energy), combined with the adjustment studies of Bosq [1], could lead to

Validation of the Calculational Scheme 169
more specific conclusions, in particular with respect to capture and inelastic cross-sections for structurals present in the reflector.
5.4 Correction Factors for Computed Gamma Heating in Core, Reflector and Diluent Regions
The performance of the currently developed calculational tool for gamma heating in the core, reflector and diluent regions of plutonium-burning fast reactor configurations is summarized in Table 5-3. Average C/E values are given for the different zones. For the inner reflector region, for which results based on TLD measurements in ZONA5K and ZONA2B differ significantly, the average value is tabulated. The indicated error corresponds to the total experimental uncertainty in each case (Table 4-10).
Table 5-3: Performance of the currently developed calculational tool for gamma heating in core (Pu-enrichment ~ 24 %), reflector and diluent regions.
Zone PuO2/UO2 core
Inner (first 10 cm) steel/sodium reflector
Outer steel/sodium reflector
Steel/sodium diluent
Average C/E
0.89 ± 5.1 % 0.84 ± 6.5 % 0.84 ± 5.2 % 0.89 ± 5.7 %
fe = E/C 1.12 ± 5.1 % 1.19 ± 6.5 % 1.19 ± 5.2 % 1.12 ± 5.7 %
Also given in Table 5-3 are the experimental correction factors fe = E/C (§ 2.5.1.2), defined as the reciprocal of the average C/E values. It is important to recall the role of these correction factors: When employing the currently developed calculational tool for computing gamma heating in configurations similar to those used for its validation, these factors have to be applied to correct the calculated values in order to achieve an accurate determination of the gamma heating. As such, the correction factors have to be considered as part of the formulaire (see § 2.5.1). The accuracy with which the gamma heating is predicted is given by the uncertainty on the experimentally derived correction factor, i.e. the total uncertainty on the measurements used to validate the tool. This is about 5 % in the core and outer reflector, and about 6 % in the inner reflector and in core diluents.
5.5 Transferability to power reactors
In this section, the transferability of the validational findings summarized in Table 5-3 to full-scale power reactors is investigated. This is done by comparing the gamma-heating calculations for the critical configurations used for the validation with those for the power reactor in the light to two principal considerations, viz.:
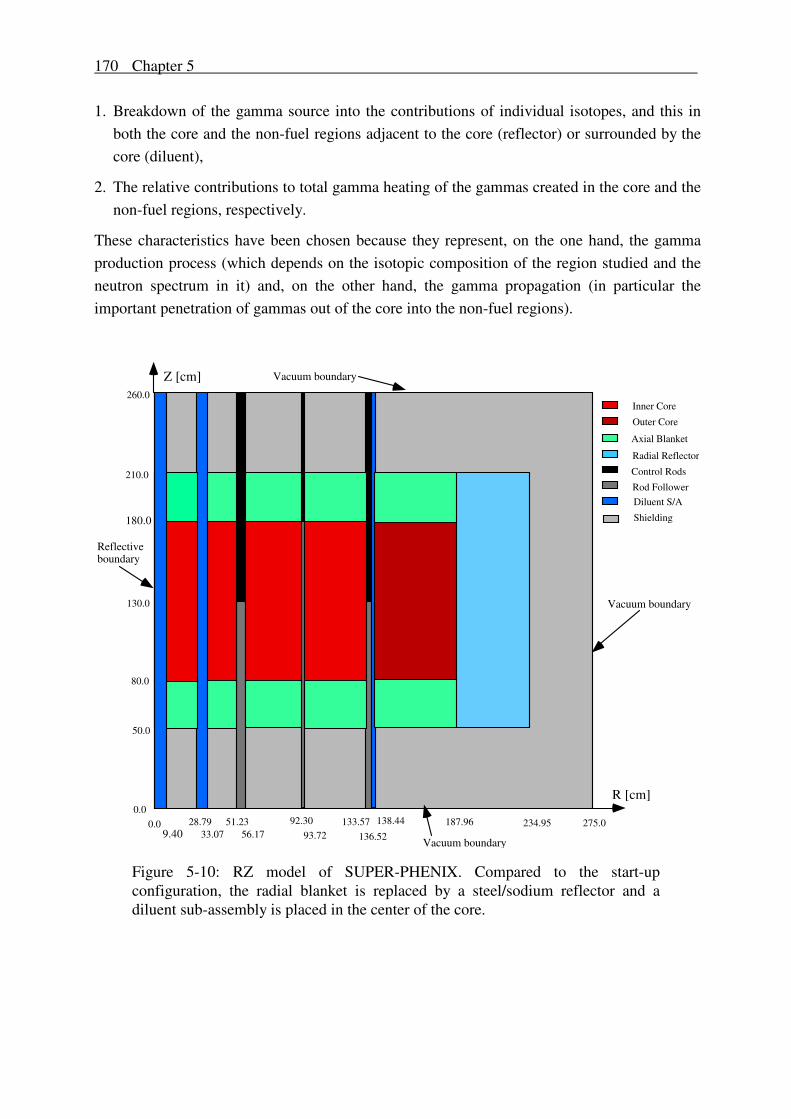
170 Chapter 5
1. Breakdown of the gamma source into the contributions of individual isotopes, and this in both the core and the non-fuel regions adjacent to the core (reflector) or surrounded by the core (diluent),
2. The relative contributions to total gamma heating of the gammas created in the core and the non-fuel regions, respectively.
These characteristics have been chosen because they represent, on the one hand, the gamma production process (which depends on the isotopic composition of the region studied and the neutron spectrum in it) and, on the other hand, the gamma propagation (in particular the important penetration of gammas out of the core into the non-fuel regions).
Inner Core
Outer Core
Axial Blanket
Radial Reflector
Control Rods
Rod FollowerDiluent S/A
Shielding
260.0
210.0
130.0
80.0
50.0
0.00.0 28.79
33.0751.23
56.1792.30
93.72133.57
136.52
138.44 187.96 234.95 275.0
Z [cm]
R [cm]
180.0
9.40
Vacuum boundary
Vacuum boundary
Vacuum boundary
Reflectiveboundary
Figure 5-10: RZ model of SUPER-PHENIX. Compared to the start-up configuration, the radial blanket is replaced by a steel/sodium reflector and a diluent sub-assembly is placed in the center of the core.

Validation of the Calculational Scheme 171
Transferability is investigated with respect to two full-scale power-reactor cases, viz. 1) SUPER-PHENIX, with its radial fertile blanket replaced by a steel/sodium reflector, and (2) the reference CAPRA 4/94 Pu-burning fast reactor configuration (§ 2.1.3). The above-mentioned characteristics were computed for these cases in a consistent way with respect to the calculation of the critical experiments used for the validation (§ 5.1.1 and § 5.2.1). The RZ model for the SUPER-PHENIX calculations is shown in Figure 5-10. This was derived from a SUPER-PHENIX start-up configuration, but with the radial fertile blanket replaced by a steel/sodium reflector and with a diluent sub-assembly at the center of the core. The RZ model used in the case of the CAPRA core is shown in Figure 2-3.
5.5.1 Gamma Heating in Steel/Sodium Reflectors
Table 5-4 gives the isotopic breakdown of the total gamma source in a) the steel/sodium reflector designed to replace the radial blanket of SUPER-PHENIX, b) the reflector of the CAPRA 4/94 Reference Core and c) the reflector of the MASURCA ZONA2B configuration. Only the first 27.5 cm of the reflector are taken into consideration in each case, the ZONA2B reflector being just of this thickness. It is seen that the breakdown for both the SUPER-PHENIX and the CAPRA reflectors is very similar to that found in ZONA2B, although the inelastic contributions are slightly larger (indicating a harder neutron spectrum in the latter case).
Table 5-4: Breakdown of total gamma emission into contributions of different isotopes in the first 27.5 cm of the radial steel/sodium reflector adjacent to the core in SUPER-PHENIX, CAPRA 4/94 and MASURCA. The relative contribution of inelastic scattering is indicated in brackets.
SUPER-PHENIX CAPRA 4/94 MASURCA (ZONA2B) Na 2.9% (39.0%) 3.1% (31.9%) 2.4% (43.8%)
Fe54 4.5% (8.4%) 5.2% (6.8%) 5.0% (11.2%) Fe56 39.3% (23.2%) 47.1% (18.8%) 46.3% (30.3%) Fe57 4.4% (10.8%) 4.3% (11.3%) 4.1% (16.7%) Fe58 0.2% (13.8%) 0.3% (12.7%) 0.2% (21.2%) Cr50 2.1% (5.1%) 2.1% (3.4%) 2.8% (6.0%) Cr52 6.9% (23.8%) 5.4% (21.1%) 8.2% (33.4%) Cr53 5.5% (4.8%) 5.8% (3.3%) 7.6% (5.9%) Cr54 0.1% (61.8%) 0.1% (53.9%) 0.2% (65.4%) Ni58 12.4% (9.0%) 9.5% (6.5%) 8.1% (10.4%) Ni60 3.5% (15.9%) 2.6% (12.1%) 2.3% (18.9%) Ni61 0.5% (7.7%) 0.3% (7.0%) 0.3% (10.5%) Ni62 0.8% (9.6%) 0.7% (6.2%) 0.6% (10.5%) Ni64 0.1% (26.4%) 0.0% (22.2%) 0.0% (32.0%) Mn 16.8% (2.1%) 13.5% (1.7%) 11.9% (3.0%)
TOTAL 100.0% (15.4%) 100.0% (13.4%) 100.0% (21.6%)

172 Chapter 5
Table 5-5 gives the corresponding isotopic breakdown of the total gamma emission for the core region. In the case of the power reactor configurations, the breakdown is given for both the outer core (adjacent to the reflector region) and the inner core (surrounding the diluent sub-assemblies discussed in the next section). The differences between these two regions are not very significant. In the case of the critical experiments, the breakdown is given for both the BALZAC (ZONA1 cell) and ZONA2B (ZONA2 cell) cores.
Table 5-5: Breakdown of total gamma emission into contributions of different isotopes in the core regions of SUPER-PHENIX and CAPRA 4/94, and of the MASURCA configurations BALZAC1-DE1 and ZONA2B.
SUPER-PHENIX CAPRA 4/94 MASURCA Inner
Core Outer Core
Inner Core
Outer Core
BALZAC ZONA1
ZONA2B ZONA2
U235 2.0% 1.7% 0.4% 0.4% 1.4% 0.7% U238 35.0% 30.7% 15.2% 14.5% 30.9% 24.7% Pu239 43.6% 47.4% 41.3% 41.5% 58.8% 59.5% Pu240 4.6% 5.0% 9.0% 9.3% 1.7% 5.3% Pu241 4.2% 5.1% 19.0% 19.0% 0.3% 1.8% Pu242 0.2% 0.3% 3.7% 3.8% 0.0% 0.2% Am241 0.4% 0.2% 0.7% 0.7% 0.1% 1.1%
O 0.1% 0.1% 0.1% 0.1% 0.1% 0.1% Na 1.3% 1.3% 1.5% 1.5% 1.8% 1.7%
Fe54 0.4% 0.4% 0.5% 0.5% 0.2% 0.2% Fe56 4.4% 4.2% 5.3% 5.3% 2.9% 2.9% Fe57 0.3% 0.3% 0.4% 0.4% 0.2% 0.2% Fe58 0.0% 0.0% 0.0% 0.0% 0.0% 0.0% Cr50 0.1% 0.1% 0.1% 0.1% 0.1% 0.1% Cr52 1.0% 1.0% 0.8% 0.8% 0.6% 0.7% Cr53 0.3% 0.3% 0.2% 0.2% 0.2% 0.1% Cr54 0.0% 0.0% 0.0% 0.0% 0.0% 0.0% Ni58 1.1% 1.0% 0.8% 0.8% 0.4% 0.4% Ni60 0.4% 0.4% 0.3% 0.3% 0.2% 0.2% Ni61 0.0% 0.0% 0.0% 0.0% 0.0% 0.0% Ni62 0.1% 0.1% 0.0% 0.0% 0.0% 0.0% Ni64 0.0% 0.0% 0.0% 0.0% 0.0% 0.0% Mn 0.5% 0.4% 0.0% 0.0% 0.2% 0.2% Al - - 0.6% 0.6% - -
TOTAL 100.0% 100.0% 100.0% 100.0% 100.0% 100.0%
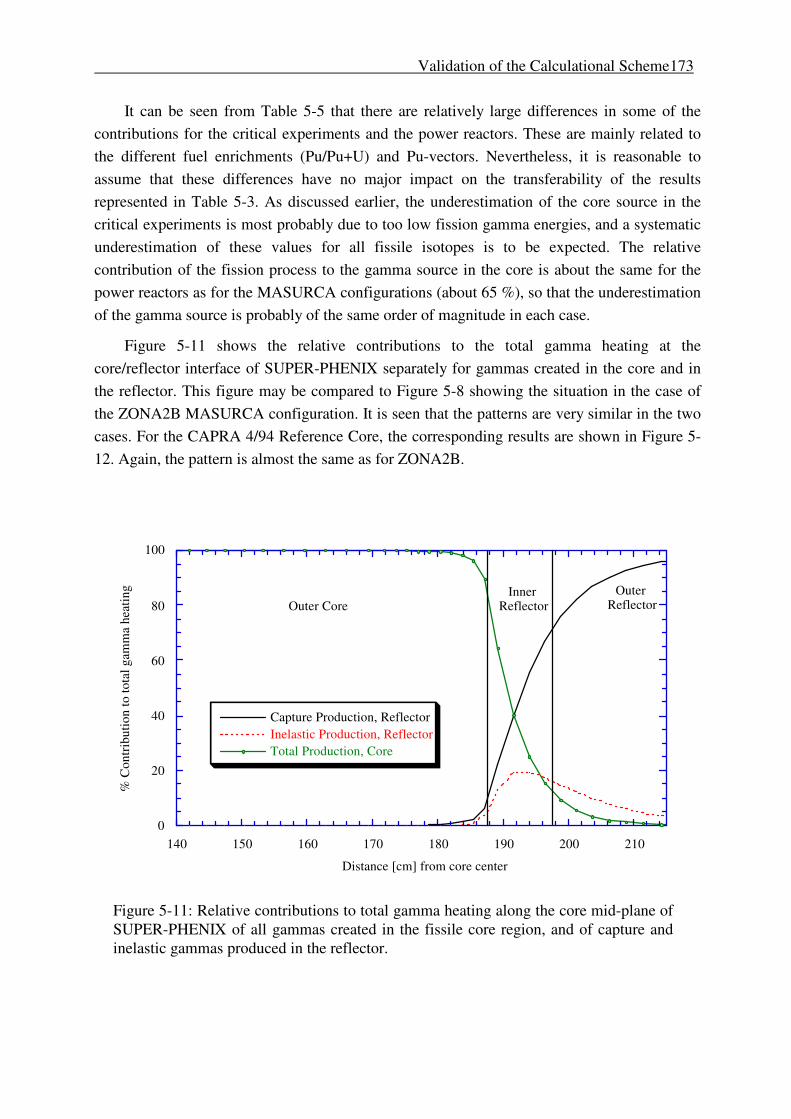
Validation of the Calculational Scheme 173
It can be seen from Table 5-5 that there are relatively large differences in some of the contributions for the critical experiments and the power reactors. These are mainly related to the different fuel enrichments (Pu/Pu+U) and Pu-vectors. Nevertheless, it is reasonable to assume that these differences have no major impact on the transferability of the results represented in Table 5-3. As discussed earlier, the underestimation of the core source in the critical experiments is most probably due to too low fission gamma energies, and a systematic underestimation of these values for all fissile isotopes is to be expected. The relative contribution of the fission process to the gamma source in the core is about the same for the power reactors as for the MASURCA configurations (about 65 %), so that the underestimation of the gamma source is probably of the same order of magnitude in each case.
Figure 5-11 shows the relative contributions to the total gamma heating at the core/reflector interface of SUPER-PHENIX separately for gammas created in the core and in the reflector. This figure may be compared to Figure 5-8 showing the situation in the case of the ZONA2B MASURCA configuration. It is seen that the patterns are very similar in the two cases. For the CAPRA 4/94 Reference Core, the corresponding results are shown in Figure 5-12. Again, the pattern is almost the same as for ZONA2B.
0
20
40
60
80
100
140 150 160 170 180 190 200 210
Capture Production, ReflectorInelastic Production, ReflectorTotal Production, Core
% C
ontr
ibut
ion
to to
tal g
amm
a he
atin
g
Distance [cm] from core center
Outer CoreInner
ReflectorOuter
Reflector
Figure 5-11: Relative contributions to total gamma heating along the core mid-plane of SUPER-PHENIX of all gammas created in the fissile core region, and of capture and inelastic gammas produced in the reflector.

174 Chapter 5
0
20
40
60
80
100
160 170 180 190 200 210 220 230
Capture Production, ReflectorInelastic Production, ReflectorTotal Production, Core
% C
ontr
ibut
ion
to to
tal g
amm
a he
atin
g
Distance [cm] from core center
InnerReflector
OuterReflector
Outer Core
Figure 5-12: Relative contributions to total gamma heating along the core mid-plane of the CAPRA 4/94 Reference Core of all gammas created in the fissile core region, and of capture and inelastic gammas produced in the reflector.
The above results provide strong evidence for the fact that the ZONA2B experimental configuration is largely representative of the gamma-heating situation encountered in both the reflector meant to replace the radial fertile blanket in SUPER-PHENIX and the reflector of the CAPRA 4/94 plutonium-burner design. The only significant differences occur for the isotopic breakdown of the core gamma source.
It can thus be concluded that the performance of the currently developed calculational tool (C/E values), as regards the determination of gamma heating in steel/sodium reflector zones, should be almost the same in the power reactors considered as in the critical experiments (Table 5-3). The indicated uncertainty on the correction factor may be assumed to apply without modification to the outer reflector. In this region, gamma heating is basically due to gammas created in the reflector itself, and the role of gammas penetrating from the core is not important. The indicated uncertainty for the inner reflector, on the other hand, should be increased since here gammas from the core (for which the experimental configurations have not been fully representative) contribute in an important way to gamma heating. The supplementary uncertainty may be estimated by summing up the differences in the isotopic breakdown of the gamma source, and then assuming an uncertainty of 10 %4 on this
4 10 % corresponds to the estimated uncertainty on the total gamma energy emission in a fission event.
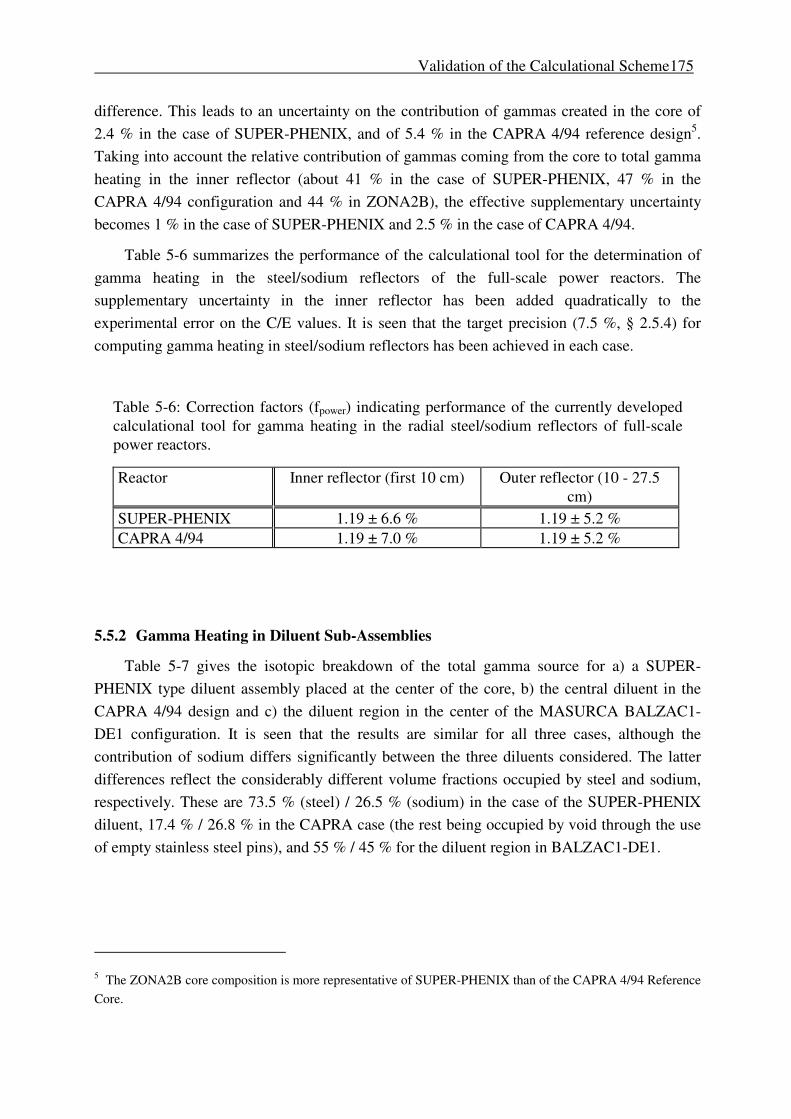
Validation of the Calculational Scheme 175
difference. This leads to an uncertainty on the contribution of gammas created in the core of 2.4 % in the case of SUPER-PHENIX, and of 5.4 % in the CAPRA 4/94 reference design5. Taking into account the relative contribution of gammas coming from the core to total gamma heating in the inner reflector (about 41 % in the case of SUPER-PHENIX, 47 % in the CAPRA 4/94 configuration and 44 % in ZONA2B), the effective supplementary uncertainty becomes 1 % in the case of SUPER-PHENIX and 2.5 % in the case of CAPRA 4/94.
Table 5-6 summarizes the performance of the calculational tool for the determination of gamma heating in the steel/sodium reflectors of the full-scale power reactors. The supplementary uncertainty in the inner reflector has been added quadratically to the experimental error on the C/E values. It is seen that the target precision (7.5 %, § 2.5.4) for computing gamma heating in steel/sodium reflectors has been achieved in each case.
Table 5-6: Correction factors (fpower) indicating performance of the currently developed calculational tool for gamma heating in the radial steel/sodium reflectors of full-scale power reactors.
Reactor Inner reflector (first 10 cm) Outer reflector (10 - 27.5 cm)
SUPER-PHENIX 1.19 ± 6.6 % 1.19 ± 5.2 % CAPRA 4/94 1.19 ± 7.0 % 1.19 ± 5.2 %
5.5.2 Gamma Heating in Diluent Sub-Assemblies
Table 5-7 gives the isotopic breakdown of the total gamma source for a) a SUPER-PHENIX type diluent assembly placed at the center of the core, b) the central diluent in the CAPRA 4/94 design and c) the diluent region in the center of the MASURCA BALZAC1-DE1 configuration. It is seen that the results are similar for all three cases, although the contribution of sodium differs significantly between the three diluents considered. The latter differences reflect the considerably different volume fractions occupied by steel and sodium, respectively. These are 73.5 % (steel) / 26.5 % (sodium) in the case of the SUPER-PHENIX diluent, 17.4 % / 26.8 % in the CAPRA case (the rest being occupied by void through the use of empty stainless steel pins), and 55 % / 45 % for the diluent region in BALZAC1-DE1.
5 The ZONA2B core composition is more representative of SUPER-PHENIX than of the CAPRA 4/94 Reference Core.

176 Chapter 5
Table 5-7: Breakdown of total gamma emission into contributions of different isotopes in the central diluent sub-assemblies of SUPER-PHENIX, CAPRA 4/94 and the BALZAC-DE1 configuration. The relative contribution of inelastic scattering is indicated in brackets.
SUPER-PHENIX CAPRA 4/94 MASURCA (BALZAC)
Na 3.2% (60.3%) 13.0% (69.5%) 6.6% (78.1%) Fe54 5.0% (16.2%) 4.9% (21.9%) 4.9% (26.2%) Fe56 41.2% (45.8%) 46.7% (54.3%) 47.3% (65.4%) Fe57 4.9% (16.6%) 4.4% (21.2%) 4.2% (28.4%) Fe58 0.2% (31.8%) 0.2% (47.2%) 0.2% (52.0%) Cr50 1.9% (13.1%) 1.1% (18.0%) 1.5% (23.5%) Cr52 9.8% (42.2%) 7.0% (51.0%) 10.6% (60.4%) Cr53 5.1% (12.6%) 3.0% (17.7%) 4.1% (24.0%) Cr54 0.2% (76.2%) 0.1% (82.4%) 0.3% (83.8%) Ni58 11.9% (18.8%) 7.8% (24.0%) 8.8% (27.7%) Ni60 3.9% (29.0%) 2.6% (37.1%) 3.1% (41.6%) Ni61 0.6% (12.4%) 0.3% (17.3%) 0.4% (20.0%) Ni62 0.7% (21.5%) 0.5% (29.3%) 0.6% (33.4%) Ni64 0.1% (43.0%) 0.1% (53.9%) 0.1% (57.5%) Mn 11.4% (5.9%) 8.3% (6.6%) 7.3% (12.1%) TOTAL 100.0% (31.9%) 100.0% (44.5%) 100.0% (51.6%)
The isotopic breakdown of the gamma source in the core region surrounding the diluent in each case is given in Table 5-5 (inner SUPER-PHENIX core, inner CAPRA core, BALZAC ZONA1 core region), and the possible impact of the differences has already been discussed.
Figure 5-13 shows the various contributions to total gamma heating in the vicinity of the diluent sub-assembly placed in the center of SUPER-PHENIX. This figure may be compared to Figure 5-9 which gives the corresponding breakdown for the BALZAC1-DE1 configuration. It is seen that, relative to the experimental situation, the contribution of gammas created in the core is less important (55 % versus 61 % of the volume-integrated total gamma heating in the diluent), the capture production in the diluent itself significantly more important (27 % versus 18 %), and the inelastic production correspondingly less important (18 % versus 21 %). The differences can be explained by the higher volumetric proportion of steel in the SUPER-PHENIX diluent as compared to that in BALZAC. On the one hand, more gammas are created in the diluent through interaction with steel than with sodium, with, at the same time, the gammas penetrating from the core being more strongly attenuated. On the other hand, there is a stronger slowing down of the neutrons penetrating from the core into the diluent, which leads to a softer neutron spectrum and thus enhanced capture.

Validation of the Calculational Scheme 177
0
20
40
60
80
100
0 5 10 15 20
Capture Production, DiluentInelastic Production, DiluentTotal Production, Core
% C
ontr
ibut
ion
to to
tal g
amm
a he
atin
g
Distance [cm] from core center
CentralSteel/Sodium
DiluentInner Core
Figure 5-13: Relative contributions to total gamma heating along the core mid-plane of SUPER-PHENIX of all gammas created in the fissile core region surrounding the central diluent, and of capture and inelastic gammas produced in the diluent itself.
0
20
40
60
80
100
0 5 10 15 20
Capture Production, DiluentInelastic Production, DiluentTotal Production, Core
% C
ontr
ibut
ion
to to
tal g
amm
a he
atin
g
Distance [cm] from core center
Inner CoreCentral
Sodium/SteelDiluent
Figure 5-14: Relative contributions to total gamma heating along the core mid-plane of the CAPRA 4/94 Reference Core of all the gammas created in the fissile core region surrounding the central diluent, and of capture and inelastic gammas produced in the diluent itself.
178 Chapter 5
For the CAPRA 4/94 reference design, the situation corresponding to Figures 5-9 and 5-13 is shown in Figure 5-14. As compared to the BALZAC case, the contribution of gammas penetrating from the core into the diluent is significantly larger (85 % versus 61 %). Again, this is a consequence of the considerably smaller volume proportions of both steel and sodium in the CAPRA diluent design: The gamma production in the diluent is significantly lower, and furthermore there is less attenuation of the gammas coming from the core.
The results discussed above show that the gamma-heating situation in the diluent region of the BALZAC1-DE1 configuration is quite different from that encountered in the central diluent sub-assembly of the CAPRA 4/94 reference design, and only partially representative of a diluent sub-assembly in SUPER-PHENIX. This is largely a consequence of the different volumetric proportions of steel and sodium in the experimental diluent region6, as well as of the different fuel enrichment and isotopic composition of the surrounding core region. Nevertheless, as reasoned below, the performance of the currently developed calculational tool for gamma heating may be expected to be similar for the diluent regions of SUPER-PHENIX, CAPRA 4/94 and BALZAC1-DE1, i.e. that the calculations underestimate gamma heating by around 11 %.
Considering the heating in the SUPER-PHENIX type diluent, the performance of the calculational tool may be assessed by assuming an underestimation of the contribution of gammas created in the core by 11 %, and an underestimation of the contribution by capture gammas in the steel/sodium region by 15 %, as deduced from the analysis of the CIRANO measurements (§ 5.3). Taking into account the respective contributions of gammas of different origin, one obtains an effective underestimation of the total gamma heating in the diluent region of the same order of magnitude as for the BALZAC diluent, viz. about 11 %.
As regards gamma heating in the CAPRA diluent, 85 % of the heating is due to gammas penetrating from the core. Thus, the accuracy of the calculational tool for computing this quantity is approximately that for determining the total gamma emission in the core region, i.e. once again about 11 %.
To verify the above estimations, it would be desirable to investigate experimental configurations having diluent zones with steel/sodium volume proportions and surrounding fuel compositions representative of the power reactors of interest. In fact, even a range of measurements of gamma heating in fissile regions having fuel compositions (enrichment, Pu-vector) characteristic of such power reactors would be of great value7. Such measurements would not only be useful for confirming the above indicated findings with respect to gamma
6 It should be borne in mind that the dimensions of the BALZAC1-DE1 diluent zone are quite representative of the diluent sub-assemblies of the full-scale power reactors.
7 Appendix E presents an evaluation of the somewhat limited measurements which were currently made in the central ZONA5K core region, having a fuel enrichment characteristic of the CAPRA core.

Validation of the Calculational Scheme 179
heating in diluents, but also further strengthen the results presented in Table 5-6 for reflector regions.
Also of great interest would be more exhaustive investigations to identify the sources of discrepancies between measured and computed gamma heating in fissile regions, in particular the study of the effect of individual isotopes. This would allow a more precise assessment of the impact of differences in fuel enrichment and isotopic composition, and facilitate the extrapolation of experimental findings to any given power reactor situation. In this context, the accurate determination (through measurements) of the total gamma energy released in fission by different isotopes is of considerable interest, because, as discussed earlier, the above-mentioned discrepancies are most probably due to incorrect fission energies.
[1] J.C.Bosq, "Développement et qualification d'un formulaire adapté à SUPER-PHENIX avec réflecteurs", Thesis, Université d'Aix-Provence (to be submitted)
[2] R.deWouters, D.Calamand, F.Cleri, P.D'Hondt, G.Granget, A.Stanculescu, "Measurements and Analysis of Gamma-Ray Energy Deposition in a Critical Assembly Containing a Central Simulated Diluent", International Conference on the Physics of Reactors: Operation, Design and Computation, PHYSOR 90, Marseille (France), April 23-27, 1990
[3] G.Rimpault, P.Smith, R.Jacqmin, F.Malvagi, J.M.Rieunier, D.Honde, G.Buzzi, P.J.Finck, "Schéma de calcul de référence du formulaire ERANOS et orientations pour le schéma de calcul de projet", Technical Note, CEN Cadarache (1997)
[4] P.Bertrand, A.Brocart, A.Cottin, F.Lopez, G.Granget, R.deWouters, "Ensemble des résultats expérimentaux nécessaires à l'interprétation des mesures gamma effectuées dans MASURCA, coeur BALZAC1-DE1 en décembre 1986", Technical Note, CEN Cadarache (1987)
[5] F.Cleri, D.Calamand, "Analysis of the BALZAC1-DE1 experimental results on gamma-ray heating measurements with CEA-ENEA methods", Technical Note, CEN Cadarache (1988)
[6] D.Calamand, F.Cleri, "Formulaire Gamma VASCO-1: Dégagement d'énergie gamma dans des assemblages diluant et absorbant", Technical Note, CEN Cadarache (1989)
[7] J.Pierre, M.Martini, "Rapport d'expérience - BERENICE - CORE ZONA2A - The experimental results", Technical Note, CEN Cadarache (1994)
[8] J.H.Hubbell, "Photon Mass-Attenuation and Energy-Absorption Coefficients from 1 keV to 20 MeV", Int.J.Appl.Radiat.Isot. 33, 1269 (1982)
[9] G.Rimpault, M.Martini, R.Jacqmin, J.C.Bosq, P.J.Finck, S.Pelloni, O.P.Joneja, A.Ziver, A.Lüthi, A.Stanculescu, R.Chawla, "Experimental Validation of Nuclear Data and Methods for Steel Reflected Plutonium Burning Fast Reactors", International Conference on the Physics of Reactors, PHYSOR 96, Mito (Japan), September 16-20, 1996
[10] P.Smith, G.Rimpault, R.Soule, M.Toupin, "Analysis of the CIRANO ZONA2A and ZONA2A3 Clean Cores", Technical Note, CEN Cadarache (1995)


181
6. CONCLUSIONS AND RECOMMENDATIONS
The present research has involved the development and implementation of a new calculational scheme for the determination of gamma heating in fast reactors, as well as its validation for gamma heating calculations for Pu-burning configurations. These configurations are characterized by a large number of core diluting sodium/steel sub-assemblies and steel/sodium reflector regions surrounding the core. Gammas account for about 90 % of total heating in these non-fuel regions.
The work carried out has essentially consisted of (i) a series of improvements in the calculational methodology for gamma heating, (ii) experimental validation based on more accurate and representative measurements than those available earlier, and (iii) the demonstration of transferability of the various findings to full-scale power reactor designs.
Calculational Developments
In comparison to the former European scheme used for gamma-heating calculations, the major improvements in the new methodology are with respect to the most demanding part of the computation, viz. that of the gamma source distribution. These improvements are:
• The separate treatment of all reactions producing gammas by folding gamma production multiplicities for fission, capture and inelastic scattering with the corresponding effective (self-shielded) neutron cross-sections and summing them up to yield the total gamma production matrices. This has enabled the consideration of the latest improvements in computing effective cross-sections at the cell level (ECCO cell code, § 2.5.2.1), in particular the use of spatially varying cross-sections in non-fuel regions such as reflectors.
• The use of gamma production multiplicities derived from the latest nuclear data evaluations.
• The use of neutron flux distributions (to generated the gamma source from the gamma production matrices) obtained employing improved neutronics methods and data by embedding the scheme in the ERANOS (European Reactor ANalysis Optimized System) code package.
An important feature of the current development work has been the creation of new gamma production data files. This was crucial since, assuming that the neutron reactions producing gammas are well computed, the major difficulty in gamma-heating calculations is the availability of an appropriate set of gamma production multiplicities.
The creation of such gamma production multiplicities separately for fission, capture and inelastic scattering from the nuclear data available in the ENDF (Evaluated Nuclear Data Files) files has shown that the major problem in defining an accurate set is the relatively large

182 Chapter 6
uncertainty on the gamma production in fission. In fact, total gamma fission emission values given by various authors differ significantly. The large uncertainty (~ 8 %) on the fission sources is not only of importance when computing gamma heating in the fissile core region (where fission gammas contribute about 65 % of total gamma heating), but also in the non-fuel regions typical of Pu-burners. This follows from the fact that an important contribution to gamma heating in the latter regions is from fission gammas created in the core (e.g. around 55 % for a core diluent) and penetrating into these zones.
There is less uncertainty on the total gamma energy released in capture and inelastic scattering. In fact, these energy values can be reliably deduced from analytical relations (e.g. the energy released in capture is approximately equal to the binding energy of the incident neutron in the target nucleus plus its kinetic energy). The ENDF data used for the creation of the capture and inelastic multiplicities could therefore be tested against such relations. Some discrepancies were found (e.g. too high inelastic production for U238, about 10 % too low capture production in Na23, completely erroneous capture data for Fe57), but the impact of these incorrect data was found to be small.
Experimental Validation
The validation of the currently developed calculational scheme for gamma heating in the steel/sodium reflector and in sodium/steel diluent regions of Pu-burning fast reactors was accomplished through comparisons with new gamma-heating measurements conducted in the framework of the CIRANO experimental programme at the MASURCA facility, as well as with reevaluated earlier measurements by Calamand et al. in the BALZAC1-DE1 configuration of the same facility. The CIRANO experiments yielded measured gamma-heating rates in a PuO2/UO2 fueled core and in the steel/sodium reflector surrounding it. In the BALZAC1-DE1 experiments, gamma-heating was measured in a central steel/sodium (diluent) zone and in the surrounding core region (of similar composition as in the CIRANO configurations).
In the CIRANO measurements, absolute gamma-heating rates were determined using ThermoLuminescent Dosimeters (TLDs). Thereby, a considerable effort was undertaken to improve the reliability of the absolute dose determination (i.e. to minimize the risk of systematic errors) and to reduce statistical uncertainties. This was achieved by 1) an absolute TLD calibration carried out in a completely consistent manner with respect to the reactor measurements, 2) the determination of individual calibration factors with an experimental uncertainty of about 1.7 %, 3) the establishment of a TLD measuring procedure yielding results with a statistical error lower than 2 %1, taking advantage of the latest reader and oven equipment available, 4) the computation of the necessary correction factors using the most
1 dispersion (1 σ) on the response of a single TLD irradiated several times under exactly the same conditions

Conclusions and Recommendations 183
recent methods and data, and 5) a detailed investigation of the cavity correction. The total error on the corrected measurements is estimated to be in general less than 6 %.
It has been found that, if the TLD measurements in CIRANO and the earlier BALZAC programme are corrected in a consistent way, absolute gamma dose values in the core compare well. As the measurements in the two programmes were carried out by different people using different TLD equipment, it may be concluded that there are no large systematic errors in the TLD measurements themselves.
As regards the calculational correction factors which need to be applied to the measurements, these were in general found to be consistent between the current and earlier analysis. An important exception, however, was the cavity correction for which there were discrepancies of 10 to 30 %. Calamand et al. determined the latter correction using the ACCEPT code (see page 177). In the present work, the correction has been determined by applying Burlin cavity theory and verified using photon-electron coupled MCNP Monte-Carlo calculations. The latter were, in turn, validated through comparisons with experimental results from TLDs irradiated in various (TLD) cavity surroundings.
The comparison of calculated and measured gamma-heating values has shown that, despite the significant improvements made in the calculational scheme, the latter underestimates gamma heating by 10 % in the PuO2/UO2 core region, by 16 % in the reflector and by 11 % in the diluent zone. Since the experimental error on the current measurements is less than 6 %, and with all major deficiencies in the calculational algorithms having been removed, one may conclude that the discrepancies are due to errors in the basic nuclear data used.
As regards the situation in the core, the basic data most in question are the total fission gamma energies since fission gammas make the most important contribution to gamma heating in this region. The values currently adopted seem to be too low. This conclusion is consistent with the relatively large uncertainty on fission gamma energies in general. As Pu239 is the most important isotope for gamma energy production in the core (contributing about 60 % of the total gamma emission), changes in data for this isotope would affect the results most. In fact, efforts should be undertaken to determine the total gamma energy emitted due to the fission of U235, U238, Pu239, Pu240 and Pu241 more precisely. This would allow clearer identification of the causes of the observed discrepancies and facilitate extrapolation of the current findings to cores of different plutonium enrichments and isotopic compositions.
For the reflector (as least the outer part of it), the major contribution to heating is the gamma emission through capture in the structurals. With the total gamma energy released in capture being well known, it is the capture reaction rates in the structurals which seem to be underestimated in the calculations. As Fe56 is the most important isotope for gamma production in the reflector (contributing about 45 % of the total gamma emission), changes in data for this isotope would affect the results most. This conclusion is consistent with the

184 Chapter 6
analysis of Bosq who, in his parallel thesis work, investigated possible reasons for the overprediction of fission rates in the CIRANO reflector region. He found these to be too low capture cross-sections (in particular of Fe56 below 10 keV), slightly too low inelastic scattering and too high elastic scattering cross-sections for structurals.
In diluent zones (and also in the inner reflector), gammas created both in the core and in the non-fuel region itself contribute in an important way to heating. The current underestimation for these regions can be interpreted as a combined effect of the too low fission gamma energies and the too low capture cross-sections for the structurals.
Transferability to Power Reactors
The transferability of the above validation findings to SUPER-PHENIX with its fertile blanket replaced by a steel/sodium reflector, as well as to the CAPRA 4/94 reference Pu-burner design, was investigated by comparing the gamma-heating calculations for the critical configurations used for the validation with those for the power reactor. This was done with respect to two principal considerations, viz. breakdown of the gamma source (in different regions) into the contributions of individual isotopes and the relative contributions to total gamma heating of the gammas created in the core and the non-fuel region.
These comparisons have shown that the situation in the radial reflector of the CIRANO configuration is indeed representative of the situation found in the SUPER-PHENIX and CAPRA reflectors, with the restriction that the isotopic breakdown of the core gamma emission is somewhat different between the critical experiments and the power reactors due to the different Pu-enrichments (SUPER-PHENIX: ~ 16 % Pu, CAPRA: ~ 45 %; CIRANO: 24.5 %) and Pu-vectors. This might influence conclusions regarding the inner part of the reflector where gammas created in the core contribute to the heating in an important way, but the effect is difficult to quantify without explicit information on the error contributions of the individual fissioning isotopes. However, if one assumes a systematic underestimation of fission gamma emission by all the nuclides, differences in individual contributions do not really matter since the fissioning isotopes, as a whole, contribute about the same (~ 65 %) to the total gamma emission in the core regions of both the critical configurations and the power reactors.
Since the CIRANO and BALZAC experiments can be considered as representative, the C/E value obtained for the reflector region (0.84 ± 6.5 %, on average) can be used to "correct" computed gamma-heating values. As a consequence, the currently developed calculational tool effectively enables the determination of gamma heating in the steel/sodium reflector which was planned to replace the fertile blanket of SUPER-PHENIX, as well as in the reflector of the CAPRA 4/49 design, with an uncertainty lower than 7.5 %, i.e. meets the target accuracy for such calculations.
The situation encountered for the diluent region of the BALZAC configuration is quite different from that for a diluent sub-assembly of the CAPRA 4/94 reference design and is only partially representative of a diluent subassembly in SUPER-PHENIX. This is because of the

Conclusions and Recommendations 185
different volumetric proportions of steel and sodium in the different diluent zones, as well as the different fuel compositions in the surrounding core regions. It has been shown (§ 5.5.2), however, that despite these differences a similar underestimation of gamma heating (~ 11 %) may be expected in the power reactor diluents as in the critical experiment. Nevertheless, experiments with more representative diluent mock-ups (in terms of steel/sodium volume proportions, as well as surrounding core compositions) would be desirable. In fact, even a range of measurements in fissile regions having fuel compositions (enrichment, Pu-vector) characteristic of Pu-burners, would be of great value (see also Appendix E). This follows from the fact that the major contribution to gamma heating in diluent regions comes from gammas emitted in the core (85 % for a CAPRA diluent, 55 % in a SUPER-PHENIX diluent).
Recommendations
Recapitulating the work currently carried out, a new calculational tool for gamma-heating calculations has been implemented and tested for Pu-burning fast reactors. The calculational methodology developed to determine the distribution of the gamma source represents a significant improvement to that applied in earlier existing tools. As the calculational algorithms have been formulated in a near-to-exact manner, the main deficiencies of the new calculational scheme appear to be data related, viz. incorrect fission gamma production multiplicites and too low neutron capture cross-sections for structurals. These data should be investigated in greater detail and changed as and when more specific evidence (e.g. more accurate measurements) becomes available.
Apart from the recommendations for future work already made (experiments with more representative mock-ups of the diluent sub-assemblies of Pu-burners, detailed measurements in cores with more characteristic fuel compositions, determination of gamma energy released in the fission of individual uranium and plutonium isotopes), certain other aspects which could not be addressed during this work seem worth pursuing. These are:
- The implementation of a 3-dimensional gamma transport module in ERANOS. Indeed, till now, only 2-dimensional SN transport calculations have been possible, as an approximation to the real-life 3-dimensional situation. Such an extended modeling possibility could be important, for example, in determining gamma heating in off-center diluents. Recently, the 3-dimensional nodal transport code TGV [1] was implemented in ERANOS for neutronic calculations. As the transport of neutrons and gammas can be treated with the same basic methodology, it should in principle be possible to implement the TGV code for gamma transport calculations without major difficulties.
- The validation of the new calculational tool for the determination of the axial distribution of gamma heating. So far, it is only for radial profiles that calculation/experiment comparisons have been made.
- The continued search for hidden systematic errors in the TLD technique. In particular, it would be worthwhile to investigate the sensitivity of TLD efficiency to the incident gamma

186 Chapter 6
energy. In the literature, it is generally assumed that the efficiency is constant, but this is based mainly on measurements by Tochilin et al. [2] in the range from 6 keV to 2.8 MeV. A review of these measurements seems to be necessary if experimental accuracies of better than 5 % are to be achieved.
- The development of an alternative gamma-heating measuring technique. Although the TLD technique proved to be invaluable in the current research, it is very time consuming, sensitive to various parameters, and moreover several significant calculational corrections have to be applied. The development of an easier-to-use absolute technique would be desirable and would also allow a cross-check of TLD measurements. Thereby, more intensive application of the gamma chamber technique appears promising. As compared to TLDs (TLD-700), gamma chambers are less sensitive to neutrons, their response is more stable, the cavity correction can be avoided by the application of an appropriate calibration, and they are more easy to handle. Their relatively large size, however, remains a disadvantage.
[1] C.B.Carrico, E.E.Lewis, G.Palmiotti, "Three-Dimensional Variational Nodal Transport Methods for Cartesian, Triangular, and Hexagonal Criticality Calculations", Nuclear Science and Engineering 111, 168 (1992)
[2] E.Tochilin, N.Goldstain, T.J.Layman, In: 2nd Int. Conf. on Luminescence Dosimetry, CONF-680820 (US Atomic Energy Commission, Washington, DC), p. 424 (1969)

187
APPENDIX A: Neutron (ECCO) and Gamma (VASCO) Multi-Group Structures1
Group Upper group boundary [eV] Neutron Structure Gamma Structure
1 1.964033E+07 1.406000E+07 2 1.000000E+07 1.200000E+07 3 6.065307E+06 1.000000E+07 4 3.678794E+06 8.000000E+06 5 2.231302E+06 7.500000E+06 6 1.353353E+06 7.000000E+06 7 8.208500E+05 6.500000E+06 8 4.978707E+05 6.000000E+06 9 3.019738E+05 5.500000E+06 10 1.831564E+05 5.000000E+06 11 1.110900E+05 4.500000E+06 12 6.737947E+04 4.000000E+06 13 4.086771E+04 3.500000E+06 14 2.478752E+04 3.000000E+06 15 1.503439E+04 2.500000E+06 16 9.118820E+03 2.000000E+06 17 5.530844E+03 1.660000E+06 18 3.354626E+03 1.500000E+06 19 2.034684E+03 1.330000E+06 20 1.234098E+03 1.000000E+06 21 7.485183E+02 8.000000E+05 22 4.539993E+02 7.000000E+05 23 3.043248E+02 6.000000E+05 24 1.486254E+02 5.120000E+05 25 9.166088E+01 5.100000E+05 26 6.790405E+01 4.500000E+05 27 4.016900E+01 4.000000E+05 28 2.260329E+01 3.000000E+05 29 1.370959E+01 2.000000E+05 30 8.315287E+00 1.500000E+05 31 4.000000E+00 1.000000E+05 32 5.400000E-01 7.500000E+04 33 1.000000E-01 6.000000E+04 34 1.100000E-04 4.500000E+04 35 3.000000E+04 36 2.000000E+04
1.000000E+04
1 33 groups for ECCO, 36 for VASCO.


189
APPENDIX B: Evaluations Used for the Creation of KERMA and Spectra Files.
The table below gives for each isotope/element the ENDF evaluation from which KERMA and gamma production data were generated. Also indicated are the reaction numbers for which gamma production is present in the evaluation. Reactions in parenthesis were not taken into account for the generation of the data files.
Isotope/Element Evaluation Reactions with Photon Production Data Li6 JEF2.2 MT 57 MF 12/14
MT 102 MF 12/14 Li7 JEF2.2 MT 51 MF 12/14
MT 102 MF 12/14 B10 JEF2.2 MT 4 MF 13/14
MT 102 MF 12/14 MT 103 MF 13/14 MT 801 MF 12/14
B11 JEF2.2 MT 4 MF 13/14 MT 91 MF 6 MT 102 MF 12/14 MT 103 MF 6 MT 107 MF 6 (MT 16/22/28 MF 6)
C JEF2.2 MT 51 MF 13/14 MT 102 MF 12/14
O JEF2.2 MT 4 MF 13/14 MT 102 MF 12/14 MT 103 MF 13/14 MT 107 MF 13/14 (MT 22 MF 13/14)
Na JEF2.2 MT 3 MF 13/14/15 MT 51-61 MF 12/14 MT 102 MF 12/14 /15
Al ENDF/B-VI MT 4 MF 13/14/15 MT 102 MF 12/14 MT 103 MF 13/14 (MT 28 MF 13/14/15)
Cr50 ENDF/B-VI MT 51-56 MF 12/14 MT 91 MF 6 MT 102 MF 12/14/15 MT 103 MF 6 MT 107 MF 6 (MT 16/22/28 MF 6)

190
Isotope/Element Evaluation Reactions with Photon Production Data Cr52 ENDF/B-VI MT 51-60 MF 12/14
MT 91 MF 6 MT 102 MF 12/14/15 MT 103 MF 6 MT 107 MF 6 (MT 16/22/28 MF 6)
Cr53 ENDF/B-VI MT 51-63 MF 12/14 MT 91 MF 6 MT 102 MF 12/14/15 MT 103 MF 6 MT 107 MF 6 (MT 16/22/28 MF 6)
Cr54 ENDF/B-VI MT 51-54 MF 12/14 MT 91 MF 6 MT 102 MF 12/14/15 MT 103 MF 6 MT 107 MF 6 (MT 16/22/28 MF 6)
Mn ENDF/B-VI MT 51-79 MF 12/14 MT 91 MF 6 MT 102 MF 12/14/15 MT 103 MF 6 MT 107 MF 6 (MT 16/22/28 MF 6)
Fe54 JEF2.2 MT 4 MF 13/14/15 MT 102 MF 12/14/15 MT 103 MF 13/14/15 MT 107 MF 13/14/15 (MT 16 MF 13/14/15)
Fe56 JEF2.2 MT 4 MF 13/14/15 MT 102 MF 12/14/15 MT 103 MF 13/14/15 MT 107 MF 13/14/15 (MT 16 MF 13/14/15)
Fe57 JEF2.2 MT 4 MF 13/14/15 MT 102 MF 12/14/15 MT 103 MF 13/14/15 MT 107 MF 13/14/15 (MT 16 MF 13/14/15)
Fe58 JEF2.2 MT 4 MF 13/14/15 MT 102 MF 12/14/15 MT 103 MF 13/14/15 MT 107 MF 13/14/15 (MT 16 MF 13/14/15)
Ni58 JEF2.2 MT 51-58 MF 12/14 MT 91 MF 6 MT 102 MF 12/14/15 MT 103 MF 6 MT 107 MF 6 (MT 16/22/28 MF 6)

Appendix B 191
Isotope/Element Evaluation Reactions with Photon Production Data Ni60 JEF2.2 MT 51-61 MF 12/14
MT 91 MF 6 MT 102 MF 12/14/15 MT 103 MF 6 MT 107 MF 6 (MT 16/22/28 MF 6)
Ni61 JEF2.2 MT 51-58 MF 12/14 MT 91 MF 6 MT 102 MF 12/14/15 MT 103 MF 6 MT 107 MF 6 (MT 16/22/28 MF 6)
Ni62 JEF2.2 MT 51-54 MF 12/14 MT 91 MF 6 MT 102 MF 12/14/15 MT 103 MF 6 MT 107 MF 6 (MT 16/22/28 MF 6)
Ni64 JEF2.2 MT 51-52 MF 12/14 MT 91 MF 6 MT 102 MF 12/14/15 MT 103 MF 6 MT 107 MF 6 (MT 16/22/28 MF 6)
U235 JEF2.2 MT 3 MF 13/14/15 MT 4 MF 12/14 MT 18 MF 12/14/15 MT 102 MF 12/14/15
U238 JEF2.2 MT 4 MF 13/14/15 MT 51-59 MF 12/14 MT 18 MF 12/14/15 MT 102 MF 12/14/15 (MT 16/17 MF 12/14/15)
Pu239 JENDL-3 MT 18 MF 12/14/15 MT 51-68 MF 12/14 MT 91 MF 12/14/15 MT 102 MF 12/14/15
Pu240 ENDF/B-VI MT 3 MF 13/14/15 MT 4 MF 12/14 MT 18 MF 12/14/15 MT 102 MF 12/14/15
Pu241 ENDF/B-VI MT 3 MF 13/14/15 MT 18 MF 12/14/15 MT 102 MF 12/14/15
Pu242 ENDF/B-VI MT 3 MF 13/14/15 MT 18 MF 12/14/15 MT 102 MF 12/14/15
Am241 ENDF/B-VI MT 3 MF 13/14/15 MT 18 MF 12/14/15 MT 102 MF 12/14/15


193
APPENDIX C: Comparison with VASCO Calculations
In this appendix, gamma-heating calculations using the new ERANOS formulaire (incorporating the currently developed methodology for the detailed determination of gamma and neutron heating) are compared to calculations with the former formulaires CARNAVAL-IV/PROPANE-D2/VASCO-1. Comparison is done in the context of the ZONA2A configuration. The main objectives of this appendix are 1) to put into evidence the differences between the two gamma-heating calculational tools; these are directly related to what has been described in Chapter 3, viz. basic data and calculational algorithms, and 2) to document the first step taken in validating the new ERANOS formulaire (i.e. independent of the experimental validation reported in Chapters 4 and 5) by comparing results for gamma-heating calculations of plutonium breeder configurations for which the VASCO-1 formulaire was validated earlier. In fact, ZONA2A, with its PuO2/UO2 core surrounded by a fertile blanket, can be taken as representative of the existing breeder configuration of SUPER-PHENIX.
C.1 Description of the ZONA2A Configuration
ZONA2A was the first configuration of the CIRANO experimental programme (§ 2.2.2) at the MASURCA facility. Its core, of height ~ 60 cm and diameter ~ 100 cm, was fueled with PuO2/UO2 (Pu-enrichment: ~ 27.0 %, of which 19% Pu240) and also contains sodium. The radial blanket, consisting of UO2/Na (50/50), has a thickness of ~ 30 cm (3 assembly tubes). The axial blanket, of the same composition, has a height of ~ 20 cm. The radial and axial shielding regions consist of stainless steel blocks. The upper and lower shields are ~ 50 cm thick. Figure C-1 shows the two-dimensional, cylindrical (RZ) geometry of the ZONA2A configuration as used for the calculational comparison.
C.2 The ERANOS Calculations
In the ERANOS gamma-heating calculations, 33-group neutron cross-sections were first obtained using the ECCO cell code with JEF2.2 based data libraries. One-dimensional cylindrical, two-region cell models were used to generate cross-sections for the core and the fertile zones. A simple homogenous representation, with fissile isotopes present in trace amounts, was used for the radial and axial shielding regions. Next, a 33-group S4P1 BISTRO calculation was performed to get the 33-group neutron flux distribution. Finally, gamma heating was computed using the calculational scheme presented in § 3.1.

194
Inner core, PuO2UO2/Na, "ZONA2 PIT"
Outer core, PuO2UO2/Na, "ZONA2 POA"
Axial breeder blanket, UO2/Na, "CAX"Radial breeder blanket, UO2/Na, "CRAD"
Radial shielding, PNS steel 100 %, "ECRAD"
Axial shielding, PNL steel 100 %, "ECRAX"
Z [cm]
R [cm]0.00
49.20
69.52
130.48
150.80
200.00
0.0 47.4749.984
80.33 120.8
Figure C-1: RZ model of the MASURCA ZONA2A configuration.
C.3 The CARNAVAL-IV/ PROPANE-D2/VASCO-1 Calculations
In the CARNAVAL-IV/ PROPANE-D2/VASCO-1 gamma-heating calculations, 25-group neutron cross-sections were first computed from the CARNAVAL-IV data base using the HETAIRE cell code. The geometric cell descriptions were the same as in the ERANOS calculations. A 25-group S4P1 BISTRO neutron transport calculation was then performed. For the computation of the neutron propagation out of the blanket, the PROPANE-D2 formulaire was used.
From the 25-group neutron flux, the source of fission neutrons was computed for the 113 neutron groups of the BABEL library. Using this source, an inhomogeneous S16P3 BISTRO calculation was done to get the neutron flux in 113 groups. Next, this flux was used to compute the gamma source in 36 groups using the gamma production matrices of the VASCO formulaire (§ 2.5.3.1).
Bias factors k1 were applied to correct for self-shielding effects, since the latter matrices are given for infinite dilution. This was done for fission in Pu239, and for radiative capture in U238 and iron. For Pu239, the correction factor computed by Calamand for the RACINE

Appendix C 195
programme (Table 2-9) was used. Taking this factor is justified since the composition of the core region in RACINE is basically the same as in CIRANO. For U238 and Fe, k1 factors were computed separately for each homogenized region according to:
k AP I Ie c e c e c1 0
1= ⋅ + −, , , ,( )σ (C-1)
Ie,c gives the fractional contribution of the gamma production by capture with respect to the total gamma production of isotope e. It was obtained by computing the gamma energy emitted in capture and dividing this value by the total gamma energy production of element e. APe c, ,σ0
corrects for the self-shielding of the capture reaction. An average value for the
considered region was computed using:
AP
V
Ve c
i g e c g igi
i g e c g igi
, ,
, , , ,
, , , ,σ
σ
σ
φ σ
φ σ0
0
=
⋅ ⋅
⋅ ⋅
∑∑
∑∑ ∞
(C-2)
where σ σe c g, , , 0
is the self-shielded multi-group cross-section at dilution σ0 and σe,c,g,σ ∞ is
the value at infinite dilution. The index i stands for a mesh of the region and Vi for its volume.
In fact, APe,c,σ0 was first computed at various dilutions. The value to be adopted in (C-2), i.e.
the value at the average dilution σ0,e for the considered region, was then obtained by linear
interpolation between these values, σ0,e being computed according to:
σ
φ σ
φ0
0
,
, , ,
,e
i g e g igi
i g igi
V
V=
⋅ ⋅
⋅
∑∑
∑∑ (C-3)
with σ0,e,g obtained according to the Bondarenko formalism:
σ σ01
, , , ,e ge
j tot g jNN= ⋅
≠∑j e
(C-4)
Correction factors were computed for the core and fertile regions, and the results are summarized in Table C-1.
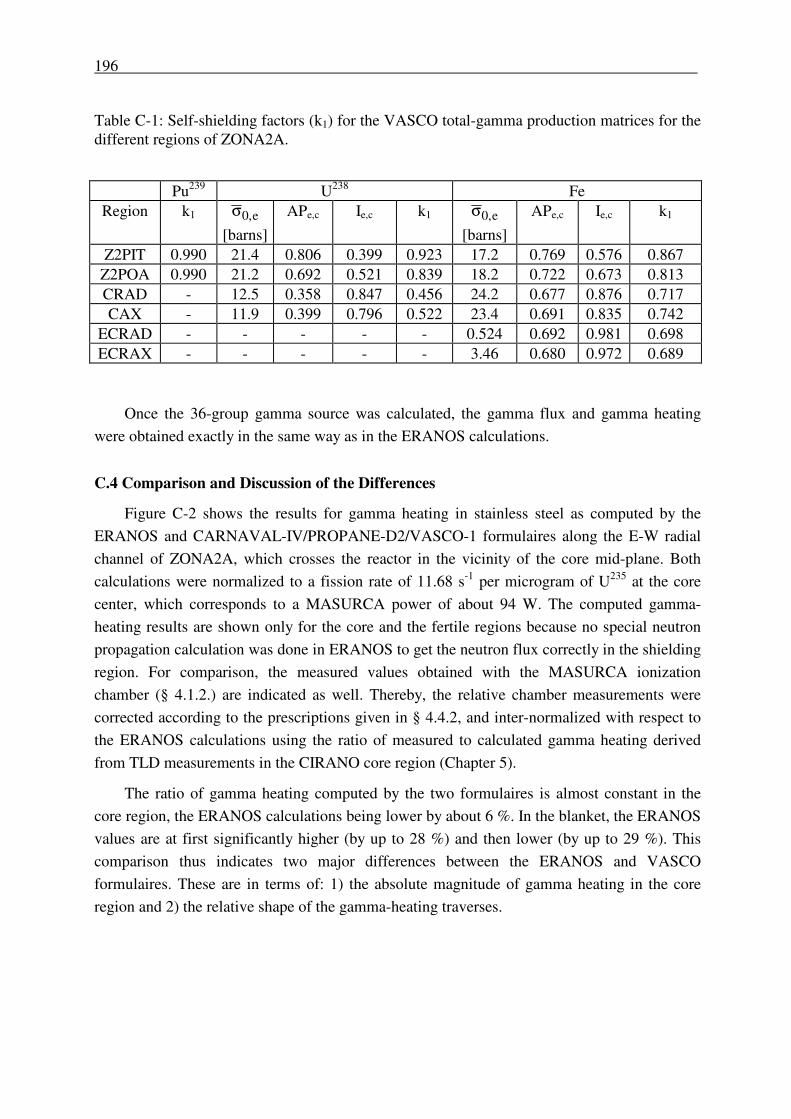
196
Table C-1: Self-shielding factors (k1) for the VASCO total-gamma production matrices for the different regions of ZONA2A.
Pu239 U238 Fe
Region k1 σ0,e
[barns] APe,c Ie,c k1 σ0,e
[barns] APe,c Ie,c k1
Z2PIT 0.990 21.4 0.806 0.399 0.923 17.2 0.769 0.576 0.867 Z2POA 0.990 21.2 0.692 0.521 0.839 18.2 0.722 0.673 0.813 CRAD - 12.5 0.358 0.847 0.456 24.2 0.677 0.876 0.717 CAX - 11.9 0.399 0.796 0.522 23.4 0.691 0.835 0.742
ECRAD - - - - - 0.524 0.692 0.981 0.698 ECRAX - - - - - 3.46 0.680 0.972 0.689
Once the 36-group gamma source was calculated, the gamma flux and gamma heating
were obtained exactly in the same way as in the ERANOS calculations.
C.4 Comparison and Discussion of the Differences
Figure C-2 shows the results for gamma heating in stainless steel as computed by the ERANOS and CARNAVAL-IV/PROPANE-D2/VASCO-1 formulaires along the E-W radial channel of ZONA2A, which crosses the reactor in the vicinity of the core mid-plane. Both calculations were normalized to a fission rate of 11.68 s-1 per microgram of U235 at the core center, which corresponds to a MASURCA power of about 94 W. The computed gamma-heating results are shown only for the core and the fertile regions because no special neutron propagation calculation was done in ERANOS to get the neutron flux correctly in the shielding region. For comparison, the measured values obtained with the MASURCA ionization chamber (§ 4.1.2.) are indicated as well. Thereby, the relative chamber measurements were corrected according to the prescriptions given in § 4.4.2, and inter-normalized with respect to the ERANOS calculations using the ratio of measured to calculated gamma heating derived from TLD measurements in the CIRANO core region (Chapter 5).
The ratio of gamma heating computed by the two formulaires is almost constant in the core region, the ERANOS calculations being lower by about 6 %. In the blanket, the ERANOS values are at first significantly higher (by up to 28 %) and then lower (by up to 29 %). This comparison thus indicates two major differences between the ERANOS and VASCO formulaires. These are in terms of: 1) the absolute magnitude of gamma heating in the core region and 2) the relative shape of the gamma-heating traverses.

Appendix C 197
0
200
400
600
800
1000
1200
1400
-80 -60 -40 -20 0 20 40 60 80
Ionisation ChamberVASCO-1ERANOS
Hea
ting
in s
tain
less
ste
el [r
ad/h
]
Distance [cm] from core center
Core FertileBlanket
FertileBlanket
Figure C-2: Results for computed gamma heating in stainless steel along the E-W radial channel in ZONA2A obtained with the ERANOS and CARNAVAL-IV/PROPANE-D2/VASCO-1 formulaires. Calculations are normalized to a fission rate of 11.68 s-1 per microgram of U235 at the core center. Measured gamma-heating values (ionization chamber) are indicated as well.
The almost constant difference in gamma heating in the core region must be due to differences in the computed gamma source, because gamma transport effects are not important in the major part of the core region. Furthermore, it has been verified that the computed gamma flux spectra in the core compare well, which means that total (summed over all isotopes) emission spectra are similar. Hence, the difference in computed gamma heating from the two formulaires is mainly due to differences in the total gamma energy emitted. In Table C-2, the computed values for gamma energy emission by U235, U238, Pu239, Pu240, Pu241, Am241, Fe, Cr, Ni and Na in the ZONA2A core region are compared. These isotopes contribute more than 99.5 % of the total gamma energy emission. It is seen that the total gamma energy emitted is 8.1 % higher in the VASCO calculations than in ERANOS. A detailed analysis of the difference is not possible as VASCO does not compute the gamma emission separately for each type of reaction. However, fission is the dominant gamma production process and, with computed fission rates from CARNAVAL-IV and ERANOS being in relatively good agreement, it stands to reason that the difference in total gamma emission is mainly due to differences in the gamma energy emitted in fission. Indeed, Table 3-5 shows that there are significant differences in the EGF values adopted in the present work and those of the VASCO formulaire. In general, the former are lower, thus leading to a lower gamma emission in fissile regions with ERANOS. If the gamma energy emitted in the fission of U238, Pu239 and Pu240

198
(which are the most important nuclides for the gamma production) are adjusted to be consistent in both calculations (based on the EGF values given in Table 2-2), the total energy emitted becomes almost equal.
Table C-2: Comparison of the gamma source in the core region of ZONA2A computed using the ERANOS and VASCO formulaires. Results are normalized to a fission rate of 11.68 s-1 per microgram of U235 at the core center and are given in units of W.
Isotope ERANOS VASCO ERANOS/ Capture
Fission Inelastic Total % in
TOTAL Total % in
TOTAL VASCO
U235 5.90E-03 4.64E-02 1.75E-03 5.40E-02 0.728% 6.15E-02 0.761% 0.879 U238 7.19E-01 6.32E-01 5.24E-01 1.88E+00 25.27% 1.73E+00 21.48% 1.081 Pu239 4.68E-01 3.83E+00 5.89E-02 4.36E+00 58.75% 5.20E+00 64.42% 0.838 Pu240 1.04E-01 2.56E-01 2.86E-02 3.88E-01 5.229% 4.31E-01 5.339% 0.900 Pu241 6.75E-03 1.21E-01 3.02E-03 1.31E-01 1.764% 1.17E-01 1.453% 1.116 Pu242 2.79E-03 6.76E-03 1.68E-03 1.12E-02 0.151% - - - Am241 5.73E-02 2.39E-02 1.86E-03 8.30E-02 1.119% 1.82E-01 2.256% 0.456
Fe 5.88E-02 0.00E+00 1.92E-01 2.50E-01 3.375% 1.08E-01 1.339% 2.317 Cr 1.83E-02 0.00E+00 4.86E-02 6.70E-02 0.903% 9.03E-02 1.118% 0.742 Ni 2.32E-02 0.00E+00 2.36E-02 4.68E-02 0.631% 4.63E-02 0.574% 1.011 Na 1.27E-02 0.00E+00 1.21E-01 1.34E-01 1.806% 8.29E-02 1.027% 1.616
TOTAL 1.485 4.917 1.017 7.419 100.00% 8.074 100.00% 0.919
Table C-2 shows moreover that the computed gamma production by neutron interactions in the structural elements Fe and Cr, as well as in Na, differs significantly (by up to a factor of 2.3 for iron). The total emission due to neutron interaction in these isotopes is 52 % higher in ERANOS. It stands to reason that differences are mainly due to differences in computing the inelastic gamma source. In fact, inelastic scattering is the dominant contribution to the gamma production by Fe, Cr and Na in the core region. The impact of the indicated differences is not as important as it seems when looking at the total gamma emission in the ZONA2A core region. Replacing the VASCO gamma production in Fe, Ni, Cr and Na by that computed by ERANOS would increase the total gamma emission by only 2.1 % as the gamma production in these isotopes does not constitute a significant contribution. However, it has to be expected that the gamma emission computed in non-fissile assemblies, especially in cases where there is an important inelastic production1 such as in CAPRA diluents, will differ significantly between ERANOS and VASCO calculations. Clearly, ERANOS calculations are much more
1 In fact, significant differences are also to be expected when the neutron spectrum has become softer and the capture reaction is the dominant process in gamma production. This is because there are known problems in CARNAVAL-IV for computing capture rates in structurals. For example, iron capture cross-sections are underestimated by about a factor of 2.
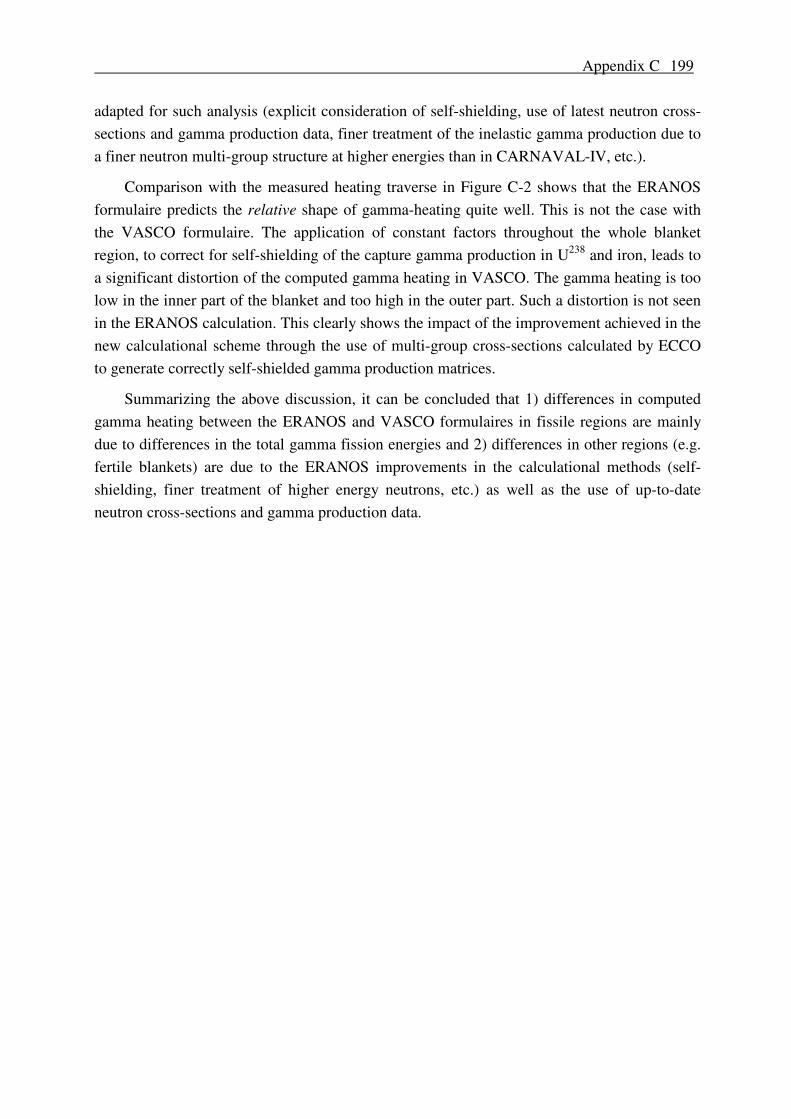
Appendix C 199
adapted for such analysis (explicit consideration of self-shielding, use of latest neutron cross-sections and gamma production data, finer treatment of the inelastic gamma production due to a finer neutron multi-group structure at higher energies than in CARNAVAL-IV, etc.).
Comparison with the measured heating traverse in Figure C-2 shows that the ERANOS formulaire predicts the relative shape of gamma-heating quite well. This is not the case with the VASCO formulaire. The application of constant factors throughout the whole blanket region, to correct for self-shielding of the capture gamma production in U238 and iron, leads to a significant distortion of the computed gamma heating in VASCO. The gamma heating is too low in the inner part of the blanket and too high in the outer part. Such a distortion is not seen in the ERANOS calculation. This clearly shows the impact of the improvement achieved in the new calculational scheme through the use of multi-group cross-sections calculated by ECCO to generate correctly self-shielded gamma production matrices.
Summarizing the above discussion, it can be concluded that 1) differences in computed gamma heating between the ERANOS and VASCO formulaires in fissile regions are mainly due to differences in the total gamma fission energies and 2) differences in other regions (e.g. fertile blankets) are due to the ERANOS improvements in the calculational methods (self-shielding, finer treatment of higher energy neutrons, etc.) as well as the use of up-to-date neutron cross-sections and gamma production data.


201
APPENDIX D: Verification of Burlin Cavity Theory for Core and Reflector
The validity of the Burlin theory was established following a 4-step procedure: Firstly, TLDs were irradiated in MASURCA in various surroundings. Secondly, these measurements were simulated using the Monte-Carlo code MCNP in the photon-electron coupled mode. Thirdly, the capability of the Monte-Carlo simulation to predict the dose in the TLDs for different surroundings was verified through comparison with the measured results. Lastly, the validity of the Burlin theory for calculating the cavity correction factors was established through comparison with the MCNP calculations.
D.1 Measurements
Details regarding the measurements carried out can be found in § 4.3.2.1. Table D-1 lists the results from the 3 irradiation runs with TLDs irradiated in different surroundings. For each position, the average response (computed according to relation (4-25)) of the three TLDs irradiated in the same holder piece is given, the uncertainty indicated corresponding to 1 σ. It is seen that, as compared to irradiations in iron surroundings, TLDs surrounded by Teflon and aluminum show approximately the same response in the core and in the reflector region close to the core. In the outer reflector, their response is lower.
Table D-1: Average responses [rad(iron) Co60 eq.] of TLDs irradiated in different surroundings and comparison of Teflon and aluminium results to the iron case.
Distance Iron Teflon Aluminum Teflon / Iron Aluminum / Iron 28.41 55.00 ± 1.7% 53.42 ± 1.3% 56.79 ± 1.8% 0.971 ± 2.1% 1.032 ± 2.5% 33.93 47.95 ± 1.6% 47.33 ± 3.7% 50.00 ± 1.5% 0.987 ± 4.1% 1.043 ± 2.2% 39.01 43.67 ± 1.1% 44.04 ± 1.2% 43.63 ± 1.0% 1.008 ± 1.6% 0.999 ± 1.5% 44.53 27.93 ± 8.1% 27.86 ± 3.8% 29.03 ± 1.9% 0.998 ± 9.0% 1.039 ± 8.3% 48.34 16.56 ± 5.4% 16.47 ± 2.3% 16.53 ± 7.6% 0.995 ± 5.9% 0.998 ± 9.4% 52.15 11.10 ± 3.7% 10.73 ± 3.0% 10.95 ± 4.0% 0.967 ± 4.8% 0.986 ± 5.4% 56.40 7.866 ± 2.4% 7.690 ± 1.9% 7.831 ± 2.1% 0.978 ± 3.0% 0.996 ± 3.2% 61.48 6.222 ± 2.1% 5.813 ± 2.8% 6.044 ± 3.0% 0.934 ± 3.5% 0.971 ± 3.6% 67.00 5.263 ± 5.1% 4.671 ± 2.7% 4.820 ± 2.3% 0.887 ± 5.8% 0.916 ± 5.6% 72.08 3.798 ± 1.4% 3.392 ± 2.5% 3.474 ± 2.6% 0.893 ± 2.9% 0.915 ± 3.0%

202
D.2 MCNP Modeling
The quantities to be determined in the calculations are the energy deposition by electrons in the TLD material and the gamma heating1 in the TLD region when the cavity is assumed filled with the surrounding material. Thus, the first quantity is directly proportional to the measured TLD response, and the second quantity, in combination with the first, yields the cavity correction factor. With the comparison to measurements being done in a relative sense, only relative results for the different TLD surroundings were in fact needed.
A typical geometrical model set up for the simulation of the measurements is presented in Figure D-1. It shows the TLD holder device inside the experimental access channel crossing a homogeneous surrounding (core or reflector region). The geometry of holder type A, with its three locations to accommodate TLDs is accurately represented.
Apart from the geometry, the distributions in space, angle and energy of the "starting" (emitted) gammas have to be specified. The intensity and the emission spectrum were computed separately for the different MCNP "cells"2 shown in Figure D-1. Gamma emission by neutron interactions in specific isotopes can be determined from the whole-reactor analysis with the calculational scheme developed in Chapter 3. From such results for the different isotopes at the TLD location studied, the total gamma emission spectrum and intensity in each of the MCNP cells were determined by adding the contributions of the different isotopes, correctly weighted by their density in the cell and multiplied by the cell volume. For all cells, isotropic, homogeneous emission was specified.
It has to be kept in mind that coupled photon-electron calculations are very time consuming. To arrive at results with an acceptably low statistical uncertainty (especially when looking at small regions of interest such as the volume occupied by a TLD), simplifications had to be made in the modeling. In particular, the simulations had to be limited to a simplified sub-region (shown in Figure D-1) of the reactor. This is not a problem for electrons due to their small range. However, gammas propagate several tenths of cm from their place of birth (§ 2.3.3). Another simplification made was that the gamma emission does not vary spatially in the different cells (and in particular in the homogeneous region around the channel with the holder device). Errors in computing the initially mentioned quantities of interest arise if the
1 It should be noted that a difference is made between gamma heating and the energy deposited by the secondary electrons. In fact, gamma heating is given through relation (2-2), i.e. obtained by folding the gamma flux with the corresponding gamma KERMA values. It is equal to the energy transferred to secondary electrons. Under charged particle equilibrium conditions (such as usually found in reactor applications, i.e. when considering "large" volumes), the energy transferred to the secondary electrons and the energy deposited by electrons is equal. However, in the present context, where the region of interest (i.e. the TLD volume) is of similar size to the electron range, a difference needs to be made between energy deposition by secondary electrons (i.e. the gamma dose) and gamma heating (i.e. the gamma KERMA).
2 In MCNP, the entire 3-dimensional volume considered is divided into sub-volumes, the so-called "cells".

Appendix D 203
simplifications do not lead to a well computed gamma flux in the TLD volume and in the surrounding region from which secondary electrons can penetrate to the TLDs.
Channel sheath (stainless steel)
Air gap
Outer tube and filling pieces ofTLD holder device (mild steel)
Homogeneous surrounding (core or reflector region)
TLD surrounding (iron, Teflon, aluminium)
TLD
Y
X Y
Z
0.0 10.0 0.0 16.0
16.0 16.0
Figure D-1: Typical MCNP model used for the calculational of cavity correction factors.
The simplifications made should not cause errors in the core region. Here, the emission spectrum is spatially constant. As regards the spatial variation of the emission intensity, this does not effect the quality of the relative results sought in the investigation, so that assuming a constant gamma flux should be adequate. The effect of the simulated sub-region size was checked separately and found not to change the relative results presented below.
The situation is more complicated in the reflector. An important contribution to heating here is made by the fission gammas leaking out of the core (see Figure 3-6). These gamma are not simulated in the model. Also, due to variation of the neutron spectrum from the beginning to the end of the reflector, the gamma emission spectrum varies as discussed in § 2.3.1.4. As a consequence, the model described above is not correct in the inner part of the reflector. However, it should be applicable in the outer part where the gamma flux at the TLD locations is dominated by the gamma source in the reflector. Furthermore, as assumed, the gamma

204
source intensity is quite flat here (see Figure 4-14), and the spatial variation of the emission spectrum (determined mainly by capture events) is not significant.
Calculations were accordingly carried out for one location in the core and for another one towards the end of the reflector i.e. situations for which the model should be quite representative. Clearly, the locations correspond to places were TLD irradiations actually took place. Calculations were performed for TLDs surrounded by iron and Teflon. For each surrounding, two principal simulations were done. In the first calculation, the TLDs were present in the model, and in the second calculation, they were removed and replaced by the surrounding material. All calculations were done in photon-electron coupled mode. Thereby, the electron transport (and generation) was limited to a 2 cm x 2 cm x 2.27 cm region around the TLDs to save computing time. The range of the electrons created outside this region is not sufficient to reach the TLDs.
D.3 Results and Comparison to Measurements
The results of the above described MCNP modeling are shown in Table D-2. Both the gamma heating values (MCNP's F6 Tally which corresponds to the track length estimate of the photon fluence times the photon KERMA, i.e. the energy transferred to secondary electrons), and the energy deposited by electrons (MCNP's *F8 Tally) are given. The indicated values correspond to the average over the three values obtained in the MCNP cells containing (or not) TLDs. The indicated uncertainties correspond to the dispersion (1 σ) on the same three values. All numbers were normalized with respect to the average energy deposition in TLDs when surrounded by iron.
Table D-2: Average gamma heating and electron energy deposition in the TLD cavity surrounded by different materials. Results (relative to average energy deposition in the TLDs surrounded by iron)3 are given in each case for the cavity a) filled with surrounding (wall) material and b) with the dosimeter present.
Without TLDs With TLDs Region TLD
surrounding
Gamma heating [MeV/g]
Electron energy deposition [MeV/g]
Gamma heating [MeV/g(TLD)]
Electron energy deposition
[MeV/g(TLD)] Core Iron 1.01 ± 0.5 % 1.00 ± 2.2 % 0.91 ± 0.3 % 1.00 ± 2.3 %
(33.93 cm) Teflon 0.99 ± 0.4 % 1.01 ± 5.0 % 0.95 ± 0.4 % 0.98 ± 6.4 % Reflector Iron 1.01 ± 0.9 % 1.01 ± 1.6 % 0.76 ± 0.8 % 1.00 ± 3.5 %
(61.48 cm) Teflon 0.81 ± 0.9 % 0.90 ± 1.0 % 0.77 ± 2.4 % 0.87 ± 3.5 %
3 The error on the normalizing point has not been summed into the errors on the other values, but rather retained separately.
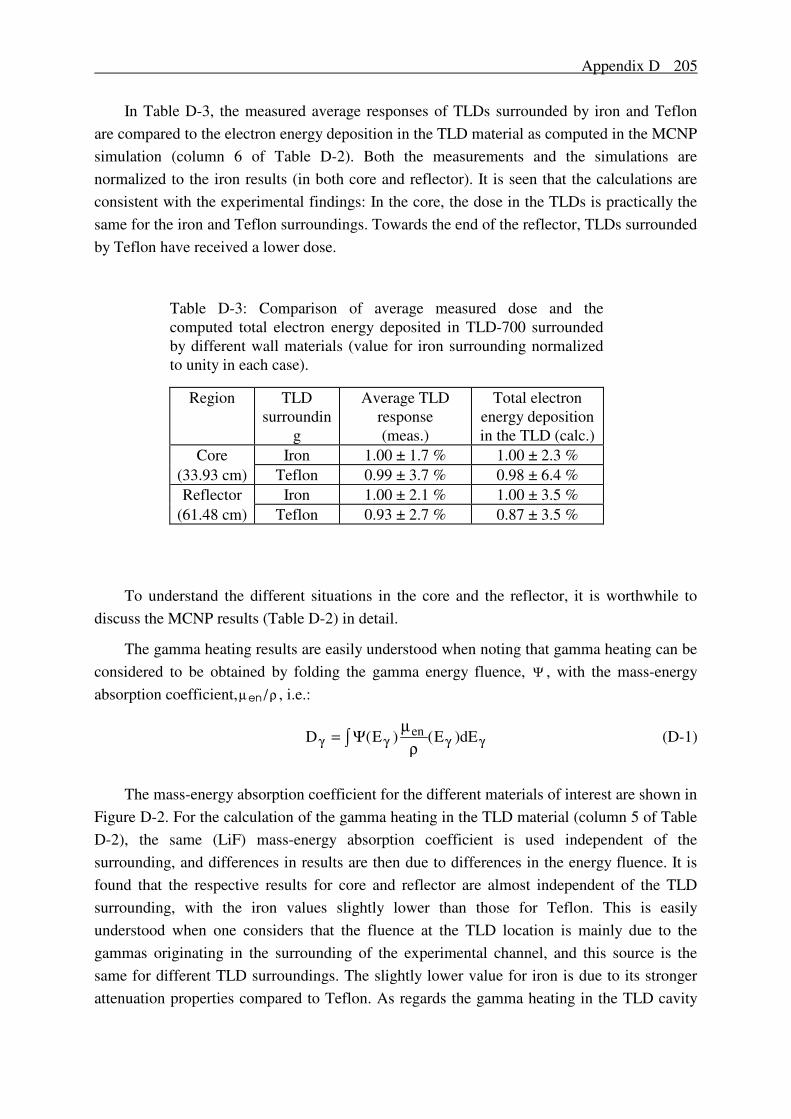
Appendix D 205
In Table D-3, the measured average responses of TLDs surrounded by iron and Teflon are compared to the electron energy deposition in the TLD material as computed in the MCNP simulation (column 6 of Table D-2). Both the measurements and the simulations are normalized to the iron results (in both core and reflector). It is seen that the calculations are consistent with the experimental findings: In the core, the dose in the TLDs is practically the same for the iron and Teflon surroundings. Towards the end of the reflector, TLDs surrounded by Teflon have received a lower dose.
Table D-3: Comparison of average measured dose and the computed total electron energy deposited in TLD-700 surrounded by different wall materials (value for iron surrounding normalized to unity in each case).
Region TLD surroundin
g
Average TLD response (meas.)
Total electron energy deposition in the TLD (calc.)
Core Iron 1.00 ± 1.7 % 1.00 ± 2.3 % (33.93 cm) Teflon 0.99 ± 3.7 % 0.98 ± 6.4 % Reflector Iron 1.00 ± 2.1 % 1.00 ± 3.5 %
(61.48 cm) Teflon 0.93 ± 2.7 % 0.87 ± 3.5 %
To understand the different situations in the core and the reflector, it is worthwhile to discuss the MCNP results (Table D-2) in detail.
The gamma heating results are easily understood when noting that gamma heating can be considered to be obtained by folding the gamma energy fluence, Ψ , with the mass-energy absorption coefficient, µ en/ρ , i.e.:
D E Eenγ γ γ γ
µρ
= ∫ Ψ( ) ( )dE (D-1)
The mass-energy absorption coefficient for the different materials of interest are shown in
Figure D-2. For the calculation of the gamma heating in the TLD material (column 5 of Table D-2), the same (LiF) mass-energy absorption coefficient is used independent of the surrounding, and differences in results are then due to differences in the energy fluence. It is found that the respective results for core and reflector are almost independent of the TLD surrounding, with the iron values slightly lower than those for Teflon. This is easily understood when one considers that the fluence at the TLD location is mainly due to the gammas originating in the surrounding of the experimental channel, and this source is the same for different TLD surroundings. The slightly lower value for iron is due to its stronger attenuation properties compared to Teflon. As regards the gamma heating in the TLD cavity

206
when filled with the wall medium (column 3 of Table D-2), it is seen that the iron value is higher than the Teflon value. This result is a direct consequence of Figure D-2. The stronger flux depression in iron does not compensate for the effect of its higher mass-energy absorption coefficient. The difference between the iron and Teflon results is small in the core region and considerable in the reflector. This is a consequence of the very different gamma spectra in the two regions as shown in Figure D-3. In the core region, most gammas have energies in the range where the mass-energy absorption coefficients for all materials are nearly the same. In the reflector, there are much more low and high energy gammas for which the mass-energy absorption coefficient of the higher-Z material iron is larger than that of Teflon. Finally, Table D-2 (columns 3 and 5) shows that gamma heating in Teflon is about 5 % higher than that in LiF, which is explained by the fact that the mass-energy absorption coefficients of LiF and Teflon are very similar in shape over a wide energy range and differ in magnitude just by about this amount.
0.01
0.1
1
10
100
0.01 0.1 1 10
LiFTeflonIron
Mas
s en
ergy
abs
orpt
ion
coef
fici
ent [
cm2 g-1
]
Energy [MeV]
Figure D-2: Mass-energy absorption coefficients for iron, Teflon and LiF.

Appendix D 207
10-5
0.0001
0.001
0.01
0.1
1
0.01 0.1 1 10
CoreReflector
Nor
mal
ised
gam
ma
flue
nce
[cm-2
]
Energy [MeV]
Figure D-3: Normalized, calculated gamma fluence at the TLD locations in the case of the iron surrounding.
As regards the energy deposition by electrons in the TLDs, it is instructive to separate it into the contributions of 1) electrons created in the TLD itself, 2) electrons created in the TLD surrounding which reach the TLD cavity, and 3) electrons created in the outside of the TLD surrounding which traverse it and reach the TLD cavity. The results are shown in Table D-4. Again, all results are normalized with respect to the total electron energy deposition in iron. To obtain the results, two supplementary calculations for each surrounding and position were performed. In the first calculation, electron transport was set to zero except in the TLD region. This then gives an estimation of contribution by electrons produced in the TLDs. In the second calculation, electron transport was omitted in the region outside the TLD surrounding. In combination with the unmodified calculation, this then yields the contribution of electrons from the outside.
Table D-4 shows that there are important differences between an iron and a Teflon surrounding: The contribution by electrons created in the TLD surrounding is higher for iron. This is due to the greater electron production in this heavier medium. Contribution from the outside is higher for Teflon. In fact, Teflon is much less attenuating than iron so that the electrons from the outside can penetrate through it more easily to reach the TLDs. The contribution by electrons generated in the TLDs themselves is almost the same, with the iron results somewhat lower, which is consistent with the somewhat reduced gamma fluence.

208
Table D-4: Energy deposition in the TLDs by electrons generated in different regions.
Region TLD surrounding
Energy deposition [MeV/g(TLD)] by electrons produced in:
TLDs TLD surrounding
Outside Everywhere
Core Iron 0.37 0.63 0.00 1.00 (33.93 cm) Teflon 0.40 0.45 0.14 0.99 Reflector Iron 0.18 0.74 0.08 1.00
(61.48 cm) Teflon 0.21 0.28 0.38 0.87
Table D-4 further shows that the situation is very different in the core and the reflector. Again, the differences can be explained by the different gamma spectra in the two regions. The harder gamma spectrum in the reflector (Figure D-3) results in a secondary electron distribution with a larger high-energy component, i.e. the electrons are more penetrating. For illustration, the calculated secondary electron spectrum produced at the TLD locations for the iron surrounding is shown for both the core and the reflector in Figure D-4. The effects of the more penetrating electrons are clearly seen in Table D-4. As regards the energy deposition by electrons produced in the TLDs, this contribution is less in the reflector for both iron and Teflon because there is enhanced leakage of electrons out of the TLDs. With iron as TLD surrounding, the contribution of the electrons generated in the TLD surrounding becomes larger in the reflector case because the higher energy electrons can penetrate into the TLDs more easily. With Teflon, the contribution of the electrons from the outside becomes significantly greater since these can cross the (Teflon) surrounding more easily in this case.
As regards the total energy deposition in the TLDs, the different situations in the core and the reflector, as indicated in Table D-4, can be summarized as follows: Clearly, electron production in the immediate TLD surrounding is higher with iron than with Teflon. On the other hand, the contribution of electrons from the outside which can penetrate the surrounding and reach the TLDs is larger for Teflon. The two effects act compensatingly in the core, and the TLD dose is almost the same for the two surroundings. In the reflector region, compensation by the electrons from the outside is not as high, and the total energy deposition is lower for a TLD surrounded by Teflon. Other differences between the two regions arise due to the different gamma spectra. Compared to the case of an iron surrounding, the electron energy deposition in a TLD surrounded by Teflon gets relatively less with increasing energy of the incident gamma. With increasing depth into the reflector, the gamma spectrum gets harder. Thus, when doing experiments at various positions in the reflector, one expects an increasing difference between TLD responses surrounded in iron and Teflon. This trend is clearly seen in the ZONA2B measurements (Table D-1).

Appendix D 209
0.0001
0.001
0.01
0.1
1
0.01 0.1 1 10
CoreReflector
Nor
mal
ised
ele
ctro
n fl
uenc
e [c
m-2]
Energy [MeV]
Figure D-4: Normalized, calculated fluence spectrum of secondary electrons at the TLD locations in the iron surrounding.
The above spectral effect was also verified numerically by recomputing the situation in the reflector, with two separate fictitious assumptions, i.e. while assuming homogenous sources emitting gammas of 0.8 and 8 MeV, respectively. 0.8 MeV corresponds to the mean gamma energy emitted in fission, and thus to the mean source energy in the core, while 8 MeV is representative of the high energy gammas produced through capture in the structurals in the reflector. The energy deposition patterns found were very similar to the those discussed above for core and reflector respectively (Table D-2).
D.4 Verification of Burlin Cavity Theory with MCNP
Summarizing the above discussion, the MCNP photon-electron simulations give reasonable results which are in good agreement with the experimental findings. Hence, the MCNP code can be regarded as a valuable tool for accurately calculating effects such as the cavity correction (assuming the modelisation is done in an appropriate manner) and can thus be used as a valuable check of the Burlin cavity theory. The cavity factor can be derived from the MCNP runs by dividing the energy deposited by electrons in the TLD by the gamma heating in the TLD region when the cavity is assumed filled with the surrounding wall medium. In Table D-5, the cavity factors so derived are compared to the Burlin theory values used to correct the current integral measurements (TLDs surrounded by iron). The indicated
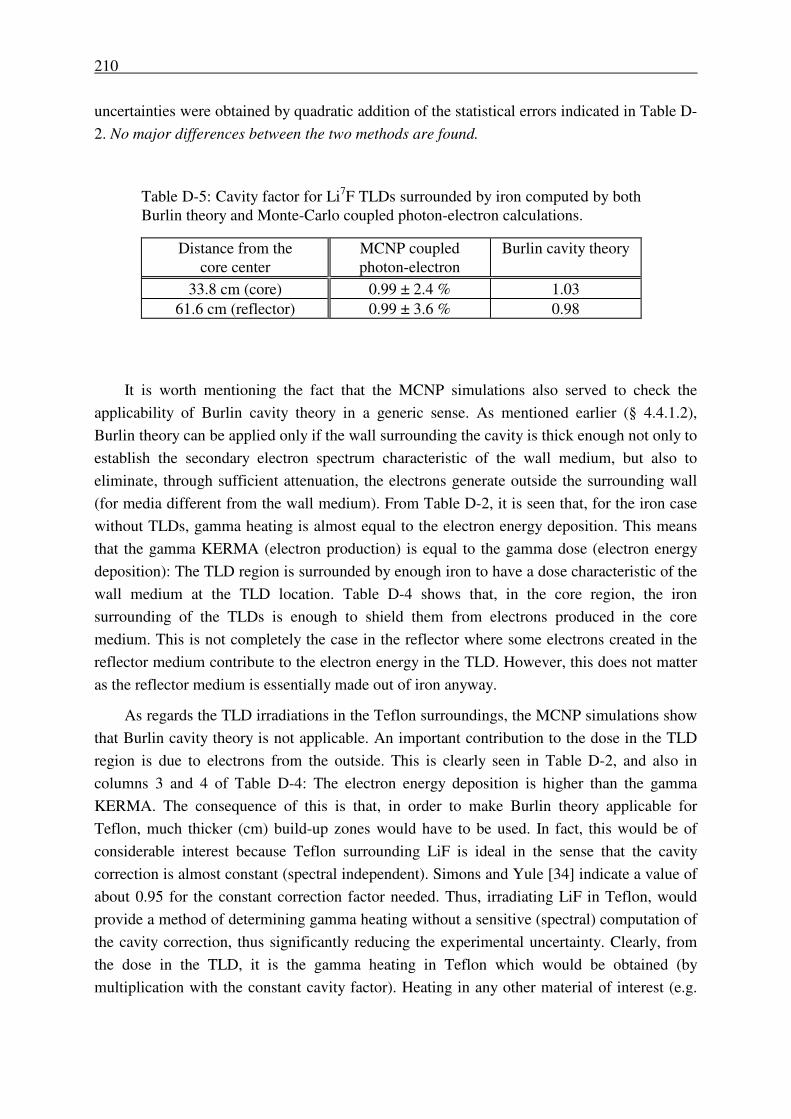
210
uncertainties were obtained by quadratic addition of the statistical errors indicated in Table D-2. No major differences between the two methods are found.
Table D-5: Cavity factor for Li7F TLDs surrounded by iron computed by both Burlin theory and Monte-Carlo coupled photon-electron calculations.
Distance from the core center
MCNP coupled photon-electron
Burlin cavity theory
33.8 cm (core) 0.99 ± 2.4 % 1.03 61.6 cm (reflector) 0.99 ± 3.6 % 0.98
It is worth mentioning the fact that the MCNP simulations also served to check the applicability of Burlin cavity theory in a generic sense. As mentioned earlier (§ 4.4.1.2), Burlin theory can be applied only if the wall surrounding the cavity is thick enough not only to establish the secondary electron spectrum characteristic of the wall medium, but also to eliminate, through sufficient attenuation, the electrons generate outside the surrounding wall (for media different from the wall medium). From Table D-2, it is seen that, for the iron case without TLDs, gamma heating is almost equal to the electron energy deposition. This means that the gamma KERMA (electron production) is equal to the gamma dose (electron energy deposition): The TLD region is surrounded by enough iron to have a dose characteristic of the wall medium at the TLD location. Table D-4 shows that, in the core region, the iron surrounding of the TLDs is enough to shield them from electrons produced in the core medium. This is not completely the case in the reflector where some electrons created in the reflector medium contribute to the electron energy in the TLD. However, this does not matter as the reflector medium is essentially made out of iron anyway.
As regards the TLD irradiations in the Teflon surroundings, the MCNP simulations show that Burlin cavity theory is not applicable. An important contribution to the dose in the TLD region is due to electrons from the outside. This is clearly seen in Table D-2, and also in columns 3 and 4 of Table D-4: The electron energy deposition is higher than the gamma KERMA. The consequence of this is that, in order to make Burlin theory applicable for Teflon, much thicker (cm) build-up zones would have to be used. In fact, this would be of considerable interest because Teflon surrounding LiF is ideal in the sense that the cavity correction is almost constant (spectral independent). Simons and Yule [34] indicate a value of about 0.95 for the constant correction factor needed. Thus, irradiating LiF in Teflon, would provide a method of determining gamma heating without a sensitive (spectral) computation of the cavity correction, thus significantly reducing the experimental uncertainty. Clearly, from the dose in the TLD, it is the gamma heating in Teflon which would be obtained (by multiplication with the constant cavity factor). Heating in any other material of interest (e.g.

Appendix D 211
iron), could then be deduced by computing the flux-weighted ratio of the mass-energy absorption coefficients, i.e.:
D
E E dE
E E dEDiron
en
Iron E
en
Teflon E
Teflonγ
γ γ γ
γ γ γ
γ
µρ
µρ
γ
γ
,,
,
,
( )
( )=
⋅ ⋅
⋅ ⋅
⋅
∫
∫
Φ
Φ (D-2)
This method corresponds to using Teflon as a large cavity. The drawback in a fast reactor situation is obviously that a thick Teflon surrounding is needed, which would not only be difficult to introduce into the reactor, but which would also significantly perturb the gamma and neutron spectra at the measurement location.


213
APPENDIX E: Analysis of ZONA5K Central Substitution Zone Measurements
As pointed out in Chapters 5 and 6, there is great interest in experimental studies of gamma heating in cores of various fuel compositions. In the context of the present work, the determination of gamma heating in a zone having a Pu-enrichment characteristic of Pu-burning cores was of considerable importance. Indeed, this would not only improve the testing of the newly developed calculational tool with respect to gamma heating in the core region, but do so also for the numerous diluent zones for which about 80 % of heating is due to gammas generated in the core. The ZONA5K measurements (§ 4.3.1) were intended to yield such results, with the central substitution zone (Figure 4-10) having a Pu-enrichment of 44 % and hence being characteristic of the CAPRA reference core composition. Due to a manipulation error, however, all except two measurement points in this higher enriched zone were lost. Nevertheless, in the present appendix, an attempt is made to draw some conclusions from an analysis of these two measurement points.
For the main part, correction of the raw experimental results can be done as described in detail in § 4.4. An exception is the heterogeneity correction. For the measurements in the radial channel crossing the Z2PIT CIRANO core region, the heterogeneity of the tube loading could be neglected (§ 4.4.1.3). This is not possible for measurements in the ZONA5K substitution zone. Here, the tube is loaded with plates (instead of rodlets) of various compositions and hence shows a strong heterogeneity.
The principle for determining the heterogeneity correction for the ZONA5K region was the same as the one used in § 4.4.1.3. Gamma heating in iron is determined in a model representing the real, heterogeneous situation. This value is then compared to gamma heating in iron as determined in a similar model, but with all regions filled with the homogenous compositions used in the whole-reactor calculations. The two-dimensional XZ model used to represent the strongly heterogeneous ZONA5K environment is shown in Figure E-1. It models a vertical cut through two MASURCA tubes, perpendicular to the radial channel with the TLD holder device (explicitly modeled) crossing one of them. Along the Z direction, the different plates (1 Pumet, 2 PuO2/UO2, 1 Fe2O3, 4 Na and 2 empty plates) making up one basic reactor cell are represented. The actual calculations were done using deterministic methods, i.e. the neutron flux was computed with the BISTRO SN transport code, and then the gamma heating in iron was computed using the calculational scheme currently developed. In fact, the neutron flux determined for the homogeneous geometry was used to create the gamma source for both the heterogeneous and homogeneous representations, thus avoiding any inter-normalization problems. It was verified separately that the cell heterogeneity only leads to very small (< 1%) fluctuations in the neutron flux.
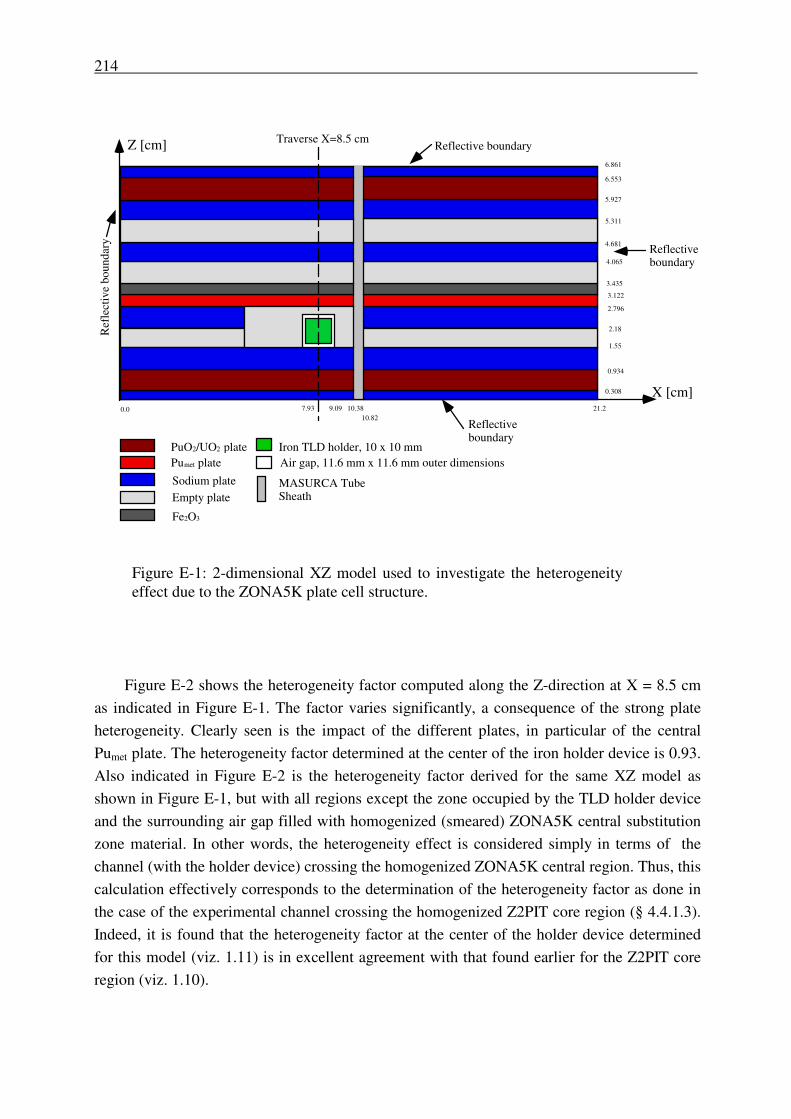
214
PuO2/UO2 platePumet plate
Sodium plateEmpty plate
Fe2O3
Iron TLD holder, 10 x 10 mmAir gap, 11.6 mm x 11.6 mm outer dimensions
MASURCA TubeSheath
0.308
0.934
1.55
2.18
2.796
3.122
3.435
4.065
4.681
5.311
5.927
6.553
6.861
0.0 7.93 9.09 10.3810.82
21.2
Z [cm]
X [cm]
Reflectiveboundary
Reflectiveboundary
Reflective boundary
Ref
lect
ive
boun
dary
Traverse X=8.5 cm
Figure E-1: 2-dimensional XZ model used to investigate the heterogeneity effect due to the ZONA5K plate cell structure.
Figure E-2 shows the heterogeneity factor computed along the Z-direction at X = 8.5 cm as indicated in Figure E-1. The factor varies significantly, a consequence of the strong plate heterogeneity. Clearly seen is the impact of the different plates, in particular of the central Pumet plate. The heterogeneity factor determined at the center of the iron holder device is 0.93. Also indicated in Figure E-2 is the heterogeneity factor derived for the same XZ model as shown in Figure E-1, but with all regions except the zone occupied by the TLD holder device and the surrounding air gap filled with homogenized (smeared) ZONA5K central substitution zone material. In other words, the heterogeneity effect is considered simply in terms of the channel (with the holder device) crossing the homogenized ZONA5K central region. Thus, this calculation effectively corresponds to the determination of the heterogeneity factor as done in the case of the experimental channel crossing the homogenized Z2PIT core region (§ 4.4.1.3). Indeed, it is found that the heterogeneity factor at the center of the holder device determined for this model (viz. 1.11) is in excellent agreement with that found earlier for the Z2PIT core region (viz. 1.10).
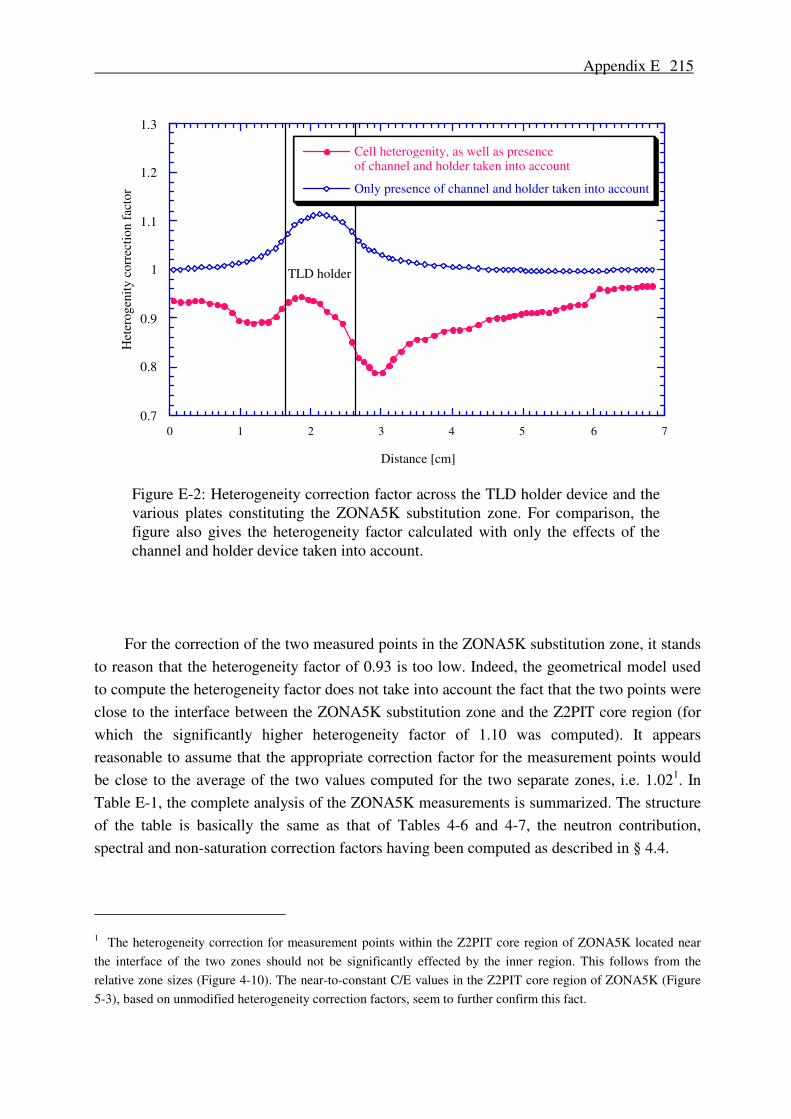
Appendix E 215
0.7
0.8
0.9
1
1.1
1.2
1.3
0 1 2 3 4 5 6 7
Cell heterogenity, as well as presenceof channel and holder taken into account
Only presence of channel and holder taken into account
Het
erog
enity
cor
rect
ion
fact
or
Distance [cm]
TLD holder
Figure E-2: Heterogeneity correction factor across the TLD holder device and the various plates constituting the ZONA5K substitution zone. For comparison, the figure also gives the heterogeneity factor calculated with only the effects of the channel and holder device taken into account.
For the correction of the two measured points in the ZONA5K substitution zone, it stands to reason that the heterogeneity factor of 0.93 is too low. Indeed, the geometrical model used to compute the heterogeneity factor does not take into account the fact that the two points were close to the interface between the ZONA5K substitution zone and the Z2PIT core region (for which the significantly higher heterogeneity factor of 1.10 was computed). It appears reasonable to assume that the appropriate correction factor for the measurement points would be close to the average of the two values computed for the two separate zones, i.e. 1.021. In Table E-1, the complete analysis of the ZONA5K measurements is summarized. The structure of the table is basically the same as that of Tables 4-6 and 4-7, the neutron contribution, spectral and non-saturation correction factors having been computed as described in § 4.4.
1 The heterogeneity correction for measurement points within the Z2PIT core region of ZONA5K located near the interface of the two zones should not be significantly effected by the inner region. This follows from the relative zone sizes (Figure 4-10). The near-to-constant C/E values in the Z2PIT core region of ZONA5K (Figure 5-3), based on unmodified heterogeneity correction factors, seem to further confirm this fact.

216
Table E-1: Correction of gamma-heating measurements in the ZONA5K substitution zone and comparison to calculations.
Distance from core
center
Uncorrected measured gamma heating
Neutron contri- bution
Spectral correction
Hetero- geneity
correction
Non- saturation correction
Corrected measured gamma heating
Calculated gamma heating
C/E
[cm] [rad(iron) Co60 eq.]
[rad (iron)
Co60eq.]
[rad(iron)] [rad(iron)]
13.05 83.74±2.5% 9.799 0.991 1.02 1.086 80.21 71.32 0.89 15.59 75.85±2.7% 9.527 0.987 1.02 1.083 71.47 65.16 0.91
Also indicated in Table E-1 is the comparison to calculated values, which yields a C/E of 0.90 for the ZONA5K substitution zone. This value is consistent with the findings in the Z2PIT CIRANO core zone. Hence, the suggestion made in Chapter 5 that the underestimation of gamma-heating in the core region by about 10 % should not depend in a significant manner on the Pu-enrichment seems to be supported. The correction factors given in Table 5-3, which are to be applied to the calculational results for gamma-heating in SUPER-PHENIX (with its fertile blanket replaced by a reflector) and the CAPRA 4/94 reference design, can thus be used without major reservations.
A 3-dimensional calculational approach to assess more precisely the heterogeneity factor near the interface of the ZONA5K substitution zone and the reference CIRANO core region would be worthwhile, in order to strengthen the current analysis of the two measurement points. Indeed, the above calculations show that the heterogeneity correction changes dramatically between these two regions due to the drastically different arrangements of fuel, structurals and coolant. (Clearly, a general conclusion to be drawn in this context is that the heterogeneity correction needs to be given due consideration and can depend strongly on the experimental geometry).
In any case, as recommended in Chapters 5 and 6, a range of measurements in core regions with different fuel compositions would be desirable in order to confirm the above findings regarding Pu-enrichment effects.

217
ACKNOWLEDGMENTS
The present doctoral research was conducted in the framework of the collaboration
between PSI/EPFL and CEN Cadarache, and was financed jointly by PSI and CER
(Communauté Electricité Romande).
First of all, I would like to thank Prof. R.Chawla, head of reactor physics research at
PSI/EPFL, for giving me the chance to explore the marvelous world of fast reactor physics and
his continuous support throughout the work, and Dr. G.Rimpault of CEN Cadarache for his
total confidence, guidance and continuous encouragement.
Many other people have contributed in one way or the other to the realization of this
thesis. My sincere thanks are due to:
- Dr. P.F.Finck and Dr. R.Jacqmin, heads of LEPh/CEN Cadarache, for their hospitality
during my work at the CEA.
- Dr. J.P.Chauvin, head of LEPx/CEN Cadarache, for giving me the opportunity to carry out
the gamma-heating measurements at the MASURCA facility.
- Dr. M.Martini of ENEA (Italy), on attachment to LEPx/CEN Cadarache, for his support and
the time he took to answer all of my questions.
- Dr. E.Fort and Dr. F.Storrer of LEPh/CEN Cadarache for their advice on basic nuclear data
evaluation and processing.
- The experimental staff at the MASURCA facility, in particular P.Chaussonnet, P.Bertrand,
J.Pierre, C.Domergue and H.Philibert, for helping to perform the measurements, and
J.C.Watripont for fabrication of the TLD holder device.
- Dr. S.Pelloni of PSI for advice and help in generating the KERMA and spectra libraries, as
well as for his continuous interest in my work.
- Dr. O.P.Joneja of PSI/EPFL for his advice on the design of the experiments, his help in the
interpretation of MCNP calculations and, most of all, his positive attitude.
- All the members of LEPh/CEN Cadarache for their hospitality and the many fruitful
discussions.
- All the members of LPR/EPFL for making the LPR what it is.
- J.C.Bosq for his great company and for answering all my questions in the most qualified
way I can imagine.

218
- Prof. B.Devaud-Plédran, Prof. R.Chawla, Dr. R.Brogli, Dr. M.Martini, Dr. G.Rimpault and
Prof. M.Q.Tran for accepting to form the jury.
I would also like to extend thanks to Mr. R. Früh of LPR/EPFL for answering with
competence my many questions on reactor engineering and operations. Finally, my special
thanks go to my family and my friends (especially those I had the chance to meet during my
stay at CEN Cadarache), without whose support this work would not have been achieved.
Anton Lüthi
CURRICULUM VITAE
The author of this doctoral thesis was born on March 18th 1969 at Langenthal,
Switzerland. After having completed his basic education, he joined the Swiss Federal Institute
of Technology at Lausanne (EPFL) in 1989 to study physics. During his third year of studies,
he stayed at Iowa State University, USA. In March 1994, he got his diploma as "Ingénieur-
physicien EPFL", having carried out his project work on heat deposition measurements at the
LOTUS fusion neutronics facility at EPFL. After this, he joined the Laboratory for Reactor
Physics at EPFL as teaching/research assistant and was attached simultaneously to the
Laboratory for Reactor Physics and Systems Engineering at the Paul Scherrer Institute (PSI),
Switzerland. Following an initiating phase, he started his PhD work on gamma-heating
calculations and measurements in advanced fast reactors in the framework of an international
collaboration between PSI and Centre d'Etudes Nucléaires (CEN) at Cadarache, France.
During his PhD work, the author was assigned to CEN Cadarache from March - October
during three years (1995-97) to perform gamma-heating measurements at the MASURCA
facility and to set up a new calculational methodology as part of the unified European code
system for fast reactor calculations, ERANOS. After finishing his PhD, the author plans to
continue reactor physics research at the LWR-PROTEUS facility, PSI, working in the field of
reactivity worth measurements and analysis.