development of a hydroacoustic survey design to quantify prey fish
TRANSCRIPT

1
Minnesota Department of Natural Resources Investigational Report 530, 2006
DEVELOPMENT OF A HYDROACOUSTIC SURVEY DESIGN TO QUANTIFY PREY FISH ABUNDANCE IN THE MINNESOTA WATERS OF LAKE SUPERIOR
Tom Hrabik1, Don Schreiner2 Matt Balge1 and Steve Geving2 1 Department of Biology
University of Minnesota, Duluth Campus 211 Life Science
10 University Drive Duluth, MN 55812
2Lake Superior Area Fisheries
Minnesota Department of Natural Resources 5153 North Shore Drive
Duluth MN 55804
Abstract.--We designed and implemented a hydroacoustic and mid-water trawl as-sessment program in Minnesota waters of Lake Superior during 2003 and 2004 to estimate the density, biomass and composition of pelagic prey fish. Hydroacoustic data were collected in August and October 2003, and August and early September 2004. Hydroacoustic data col-lection in October 2003 and August and September 2004 occurred in conjunction with mid-water trawl sampling to identify species composition. Approximately 225 km of transects were sampled in 2003, and 300 km were sampled in 2004. Small coregonids (<150mm) comprised 80% of the trawl catch by number in 2003 and larger (>150mm) coregonids com-prised 54% of the trawl catch in 2004. Spawning-size lake herring (>305mm) represented 7% and 17% of the trawl catch by numbers in 2003 and 2004, respectively. The density, bio-mass and composition of prey fishes were estimated for areas with bottom depths <80m and >80m for each of the three Minnesota management units for both years. Fish density esti-mates in 2003 ranged from 80 fish per hectare in MN1 waters >80m, to 447 fish per hectare in waters <80m of MN1. In 2004, fish density ranged from 93 fish per hectare in MN2 waters >80m to 234 fish per hectare in MN3 waters >80m. Estimates of total fish biomass in 2003 were 375 metric tons in MN1, 1066 metric tons in MN2, and 1821 metric tons in MN3. In 2004, the estimated total fish biomass was 1391 metric tons for MN1, 1004 metric tons for MN2, and 8220 metric tons for MN3. For all Minnesota management units combined, spawn-ing-size lake herring dominated total fish biomass in both 2003, (86%, 2800 metric tons, 4.3 kg/ha) and 2004 (68%, 7240 metric tons, 11.0 kg/ha). Lake herring <300mm and all other coregonids represented 12% (407 metric tons) of the total biomass in 2003, and 29% (3041 metric tons) in 2004. The remaining biomass for both years was comprised mainly of rain-bow smelt and siscowet.
2
Introduction
Within the last century, the Lake Su-perior food web has changed as a result of over fishing, the introduction of exotics, and habitat degradation. The control of sea lam-prey, decreases in commercial fishing and the stocking of lake trout in the 1950s initiated restoration efforts on the Great Lakes (Hansen et al. 1995). These management policies fa-cilitated the recovery of naturally reproducing populations and have led to a substantial in-crease in the abundance of wild lean lake trout (Salvelinus namaycush namaycush), which are now thought to comprise over 90% of the lake trout population (Bronte et al. 2003). The “lean” lake trout, which generally inhabits areas of the lake <80 m in depth and the “sis-cowet” lake trout (Salvelinus namaycush sis-cowet), which inhabits deeper areas, are increasing in abundance and placing a greater demands on prey fish resources (Negus 1995; Harvey et al. 2003). The increased demand on forage fish has initiated the need to compre-hensively estimate the amount of forage fish available in the lake (Schreiner 1995). One facet of this effort is the collaboration be-tween the Minnesota Department of Natural Resources (MNDNR) and the University of Minnesota Duluth (UMD) focused on estimat-ing the biomass of pelagic fishes within the Minnesota waters of Lake Superior.
The objective of this project was to develop an acoustic program to quantify the abundance of pelagic prey fishes that are im-portant to predatory lake trout and pacific salmon (rainbow smelt and various species of coregonines) in Minnesota waters of Lake Su-perior. That goal was to be achieved in a se-ries of steps. The first step was to identify the appropriate resolution for analyses of fish den-sity and assess the amount of sampling effort needed to estimate biomass for spatial units. Secondly, to determine the cost of implement-ing a design that incorporates the identified sample density. Third, and most importantly, was to implement a sampling scheme that es-timated the density, total abundance and bio-mass of prey fish populations in Minnesota waters of Lake Superior. We provide esti-mates of transect distance:survey area, which is needed to estimate fish density and biomass
for prey fish for each of the three Minnesota management units. These findings are derived from sampling conducted in August and Octo-ber of 2003, and were applied to the survey design in 2004.
Materials and Methods Survey Design
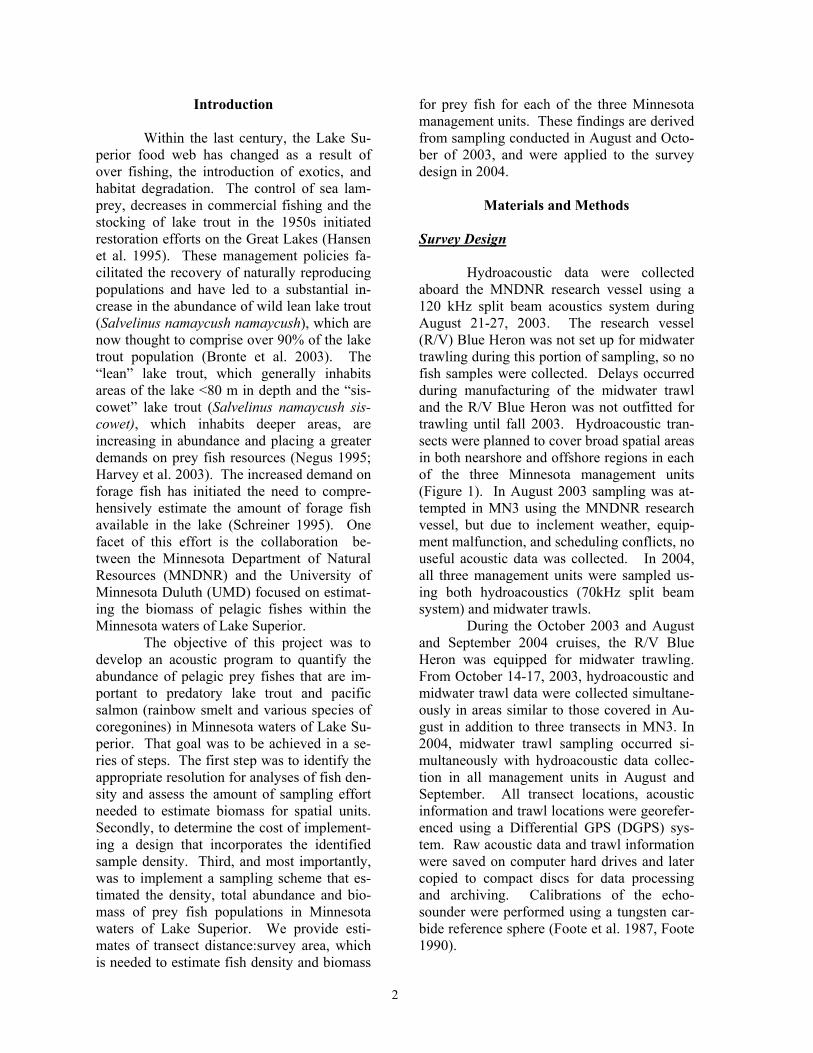
Hydroacoustic data were collected aboard the MNDNR research vessel using a 120 kHz split beam acoustics system during August 21-27, 2003. The research vessel (R/V) Blue Heron was not set up for midwater trawling during this portion of sampling, so no fish samples were collected. Delays occurred during manufacturing of the midwater trawl and the R/V Blue Heron was not outfitted for trawling until fall 2003. Hydroacoustic tran-sects were planned to cover broad spatial areas in both nearshore and offshore regions in each of the three Minnesota management units (Figure 1). In August 2003 sampling was at-tempted in MN3 using the MNDNR research vessel, but due to inclement weather, equip-ment malfunction, and scheduling conflicts, no useful acoustic data was collected. In 2004, all three management units were sampled us-ing both hydroacoustics (70kHz split beam system) and midwater trawls.
During the October 2003 and August and September 2004 cruises, the R/V Blue Heron was equipped for midwater trawling. From October 14-17, 2003, hydroacoustic and midwater trawl data were collected simultane-ously in areas similar to those covered in Au-gust in addition to three transects in MN3. In 2004, midwater trawl sampling occurred si-multaneously with hydroacoustic data collec-tion in all management units in August and September. All transect locations, acoustic information and trawl locations were georefer-enced using a Differential GPS (DGPS) sys-tem. Raw acoustic data and trawl information were saved on computer hard drives and later copied to compact discs for data processing and archiving. Calibrations of the echo-sounder were performed using a tungsten car-bide reference sphere (Foote et al. 1987, Foote 1990).
3
Figure 1. Locations of hydroacoustic data collection (lines) and midwater trawl sampling
(circles) in a) August and October 2003 and b) August and September 2004.
The midwater trawls were aimed at depths of fish aggregations observed from the acoustic system, and fish data from those tows were used for species identification and to re-fine target strength relationships by incorpo-rating additional species length data. Using the hydroacoustic information along with the species composition from the trawls, estimates of density and biomass for lake herring, rain-bow smelt, and deepwater ciscoes were calcu-lated.
Trawl Species Identification Individual fish collected from midwa-ter trawls in 2003 and 2004 were identified to species, and total length was recorded for comparison to hydroacoustic target strength measurements. Coregonids were identified using the taxonomic key in Becker (1983).
MN1
MN2
MN3
a
b
MN1
MN2
MN3
4
Data Analysis Acoustic data was collected using Biosonics Visual Acquisition software, and data was analyzed using Echoview analysis software (v. 3.25.55, Sonardata Pty. Ltd 1995-2004). Data from each transect were proc-essed identically, using the following proce-dures. Data Quality Prior to analysis, it was necessary to manually edit each echogram to ensure that only true fish echoes were included in analy-sis. Each echogram was examined for acoustic “noise” not likely attributable to fish backscat-ter (e.g. ship depth sounder/electrical interfer-ence, surface wave disturbance), and such regions were excluded from analysis to re-move potential for biased density estimates. Additionally, the Echoview bottom detection function was used to exclude sound returned from the lake floor from echo integration. Echo Integration
Echo integration was used to calcu-late the total amount of sound backscattered
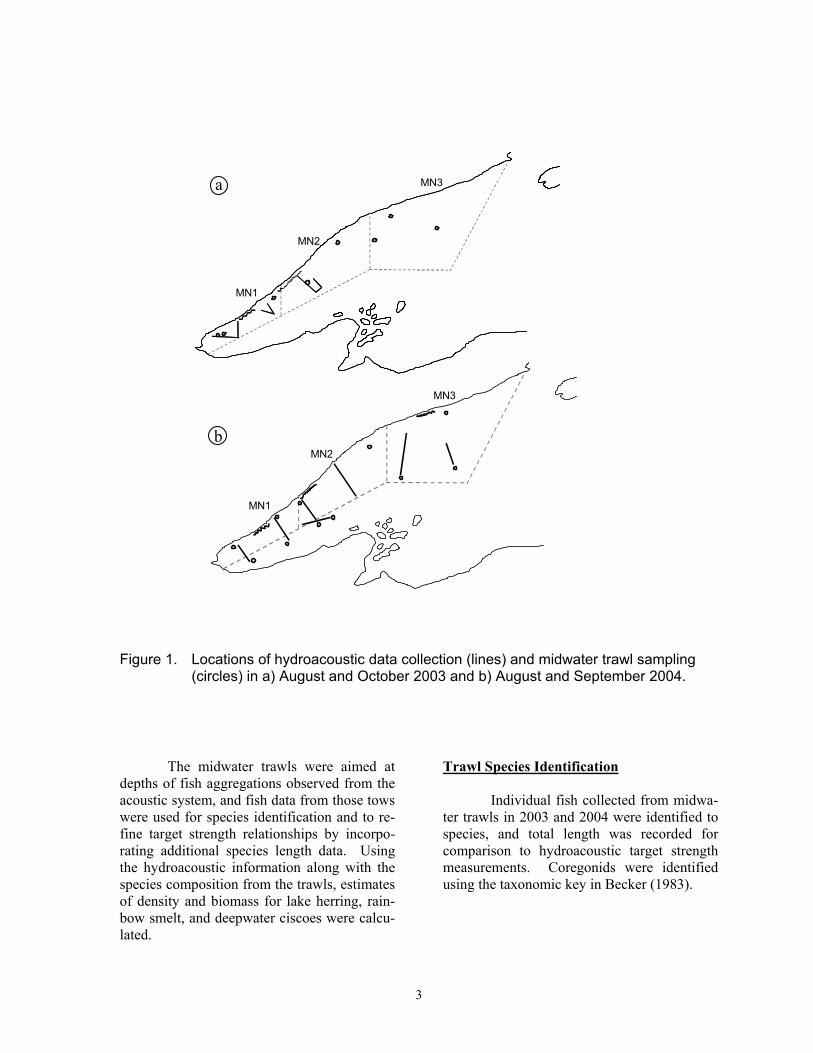
within an echogram. For all data, echo inte-gration was performed for the entire length and depth of each transect and the minimum raw echo-strength threshold was –65dB. These analyses provided the Nautical Area Scattering Coefficient (NASC - a measure of the average amount of sound reflected by fish per aerial square nautical mile) for each transect. Single Target Detection Scaling NASC using the expected size of an acoustic fish is necessary to calculate fish density. The single target detection algo-rithm of Echoview uses a suite of parameters to define raw echoes as likely fish-targets. The settings used for single target detection along all transects are shown in Figure 2. Echo strength for each target identified is then corrected for sound attenuation due to depth and angle off axis, providing a true measure of the sound reflected. From this, the average target strength (TSmean) for each transect was calculated. All “noise” regions identified in quality control of raw echo echograms (de-scribed above) were also excluded from single target analysis.
Figure 2. Echoview single target detection parameter settings used for all hydroacoustic
data collected in Minnesota waters in August and October 2003 and 2004.
5
Fish Density Calculations Results from echo integration and sin-gle target detection were used to calculate fish density for each transect using: Density (fish/ha) = NASC 4 π*10 (TSmean/10)*342.9904 where NASC is the nautical area scattering coefficient (m2*n.mi-2), 4 π *10 (TSmean/10) is the average backscattering cross-section of an acoustic target (m2), and 342.9904 is the num-ber of hectares per square nautical mile. For Minnesota waters, fish density was calculated for two bottom depth zones (<80 m and >80 m) within each pre-established management unit (MN1, MN2 and MN3). All acoustic transects within a management unit or depth zone of interest were used to determine aver-age fish density (fish/ha) for that area. The resulting density estimate (fish/ha) for each area was then multiplied by the number of hectares in that area to determine the total number of fish in that region. For both years, trawl data proportions were used to proportion the total number of acoustic fish into species-specific number and biomass estimates. All fish captured in trawls were used for species-specific proportioning of acoustic densities. Sample Density and Variability
We assessed the importance of sample size on estimates of fish density from data col-lected in MN1, which contained the highest ratio of transect km:total survey area. To do so, we divided survey transects into smaller segments that would allow randomization tests to be performed. The first step in these analy-ses was to identify the most appropriate length of segments to use in the remainder of the analyses. The fish density calculation requires estimation of mean target strength (mean acoustic size or sigma) within a segment. We examined variability in mean target strength as it related to segment size by analyzing tran-sects divided into segments of varying length. Segments 400 m in length were considered the finest resolution possible because shorter seg-ments contained too few single targets to ob-tain reasonable estimates of mean target
strength. Often, segments smaller than 400 m contained less than 10 single fish echoes (in some cases none) and provided highly variable estimates of mean backscatter (mean acoustic fish size). We then used autocorrelation func-tions (S-plus, v. 6.2, Insightful inc.) to exam-ine spatial correlation between segments ranging in size from 400 m to 1200 m. When the appropriate spatial resolution was identi-fied, we then selected 250 random combina-tions of 5, 10, 15, 20, 25 and 30 segments, respectively. We then estimated mean fish density and 95% confidence intervals for each sample density and examined the associated relationships. Biomass of fish species When possible, fish collected in mid-water trawls were individually weighed for use in biomass estimation. If individual weights were not taken, species-specific length-weight relationships from other regions of Lake Superior were used. Biomass of fish along each transect was determined using the species proportions and average weight of fish caught in trawl samples collected simultane-ously with hydroacoustic data. For each tran-sect, fish species proportions were multiplied by the total number of acoustic fish to deter-mine the total number of each species. The total number of each species was then multi-plied by the average weight of an individual of that species to calculate biomass. Fish Density and Biomass Error Estimation Each transect was divided into 800 m segments, and each segment was used to esti-mate density along the transect. Autocorrela-tion analysis was used to ensure adjacent segments along transects could be considered independent samples. If a transect did not meet this criteria, it was reanalyzed at de-creased resolution until autocorrelation analy-sis showed independence between segments.
1
6
All independent acoustic density esti-
mates from within an area of interest were used to calculate the 95% confidence interval about that density estimate. Error about bio-mass estimates was then found using:
CIproportiondensity
CI%95
%95= 2
± proportion (95%CI)*biomass=biomass95%CI 3
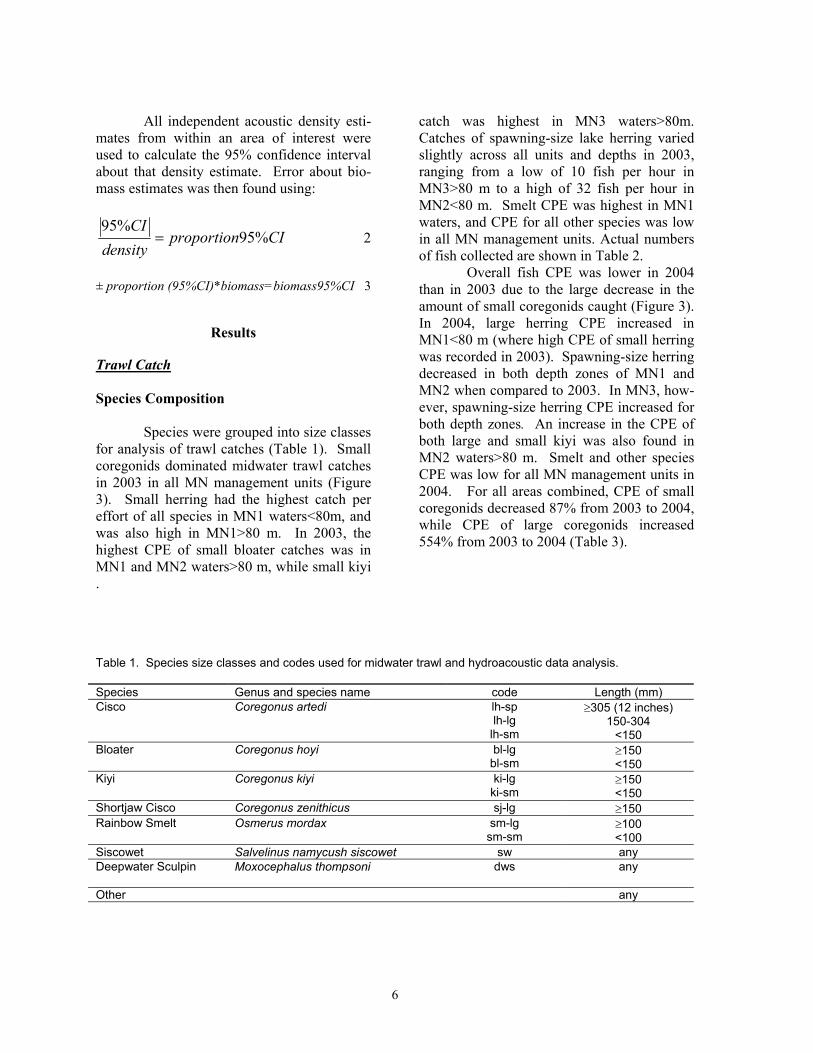
Results Trawl Catch Species Composition Species were grouped into size classes for analysis of trawl catches (Table 1). Small coregonids dominated midwater trawl catches in 2003 in all MN management units (Figure 3). Small herring had the highest catch per effort of all species in MN1 waters<80m, and was also high in MN1>80 m. In 2003, the highest CPE of small bloater catches was in MN1 and MN2 waters>80 m, while small kiyi
catch was highest in MN3 waters>80m. Catches of spawning-size lake herring varied slightly across all units and depths in 2003, ranging from a low of 10 fish per hour in MN3>80 m to a high of 32 fish per hour in MN2<80 m. Smelt CPE was highest in MN1 waters, and CPE for all other species was low in all MN management units. Actual numbers of fish collected are shown in Table 2. Overall fish CPE was lower in 2004 than in 2003 due to the large decrease in the amount of small coregonids caught (Figure 3). In 2004, large herring CPE increased in MN1<80 m (where high CPE of small herring was recorded in 2003). Spawning-size herring decreased in both depth zones of MN1 and MN2 when compared to 2003. In MN3, how-ever, spawning-size herring CPE increased for both depth zones. An increase in the CPE of both large and small kiyi was also found in MN2 waters>80 m. Smelt and other species CPE was low for all MN management units in 2004. For all areas combined, CPE of small coregonids decreased 87% from 2003 to 2004, while CPE of large coregonids increased 554% from 2003 to 2004 (Table 3).
. Table 1. Species size classes and codes used for midwater trawl and hydroacoustic data analysis. Species Genus and species name code Length (mm) Cisco Coregonus artedi lh-sp
lh-lg lh-sm
≥305 (12 inches) 150-304
<150 Bloater Coregonus hoyi bl-lg
bl-sm ≥150 <150
Kiyi Coregonus kiyi ki-lg ki-sm
≥150 <150
Shortjaw Cisco Coregonus zenithicus sj-lg ≥150 Rainbow Smelt Osmerus mordax sm-lg
sm-sm ≥100 <100
Siscowet Salvelinus namycush siscowet sw any Deepwater Sculpin Moxocephalus thompsoni dws any
Other any
7
MN1<80m
0
50
100
150
200
250lh
-sp
lh-lg
lh-s
m
bl-lg
bl-s
m
ki-lg
ki-s
m
sj-lg
sm-lg
sm-s
m
dws
sw
othe
r
Num
ber C
augh
t per
Hou
r
20032004
MN1>80m
0
50
100
150
200
250
lh-s
p
lh-lg
lh-s
m
bl-lg
bl-s
m
ki-lg
ki-s
m
sj-lg
sm-lg
sm-s
m
dws
sw
othe
r
MN2<80m
0
15
30
45
60
75
lh-s
p
lh-lg
lh-s
m
bl-lg
bl-s
m
ki-lg
ki-s
m
sj-lg
sm-lg
sm-s
m
dws
sw
othe
r
Num
ber C
augh
t per
Hou
r
MN2>80m
0
15
30
45
60
75
lh-s
p
lh-lg
lh-s
m
bl-lg
bl-s
m
ki-lg
ki-s
m
sj-lg
sm-lg
sm-s
m
dws
sw
othe
r
MN3<80m
0
20
40
60
80
100
lh-s
p
lh-lg
lh-s
m
bl-lg
bl-s
m
ki-lg
ki-s
m
sj-lg
sm-lg
sm-s
m
dws
sw
othe
r
Num
ber C
augh
t per
Hou
r
MN3>80m
0
20
40
60
80
100
lh-s
p
lh-lg
lh-s
m
bl-lg
bl-s
m
ki-lg
ki-s
m
sj-lg
sm-lg
sm-s
m
dws
sw
othe
r
r
r
r
Figure 3. Species and size catch per effort for midwater trawl samples collected in Minne-
sota waters of Lake Superior in 2003 and 2004.
8
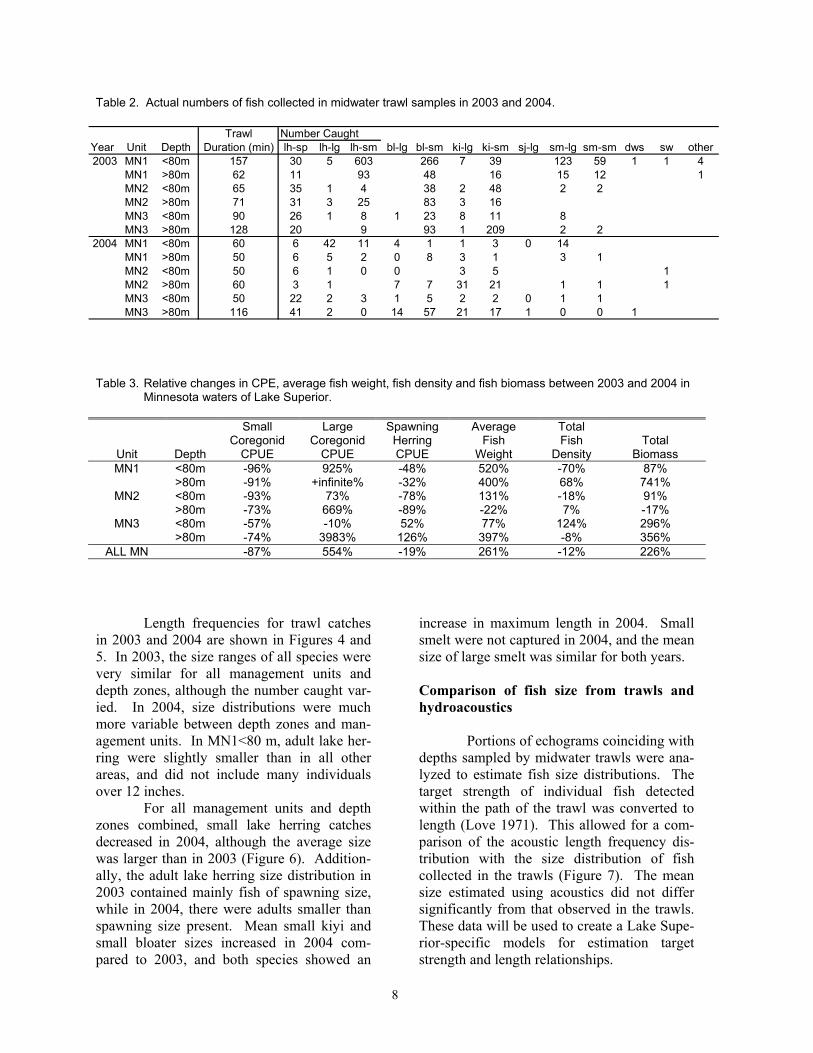
Table 2. Actual numbers of fish collected in midwater trawl samples in 2003 and 2004.
Table 3. Relative changes in CPE, average fish weight, fish density and fish biomass between 2003 and 2004 in
Minnesota waters of Lake Superior.
Unit
Depth
Small Coregonid
CPUE
Large Coregonid
CPUE
Spawning Herring CPUE
Average Fish
Weight
Total Fish
Density
Total
Biomass MN1 <80m
>80m -96% -91%
925% +infinite%
-48% -32%
520% 400%
-70% 68%
87% 741%
MN2 <80m >80m
-93% -73%
73% 669%
-78% -89%
131% -22%
-18% 7%
91% -17%
MN3 <80m >80m
-57% -74%
-10% 3983%
52% 126%
77% 397%
124% -8%
296% 356%
ALL MN -87% 554% -19% 261% -12% 226%
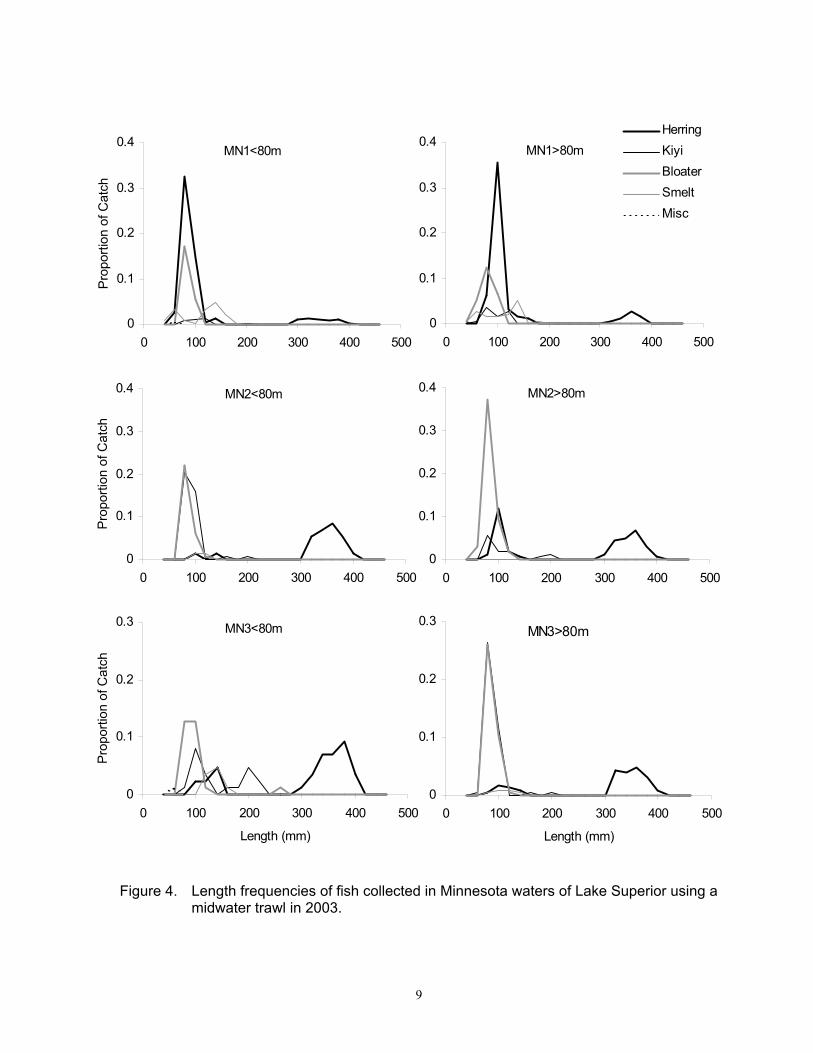
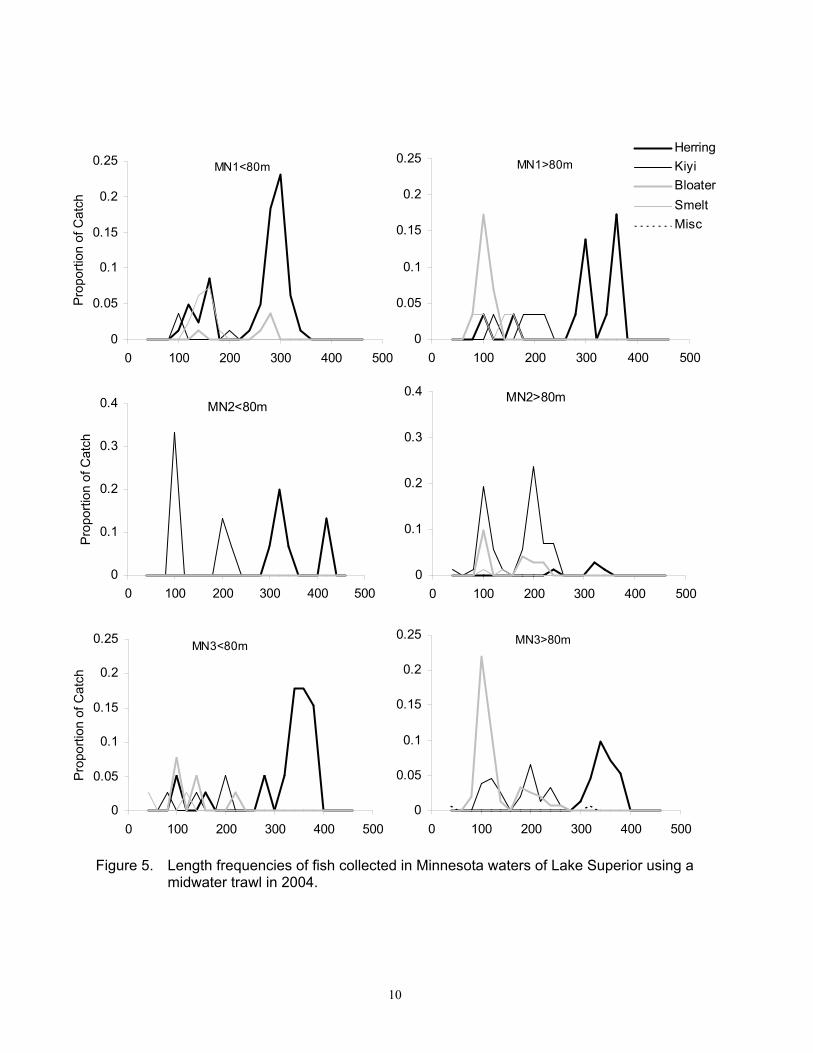
Length frequencies for trawl catches in 2003 and 2004 are shown in Figures 4 and 5. In 2003, the size ranges of all species were very similar for all management units and depth zones, although the number caught var-ied. In 2004, size distributions were much more variable between depth zones and man-agement units. In MN1<80 m, adult lake her-ring were slightly smaller than in all other areas, and did not include many individuals over 12 inches. For all management units and depth zones combined, small lake herring catches decreased in 2004, although the average size was larger than in 2003 (Figure 6). Addition-ally, the adult lake herring size distribution in 2003 contained mainly fish of spawning size, while in 2004, there were adults smaller than spawning size present. Mean small kiyi and small bloater sizes increased in 2004 com-pared to 2003, and both species showed an
increase in maximum length in 2004. Small smelt were not captured in 2004, and the mean size of large smelt was similar for both years. Comparison of fish size from trawls and hydroacoustics Portions of echograms coinciding with depths sampled by midwater trawls were ana-lyzed to estimate fish size distributions. The target strength of individual fish detected within the path of the trawl was converted to length (Love 1971). This allowed for a com-parison of the acoustic length frequency dis-tribution with the size distribution of fish collected in the trawls (Figure 7). The mean size estimated using acoustics did not differ significantly from that observed in the trawls. These data will be used to create a Lake Supe-rior-specific models for estimation target strength and length relationships.
Trawl Number CaughtYear Unit Depth Duration (min) lh-sp lh-lg lh-sm bl-lg bl-sm ki-lg ki-sm sj-lg sm-lg sm-sm dws sw other2003 MN1 <80m 157 30 5 603 266 7 39 123 59 1 1 4
MN1 >80m 62 11 93 48 16 15 12 1MN2 <80m 65 35 1 4 38 2 48 2 2MN2 >80m 71 31 3 25 83 3 16MN3 <80m 90 26 1 8 1 23 8 11 8MN3 >80m 128 20 9 93 1 209 2 2
2004 MN1 <80m 60 6 42 11 4 1 1 3 0 14MN1 >80m 50 6 5 2 0 8 3 1 3 1MN2 <80m 50 6 1 0 0 3 5 1MN2 >80m 60 3 1 7 7 31 21 1 1 1MN3 <80m 50 22 2 3 1 5 2 2 0 1 1MN3 >80m 116 41 2 0 14 57 21 17 1 0 0 1
9
Figure 4. Length frequencies of fish collected in Minnesota waters of Lake Superior using a
midwater trawl in 2003.
0
0.1
0.2
0.3
0.4
0 100 200 300 400 500
Length (mm)
Prop
ortio
n of
Cat
ch
MN1<80m
0
0.1
0.2
0.3
0.4
0 100 200 300 400 500
HerringKiyiBloaterSmeltMisc
MN1>80m
0
0.1
0.2
0.3
0.4
0 100 200 300 400 500
Prop
ortio
n of
Cat
ch
MN2<80m
0
0.1
0.2
0.3
0.4
0 100 200 300 400 500
MN2>80m
0
0.1
0.2
0.3
0 100 200 300 400 500
Length (mm)
Prop
ortio
n of
Cat
ch
MN3<80m
0
0.1
0.2
0.3
0 100 200 300 400 500
Length (mm)
MN3>80m
10
Figure 5. Length frequencies of fish collected in Minnesota waters of Lake Superior using a midwater trawl in 2004.
0
0.05
0.1
0.15
0.2
0.25
0 100 200 300 400 500
Prop
ortio
n of
Cat
ch
MN1<80m
0
0.05
0.1
0.15
0.2
0.25
0 100 200 300 400 500
HerringKiyiBloaterSmeltMisc
MN1>80m
0
0.1
0.2
0.3
0.4
0 100 200 300 400 500
Prop
ortio
n of
Cat
ch
MN2<80m
0
0.1
0.2
0.3
0.4
0 100 200 300 400 500
MN2>80m
0
0.05
0.1
0.15
0.2
0.25
0 100 200 300 400 500
Prop
ortio
n of
Cat
ch
MN3<80m
0
0.05
0.1
0.15
0.2
0.25
0 100 200 300 400 500
MN3<80mMN3>80m

11
Figure 6. Length frequency for all midwater trawl samples collected in all Minnesota waters
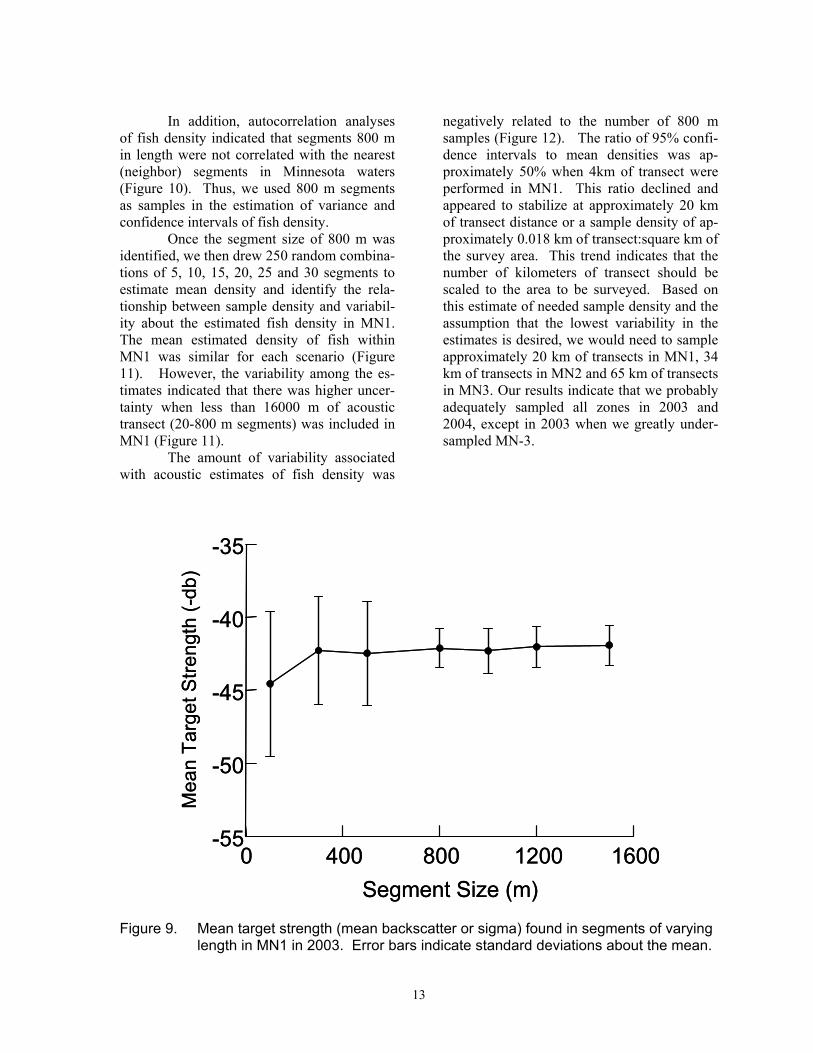
of Lake Superior in 2003 and 2004. Hydroacoustic Data Sample Density and Variability In 2003, we assessed the influence of sampling effort on the variability about our estimates of fish density. We used informa-tion collected in MN1, which contained the highest sampling effort per unit area. We be-gan by separating transects into smaller seg-ments to identify the most appropriate resolution for analysis based on the number of single targets detected (which is used to calcu-late the mean fish size and fish density over a defined area). Results from segments ranging
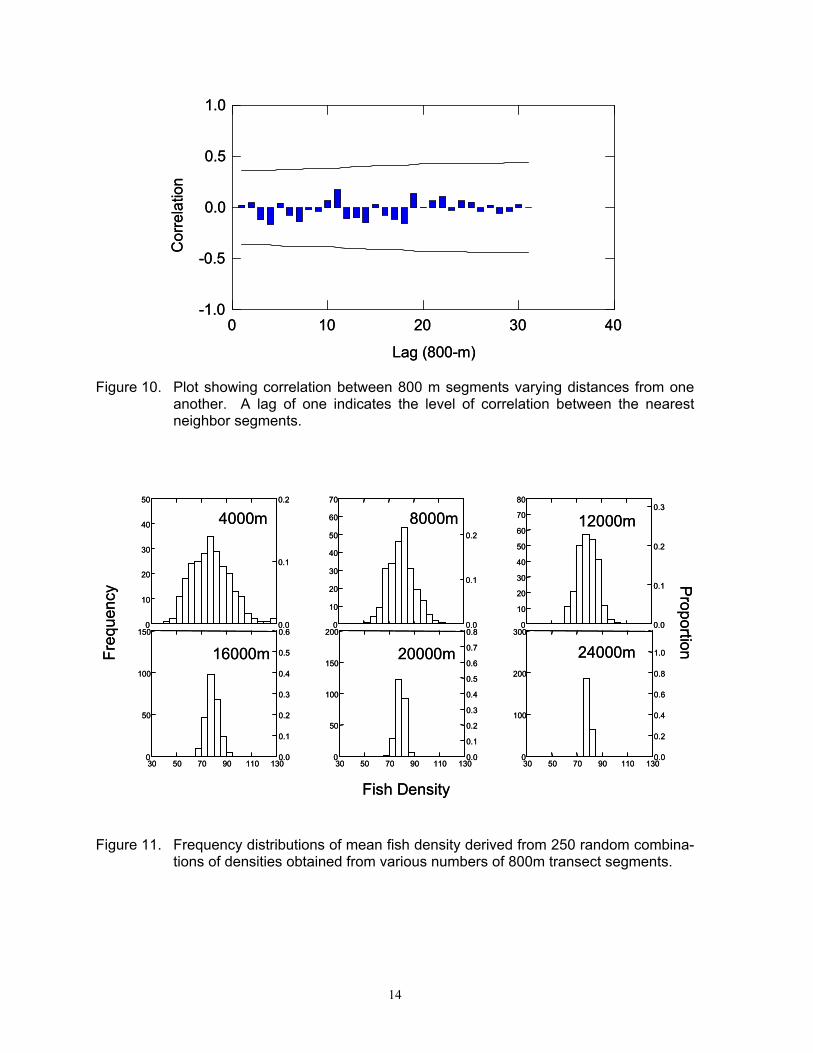
in size from 100 m to 1500 m indicated that fewer than 50 single fish targets were detected in segments shorter than 800 m (Figure 8). Furthermore, the mean size of acous-tic targets varied as segment size was changed. Mean acoustic size or “sigma” is very influen-tial in estimating fish density and is an ex-tremely important variable. The estimated mean acoustic size of fish targets and the as-sociated variability became more consistent as segment size approached 800 m in length (Figure 9) and the standard deviation was ap-proximately 1.3 db for segments 800 m or longer in length.
Kiyi
0
0.02
0.04
0.06
0.08
0.1
0 100 200 300 400 500Length (mm)
Prop
ortio
n of
Tot
al C
atch
20032004
Smelt
0
0.01
0.02
0.03
0.04
0 100 200 300 400 500Length (mm)
Prop
ortio
n of
Tot
al C
atch
Herring
0
0.05
0.1
0.15
0.2
0.25
0 100 200 300 400 500Length (mm)
Prop
ortio
n of
Tot
al C
atch
Bloater
0
0.05
0.1
0.15
0.2
0.25
0 100 200 300 400 500Length (mm)
Prop
ortio
n of
Tot
al C
atch
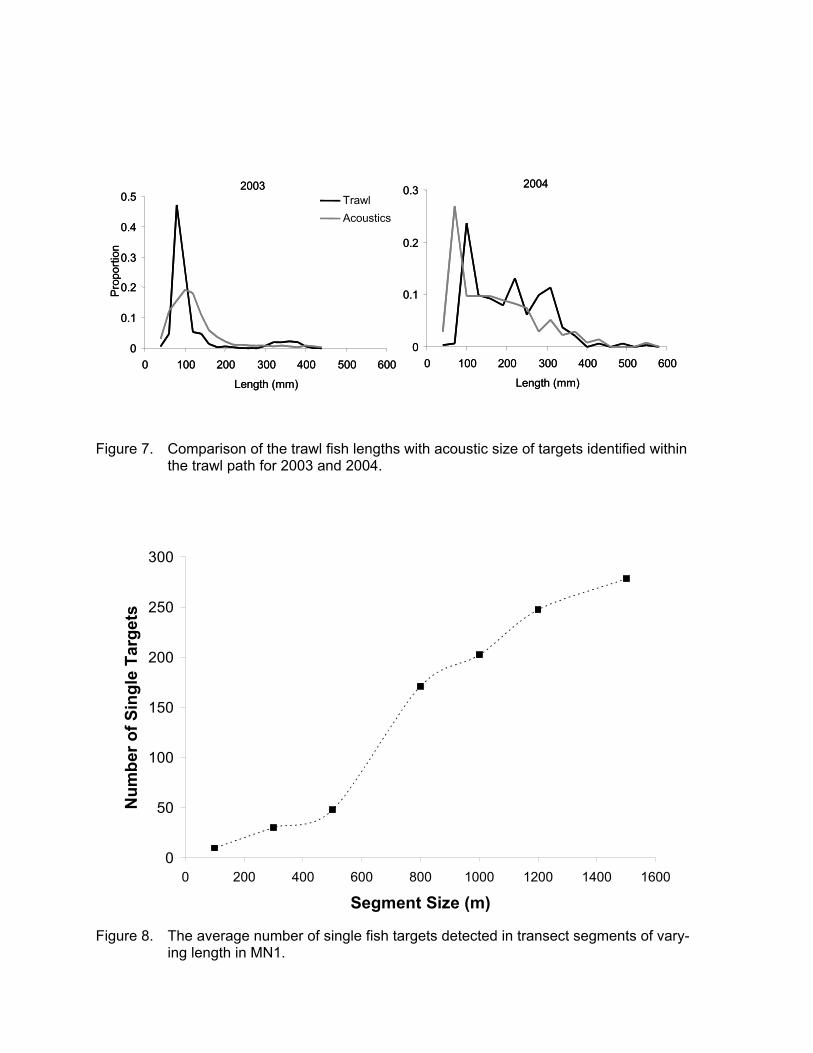
Figure 7. Comparison of the trawl fish lengths with acoustic size of targets identified within
the trawl path for 2003 and 2004.
0
50
100
150
200
250
300
0 200 400 600 800 1000 1200 1400 1600
Segment Size (m)
Num
ber o
f Sin
gle
Targ
ets
Figure 8. The average number of single fish targets detected in transect segments of vary-
ing length in MN1.
2003
0
0.1
0.2
0.3
0.4
0.5
0 100 200 300 400 500 600
Length (mm)
Prop
ortio
n
TrawlAcoustics
2004
0
0.1
0.2
0.3
0 100 200 300 400 500 600
Length (mm)
2003
0
0.1
0.2
0.3
0.4
0.5
0 100 200 300 400 500 600
Length (mm)
Prop
ortio
n
TrawlAcoustics
2004
0
0.1
0.2
0.3
0 100 200 300 400 500 600
Length (mm)
13
In addition, autocorrelation analyses of fish density indicated that segments 800 m in length were not correlated with the nearest (neighbor) segments in Minnesota waters (Figure 10). Thus, we used 800 m segments as samples in the estimation of variance and confidence intervals of fish density. Once the segment size of 800 m was identified, we then drew 250 random combina-tions of 5, 10, 15, 20, 25 and 30 segments to estimate mean density and identify the rela-tionship between sample density and variabil-ity about the estimated fish density in MN1. The mean estimated density of fish within MN1 was similar for each scenario (Figure 11). However, the variability among the es-timates indicated that there was higher uncer-tainty when less than 16000 m of acoustic transect (20-800 m segments) was included in MN1 (Figure 11). The amount of variability associated with acoustic estimates of fish density was
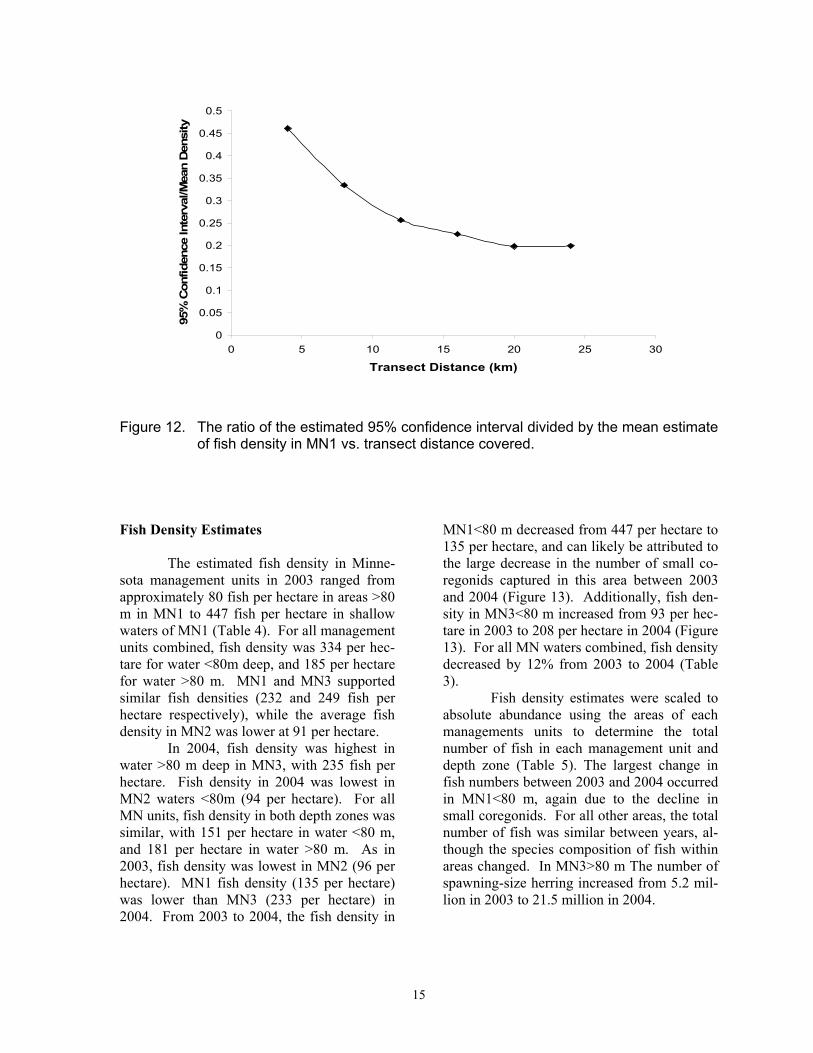
negatively related to the number of 800 m samples (Figure 12). The ratio of 95% confi-dence intervals to mean densities was ap-proximately 50% when 4km of transect were performed in MN1. This ratio declined and appeared to stabilize at approximately 20 km of transect distance or a sample density of ap-proximately 0.018 km of transect:square km of the survey area. This trend indicates that the number of kilometers of transect should be scaled to the area to be surveyed. Based on this estimate of needed sample density and the assumption that the lowest variability in the estimates is desired, we would need to sample approximately 20 km of transects in MN1, 34 km of transects in MN2 and 65 km of transects in MN3. Our results indicate that we probably adequately sampled all zones in 2003 and 2004, except in 2003 when we greatly under-sampled MN-3.
0 400 800 1200 1600Segment Size (m)
-55
-50
-45
-40
-35
Mea
n Ta
rget
Stre
ngth
(-db
)
0 400 800 1200 1600Segment Size (m)
-55
-50
-45
-40
-35
Mea
n Ta
rget
Stre
ngth
(-db
)
Figure 9. Mean target strength (mean backscatter or sigma) found in segments of varying
length in MN1 in 2003. Error bars indicate standard deviations about the mean.
14
0 10 20 30 40
Lag (800-m)
-1.0
-0.5
0.0
0.5
1.0
Cor
rela
tion
0 10 20 30 40
Lag (800-m)
-1.0
-0.5
0.0
0.5
1.0
Cor
rela
tion
Figure 10. Plot showing correlation between 800 m segments varying distances from one
another. A lag of one indicates the level of correlation between the nearest neighbor segments.
0
10
20
30
40
50
0.0
0.1
0.2
0
10
20
30
40
50
60
70
0.0
0.1
0.2
0
10
20
30
40
50
60
70
80
0.0
0.1
0.2
0.3
30 50 70 90 110 1300
50
100
150
0.0
0.1
0.2
0.3
0.4
0.5
0.6
30 50 70 90 110 1300
50
100
150
200
0.0
0.1
0.2
0.3
0.4
0.5
0.6
0.7
0.8
30 50 70 90 110 1300
100
200
300
0.0
0.2
0.4
0.6
0.8
1.0
Fish Density
Freq
uenc
y Proportion
4000m 8000m 12000m
16000m 20000m 24000m
0
10
20
30
40
50
0.0
0.1
0.2
0
10
20
30
40
50
60
70
0.0
0.1
0.2
0
10
20
30
40
50
60
70
80
0.0
0.1
0.2
0.3
30 50 70 90 110 1300
50
100
150
0.0
0.1
0.2
0.3
0.4
0.5
0.6
30 50 70 90 110 1300
50
100
150
200
0.0
0.1
0.2
0.3
0.4
0.5
0.6
0.7
0.8
30 50 70 90 110 1300
100
200
300
0.0
0.2
0.4
0.6
0.8
1.0
Fish Density
Freq
uenc
y Proportion
4000m 8000m 12000m
16000m 20000m 24000m
Figure 11. Frequency distributions of mean fish density derived from 250 random combina-
tions of densities obtained from various numbers of 800m transect segments.
15
0
0.05
0.1
0.15
0.2
0.25
0.3
0.35
0.4
0.45
0.5
0 5 10 15 20 25 30
Transect Distance (km)
95%
Con
fiden
ce In
terv
al/M
ean
Den
sity
Figure 12. The ratio of the estimated 95% confidence interval divided by the mean estimate
of fish density in MN1 vs. transect distance covered. Fish Density Estimates The estimated fish density in Minne-sota management units in 2003 ranged from approximately 80 fish per hectare in areas >80 m in MN1 to 447 fish per hectare in shallow waters of MN1 (Table 4). For all management units combined, fish density was 334 per hec-tare for water <80m deep, and 185 per hectare for water >80 m. MN1 and MN3 supported similar fish densities (232 and 249 fish per hectare respectively), while the average fish density in MN2 was lower at 91 per hectare. In 2004, fish density was highest in water >80 m deep in MN3, with 235 fish per hectare. Fish density in 2004 was lowest in MN2 waters <80m (94 per hectare). For all MN units, fish density in both depth zones was similar, with 151 per hectare in water <80 m, and 181 per hectare in water >80 m. As in 2003, fish density was lowest in MN2 (96 per hectare). MN1 fish density (135 per hectare) was lower than MN3 (233 per hectare) in 2004. From 2003 to 2004, the fish density in
MN1<80 m decreased from 447 per hectare to 135 per hectare, and can likely be attributed to the large decrease in the number of small co-regonids captured in this area between 2003 and 2004 (Figure 13). Additionally, fish den-sity in MN3<80 m increased from 93 per hec-tare in 2003 to 208 per hectare in 2004 (Figure 13). For all MN waters combined, fish density decreased by 12% from 2003 to 2004 (Table 3). Fish density estimates were scaled to absolute abundance using the areas of each managements units to determine the total number of fish in each management unit and depth zone (Table 5). The largest change in fish numbers between 2003 and 2004 occurred in MN1<80 m, again due to the decline in small coregonids. For all other areas, the total number of fish was similar between years, al-though the species composition of fish within areas changed. In MN3>80 m The number of spawning-size herring increased from 5.2 mil-lion in 2003 to 21.5 million in 2004.

16
Table 4. Estimates of fish density and total number of fish in each management unit and depth zone for 2003 and 2004.
0
150
300
450
600
750
MN
1<80
m
MN
1>80
m
MN
2<80
m
MN
2>80
m
MN
3<80
m
MN
3>80
m
Den
sity
(Fis
h/ha
)
20032004
Figure 13. Fish density estimates (number/ha) with 95%CI for Minnesota waters of Lake
Superior for 2003 and 2004.
2003 2004Management Density Number of Fish Density Number of Fish
Unit Bottom Depth Area (ha) (fish/ha) (millions) (fish/ha) (millions)MN1 <80m 44,959 447.0 20.1 134.9 6.1
>80m 63,794 80.3 5.1 135.1 8.6MN2 <80m 8,533 160.6 1.4 132.3 1.1
>80m 180,507 88.1 15.9 93.8 16.9MN3 <80m 14,879 93.1 1.4 208.5 3.1
>80m 343,473 255.8 87.9 234.7 80.6MN1 all 108,753 231.9 25.2 135.0 14.7MN2 all 189,040 91.4 17.3 95.6 18.1MN3 all 358,352 249.1 89.3 233.6 83.7All <80m 68,371 334.2 22.9 150.6 10.3All >80m 587,774 185.3 108.9 180.6 106.2
All MN all 656,145 200.8 131.7 177.5 116.5
17
Table 5. Total number by species in October 2003 for each depth zone of the Minnesota management units of Lake Superior using acoustic and midwater trawl data.
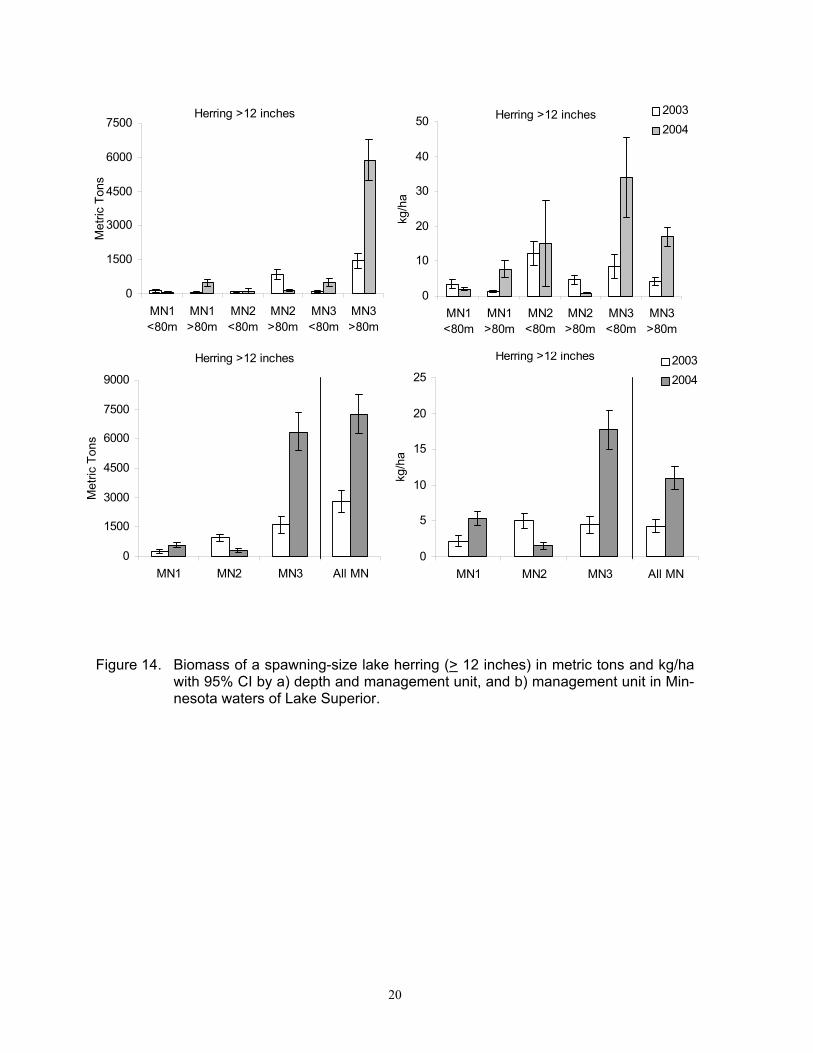
Fish Biomass Estimates The biomass of each species in metric tons (Table 6) and kilograms per hectare (Ta-ble 7) was found using the average weight for each species and the total number of each spe-cies. In 2003, spawning-size lake herring dominated the biomass in all management units and depth zones, ranging from 58% of the biomass in MN1<80 m to 95% in MN2<80 m. For all areas and depth zones combined, spawning-size lake herring biomass (2,800 metric tons) comprised 86% of the total bio-mass (Figure 14). All coregonids together represent 98% of the total biomass of fish found in Minnesota waters of Lake Superior. The total fish biomass of Minnesota waters was 3,263 metric tons in 2003. Area-corrected biomass calculations show a range of spawn-ing-size lake herring from 1.3 kg/ha in MN1<80 m to 12.1 kg/ha in MN2<80 m (Ta-ble 6, Figure 14). For all Minnesota waters, spawning-size lake herring averaged 4.3 kg/ha, and all coregonids combined averaged 4.9 kg/ha. In 2004, the total biomass of fish in Minnesota waters increased to 10,630 metric tons. Although spawning-size lake herring again dominated the biomass with 7,240 met-ric tons (Figure 14), this only represented 68% of the total biomass - a decrease of 18% com-pared to 2003. Large herring, large bloater,
large kiyi and siscowet all increased in bio-mass in 2004, and combined contributed 27% of the total biomass. A single specimen of shortjaw cisco captured in the midwater trawls yielded a shortjaw biomass estimate of 113 metric tons in MN3>80 m. Area-corrected biomass estimates for spawning-sized lake herring in 2004 showed an increase from 2003, ranging from 2 kg/ha in MN1<80m to 34 kg/ha in MN3<80 m and averaging 11 kg/ha for all MN waters (Figure 14). The co-regonid biomass increased greatly when com-pared to 2003, with 15.5 kg/ha for all management units and depths combined. Changes from 2003 to 2004 Small coregonid CPE decreased in every management unit between 2003 and 2004. During this same time period, large co-regonid (not including spawning herring) CPE increased dramatically (>500%) in nearly all MN units (Table 2). Additionally, the propor-tion of large coregonids and spawning-size herring in trawl catches greatly increased in 2004 (Figure 6). This change in fish propor-tions led to a 261% increase in average fish weight. When these larger weights and higher proportions of larger fish were applied to acoustic density estimates, the result was an overall increase in fish biomass of 226% be-tween 2003 and 2004 (Table 2).
Bottom Depth Total Fish Number by species and size (millions)Year Unit (m) (millions) lh-sp lh-lg lh-sm bl-lg bl-sm ki-lg ki-sm sj-lg sm-lg sm-sm dws sw other2003 MN1 <80m 20.1 0.5 0.1 10.6 0.0 4.7 0.1 0.7 0.0 2.2 1.0 0.0 0.0 0.12003 MN1 >80m 5.1 0.3 0.0 2.4 0.0 1.3 0.0 0.4 0.0 0.4 0.3 0.0 0.0 0.02003 MN2 <80m 1.4 0.4 0.0 0.0 0.0 0.4 0.0 0.5 0.0 0.0 0.0 0.0 0.0 0.02003 MN2 >80m 15.9 3.1 0.3 2.5 0.0 8.2 0.3 1.6 0.0 0.0 0.0 0.0 0.0 0.02003 MN3 <80m 1.4 0.4 0.0 0.1 0.0 0.4 0.1 0.2 0.0 0.1 0.0 0.0 0.0 0.02003 MN3 >80m 87.9 5.2 0.0 2.4 0.0 24.3 0.3 54.7 0.0 0.5 0.5 0.0 0.0 0.02004 MN1 <80m 6.1 0.4 3.1 0.8 0.3 0.1 0.1 0.2 0.0 1.0 0.0 0.0 0.0 0.02004 MN1 >80m 8.6 1.8 1.5 0.6 0.0 2.4 0.9 0.3 0.0 0.9 0.3 0.0 0.0 0.02004 MN2 <80m 1.1 0.4 0.1 0.0 0.0 0.0 0.2 0.4 0.0 0.0 0.0 0.0 0.1 0.02004 MN2 >80m 16.9 0.7 0.2 0.0 1.6 1.6 7.2 4.9 0.0 0.2 0.2 0.0 0.2 0.02004 MN3 <80m 3.1 1.7 0.2 0.2 0.1 0.4 0.2 0.2 0.0 0.1 0.1 0.0 0.0 0.02004 MN3 >80m 80.6 21.5 1.0 0.0 7.3 29.8 11.0 8.9 0.5 0.0 0.0 0.5 0.0 0.0

18
Table 6. Biomass in metric tons (+95% CI, in parentheses) for fish species and size classes (Table 1) for Minnesota management units of Lake Superior in 2003 and 2004 de-termined using hydroacoustics and midwater trawl samples.
Bottom Metric TonsYear Unit Depth(m) lh-sp lh-lg lh-sm bl-lg bl-sm ki-lg ki-sm sj-lg sm-lg sm-sm dws sw other2003 MN1 <80m 154.8 15.5 33.2 0.0 14.1 4.0 2.4 0.0 23.6 2.5 0.0 17.2 0.1
(58.5) (5.9) (12.6) - (5.3) (1.5) (0.9) - (8.9) (1.0) - (6.5) (0.0)>80m 85.9 0.0 13.1 0.0 3.2 0.0 1.2 0.0 3.9 0.4 0.0 0.0 0.0
(20.9) - (3.2) - (0.8) - (0.3) - (1.0) (0.1) - - -MN2 <80m 103.5 1.9 0.4 0.0 1.3 0.5 0.8 0.0 0.2 0.1 0.0 0.0 0.0
(29.3) (0.6) (0.1) - (0.4) (0.1) (0.2) - (0.0) (0.0) - - ->80m 854.1 52.0 14.1 0.0 26.3 7.7 3.8 0.0 0.0 0.0 0.0 0.0 0.0
(221.3) (13.5) (3.7) - (6.8) (2.0) (1.0) - - - - - -MN3 <80m 125.4 2.5 1.4 1.6 1.4 3.9 0.5 0.0 1.3 0.0 0.0 0.0 0.0
(51.9) (1.0) (0.6) (0.7) (0.6) (1.6) (0.2) - (0.5) - - - ->80m 1476.6 0.0 17.7 0.0 72.4 6.8 103.5 0.0 5.9 0.7 0.0 0.0 0.0
(335.8) - (4.0) - (16.5) (1.6) (23.5) - (1.3) (0.2) - - -MN1 all 240.7 15.5 46.3 0.0 17.4 4.0 3.5 0.0 27.5 3.0 0.0 17.2 0.1
(86.8) (5.6) (16.7) - (6.3) (1.4) (1.3) - (9.9) (1.1) (0.0) (6.2) (0.0)MN2 all 957.6 53.9 14.6 0.0 27.6 8.2 4.7 0.0 0.2 0.1 0.0 0.0 0.0
(189.0) (10.6) (2.9) - (5.5) (1.6) (0.9) - (0.0) (0.0) - - -MN3 all 1601.9 2.5 19.1 1.6 73.7 10.7 104.0 0.0 7.1 0.7 0.0 0.0 0.0
(424.0) (0.7) (5.0) (0.4) (19.5) (2.8) (27.5) - (1.9) (0.2) - - -All <80m 383.7 20.0 35.0 1.6 16.8 8.4 3.7 0.0 25.0 2.6 0.0 17.2 0.1
(110.0) (5.7) (10.0) (0.5) (4.8) (2.4) (1.1) - (7.2) (0.7) (0.0) (4.9) (0.0)All >80m 2416.6 52.0 45.0 0.0 102.0 14.5 108.5 0.0 9.8 1.1 0.0 0.0 0.0
(432.7) (9.3) (8.0) - (18.3) (2.6) (19.4) - (1.7) (0.2) - - (0.0)All MN 2800.3 72.0 79.9 1.6 118.7 22.9 112.2 0.0 34.8 3.7 0.0 17.2 0.1
(580.1) (14.9) (16.6) (0.3) (24.6) (4.7) (23.2) - (7.2) (0.8) (0.0) (3.6) (0.0)2004 MN1 <80m 89.3 348.2 11.7 32.8 1.0 2.3 0.5 0.0 14.2 0.0 0.0 0.0 0.0
(20.5) (79.8) (2.7) (7.5) (0.2) (0.5) (0.1) - (3.3) - - - ->80m 494.6 246.0 115.2 0.0 13.5 25.9 1.2 0.0 8.9 0.7 0.0 0.0 0.0
(151.7) (75.5) (35.3) - (4.1) (7.9) (0.4) - (2.7) (0.2) - - -MN2 <80m 128.8 11.9 0.0 0.0 0.0 7.4 1.0 0.0 0.0 0.0 0.0 58.2 0.0
(105.2) (9.7) - - - (6.0) (0.8) - - - - (47.6) ->80m 161.5 20.2 0.0 74.4 9.2 251.9 14.6 0.0 2.0 0.8 0.0 262.7 0.0
(30.2) (3.8) - (13.9) (1.7) (47.2) (2.7) - (0.4) (0.2) - (49.2) -MN3 <80m 506.4 21.9 2.7 5.4 3.7 4.7 1.0 0.0 0.4 0.0 0.0 0.0 0.0
(169.1) (7.3) (0.9) (1.8) (1.2) (1.6) (0.3) - (0.1) (0.0) - - ->80m 5859.8 171.0 0.0 374.3 186.9 922.9 42.7 115.6 0.0 0.0 0.5 0.0 0.0
(900.6) (26.3) - (57.5) (28.7) (141.8) (6.6) (17.8) - - (0.1) - -MN1 all 583.9 594.2 126.9 32.8 14.4 28.2 1.7 0.0 23.1 0.7 0.0 0.0 0.0
(106.5) (108.4) (23.2) (6.0) (2.6) (5.1) (0.3) 0.0 (4.2) (0.1) 0.0 0.0 0.0MN2 all 290.3 32.0 0.0 74.4 9.2 259.2 15.5 0.0 2.0 0.8 0.0 320.9 0.0
(91.3) (10.1) 0.0 (23.4) (2.9) (81.6) (4.9) 0.0 (0.6) (0.3) 0.0 (101.0) 0.0MN3 all 6366.2 192.9 2.7 379.7 190.6 927.6 43.7 115.6 0.4 0.0 0.5 0.0 0.0
(980.5) (29.7) (0.4) (58.5) (29.4) (142.9) (6.7) (17.8) (0.1) (0.0) (0.1) 0.0 0.0All <80m 724.6 381.9 14.5 38.2 4.7 14.3 2.5 0.0 14.7 0.0 0.0 58.2 0.0
(192.8) (101.6) (3.9) (10.2) (1.2) (3.8) (0.7) 0.0 (3.9) (0.0) 0.0 (15.5) 0.0All >80m 6515.9 437.2 115.2 448.7 209.5 1200.7 58.5 115.6 10.9 1.5 0.5 262.7 0.0
(852.8) (57.2) (15.1) (58.7) (27.4) (157.2) (7.7) (15.1) (1.4) (0.2) (0.1) (34.4) 0.0All MN 7240.4 819.1 129.7 486.9 214.2 1215.0 60.9 115.6 25.5 1.5 0.5 320.9 0.0
(995.8) (112.7) (17.8) (67.0) (29.5) (167.1) (8.4) (15.9) (3.5) (0.2) (0.1) (44.1) 0.0
19
Table 7. Biomass in kg/ha (+95% CI, in parentheses) for fish species and size classes (Table 1) for Minnesota management units of Lake Superior in 2003 and 2004 de-termined using hydroacoustics and midwater trawl samples.
Bottom kg/haYear Unit Depth(m) lh-sp lh-lg lh-sm bl-lg bl-sm ki-lg ki-sm sj-lg sm-lg sm-sm dws sw other2003 MN1 <80m 3.4 0.3 0.7 0.0 0.3 0.1 0.1 0.0 0.5 0.1 0.0 0.4 0.0
(1.3) (0.1) (0.3) - (0.1) (0.0) (0.0) - (0.2) (0.0) (0.0) (0.1) (0.0)>80m 1.3 0.0 0.2 0.0 0.1 0.0 0.0 0.0 0.1 0.0 0.0 0.0 0.0
(0.3) - (0.1) - (0.0) - (0.0) - (0.0) (0.0) - - (0.0)MN2 <80m 12.1 0.2 0.0 0.0 0.2 0.1 0.1 0.0 0.0 0.0 0.0 0.0 0.0
(3.4) (0.1) (0.0) - (0.0) (0.0) (0.0) - (0.0) (0.0) - - ->80m 4.7 0.3 0.1 0.0 0.1 0.0 0.0 0.0 0.0 0.0 0.0 0.0 0.0
(1.2) (0.1) (0.0) - (0.0) (0.0) (0.0) - - - - - -MN3 <80m 8.4 0.2 0.1 0.1 0.1 0.3 0.0 0.0 0.1 0.0 0.0 0.0 0.0
(3.5) (0.1) (0.0) (0.0) (0.0) (0.1) (0.0) - (0.0) - - - ->80m 4.3 0.0 0.1 0.0 0.2 0.0 0.3 0.0 0.0 0.0 0.0 0.0 0.0
(1.0) - (0.0) - (0.0) (0.0) (0.1) - (0.0) (0.0) - - -MN1 all 2.2 0.1 0.4 0.0 0.2 0.0 0.0 0.0 0.3 0.0 0.0 0.2 0.0
(0.8) (0.1) (0.2) - (0.1) (0.0) (0.0) - (0.1) (0.0) (0.0) (0.1) (0.0)MN2 all 5.1 0.3 0.1 0.0 0.1 0.0 0.0 0.0 0.0 0.0 0.0 0.0 0.0
(1.0) (0.1) (0.0) - (0.0) (0.0) (0.0) - (0.0) (0.0) - - -MN3 all 4.5 0.0 0.1 0.0 0.2 0.0 0.3 0.0 0.0 0.0 0.0 0.0 0.0
(1.2) (0.0) (0.0) (0.0) (0.1) (0.0) (0.1) - (0.0) (0.0) - - -All <80m 5.6 0.3 0.5 0.0 0.2 0.1 0.1 0.0 0.4 0.0 0.0 0.3 0.0
(1.6) (0.1) (0.1) (0.0) (0.1) (0.0) (0.0) - (0.1) (0.0) (0.0) (0.1) (0.0)All >80m 4.1 0.1 0.1 0.0 0.2 0.0 0.2 0.0 0.0 0.0 0.0 0.0 0.0
(0.7) (0.0) (0.0) - (0.0) (0.0) (0.0) - (0.0) (0.0) - - (0.0)All MN 4.3 0.1 0.1 0.0 0.2 0.0 0.2 0.0 0.1 0.0 0.0 0.0 0.0
(0.9) (0.0) (0.0) (0.0) (0.0) (0.0) (0.0) - (0.0) (0.0) (0.0) (0.0) (0.0)2004 MN1 <80m 2.0 7.7 0.3 0.7 0.0 0.1 0.0 0.0 0.3 0.0 0.0 0.0 0.0
(0.5) (1.8) (0.1) (0.2) (0.0) (0.0) (0.0) - (0.1) - - - ->80m 7.8 3.9 1.8 0.0 0.2 0.4 0.0 0.0 0.1 0.0 0.0 0.0 0.0
(2.4) (1.2) (0.6) - (0.1) (0.1) (0.0) - (0.0) (0.0) - - -MN2 <80m 15.1 1.4 0.0 0.0 0.0 0.9 0.1 0.0 0.0 0.0 0.0 6.8 0.0
(12.3) (1.1) - - - (0.7) (0.1) - - - - (5.6) ->80m 0.9 0.1 0.0 0.4 0.1 1.4 0.1 0.0 0.0 0.0 0.0 1.5 0.0
(0.2) (0.0) - (0.1) (0.0) (0.3) (0.0) - (0.0) (0.0) - (0.3) -MN3 <80m 34.0 1.5 0.2 0.4 0.2 0.3 0.1 0.0 0.0 0.0 0.0 0.0 0.0
(11.4) (0.5) (0.1) (0.1) (0.1) (0.1) (0.0) - (0.0) (0.0) - - ->80m 17.1 0.5 0.0 1.1 0.5 2.7 0.1 0.3 0.0 0.0 0.0 0.0 0.0
(2.6) (0.1) - (0.2) (0.1) (0.4) (0.0) (0.1) - - (0.0) - -MN1 all 5.4 5.5 1.2 0.3 0.1 0.3 0.0 0.0 0.2 0.0 0.0 0.0 0.0
(1.0) (1.0) (0.2) (0.1) (0.0) (0.0) (0.0) - (0.0) (0.0) - - -MN2 all 1.5 0.2 0.0 0.4 0.0 1.4 0.1 0.0 0.0 0.0 0.0 1.7 0.0
(0.5) (0.1) - (0.1) (0.0) (0.4) (0.0) - (0.0) (0.0) - (0.5) -MN3 all 17.8 0.5 0.0 1.1 0.5 2.6 0.1 0.3 0.0 0.0 0.0 0.0 0.0
(2.7) (0.1) (0.0) (0.2) (0.1) (0.4) (0.0) (0.0) (0.0) (0.0) (0.0) - -All <80m 10.6 5.6 0.2 0.6 0.1 0.2 0.0 0.0 0.2 0.0 0.0 0.9 0.0
(2.8) (1.5) (0.1) (0.1) (0.0) (0.1) (0.0) 0.0 (0.1) (0.0) 0.0 (0.2) 0.0All >80m 11.1 0.7 0.2 0.8 0.4 2.0 0.1 0.2 0.0 0.0 0.0 0.4 0.0
(1.5) (0.1) (0.0) (0.1) (0.0) (0.3) (0.0) (0.0) (0.0) (0.0) (0.0) (0.1) 0.0All MN 11.0 1.2 0.2 0.7 0.3 1.9 0.1 0.2 0.0 0.0 0.0 0.5 0.0
(1.5) (0.2) (0.0) (0.1) (0.0) (0.3) (0.0) (0.0) (0.0) (0.0) (0.0) (0.1) -
20
Figure 14. Biomass of a spawning-size lake herring (> 12 inches) in metric tons and kg/ha with 95% CI by a) depth and management unit, and b) management unit in Min-nesota waters of Lake Superior.
Herring >12 inches
0
1500
3000
4500
6000
7500
9000
MN1 MN2 MN3 All MN
Met
ric T
ons
Herring >12 inches
0
5
10
15
20
25
MN1 MN2 MN3 All MN
kg/h
a
20032004
Herring >12 inches
0
1500
3000
4500
6000
7500
MN1<80m
MN1>80m
MN2<80m
MN2>80m
MN3<80m
MN3>80m
Met
ric T
ons
Herring >12 inches
0
10
20
30
40
50
MN1<80m
MN1>80m
MN2<80m
MN2>80m
MN3<80m
MN3>80m
kg/h
a
20032004
21
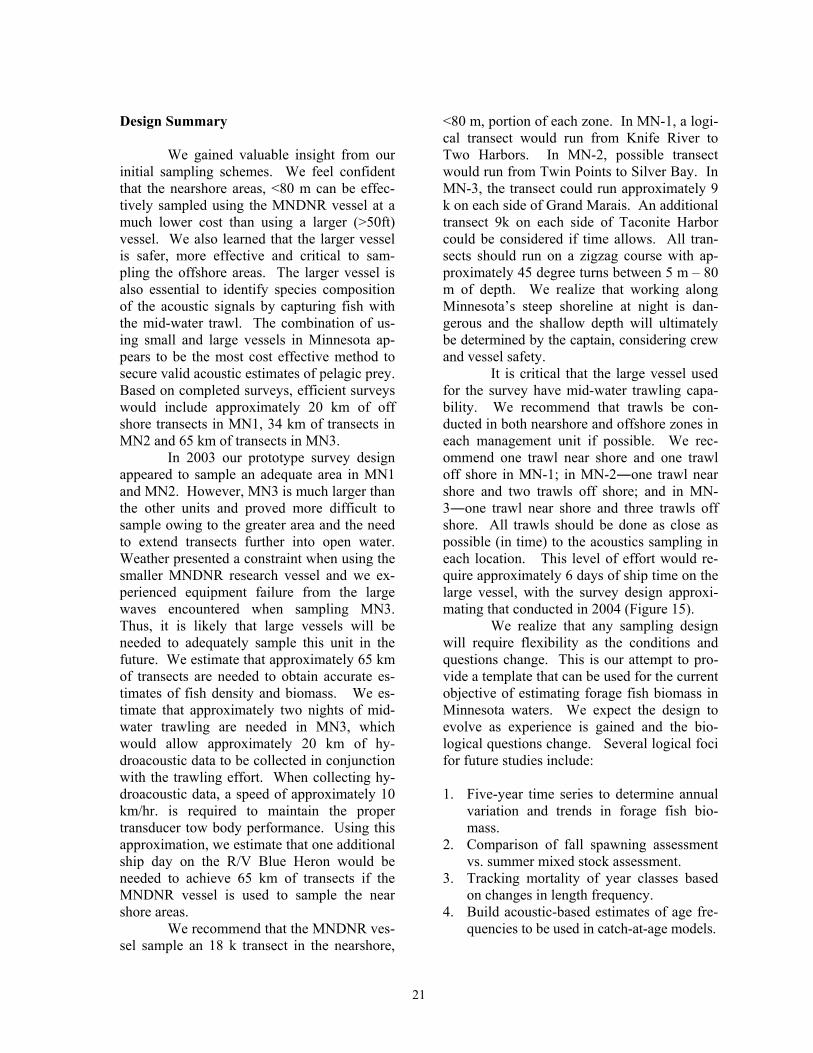
Design Summary
We gained valuable insight from our initial sampling schemes. We feel confident that the nearshore areas, <80 m can be effec-tively sampled using the MNDNR vessel at a much lower cost than using a larger (>50ft) vessel. We also learned that the larger vessel is safer, more effective and critical to sam-pling the offshore areas. The larger vessel is also essential to identify species composition of the acoustic signals by capturing fish with the mid-water trawl. The combination of us-ing small and large vessels in Minnesota ap-pears to be the most cost effective method to secure valid acoustic estimates of pelagic prey. Based on completed surveys, efficient surveys would include approximately 20 km of off shore transects in MN1, 34 km of transects in MN2 and 65 km of transects in MN3. In 2003 our prototype survey design appeared to sample an adequate area in MN1 and MN2. However, MN3 is much larger than the other units and proved more difficult to sample owing to the greater area and the need to extend transects further into open water. Weather presented a constraint when using the smaller MNDNR research vessel and we ex-perienced equipment failure from the large waves encountered when sampling MN3. Thus, it is likely that large vessels will be needed to adequately sample this unit in the future. We estimate that approximately 65 km of transects are needed to obtain accurate es-timates of fish density and biomass. We es-timate that approximately two nights of mid-water trawling are needed in MN3, which would allow approximately 20 km of hy-droacoustic data to be collected in conjunction with the trawling effort. When collecting hy-droacoustic data, a speed of approximately 10 km/hr. is required to maintain the proper transducer tow body performance. Using this approximation, we estimate that one additional ship day on the R/V Blue Heron would be needed to achieve 65 km of transects if the MNDNR vessel is used to sample the near shore areas. We recommend that the MNDNR ves-sel sample an 18 k transect in the nearshore,
<80 m, portion of each zone. In MN-1, a logi-cal transect would run from Knife River to Two Harbors. In MN-2, possible transect would run from Twin Points to Silver Bay. In MN-3, the transect could run approximately 9 k on each side of Grand Marais. An additional transect 9k on each side of Taconite Harbor could be considered if time allows. All tran-sects should run on a zigzag course with ap-proximately 45 degree turns between 5 m – 80 m of depth. We realize that working along Minnesota’s steep shoreline at night is dan-gerous and the shallow depth will ultimately be determined by the captain, considering crew and vessel safety. It is critical that the large vessel used for the survey have mid-water trawling capa-bility. We recommend that trawls be con-ducted in both nearshore and offshore zones in each management unit if possible. We rec-ommend one trawl near shore and one trawl off shore in MN-1; in MN-2―one trawl near shore and two trawls off shore; and in MN-3―one trawl near shore and three trawls off shore. All trawls should be done as close as possible (in time) to the acoustics sampling in each location. This level of effort would re-quire approximately 6 days of ship time on the large vessel, with the survey design approxi-mating that conducted in 2004 (Figure 15). We realize that any sampling design will require flexibility as the conditions and questions change. This is our attempt to pro-vide a template that can be used for the current objective of estimating forage fish biomass in Minnesota waters. We expect the design to evolve as experience is gained and the bio-logical questions change. Several logical foci for future studies include: 1. Five-year time series to determine annual
variation and trends in forage fish bio-mass.
2. Comparison of fall spawning assessment vs. summer mixed stock assessment.
3. Tracking mortality of year classes based on changes in length frequency.
4. Build acoustic-based estimates of age fre-quencies to be used in catch-at-age models.
22
MN1
0 25 50 75km
MN2
MN3
MN1MN1
0 25 50 75km0 25 50 75km
MN2MN2
MN3MN3
Figure 15. Possible transects for future forage fish surveys in Minnesota waters that adhere
to the effort levels identified in surveys conducted in 2003 and 2004.
23
References
Becker, G.C. 1983. Fishes of Wisconsin.
The University of Wisconsin Press. Madison, Wisconsin.
Bronte, C.R., M.P. Ebener, D.R. Schreiner, D.S. DeVault, M.M. Petzold, D.A. Jensen, C. Richards, and S.J. Lozano. 2003. Fish Community change in Lake Superior. Canadian Journal of Fish-eries and Aquatic Sciences 60:1552-1574.
Foote, K.G., H.P. Knudsen, G. Vestnes, D.N. MacLennan, and E.J. Simmonds. 1987. Calibration of acoustic instru-ments for fish density estimation: a practical guide. Coop. Res. Rep. Cons. Int. Explor. Mer. 144, 69pp.
Foote, K.G. 1990. Spheres for calibrating an eleven-frequency acoustic measure-ment system. J. Cons. Int. Explor. Mer. 46:284-286.
Hansen, M.J., J.W. Peck, R.G. Schorfhaar, J.H. Selgeby, D.R. Schreiner, S.T. Schram, B.L. Swanson, W.R. Mac-Callum, M.K. Burnham-Curtis, G.L. Curtis, J.W. Heinrich, and R.J. Young.
1995. Lake trout (Salvelinus namay-cush) populations in Lake Superior and their restoration in 1959-1993. Journal of Great Lakes Research 21 (Suppl. 1):152-175.
Harvey, C.J., S.T. Schram, and J.F. Kitchell. 2003. Trophic Relationships among Lean and Siscowet Lake Trout in Lake Superior. Transactions of the American Fisheries Society 132:219-228.
Love, R.H. 1971. Dorsal-aspect target strength of an individual fish. Journal of the Acoustical Society of America 62(6):1397-1403.
Negus, M.T. 1995. Bioenergetics modeling as a salmonines management tool ap-plied to Minnesota waters of Lake Su-perior. North American Journal of Fisheries Management 15:60-78.
Schreiner, D.R., editor. 1995. Fisheries man-agement plan for the Minnesota wa-ters of Lake Superior. Minnesota Department of Natural Resources, Special Publication 149, St. Paul.