hydroacoustic mapping to define sedimentation rates and
TRANSCRIPT
Prepared in cooperation with the U. S. Fish and Wildlife Service
Hydroacoustic Mapping to Define Sedimentation Rates and Characterize Lentic Habitats in DeSoto Lake, DeSoto National Wildlife Refuge
By Caroline M. Elliott, Robert B. Jacobson, and Kimberly A. Chojnacki
Open-File Report 2006–1254
U.S. Department of the Interior U.S. Geological Survey
ii
U.S. Department of the Interior DIRK KEMPTHORNE, Secretary
U.S. Geological Survey P. Patrick Leahy, Acting Director
U.S. Geological Survey, Reston, Virginia 2006
For product and ordering information: World Wide Web: http://www.usgs.gov/pubprod Telephone: 1-888-ASK-USGS
For more information on the USGS—the Federal source for science about the Earth, its natural and living resources, natural hazards, and the environment: World Wide Web: http://www.usgs.gov Telephone: 1-888-ASK-USGS
Suggested citation: Elliott, C.M., Jacobson, R.B., and Chojnacki, K.A., 2006, Hydroacoustic mapping to define sedimentation rates and characterize lentic habitats in DeSoto Lake, DeSoto National Wildlife Refuge: U.S. Geological Survey Open-File Report 2006-1254, 28 p.
Any use of trade, product, or firm names is for descriptive purposes only and does not imply endorsement by the U.S. Government.
Although this report is in the public domain, permission must be secured from the individual copyright owners to reproduce any copyrighted material contained within this report.
iii
Contents Contents .............................................................................................................................................................................. iii Figures ................................................................................................................................................................................. iii Abstract................................................................................................................................................................................1 Introduction .........................................................................................................................................................................1 Purpose and Scope............................................................................................................................................................1 Setting...................................................................................................................................................................................2 Approach and Methods.....................................................................................................................................................5
Hydroacoustic Mapping ................................................................................................................................................5 Data Reduction and Maps ............................................................................................................................................8
Bathymetry...................................................................................................................................................................8 Elevation .......................................................................................................................................................................8 Substrate ....................................................................................................................................................................10
Results ................................................................................................................................................................................10 Depth Map .....................................................................................................................................................................10 Elevation Maps..............................................................................................................................................................13 Substrate Map...............................................................................................................................................................13 Fish Habitat Structures Map.......................................................................................................................................17 Sedimentation/Erosion Assessment .........................................................................................................................17
Discussion..........................................................................................................................................................................21 Summary ............................................................................................................................................................................23 References Cited ..............................................................................................................................................................24
Figures 1–6. Maps showing DeSoto Lake— 1. With the DeSoto National Wildlife Refuge................................................................................................3 2. Historic positions within the Missouri River.............................................................................................4 3. Depth contours in 1979 .................................................................................................................................5 4. Survey transects for hydroacoustic mapping .........................................................................................7 5. Survey points combined for elevation map .............................................................................................9 6. Depth map.....................................................................................................................................................11 7. Histograms showing depths of DeSoto Lake................................................................................................12 8–13. Maps showing— 8. DeSoto Lake elevation . ..............................................................................................................................14 9. DeSoto National Wildlife Refuge elevations ..........................................................................................15 10. DeSoto Lake generalized substrates .......................................................................................................16 11. DeSoto Lake submersed tree structures ................................................................................................18 12. DeSoto Lake depth contours near irrigation ditches............................................................................20 13. DeSoto Lake shallow water regions ........................................................................................................22 14. Hypsometric graph for DeSoto Lake .............................................................................................................23
Tables 1. Substrate classes and percent area occupied in DeSoto Lake, 2006 .........................................................13 2. Elevations and maximum depths of DeSoto Lake from maps.........................................................................19 3. Estimated sedimentation rates for DeSoto Lake at deepest point based on historical maps..................19 4. Surface area changes for incremental changes in elevation at DeSoto Lake ...........................................21
Conversion Factors SI to Inch/Pound
Multiply By To obtain
Length
meter (m) 3.281 foot (ft)
kilometer (km) 0.6214 mile (mi)
Area
square meter (m2) 0.0002471 acre
Volume
cubic meter (m3) 0.0008107 acre-foot (acre-ft) Vertical coordinate information is referenced to the “North American Vertical Datum of 1988 (NAVD 88), Geoid 03” Horizontal coordinate information is referenced to the “North American Datum of 1983 (NAD 83).”
iv
Hydroacoustic Mapping to Define Sedimentation Rates and Characterize Lentic Habitats in DeSoto Lake, DeSoto National Wildlife Refuge
By Caroline M. Elliott, Robert B. Jacobson, and Kimberly A. Chojnacki
Abstract Hydroacoustic tools were used to map depth, elevation, and substrate on DeSoto Lake. This
oxbow lake was cut off from the Missouri River in 1960, and the mapping updates previous lower-resolution bathymetric maps created from lake surveys in 1967 and 1979. The new maps provide managers tools to assess aquatic habitats and provide a baseline for future monitoring of lake sedimentation and erosion.
Introduction DeSoto Lake, located on the DeSoto National Wildlife Refuge (Desoto NWR) in Iowa and Nebraska, is one of the largest oxbow lakes of the Missouri River system. It is managed by the U.S. Fish and Wildlife Service. The lake is used by over 500,000 migratory birds each fall and spring and is also an important aquatic resource for anglers. We mapped DeSoto Lake in March of 2006 with high-resolution hydroacoustic tools to update previous mapping and to provide a baseline for monitoring future sedimentation rates. Management concerns at the lake include the effects of erosion and sedimentation, aquatic vegetation establishment, shorebird habitat availability at different lake levels, and fish habitat structure work. Subsequent mapping will allow managers to determine the extent of sediment deposition and monitor changes in the lake bathymetry.
Purpose and Scope Our objective was to develop high-precision maps of depth, elevation, and substrate conditions
of DeSoto Lake. The maps quantify habitat conditions within the lake and identify where accelerated sedimentation may threaten lake resources. The maps also provide a template for monitoring future changes in DeSoto Lake’s aquatic habitats. The DeSoto NWR Comprehensive Conservation Plan (CCP) has as two of its goals to: (1) “manage DeSoto Lake so that it makes the highest possible contribution to the Refuge’s mission to preserve and restore indigenous biological communities…” and, (2) “protect, restore, and manage sport fish habitat and populations in DeSoto Lake and to provide quality recreational fishing opportunities for refuge visitors." (U.S. Fish and Wildlife Service, 2001,
1
p. iv) The DeSoto NWR Fishery Management Plan recommends mapping fish structure locations and the lake bottom with current GIS capabilities as needed (U.S. Fish and Wildlife Service, 1989).
Setting DeSoto Lake is located on the DeSoto NWR on the Nebraska and Iowa border (fig. 1). The lake
was cut off from the Missouri River by the U.S. Army Corps of Engineers when the navigation channel was shortened by construction of a cut-off channel and levee in 1960. Its connection to the Missouri River today is through engineered inlet and outlet structures in the levee. There are three inlet ditches that drain adjacent farmland and appear to be a significant source of suspended sediment, contributing mainly silt-sized sediment to the lake.
DeSoto Lake is located in a wide flood plain adjacent to the Lower Missouri River and lies completely within the recent meander belt of the Missouri River. DeSoto Lake does not occupy the same position today as indicated in the 1894 Missouri River Commission maps (fig. 2). It appears the river was quite active in the time between 1894 and 1927 when channel stabilization work was authorized between Kansas City and Sioux City. The lakebed and adjacent lands are composed of fairly recent Missouri River alluvium–sand, silt, and clay sediments. Some bank segments in DeSoto Lake, particularly areas that were previously on the outside bend of the river, are armored by the coarse rip rap and wooden pilings used to narrow the river channel in the 1940s for the creation of the 9-foot deep, 300-foot wide Lower Missouri River navigation channel (Ferrell, 1996).
Refuge records indicate that the lake was mapped in March 1967 by the U.S. Fish and Wildlife Service. The archived maps are 5-foot interval contour maps of depth mapped from a lake elevation of 988.5 ft (feet). The lake was surveyed again in June 1979 (fig. 3). The lake elevation at the time of this mapping was not documented, and the contour interval is 4 ft. Both the 1967 and 1979 maps were hand-contoured from surveys with undocumented data density. This makes quantitative comparison to the 2006 mapping impossible, as actual elevations of the bottom cannot be determined. As part of a lake assessment of all large Iowa lakes in 2004, the Iowa State University Limnology Lab created a grid from the 1979 mapping and compiled physical characteristics of DeSoto Lake in a report (Bachmann, 1994). The grid is interpolated from contour data, does not indicate water surface elevations, and cannot be used to calculate sedimentation rates.
2
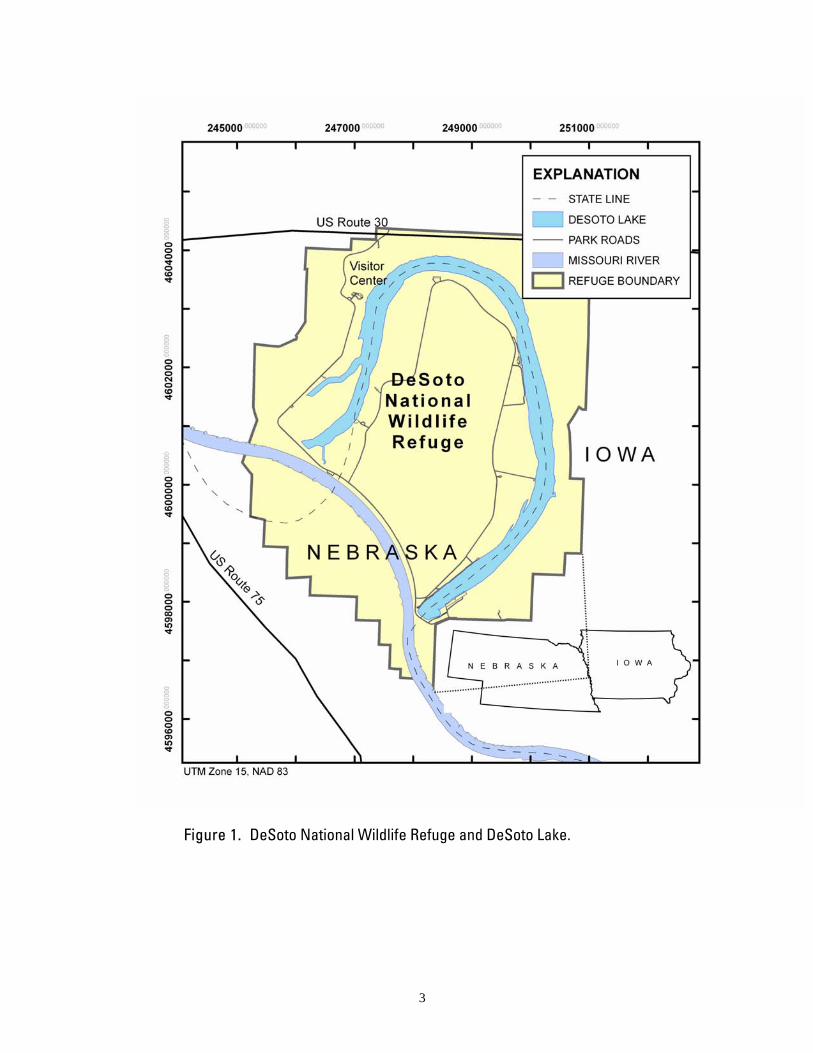
Figure 1. DeSoto National Wildlife Refuge and DeSoto Lake.
3
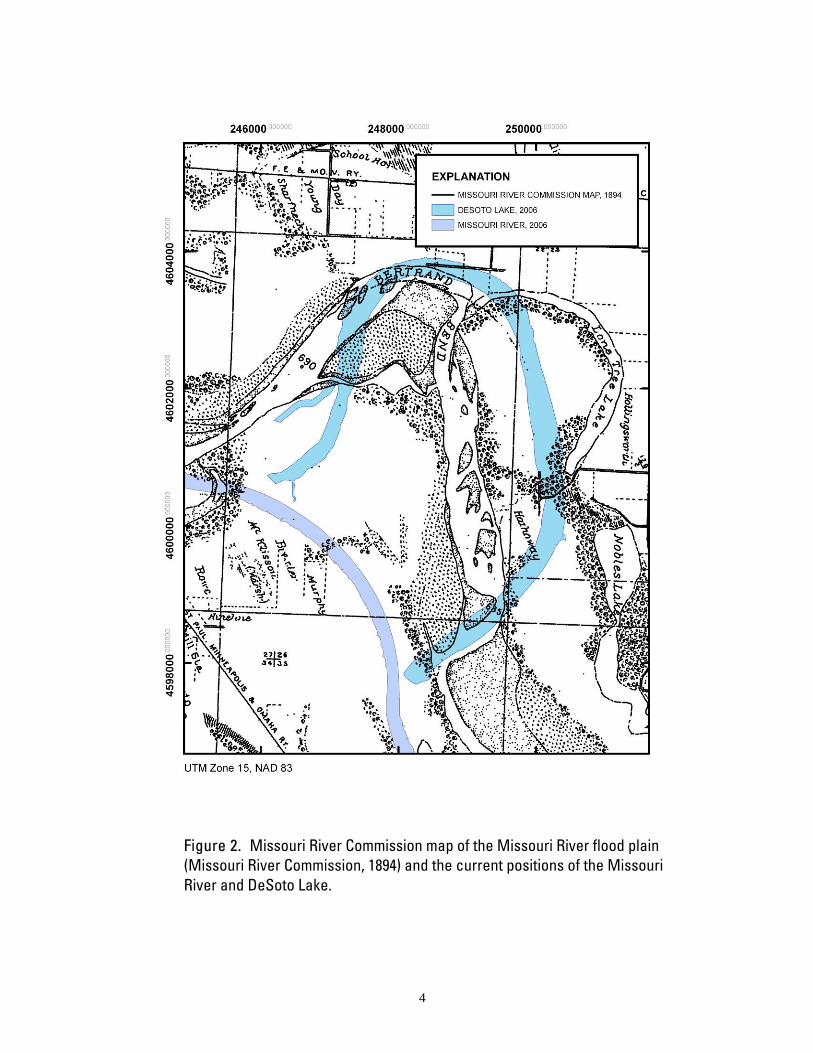
Figure 2. Missouri River Commission map of the Missouri River flood plain (Missouri River Commission, 1894) and the current positions of the Missouri River and DeSoto Lake.
4
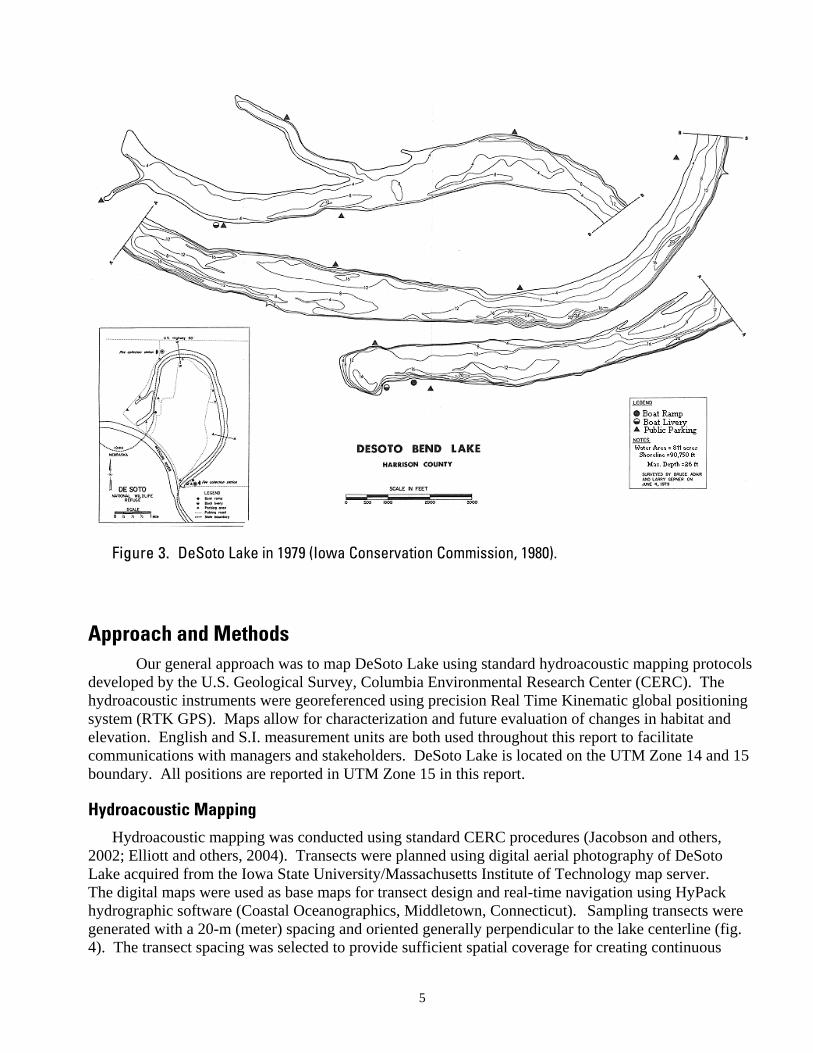
Figure 3. DeSoto Lake in 1979 (Iowa Conservation Commission, 1980).
Approach and Methods Our general approach was to map DeSoto Lake using standard hydroacoustic mapping protocols
developed by the U.S. Geological Survey, Columbia Environmental Research Center (CERC). The hydroacoustic instruments were georeferenced using precision Real Time Kinematic global positioning system (RTK GPS). Maps allow for characterization and future evaluation of changes in habitat and elevation. English and S.I. measurement units are both used throughout this report to facilitate communications with managers and stakeholders. DeSoto Lake is located on the UTM Zone 14 and 15 boundary. All positions are reported in UTM Zone 15 in this report.
Hydroacoustic Mapping
Hydroacoustic mapping was conducted using standard CERC procedures (Jacobson and others, 2002; Elliott and others, 2004). Transects were planned using digital aerial photography of DeSoto Lake acquired from the Iowa State University/Massachusetts Institute of Technology map server. The digital maps were used as base maps for transect design and real-time navigation using HyPack hydrographic software (Coastal Oceanographics, Middletown, Connecticut). Sampling transects were generated with a 20-m (meter) spacing and oriented generally perpendicular to the lake centerline (fig. 4). The transect spacing was selected to provide sufficient spatial coverage for creating continuous
5
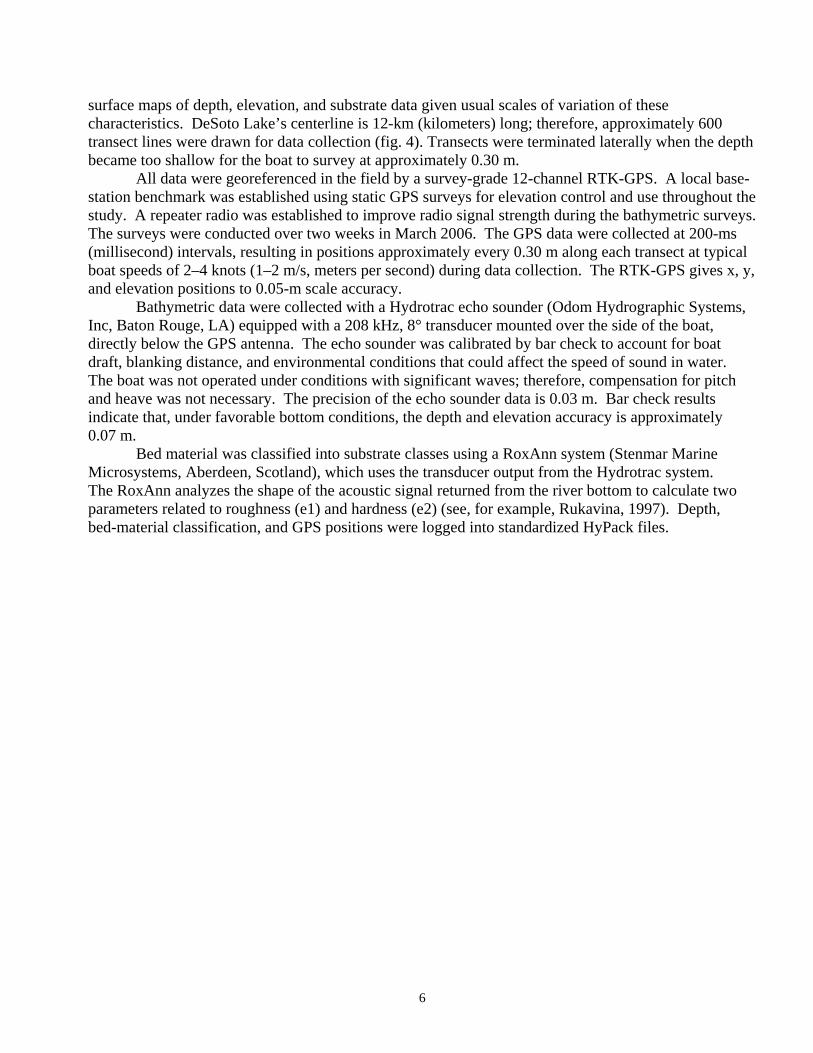
surface maps of depth, elevation, and substrate data given usual scales of variation of these characteristics. DeSoto Lake’s centerline is 12-km (kilometers) long; therefore, approximately 600 transect lines were drawn for data collection (fig. 4). Transects were terminated laterally when the depth became too shallow for the boat to survey at approximately 0.30 m.
All data were georeferenced in the field by a survey-grade 12-channel RTK-GPS. A local base-station benchmark was established using static GPS surveys for elevation control and use throughout the study. A repeater radio was established to improve radio signal strength during the bathymetric surveys. The surveys were conducted over two weeks in March 2006. The GPS data were collected at 200-ms (millisecond) intervals, resulting in positions approximately every 0.30 m along each transect at typical boat speeds of 2–4 knots (1–2 m/s, meters per second) during data collection. The RTK-GPS gives x, y, and elevation positions to 0.05-m scale accuracy.
Bathymetric data were collected with a Hydrotrac echo sounder (Odom Hydrographic Systems, Inc, Baton Rouge, LA) equipped with a 208 kHz, 8° transducer mounted over the side of the boat, directly below the GPS antenna. The echo sounder was calibrated by bar check to account for boat draft, blanking distance, and environmental conditions that could affect the speed of sound in water. The boat was not operated under conditions with significant waves; therefore, compensation for pitch and heave was not necessary. The precision of the echo sounder data is 0.03 m. Bar check results indicate that, under favorable bottom conditions, the depth and elevation accuracy is approximately 0.07 m.
Bed material was classified into substrate classes using a RoxAnn system (Stenmar Marine Microsystems, Aberdeen, Scotland), which uses the transducer output from the Hydrotrac system. The RoxAnn analyzes the shape of the acoustic signal returned from the river bottom to calculate two parameters related to roughness (e1) and hardness (e2) (see, for example, Rukavina, 1997). Depth, bed-material classification, and GPS positions were logged into standardized HyPack files.
6
Figure 4. Transects created for data collection using a 20-m line spacing.
7
Data Reduction and Maps
Bathymetry
Depth data were edited using a routine included with HyPack to remove spurious reflections from water-column turbulence, vegetation, or fish, and to correct for places where bottom conditions prevented a good digitization. Following editing for accuracy and content, the datasets were exported from HyPack as comma-delimited files containing data of UTM northing and easting, depth, elevation, and substrate for each data point.
A Perl script (Practical Extraction and Report Language, ActiveState Corporation, Vancouver, British Columbia) was used to edit, format, and prepare the comma-delimited files for grid creation. Surfaces were interpolated using Surfer 7 (Golden Software, Inc., Golden Colorado) by kriging, a standard surface interpolation method. An eight quadrant search was used against the 20-m spacing of transects. Spurious data points were eliminated from consideration and the output grid resolution was set to 5 m. A blanking file was then used to clip the interpolated grid to the extent of the input dataset. The Surfer 7 grids were exported as ASCII files and then added to an ArcMap (ESRI, Redlands, Calif.) project as a table. Each table was added to a view as a point-event theme and converted to a 5-m grid.
Elevation
Elevations were obtained by calculating the orthometric height of the RTK antenna using the Geoid 03 model and the NAVD 88 vertical datum. Antenna elevations were converted from ellipsoid height to orthometric height by using a modified version of the Geoid 03 model. The Geoid 03 model was re-gridded at 5 m, the same resolution of the data and added to the orthometric height to allow continuous water-surface elevation corrections. Elevations of the channel bottom were then calculated by subtracting the distance from the antenna to the water surface, the calibrated draft of the echo sounder transducer, and depth recorded by the echo sounder from the antenna elevation. These data were supplemented by ground-survey data collected with a pole-mounted hand-held RTK unit. Points were taken in shallow areas by wading up to 0.75-m deep at the edge of water, and on any emergent landforms of interest such as sandbars or low-lying temporally flooded areas.
Elevation data were further supplemented by data points from a digital terrain model for the Missouri River flood-plain region acquired from the U.S. Army Corps of Engineers. These points were collected using photogrammetric techniques from 1999 aerial orthophotography in the flood plain and 1994–1995 bathymetric surveys in the Missouri River (fig. 5). The flood-plain data consist of spot points and breaklines, with a higher point density on linear features in the flood plain (such as roads and levees). The Missouri River data consist of cross sections spaced approximately every 500 ft. The points have a root mean square error (RMSE) of 0.67–1.33 ft. These points were reprojected and joined with the points collected in the bathymetric and ground surveys to create a detailed Triangular Irregular Network (TIN) of elevation. The Missouri River points were separated from the main flood-plain dataset and breaklines were added to improve interpolation. A 5-m grid in the Missouri River was created by krigging in ArcMap. The TIN of the flood plain was then converted to an ESRI grid with 5-m spacing and merged with the Missouri River grid. The resulting flood-plain grid was then merged with the Missouri River grid and the elevation grid created for DeSoto Lake to create an elevation grid of the DeSoto NWR and adjacent lands. All elevation data are reported in NAVD 88 using the GEOID 03 model for conversion from ellipsoid height.
8
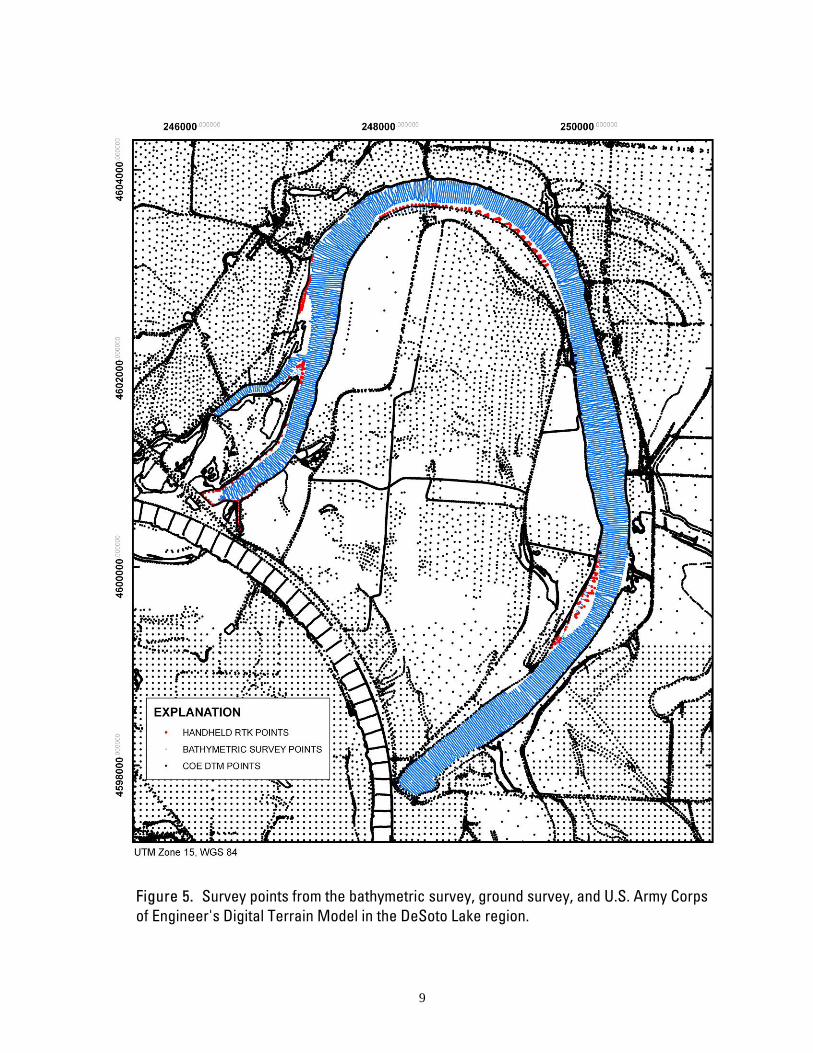
Figure 5. Survey points from the bathymetric survey, ground survey, and U.S. Army Corps of Engineer's Digital Terrain Model in the DeSoto Lake region.
9
Substrate
Raw substrate roughness (e1) and hardness (e2) values were exported from HyPack. A Perl script was then used to transform the raw e1 and e2 values by taking the square root and multiplying by 100. The resulting integer values for e1 and e2 were imported into Surfer 7 for surface interpolation. These files were also clipped using a blanking file, and imported as event themes and converted to 5-m grids in ArcMap.
Grids for roughness, hardness, and depth were classified into substrate classes using a multivariate unsupervised classification routine in ArcInfo (Elliott and others, 2004). Four or more distinct classes were classified through unsupervised classification. Interpretation of this classification matrix was aided by comparison to other datasets specific to the echo sounder/transducer system and to the bottom conditions of the Missouri River. Bottom cores were also taken intermittently to a depth of 0.15 m for substrate classification verification.
Results
Depth Map
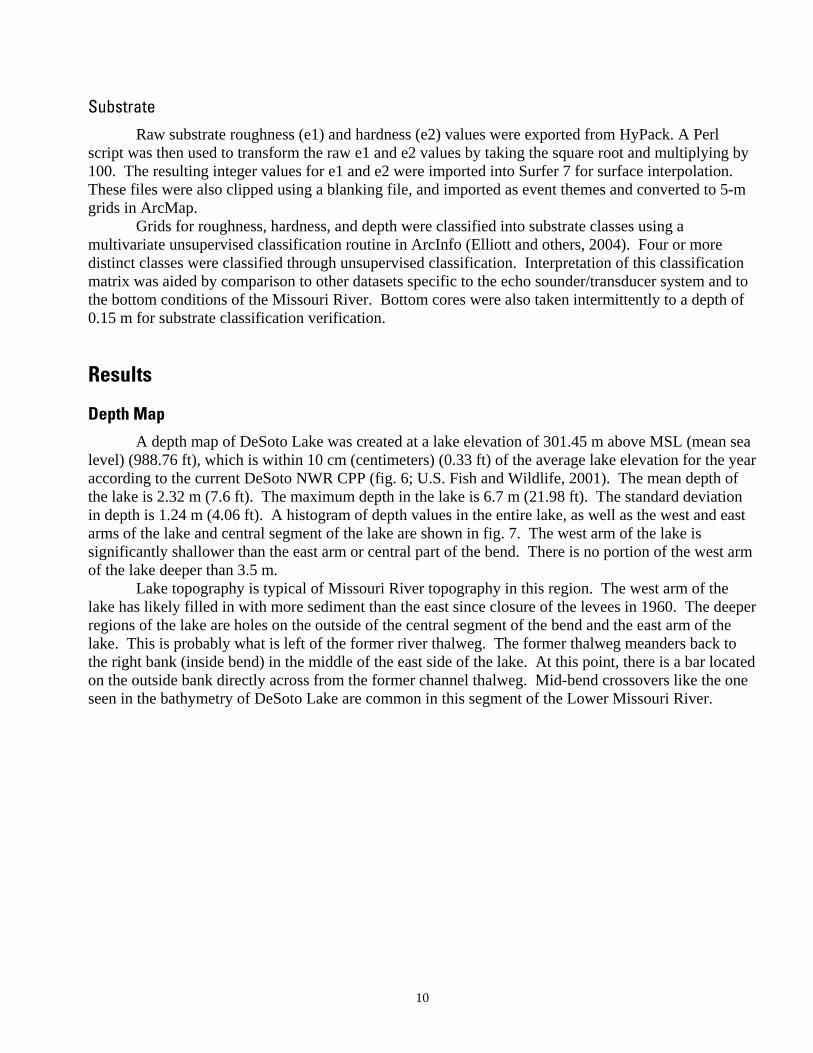
A depth map of DeSoto Lake was created at a lake elevation of 301.45 m above MSL (mean sea level) (988.76 ft), which is within 10 cm (centimeters) (0.33 ft) of the average lake elevation for the year according to the current DeSoto NWR CPP (fig. 6; U.S. Fish and Wildlife, 2001). The mean depth of the lake is 2.32 m (7.6 ft). The maximum depth in the lake is 6.7 m (21.98 ft). The standard deviation in depth is 1.24 m (4.06 ft). A histogram of depth values in the entire lake, as well as the west and east arms of the lake and central segment of the lake are shown in fig. 7. The west arm of the lake is significantly shallower than the east arm or central part of the bend. There is no portion of the west arm of the lake deeper than 3.5 m.
Lake topography is typical of Missouri River topography in this region. The west arm of the lake has likely filled in with more sediment than the east since closure of the levees in 1960. The deeper regions of the lake are holes on the outside of the central segment of the bend and the east arm of the lake. This is probably what is left of the former river thalweg. The former thalweg meanders back to the right bank (inside bend) in the middle of the east side of the lake. At this point, there is a bar located on the outside bank directly across from the former channel thalweg. Mid-bend crossovers like the one seen in the bathymetry of DeSoto Lake are common in this segment of the Lower Missouri River.
10
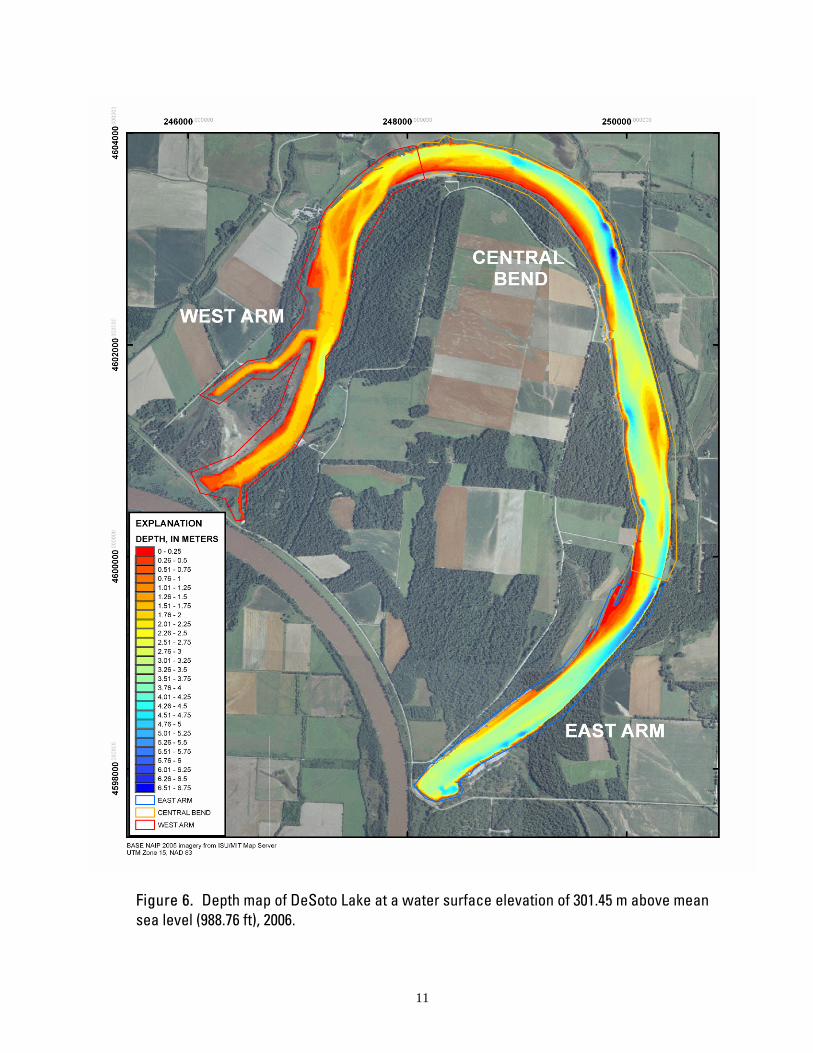
Figure 6. Depth map of DeSoto Lake at a water surface elevation of 301.45 m above mean sea level (988.76 ft), 2006.
11
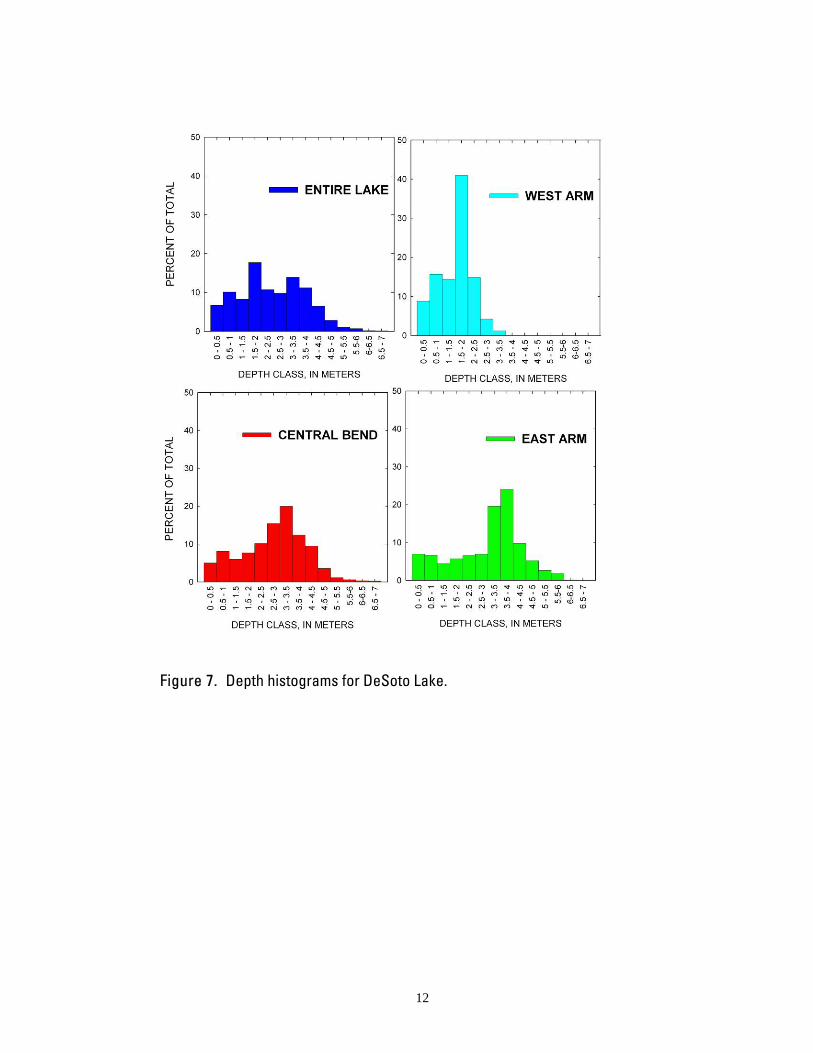
Figure 7. Depth histograms for DeSoto Lake.
12
Elevation Maps
Maps of elevations in DeSoto Lake and the DeSoto NWR region are shown in figures 8 and 9. Individual surveyed transects tied to elevations are stored in archival formats that can be used for a precise transect-by-transect assessment of sedimentation rates during subsequent resurveys of the lake.
Substrate Map
The bottom materials of DeSoto Lake are primarily soft silt and fine sand (fig. 10). No data are available in depths shallower than 1.3 m, which is due to instrument range. Sampling conducted to ground-truth substrate data found clay to be very rare in the DeSoto Lake; fines consisted mostly of silt and fine-sand sediment with some organic matter. Harder substrates included compacted silt and fine to coarse sand. Hard and coarse sand were present in parts of the lake, particularly in the wide portion of the west arm of the lake and the central portion of the bend (table 1). Hard sand substrate is very rare in the east arm of the lake. This region was dominated by soft materials, mostly silt, fine sand, and organic matter. There is also a considerable amount of soft silt in the lake near the ditch outlets. This was verified by sampling. Fines were easily suspended in the water column in many shallow areas when disturbed by boat motion. These results are consistent with a high silt content (58.7 percent silt, 10.6 percent clay, and 30.7 percent sand) measured in the east arm of DeSoto Lake in a backwater- and water-quality study in the lake and adjacent backwaters (DeLucchi and others, 2003).
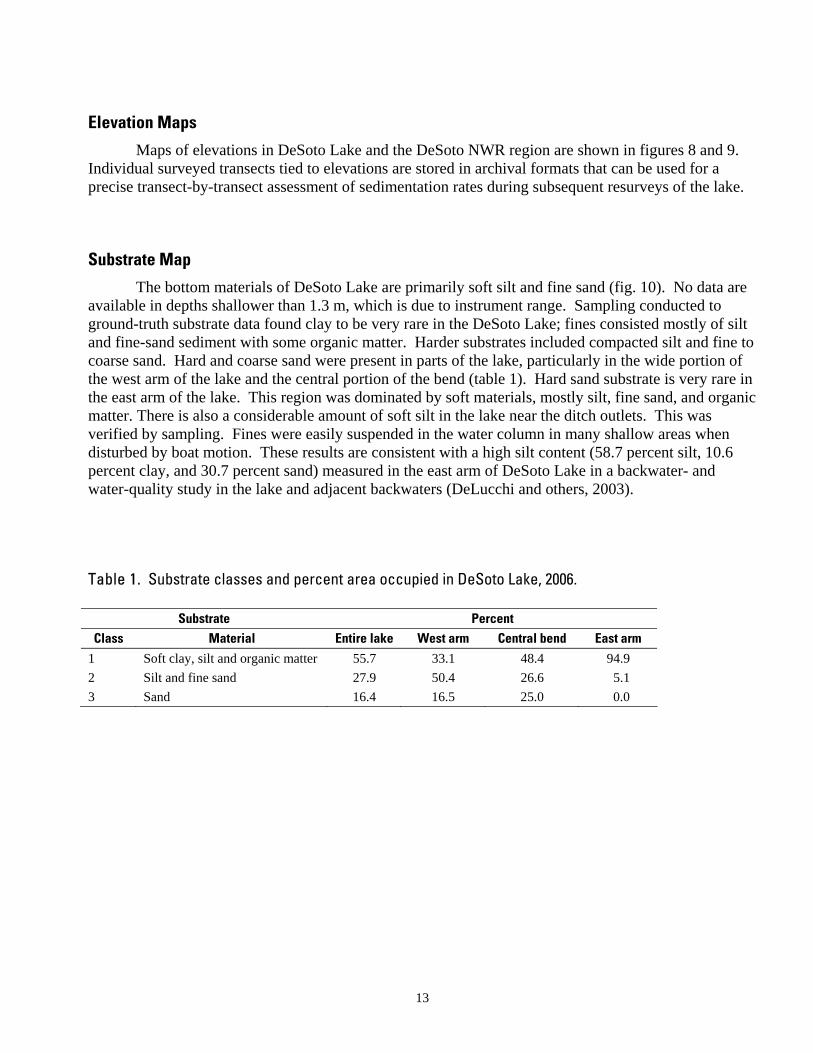
Table 1. Substrate classes and percent area occupied in DeSoto Lake, 2006.
Substrate Percent Class Material Entire lake West arm Central bend East arm
1 Soft clay, silt and organic matter 55.7 33.1 48.4 94.9 2 Silt and fine sand 27.9 50.4 26.6 5.1 3 Sand 16.4 16.5 25.0 0.0
13
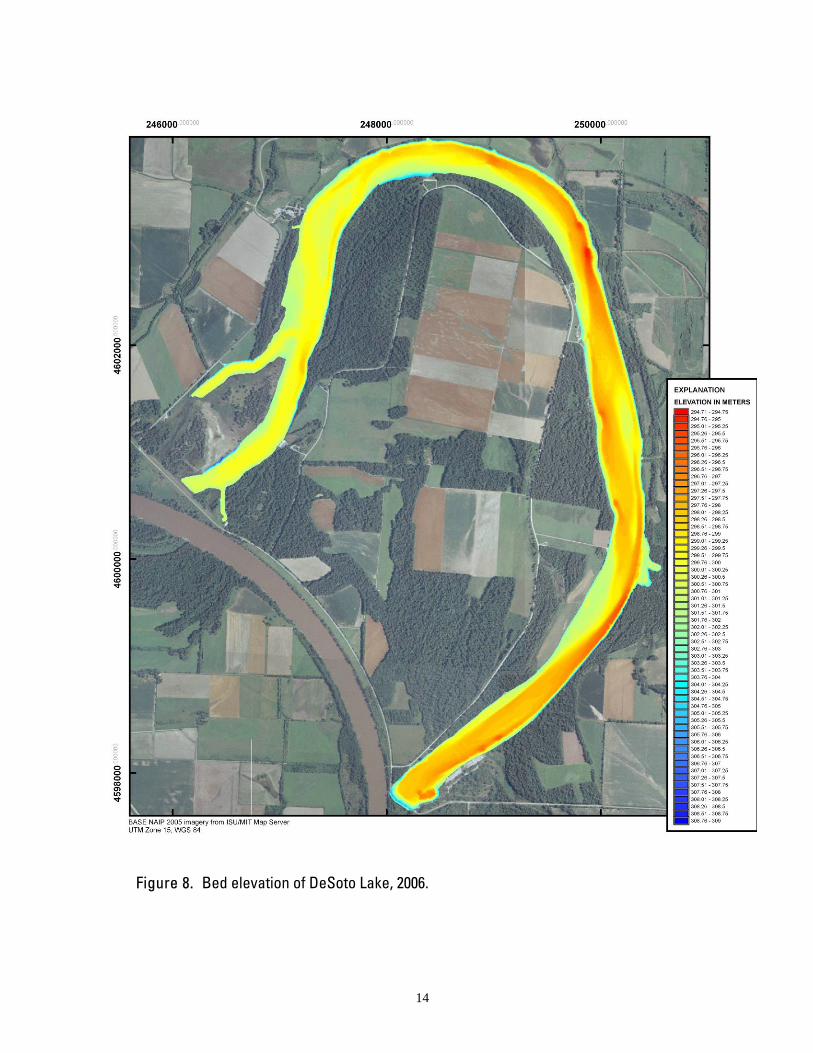
Figure 8. Bed elevation of DeSoto Lake, 2006.
14
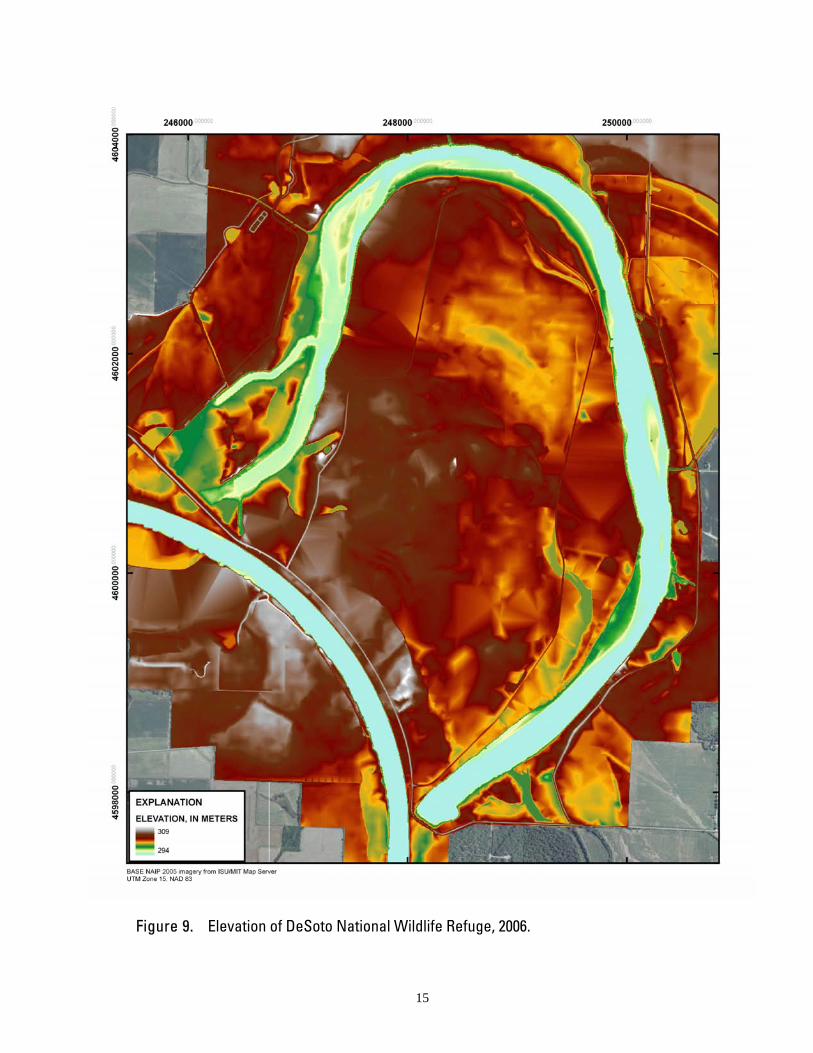
Figure 9. Elevation of DeSoto National Wildlife Refuge, 2006.
15
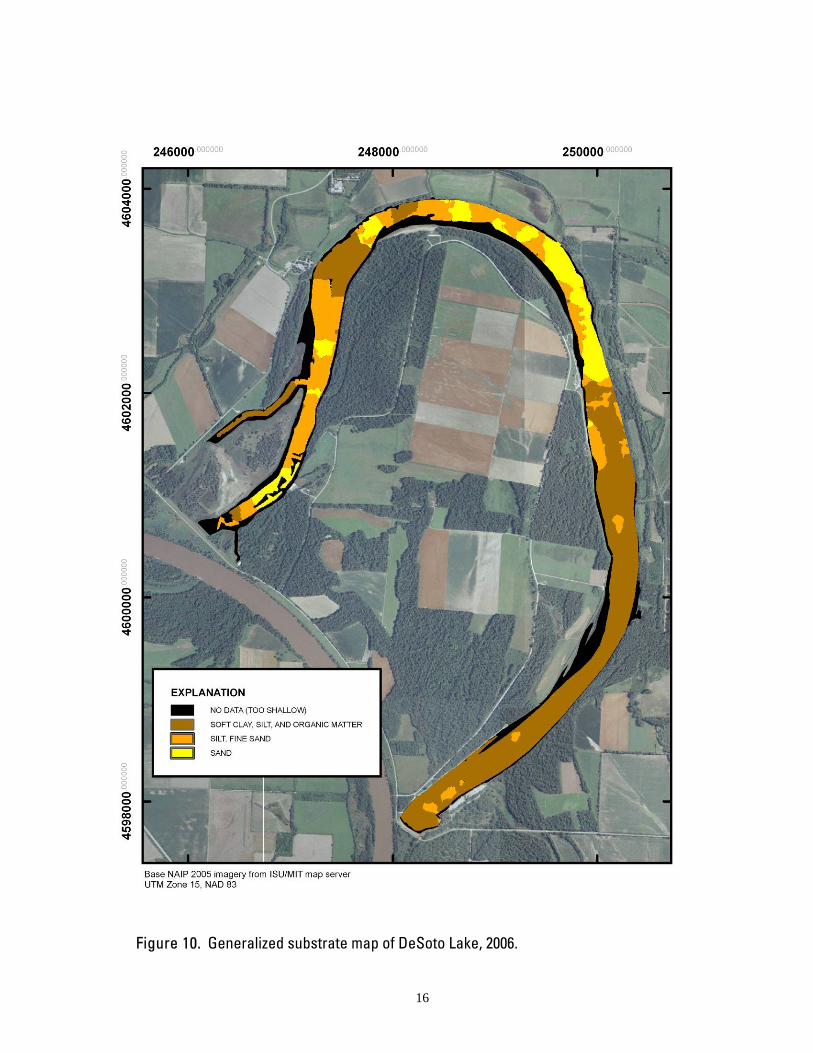
Figure 10. Generalized substrate map of DeSoto Lake, 2006.
16
Fish Habitat Structures Map
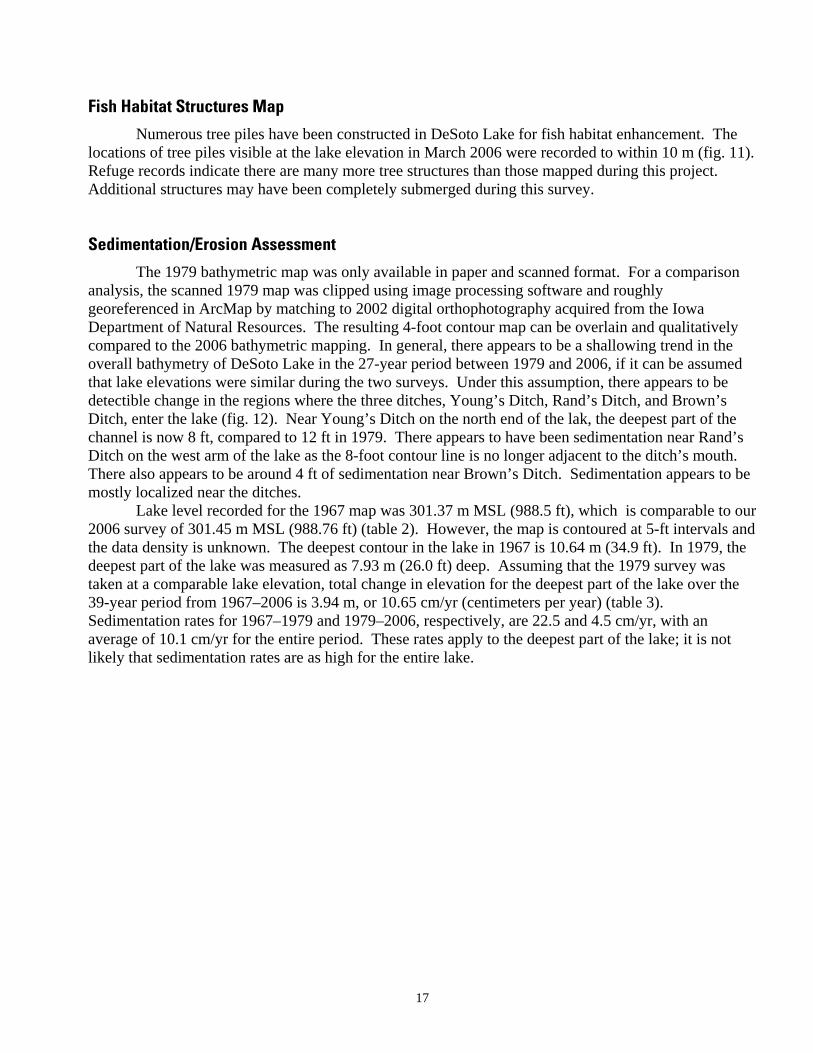
Numerous tree piles have been constructed in DeSoto Lake for fish habitat enhancement. The locations of tree piles visible at the lake elevation in March 2006 were recorded to within 10 m (fig. 11). Refuge records indicate there are many more tree structures than those mapped during this project. Additional structures may have been completely submerged during this survey.
Sedimentation/Erosion Assessment
The 1979 bathymetric map was only available in paper and scanned format. For a comparison analysis, the scanned 1979 map was clipped using image processing software and roughly georeferenced in ArcMap by matching to 2002 digital orthophotography acquired from the Iowa Department of Natural Resources. The resulting 4-foot contour map can be overlain and qualitatively compared to the 2006 bathymetric mapping. In general, there appears to be a shallowing trend in the overall bathymetry of DeSoto Lake in the 27-year period between 1979 and 2006, if it can be assumed that lake elevations were similar during the two surveys. Under this assumption, there appears to be detectible change in the regions where the three ditches, Young’s Ditch, Rand’s Ditch, and Brown’s Ditch, enter the lake (fig. 12). Near Young’s Ditch on the north end of the lak, the deepest part of the channel is now 8 ft, compared to 12 ft in 1979. There appears to have been sedimentation near Rand’s Ditch on the west arm of the lake as the 8-foot contour line is no longer adjacent to the ditch’s mouth. There also appears to be around 4 ft of sedimentation near Brown’s Ditch. Sedimentation appears to be mostly localized near the ditches.
Lake level recorded for the 1967 map was 301.37 m MSL (988.5 ft), which is comparable to our 2006 survey of 301.45 m MSL (988.76 ft) (table 2). However, the map is contoured at 5-ft intervals and the data density is unknown. The deepest contour in the lake in 1967 is 10.64 m (34.9 ft). In 1979, the deepest part of the lake was measured as 7.93 m (26.0 ft) deep. Assuming that the 1979 survey was taken at a comparable lake elevation, total change in elevation for the deepest part of the lake over the 39-year period from 1967–2006 is 3.94 m, or 10.65 cm/yr (centimeters per year) (table 3). Sedimentation rates for 1967–1979 and 1979–2006, respectively, are 22.5 and 4.5 cm/yr, with an average of 10.1 cm/yr for the entire period. These rates apply to the deepest part of the lake; it is not likely that sedimentation rates are as high for the entire lake.
17
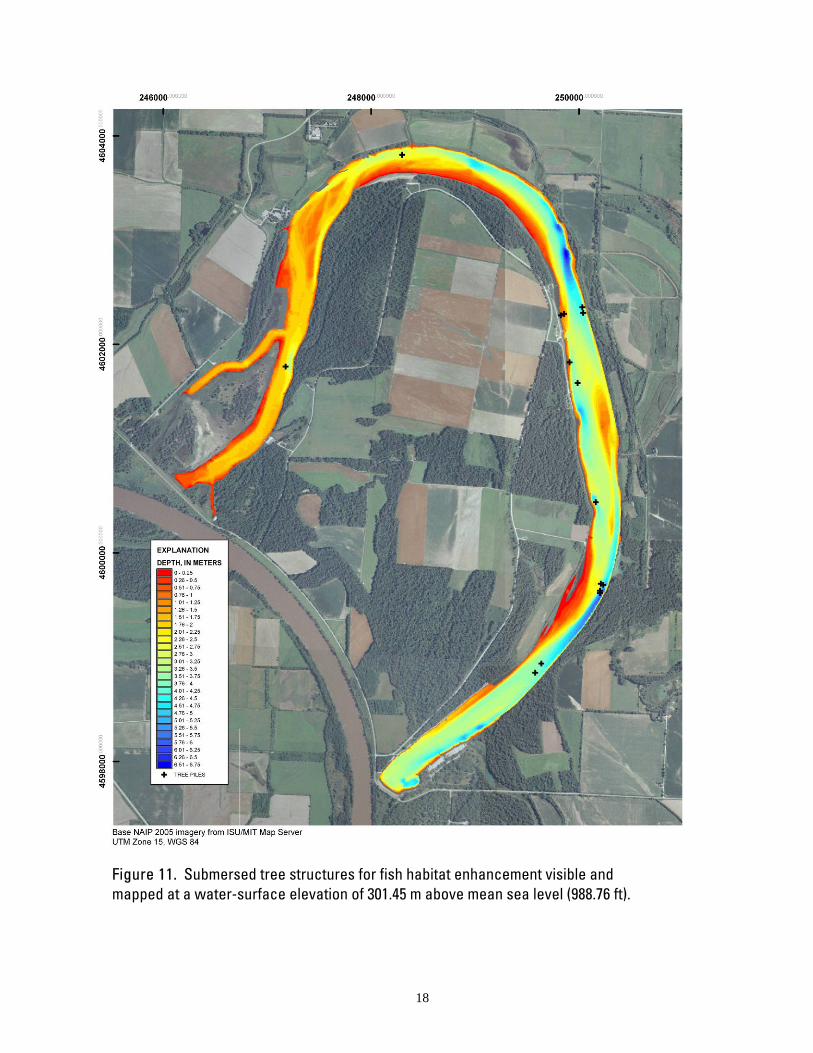
Figure 11. Submersed tree structures for fish habitat enhancement visible and mapped at a water-surface elevation of 301.45 m above mean sea level (988.76 ft).
18
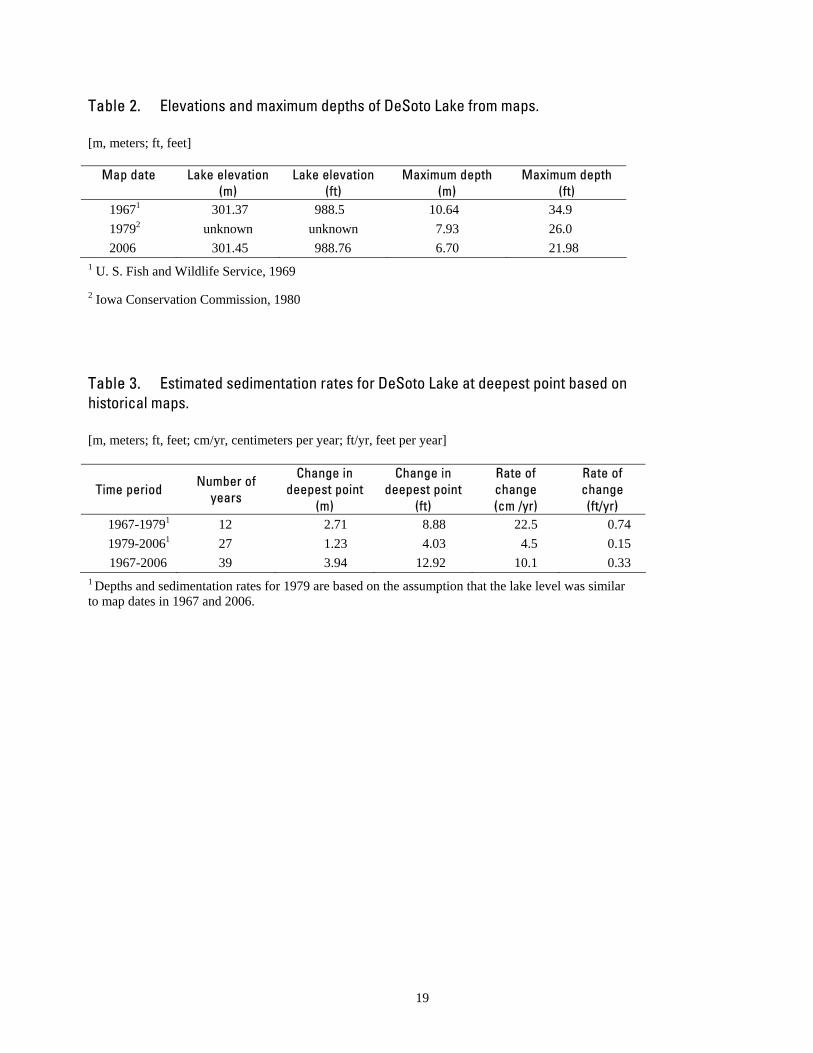
Table 2. Elevations and maximum depths of DeSoto Lake from maps.
[m, meters; ft, feet]
Map date Lake elevation (m)
Lake elevation (ft)
Maximum depth (m)
Maximum depth (ft)
19671 301.37 988.5 10.64 34.9 19792 unknown unknown 7.93 26.0 2006 301.45 988.76 6.70 21.98
1 U. S. Fish and Wildlife Service, 1969
2 Iowa Conservation Commission, 1980
Table 3. Estimated sedimentation rates for DeSoto Lake at deepest point based on historical maps. [m, meters; ft, feet; cm/yr, centimeters per year; ft/yr, feet per year]
Time period Number of
years
Change in deepest point
(m)
Change in deepest point
(ft)
Rate of change (cm /yr)
Rate of change (ft/yr)
1967-19791 12 2.71 8.88 22.5 0.74 1979-20061 27 1.23 4.03 4.5 0.15 1967-2006 39 3.94 12.92 10.1 0.33
1 Depths and sedimentation rates for 1979 are based on the assumption that the lake level was similar to map dates in 1967 and 2006.
19
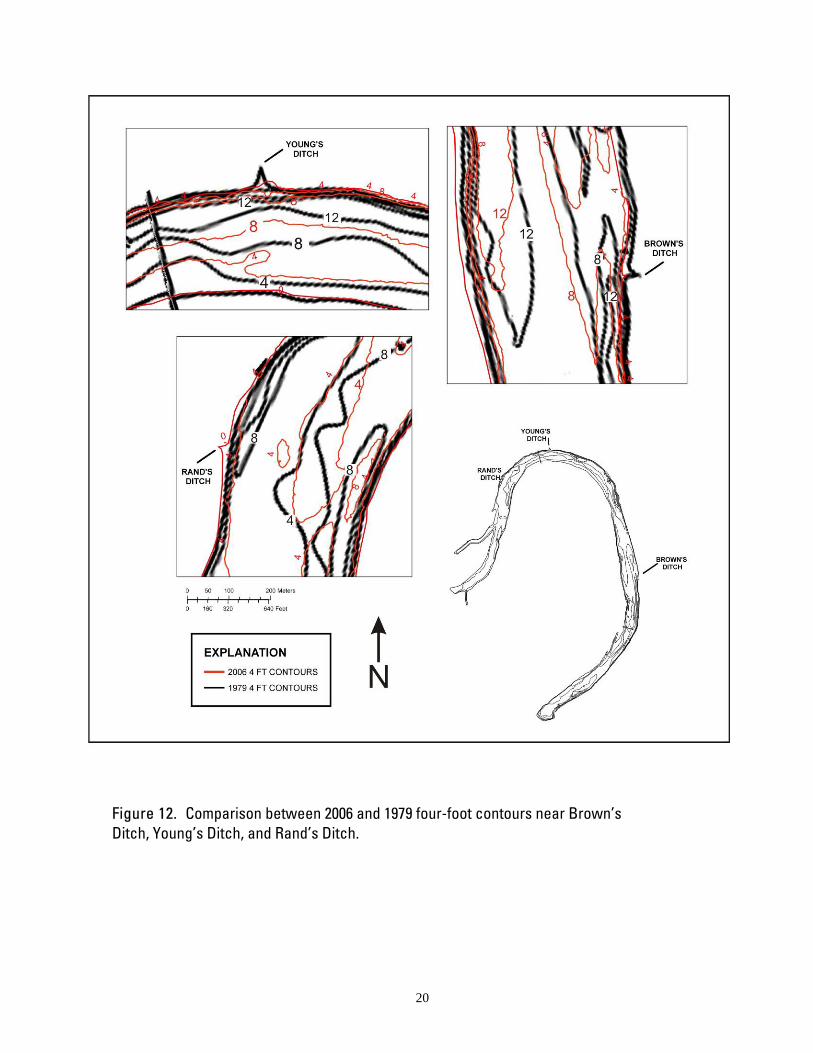
Figure 12. Comparison between 2006 and 1979 four-foot contours near Brown’s Ditch, Young’s Ditch, and Rand’s Ditch.
20
Discussion In the 46 years since the lake was cut off from the Missouri River channel, DeSoto Lake still
retains many features from the Missouri River. According to the DeSoto NWR Comprehensive Conservation Plan, the ideal lake level for DeSoto Lake fluctuates between 300.8 m MSL (986.5 ft) and 301.7 m MSL (989.5 ft) (U.S. Fish and Wildlife Service, 2001). This fluctuation affects the entire perimeter of the lake, as well as specific shallow areas on the inside of the bend and the west arm of the lake (fig. 12). Within the operating conditions between 300.8 m MSL (986.62 ft) and 301.7 m MSL (989.58 ft), there is a difference in 633,425 square meters (156.52 acres), or 16.2 percent of the total lake area below the 301.8-m contour line (fig. 13; table 4). Due to DeSoto Lake’s connection with the Missouri River, the refuge has a limited ability to regulate lake level (U.S. Fish and Wildlife Service, 2001). Under ideal conditions, lake levels are drawn down in the fall for waterfowl management and predation on forage fish (U.S. Fish and Wildlife Service, 2001). In the winter, lake levels are higher to reduce fish winterkills, and lake levels are reduced in the spring to accommodate spring runoff. When river levels are above the inlet elevation, it is no longer possible to manage lake levels and unfavorably high lake conditions can occur (U.S. Fish and Wildlife Service, 2001).
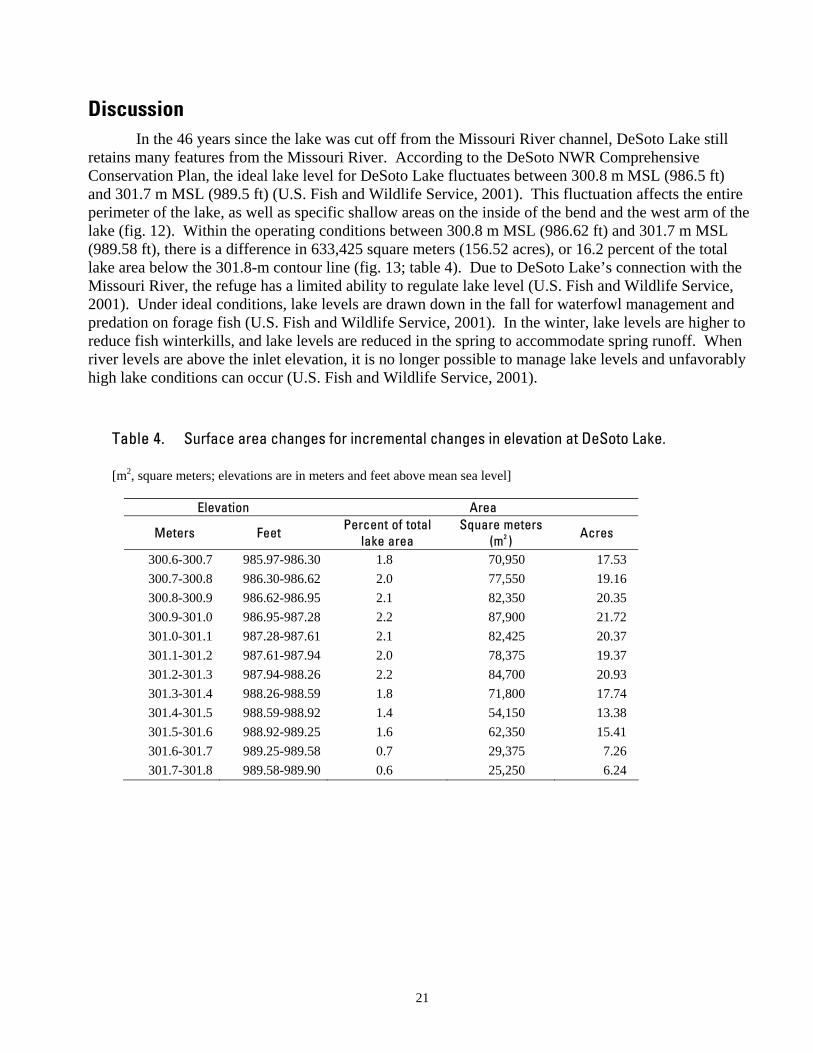
Table 4. Surface area changes for incremental changes in elevation at DeSoto Lake.
[m2, square meters; elevations are in meters and feet above mean sea level]
Elevation Area
Meters Feet Percent of total lake area
Square meters (m2 ) Acres
300.6-300.7 985.97-986.30 1.8 70,950 17.53 300.7-300.8 986.30-986.62 2.0 77,550 19.16 300.8-300.9 986.62-986.95 2.1 82,350 20.35 300.9-301.0 986.95-987.28 2.2 87,900 21.72 301.0-301.1 987.28-987.61 2.1 82,425 20.37 301.1-301.2 987.61-987.94 2.0 78,375 19.37 301.2-301.3 987.94-988.26 2.2 84,700 20.93 301.3-301.4 988.26-988.59 1.8 71,800 17.74 301.4-301.5 988.59-988.92 1.4 54,150 13.38 301.5-301.6 988.92-989.25 1.6 62,350 15.41 301.6-301.7 989.25-989.58 0.7 29,375 7.26 301.7-301.8 989.58-989.90 0.6 25,250 6.24
21
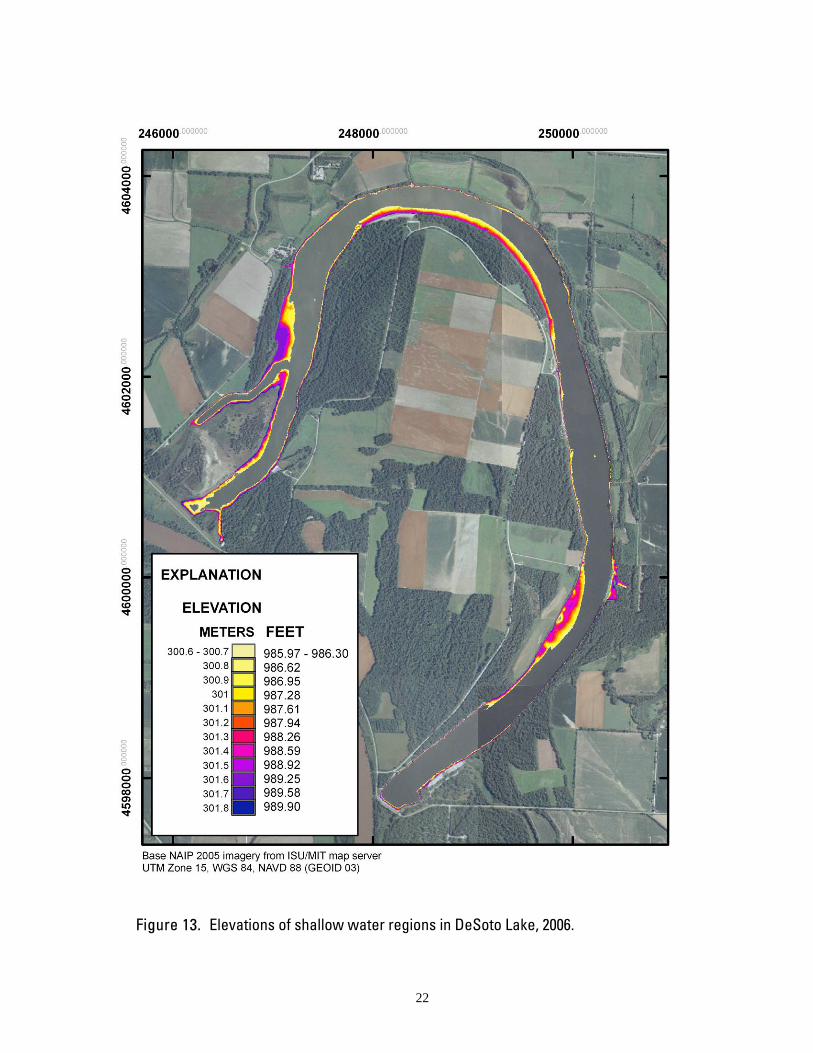
Figure 13. Elevations of shallow water regions in DeSoto Lake, 2006.
22
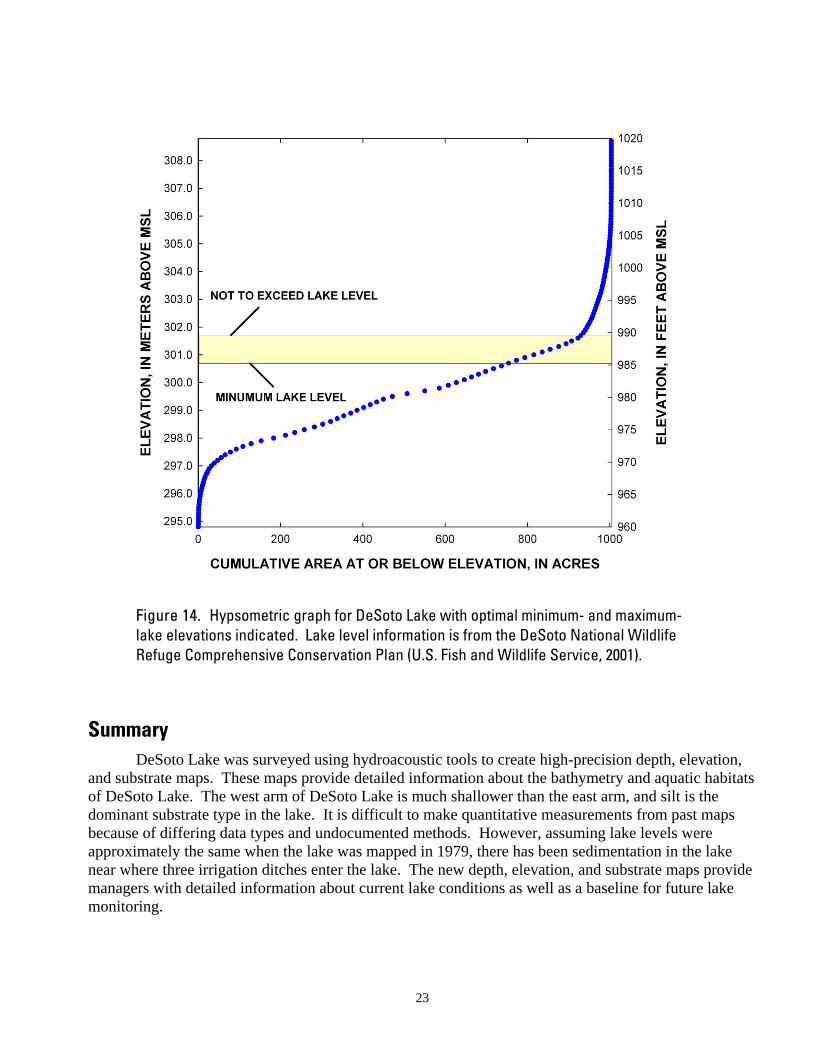
Figure 14. Hypsometric graph for DeSoto Lake with optimal minimum- and maximum- lake elevations indicated. Lake level information is from the DeSoto National Wildlife Refuge Comprehensive Conservation Plan (U.S. Fish and Wildlife Service, 2001).
Summary DeSoto Lake was surveyed using hydroacoustic tools to create high-precision depth, elevation,
and substrate maps. These maps provide detailed information about the bathymetry and aquatic habitats of DeSoto Lake. The west arm of DeSoto Lake is much shallower than the east arm, and silt is the dominant substrate type in the lake. It is difficult to make quantitative measurements from past maps because of differing data types and undocumented methods. However, assuming lake levels were approximately the same when the lake was mapped in 1979, there has been sedimentation in the lake near where three irrigation ditches enter the lake. The new depth, elevation, and substrate maps provide managers with detailed information about current lake conditions as well as a baseline for future lake monitoring.
23
References Cited Bachmann, R.W., Hoyman, T.A., Hatch, L.K., and Hutchins, B. P., 1994, A classification of Iowa’s
lakes for restoration: Ames, Iowa, Department of Animal Ecology, Iowa State University, 520 p. DeLucchi, C., Neal, T., Anderson, J., and Latella, I., 2003, Final report on backwater data collection:
Blair, Nebr., DeSoto National Wildlife Refuge Cooperative Agreement Number 301811J272. Elliott, C.M., Jacobson, R.B., and DeLonay, A.J., 2004, Physical aquatic habitat assessment, Fort
Randall segment of the Missouri River, Nebraska and South Dakota: U.S. Geological Survey Open-File Report 2004-1060, 80 p. On CD-ROM or online at: http://infolink.cr.usgs.gov/RSB/USGS_OFR_2004-1060/index.htm
Ferrell, John, 1996, Soundings–100 years of the Missouri River Navigation Project: Kansas City, Mo., U.S. Army Corps of Engineers, 171 p.
Iowa Conservation Commission, 1980, Map of DeSoto Bend Lake, Lake Contours. Jacobson, R.B., Laustrup, M.L., and Reuter, J.M., 2002, Habitat assessment, Missouri River at
Hermann, Missouri: U.S. Geological Survey Open-File Report 02-32, 22 p., 181 oversize maps. On CD-ROM or online at http://www.cerc.usgs.gov/pubs/Moriver/herm_hab.htm.
Missouri River Commission, 1894, Map of the Missouri River—from its mouth to Three Forks, Montana: Washington, D.C., Missouri River Commission, Plate 32 of 83, scale 1:63,360.
Rukavina, N.A., 1997, Substrate mapping in the Great Lakes nearshore with a RoxAnn acoustic sea-bed classification system, in Skafel, M.G., ed., Canadian Coastal Conference, Guelph, Ontario, 1997, [Proceedings], p. 338-349.
U.S. Fish and Wildlife Service, 1967, DeSoto Lake bottom contour map: U.S. Fish and Wildlife Service.
U.S. Fish and Wildlife Service, 1989, DeSoto National Wildlife Refuge fishery management plan: Columbia, Mo., U.S. Fish and Wildlife Service, 18 p.
U.S. Fish and Wildlife Service, 2001, DeSoto National Wildlife Refuge final comprehensive conservation plan, 2001: Fort Snelling, Minn., U.S. Fish and Wildlife Service, 257 p.
24