development of bilingualism and biliteracy from grade 3 to 5
TRANSCRIPT

THE DEVELOPMENT OF
BILINGUALISM AND BILITERACY
FROM GRADE 3 TO 5:
A SUMMARY OF FINDINGS FROM
THE CAL/CREDE STUDY OF TWO-WAY
IMMERSION EDUCATION
ELIZABETH R. HOWARD
DONNA CHRISTIANCENTER FOR APPLIED LINGUISTICS
FRED GENESEEMCGILL UNIVERSITY
center for research on education,
diversity & excellence
2004

All inquiries should be addressed to Dissemination Coordinator, CREDE/CAL, 4646 40th Street NW,Washington, DC 20016-1859.
©2004 by the Center for Research on Education, Diversity & Excellence, University of California, Santa Cruz
COLLABORATING INSTITUTIONS
ARC AssociatesBrown UniversityCalifornia State University, Long BeachCalifornia State University, San JoseCenter for Applied Linguistics (CAL)Center for Research on Evaluation, Standards, and Student Testing (CRESST)Claremont Graduate SchoolGeorge Mason UniversityJohns Hopkins UniversityLinguistic Minority Research InstituteNational Center for Early Development and Learning (NCEDL)RANDTERCUniversity of ArizonaUniversity of California, DavisUniversity of California, Los AngelesUniversity of California, San DiegoUniversity of California, Santa BarbaraUniversity of California, Santa CruzUniversity of Colorado, BoulderUniversity of HawaiiUniversity of HoustonUniversity of LouisvilleUniversity of MemphisUniversity of Southern CaliforniaWestern Washington University
Research Report No. 13
Editing: Vickie LewellingProduction, cover & interior design: SAGARTdesign
This report was prepared with funding from the Center for Research on Education, Diversity & Excellence(CREDE), a national research center funded by the Institute of Education Sciences (IES) of the U.S.Department of Education, under Cooperative Agreement No. R306A60001-96 (July 1, 1996-June 30, 2003).The findings and opinions expressed here are those of the author(s) and do not necessarily reflect thepositions or policies of IES.

CENTER FOR RESEARCH ON EDUCATION, DIVERSITY & EXCELLENCE (CREDE)
The Center for Research on Education, Diversity & Excellence is funded by the Institute ofEducation Sciences of the U.S. Department of Education to assist the nation’s diversestudents at risk of educational failure to achieve academic excellence. The Center isoperated by the University of California, Santa Cruz, through the University of California’sstatewide Linguistic Minority Research Project, in collaboration with a number of otherinstitutions nationwide.
The Center is designed to move issues of risk, diversity, and excellence to the forefront ofdiscussions concerning educational research, policy, and practice. Central to its mission,CREDE’s research and development focus on critical issues in the education of linguisticand cultural minority students and students placed at risk by factors of race, poverty, andgeographic location. CREDE’s research program is based on a sociocultural framework thatis sensitive to diverse cultures and languages, but powerful enough to identify the greatcommonalities that unite people.
CREDE operates 30 research projects under 6 programmatic strands:
• Research on language learning opportunities highlights exemplary instructionalpractices and programs.
• Research on professional development explores effective practices for teachers,paraprofessionals, and principals.
• Research on the interaction of family, peers, school, and community examinestheir influence on the education of students placed at risk.
• Research on instruction in context explores the embedding of teaching andlearning in the experiences, knowledge, and values of the students, their families,and communities. The content areas of science and mathematics are emphasized.
• Research on integrated school reform identifies and documents successfulinitiatives.
• Research on assessment investigates alternative methods for evaluating theacademic achievement of language minority students.
Dissemination is a key feature of Center activities. Information on Center research ispublished in two series of reports. Research Reports describe ongoing research or presentthe results of completed research projects. They are written primarily for researchersstudying various aspects of the education of students at risk of educational failure.Educational Practice Reports discuss research findings and their practical application inclassroom settings. They are designed primarily for teachers, administrators, and policymakers responsible for the education of students from diverse backgrounds.

NoteThe authors wish to thank Gheorghe Doros and two anonymous reviewers for theirfeedback on an earlier version of this publication.

AbstractThis report presents the findings of the first two-way immersion (TWI) study to look atthe language and literacy development of both native Spanish speakers and nativeEnglish speakers, over time, in a multidimensional way, and from a national perspec-tive. The results discussed here offer important insights into key issues such as levelsof language and literacy attainment in the upper elementary grades, growth in languageand literacy ability in two languages over time, and the nature of the relationshipbetween language and literacy growth in a child’s first and second languages. Develop-ing a better understanding of all these issues is central to the continued success oftwo-way immersion programs.


1
IntroductionOver the past decade, there has been tremendous growth in the number of two-wayimmersion (TWI) education programs in the United States, from 30 programs in 1987 to266 programs in 2002 (Center for Applied Linguistics, 2002). The goals of TWI programs,which include bilingualism, biliteracy, and cross-cultural competence, added to the standardeducational goal of academic achievement, serve to prepare all students to functionsuccessfully in an increasingly global society. As a result, the number of TWI programs islikely to continue to increase, as more districts implement pilot programs, and districts withestablished programs move toward districtwide implementation.
There is great variation within the TWI model, but all programs share three centralcharacteristics: 1) Native English speakers and language-minority students from asingle language group are integrated for all or most of the school day, 2) both Englishand the minority language (usually Spanish) are used for instruction, and 3) bilingualismand biliteracy,1 in addition to grade-level academic performance, are goals for allstudents (Christian, 1994; Howard & Christian, 2002). Because the TWI model inte-grates students from diverse backgrounds and promotes bilingualism and biliteracy forboth language-minority and language-majority students, it is frequently seen as asolution to the problems of segregation and stigmatization that often accompanyprograms for language-minority students, such as English as a Second Language (ESL)pullout and transitional bilingual education (TBE). Likewise, it is seen as a favorableeducational approach for promoting second language acquisition and cross-culturalawareness among native English speaking students.
TWI programs vary in two key ways (Howard & Christian, 2002): by program modeland by language of initial literacy instruction. Program model refers to the amount ofinstruction that is provided through the minority language in the elementary grades.The two primary models are commonly referred to as 90/10 and 50/50. In a 90/10program, 90% of instruction in kindergarten and first grade is provided through theminority language, while 10% of instruction is provided through English. Over thecourse of the elementary grades, these ratios change gradually until reaching a 50/50balance by about fourth grade. Accompanying the increase in TWI programs is greaterexperimentation with the models. For example, there are many programs that adoptwhat is sometimes referred to as a modified 90/10 approach. In this approach, Englishis used as the language of instruction slightly more than 10% of the time. Because ofsuch variation, it is easier to refer to all programs that use the minority language 70%or more of the time as minority language dominant, or in the case of this study,Spanish dominant.
In a 50/50 model, instruction through both English and the minority language isconducted equally at all grade levels. This division most frequently occurs on a half-day,half-day basis, with students working in one language in the morning and the otherlanguage in the afternoon. In some programs, it occurs on an alternating day oralternating week schedule. Finally, in addition to the two primary models of 90/10 (orSpanish dominant) and 50/50, there is a third program model that is much less com-mon. In this model, language-minority students and language-majority students areseparated for native language instruction in the morning and integrated for instructionthrough both languages in the afternoon. Around third grade, the two groups areintegrated all day, and instruction is divided fairly equally across English and theminority language. This variation is referred to as a differentiated model (Howard &Christian, 2002), because language minority students receive a different (greater)amount of instruction through the minority language in the primary grades than nativeEnglish speakers do. The important point to keep in mind is that all of the variation in

2
program models occurs during the primary grades. By the upper elementary grades,the program models all take on the characteristics of a 50/50 program.
The second key variable in TWI programs is the language of initial literacy instruction.In this area, there are again three main alternatives. The first is Spanish only, and thismeans that all students, both native Spanish speakers and native English speakers,receive initial literacy instruction through Spanish, with formal literacy instruction inEnglish being added to the curriculum in third grade. This option is most frequentlyemployed with a classic 90/10 approach. The second option is to provide simultaneousinitial literacy instruction in both English and Spanish to all students. This approach ismost frequently paired with a classic 50/50 model, where students receive formalEnglish literacy instruction during English instructional time, and Spanish literacyinstruction during Spanish literacy time. The third basic approach is to provide initialliteracy instruction through the native language only. In this approach, students areseparated into native language groups, and native Spanish speakers receive initialliteracy instruction through Spanish while native English speakers receive initial literacyinstruction through English. It can be used with either a Spanish dominant or a 50/50model. Like the Spanish only approach, this is only the path of initial literacy instruc-tion; all students are provided with formal literacy instruction in both languages bythird grade.
This report introduces baseline findings from a large-scale research project on two-wayimmersion education that is funded by the U.S. Department of Education, Institute ofEducation Sciences (IES), administered through the Center for Researchon Education, Diversity & Excellence (CREDE), and based at the Center for AppliedLinguistics (CAL). The project has three main areas of investigation: 1) students’language and literacy development and academic achievement; 2) teachers’ profes-sional development experiences and needs; and 3) the growth of TWI programs inthe United States. The first area (student outcomes) is the largest component. It hasinvolved a 3-year longitudinal study of students’ language, literacy, and academicattainment in English and Spanish, followed by qualitative investigations of learningenvironments in four of the participating programs that were shown to be effectivein promoting high levels of bilingualism, biliteracy, and academic achievement amongtheir student populations. The research discussed in this report falls under the domainof this first area, focusing on the English and Spanish language and literacy develop-ment of TWI students.
The longitudinal component of the project spanned a 3-year period, following 474students in 11 TWI programs from the beginning of third grade (October 1997)through the end of fifth grade (May 2000). Repeated measures of writing, reading, andoral language proficiency in both English and Spanish were collected from participatingstudents during this time period. There are three key reasons why this age group wasselected. First, the upper elementary grades are an understudied age group, particu-larly in the field of literacy research. Second, while there are increasing numbers ofsecondary TWI programs, many end at fifth grade and students move into generaleducation (monolingual English) programs. Finally, as discussed earlier, there is greatvariation across TWI programs at the primary level with regard to the ratio of instruc-tion in the minority language and in English and the path of initial literacy instruction.As a result, it is reasonable to collect data on all students’ language and literacydevelopment in both English and Spanish in the upper elementary grades across avariety of schools, because all students should be receiving literacy instruction in bothlanguages by that time.
Because TWI programs integrate language-minority (usually native Spanish speaking) andlanguage-majority (native English speaking) students and strive to develop high levels of

3
biliteracy in all students, they provide an ideal context for learning more about the simulta-neous development of speaking, reading, and writing ability in two languages. Likewise,because these programs are becoming increasingly popular, educators, policy makers, andparents need information regarding student outcomes to create sound programs of instruc-tion. This report contributes to the growing knowledge base on two-way immersioneducation by presenting findings from the first large-scale, longitudinal study of languageand literacy development among TWI students.
As will be evident in the report findings, data collection in the three domains was notequivalent. Writing development is the central focus of the study, with nine waves ofdata collected in each language over the 3-year period. There are several reasons whywriting was chosen as the focal area. First, writing is an understudied area of literacydevelopment. Second, writing samples are easy to collect through a whole-classactivity that is led by the classroom teacher, and third, it is possible to score all of thewriting samples using a single rubric, making it possible to show development overtime. Having said this, reading and oral language proficiency are also key areas ofinterest, and for this reason, two waves of data in these domains were also collectedin both English and Spanish over the 3-year period.
Three central research questions are addressed in this report:
(1) What levels of English and Spanish writing, reading, and oral language proficiencydo TWI students achieve by the end of fifth grade, and do those levels differ by nativelanguage?
(2) On average, what type of growth in English and Spanish writing, reading, and orallanguage proficiency do TWI students experience from third to fifth grade, and doesthat growth differ by native language?
(3) Within each domain of writing, reading, and oral language, what are the relation-ships between performance in English and performance in Spanish, and do thoserelationships differ by native language?
Student Performance in TWI Programs
The majority of TWI research to date has focused on the academic achievement andlanguage and literacy development of students enrolled in these programs (Howard,Sugarman, & Christian, 2003). In addition to the study reported here, two other studieshave provided longitudinal findings on TWI student outcomes (Lindholm-Leary, 2001;Thomas & Collier, 2002).
In her large-scale study, Lindholm-Leary (2001) found that native Spanish speakers(NSS) and native English speakers (NES) in Spanish/English TWI programs performedat or above grade level in the content areas in their first language, achieving standard-ized mathematics and reading test scores on par with their statewide peers. Inaddition, both groups of students also demonstrated high levels of academic achieve-ment through their respective second languages. In both cases, results varied some-what according to language background, student characteristics, and program type.Socioeconomic status (SES) was significantly associated with second-language readingperformance for both NSS and NES, with mid-SES students outperforming low-SESstudents. In first language reading, there was an interaction between native languageand socioeconomic status, such that the gap between mid-SES and low-SES studentswas larger for NES than NSS. Lindholm-Leary hypothesized that this might have beendue to greater actual variability in SES among NES than NSS. Given that socioeco-

4
nomic status has repeatedly been shown to be strongly related to academic performance,with low socioeconomic status being associated with a risk of academic difficulty (e.g.,Loomis & Bourque, 2001; Snow, Barnes, Chandler, Goodman, & Hemphill, 1991), the factthat it was found to be a factor in TWI students’ performance as well is not particularlysurprising. Finally, Lindholm-Leary found that higher levels of bilingual proficiency in Englishand Spanish were associated with higher levels of literacy in the two languages for bothgroups of students.
In their most recent report, Thomas & Collier (2002) presented findings from their1996-2001 study of the long-term effects of various programs for language-minoritystudents. They found that only 90/10 and 50/50 one-way (including only language-minority students from the same native language background) and two-way (integrat-ing native English speakers and only language-minority students from the same nativelanguage background) developmental bilingual programs enabled language minoritystudents to reach the fiftieth percentile on standardized tests on all subjects in bothlanguages and to maintain or surpass that level of achievement. They also found thatthere were fewer school dropouts from these programs. In contrast, the achievementgap between language-minority students in segregated, remedial programs and theirpeers was found to widen even further after language minority students reenteredmainstream classes, with even the highest quality ESL content programs narrowingthe gap only about half-way. Bilingually-schooled students were found to outperformtheir peers who were educated monolingually in English, in all subjects after 4-7 years.
Most of the other TWI studies on student outcomes have involved close examination ofstudent performance in a single TWI program. As was the case with the two large-scalestudies reported above, most of these studies indicate that TWI students tend to performas well or better on English standardized achievement tests than comparison groupsenrolled in monolingual English or TBE programs (e.g., Cazabon, Lambert, & Hall, 1993;Cazabon, Nicoladis, & Lambert, 1998; Dolson & Lindholm, 1995). Some studies have alsocompared the performance of students within TWI programs, finding that native Englishspeakers (NES) tend to perform higher on average on English achievement measures thannative Spanish speakers (NSS), while NSS tend to perform higher on average than NES onSpanish measures of achievement (Cazabon et. al., 1993; Cazabon et. al., 1998). Finally, afew studies have looked at longitudinal development in language and literacy skills and havefound that students in two-way immersion programs demonstrate continued progress inboth first and second language oral proficiency and literacy over time (Howard, 2003;Howard & Christian, 1997).
Research DesignSite Selection
Twelve Spanish/English TWI programs across the United States were selected for thisstudy, and eleven programs continued with the study for the full 3 years of datacollection. In fall 1996, 40 programs were invited to apply to participate in the CAL/CREDE study of two-way immersion education. These 40 schools were either knownto project staff or recommended by researchers or practitioners who were familiarwith them. Because this study is investigating the effects of two-way immersioneducation, it was important to ensure that the participating programs all adhered tothe three central characteristics of TWI outlined in the introduction. Choosing amongknown or recommended programs allowed project researchers to be more certain ofthis. Twenty programs responded, and 12 were chosen for participation, based on theavailability in their records of relevant student background data, their willingness to

5
collect new data, and their interest in collaborating with CAL researchers and otherparticipating TWI programs. Due in part to the passage of Proposition 227—theCalifornia initiative that severely restricted bilingual education—one program (C) wasmodified during the second year of data collection and the number of participatingstudents in that program decreased considerably. As a result, the decision was madeto drop this program from the study, leaving a total of 11 programs that are included inthe analyses presented here. Overall, the goal was to select sites that varied bygeographic location, student population, and number of years in operation, and thisgoal was achieved through the process of site selection that was followed. Anoverview of these programs can be found in Table 1.
Table 1: Overview of Participating TWI Programs
Program Geographical Population Age of Program Program LanguageLocation Program 2 Setting Model of Initial
LiteracyInstruction
A West Coast White/Latino veteran whole school Spanish dominant Spanish
B West Coast White/Latino veteran whole school Spanish dominant Spanish
C West Coast Multi-racial average strand Spanish dominant Spanish
D Southwest Latino new whole school Spanish dominant Spanish
E Midwest Multi-racial average whole school Spanish dominant Spanish
F Midwest Multi-racial veteran whole school Spanish dominant Native language
G Northeast Multi-racial veteran strand 50/50 BothH Northeast White/Latino average strand Differentiated Native language
I Northeast White/Latino average strand 50/50 Native language
J Mid-Atlantic White/Latino average strand 50/50 English
K Mid-Atlantic Multi-racial new strand Spanish dominant Spanish
L Mid-Atlantic White/Latino average strand 50/50 English
ParticipantsConsent forms were sent home in September 1997 to all third-grade students in theparticipating programs. Ninety-eight percent of the students returned consent forms,and of those students, 98% were given parental consent to participate in the study.From that pool of eligible students, only students who had been continuously enrolledin their respective programs since at least first grade and who were classified asnative speakers of English or Spanish3 were included in the study. Finally, prior toconducting these analyses, all students who exited their respective programs prior tothe end of fifth grade were excluded from the sample, so that any differences inperformance from the beginning of third grade through the end of fifth grade couldnot be attributed to a potential shift in the types of students included in the sample.An analysis of the students who had left their programs determined that the majoritydid so because they had moved. They did not differ from students who stayed interms of background characteristics such as native language, socioeconomic status,or gender. This process yielded a final sample of 344 students, a higher percentageof which were girls (58%).

6
When using the classifications provided by the schools, the sample is completely balancedwith regard to native language, with 50% of the students being classified by their schoolsas native English speakers and the other 50% as native Spanish speakers. However, basedon parent responses to a home language and literacy questionnaire that was completedwhen the students were in fourth grade, a slightly different picture emerges. The sample asa whole tends toward varying levels of bilingualism at home, with 36.8% reporting that bothlanguages were used equally, 18.8% reporting that mostly English (but some Spanish) wasused, and 15.5% reporting that mostly Spanish (but some English) was used. Only 19.2%reported using Spanish most or all of the time. At the same time, a quarter of the sample(25.2%) reported that they spoke only English at home, while a mere 3.7% said they spokeonly Spanish at home, indicating that while varying levels of bilingual home language useare common, the distribution in general is skewed more towards English dominance thanSpanish dominance.
Breaking the home language distributions down by native language, the majority ofNES (50%) indicated that they spoke only English at home, while 32.5% reportedspeaking English most of the time, and 17.5% reported speaking English and Spanishequally. The majority of NSS indicated that they used both languages about equally(56.4%), with smaller percentages using Spanish most (31.3%) or all (7.4%) of thetime, and a very small percentage (4.9%) even reporting that they spoke English mostof the time. In other words, while the majority of the native English speakers wereclearly English dominant in their home language use, the majority of native Spanishspeakers tended to use English and Spanish equally. This trend will be important tokeep in mind later on in the interpretation of the findings.
It is important to take socioeconomic variables into consideration for two reasons.First, as was discussed previously, there is a substantial amount of research indicatinga strong link between socioeconomic status and academic achievement, with lowsocioeconomic status being associated with risk of academic difficulty (e.g., Loomis& Bourque, 2001; Snow, Barnes, Chandler, Goodman, & Hemphill, 1991). Second,because this study involves both native English speakers and native Spanish speakers,and because in many programs there tends to be fairly large socioeconomic differ-ences across the two groups, it is important to consider socioeconomic factors whenlooking at differences in performance across the native language groups.
Two main indicators of socioeconomic status were considered: free/reduced lunchstatus in third grade, as recorded by the schools; and parent education levels, asindicated by parent responses on the home language and literacy questionnaire. Aswas the case with the native language designations provided by the schools, thesample is relatively balanced in terms of free/reduced lunch status. Fifty-one percent ofthe students were not eligible to receive free/reduced lunch in third grade, while 49%of the students were eligible. This relatively even split is somewhat deceiving, how-ever, because the majority of native Spanish speakers (79%) were eligible for free/reduced lunch, while only a minority of the native English speakers (23%) wereeligible.
Close to 60% of the sample had a parent who had completed at least some post-secondary coursework at a college or trade school. That is, the majority of the stu-dents in the sample came from families with fairly high levels of parent education.However, it is important to keep in mind that about a quarter of the students camefrom families where the parent who filled out the questionnaire did not complete highschool, and these students may be considered at-risk of academic difficulty as a result.

7
Breaking the parent education information down by native language, it is clear that themajority of students who came from homes where the parents have lower levels ofeducation were native Spanish speakers. The mean parent education level for NESwas 14.82 years, indicating that on average, their parents had attended 2-3 years ofcollege, had received an Associate’s Degree, or had completed post-secondary tradeschool. For NSS, the mean was 9.79 years, indicating that on average, their parentshad some secondary schooling but had not received a high school degree.
For both indicators of socioeconomic status, a native Spanish language designationwas associated with lower socioeconomic levels, while a native English languagedesignation was associated with higher socioeconomic levels. It will be importantto keep these differences between the two native language groups in mind as thelanguage and literacy findings are presented and discussed.
Overview of Measures and Data Collection Procedures
Perhaps because two-way immersion education is a fairly recent phenomenon, thereare few assessment tools that are designed for these unique programs. Specifically,few instruments have been designed to assess first- or second-language and literacyability in both native English speakers and native Spanish speakers. Program evaluatorstypically employ extant measures developed to assess either the first- or second-language/literacy ability of either native English speakers or language-minority students.In TWI programs, this approach is problematic, because, regardless of the language ofassessment, half of the students are always native speakers and half are alwayssecond language speakers. As a result, new measures were developed for the study.While the measures were not normed, the decision was made that it would be betterto use new measures designed specifically for the particular population and purposesof this study.
Narrative Writing AbilityWriting samples were collected by classroom teachers three times per year (October,February, May) over the 3-year period. The focus was only on narrative writing; it wasimportant to limit the genre so we could make statements about development overtime. Because personal narratives are the most common form of writing in primaryclassrooms, this seemed like a logical starting point for longitudinal research aboutchildren’s writing development.
During each period of data collection, writing samples were collected in both Englishand Spanish from all children. Each period of data collection lasted 2 weeks. This gaveteachers the flexibility to incorporate the data collection into their schedules andallowed a time lapse between English and Spanish writing sample collection at eachtime period. The initial language of writing alternated systematically between Englishand Spanish.
To ensure a reasonably consistent environment across sites, a memo was sent to allparticipating teachers prior to each period of data collection, reminding them of appro-priate data collection procedures and classroom conditions. For the most part, theguidelines mirrored typical pre-writing activities, such as introducing the topic, brain-storming for possible writing ideas, and issuing basic reminders regarding mechanics,topic development, and so on. The students were given approximately one hour tocomplete the writing task following the pre-writing activity and were allowed to talkand interact with each other as they normally would during a writing activity in class.However, teachers were asked not to help the children by translating words or phrasesor providing correct spellings. A trained research assistant was present in each class-

8
room during most periods of data collection and submitted fieldnotes summarizing theclassroom environment and writing behaviors of the students. Immediately followingdata collection, a project coordinator at each school collected the samples from theteachers and submitted them to CAL, where the students’ names were replaced bycodes to keep their identities anonymous. Identification was removed and replacedwith a series of stickers that indicated the student I.D. number, the language of theassessment, and the time (month and grade) that the sample was collected.
At the end of each year of data collection, the writing samples were scored byexperienced two-way immersion teachers who were trained by CAL researchers touse an analytic rubric designed for this study. The rubric was based on an earlier set ofrubrics developed by CAL researchers and two-way immersion teachers in Arlington,Virginia that was designed to assess writing ability in English and Spanish in two-wayimmersion programs in Grades 1-5 (www.cal.org/twi). Working with three of the TWIteachers who were involved in the development of the original rubrics, the leadresearcher modified these rubrics to make them appropriate for the study. Specifically,the original rubrics were designed for classroom use and were therefore different foreach grade level and language. Because this study was designed to look at develop-ment over time and to examine both English and Spanish language and literacydevelopment, it was important to have a single rubric that would be appropriate forGrades 3-5 and could be used for both English and Spanish writing samples. Englishand Spanish narratives collected from the portfolios of NSS and NES in Grades 2-6 intwo Spanish/English TWI programs were used as anchor papers to ensure that therubric categories and descriptors were indeed appropriate for both languages and allthree grade levels. Anchor papers from Grades 2 and 6 were included in the processto increase the probability that the final rubric would be appropriate for the lowest andhighest papers that would be encountered in the study.
The rubric has three components, each of which has four sub-components. Thecomponents and sub-components are shown below.
Composition
• Topic development• Sentence formation• Supporting details• Descriptive language
Grammar
• Verbs• Agreement• Placement• Prepositions
Mechanics
• Spelling• Punctuation• Capitalization• Paragraph formation
Each sub-component has a series of descriptors that corresponds to possible scoresof 1 to 5 points. It is also possible to add or subtract .5 points to differentiate low,average, and high ability within a given level. For example, a score at the “1” levelcould be .5, 1, or 1.5, depending on whether the student’s performance was low,average, or high within that level for the given subcomponent. The exception is thetop score, which does not go higher than 5. A score of 0 is possible at the wholenarrative level only if the student wrote nothing in the language of the assessment

9
(i.e., writing the Spanish narrative entirely in English). An average of all 12 subcompo-nent scores is used as the total score. Because of the number of measures andwaves of data that are being reported, only total scores are discussed in this report.
Cloze Reading AssessmentsReading comprehension was assessed at the beginning of Grade 3 and the end ofGrade 5 using a multiple-choice cloze assessment. Thirty words were deleted atregular intervals from an otherwise continuous text and replaced with blanks. Thestudents were asked to choose the most appropriate alternative from among threechoices to fill in each blank. Different passages taken from the same two stories wereused for the third-grade English and Spanish assessments, so that the reading pas-sages would be different but comparable in terms of topic and readability level. In fifth-grade, only an English cloze reading assessment was administered, because noSpanish companion volume was available. This created an unfortunate imbalance inthe data, and limited our ability to look at Spanish reading development over time andthe relationship between English and Spanish reading ability at the end of fifth grade.
Because thirty words were deleted from the text on each assessment, the totalscores on all of the English and Spanish cloze assessments ranged from 0 to 30.Third-grade teachers were provided with a master key of correct responses and wereasked to score the English and Spanish assessments prior to returning them to CAL.Fifth grade assessments were printed on scannable forms, allowing scoring to bedone electronically.
The assessment was administered in both English and Spanish in the beginning of thirdgrade. Teachers were asked to divide their classes into two groups with equal numbers ofnative English speakers and native Spanish speakers, and to administer the English assess-ment to one group and the Spanish assessment to the other group on the first day of datacollection. A few days later, teachers repeated the assessment, this time reversing thelanguage of assessment for each group. Cover sheets indicated whether each student tookthe assessment in a given language first or second. Two-tailed t-tests indicated that therewere no significant differences in reading performance in either language related to theorder in which the assessments were administered.
Oral Language ProficiencyBecause of the time-intensive nature of the oral proficiency assessment, it was onlyadministered to a sub-sample of students from each program. Assessments in both Englishand Spanish were collected from a random, stratified subset of students at the end of thirdgrade and from the remaining students in that sub-sample at the end of fifth grade. Therandom sub-sample was chosen by stratifying the students in each program into fourgroups according to native language and free/reduced lunch status. We had hoped toinclude six children per group from each program, yielding a total sub-sample of 24 studentsper program and 264 students in all. However, this was not always possible, because of theimbalances in free/reduced lunch status by native language group that were noted earlier. Incases where it was not possible to locate six students per group, the next best solutionwas to identify at least 12 native speakers of each language group per program. Theimbalance in the free/reduced lunch eligibility between the two native language groups isimportant to keep in mind, because it may be related to varying levels of performance.
Prior to the onset of data collection, one representative per school was flown to CALto participate in a 2-day training session on how to administer the oral proficiencyassessment. Following training, the researcher visited each of the schools and con-ducted the interviews along with the trained school representative. The school repre-

10
sentative was the primary interviewer, and the researcher rated the students’ perfor-mance as they spoke with the interviewer. The researcher also wrote down as muchof the students’ speech as possible during the interview and tape recorded all inter-views so that questionable scores could be revisited at a later time and more substan-tive analyses could be done with the oral language data.
The students were interviewed in pairs in order to facilitate their use of the language.They were paired according to similar levels of proficiency in English and Spanish, asdetermined by their classroom teachers. Each interview lasted approximately 15minutes and included tasks intended to solicit a variety of linguistic features throughboth social and academic prompts, such as telling a story about a recent familyvacation or school trip, discussing a hypothetical science experiment, retelling a familiarfairy tale through the use of a wordless picture book, and engaging in a role-play toconvince the school principal to change or get rid of a school rule. The students wereallowed to help each other and to ask questions of the adults who were administeringthe assessments. Some of the pairs were assessed in English first, while others wereassessed in Spanish first. The order of assessment was not related to the nativelanguage of the students.
Oral proficiency scores were determined using a rubric designed for this study.The rubric was modeled after the writing rubric and has a similar structure andcontent. The oral proficiency rubric has two components, each of which has foursub-components (see below):
Conversational fluency
• Comprehension• Fluency• Vocabulary• Rhetorical complexity
Grammar
• Verbs• Agreement• Placement• Prepositions
The grammar component is identical to that of the writing rubric. Like the writingrubric, each sub-component has a series of descriptors that corresponds to possiblescores of 1 to 5 points. It is also possible to add or subtract .5 points to differentiatelow, average, and high ability within a given level, with the exception of the top score,which does not go higher than 5. A score of 0 is possible only if the student saidnothing at all or nothing in the language of the assessment (i.e., speaking only inEnglish during the Spanish language assessment). An average of all eight subcompo-nent scores is used as the total score. Again, because of the number of measures andwaves of data that are being reported on, only total scores are discussed in this report.
Summary of Measures and Data Collection Timeline
Because this study is complex and involves a variety of measures of language andliteracy in English and Spanish collected from both native Spanish speakers and nativeEnglish speakers at multiple time points over a 3-year period, it is useful to summarizethe data collection schedule before moving on to a discussion of the findings. Thissummary can be found in Table 2.

11
Table 2: Summary of Data Collection
Construct Grade 3 Grade 4 Grade 5
Fall Winter Spring Fall Winter Spring Fall Winter Spring
English narrative writing All All All All All All All All All
Spanish narrative writing All All All All All All All All All
English reading comprehension All All
Spanish reading comprehension All
English oral language proficiency Sub-sample Sub-sample
Spanish oral language proficiency Sub-sample Sub-sample
FindingsThroughout this section, descriptive statistics disaggregated by the native language ofthe students will be presented for each measure, followed by the results of statisticaltests conducted to assess potential differences in performance between nativeSpanish speakers and native English speakers. The same standard abbreviations areused in all tables: n for sample size, m for mean, and sd for standard deviation.
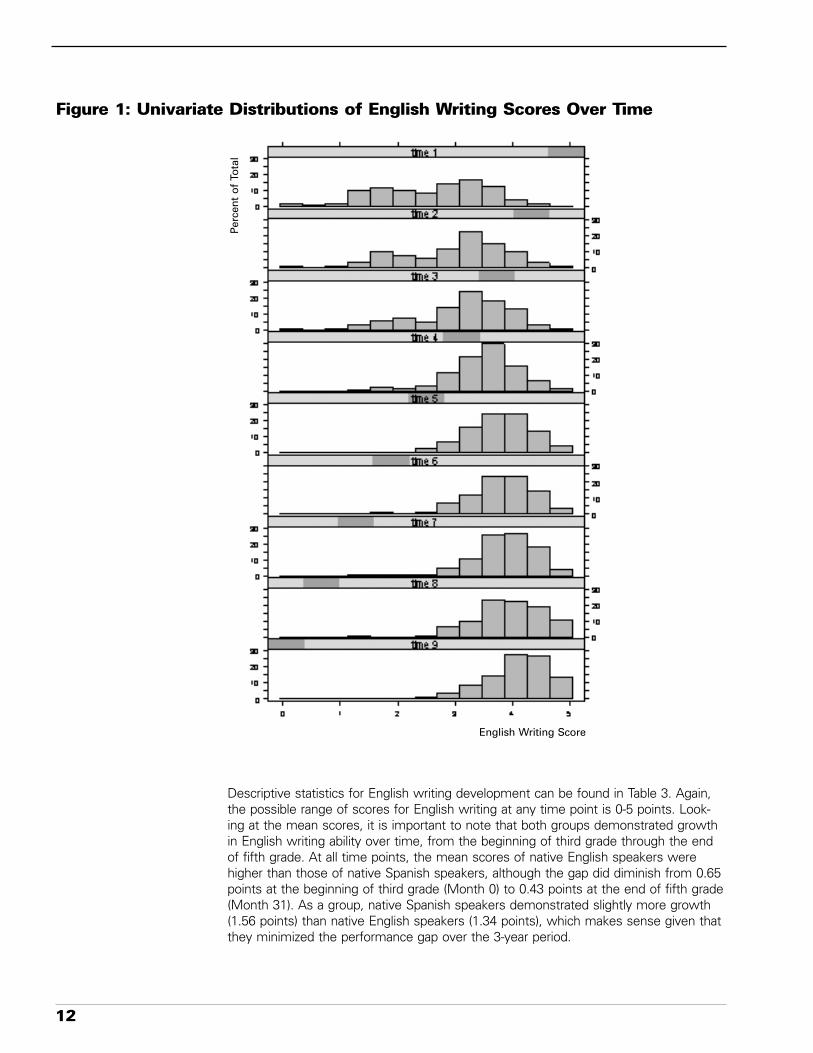
English Narrative Writing DevelopmentUnivariate distributions of English writing development can be found in Figure 1. Thefirst graph at the top shows the distribution of the first wave of data, collected in thefall of third grade. Subsequent time points are displayed in the following segments ofthe graph, all the way down to the final time point, collected in the spring of fifthgrade. The scale of 0 to 5 is indicated along the bottom of the figure, with the lowestpossible score (0) at the far left, and the highest possible score (5) at the far right.
A few important trends can be noticed by looking at these univariate distributions.First, the center of the distribution clearly moves further and further to the right overtime, indicating a general trend of increasing mean scores over the course of the 3years of the study. Second, at all time points, the distribution is relatively bell-shaped,although there is some negative skew at later time points. In other words, while themajority of scores increased over time, there continued to be a few low scores ateach time point that created a long “tail” on the lower end of the distribution andlowered mean scores accordingly. These skews in the distribution are not extremeand should not interfere with the interpretation of statistical tests; however, to becertain, non-parametric tests were conducted in addition to ANOVA to test for meandifferences across native language groups.
12
Figure 1: Univariate Distributions of English Writing Scores Over Time
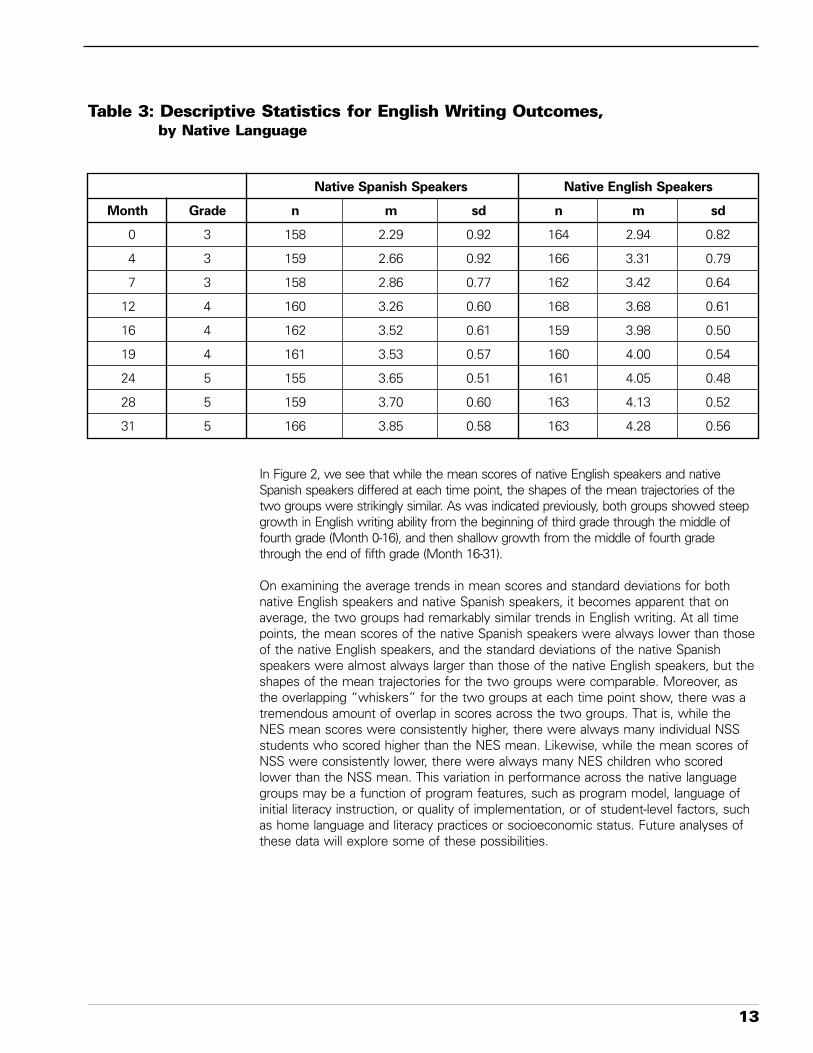
Descriptive statistics for English writing development can be found in Table 3. Again,the possible range of scores for English writing at any time point is 0-5 points. Look-ing at the mean scores, it is important to note that both groups demonstrated growthin English writing ability over time, from the beginning of third grade through the endof fifth grade. At all time points, the mean scores of native English speakers werehigher than those of native Spanish speakers, although the gap did diminish from 0.65points at the beginning of third grade (Month 0) to 0.43 points at the end of fifth grade(Month 31). As a group, native Spanish speakers demonstrated slightly more growth(1.56 points) than native English speakers (1.34 points), which makes sense given thatthey minimized the performance gap over the 3-year period.
English Writing Score
Perc
ent
of T
otal
13
Table 3: Descriptive Statistics for English Writing Outcomes,by Native Language
Native Spanish Speakers Native English Speakers
Month Grade n m sd n m sd
0 3 158 2.29 0.92 164 2.94 0.82
4 3 159 2.66 0.92 166 3.31 0.79
7 3 158 2.86 0.77 162 3.42 0.64
12 4 160 3.26 0.60 168 3.68 0.61
16 4 162 3.52 0.61 159 3.98 0.50
19 4 161 3.53 0.57 160 4.00 0.54
24 5 155 3.65 0.51 161 4.05 0.48
28 5 159 3.70 0.60 163 4.13 0.52
31 5 166 3.85 0.58 163 4.28 0.56
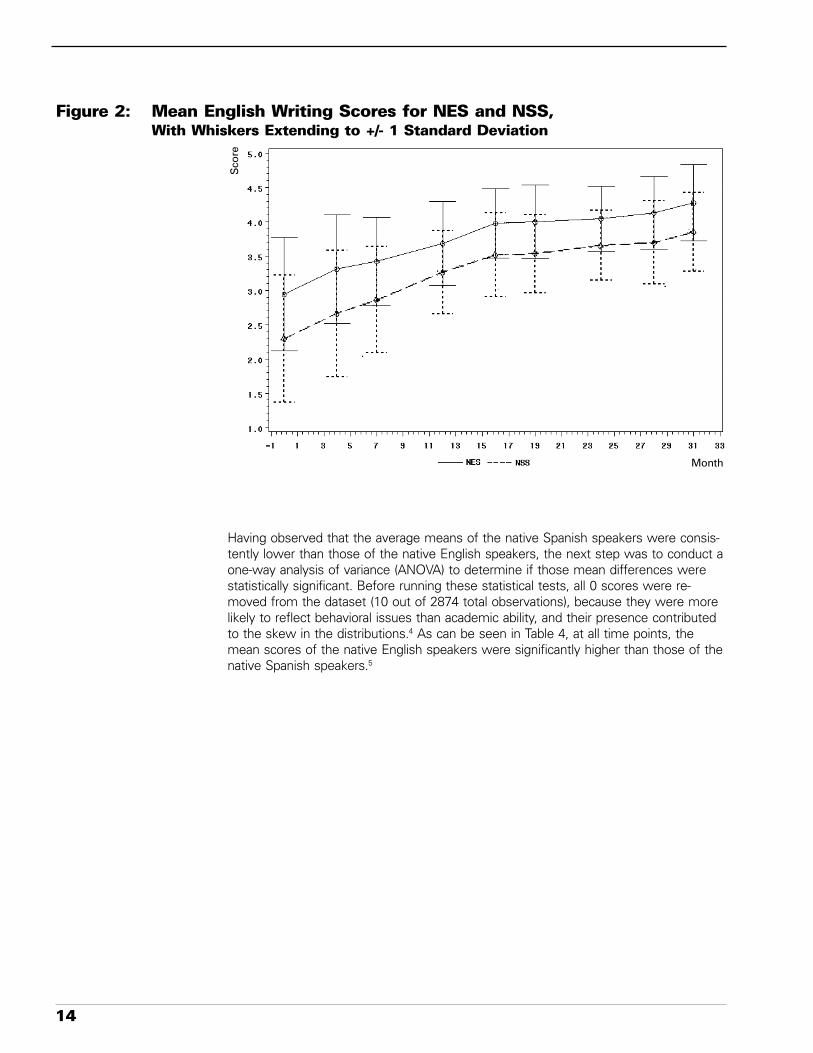
In Figure 2, we see that while the mean scores of native English speakers and nativeSpanish speakers differed at each time point, the shapes of the mean trajectories of thetwo groups were strikingly similar. As was indicated previously, both groups showed steepgrowth in English writing ability from the beginning of third grade through the middle offourth grade (Month 0-16), and then shallow growth from the middle of fourth gradethrough the end of fifth grade (Month 16-31).
On examining the average trends in mean scores and standard deviations for bothnative English speakers and native Spanish speakers, it becomes apparent that onaverage, the two groups had remarkably similar trends in English writing. At all timepoints, the mean scores of the native Spanish speakers were always lower than thoseof the native English speakers, and the standard deviations of the native Spanishspeakers were almost always larger than those of the native English speakers, but theshapes of the mean trajectories for the two groups were comparable. Moreover, asthe overlapping “whiskers” for the two groups at each time point show, there was atremendous amount of overlap in scores across the two groups. That is, while theNES mean scores were consistently higher, there were always many individual NSSstudents who scored higher than the NES mean. Likewise, while the mean scores ofNSS were consistently lower, there were always many NES children who scoredlower than the NSS mean. This variation in performance across the native languagegroups may be a function of program features, such as program model, language ofinitial literacy instruction, or quality of implementation, or of student-level factors, suchas home language and literacy practices or socioeconomic status. Future analyses ofthese data will explore some of these possibilities.
14
Figure 2: Mean English Writing Scores for NES and NSS,With Whiskers Extending to +/- 1 Standard Deviation
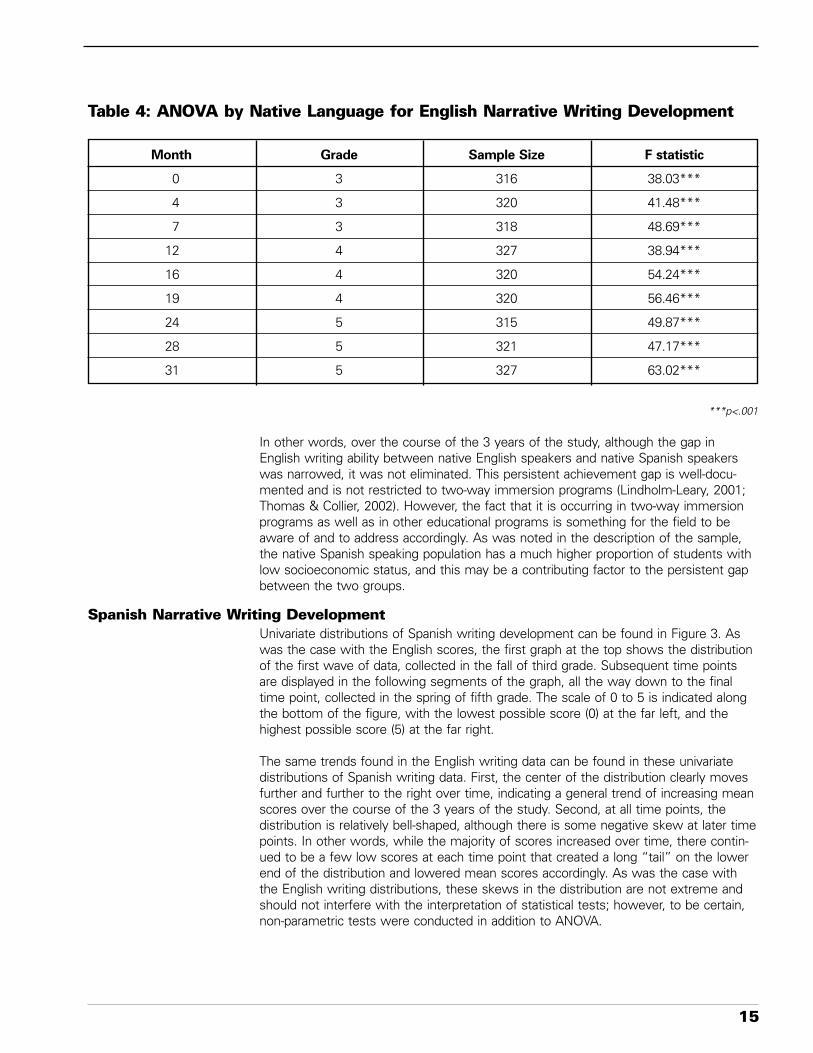
Having observed that the average means of the native Spanish speakers were consis-tently lower than those of the native English speakers, the next step was to conduct aone-way analysis of variance (ANOVA) to determine if those mean differences werestatistically significant. Before running these statistical tests, all 0 scores were re-moved from the dataset (10 out of 2874 total observations), because they were morelikely to reflect behavioral issues than academic ability, and their presence contributedto the skew in the distributions.4 As can be seen in Table 4, at all time points, themean scores of the native English speakers were significantly higher than those of thenative Spanish speakers.5
Month
Sco
re
15
Table 4: ANOVA by Native Language for English Narrative Writing Development
Month Grade Sample Size F statistic
0 3 316 38.03***
4 3 320 41.48***
7 3 318 48.69***
12 4 327 38.94***
16 4 320 54.24***
19 4 320 56.46***
24 5 315 49.87***
28 5 321 47.17***
31 5 327 63.02***
***p<.001
In other words, over the course of the 3 years of the study, although the gap inEnglish writing ability between native English speakers and native Spanish speakerswas narrowed, it was not eliminated. This persistent achievement gap is well-docu-mented and is not restricted to two-way immersion programs (Lindholm-Leary, 2001;Thomas & Collier, 2002). However, the fact that it is occurring in two-way immersionprograms as well as in other educational programs is something for the field to beaware of and to address accordingly. As was noted in the description of the sample,the native Spanish speaking population has a much higher proportion of students withlow socioeconomic status, and this may be a contributing factor to the persistent gapbetween the two groups.
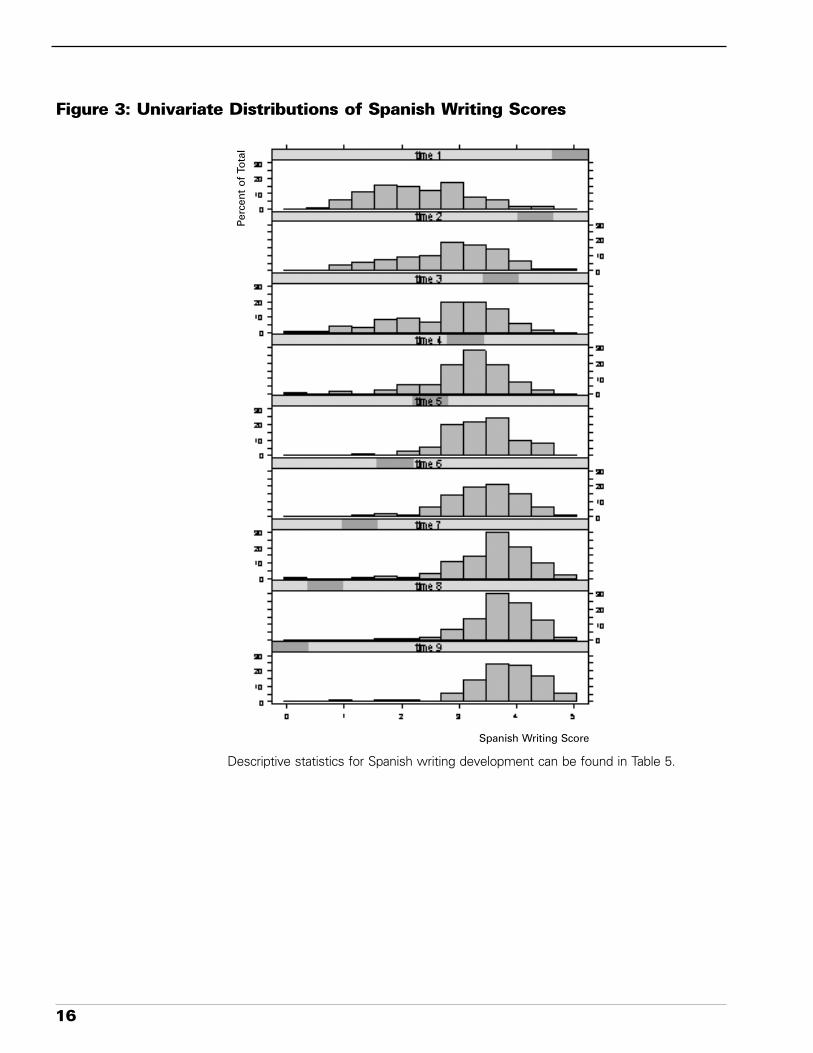
Spanish Narrative Writing DevelopmentUnivariate distributions of Spanish writing development can be found in Figure 3. Aswas the case with the English scores, the first graph at the top shows the distributionof the first wave of data, collected in the fall of third grade. Subsequent time pointsare displayed in the following segments of the graph, all the way down to the finaltime point, collected in the spring of fifth grade. The scale of 0 to 5 is indicated alongthe bottom of the figure, with the lowest possible score (0) at the far left, and thehighest possible score (5) at the far right.
The same trends found in the English writing data can be found in these univariatedistributions of Spanish writing data. First, the center of the distribution clearly movesfurther and further to the right over time, indicating a general trend of increasing meanscores over the course of the 3 years of the study. Second, at all time points, thedistribution is relatively bell-shaped, although there is some negative skew at later timepoints. In other words, while the majority of scores increased over time, there contin-ued to be a few low scores at each time point that created a long “tail” on the lowerend of the distribution and lowered mean scores accordingly. As was the case withthe English writing distributions, these skews in the distribution are not extreme andshould not interfere with the interpretation of statistical tests; however, to be certain,non-parametric tests were conducted in addition to ANOVA.
16
Figure 3: Univariate Distributions of Spanish Writing Scores
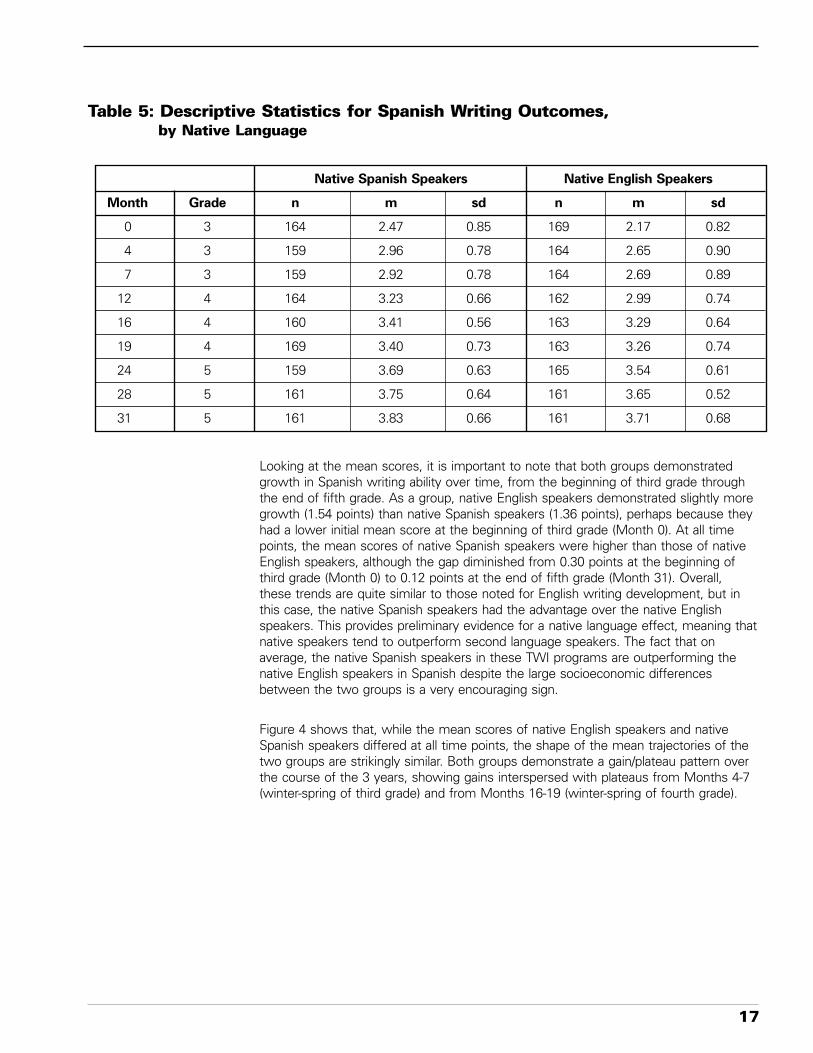
Descriptive statistics for Spanish writing development can be found in Table 5.
Perc
ent
of T
otal
Spanish Writing Score
17
Table 5: Descriptive Statistics for Spanish Writing Outcomes,by Native Language
Native Spanish Speakers Native English Speakers
Month Grade n m sd n m sd
0 3 164 2.47 0.85 169 2.17 0.82
4 3 159 2.96 0.78 164 2.65 0.90
7 3 159 2.92 0.78 164 2.69 0.89
12 4 164 3.23 0.66 162 2.99 0.74
16 4 160 3.41 0.56 163 3.29 0.64
19 4 169 3.40 0.73 163 3.26 0.74
24 5 159 3.69 0.63 165 3.54 0.61
28 5 161 3.75 0.64 161 3.65 0.52
31 5 161 3.83 0.66 161 3.71 0.68
Looking at the mean scores, it is important to note that both groups demonstratedgrowth in Spanish writing ability over time, from the beginning of third grade throughthe end of fifth grade. As a group, native English speakers demonstrated slightly moregrowth (1.54 points) than native Spanish speakers (1.36 points), perhaps because theyhad a lower initial mean score at the beginning of third grade (Month 0). At all timepoints, the mean scores of native Spanish speakers were higher than those of nativeEnglish speakers, although the gap diminished from 0.30 points at the beginning ofthird grade (Month 0) to 0.12 points at the end of fifth grade (Month 31). Overall,these trends are quite similar to those noted for English writing development, but inthis case, the native Spanish speakers had the advantage over the native Englishspeakers. This provides preliminary evidence for a native language effect, meaning thatnative speakers tend to outperform second language speakers. The fact that onaverage, the native Spanish speakers in these TWI programs are outperforming thenative English speakers in Spanish despite the large socioeconomic differencesbetween the two groups is a very encouraging sign.
Figure 4 shows that, while the mean scores of native English speakers and nativeSpanish speakers differed at all time points, the shape of the mean trajectories of thetwo groups are strikingly similar. Both groups demonstrate a gain/plateau pattern overthe course of the 3 years, showing gains interspersed with plateaus from Months 4-7(winter-spring of third grade) and from Months 16-19 (winter-spring of fourth grade).

18
Figure 4: Mean Spanish Writing Scores for NSS and NES,With Whiskers Extending to +/- 1 Standard Deviation
Examining the average trends in mean scores and standard deviations for both nativeSpanish speakers and native English speakers, it becomes apparent that the twogroups had remarkably similar trends in Spanish writing, as was the case in Englishwriting. At all time points, the mean scores of the native Spanish speakers werehigher than those of the native English speakers, but the standard deviations of thetwo groups were generally comparable, as were the shapes of the average trend linesfor the two groups. Moreover, as the overlapping “whiskers” for the two groups ateach time point show, there was a tremendous amount of overlap in scores acrossthe two groups. That is, while the NSS mean scores were consistently higher, therewere always many individual NES students who scored higher than the NSS mean.Likewise, while the mean scores of NES were consistently lower, there were alwaysmany NSS children who scored lower than the NES mean. Once again, this is likely afunction of program as well as student level factors and is an issue that will beexplored in future analyses of this dataset.
Having observed that the average means of the native Spanish speakers were consis-tently higher than those of the native English speakers, the next step was to conducta one-way analysis of variance (ANOVA) procedure to determine if those mean differ-ences were statistically significant. Once again, 0 scores were deleted prior to con-ducting the analyses (10 out of 2899)6. As can be seen in Table 6, there were signifi-cant mean differences across the two native language groups until the spring of fifthgrade. Unlike the situation with English writing, the achievement gap between nativeEnglish speakers and native Spanish speakers in Spanish narrative writing develop-ment closed over the course of the 3 years of the study. Again, this may be partly afunction of the demographic differences in the two samples, particularly with regard tosocioeconomic status. It may also be a function of the slightly skewed distributions, asthe non-parametric test found significant differences across groups at the .05 level atMonth 31.7
Month
Sco
re

19
Table 6: ANOVA by Native Language for Spanish Narrative Writing Development
Month Grade Sample Size F statistic
0 3 331 9.98**
4 3 322 11.24***
7 3 320 4.83*
2 4 323 8.02**
16 4 322 2.91 ~
19 4 329 3.76 ~
24 5 322 6.85**
28 5 320 3.71 ~
31 5 320 1.95 ns
***p<.001, **p<.01, *p<.05, ~p<.1
The Relationship Between English and Spanish Narrative Writing DevelopmentHaving examined the differences and growth patterns in English and Spanish narrativewriting for both native Spanish speakers and native English speakers, it is now interesting tolook at how the development of writing ability in one language relates to the developmentof writing ability in the other language for both groups of students. Table 7 provides correla-tions between English and Spanish writing ability at each time point for each of the nativelanguage groups. As is shown in the table, with the exception of NSS at Month 16 (winterof fourth grade), there were moderate, significant correlations between English and Spanishwriting ability for both groups of students at all time points. In general, the magnitude of thecorrelations tended to be a little larger for NSS than NES, but not dramatically so. In otherwords, there is clearly a relationship between narrative writing ability in English and Spanishfor both groups of students, and that relationship seems to be fairly consistent both overtime within each language group and across language groups.
Table 7: Correlations Between English and Spanish Writing Ability,by Native Language
Month Grade Native Spanish Speakers Native English speakers
0 3 .44*** .28***
4 3 .41*** .32***
7 3 .30*** .29***
12 4 .36*** .29***
16 4 .14~ .34***
19 4 .36*** .33***
24 5 .46*** .44***
28 5 .49*** .31***
31 5 .49*** .40***

20
Looking at Figure 5, we note that for native English speakers, English writing ability wasalways higher than Spanish writing ability. For native Spanish speakers, however, thesituation was much different. With the exception of Time 2, their mean scores in Englishand Spanish were virtually identical at all time points. As a group, the native Spanishspeakers appeared to have much more balanced writing skills in the two languages, whilethe native English speakers were more dominant in English. This is not particularly surpris-ing given that the majority of native Spanish speakers came from bilingual home environ-ments, while the majority of native English speakers came from English monolingual orEnglish dominant home environments. In addition, native Spanish speakers in the UnitedStates generally have more opportunities for exposure to English outside of school thannative English speakers have for exposure to Spanish.
Figure 5: Mean Spanish Writing (SW) and English Writing (EW) Scoresfor Native Spanish Speakers and Native English Speakers
Month
Mea
n S
core

21
English Reading DevelopmentScores on the English Cloze Reading Assessment ranged from 0 to 30 points. As canbe seen in Figure 6, the distributions at both grade levels were negatively skewed,with more scores at the higher end of the distribution. This trend was more dramaticin fifth grade than in third grade, with a tighter clustering of scores at the high end ofthe distribution. The fifth grade results are particularly encouraging, as they demon-strate that the majority of students received perfect or close to perfect scores on agrade-level assessment of English reading ability. These results provide evidence ofgrade-level reading ability in English for the majority of TWI students in this study. Thisfinding is consistent with other large-scale studies of TWI student achievement, whichindicate that the greatest gains in academic achievement and English literacy abilitytend to occur after several years of participation in the program (Lindholm-Leary, 2001;Thomas & Collier, 2002).
Figure 6: Univariate Distributions of Third Grade and Fifth Grade EnglishCloze Scores
English Cloze Score
Perc
enta
ge o
f S
tude
nts

22
As shown in Table 8 and Figure 7, on average, both native English speakers and nativeSpanish speakers demonstrated growth in English reading, as average scores for bothgroups increased from third grade to fifth grade. At the same time, standard deviationsfor both groups declined over time, indicating a tighter clustering of scores toward thehigh end of the distribution in fifth grade, as was clearly noted in Figure 6.
Table 8: Descriptive Statistics for English Cloze Reading Outcomes,by Native Language
Native Spanish Speakers Native English Speakers
Measure n m sd n m sd
3rd Grade Cloze English 164 18.37 7.55 165 23.70 6.29
5th Grade Cloze English 164 25.77 4.75 160 28.69 2.58
On average, the native Spanish speakers made slightly more progress (7.4 points) thanthe native English speakers (5 points). This was likely due in part to the fact that theirmean score in third grade was lower than that of the native English speakers. At both
Figure 7: Mean English Cloze Scores for Native Spanish Speakers and NativeEnglish Speakers
03 5
5
10
15
20
25
30
NES NSS
Grade
Mea
n S
core

23
time points, the mean scores of the native Spanish speakers were lower than thoseof the native English speakers, although the gap narrowed from 5.3 points to 2.9points (out of 30 points). This mirrors the trend shown in English writing, where theachievement gap between the two groups narrowed but did not disappear over the 3-year period of the study. As is indicated in Table 9, the mean differences at both timepoints were statistically significant. These findings were confirmed by the Wilcoxonnon-parametric test, which was important to conduct because of the extreme skew ofthe distributions, particularly for the fifth grade data. It is important to keep in mind,however, that these tests do not control for other factors such as socioeconomicstatus, and that the native language effects may disappear once these other variablesare introduced into a model.
Table 9: ANOVA by Native Language for English Cloze Reading Development
Grade Sample Size F statistic
3 329 48.43***
5 324 47.09***
***p<.001
Spanish Reading AbilityThe distribution of Spanish cloze reading scores in third grade can be found in Figure8. Once again, the possible scores ranged from 0 to 30 points. Unlike the distributionsfor the English cloze reading assessment, the distribution here is relatively bell-shaped,with no clear ceiling effect. In other words, the Spanish third grade cloze readingassessment appears to have been more challenging for the students than the thirdgrade English cloze reading assessment.
Figure 8: Univariate Distribution of 3rd Grade Spanish Close Reading Scores
Spanish Cloze Reading Score
Perc
enta
ge o
f S
tude
nts
24
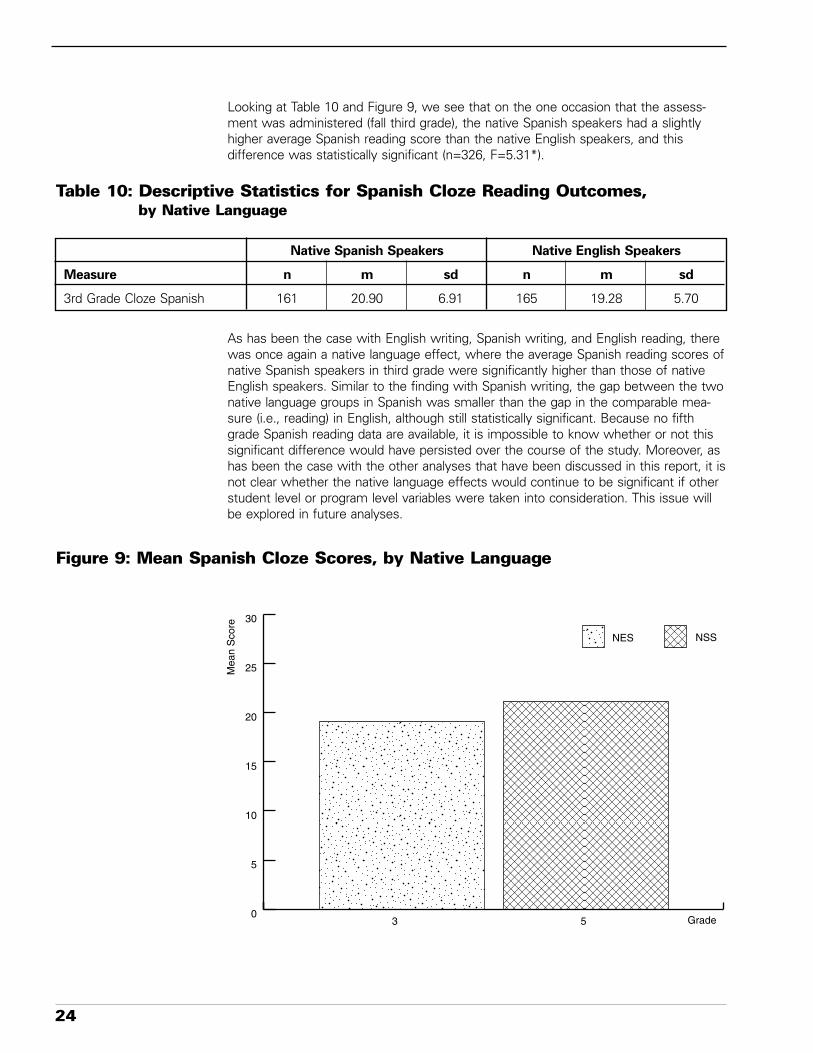
Looking at Table 10 and Figure 9, we see that on the one occasion that the assess-ment was administered (fall third grade), the native Spanish speakers had a slightlyhigher average Spanish reading score than the native English speakers, and thisdifference was statistically significant (n=326, F=5.31*).
Table 10: Descriptive Statistics for Spanish Cloze Reading Outcomes,by Native Language
Native Spanish Speakers Native English Speakers
Measure n m sd n m sd
3rd Grade Cloze Spanish 161 20.90 6.91 165 19.28 5.70
As has been the case with English writing, Spanish writing, and English reading, therewas once again a native language effect, where the average Spanish reading scores ofnative Spanish speakers in third grade were significantly higher than those of nativeEnglish speakers. Similar to the finding with Spanish writing, the gap between the twonative language groups in Spanish was smaller than the gap in the comparable mea-sure (i.e., reading) in English, although still statistically significant. Because no fifthgrade Spanish reading data are available, it is impossible to know whether or not thissignificant difference would have persisted over the course of the study. Moreover, ashas been the case with the other analyses that have been discussed in this report, it isnot clear whether the native language effects would continue to be significant if otherstudent level or program level variables were taken into consideration. This issue willbe explored in future analyses.
Figure 9: Mean Spanish Cloze Scores, by Native Language
53
NES NSS
Grade
Mea
n S
core
0
5
10
15
20
25
30

25
The Relationship Between English Reading Ability and Spanish Reading Ability
Because Spanish reading data were only collected in third grade, this was the only opportu-nity to compare reading ability across the two languages for the two groups of students.
As is shown in Figure 10, the native English speakers had a slightly higher average on theEnglish reading assessment than on the Spanish reading assessment, and the oppositewas true for the native Spanish speakers. The gap in average reading ability between thetwo languages was slightly larger for the native English speakers (4.4 points) than for thenative Spanish speakers (2.5 points). In addition, the magnitude of the correlation betweenthird grade English and Spanish cloze reading scores was much larger for NSS (.71***) thanfor NES (.32***), although correlations for both groups were statistically significant. Takentogether, these findings lend support to the notion that the native Spanish speakers in theseprograms tend to have more balanced biliteracy skills than the native English speakers. Thisis likely a byproduct of two co-occurring phenomena. First, as we have already seen, thenative Spanish speakers are more likely to use both languages outside of school as well asinside of school, whereas the native English speakers are more likely to use English outsideof school. Second, given the socioeconomic differences between the two groups notedearlier, particularly the differences in levels of formal education, the parents of the nativeEnglish speakers are more likely to engage in literacy practices at home (in English) thatmirror and support literacy tasks in school. This bolsters the English literacy developmentof the native English speakers and may create a greater disparity between their English andSpanish literacy ability. In contrast, the parents of the native Spanish speakers are less likelyto engage in such school-like literacy practices at home, which suggests that the nativeSpanish speakers are more likely to experience the majority of their literacy instruction inboth languages at school and therefore develop similar levels of literacy ability in bothlanguages.
Figure 10: Third Grade Mean English and Spanish Cloze Scores, by Native Language
NES NSS
Language of Assessment
SPANISHENGLISH
Mea
n S
core
0
5
10
15
20
25
30

26
Oral English Proficiency DevelopmentUnivariate distributions of English oral proficiency scores can be found in Figure 11.Possible scores range from 0 to 5 points, as was the case with the writing scoresdiscussed earlier. The figure on the top shows the distribution in the spring of fifthgrade. Clearly, both distributions are negatively skewed, with the fifth grade distributionshowing virtually no variability across children. In other words, in third grade, themajority of the children were exhibiting very high levels of oral English proficiency,despite having spent half or most of the school day working in Spanish up to thatpoint. By the end of fifth grade, all students scored at the highest possible levels. Thiswas a very encouraging outcome, because it provides clear evidence that TWI stu-dents are able to achieve very high levels of oral English fluency.
As shown in Table 11, the average oral English proficiency of both groups of studentswas quite high in both third grade and fifth grade. Average scores were in the mid tohigh 4 range, indicating advanced skills on the part of both native English speakers andnative Spanish speakers. In addition, standard deviations for both groups dropped toextremely low and equivalent levels, suggesting that the very high mean averagescores of both groups in fifth grade were reflective of most individual scores as well,as was evident in Figure 11.
Figure 11. Univariate Distribution of English Oral Proficiency Scores
English Oral Proficiency Score
Perc
enta
ge o
f S
tude
nts

27
0
1
2
3
3 5
4
5
NES
NSS
Grade
Mea
n S
core
Table 11: Descriptive Statistics for Oral Language Outcomes, by Native Language
Native Spanish Speakers Native English Speakers
Measure n m sd n m sd
3rd Grade Oral English 129 4.35 0.59 118 4.77 0.15
5th Grade Oral English 122 4.86 0.08 112 4.90 0.06
Looking now at Figure 12, we see that despite the initially high average scores of bothgroups, there was still an increase in English oral proficiency for both groups, with theaverage score of native English speakers increasing 0.13 points and that of native Spanishspeakers increasing 0.51 points. At both time points, the native English speakers hadslightly higher average scores than the native Spanish speakers, but the gap narrowedconsiderably from 0.42 points in third grade to only 0.04 points in fifth grade.
Figure 12: Mean Oral English Proficiency Scores, by Native Language
As shown in Table 12, these differences across groups were statistically significant atboth grade levels, and these findings were corroborated by the non-parametric tests.However, given that the mean difference in fifth grade was less than a tenth of a point,it is clearly not a substantively significant difference at this grade level. The finding islikely due to the high scores of the vast majority of students and the subsequent limitedvariability among the sample, as was discussed previously. In other words, it is notsomething to be concerned about from an educational or linguistic standpoint.
Table 12: ANOVA by Native Language for English Oral Proficiency Development
Grade Sample Size F statistic
3 247 56.72***
5 234 12.13***
***p<.001

28
Oral Spanish Proficiency DevelopmentUnivariate distributions of Spanish oral proficiency scores can be found in Figure 13. Aswas the case for English oral proficiency, possible scores range from 0 to 5 points.The figure on the top shows the distribution in the spring of third grade, while thefigure on the bottom shows the distribution in the spring of fifth grade. As was thecase in English, both the third grade and fifth grade distributions are negativelyskewed, with clear ceiling effects. At the same time, however, there is more variabilityin Spanish oral proficiency at each grade level than there was in English oral profi-ciency, particularly in third grade. That is, while the majority of students demonstratedhigh levels of oral proficiency in Spanish, more students scored at average and lowlevels of proficiency than was the case in English. This is not particularly surprising,given the strong dominance of English in the United States. On the contrary, the factthat the Spanish oral proficiency scores of the majority of students were so high giventhe extremely strong influence of English is a testimony to the TWI programs’ suc-cessful efforts to promote bilingualism among the student population.
Figure 13: Univariate Distributions of Oral Spanish Proficiency Scores
Perc
enta
ge o
f S
tude
nts
Spanish Oral Proficiency Score

29
Table 13 and Figure 14 present descriptive information about the Spanish oral proficiencydevelopment of native Spanish speakers and native English speakers in the study. Aswas the case for other skills that were assessed repeatedly, both groups of studentsshowed progress from third grade to fifth grade. Native English speakers showed moreaverage growth (0.56 points) than native Spanish speakers (0.19 points), in part becausetheir initial score was much lower than that of the native Spanish speakers and they hadmore room to grow. Additionally, the standard deviations of both groups decreased overtime, but the standard deviations of the native English speakers were always muchhigher than those of the native Spanish speakers, indicating much more variability inSpanish language proficiency among native English speakers than native Spanish speak-ers. This is probably related in part to program model. Because native English speakersare frequently limited in their exposure to Spanish outside of school, the amount ofexposure that they have to Spanish at school is likely to be a factor in their level ofSpanish language attainment. Native Spanish speakers, on the other hand, are morelikely to have some exposure to Spanish outside of school, which may minimize anypotential differences in oral Spanish proficiency development related to program model.
Table 13: Descriptive Statistics for Spanish Oral Language Outcomes,by Native Language
Native Spanish Speakers Native English Speakers
Grade n m sd n m sd
3 131 4.61 0.38 116 3.58 1.02
5 123 4.80 0.17 111 4.14 0.63
Figure 14: Mean Oral Spanish Proficiency Scores, by Native Language
0
1
2
3
3
4
5
5
NES NSS
Grade
Mea
n S
core
30
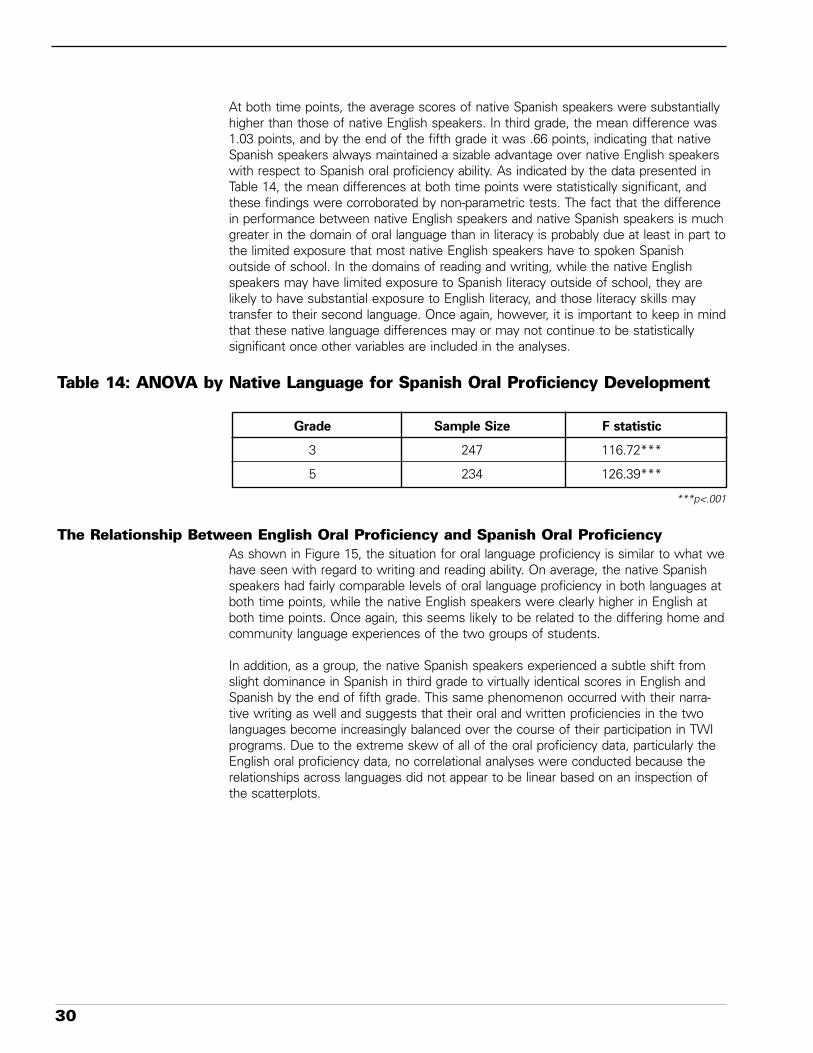
At both time points, the average scores of native Spanish speakers were substantiallyhigher than those of native English speakers. In third grade, the mean difference was1.03 points, and by the end of the fifth grade it was .66 points, indicating that nativeSpanish speakers always maintained a sizable advantage over native English speakerswith respect to Spanish oral proficiency ability. As indicated by the data presented inTable 14, the mean differences at both time points were statistically significant, andthese findings were corroborated by non-parametric tests. The fact that the differencein performance between native English speakers and native Spanish speakers is muchgreater in the domain of oral language than in literacy is probably due at least in part tothe limited exposure that most native English speakers have to spoken Spanishoutside of school. In the domains of reading and writing, while the native Englishspeakers may have limited exposure to Spanish literacy outside of school, they arelikely to have substantial exposure to English literacy, and those literacy skills maytransfer to their second language. Once again, however, it is important to keep in mindthat these native language differences may or may not continue to be statisticallysignificant once other variables are included in the analyses.
Table 14: ANOVA by Native Language for Spanish Oral Proficiency Development
Grade Sample Size F statistic
3 247 116.72***
5 234 126.39***
***p<.001
The Relationship Between English Oral Proficiency and Spanish Oral ProficiencyAs shown in Figure 15, the situation for oral language proficiency is similar to what wehave seen with regard to writing and reading ability. On average, the native Spanishspeakers had fairly comparable levels of oral language proficiency in both languages atboth time points, while the native English speakers were clearly higher in English atboth time points. Once again, this seems likely to be related to the differing home andcommunity language experiences of the two groups of students.
In addition, as a group, the native Spanish speakers experienced a subtle shift fromslight dominance in Spanish in third grade to virtually identical scores in English andSpanish by the end of fifth grade. This same phenomenon occurred with their narra-tive writing as well and suggests that their oral and written proficiencies in the twolanguages become increasingly balanced over the course of their participation in TWIprograms. Due to the extreme skew of all of the oral proficiency data, particularly theEnglish oral proficiency data, no correlational analyses were conducted because therelationships across languages did not appear to be linear based on an inspection ofthe scatterplots.

31
Figure 15: Mean English and Spanish Oral Proficiency Scores of NSS and NES
0
1
2
3
3
4
5
5
NES, English NSS, English NES, Spanish NSS, Spanish
Grade
Mea
n S
core

32
Discussion
Summary of Findings
Returning to the three research questions posed in the introduction, we can summa-rize our findings as follows.
1) What levels of English and Spanish writing, reading, and oral language proficiency do TWIstudents achieve by the end of fifth grade, and do those levels differ by native language?
Based on average performance at the end of fifth grade, we can say that TWI stu-dents in this study demonstrated impressive levels of performance on oral language,reading, and writing measures in English and Spanish. English oral proficiency scoresof all students were at the maximum possible for the measure, indicating very highlevels of English fluency for all students, both native English speakers and nativeSpanish speakers. Spanish oral proficiency scores were likewise very high, with themajority of students receiving the maximum possible score or close to it. On average,native English speakers tended to perform at lower levels than native Spanish speak-ers, but their oral Spanish proficiency was still at a high level.
In the domain of reading, both native English speakers and native Spanish speakersdemonstrated a capacity for successfully reading and comprehending grade-level texts inEnglish, based on fifth grade English cloze reading scores. Those scores had a similardistribution to the oral language assessments, with the majority of students receiving themaximum score or close to it. Native Spanish speakers scored slightly lower than nativeEnglish speakers, but on average they still demonstrated a high level of mastery in Englishreading. Because we were not able to develop a parallel fifth grade Spanish cloze readingassessment, we cannot discuss Spanish reading performance at the end of fifth grade.However, the third grade Spanish cloze reading results were positive and indicated relativelystrong Spanish reading abilities on the part of both native language groups. On average,native Spanish speakers performed at a level that was just slightly higher than that of nativeEnglish speakers in Spanish reading.
Finally, in the domain of writing, students from both native language groups scored atreasonably high levels in both English and Spanish writing. It is difficult to pinpoint thelevel of the students’ performance, as the assessment is not normed and the majorityof students did not attain maximum scores, as was the case for English and Spanishoral language proficiency and English reading ability. However, qualitative analysis of anumber of writing samples with scores in the average range for each group indicatedthat by the end of fifth grade, students were capable of writing reasonably long,organized narratives in English, with few mistakes in grammar or mechanics but withlittle in the way of details or descriptive language. In Spanish, the situation was similar,except that the students, in particular the native English speakers, were more likely tomake grammatical errors. This finding may indicate a need for some explicit Spanishgrammar instruction in TWI programs, as students (particularly native English speakersbut also some native Spanish speakers) do not seem to naturally acquire correctgrammatical structures through their interactions in academic and social settings. Whilesignificant differences across native language groups were found in the three domainsat most grade levels, it is not clear whether or not these differences would remain ifother variables, such as socioeconomic status and home literacy exposure, werecontrolled for. Future analyses will investigate this issue.
On average, both groups of students demonstrated intermediate to advanced levels ofproficiency in English reading and in English and Spanish writing and oral language by

33
the end of fifth grade. This indicates that the programs are achieving one of theprimary goals of two-way immersion education, that of developing bilingualism andbiliteracy among both student populations.
2) On average, what type of growth in English and Spanish writing, reading, and orallanguage proficiency do TWI students experience from third to fifth grade, and doesthat growth differ by native language?
The substantial mean writing growth of the students in both English and Spanish wasapparent, as both groups of students progressed approximately one and a half points (on afive-point scale) on average in both languages over the 3-year period of the study. In thirdgrade, on the assessment of writing in each language, native speakers outperformednonnative speakers, so there was a gap in performance. Over the 3-year period, nativeSpanish speakers demonstrated slightly more growth in English writing than native Englishspeakers, so the performance gap was reduced. Likewise, native English speakers demon-strated slightly more growth in Spanish writing than native Spanish speakers, and theyclosed the performance gap by the end of fifth grade. See Howard (2003) for a moredetailed analysis that employs an individual growth modeling framework.
In English reading, a similar phenomenon occurred, whereby both groups of studentsdemonstrated higher average scores at the end of fifth grade than they did in thebeginning of third grade, and the native Spanish speakers reduced the performancegap with the native English speakers by exhibiting a slightly higher average gain. It isnot possible to discuss mean growth in Spanish reading, because students were onlymeasured once, at the beginning of third grade.
Both groups of students showed very high initial oral English proficiency scores at the endof third grade, but there were still average gains by the end of fifth grade, with mean scoresclose to the maximum possible score and extremely small standard deviations. Again, nativeSpanish speakers showed a bigger gain than native English speakers, thus minimizing theperformance gap in this domain as well. Finally, both groups likewise showed gains in meanSpanish oral proficiency scores, with native English speakers evidencing a larger gain thannative Spanish speakers, thereby minimizing the performance gap somewhat.
Overall, both groups of students demonstrated mean growth in language and literacyabilities in both languages, thus lending empirical support to the theoretical premisethat TWI programs promote additive bilingualism. That is, students can continue todevelop language and literacy skills in their first language while simultaneously develop-ing language and literacy skills in a second language. This premise is further supportedby the evidence of convergence in all three domains, suggesting that the meanperformance of second language speakers always approaches and sometimesmatches the mean performance of the native speakers. This phenomenon providesempirical evidence for the importance of long-term participation in these programs inorder to achieve the maximum benefits of bilingualism and biliteracy.
3) Within each domain of writing, reading, and oral language, what are the relationshipsbetween performance in English and performance in Spanish, and do those relation-ships differ by native language?
In general, the English and Spanish language and literacy skills of the native Spanishspeakers tended to develop more in tandem, with comparable levels of mean achieve-ment in both languages in all three domains, while on average, the native Englishspeakers clearly retained English dominance in both oral language and literacy skillsover the 3 years of the study.

34
There were significant, moderate, positive relationships between English and Spanishwriting development for both native Spanish speakers and native English speakers,such that advanced writing ability in one language was associated with advancedwriting ability in the other, and limited writing ability in one language was alsoassociated with limited writing ability in the other. The relationships were relativelycomparable for both native language groups at all time points. Similarly, there weresignificant, positive correlations between English and Spanish reading ability in thirdgrade for both native Spanish speakers and native English speakers, although thecorrelation was much stronger for native Spanish speakers than for native Englishspeakers. Because reading scores in both languages were only collected on oneoccasion, it is not possible to tell if this difference across native language groups in thestrength of the correlation was idiosyncratic or indicative of a pattern. The writing datasuggest that the reading finding is probably idiosyncratic given that the strength of thewriting correlations was generally comparable at all time points, but further datacollection is needed to understand this issue. Correlational analyses were notconducted between English and Spanish oral proficiency scores, because of the strongskew of the distributions and the indications from scatterplots that the relationship ateither time point was not linear.
Implications for Practice
For each domain, two primary comparisons have been made throughout this report: 1)how each native language group on its own performed in one language relative to theother; and 2) how each native language group performed relative to the other nativelanguage group within a given language. These comparisons have generated someinteresting findings that have important implications for TWI programs.
First, the data presented in this report show that on average, native Spanish speakersin this study exhibited more balanced abilities in reading, writing, and oral language inEnglish and Spanish than did their native English speaking peers. This is likely related inpart to the larger sociocultural context of TWI programs in the United States, and inpart to cognitive aspects of language learning and the transfer of literacy skills. Specifi-cally, native Spanish speakers are more likely to use both languages outside of schoolthan native English speakers, and, as a result, they have more opportunities for devel-oping both languages. Additionally, because the majority of the native Spanish speakersin this sample came from lower socioeconomic backgrounds where many parents hadlimited formal schooling, the students may not have engaged in regular school-likeliteracy practices at home. As a result, the majority of their literacy activities in bothlanguages took place in school, a fact that could contribute to similar levels of literacydevelopment across languages.
The native English speakers in the study, in contrast, came from families where theparents had higher levels of formal education and were therefore more likely to engagein literacy practices at home that reinforced and supported school practice. This wouldlead them to develop high levels of native language literacy. At the same time, the factthat their exposure to Spanish is generally limited to school would reinforce their oraldominance in English and also create challenges for their Spanish literacy development,as limitations in Spanish grammar and vocabulary development can limit their ability totransfer English literacy skills to Spanish literacy activities. These sociocultural andcognitive factors may help to explain why the native Spanish speakers as a groupdemonstrated more balanced language and literacy abilities across languages, while thenative English speakers as a group remained clearly English dominant in all threedomains.

35
In addition, when comparing the performance of the two native language groups within agiven language we found domain specific differences across the two groups. Whileadditional analyses need to be conducted to determine if these differences remainafter other factors are taken into consideration, there are some important potentialimplications that can at least be discussed in a preliminary manner.
In oral language, the native Spanish speakers performed at comparable levels to the nativeEnglish speakers in English, but the native English speakers performed considerably lowerthan the native Spanish speakers in Spanish. These findings suggest that TWI programsneed to work harder to increase the oral Spanish proficiency of native English speakers,perhaps providing them with increased opportunities for oral interactions, instruction in sociallanguage, and a more formal presentation of Spanish grammar. This follows from thesociocultural factors just discussed, in that increased opportunities for using Spanish willhelp to compensate for lack of exposure outside the school, but it also suggests that someformal instruction in the second language may be needed.
In reading and writing, the situation was reversed. Native English speakers performedat comparable levels to native Spanish speakers on Spanish reading and writing tasks,while native Spanish speakers performed considerably lower than native Englishspeakers on English literacy tasks. This suggests that the native English speakers havea certain advantage with respect to the development of literacy skills, which again islikely related at least in part to socioeconomic factors.
All of the issues discussed above point to the enormous influence factors outside ofschool have on student performance within TWI programs. These external factors alsocontribute to a situation that is very difficult for the TWI teacher to negotiate, becausethe two student groups differ by far more than native language. Our research findingssuggest that maximizing opportunities for literacy development in both languages maybe an important priority for the native Spanish speakers, while maximizing opportunitiesfor Spanish language development may be a priority for the native English speakers.
ConclusionAs the number of schools implementing TWI programs in the United States growssteadily, it becomes increasingly important to expand our knowledge base aboutstudent performance in such programs. TWI programs are distinguished from mostother academic approaches by their goals of bilingualism and biliteracy development.Thus, studies of students’ language and literacy development are particularly relevantto the field.
This report presents the findings of the first TWI study to look at language and literacydevelopment of both native Spanish speakers and native English speakers, over time, in amultidimensional way, and from a national perspective. As such, the results discussed hereoffer important insights into key issues such as levels of language and literacy attainment inthe upper elementary grades, growth in language and literacy ability in two languages overtime, and the nature of the relationship between language and literacy growth in a child’sfirst and second languages. Developing a better understanding of all these issues is centralto the continued success of two-way immersion programs.

36
Footnotes1Bilingualism is the ability to speak two languages; biliteracy is the ability to read andwrite in two languages.
2Veteran = older than 10 years at time of selection; average = 5–10 years at time ofselection; new = younger than 5 years at time of selection.
3A small percentage of students in TWI programs are designated “third-languagespeakers” because they speak a language other than one of the two languages ofinstruction. These students were eliminated from the sample because their numberswere very small and there was considerable variation with respect to their languageand SES backgrounds, making generalizations about their performance difficult if notimpossible.
4With 9 possible writing samples for 344 students, there was a total possible pool of3096 samples. Of those 3096 possible samples, 222 were missing (primarily due tostudents who left their programs early or who were absent), leaving a total pool of2874 English writing samples. Ten of those samples received scores of 0, and weredeleted from all statistical analyses.
5Because the distributions became somewhat skewed at the later time points, aWilcoxon non-parametric test was also run. These results corroborated the findings ofthe ANOVA, of significant differences across language groups at all time points.
6Out of a total possible of 3096 Spanish writing samples – 9 waves of data for 344students – 197 were missing (again, usually from students who left their programsearly or were absent that day), leaving a total pool of 2899 Spanish samples.
7At other time points, the findings from the non-parametric tests generally mirroredthose of the ANOVA. Significance levels sometimes varied, but the general finding of asignificant difference across language groups held.

37
ReferencesCazabon, M., Lambert, W., & Hall, G. (1993). Two-way bilingual education: A progress
report on the Amigos program (Research Report No. 7). Washington, DC: NationalCenter for Research on Cultural Diversity and Second Language Learning.
Cazabon, M., Nicoladis, E., & Lambert, W. (1998). Becoming bilingual in the Amigostwo-way immersion program (Research Report No. 3). Santa Cruz, CA and Wash-ington, DC: Center for Research on Education, Diversity, & Excellence.
Center for Applied Linguistics. (2002). Directory of two-way immersion programs in theUnited States. www.cal.org/twi/directory.
Christian, D. (1994). Two-way bilingual education: Students learning through twolanguages (Educational Practice Report No. 12). Washington, DC: National Centerfor Research on Cultural Diversity and Second Language Learning.
Dolson, D., & Lindholm, K. (1995). World class education for children in California: Acomparison of the two-way bilingual immersion and European school models. In T.Skutnabb-Kangas (Ed.), Multilingualism for all (pp. 69-102). Lisse: Swets & Zeitlinger.
Howard, E.R. (2003). Biliteracy development in two-way immersion educationprograms: A multilevel analysis of the effects of native language and homelanguage use on the development of narrative writing ability in English and Spanish.Unpublished doctoral dissertation. Harvard University, Cambridge, MA.
Howard, E., & Christian, D. (1997). The development of bilingualism and biliteracy intwo-way immersion students. Paper presented at the annual meeting of theAmerican Educational Research Association (AERA), Chicago, IL.
Howard, E.R., & Christian, D. (2002). Two-way immersion 101: Designing andimplementing two-way immersion programs at the elementary level. (EducationalPractice Report No. 9). Santa Cruz, CA and Washington, DC: Center for Researchon Education, Diversity & Excellence.
Howard, E.R., Sugarman, J., & Christian, D. (2003). Trends in two-way immersioneducation: A review of the research. Baltimore, MD: Center for Research on theEducation of Students Placed at Risk.
Lindholm-Leary, K. (2001). Dual Language Education. Clevedon: Multilingual Matters.
Loomis, S.C., & Bourque, M. L. (Eds.). (2001). National assessment of educationalprogress achievement levels 1992-1998 for writing. Washington, DC: U.S. Depart-ment of Education, National Assessment of Educational Progress, NationalAssessment Governing Board.
Snow, C. E., Barnes, W. S., Chandler, J., Goodman, I. F., & Hemphill, L. (1991).Unfulfilled expectations: Home and school influences on literacy. Cambridge:Harvard University Press.
Thomas, W. & Collier, V. (2002). A national study of school effectiveness for languageminority students’ long-term academic achievement. Santa Cruz, CA andWashington, DC: Center for Research on Education, Diversity & Excellence.

38

Research Reports
RR 1 From At-Risk to Excellence: Research, Theory, and Principles for Practice, by R. Tharp, 1997
RR 2 Scaling Up School Restructuring in Multicultural, Multilingual Contexts: Early Observations fromSunland County, by S. Stringfield, A. Datnow, & S. M. Ross, 1998
RR 3 Becoming Bilingual in the Amigos Two-Way Immersion Program, by M. T. Cazabon, E. Nicoladis,& W. E. Lambert, 1998
RR 4 Pedagogy Matters: Standards for Effective Teaching Practice, by S. Dalton, 1998
RR 5 Educational Reform Implementation: A Co-Constructed Process, by A. Datnow, L. Hubbard, & H.Mehan, 1998
RR 6 The Effects of Instructional Conversations and Literature Logs on the Story Comprehension andThematic Understanding of English Proficient and Limited English Proficient Students, by W. M.Saunders & C. Goldenberg, 1999
RR 7 Collaborative Practices in Bilingual Cooperative Learning Classrooms, by J. J. Gumperz, J. Cook-Gumperz, & M. H. Szymanski, 1999
RR 8 Apprenticeship for Teaching: Professional Development Issues Surrounding the CollaborativeRelationship Between Teachers and Paraeducators, by R. S. Rueda & L. D. Monzó, 2000
RR 9 Sociocultural Factors in Social Relationships: Examining Latino Teachers’ and Paraeducators’Interactions With Latino Students, by L. D. Monzó & R. S. Rueda, 2001
RR 10 Impact of Two-Way Bilingual Elementary Programs on Students’ Attitudes Toward School andCollege, by K. J. Lindholm-Leary & G. Borsato, 2001
RR 11 Review of Research on Educational Resilience, by H. C. Waxman, J. P. Gray, & Y. N. Padrón,2003
RR 12 Secondary School Newcomer Programs in the United States, by B. A. Boyson & D. J. Short, 2003
RR 13 The Development of Bilingualism and Biliteracy From Grade 3 to 5: A Summary of Findings fromthe CAL/CREDE Study of Two-Way Immersion Education, by E. R. Howard, D. Christian, & F.Genesee, 2004
Educational Practice Reports
EPR 1 Program Alternatives for Linguistically Diverse Students, by F. Genesee (Ed.), 1999
EPR 2 Successful Transition Into Mainstream English: Effective Strategies for Studying Literature, byW. Saunders, G. O’Brien, D. Lennon, & J. McLean, 1999
EPR 3 The Sheltered Instruction Observation Protocol: A Tool for Teacher-Researcher Collaboration andProfessional Development, by D. J. Short & J. Echevarria, 1999
EPR 4 Personalizing Culture Through Anthropological and Educational Perspectives, by R. C. Henze &M. E. Hauser, 1999
EPR 5 Implementing Two-Way Immersion Programs in Secondary Schools, by C. Montone & M. Loeb,2000
EPR 6 Broadening the Base: School/Community Partnerships to Support Language Minority StudentsAt Risk, by C. T. Adger & J. Locke, 2000
EPR 7 Leading for Diversity: How School Leaders Can Improve Interethnic Relations, by R. C. Henze,2001
EPR 8 Educating Hispanic Students: Obstacles and Avenues to Improved Academic Achievement, byY. N. Padrón, H. C. Waxman, & H. H. Rivera, 2002
EPR 9 Two-Way Immersion 101: Designing and Implementing a Two-Way Immersion EducationProgram at the Elementary Level, by E. R. Howard & D. Christian, 2002
Publications and Products from CREDE

Occasional Reports
The Role of Classroom Assessment in Teaching and Learning, by L. Shepard, 2000
Using the SIOP Model: Sheltered Instruction Manual for Professional Development, by D. Short,J. Hudec, & J. Echevarria, 2002
A National Study of School Effectiveness for Language Minority Students’ Long-Term AcademicAchievement, by W. Thomas & V. Collier, 2002
Dual Language Program Planner: A Guide for Designing and Implementing Dual LanguagePrograms, by E. R. Howard, N. Olague, & D. Rogers, 2003
Proceedings of the First National Conference for Educators of Newcomer Students, by B. A.Boyson, B. Coltrane, & D. J. Short (Eds.), 2003
Designing Effective Activity Centers for Diverse Learners, by R. S. Hilberg, J. M. Chang, & G.Epaloose, 2004
Multimedia
Video Pedagogy, Research, & Practice, 1999
Video Studies in Native American Education: Improving Education for Zuni Children, 2002
Video Helping English Learners Succeed: An Overview of the SIOP Model, 2002
Video The SIOP Model: Sheltered Instruction for Academic Achievement, 2002
Five Standards for Effective Pedagogy Series:
CD-ROM The Adolescent Literacy Case: A Video Ethnography of Bilingual Students’ Literacy Develop-ment, by S. Pinnegar, A. Teemant, & C. Harris, 2002
CD-ROM The Assessment Literacy Case, by S. Pinnegar & A. Teemant, 2002
CD-ROM The Craig Cleveland Case, by S. Pinnegar, A. Teemant, & R. Tharp, 2002
CD-ROM The Early Childhood Literacy Case, by S. Pinnegar, A. Teemant, & S. Tyra, 2002
CD-ROM The Julene Kendell Case, by R. C. Harris, J. Kendell, M. F. Harris, & D. Baker, 2002
CD-ROM The Lucia Villarreal Case: A Video Ethnography of Literacy Practices in a Bilingual Classroom,by S. Pinnegar & S. Tyra, 2002
CD-ROM The Mara Mills Case, by A Teemant, S. Pinnegar, & R. Tharp, 2002
3 CD-ROM set The Second Language Acquisition Case, by A. Teemant & S. Pinnegar, 2002
CD-ROM The Sheri Galarza Pre-School Case, by R. Tharp, S. Entz, & S. Galarza, 2002
CD-ROM Teaching Alive for the 21st Century in Elementary Settings, by R. Tharp, S. Dalton, & S.Hilberg, 2002
CD-ROM Teaching Alive for the 21st Century in Secondary Settings, by R. Tharp, S. Dalton, & S.Hilberg, 2002
CD-ROM The Bilingual/ESL Programs and Practices Case: A Video Ethnography of Educational Alternativesfor Second Language Learners, by A. Teemant, 2003
CD-ROM The Second Language Literacy Case: A Video Ethnography of Bilingual Students’ LiteracyDevelopment, by A. Teemant, S. Pinnegar, J. R. Graham, 2003

Directories
Directory of Secondary Newcomer Programs in the United States: Revised 2000, by D. J. Short& B. A. Boyson, online at http://www.cal.org/newcomerdb
Directory of Two-Way Bilingual Immersion Programs in the United States, by J. Sugarman &E. Howard, online at http://www.cal.org/twi/directory
National Directory of Teacher Preparation Programs (Preservice & Inservice) for Teachers ofLinguistically and Culturally Diverse Students, online at http://www.colorado.edu/education/BUENO/crede/index.html
To order copies of CREDE publications and products, contact:
Dissemination Coordinator, CREDE CALStoreCenter for Applied Linguistics Center for Applied Linguistics4646 40th Street NW 4646 40th Street NWWashington, DC 20016-1859 Washington, DC 20016-1859202-362-0700 800-551-3709202-362-3740 (fax) 888-700-3629 (fax)[email protected] [email protected]://www.cal.org/crede/pubs http://www.cal.org/store
