development of calibration factors for …
TRANSCRIPT
DEVELOPMENT OF CALIBRATION FACTORS FOR MONITORING
THEATRICAL SMOKE AND HAZE
Prepared for:
Entertainment Services and Technology Association New York, New York
Prepared by:
ENVIRON International Corporation Groton, Massachusetts
November 11, 2002
-i- E N V I R O N
C O N T E N T S Page EXECUTIVE SUMMARY .......................................................................................................ES-1 I. INTRODUCTION ...............................................................................................................1
II. METHODS AND MATERIALS ........................................................................................3
A. Selection of Smoke and Haze-Generating Equipment and Fluids...........................3 B. Sampling Equipment and Materials.........................................................................5 C. Aerosol Monitor Calibration Procedures .................................................................6 D. Laboratory Analysis.................................................................................................7
III. RESULTS AND DISCUSSIONS......................................................................................12
A. Aerosol Monitor Calibration..................................................................................12 B. Use of Calibration Factors .....................................................................................14
IV. REFERENCES .................................................................................................................28
-ii- E N V I R O N
F I G U R E S Figure 1: Experimental set-up for aerosol monitor calibration Figure 2: Smoke and haze generating equipment tested Figure 3: Calibration curve for Natural Fogging Fluid in CITC Fog Max Figure 4: Calibration curve for Water Vapor Haze Fluid in CITC Haze Max Figure 5: Calibration curve for High Performance Fluid in CITC Starhazer Figure 6: Calibration curve for Jem B2 Heavy Fog Fluid in Martin Professional Glaciator Figure 7: Calibration curve for Jem Pro-Smoke Super Fluid in Martin Professional ZR12-
DMX Figure 8: Calibration curve for Le Maitre Pro Beam (Long Lasting) Fluid in G150 Figure 9: Calibration curve for Le Maitre Molecular Fog Fluid in G300 Figure 10: Calibration curve for Le Maitre Pro Beam (Long Lasting) Fluid in G300 Figure 11: Calibration curve for Le Maitre Quick Dissipating Fluid in G300 Figure 12: Calibration curve for Le Maitre Regular Fog Fluid in G300 Figure 13: Calibration curve for Le Maitre Pro Beam (Long Lasting) Fluid in Show Fogger
Pro Figure 14: Calibration curve for Le Maitre Quick Dissipating Fog Fluid in Show Fogger Pro Figure 15: Calibration curve for Le Maitre Regular Fog Fluid in Show Fogger Pro Figure 16: Calibration curve for Le Maitre Molecular Fog Fluid in Stage Fogger DMX Figure 17: Calibration curve for Le Maitre Pro Beam (Long Lasting) Fluid in Stage Fogger Figure 18: Calibration curve for Le Maitre Quick Dissipating Fog Fluid in Stage Fogger
DMX Figure 19: Calibration curve for Le Maitre Regular Fog Fluid in Stage Fogger DMX Figure 20: Calibration curve for Look Solutions/Theatre Effects Tiny Fogger Fluid in Tiny
Fogger Figure 21: Calibration curve for Look Solutions/Theatre Effects Unique Fluid in Unique
Hazer Figure 22: Calibration curve for Look Solutions/Theatre Effects Viper Fluid in Viper II (NT) Figure 23: Calibration curve for Rosco Clear Fog Fluid in Delta 3000 Figure 24: Calibration curve for Rosco Light Fog Fluid in Delta 3000 Figure 25: Calibration curve for Rosco Fog Fluid in Delta 3000 Figure 26: Calibration curve for Rosco Stage & Studio Fluid in Delta 3000 Figure 27: Calibration curve for Tour Hazer Fog Fluid in Smoke Factory Tour Hazer
-iii- E N V I R O N
T A B L E S Table ES-1: Summary of Calibration Factors Table 1: Summary of Smoke/Haze Machines and Fluids Tested Table 2: Summary of Calibration Factors
ES-1 E N V I R O N
EXECUTIVE SUMMARY
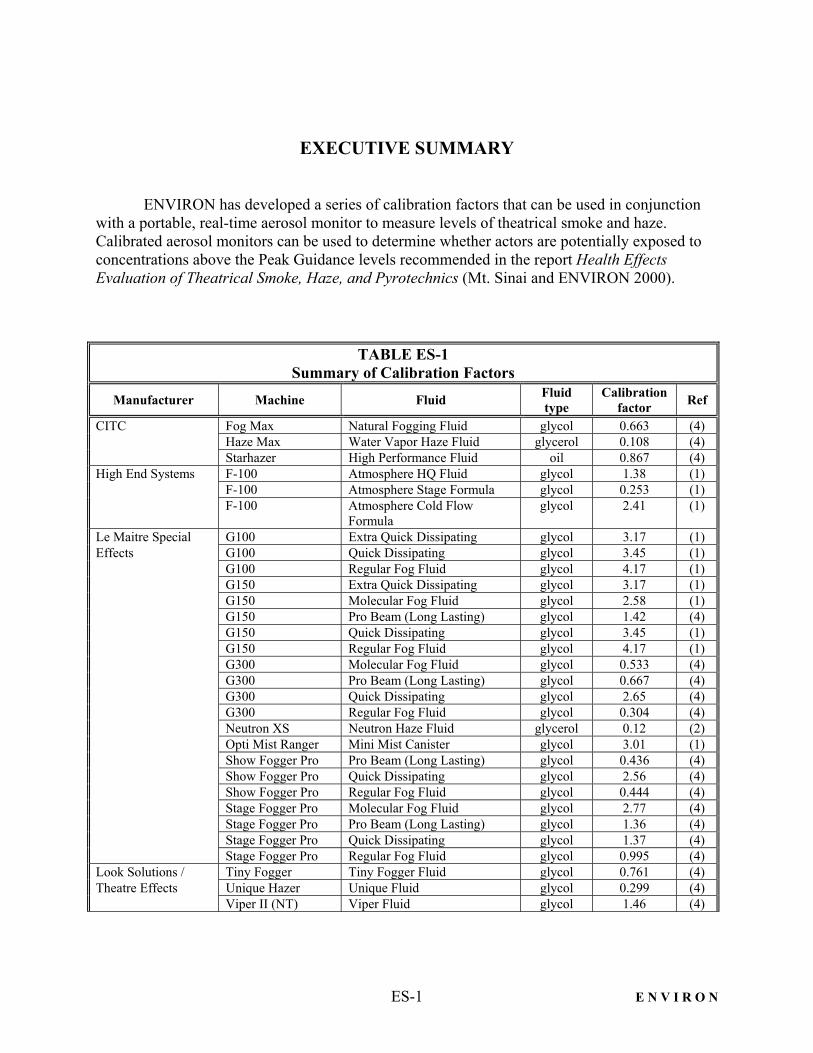
ENVIRON has developed a series of calibration factors that can be used in conjunction with a portable, real-time aerosol monitor to measure levels of theatrical smoke and haze. Calibrated aerosol monitors can be used to determine whether actors are potentially exposed to concentrations above the Peak Guidance levels recommended in the report Health Effects Evaluation of Theatrical Smoke, Haze, and Pyrotechnics (Mt. Sinai and ENVIRON 2000).
TABLE ES-1 Summary of Calibration Factors
Manufacturer Machine Fluid Fluid type
Calibration factor Ref
CITC Fog Max Natural Fogging Fluid glycol 0.663 (4) Haze Max Water Vapor Haze Fluid glycerol 0.108 (4) Starhazer High Performance Fluid oil 0.867 (4) High End Systems F-100 Atmosphere HQ Fluid glycol 1.38 (1) F-100 Atmosphere Stage Formula glycol 0.253 (1) F-100 Atmosphere Cold Flow
Formula glycol 2.41 (1)
Le Maitre Special G100 Extra Quick Dissipating glycol 3.17 (1) Effects G100 Quick Dissipating glycol 3.45 (1) G100 Regular Fog Fluid glycol 4.17 (1) G150 Extra Quick Dissipating glycol 3.17 (1) G150 Molecular Fog Fluid glycol 2.58 (1) G150 Pro Beam (Long Lasting) glycol 1.42 (4) G150 Quick Dissipating glycol 3.45 (1) G150 Regular Fog Fluid glycol 4.17 (1) G300 Molecular Fog Fluid glycol 0.533 (4) G300 Pro Beam (Long Lasting) glycol 0.667 (4) G300 Quick Dissipating glycol 2.65 (4) G300 Regular Fog Fluid glycol 0.304 (4) Neutron XS Neutron Haze Fluid glycerol 0.12 (2) Opti Mist Ranger Mini Mist Canister glycol 3.01 (1) Show Fogger Pro Pro Beam (Long Lasting) glycol 0.436 (4) Show Fogger Pro Quick Dissipating glycol 2.56 (4) Show Fogger Pro Regular Fog Fluid glycol 0.444 (4) Stage Fogger Pro Molecular Fog Fluid glycol 2.77 (4) Stage Fogger Pro Pro Beam (Long Lasting) glycol 1.36 (4) Stage Fogger Pro Quick Dissipating glycol 1.37 (4) Stage Fogger Pro Regular Fog Fluid glycol 0.995 (4) Look Solutions / Tiny Fogger Tiny Fogger Fluid glycol 0.761 (4) Theatre Effects Unique Hazer Unique Fluid glycol 0.299 (4) Viper II (NT) Viper Fluid glycol 1.46 (4)
ES-2 E N V I R O N
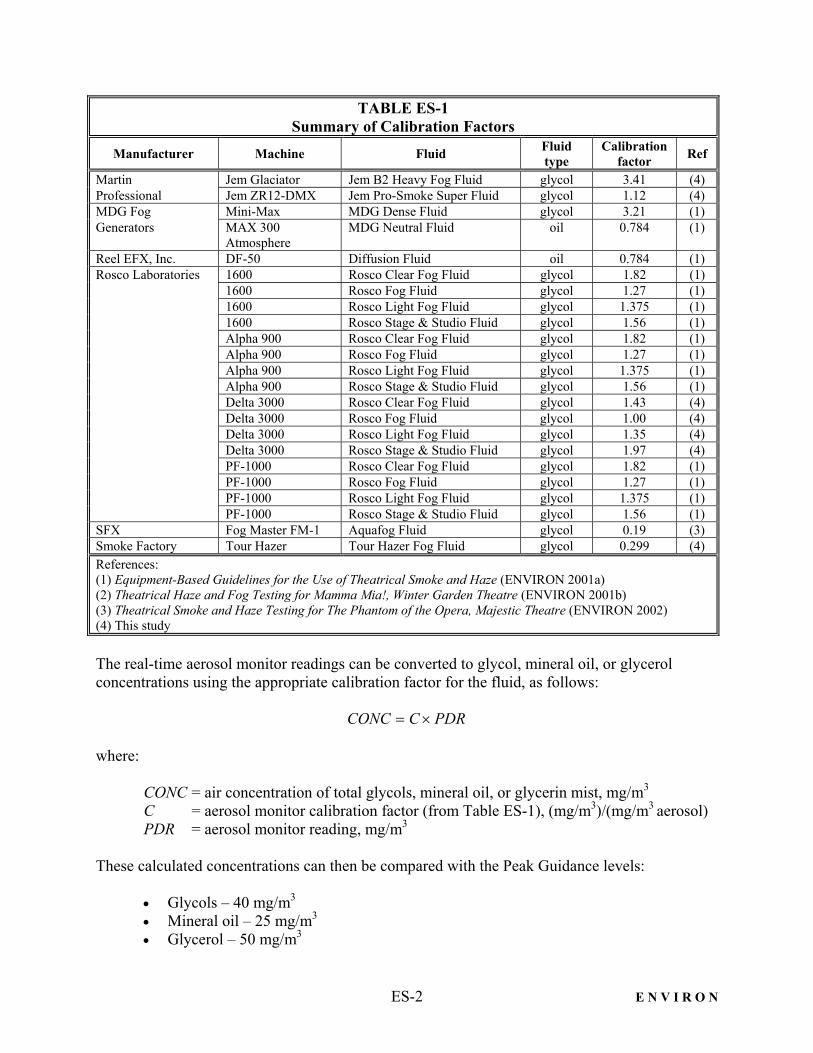
TABLE ES-1 Summary of Calibration Factors
Manufacturer Machine Fluid Fluid type
Calibration factor Ref
Martin Jem Glaciator Jem B2 Heavy Fog Fluid glycol 3.41 (4) Professional Jem ZR12-DMX Jem Pro-Smoke Super Fluid glycol 1.12 (4) MDG Fog Mini-Max MDG Dense Fluid glycol 3.21 (1) Generators MAX 300
Atmosphere MDG Neutral Fluid oil 0.784 (1)
Reel EFX, Inc. DF-50 Diffusion Fluid oil 0.784 (1) Rosco Laboratories 1600 Rosco Clear Fog Fluid glycol 1.82 (1) 1600 Rosco Fog Fluid glycol 1.27 (1) 1600 Rosco Light Fog Fluid glycol 1.375 (1) 1600 Rosco Stage & Studio Fluid glycol 1.56 (1) Alpha 900 Rosco Clear Fog Fluid glycol 1.82 (1) Alpha 900 Rosco Fog Fluid glycol 1.27 (1) Alpha 900 Rosco Light Fog Fluid glycol 1.375 (1) Alpha 900 Rosco Stage & Studio Fluid glycol 1.56 (1) Delta 3000 Rosco Clear Fog Fluid glycol 1.43 (4) Delta 3000 Rosco Fog Fluid glycol 1.00 (4) Delta 3000 Rosco Light Fog Fluid glycol 1.35 (4) Delta 3000 Rosco Stage & Studio Fluid glycol 1.97 (4) PF-1000 Rosco Clear Fog Fluid glycol 1.82 (1) PF-1000 Rosco Fog Fluid glycol 1.27 (1) PF-1000 Rosco Light Fog Fluid glycol 1.375 (1) PF-1000 Rosco Stage & Studio Fluid glycol 1.56 (1) SFX Fog Master FM-1 Aquafog Fluid glycol 0.19 (3) Smoke Factory Tour Hazer Tour Hazer Fog Fluid glycol 0.299 (4) References: (1) Equipment-Based Guidelines for the Use of Theatrical Smoke and Haze (ENVIRON 2001a) (2) Theatrical Haze and Fog Testing for Mamma Mia!, Winter Garden Theatre (ENVIRON 2001b) (3) Theatrical Smoke and Haze Testing for The Phantom of the Opera, Majestic Theatre (ENVIRON 2002) (4) This study
The real-time aerosol monitor readings can be converted to glycol, mineral oil, or glycerol concentrations using the appropriate calibration factor for the fluid, as follows: PDRCCONC ×= where: CONC = air concentration of total glycols, mineral oil, or glycerin mist, mg/m3 C = aerosol monitor calibration factor (from Table ES-1), (mg/m3)/(mg/m3 aerosol) PDR = aerosol monitor reading, mg/m3 These calculated concentrations can then be compared with the Peak Guidance levels:
• Glycols – 40 mg/m3 • Mineral oil – 25 mg/m3 • Glycerol – 50 mg/m3
-1- E N V I R O N
I. INTRODUCTION
In 1997-99, at the request of Actors’ Equity Association (AEA) and the League of American Theaters and Producers (LATP) and with the support of the Equity-League Pension and Health Trust Funds, investigators from the Mount Sinai School of Medicine (Mt. Sinai) and ENVIRON International Corporation (ENVIRON) conducted a study to determine whether the use of smoke, haze, and pyrotechnics special effects in theatrical musical productions is associated with a negative health impact in actors. This effort was initiated in response to ongoing concerns by actors that the use of these theatrical effects may have an impact on their health. The results of this study were presented in the report Health Effects Evaluation of Theatrical Smoke, Haze, and Pyrotechnics (Mt. Sinai and ENVIRON 2000).
The results of the Mt. Sinai/ENVIRON study indicate that there are certain health effects
associated with actors exposed to elevated or peak levels of glycol smoke and mineral oil. However, as long as peak exposures are avoided, actors’ health, vocal abilities, and careers should not be harmed. Pyrotechnics as used on Broadway at the time of the study did not have an observable effect on actors’ health.
Mt. Sinai and ENVIRON recommended the following peak guidance levels with respect
to glycols and mineral oil: • The use of glycols should be such that an actor’s exposure does not exceed 40
milligrams per cubic meter (mg/m3). • Mineral oil should be used in a manner such that an actor’s exposure does not exceed
a peak concentration of 25 mg/m3.
• For chronic exposures to mineral oil, the existing standards established for oil mists (5 mg/m3 as an eight-hour time-weighted average) should also be protective for actors in theatrical productions.
Comparable guidance levels were developed for glycerol in a subsequent study (ENVIRON 2001c):
• Glycerol should be used in a manner such that an actor’s exposure does not exceed a peak concentration of 50 mg/m3.
• For chronic exposures to glycerol, the existing standards established for glycerin
mists (10 mg/m3 as an eight-hour TWA) should also be protective for actors in theatrical productions.
In 2001, ENVIRON developed calibration factors for certain smoke and haze generating equipment and fluids (ENVIRON 2001b). These calibration factors, used in conjunction with real-time aerosol monitors, can be used to evaluate whether potential exposures to actors exceed
-2- E N V I R O N
the peak guidance levels. Following the release of ENVIRON’s report, additional equipment manufacturers expressed interest in having calibration factors developed for their equipment, to support monitoring in productions using their equipment and fluids. This additional study was organized by the Entertainment Services and Technology Association (ESTA).
-3- E N V I R O N
II. METHODS AND MATERIALS A. Selection of Smoke and Haze-Generating Equipment and Fluids
The following types of chemicals used to produce theatrical effects were included in this
study: • Glycols – The glycol solutions evaluated in this study consist of mixtures of 1,3-
butylene glycol (BG), diethylene glycol (DEG), propylene glycol (PG), dipropylene glycol (DPG), triethylene glycol (TEG), and water.
• Mineral oil • Glycerol The following smoke and haze-generating equipment manufacturers provided ENVIRON
with the use of their machines and fluids for testing: • CITC Special Effects, Lynnwood, Washington • Le Maitre Special Effects, Port Huron, Michigan • Look Solutions/Theatre Effects, Hagerstown, Maryland • Martin Professional, Sunrise, Florida • Rosco Laboratories, Stamford, Connecticut • Smoke Factory, Wedemark, Germany
All of the equipment and fluids were shipped to Interesting Products in Chicago, Illinois, where the testing was conducted.
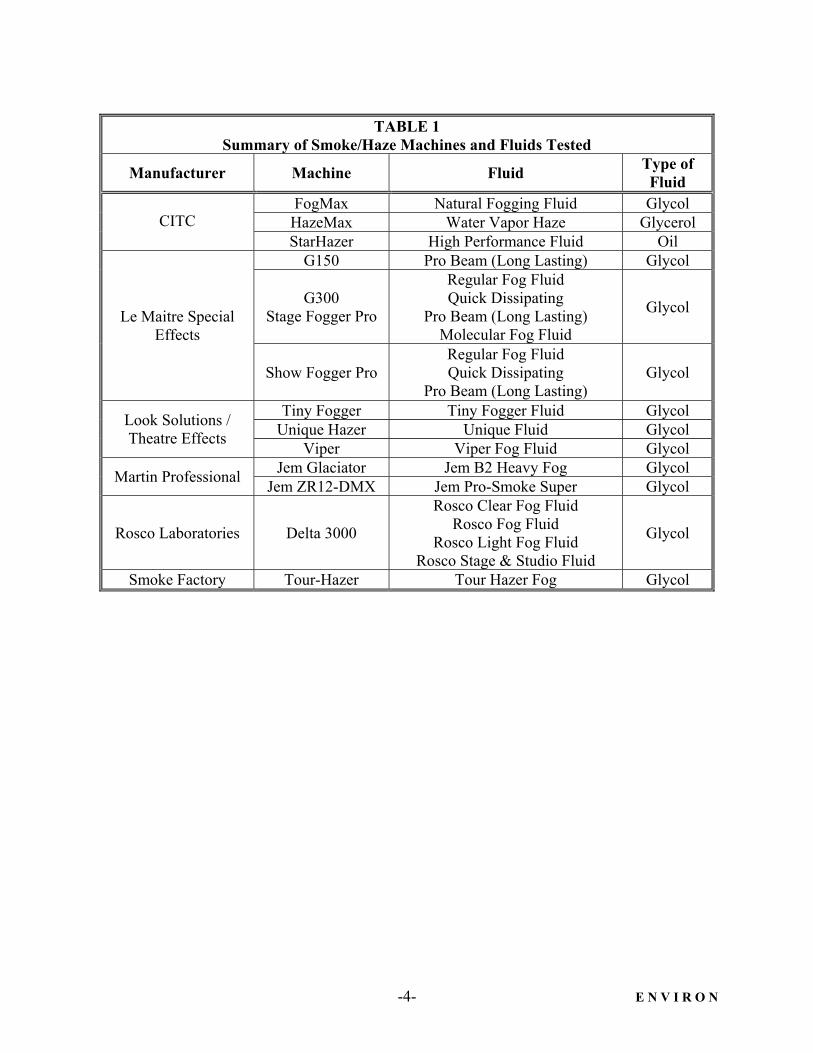
Table 1 summarizes the equipment and fluids included in this study. Calibration factors
for additional machines could be developed at a later date, if requested.
-4- E N V I R O N
TABLE 1
Summary of Smoke/Haze Machines and Fluids Tested
Manufacturer Machine Fluid Type of Fluid
FogMax Natural Fogging Fluid Glycol HazeMax Water Vapor Haze Glycerol CITC StarHazer High Performance Fluid Oil
G150 Pro Beam (Long Lasting) Glycol
G300 Stage Fogger Pro
Regular Fog Fluid Quick Dissipating
Pro Beam (Long Lasting) Molecular Fog Fluid
Glycol Le Maitre Special Effects
Show Fogger Pro Regular Fog Fluid Quick Dissipating
Pro Beam (Long Lasting) Glycol
Tiny Fogger Tiny Fogger Fluid Glycol Unique Hazer Unique Fluid Glycol Look Solutions /
Theatre Effects Viper Viper Fog Fluid Glycol Jem Glaciator Jem B2 Heavy Fog Glycol Martin Professional Jem ZR12-DMX Jem Pro-Smoke Super Glycol
Rosco Laboratories Delta 3000
Rosco Clear Fog Fluid Rosco Fog Fluid
Rosco Light Fog Fluid Rosco Stage & Studio Fluid
Glycol
Smoke Factory Tour-Hazer Tour Hazer Fog Glycol
-5- E N V I R O N
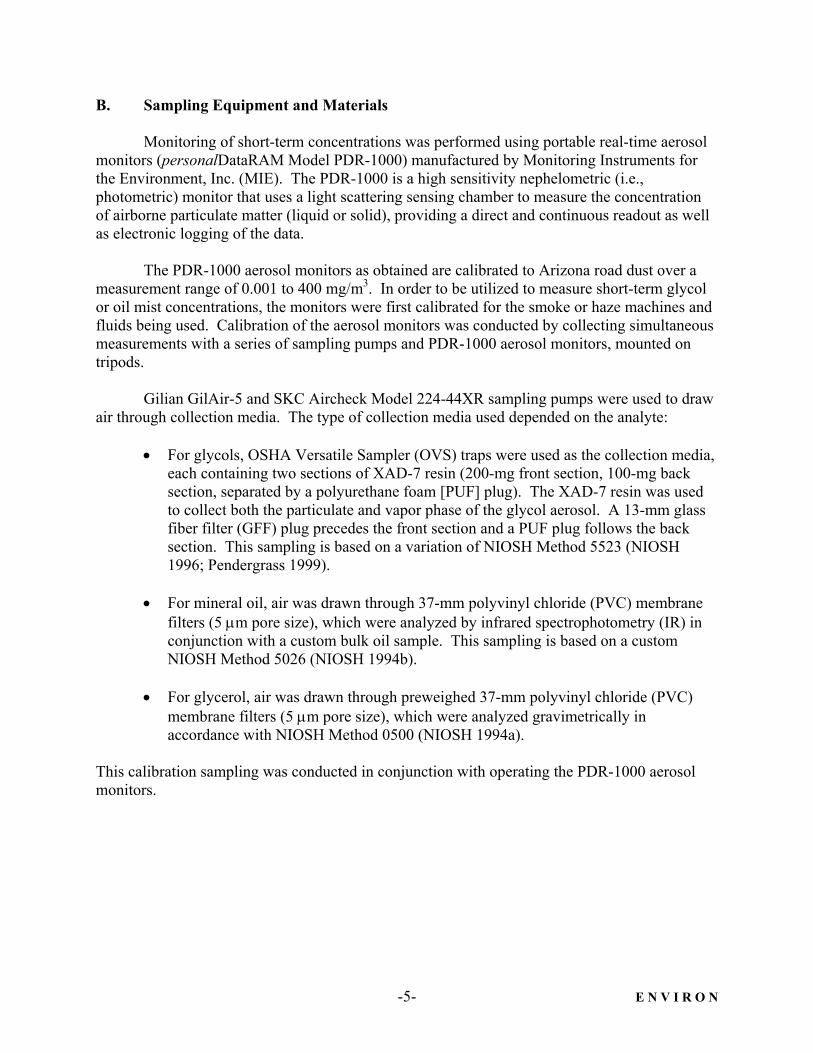
B. Sampling Equipment and Materials Monitoring of short-term concentrations was performed using portable real-time aerosol
monitors (personalDataRAM Model PDR-1000) manufactured by Monitoring Instruments for the Environment, Inc. (MIE). The PDR-1000 is a high sensitivity nephelometric (i.e., photometric) monitor that uses a light scattering sensing chamber to measure the concentration of airborne particulate matter (liquid or solid), providing a direct and continuous readout as well as electronic logging of the data.
The PDR-1000 aerosol monitors as obtained are calibrated to Arizona road dust over a
measurement range of 0.001 to 400 mg/m3. In order to be utilized to measure short-term glycol or oil mist concentrations, the monitors were first calibrated for the smoke or haze machines and fluids being used. Calibration of the aerosol monitors was conducted by collecting simultaneous measurements with a series of sampling pumps and PDR-1000 aerosol monitors, mounted on tripods.
Gilian GilAir-5 and SKC Aircheck Model 224-44XR sampling pumps were used to draw
air through collection media. The type of collection media used depended on the analyte: • For glycols, OSHA Versatile Sampler (OVS) traps were used as the collection media,
each containing two sections of XAD-7 resin (200-mg front section, 100-mg back section, separated by a polyurethane foam [PUF] plug). The XAD-7 resin was used to collect both the particulate and vapor phase of the glycol aerosol. A 13-mm glass fiber filter (GFF) plug precedes the front section and a PUF plug follows the back section. This sampling is based on a variation of NIOSH Method 5523 (NIOSH 1996; Pendergrass 1999).
• For mineral oil, air was drawn through 37-mm polyvinyl chloride (PVC) membrane
filters (5 µm pore size), which were analyzed by infrared spectrophotometry (IR) in conjunction with a custom bulk oil sample. This sampling is based on a custom NIOSH Method 5026 (NIOSH 1994b).
• For glycerol, air was drawn through preweighed 37-mm polyvinyl chloride (PVC)
membrane filters (5 µm pore size), which were analyzed gravimetrically in accordance with NIOSH Method 0500 (NIOSH 1994a).
This calibration sampling was conducted in conjunction with operating the PDR-1000 aerosol monitors.
-6- E N V I R O N
C. Aerosol Monitor Calibration Procedures
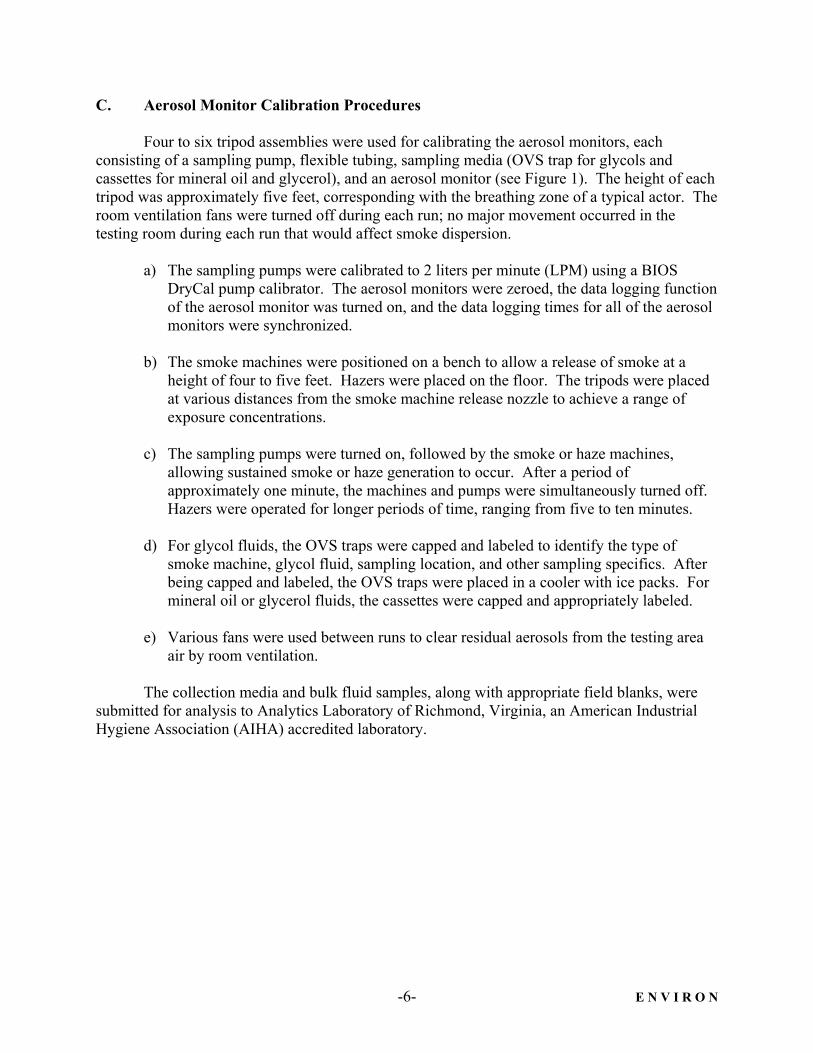
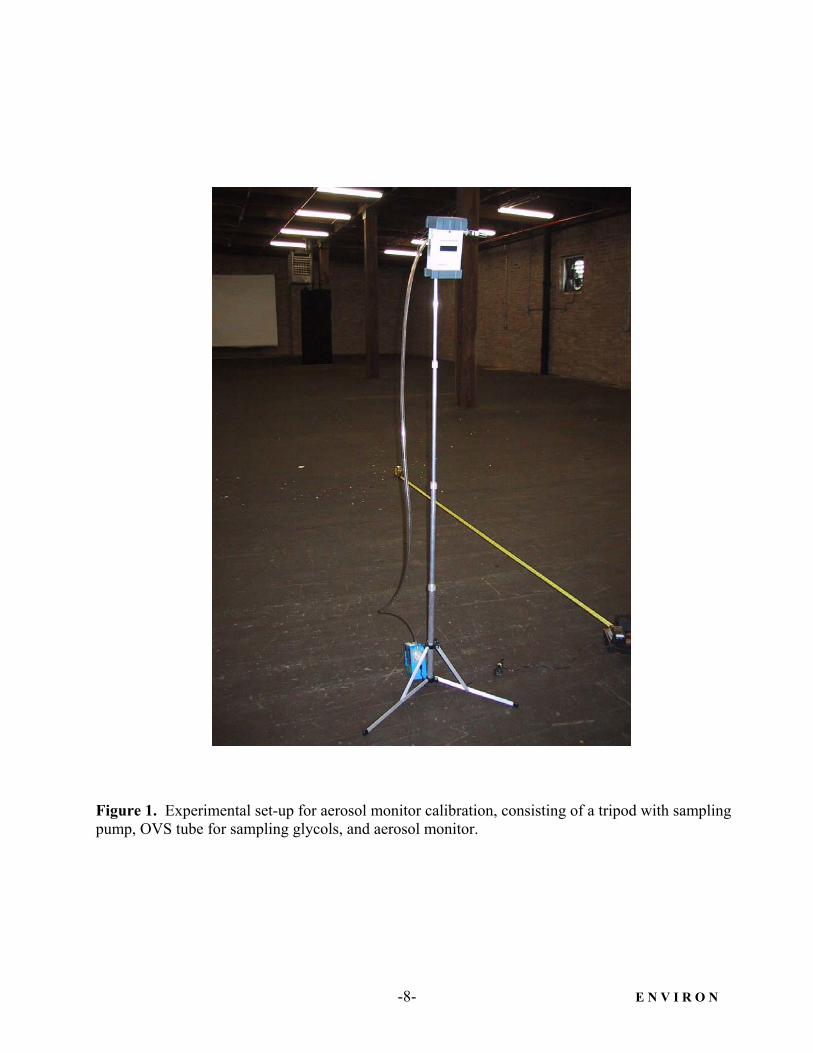
Four to six tripod assemblies were used for calibrating the aerosol monitors, each consisting of a sampling pump, flexible tubing, sampling media (OVS trap for glycols and cassettes for mineral oil and glycerol), and an aerosol monitor (see Figure 1). The height of each tripod was approximately five feet, corresponding with the breathing zone of a typical actor. The room ventilation fans were turned off during each run; no major movement occurred in the testing room during each run that would affect smoke dispersion.
a) The sampling pumps were calibrated to 2 liters per minute (LPM) using a BIOS
DryCal pump calibrator. The aerosol monitors were zeroed, the data logging function of the aerosol monitor was turned on, and the data logging times for all of the aerosol monitors were synchronized.
b) The smoke machines were positioned on a bench to allow a release of smoke at a
height of four to five feet. Hazers were placed on the floor. The tripods were placed at various distances from the smoke machine release nozzle to achieve a range of exposure concentrations.
c) The sampling pumps were turned on, followed by the smoke or haze machines,
allowing sustained smoke or haze generation to occur. After a period of approximately one minute, the machines and pumps were simultaneously turned off. Hazers were operated for longer periods of time, ranging from five to ten minutes.
d) For glycol fluids, the OVS traps were capped and labeled to identify the type of
smoke machine, glycol fluid, sampling location, and other sampling specifics. After being capped and labeled, the OVS traps were placed in a cooler with ice packs. For mineral oil or glycerol fluids, the cassettes were capped and appropriately labeled.
e) Various fans were used between runs to clear residual aerosols from the testing area
air by room ventilation.
The collection media and bulk fluid samples, along with appropriate field blanks, were submitted for analysis to Analytics Laboratory of Richmond, Virginia, an American Industrial Hygiene Association (AIHA) accredited laboratory.
-7- E N V I R O N
D. Laboratory Analyses
All sample analyses were conducted by using validated analytical methodologies, as described in the ENVIRON Air Sampling Protocol (ENVIRON 2001a).
1. Glycols
Samples were analyzed for glycols using a variation of NIOSH Method 5523,
which involves the use of a gas chromatograph with a flame ionization detector (GC/FID). The NIOSH Method 5523 was extended to a validated level of quantification (LOQ) of 4.0 micrograms (µg) of each individual glycol per sample.
2. Mineral Oil
Mineral oil samples were analyzed using a custom NIOSH Method 5026, which
involves analysis using infrared spectrophotometry, with a bulk mineral oil sample used instead of a stock mineral oil standard. A maximum LOQ of 50 µg per sample was used. 3. Glycerol
Glycerin mist samples were analyzed gravimetrically using NIOSH Method 0500.
A maximum LOQ of 10 µg per sample was used.
-8- E N V I R O N
Figure 1. Experimental set-up for aerosol monitor calibration, consisting of a tripod with sampling pump, OVS tube for sampling glycols, and aerosol monitor.
-9- E N V I R O N
(a) CITC FogMax (b) CITC Haze-Max
(c) CITC StarHazer (d) Jem Glaciator
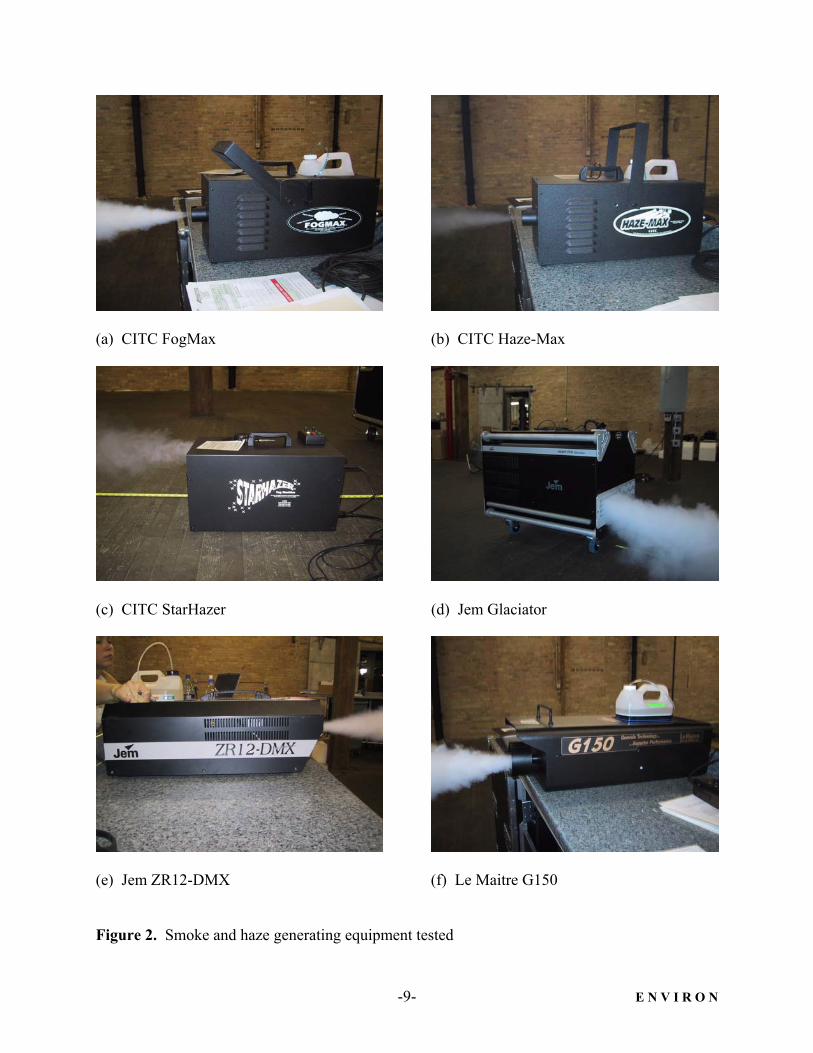
(e) Jem ZR12-DMX (f) Le Maitre G150 Figure 2. Smoke and haze generating equipment tested
-10- E N V I R O N
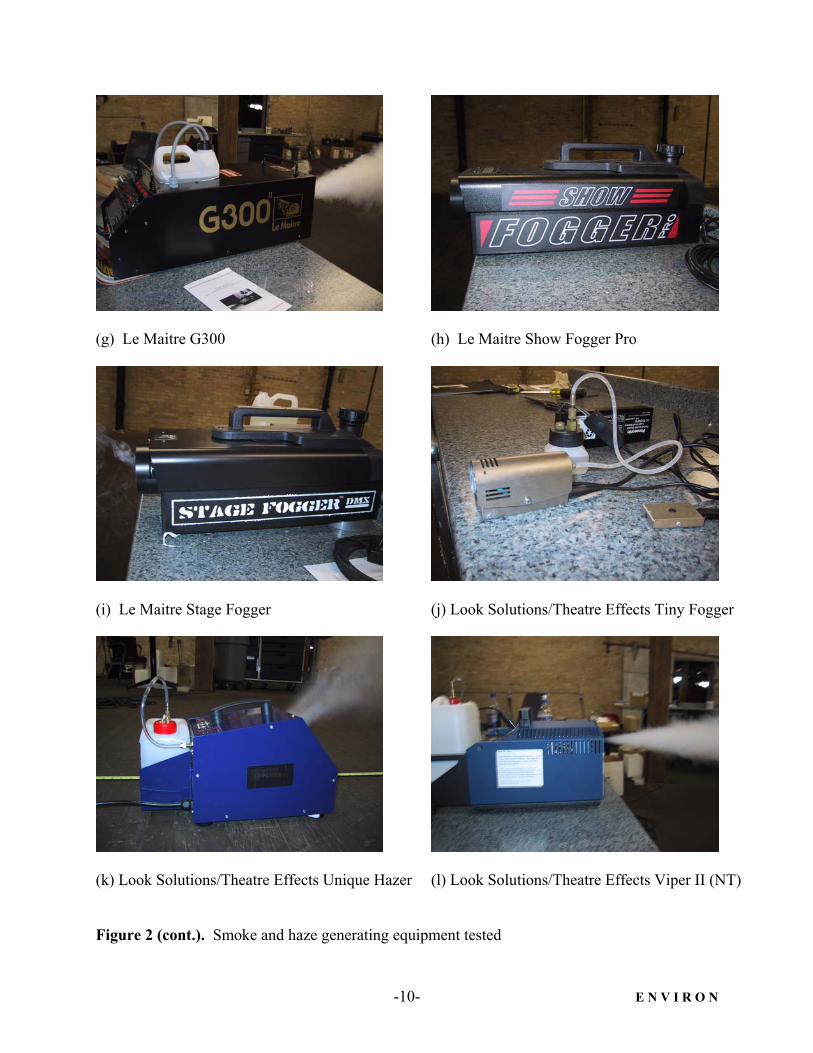
(g) Le Maitre G300 (h) Le Maitre Show Fogger Pro
(i) Le Maitre Stage Fogger (j) Look Solutions/Theatre Effects Tiny Fogger
(k) Look Solutions/Theatre Effects Unique Hazer (l) Look Solutions/Theatre Effects Viper II (NT) Figure 2 (cont.). Smoke and haze generating equipment tested
-11- E N V I R O N
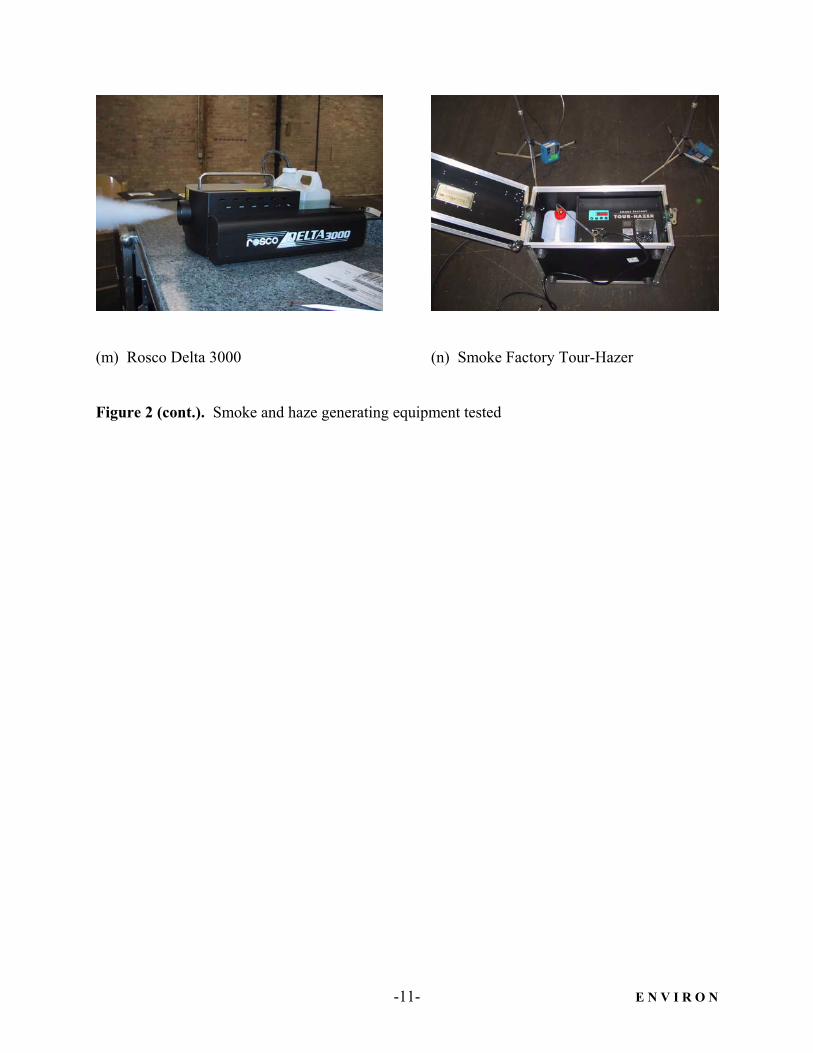
(m) Rosco Delta 3000 (n) Smoke Factory Tour-Hazer
Figure 2 (cont.). Smoke and haze generating equipment tested
-12- E N V I R O N
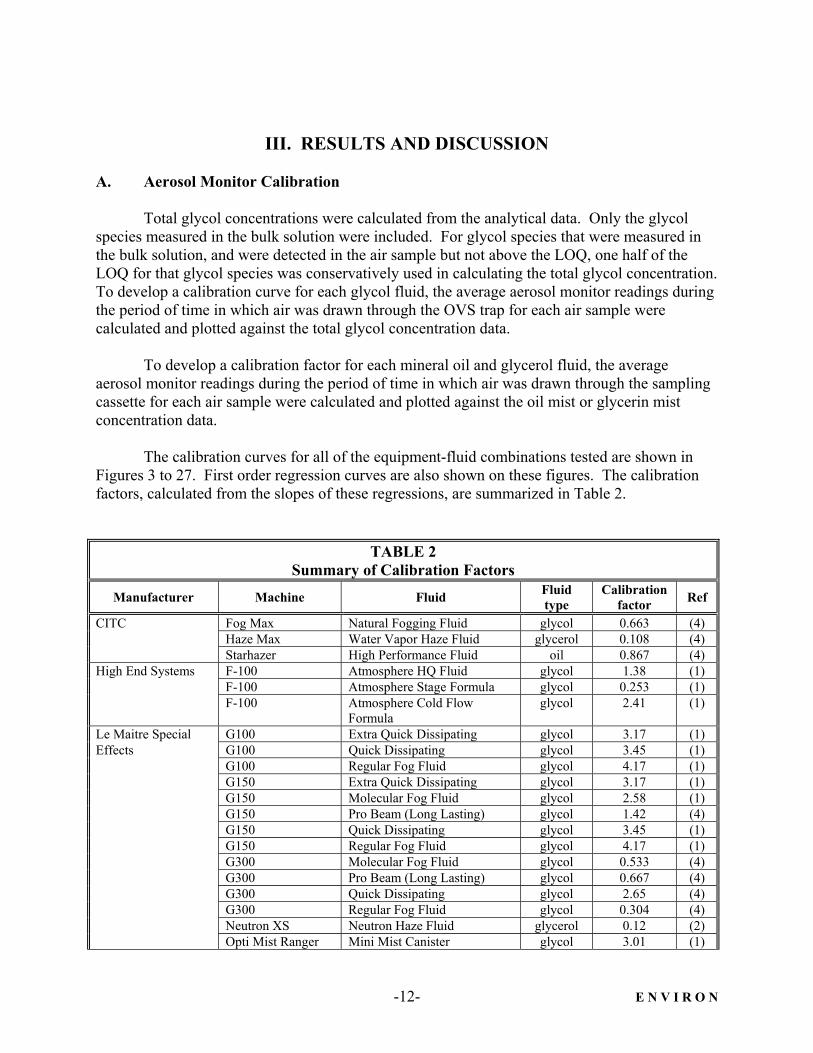
III. RESULTS AND DISCUSSION A. Aerosol Monitor Calibration
Total glycol concentrations were calculated from the analytical data. Only the glycol
species measured in the bulk solution were included. For glycol species that were measured in the bulk solution, and were detected in the air sample but not above the LOQ, one half of the LOQ for that glycol species was conservatively used in calculating the total glycol concentration. To develop a calibration curve for each glycol fluid, the average aerosol monitor readings during the period of time in which air was drawn through the OVS trap for each air sample were calculated and plotted against the total glycol concentration data.
To develop a calibration factor for each mineral oil and glycerol fluid, the average
aerosol monitor readings during the period of time in which air was drawn through the sampling cassette for each air sample were calculated and plotted against the oil mist or glycerin mist concentration data.
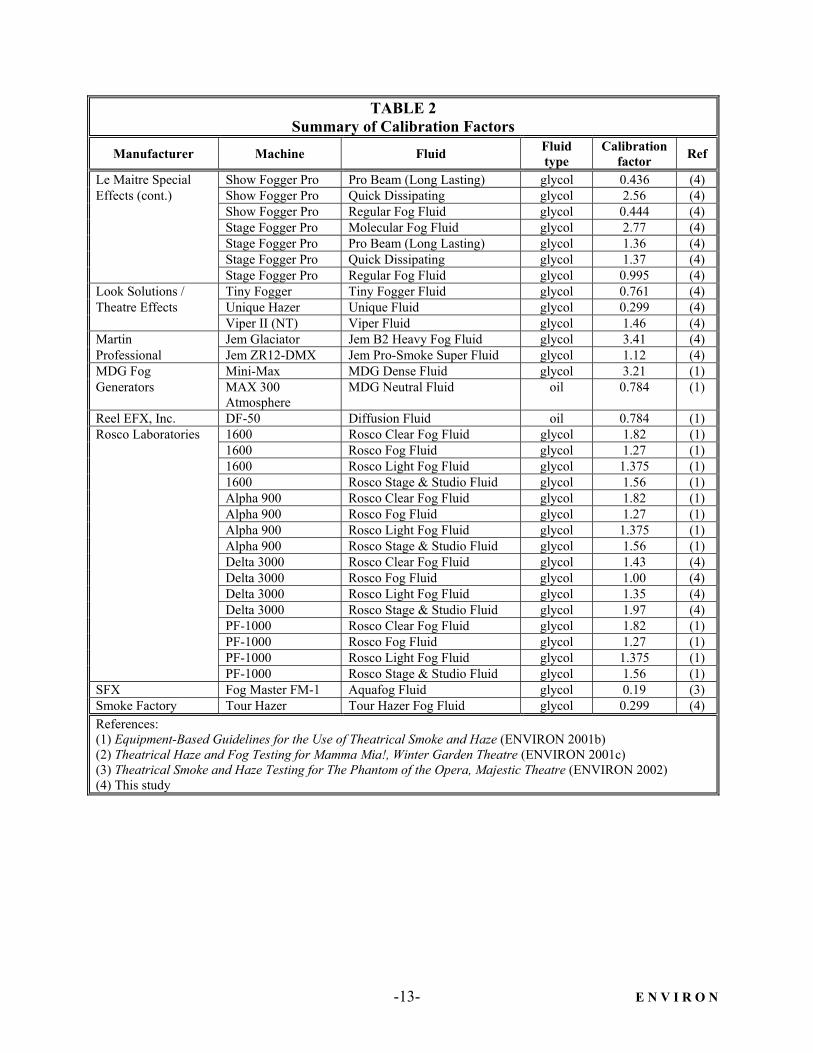
The calibration curves for all of the equipment-fluid combinations tested are shown in
Figures 3 to 27. First order regression curves are also shown on these figures. The calibration factors, calculated from the slopes of these regressions, are summarized in Table 2.
TABLE 2 Summary of Calibration Factors
Manufacturer Machine Fluid Fluid type
Calibration factor Ref
CITC Fog Max Natural Fogging Fluid glycol 0.663 (4) Haze Max Water Vapor Haze Fluid glycerol 0.108 (4) Starhazer High Performance Fluid oil 0.867 (4) High End Systems F-100 Atmosphere HQ Fluid glycol 1.38 (1) F-100 Atmosphere Stage Formula glycol 0.253 (1) F-100 Atmosphere Cold Flow
Formula glycol 2.41 (1)
Le Maitre Special G100 Extra Quick Dissipating glycol 3.17 (1) Effects G100 Quick Dissipating glycol 3.45 (1) G100 Regular Fog Fluid glycol 4.17 (1) G150 Extra Quick Dissipating glycol 3.17 (1) G150 Molecular Fog Fluid glycol 2.58 (1) G150 Pro Beam (Long Lasting) glycol 1.42 (4) G150 Quick Dissipating glycol 3.45 (1) G150 Regular Fog Fluid glycol 4.17 (1) G300 Molecular Fog Fluid glycol 0.533 (4) G300 Pro Beam (Long Lasting) glycol 0.667 (4) G300 Quick Dissipating glycol 2.65 (4) G300 Regular Fog Fluid glycol 0.304 (4) Neutron XS Neutron Haze Fluid glycerol 0.12 (2) Opti Mist Ranger Mini Mist Canister glycol 3.01 (1)
-13- E N V I R O N
TABLE 2 Summary of Calibration Factors
Manufacturer Machine Fluid Fluid type
Calibration factor Ref
Le Maitre Special Show Fogger Pro Pro Beam (Long Lasting) glycol 0.436 (4) Effects (cont.) Show Fogger Pro Quick Dissipating glycol 2.56 (4) Show Fogger Pro Regular Fog Fluid glycol 0.444 (4) Stage Fogger Pro Molecular Fog Fluid glycol 2.77 (4) Stage Fogger Pro Pro Beam (Long Lasting) glycol 1.36 (4) Stage Fogger Pro Quick Dissipating glycol 1.37 (4) Stage Fogger Pro Regular Fog Fluid glycol 0.995 (4) Look Solutions / Tiny Fogger Tiny Fogger Fluid glycol 0.761 (4) Theatre Effects Unique Hazer Unique Fluid glycol 0.299 (4) Viper II (NT) Viper Fluid glycol 1.46 (4) Martin Jem Glaciator Jem B2 Heavy Fog Fluid glycol 3.41 (4) Professional Jem ZR12-DMX Jem Pro-Smoke Super Fluid glycol 1.12 (4) MDG Fog Mini-Max MDG Dense Fluid glycol 3.21 (1) Generators MAX 300
Atmosphere MDG Neutral Fluid oil 0.784 (1)
Reel EFX, Inc. DF-50 Diffusion Fluid oil 0.784 (1) Rosco Laboratories 1600 Rosco Clear Fog Fluid glycol 1.82 (1) 1600 Rosco Fog Fluid glycol 1.27 (1) 1600 Rosco Light Fog Fluid glycol 1.375 (1) 1600 Rosco Stage & Studio Fluid glycol 1.56 (1) Alpha 900 Rosco Clear Fog Fluid glycol 1.82 (1) Alpha 900 Rosco Fog Fluid glycol 1.27 (1) Alpha 900 Rosco Light Fog Fluid glycol 1.375 (1) Alpha 900 Rosco Stage & Studio Fluid glycol 1.56 (1) Delta 3000 Rosco Clear Fog Fluid glycol 1.43 (4) Delta 3000 Rosco Fog Fluid glycol 1.00 (4) Delta 3000 Rosco Light Fog Fluid glycol 1.35 (4) Delta 3000 Rosco Stage & Studio Fluid glycol 1.97 (4) PF-1000 Rosco Clear Fog Fluid glycol 1.82 (1) PF-1000 Rosco Fog Fluid glycol 1.27 (1) PF-1000 Rosco Light Fog Fluid glycol 1.375 (1) PF-1000 Rosco Stage & Studio Fluid glycol 1.56 (1) SFX Fog Master FM-1 Aquafog Fluid glycol 0.19 (3) Smoke Factory Tour Hazer Tour Hazer Fog Fluid glycol 0.299 (4) References: (1) Equipment-Based Guidelines for the Use of Theatrical Smoke and Haze (ENVIRON 2001b) (2) Theatrical Haze and Fog Testing for Mamma Mia!, Winter Garden Theatre (ENVIRON 2001c) (3) Theatrical Smoke and Haze Testing for The Phantom of the Opera, Majestic Theatre (ENVIRON 2002) (4) This study
-14- E N V I R O N
B. Use of Calibration Factors
The real-time aerosol monitor readings can be converted to glycol, mineral oil, or glycerol concentrations using the appropriate calibration factor for the fluid, as follows: PDRCCONC ×= where: CONC = air concentration of total glycols, mineral oil, or glycerin mist, mg/m3 C = aerosol monitor calibration factor (from Table 2), (mg/m3)/(mg/m3 aerosol) PDR = aerosol monitor reading, mg/m3 These calculated concentrations can then be compared with the peak guidance levels.
-15- E N V I R O N
CITCFog Max / Natural Fogging Fluid
Average PDR Concentration (mg/m³)
0 50 100 150 200 250
Tota
l Gly
col C
once
ntra
tion
(mg/
m3 )
(Lab
orat
ory
Anal
yzed
)
0
20
40
60
80
100
120
140
160
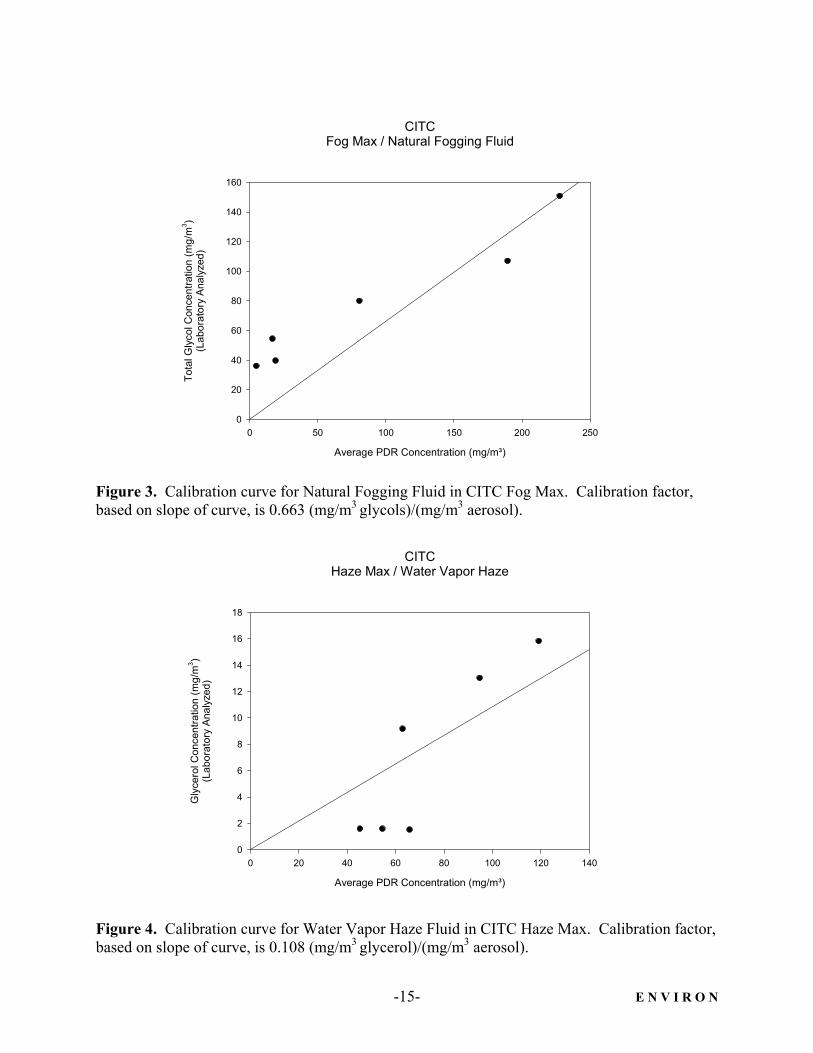
Figure 3. Calibration curve for Natural Fogging Fluid in CITC Fog Max. Calibration factor, based on slope of curve, is 0.663 (mg/m3 glycols)/(mg/m3 aerosol).
CITCHaze Max / Water Vapor Haze
Average PDR Concentration (mg/m³)
0 20 40 60 80 100 120 140
Gly
cero
l Con
cent
ratio
n (m
g/m
3 )(L
abor
ator
y An
alyz
ed)
0
2
4
6
8
10
12
14
16
18
Figure 4. Calibration curve for Water Vapor Haze Fluid in CITC Haze Max. Calibration factor, based on slope of curve, is 0.108 (mg/m3 glycerol)/(mg/m3 aerosol).
-16- E N V I R O N
CITCStarhazer / High Performance Fluid
Average PDR Concentration (mg/m³)
0 20 40 60 80 100 120 140
Min
eral
Oil
Con
cent
ratio
n (m
g/m
3 )(L
abor
ator
y An
alyz
ed)
0
20
40
60
80
100
120
140
160
180
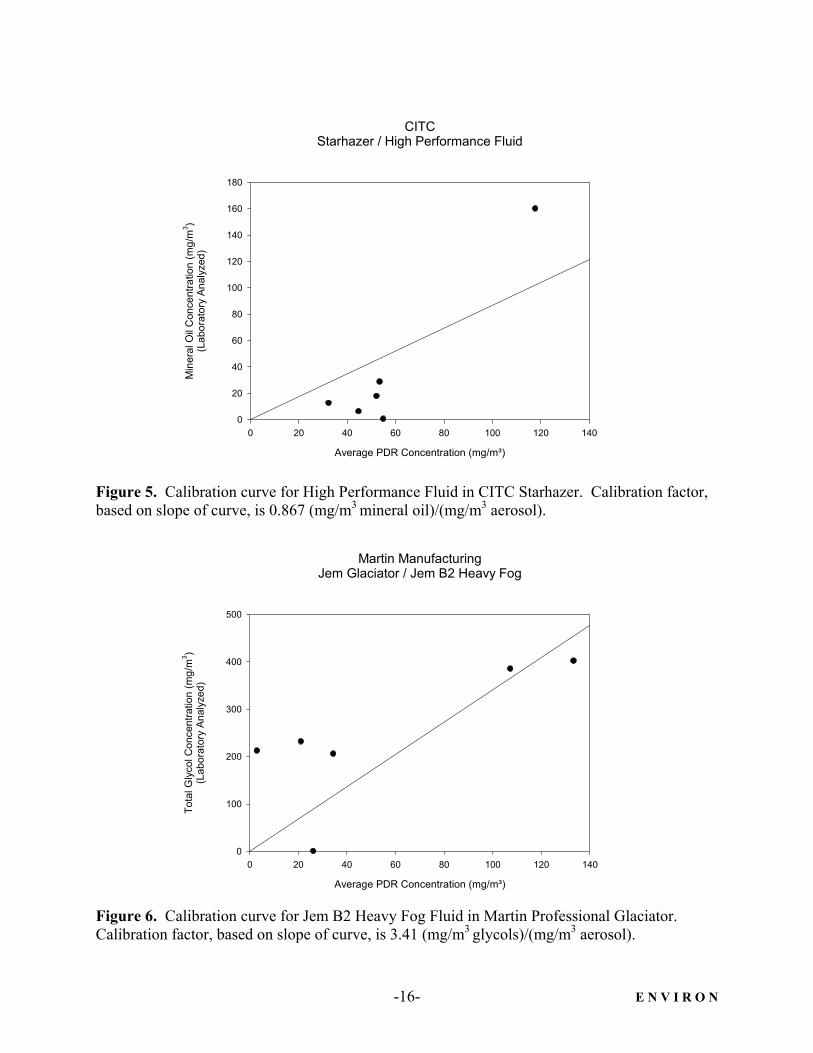
Figure 5. Calibration curve for High Performance Fluid in CITC Starhazer. Calibration factor, based on slope of curve, is 0.867 (mg/m3 mineral oil)/(mg/m3 aerosol).
Martin ManufacturingJem Glaciator / Jem B2 Heavy Fog
Average PDR Concentration (mg/m³)
0 20 40 60 80 100 120 140
Tota
l Gly
col C
once
ntra
tion
(mg/
m3 )
(Lab
orat
ory
Anal
yzed
)
0
100
200
300
400
500
Figure 6. Calibration curve for Jem B2 Heavy Fog Fluid in Martin Professional Glaciator. Calibration factor, based on slope of curve, is 3.41 (mg/m3 glycols)/(mg/m3 aerosol).
-17- E N V I R O N
Martin ManufacturingJem ZR12DMX / Jem Pro-Smoke Super
Average PDR Concentration (mg/m³)
0 50 100 150 200 250 300
Tota
l Gly
col C
once
ntra
tion
(mg/
m3 )
(Lab
orat
ory
Anal
yzed
)
0
100
200
300
400
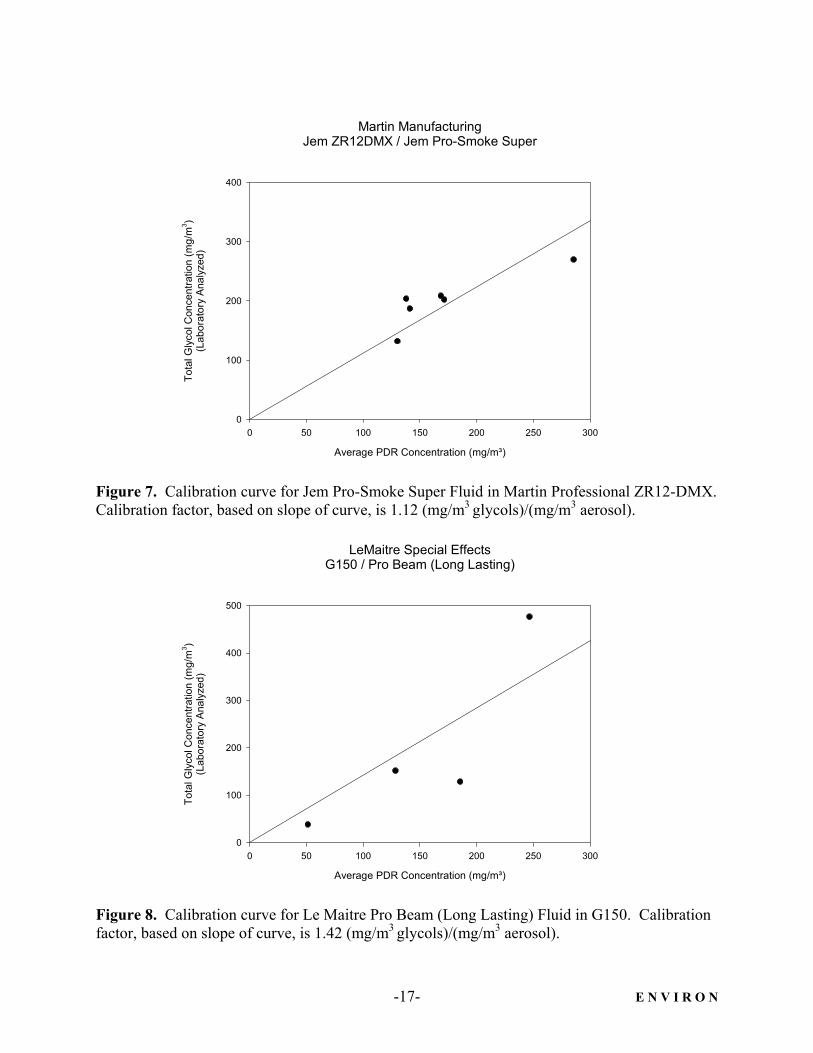
Figure 7. Calibration curve for Jem Pro-Smoke Super Fluid in Martin Professional ZR12-DMX. Calibration factor, based on slope of curve, is 1.12 (mg/m3 glycols)/(mg/m3 aerosol).
LeMaitre Special EffectsG150 / Pro Beam (Long Lasting)
Average PDR Concentration (mg/m³)
0 50 100 150 200 250 300
Tota
l Gly
col C
once
ntra
tion
(mg/
m3 )
(Lab
orat
ory
Anal
yzed
)
0
100
200
300
400
500
Figure 8. Calibration curve for Le Maitre Pro Beam (Long Lasting) Fluid in G150. Calibration factor, based on slope of curve, is 1.42 (mg/m3 glycols)/(mg/m3 aerosol).
-18- E N V I R O N
LeMaitre Special EffectsG300 / Molecular Fog Fluid
Average PDR Concentration (mg/m³)
0 50 100 150 200
Tota
l Gly
col C
once
ntra
tion
(mg/
m3 )
(Lab
orat
ory
Anal
yzed
)
0
10
20
30
40
50
60
70
80
90
100
110
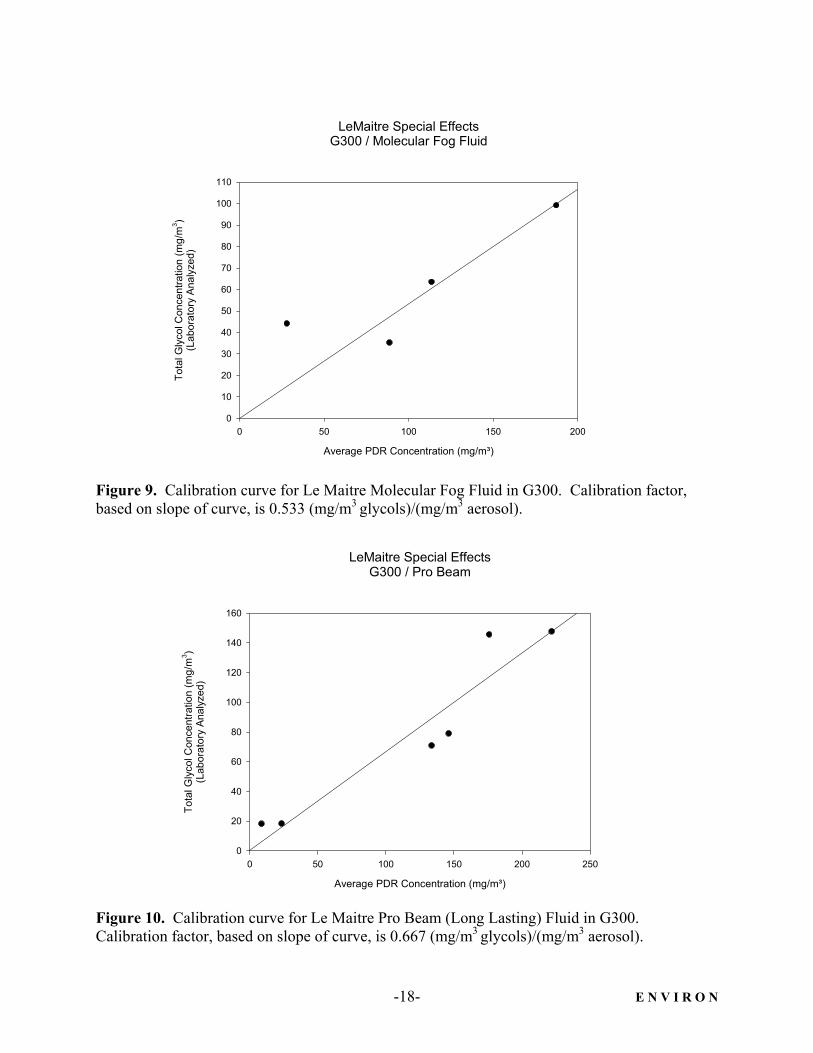
Figure 9. Calibration curve for Le Maitre Molecular Fog Fluid in G300. Calibration factor, based on slope of curve, is 0.533 (mg/m3 glycols)/(mg/m3 aerosol).
LeMaitre Special EffectsG300 / Pro Beam
Average PDR Concentration (mg/m³)
0 50 100 150 200 250
Tota
l Gly
col C
once
ntra
tion
(mg/
m3 )
(Lab
orat
ory
Anal
yzed
)
0
20
40
60
80
100
120
140
160
Figure 10. Calibration curve for Le Maitre Pro Beam (Long Lasting) Fluid in G300. Calibration factor, based on slope of curve, is 0.667 (mg/m3 glycols)/(mg/m3 aerosol).
-19- E N V I R O N
LeMaitre Special EffectsG300 / Quick Dissipating Fluid
Average PDR Concentration (mg/m³)
0 50 100 150 200
Tota
l Gly
col C
once
ntra
tion
(mg/
m3 )
(Lab
orat
ory
Anal
yzed
)
0
100
200
300
400
500
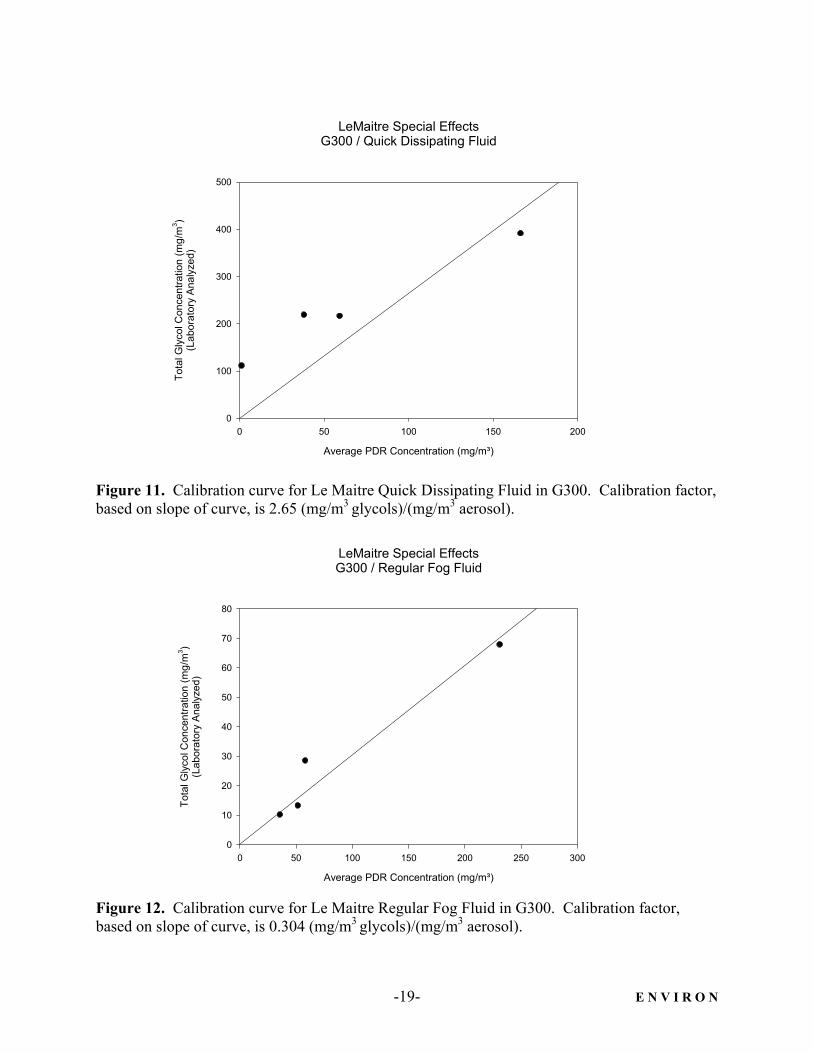
Figure 11. Calibration curve for Le Maitre Quick Dissipating Fluid in G300. Calibration factor, based on slope of curve, is 2.65 (mg/m3 glycols)/(mg/m3 aerosol).
LeMaitre Special EffectsG300 / Regular Fog Fluid
Average PDR Concentration (mg/m³)
0 50 100 150 200 250 300
Tota
l Gly
col C
once
ntra
tion
(mg/
m3 )
(Lab
orat
ory
Anal
yzed
)
0
10
20
30
40
50
60
70
80
Figure 12. Calibration curve for Le Maitre Regular Fog Fluid in G300. Calibration factor, based on slope of curve, is 0.304 (mg/m3 glycols)/(mg/m3 aerosol).
-20- E N V I R O N
Le Maitre Special EffectsShow Fogger Pro / Pro Beam (Long Lasting)
Average PDR Concentration (mg/m³)
0 50 100 150 200 250 300
Tota
l Gly
col C
once
ntra
tion
(mg/
m3 )
(Lab
orat
ory
Anal
yzed
)
0
20
40
60
80
100
120
140
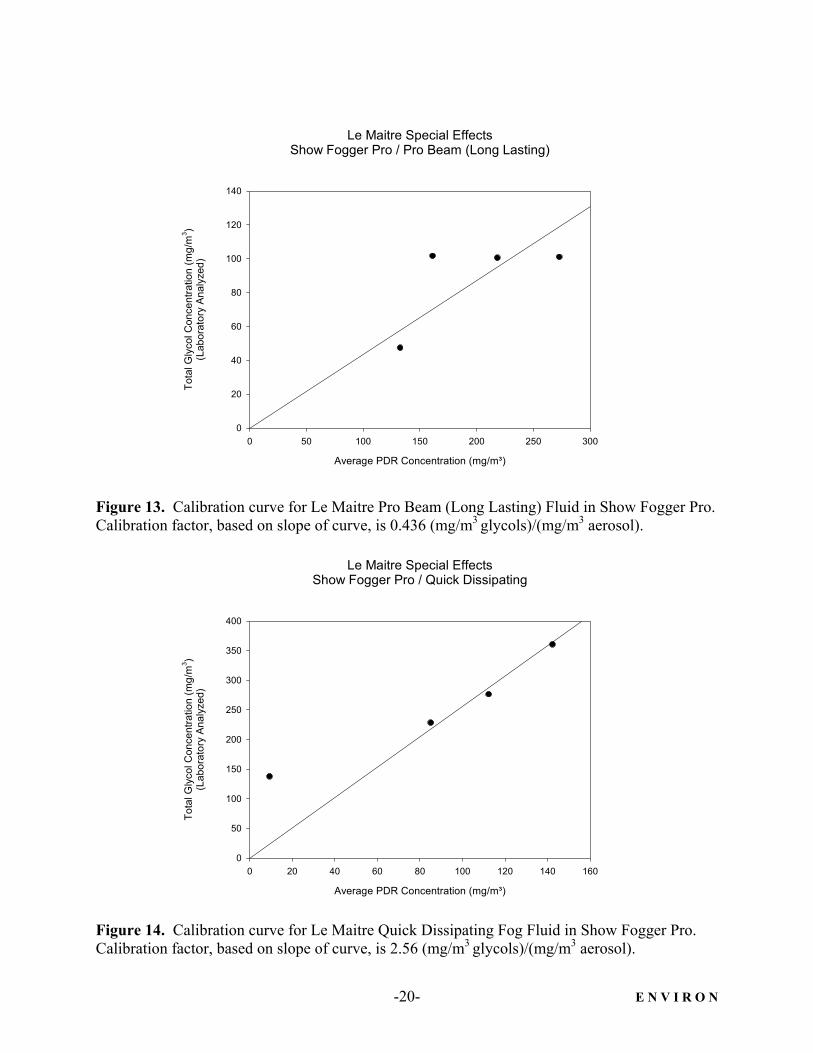
Figure 13. Calibration curve for Le Maitre Pro Beam (Long Lasting) Fluid in Show Fogger Pro. Calibration factor, based on slope of curve, is 0.436 (mg/m3 glycols)/(mg/m3 aerosol).
Le Maitre Special EffectsShow Fogger Pro / Quick Dissipating
Average PDR Concentration (mg/m³)
0 20 40 60 80 100 120 140 160
Tota
l Gly
col C
once
ntra
tion
(mg/
m3 )
(Lab
orat
ory
Anal
yzed
)
0
50
100
150
200
250
300
350
400
Figure 14. Calibration curve for Le Maitre Quick Dissipating Fog Fluid in Show Fogger Pro. Calibration factor, based on slope of curve, is 2.56 (mg/m3 glycols)/(mg/m3 aerosol).
-21- E N V I R O N
Le Maitre Special EffectsShow Fogger Pro / Regular Fog Fluid
Average PDR Concentration (mg/m³)
0 50 100
Tota
l Gly
col C
once
ntra
tion
(mg/
m3 )
(Lab
orat
ory
Anal
yzed
)
0
10
20
30
40
50
60
70
80
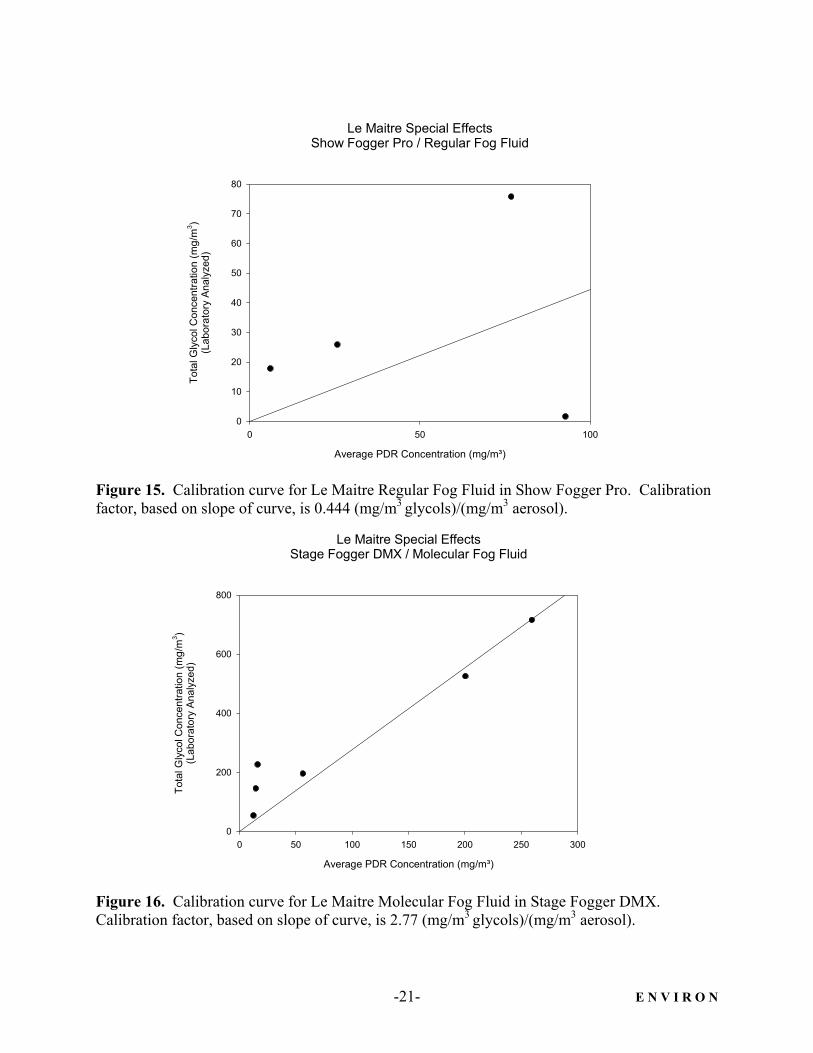
Figure 15. Calibration curve for Le Maitre Regular Fog Fluid in Show Fogger Pro. Calibration factor, based on slope of curve, is 0.444 (mg/m3 glycols)/(mg/m3 aerosol).
Le Maitre Special EffectsStage Fogger DMX / Molecular Fog Fluid
Average PDR Concentration (mg/m³)
0 50 100 150 200 250 300
Tota
l Gly
col C
once
ntra
tion
(mg/
m3 )
(Lab
orat
ory
Anal
yzed
)
0
200
400
600
800
Figure 16. Calibration curve for Le Maitre Molecular Fog Fluid in Stage Fogger DMX. Calibration factor, based on slope of curve, is 2.77 (mg/m3 glycols)/(mg/m3 aerosol).
-22- E N V I R O N
Le Maitre Special EffectsStage Fogger DMX / Pro Beam (Long Lasting)
Average PDR Concentration (mg/m³)
0 50 100 150 200 250 300
Tota
l Gly
col C
once
ntra
tion
(mg/
m3 )
(Lab
orat
ory
Anal
yzed
)
0
50
100
150
200
250
300
350
400
450
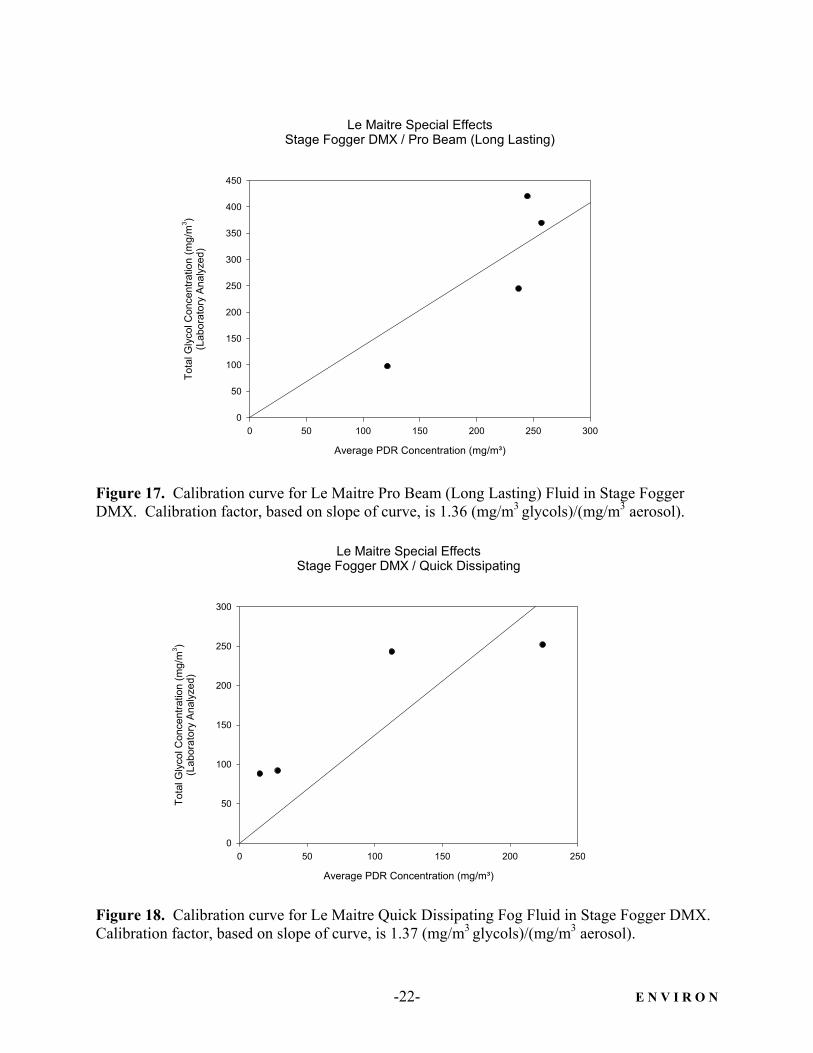
Figure 17. Calibration curve for Le Maitre Pro Beam (Long Lasting) Fluid in Stage Fogger DMX. Calibration factor, based on slope of curve, is 1.36 (mg/m3 glycols)/(mg/m3 aerosol).
Le Maitre Special EffectsStage Fogger DMX / Quick Dissipating
Average PDR Concentration (mg/m³)
0 50 100 150 200 250
Tota
l Gly
col C
once
ntra
tion
(mg/
m3 )
(Lab
orat
ory
Anal
yzed
)
0
50
100
150
200
250
300
Figure 18. Calibration curve for Le Maitre Quick Dissipating Fog Fluid in Stage Fogger DMX. Calibration factor, based on slope of curve, is 1.37 (mg/m3 glycols)/(mg/m3 aerosol).
-23- E N V I R O N
Le Maitre Special EffectsStage Fogger DMX / Regular Fog Fluid
Average PDR Concentration (mg/m³)
0 50 100 150 200 250 300
Tota
l Gly
col C
once
ntra
tion
(mg/
m3 )
(Lab
orat
ory
Anal
yzed
)
0
50
100
150
200
250
300
350
400
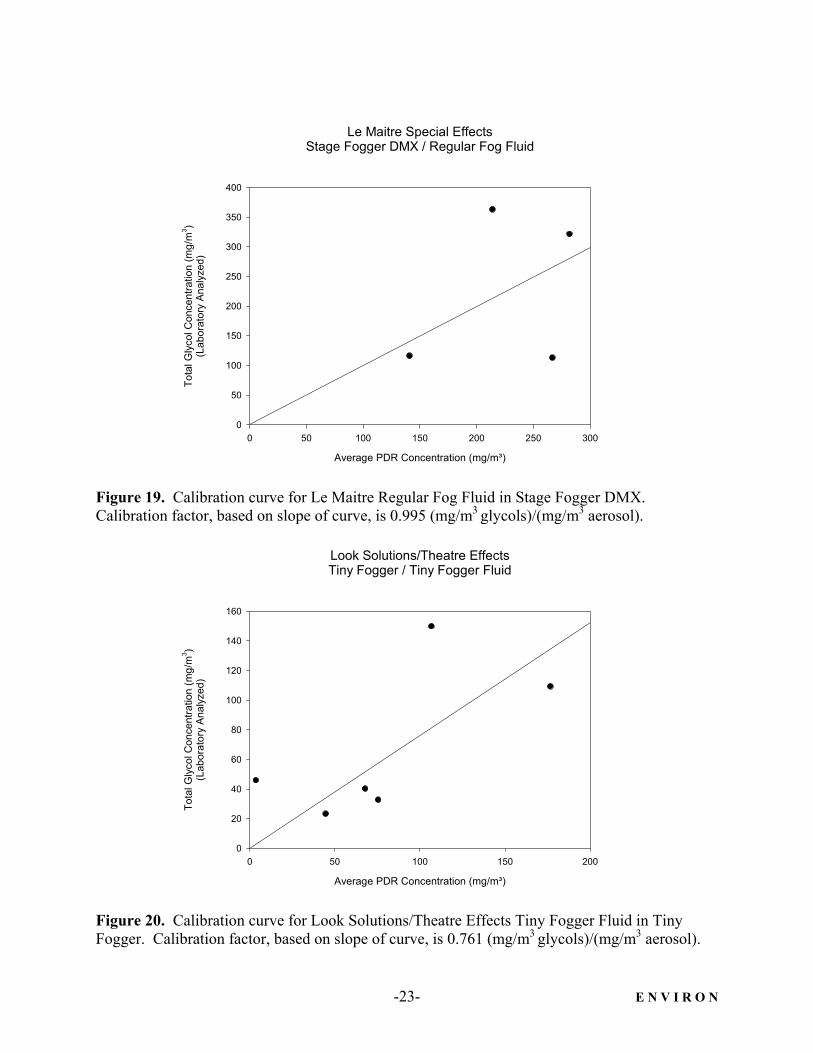
Figure 19. Calibration curve for Le Maitre Regular Fog Fluid in Stage Fogger DMX. Calibration factor, based on slope of curve, is 0.995 (mg/m3 glycols)/(mg/m3 aerosol).
Look Solutions/Theatre EffectsTiny Fogger / Tiny Fogger Fluid
Average PDR Concentration (mg/m³)
0 50 100 150 200
Tota
l Gly
col C
once
ntra
tion
(mg/
m3 )
(Lab
orat
ory
Anal
yzed
)
0
20
40
60
80
100
120
140
160
Figure 20. Calibration curve for Look Solutions/Theatre Effects Tiny Fogger Fluid in Tiny Fogger. Calibration factor, based on slope of curve, is 0.761 (mg/m3 glycols)/(mg/m3 aerosol).
-24- E N V I R O N
Look Solutions/Theatre EffectsUnique Hazer / Unique Fluid
Average PDR Concentration (mg/m³)
0 20 40 60 80 100 120 140
Tota
l Gly
col C
once
ntra
tion
(mg/
m3 )
(Lab
orat
ory
Anal
yzed
)
0
10
20
30
40
50
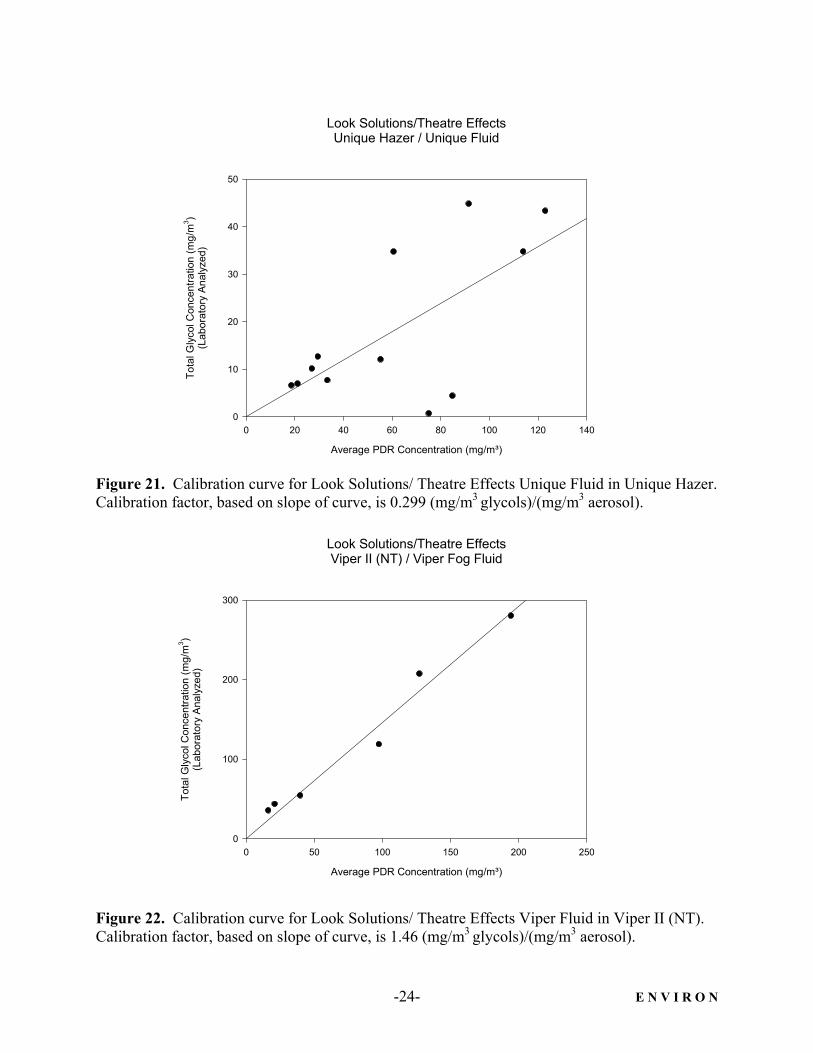
Figure 21. Calibration curve for Look Solutions/ Theatre Effects Unique Fluid in Unique Hazer. Calibration factor, based on slope of curve, is 0.299 (mg/m3 glycols)/(mg/m3 aerosol).
Look Solutions/Theatre EffectsViper II (NT) / Viper Fog Fluid
Average PDR Concentration (mg/m³)
0 50 100 150 200 250
Tota
l Gly
col C
once
ntra
tion
(mg/
m3 )
(Lab
orat
ory
Anal
yzed
)
0
100
200
300
Figure 22. Calibration curve for Look Solutions/ Theatre Effects Viper Fluid in Viper II (NT). Calibration factor, based on slope of curve, is 1.46 (mg/m3 glycols)/(mg/m3 aerosol).
-25- E N V I R O N
Rosco LaboratoriesDelta 3000 / Rosco Clear Fluid
Average PDR Concentration (mg/m³)
0 50 100 150 200 250
Tota
l Gly
col C
once
ntra
tion
(mg/
m3 )
(Lab
orat
ory
Anal
yzed
)
0
100
200
300
400
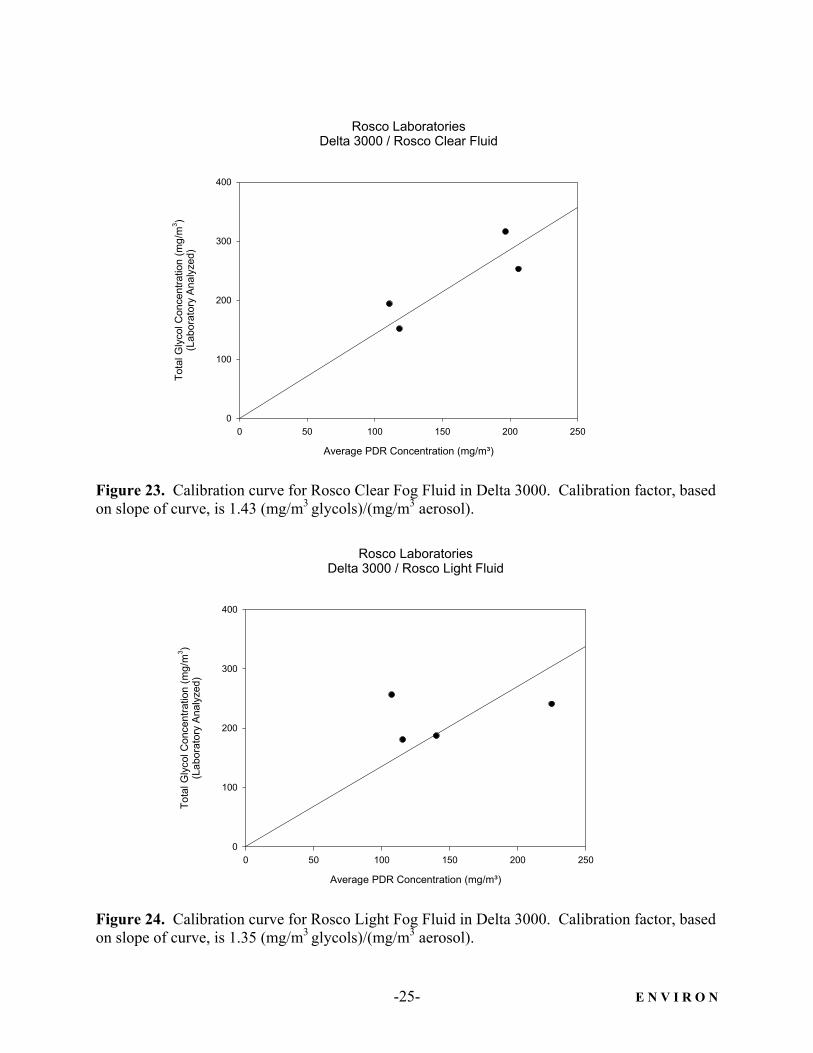
Figure 23. Calibration curve for Rosco Clear Fog Fluid in Delta 3000. Calibration factor, based on slope of curve, is 1.43 (mg/m3 glycols)/(mg/m3 aerosol).
Rosco LaboratoriesDelta 3000 / Rosco Light Fluid
Average PDR Concentration (mg/m³)
0 50 100 150 200 250
Tota
l Gly
col C
once
ntra
tion
(mg/
m3 )
(Lab
orat
ory
Anal
yzed
)
0
100
200
300
400
Figure 24. Calibration curve for Rosco Light Fog Fluid in Delta 3000. Calibration factor, based on slope of curve, is 1.35 (mg/m3 glycols)/(mg/m3 aerosol).
-26- E N V I R O N
Rosco LaboratoriesDelta 3000 / Rosco Fog Fluid
Average PDR Concentration (mg/m³)
0 50 100 150 200 250 300 350
Tota
l Gly
col C
once
ntra
tion
(mg/
m3 )
(Lab
orat
ory
Anal
yzed
)
0
100
200
300
400
500
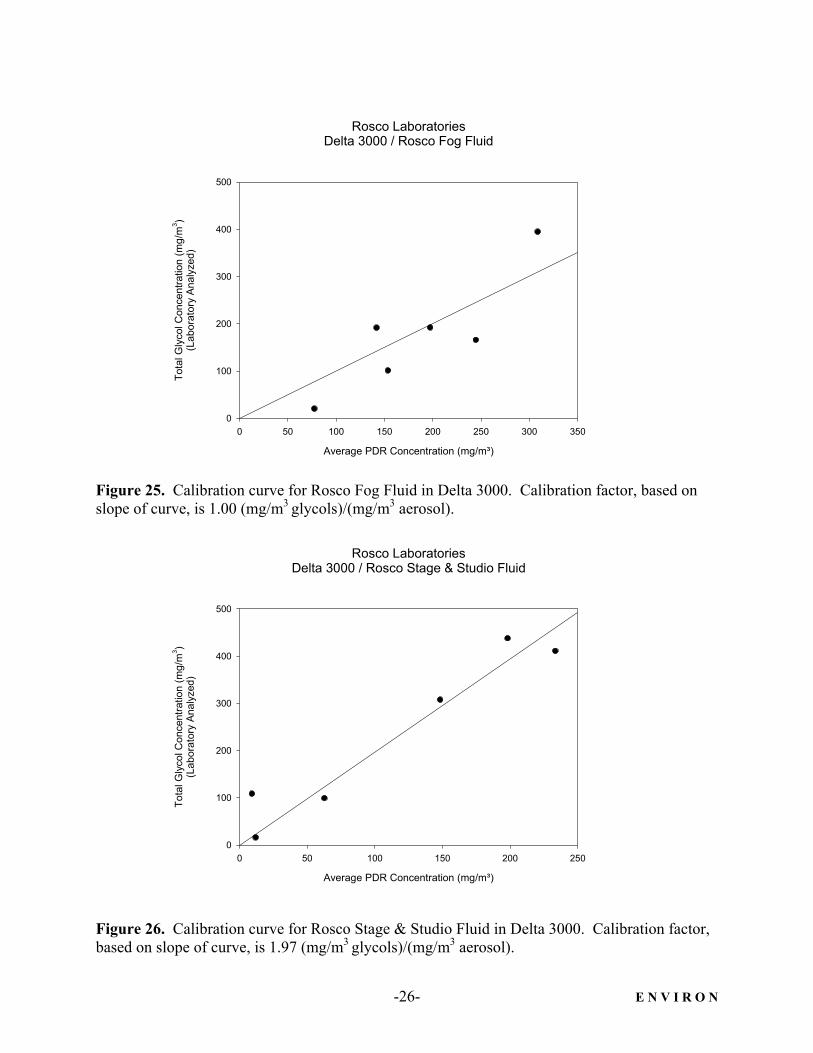
Figure 25. Calibration curve for Rosco Fog Fluid in Delta 3000. Calibration factor, based on slope of curve, is 1.00 (mg/m3 glycols)/(mg/m3 aerosol).
Rosco LaboratoriesDelta 3000 / Rosco Stage & Studio Fluid
Average PDR Concentration (mg/m³)
0 50 100 150 200 250
Tota
l Gly
col C
once
ntra
tion
(mg/
m3 )
(Lab
orat
ory
Anal
yzed
)
0
100
200
300
400
500
Figure 26. Calibration curve for Rosco Stage & Studio Fluid in Delta 3000. Calibration factor, based on slope of curve, is 1.97 (mg/m3 glycols)/(mg/m3 aerosol).
-27- E N V I R O N
Smoke FactoryTour Hazer / Tour Hazer Fog Fluid
Average PDR Concentration (mg/m³)
0 20 40 60 80 100 120 140
Tota
l Gly
col C
once
ntra
tion
(mg/
m3 )
(Lab
orat
ory
Anal
yzed
)
0
10
20
30
40
50
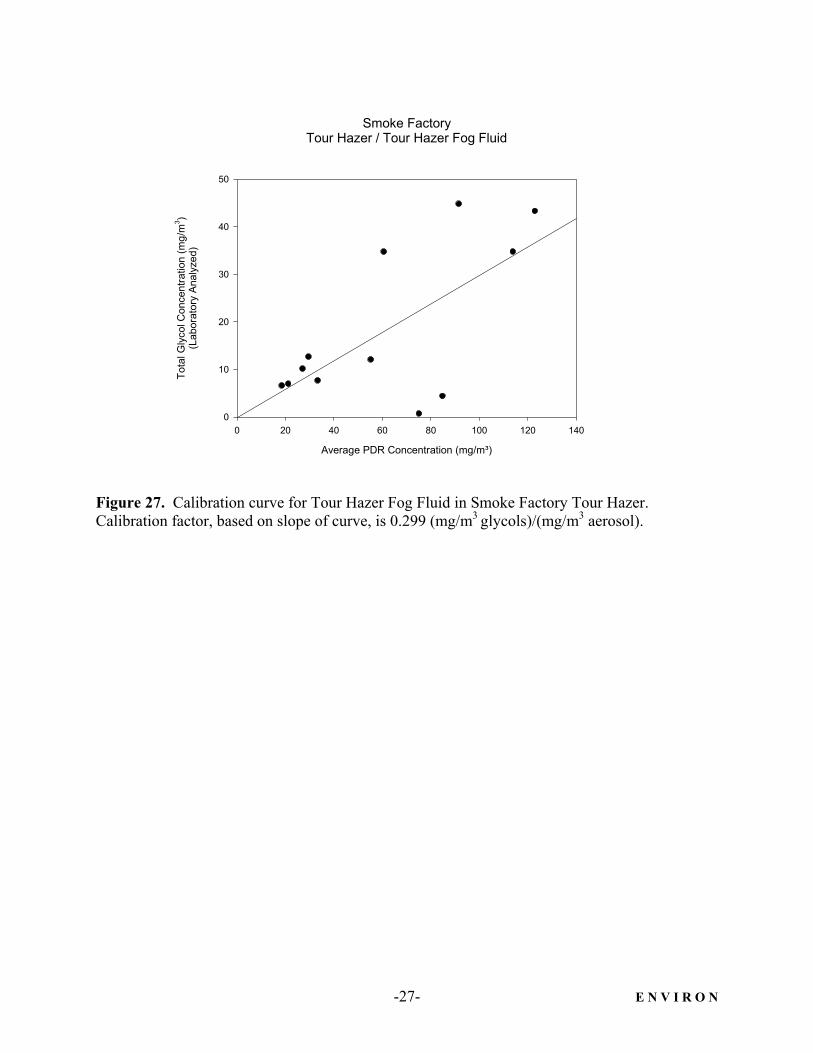
Figure 27. Calibration curve for Tour Hazer Fog Fluid in Smoke Factory Tour Hazer. Calibration factor, based on slope of curve, is 0.299 (mg/m3 glycols)/(mg/m3 aerosol).
-28- E N V I R O N
IV. REFERENCES ENVIRON International Corporation (ENVIRON). 2001a. Evaluation of short-term exposures
to theatrical smoke and haze: Air sampling protocol. Prepared for Equity-League Pension and Health Trust Funds. May 14.
ENVIRON International Corporation (ENVIRON). 2001b. Equipment-based guidelines for use
of theatrical smoke and haze. Revision 1. Prepared for Equity-League Pension and Health Trust Funds. June 8.
ENVIRON International Corporation (ENVIRON). 2001c. Theatrical Haze and Fog Testing for
Mamma Mia!, Winter Garden Theatre. Prepared for Mamma Mia! Broadway and Nina Lannan Associates. November 12.
ENVIRON International Corporation (ENVIRON). 2002. Theatrical Smoke and Haze Testing
for The Phantom of the Opera, Majestic Theatre. Prepared for Alan Wasser Associates. July.
Mount Sinai School of Medicine and ENVIRON International Corporation (Mt. Sinai and
ENVIRON). 2000. Health effects evaluation of theatrical smoke, haze, and pyrotechnics. Prepared for Equity-League Pension and Health Trust Funds. June 6.
National Institute for Occupational Safety and Health (NIOSH). 1994a. Method 0500:
Particulates Not Otherwise Regulated, Total, Issue 2. NIOSH Manual of Analytical Methods (NMAM). Fourth Edition. August 15.
National Institute for Occupational Safety and Health (NIOSH). 1994b. Method 5026: Oil mist,
mineral, Issue 2. NIOSH Manual of Analytical Methods (NMAM). Fourth Edition. August 15.
National Institute for Occupational Safety and Health (NIOSH). 1996. Method 5523: Glycols,
Issue 1. NIOSH Manual of Analytical Methods (NMAM). Fourth Edition. May 15. Pendergrass, S.M. 1999. Determination of glycols in air: Development of sampling and
analytical methodology and application to theatrical smokes. AIHA Journal, 60:452-457.