diagnostic shielding update - here at last! · 2004-08-19 · 3 history • aapm task group 9, 1989...
TRANSCRIPT

Diagnostic ShieldingDiagnostic ShieldingUpdate - Update - Here At Last!Here At Last!
Douglas J. Simpkin, Ph.D.
Aurora Health Care - St. Luke’s Med Ctr
Milwaukee, WI
www.execpc.com/~dsimpkin

2
HistoryHistory
• NBS Handbook 60 (1955) & Braestrup &Wykoff Health Physics Text (1958)
• NCRP Reports 34 (1972) & 49 (1976)
3
HistoryHistory
• AAPM Task Group 9, 1989– Interested individuals met at
AAPM meetings to discuss on-going concerns with practice ofshielding
– Ted Villafana, chair
• Joint NCRP ScientificCommittee SC-9 / AAPMTask Group 13 formed 1992 Your speaker as an eager
young physicist when thisproject started.
4
Cochairs
• Joel Gray– clinical/
industrymedicalphysicist
• Ben Archer– clinical
medicalphysicist
5
Membership
• Robert Dixon - clinical medical physicist
• Robert Quillin - Colorado state regulator (ret.).
• William Eide - architect
• Ray Rossi - clinical medical physicist(deceased)

6
Membership
• Lincoln Hubbard - clinical medical physicist
• Douglas Shearer - clinical medical physicist
• Douglas Simpkin - clinical medical physicist
• Eric Kearsley -– 2nd NCRP staff scientist (1998-2001) , first
outside reviewer
7
Consultants• Andrew Poznanski, M.D…..
• Ken Kase– Has helped shepherd the report through it’s final
reviews
• Wayne Thompson– Has kept us honest in the past couple of years,
independently redoing sample calculations,checking for self-consistency, & asking “Why?”
• Jack Krohmer (deceased)– Jack didn’t suffer fools lightly...

8
Membership
• Members met ~twiceper year (at AAPM &RSNM meetings), andfor extended weekends(to actually work)
Ben, Linc, Bob & I

9
Member Publications• As new methods were
developed, they werepeer-reviewed andpublished by themembers
• 16 refereed publicationscame out of Task Group 9/SC-9, including– 5 in Medical Physics
– 6 in Health Physics

10
Lectures• Medical / health physics community has been kept
informed of our progress throughout
• Per Archer’s count, 31 refresher courses / invitedlectures have been given by the members at AAPM,HPS, CRCPD, RSNA, AAPM & HPS Chapters, etc
11
HistoryHistory
• Initial draft prepared for NCRP Council review2001
• ~2/3 of council members responded, and many positive& minor editorial comments were received
• BUT 8 members voted for contingent approval and onemember voted for disapproval
12
NCRP Scientists Assigned to SC-9NCRP Scientists Assigned to SC-9
• James Spahn (1992-1998)
• Eric Kearsley (1998-2001)
• Marvin Rosenstein (2001-2004)– Implemented the steps necessary to get report
accepted, including• hammering out permitted dose in uncontrolled areas
• rewriting for technical accuracy
13
HistoryHistory• Final approvals from
NCRP 7/9/04 &AAPM 7/7/04
• NCRP Report No. 147“Structural ShieldingDesign for Medical X-ray ImagingFacilities” goes to theprinter shortly.
• Price?
147
StructuralShielding Designfor Medical X-ray ImagingFacilities

14
What’s in the New Report?What’s in the New Report?
• New report addresses shielding fordiagnostic x-ray imaging devices only
• No dental units– (cf. NCRP Report No. 145; x-ray shielding
section written by Marc Edwards)
• No therapy simulators or therapy machines– (separate task group; cf. Ray Wu & Jim Deye)
• No radionuclides.

15
The Qualified Expert
• “A medical (or medical health) physicistwho is competent to design radiationshielding for medical x-ray imagingfacilities. The QE is a person who is BoardCertified by ABR, ABMP, ABHP, orCCPM.”

16
Design Goal, Design Goal, PP
• Design Goal P = accepted radiation level tothe occupied area– P is now a kerma value
– P must be consistent with NRCP Report No116 (but these are effective dose equivalents,which can’t be measured)

17
DesignGoal P
Controlled areaUncontrolled
areas
NCRP-4950 mGy/y
=1 mGy/wk5 mGy/y
=0.1 mGy/wk
New report(based on
NCRP-116)
Fraction ( =½) of 10mGy/yr limit for new
operations= 5 mGy/yr (~matches
fetal dose limit)= 0.1 mGy/wk
1 mGy/y= 0.02 mGy/wk
Effect Factor of 10 decreaseFactor of 5decrease
186
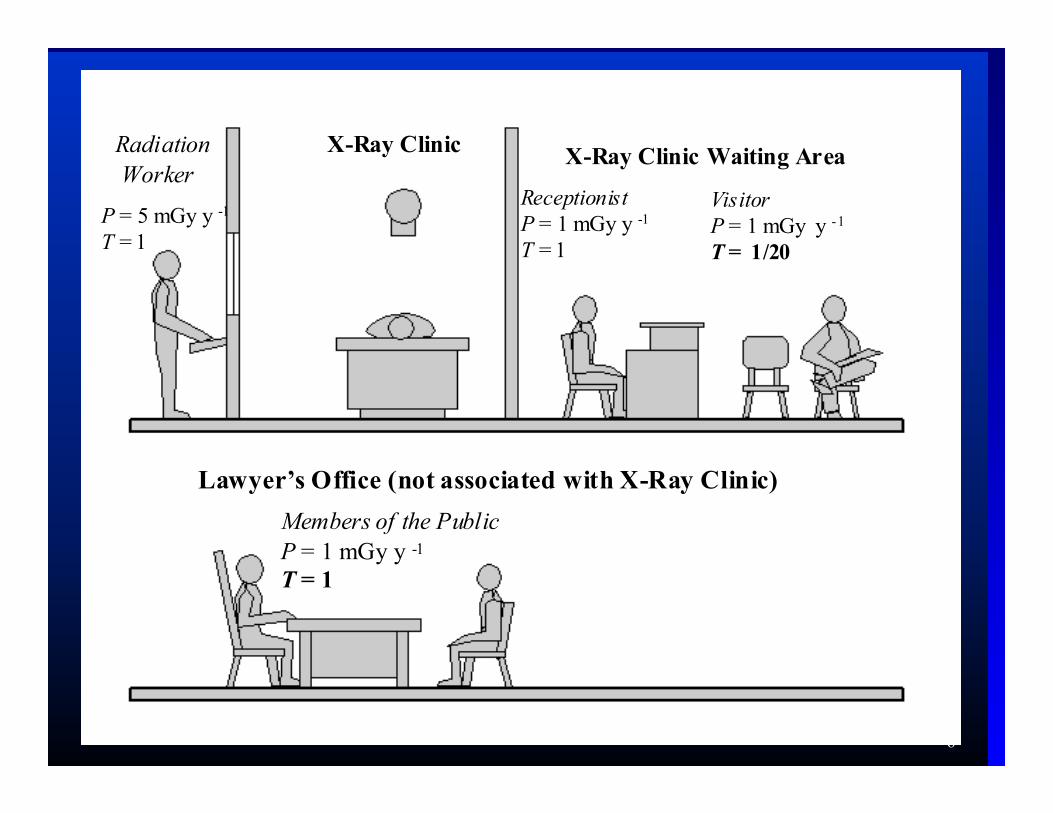
Radiation Worker
P = 5 mGy y -1 T = 1
VisitorP = 1 mGy y -1
T = 1/20
Lawyer’s Office (not associated with X-Ray Clinic)
ReceptionistP = 1 mGy y -1
T = 1
Members of the PublicP = 1 mGy y -1
T = 1
X-Ray Clinic X-Ray Clinic Waiting Area
19
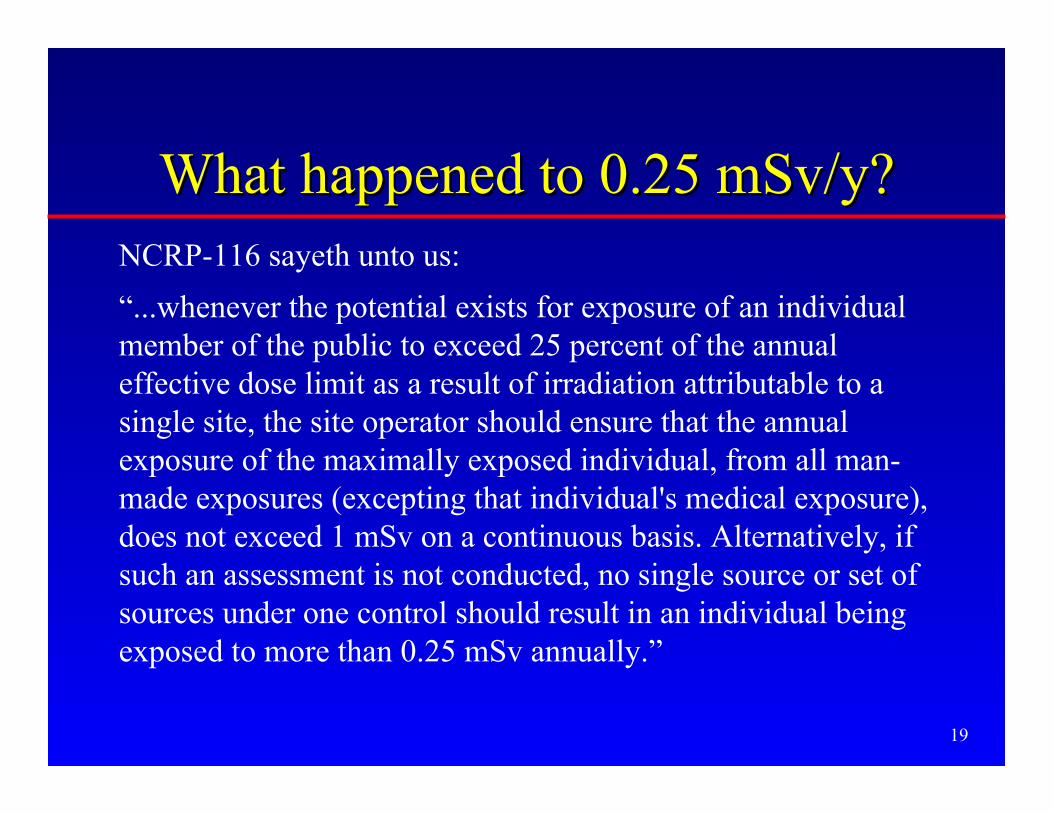
What happened to 0.25 mSv/y?What happened to 0.25 mSv/y?NCRP-116 sayeth unto us:
“...whenever the potential exists for exposure of an individualmember of the public to exceed 25 percent of the annualeffective dose limit as a result of irradiation attributable to asingle site, the site operator should ensure that the annualexposure of the maximally exposed individual, from all man-made exposures (excepting that individual's medical exposure),does not exceed 1 mSv on a continuous basis. Alternatively, ifsuch an assessment is not conducted, no single source or set ofsources under one control should result in an individual beingexposed to more than 0.25 mSv annually.”

20
What happened to 0.25 mSv/y?What happened to 0.25 mSv/y?
• NCRP had a change in leadership in 2003
• Thomas Tenforde 8/03: “The 0.25 mSv/yrecommendation in Report 116 dates back toNCRP Statement No. 6 on “Control of AirEmissions of Radionuclides” published in 1984.Its original intent was to limit public exposure toairborne emissions of radionuclides, and did notspecifically refer to other sources of externalradiation exposure.”
• NCRP is reviewing Report No. 116
21
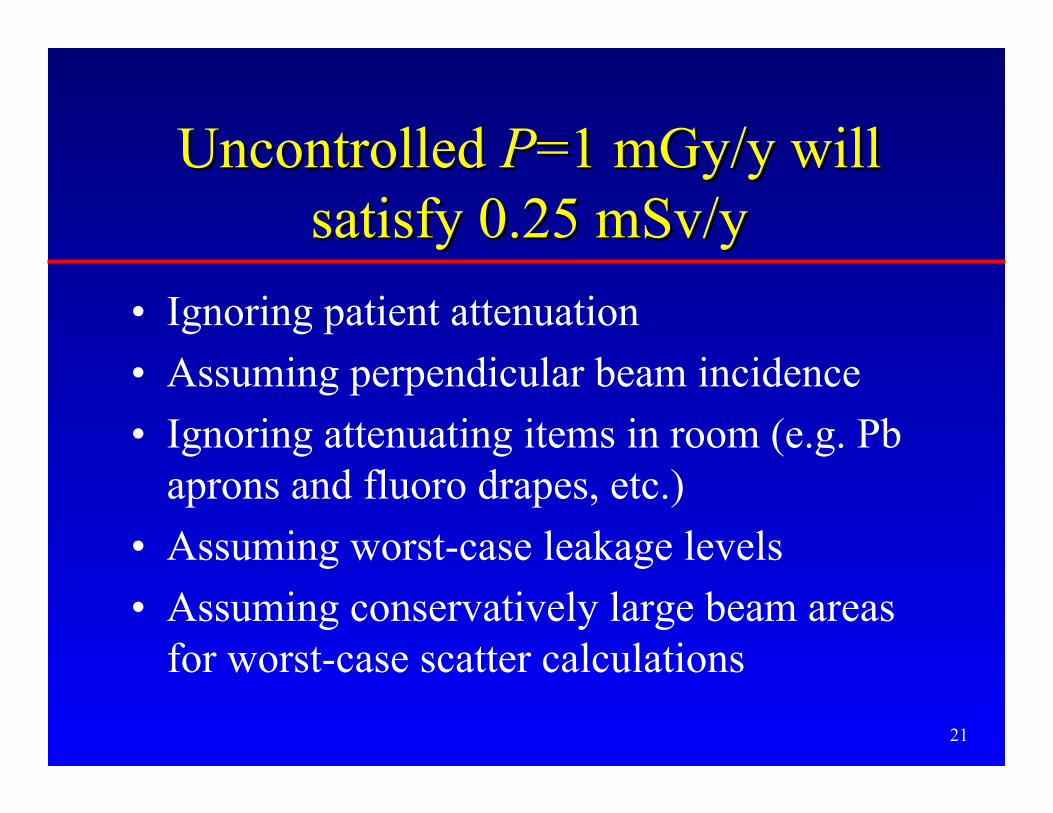
Uncontrolled Uncontrolled PP=1 mGy/y=1 mGy/y willwillsatisfy 0.25 mSv/ysatisfy 0.25 mSv/y
• Ignoring patient attenuation
• Assuming perpendicular beam incidence
• Ignoring attenuating items in room (e.g. Pbaprons and fluoro drapes, etc.)
• Assuming worst-case leakage levels
• Assuming conservatively large beam areasfor worst-case scatter calculations

22
Uncontrolled Uncontrolled PP=1 mGy/y=1 mGy/y willwillsatisfy 0.25 mSv/ysatisfy 0.25 mSv/y
• Assuming conservatively high occupancyfactors
• Pb sheets come in quantized thicknesses(e.g. 1/32 inch, 1/16 inch, etc). Using thenext greater thickness will shield to muchlower levels than P
• Assuming minimum distances from sourceto personnel in occupied areas

23
Uncontrolled Uncontrolled PP=1 mGy/y=1 mGy/y willwillsatisfy 0.25 mSv/ysatisfy 0.25 mSv/y
• At <50 keV, the Effective Dose Equivalentis a small fraction of the kerma (due toshielding of deep organs by overlyingtissues)
24
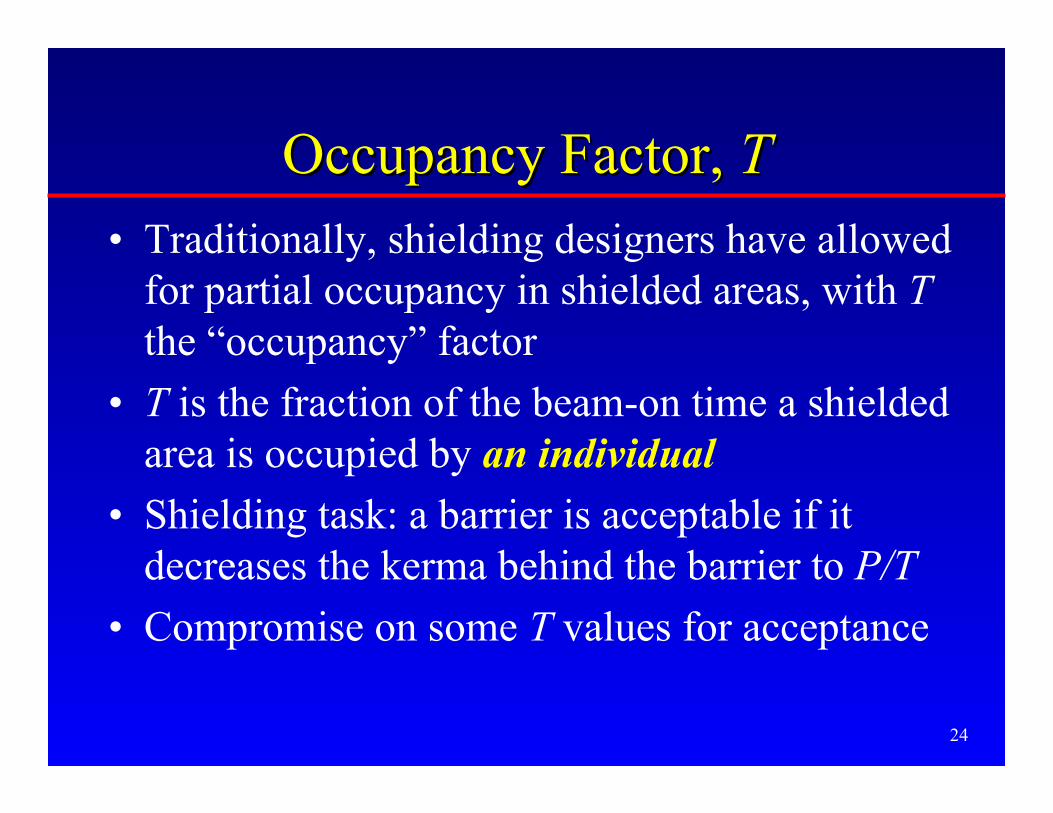
Occupancy Factor, Occupancy Factor, TT• Traditionally, shielding designers have allowed
for partial occupancy in shielded areas, with Tthe “occupancy” factor
• T is the fraction of the beam-on time a shieldedarea is occupied by an individual
• Shielding task: a barrier is acceptable if itdecreases the kerma behind the barrier to P/T
• Compromise on some T values for acceptance

25
Recommended Occupancy FactorsRecommended Occupancy FactorsOffices, labs, pharmacies, receptionist areas, attendedwaiting rooms, kids’ play areas, x-ray rooms, filmreading areas, nursing stations, x-ray control rooms
1
Patient exam & treatment rooms ½
Corridors, patient rooms, employee lounges, staff restrooms
1/5
Corridor doors 1/8
Public toilets, vending areas, storage rooms, outdoorareas w/ seating, unattended waiting rooms, patientholding
1/20
Outdoors, unattended parking lots, attics, stairways,unattended elevators, janitor’s closets
1/40
26
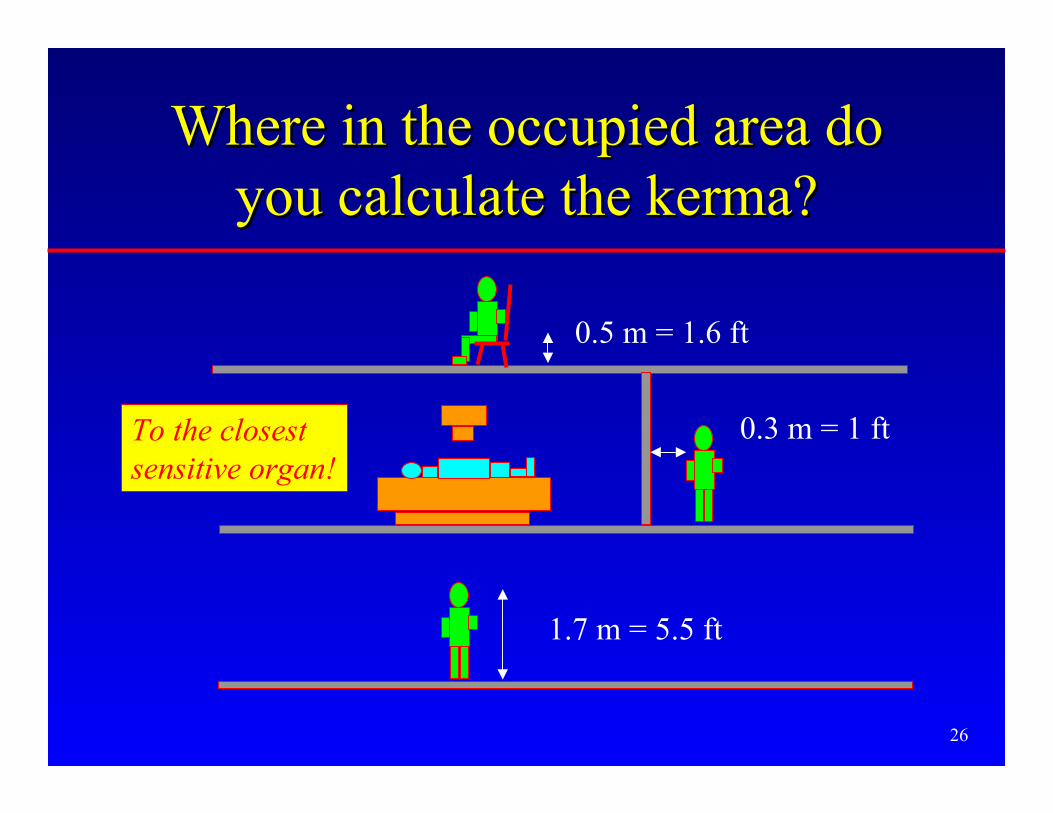
Where in the occupied area doWhere in the occupied area doyou calculate the kerma?you calculate the kerma?
1.7 m = 5.5 ft
0.3 m = 1 ft
0.5 m = 1.6 ft
To the closestsensitive organ!

27
X-ray Beam TransmissionX-ray Beam Transmission• For a given x-ray
spectrum, theTransmission, B,through a barrier ofthickness x is the ratioof kerma with &without the barrier
)0(
)()(
K
xKxB =
K(0)
K(x)
x
RadiationSource
Kermadetector

28
Sources of Transmission DataSources of Transmission Data• Measured or calculated B(x) data of modern
three phase /constant potential beams:– Archer et al. (1994) for Pb, gypsum wallboard,
steel, plate glass
– Légaré et al. (1977) / Rossi (1997) for concrete
– Simpkin (1987) for mammography
• Transmission data for a wide variety ofmaterials were interpolated to yield B(x)every 5 kVp (Simpkin 1995)
29
Archer Equation for Transmission CurvesArcher Equation for Transmission Curves
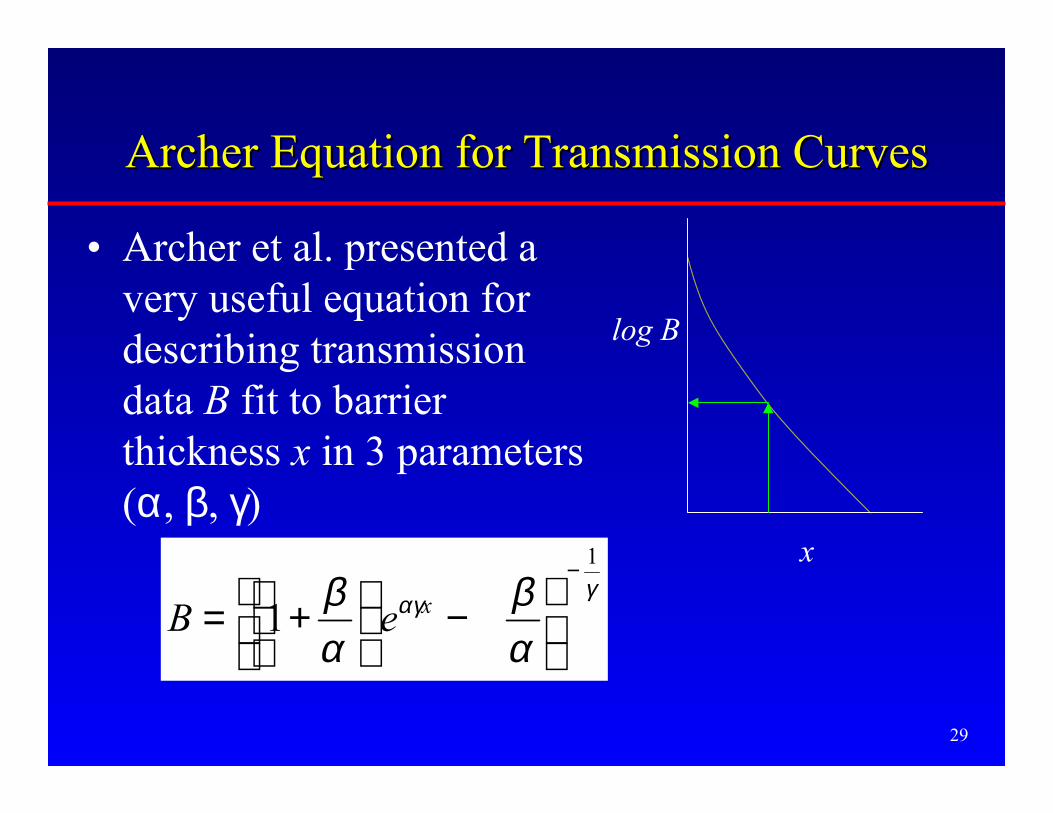
• Archer et al. presented avery useful equation fordescribing transmissiondata B fit to barrierthickness x in 3 parameters(α, β, γ)
γαγ
αβ
αβ
1
1−
−
+= xeB
x
log B

30
Archer Equation for Transmission CurvesArcher Equation for Transmission Curves
• Note: α is the slope of the transmission curve atlarge x. Therefore, α = (ln 2) / “Hard HVL”
x
log BFind HVL of curve here(once beam hardening has“straightened curve”)
31
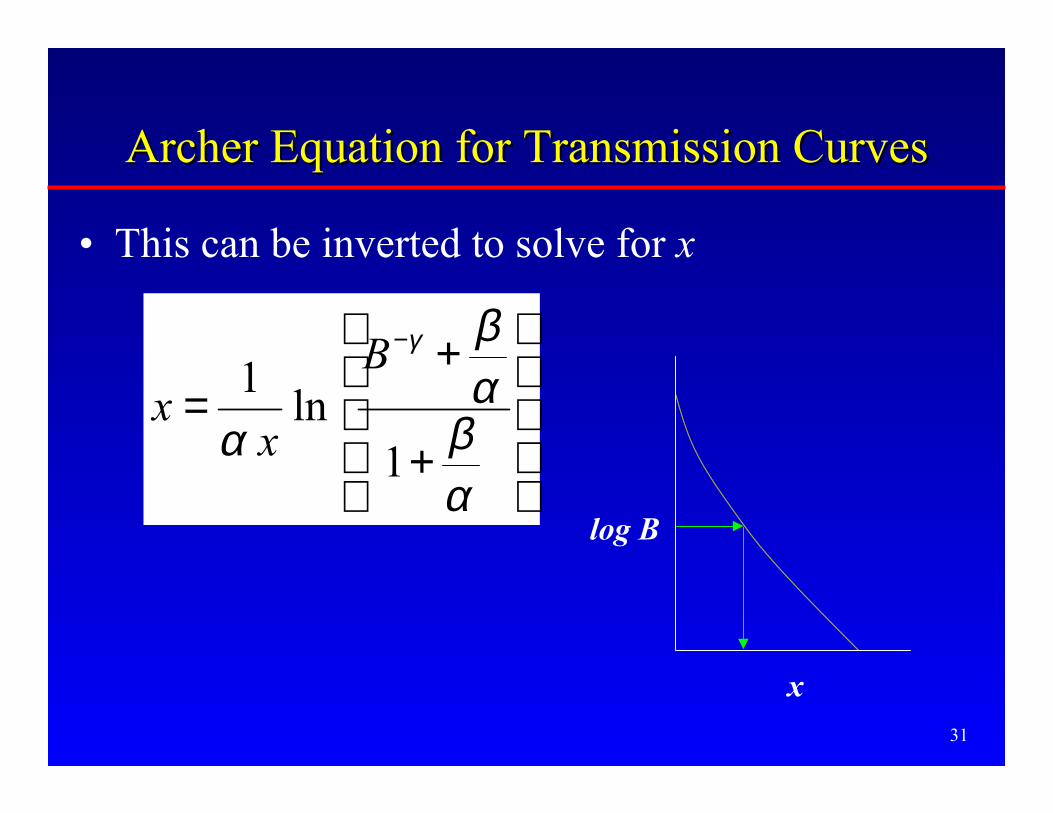
Archer Equation for Transmission CurvesArcher Equation for Transmission Curves
• This can be inverted to solve for x
+
+=
−
αβαβ
α
γ
1ln
1 B
xx
x
log B

32
Workload, Workload, W(kVp)W(kVp)• W is a measure of the x-ray tube’s use = the
time integral of the tube current
• The kVp distribution of W determines boththe kerma and the transmission of the beamthrough the barrier.– Primary beam kerma ∝ kVp2
– kerma transmitted through typical shieldingbarriers increases by factors of hundreds goingfrom 60 kVp to 120 kVp

33
Workload, Workload, WW• To determine W used clinically, a survey of
modern medical facilities was undertaken byAAPM TG 9 in the early 1990s and published in1996 (Simpkin).
• Objectives of survey:– W per patient in various types of diagnostic settings
(general radiography, cath lab, etc.)
– the weekly average number of patients, N
– the kVp distribution of W
– use factors in radiographic rooms

34
Workload SurveyWorkload Survey• Found total W to be far different from the 1000
mA·min/wk blindly assumed– Radiographic Rooms: 277 mA·min/wk
– Chest Rooms: 45 mA·min/wk
– Cardiac Angio Rooms: 3050 mA·min/wk
• The NCRP Report accepts the shapes of theseworkload distributions as reasonable, andallows for modification of the total W as needed.

35
Workload Distribution, Workload Distribution, W(kVp)W(kVp)• e.g. Cardiac Angio Lab
– Wtot = 3047 mA·min /wk for N = 20 patients/wk
36
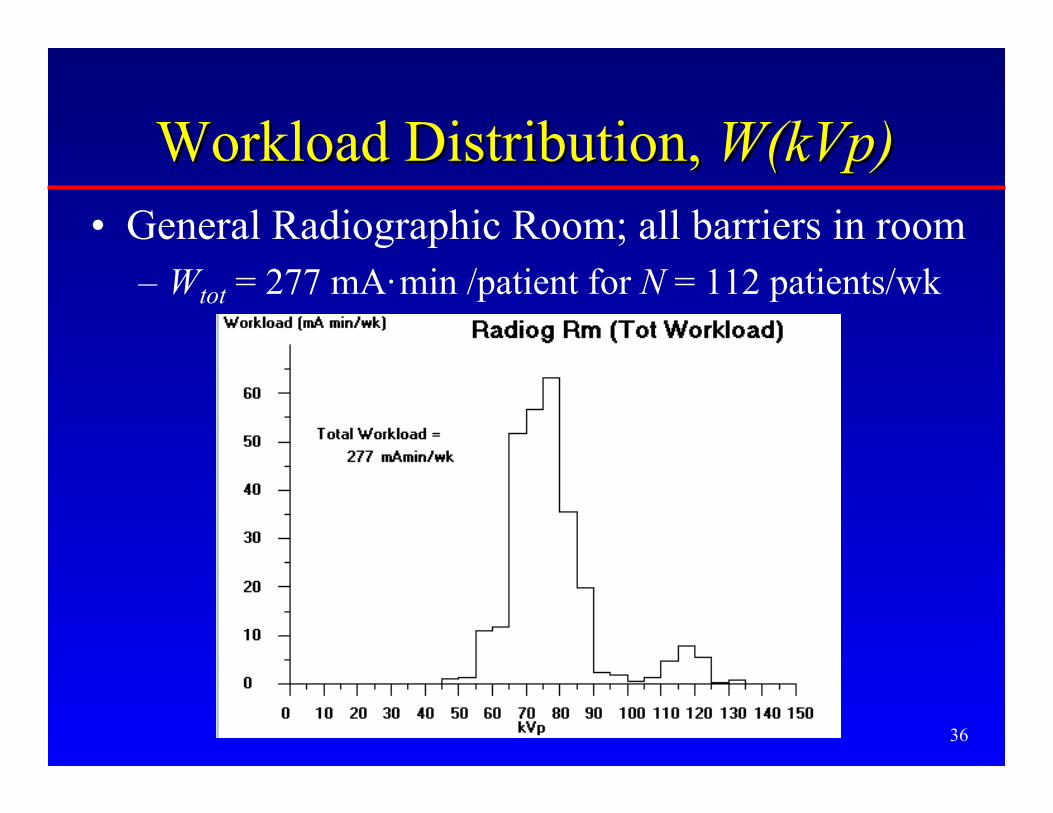
Workload Distribution, Workload Distribution, W(kVp)W(kVp)• General Radiographic Room; all barriers in room
– Wtot = 277 mA·min /patient for N = 112 patients/wk

37
General Radiographic RoomGeneral Radiographic RoomWorkload Distribution, Workload Distribution, W(kVp)W(kVp)
• But this is composed of radiographic views takenagainst the wall-mounted “Chest Bucky”– Wtot = 67.9 mA·min/patient for N = 112 patients/wk
• and...
Note: high kVpcontent of workloadagainst chest bucky
38
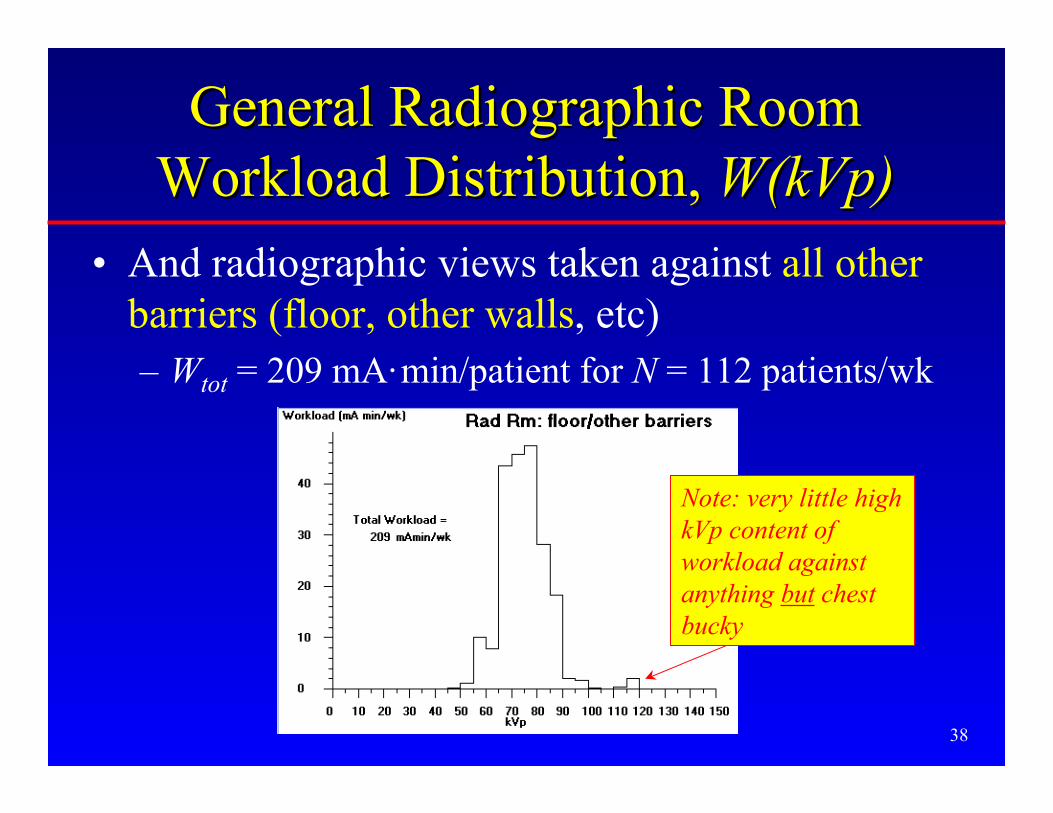
General Radiographic RoomGeneral Radiographic RoomWorkload Distribution, Workload Distribution, W(kVp)W(kVp)
• And radiographic views taken against all otherbarriers (floor, other walls, etc)– Wtot = 209 mA·min/patient for N = 112 patients/wk
Note: very little highkVp content ofworkload againstanything but chestbucky

39
Theory Theory (the stuff buried in the Appendices)(the stuff buried in the Appendices)
• The kerma in the occupied area may havecontributions from– primary radiation
– scatter radiation
– leakage radiation
• from multiple x-ray sources (or tube positions)operating over ranges of kVp (“workloaddistribution”)
Secondary radiation}

40
Primary Radiation OutputPrimary Radiation Output
• In primary beam,know kerma perworkload at 1 m,KW(kVp) , for 3phase units (dataof Archer et al.1994)

41
Unshielded Primary Beam KermaUnshielded Primary Beam Kerma
• At a given kVp, for a fraction U of thetube’s workload directed at a barrier, thenthe unshielded primary kerma is
• U is the use factor for this barrier
2
)()()0(
P
WP d
kVpWUkVpKK =
42
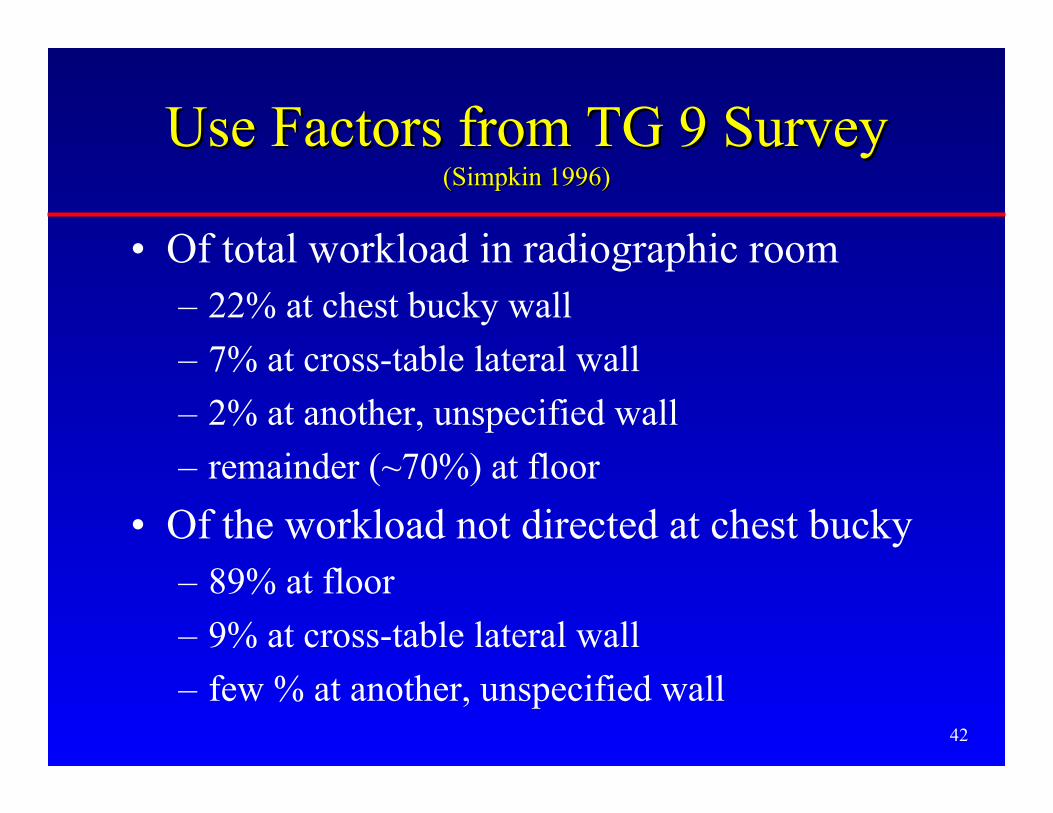
Use Factors from TG 9 SurveyUse Factors from TG 9 Survey(Simpkin 1996)(Simpkin 1996)
• Of total workload in radiographic room– 22% at chest bucky wall
– 7% at cross-table lateral wall
– 2% at another, unspecified wall
– remainder (~70%) at floor
• Of the workload not directed at chest bucky– 89% at floor
– 9% at cross-table lateral wall
– few % at another, unspecified wall

43
Use Factors from TG 9 SurveyUse Factors from TG 9 Survey
• U = 0 for modalities where primary beam isstopped by image receptor– image intensified fluoro (e.g. special
procedures, cath lab)
– mammography

44
Kerma Behind a Primary BarrierKerma Behind a Primary Barrier• Kerma behind a primary barrier of transmission
B(x, kVp)
• For the whole distribution of workloads, totalkerma is
),()()(
),(2
kVpxBd
kVpWUkVpKkVpxK
P
WP =
),()()(
)(2
kVpxBd
kVpWUkVpKxK
P
W
kVpP ∑=

45
Primary Radiation:Primary Radiation:The NCRP49 ModelThe NCRP49 Model
Barrier of thickness x decreases rawprimary radiation to P/T
x

46
Primary Radiation:Primary Radiation:The RealityThe Reality
Primary radiation is significantlyattenuated before reaching barrier
Grid, cassette,supporting structures
patient

47
Primary Radiation:Primary Radiation:The NCRP Rep No. 147 ModelThe NCRP Rep No. 147 Model
Primary radiation is still significantlyattenuated before reaching barrier
Grid, cassette,supporting structures;No patient!
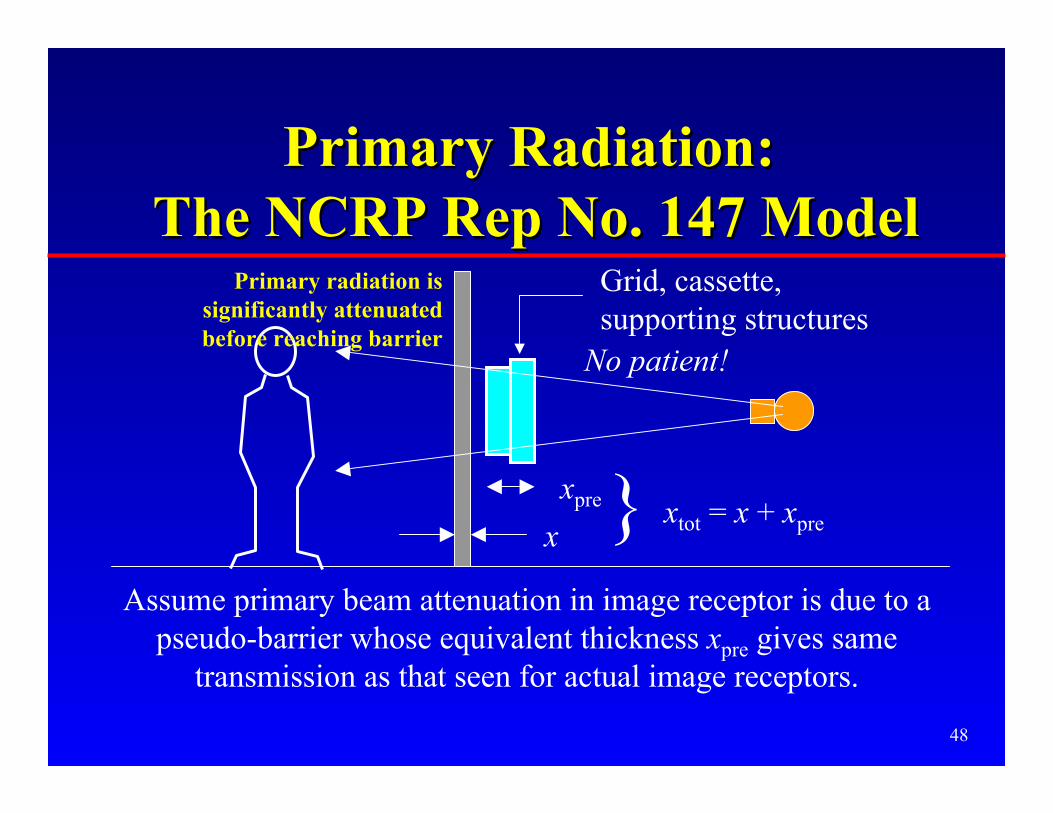
48
Primary Radiation:Primary Radiation: The NCRP Rep No. 147 Model The NCRP Rep No. 147 Model
Assume primary beam attenuation in image receptor is due to apseudo-barrier whose equivalent thickness xpre gives same
transmission as that seen for actual image receptors.
Grid, cassette,supporting structures
x
xpre } xtot = x + xpre
No patient!
Primary radiation issignificantly attenuatedbefore reaching barrier
49
40 50 60 70 80 90 100 125 150kVp
2
4
68
2
4
68
2
4
68
2
4
68
1E-4
1E-3
1E-2
1E-1
1E+0
Tra
nsm
issi
on
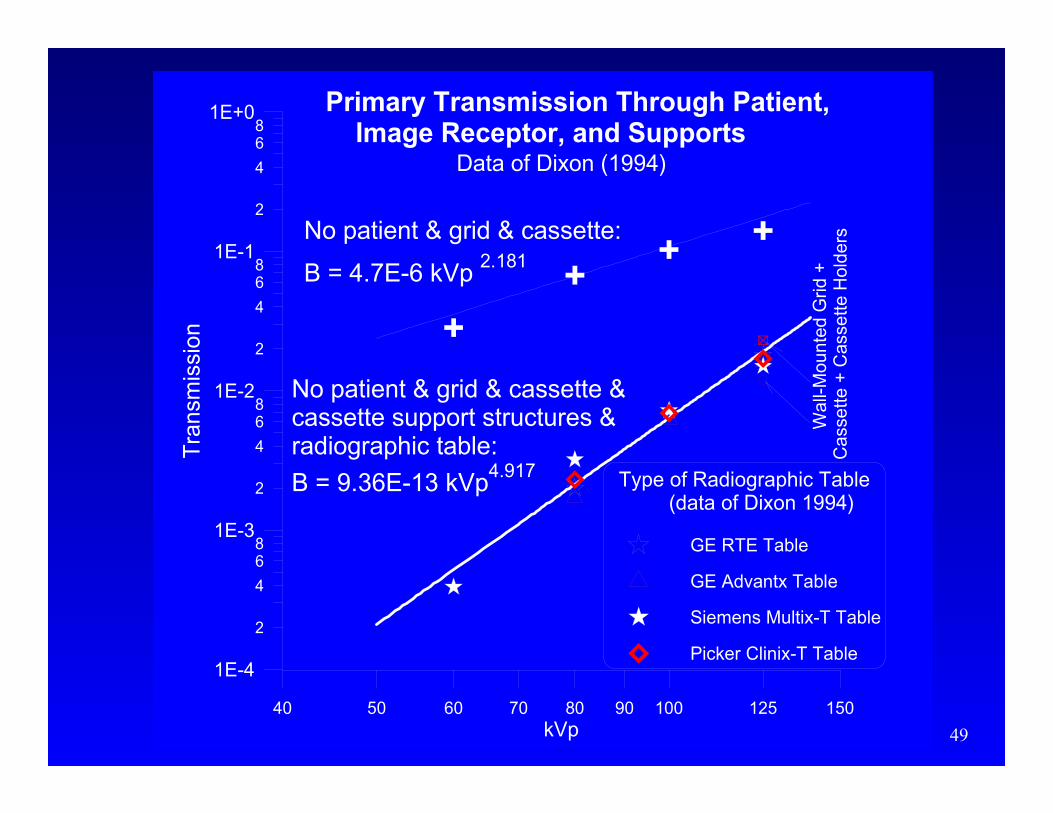
No patient & grid & cassette &cassette support structures &radiographic table:
B = 9.36E-13 kVp4.917
Primary Transmission Through Patient, Image Receptor, and Supports
Type of Radiographic Table (data of Dixon 1994)
GE RTE Table
GE Advantx Table
Siemens Multix-T Table
Picker Clinix-T Table
Wal
l-Mou
nted
Grid
+C
asse
tte +
Cas
sette
Hol
dersNo patient & grid & cassette:
B = 4.7E-6 kVp 2.181
Data of Dixon (1994)

50
20 30 40 50 60 70 80 90 100 110 120 130 140 150kVp
1E-1
1E+0
1E+1
1E+2
1E+3
x pre
(m
m)
Plate GlassGypsum
Concrete
Steel
Lead
Values of x pre
(Grid+cassette+support)
51
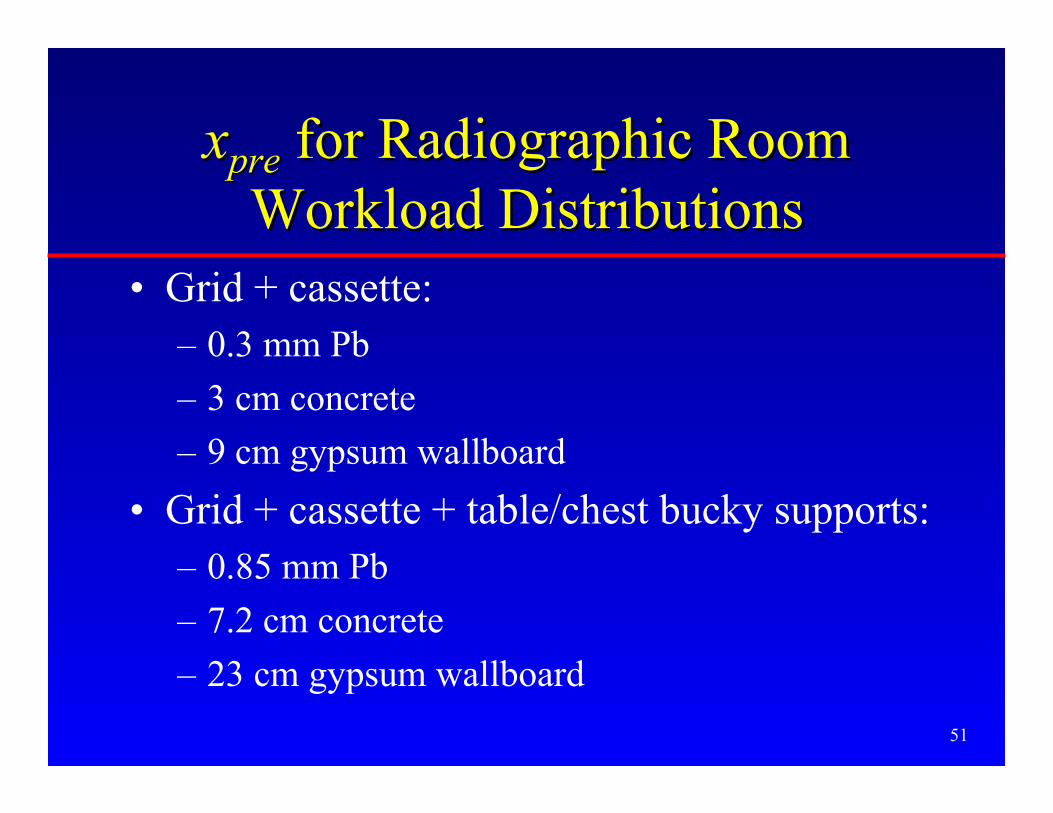
xxprepre for Radiographic Room for Radiographic RoomWorkload DistributionsWorkload Distributions
• Grid + cassette:– 0.3 mm Pb
– 3 cm concrete
– 9 cm gypsum wallboard
• Grid + cassette + table/chest bucky supports:– 0.85 mm Pb
– 7.2 cm concrete
– 23 cm gypsum wallboard
52
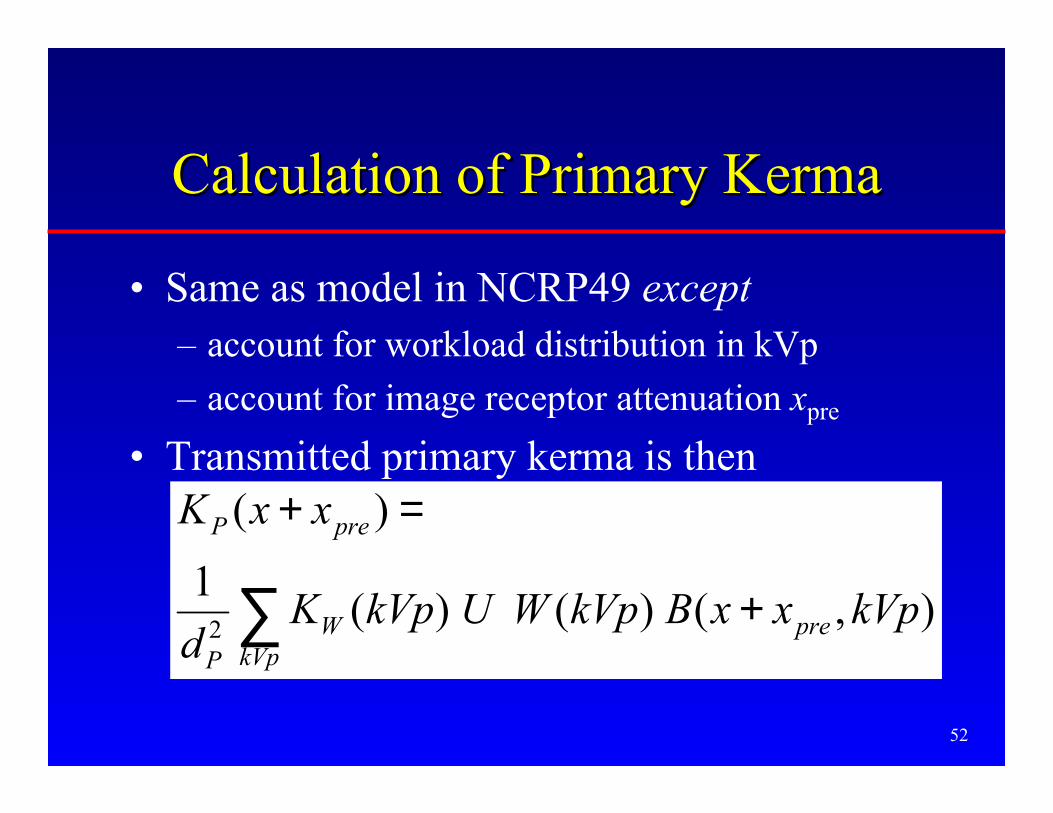
Calculation of Primary KermaCalculation of Primary Kerma
• Same as model in NCRP49 except– account for workload distribution in kVp
– account for image receptor attenuation xpre
• Transmitted primary kerma is then
∑ +
=+
kVppreW
P
preP
kVpxxBkVpWUkVpKd
xxK
),()()(1
)(
2

53
Scatter RadiationScatter Radiation
patient

54
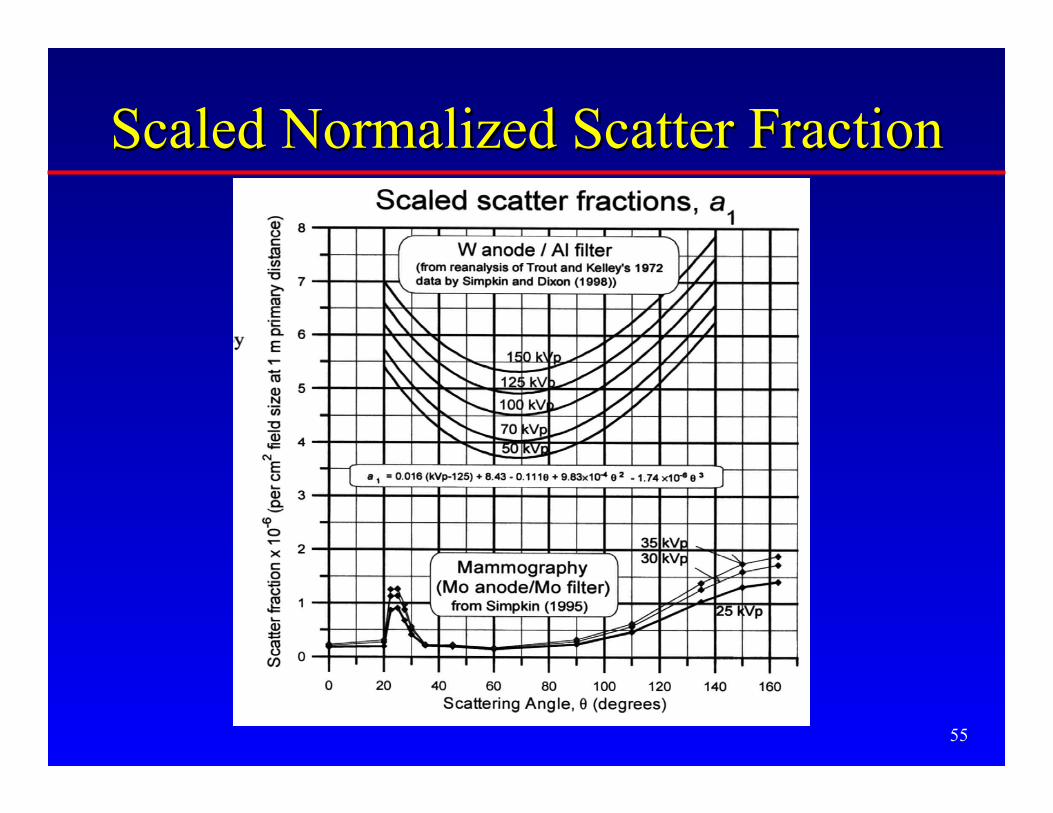
Scaled Normalized Scatter FractionScaled Normalized Scatter Fraction
KP
1 m
KS
1 m1 m
1 cm2 areaprimary beamat 1 m
θ
61 10+×=
P
S
K
Ka
55
Scaled Normalized Scatter FractionScaled Normalized Scatter Fraction

56
Scatter RadiationScatter Radiation• Same theory as NCRP-49
– with reevaluated scatter fraction
– pri beam area F (cm2) measured at pri distance dF
conveniently taken as image receptor area @ SID
– explicitly show kVp dependence and sum overworkload distribution to yield shielded scatterkerma
),()()1()(10
),(22
61 kVpxB
d
F
d
kVpWUkVpKaxK
FkVp S
WS ∑ −×=
−
θ

57
Leakage Radiation
patient
Radiation originating from x-ray tube focal spot but notemanating from the tubeportal
58
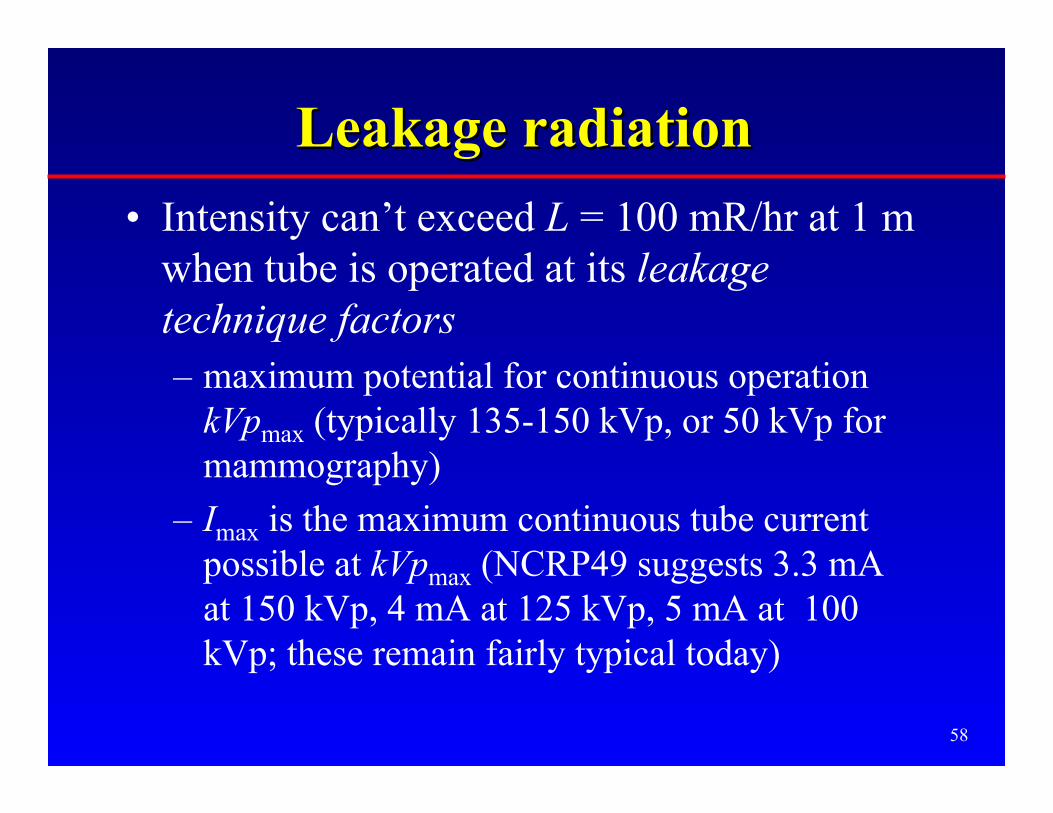
Leakage radiationLeakage radiation
• Intensity can’t exceed L = 100 mR/hr at 1 mwhen tube is operated at its leakagetechnique factors– maximum potential for continuous operation
kVpmax (typically 135-150 kVp, or 50 kVp formammography)
– Imax is the maximum continuous tube currentpossible at kVpmax (NCRP49 suggests 3.3 mAat 150 kVp, 4 mA at 125 kVp, 5 mA at 100kVp; these remain fairly typical today)

59
Leakage radiationLeakage radiation
• Because of heavy filtering by the tube housing,only the highest energy photons exist in theleakage beam
• Leakage intensity is inversely proportional tothe square of the distance from the tube, dL
• Transmission of leakage radiation isexponential, with the “hard” HVL at that kVpfor the barrier material

60
New Leakage ModelNew Leakage Model
• For tube operating at techniques (kVp, I) withtransmission through the tube housingBhousing, assume leakage kerma rate at 1 mthrough tube housing is
• Assume worst case scenario: leakage kermarate = limit (was= L) for tube operationat leakage technique factors (conservative byfactors of 3 to ~100s)
)()( housing2 kVpBIkVpkVpKL ∝&
limK&

61
New Leakage ModelNew Leakage Model• Estimate thickness of tube housing by using primary beam
output at leakage technique factors as model for unhousedleakage radiation.
1 m
1 m
“unhoused”tube
1931 mGy/hr
1931 mGy/hr
1 m
1 mTube operated at150 kVp, 3.3 mA
Tube housing= 2.32 mm Pbthick
1931 mGy/hr
100 mR/hr = 0.873 mGy/hr

62
New Leakage ModelNew Leakage Model• Write ratio of leakage kerma rates at any kVp
to at kVpmax
• and knowing that at a given kVp, workloadW(kVp) is the time integral of the tubecurrent:
• then unshielded leakage kerma KL (at 1 m) atthat kVp is
∫= dtIkVpW )(
)(
)()()1()(
maxhousingmax2
max
housing2
lim
kVpBIkVp
kVpBkVpWUkVpKkVpKL
−=&
limK&

63
New Leakage ModelNew Leakage Model
• Applying inverse square to distance dL fromtube to shielded area,
• and putting a barrier with transmissionexp(–ln(2)x/HVL) between tube & area yields
−×
×−
=
)(
)2ln(exp
1
)(
)()()1()(
2
maxhousingmax2
max
housing2
kVpHVL
x
d
kVpBIkVp
kVpBkVpWUkVpKkVpK
L
LL
&
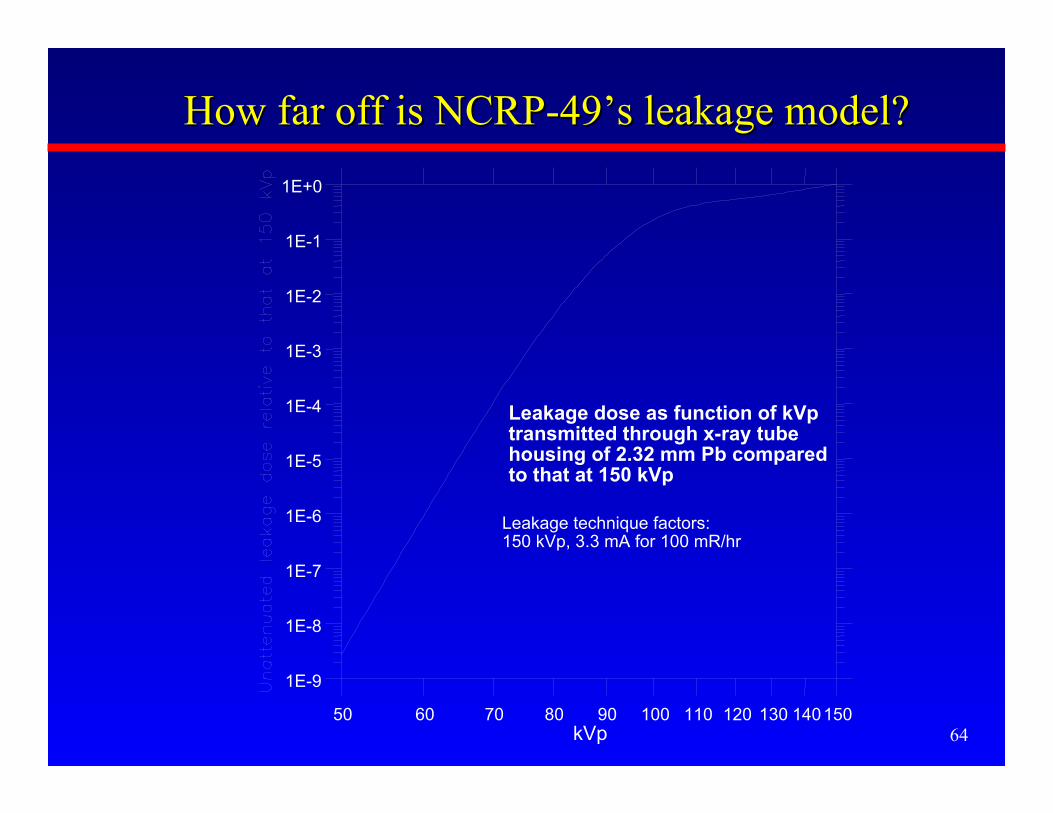
6450 60 70 80 90 100 110 120 130 140150
kVp
1E-9
1E-8
1E-7
1E-6
1E-5
1E-4
1E-3
1E-2
1E-1
1E+0
Leakage dose as function of kVp transmitted through x-ray tube housing of 2.32 mm Pb compared to that at 150 kVp
Leakage technique factors:150 kVp, 3.3 mA for 100 mR/hr
How far off is NCRP-49’s leakage model?How far off is NCRP-49’s leakage model?
65
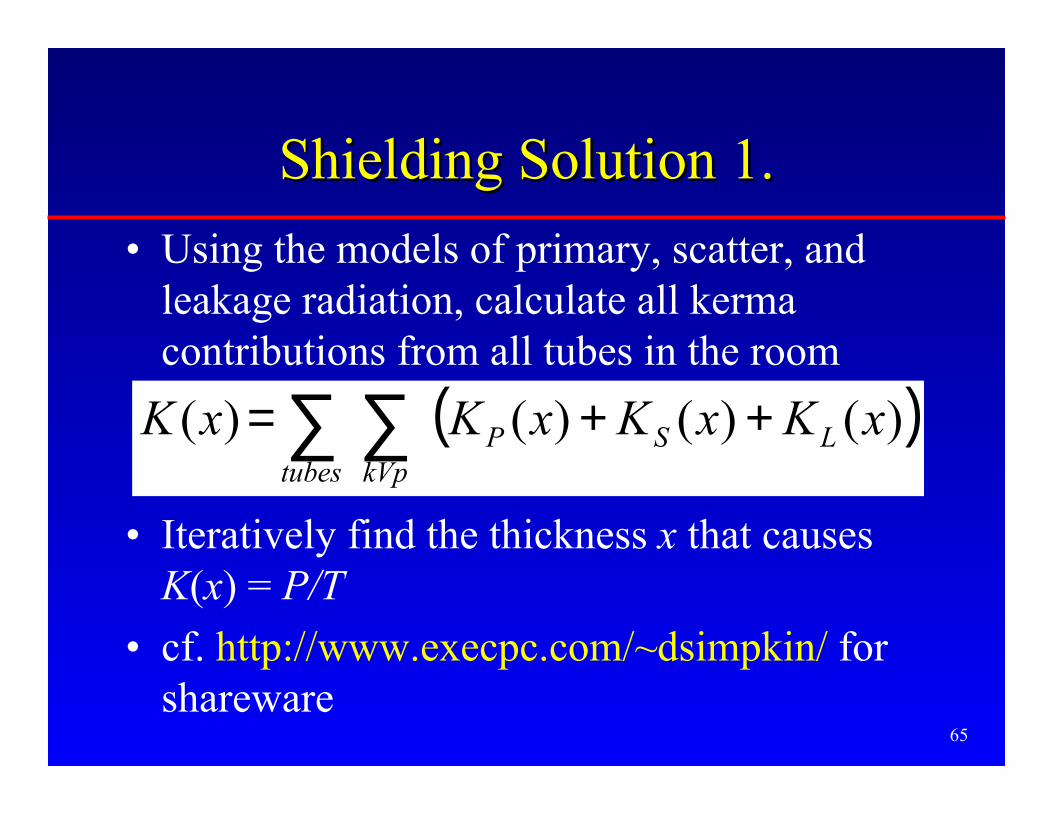
Shielding Solution 1.Shielding Solution 1.
• Using the models of primary, scatter, andleakage radiation, calculate all kermacontributions from all tubes in the room
• Iteratively find the thickness x that causesK(x) = P/T
• cf. http://www.execpc.com/~dsimpkin/ forshareware
( )∑ ∑ ++=tubes kVp
LSP xKxKxKxK )()()()(

66
Solution 2. Keep it Simple, Stupid
• For each clinical workload distribution, oftotal workload Wnorm per patient, for bothprimary and secondary barriers, cancalculate:– K1 , the kerma per patient at 1 m distance
– B, the transmission of the radiationgenerated by this workload distribution forprimary or secondary barriers

67
The Shielding Chore SimplifiesThe Shielding Chore Simplifies
• The unshielded kerma for– N patients imaged per week, or, equivalently
– total workload Wtot (where workload/pat = Wnorm)
• is then
– (where U is replaced by 1 for secondary barriers)norm
totun Wd
WUK
d
NUKK
2
1
2
1
==

68
Required TransmissionRequired Transmission
• Ratio of P/T to Kun is the required transmission
– (again, U is replaced by 1 for secondary barriers)
• Transmission B is now a function of– barrier material and thickness
– workload distribution
– primary or secondary
1
2
1
2/)(
UKTW
WdP
UKTN
dP
K
TPxB
tot
norm
un
===

69
Cath Cath Lab Example: WallLab Example: Wall
• Assume d=4 m, P = 0.02 mGy wk-1, T=1, 12”=30.5 cm diameter image intensifier, 90°scatter, N=25 patients wk-1
• Look up secondary kerma at 1 m per patientfor cath lab distribution: K1 = 2.7 mSv patient-1
• Total unshielded kerma is then
12
11
22.4)4(
257.2 −−−
=×= wkmGym
wkpatpatmGyKun

70
Cath Cath Lab Example: WallLab Example: Wall
• Required transmission is
• Look on graph for transmission curve forsecondary radiation from CardiacAngiography Lab → Requires 1.2 mm Pb(which is satisfied by standard 1/16” sheet)
• (vs. 1.88 mm Pb requirement of NCRP-49)
0047.022.4
02.0/1
1
=== −
−
wkmGy
wkmGy
K
TPB
un
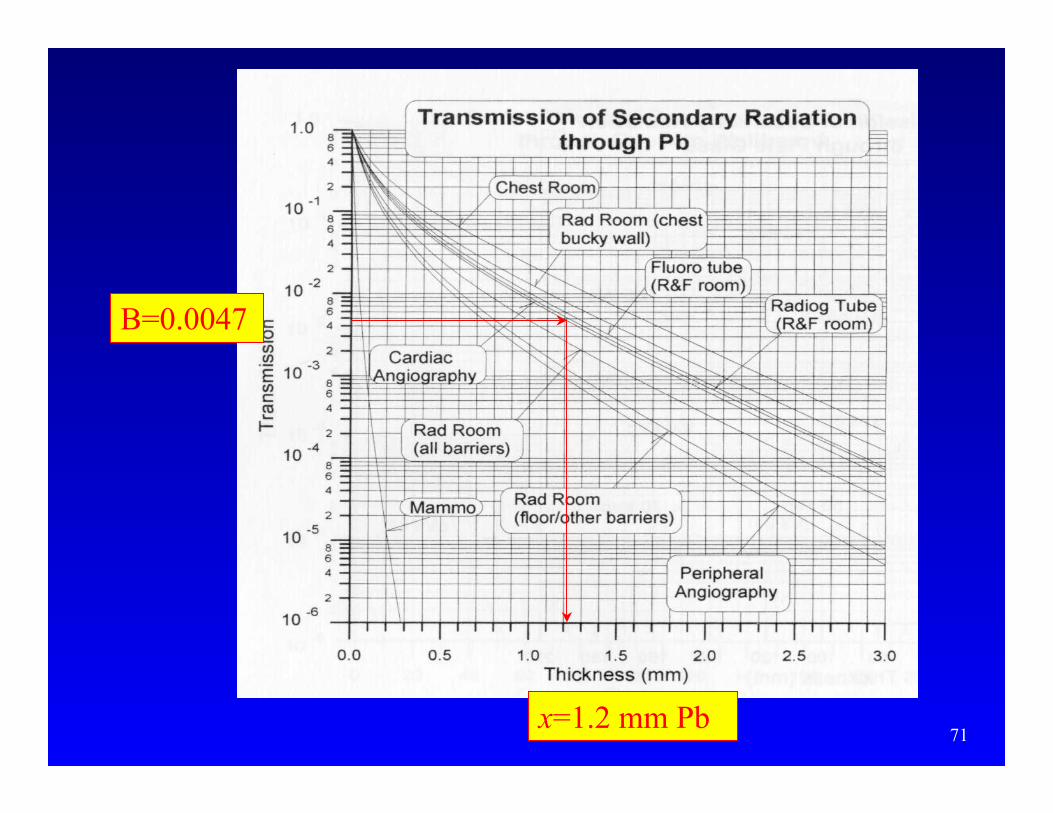
71
B=0.0047
x=1.2 mm Pb

72
Solution 3. A “Representative Room”Solution 3. A “Representative Room”
• Even the simplest, most common radiographicroom is a complicated assemblage of x-raytube positions/ workload distributions,
• Calculate the barrier thickness requirementsfor an assumed:– conservatively small room layout
• assures contribution from all sources is maximal
– distribution of the kinds of exposures madeamongst the tubes/positions

73
ChestBuckywallprimary
Cross-tableLateral Wallprimary
Ch
est
Bu
cky
wal
l sec
ond
ary
U=2%primarywall
Secondary Barrier
Secondary Barrier
Representative Radiographic RoomRepresentative Radiographic Room
Measure distance Measure distance ddfrom any tube havingfrom any tube havinga primary a primary contribcontrib..
74
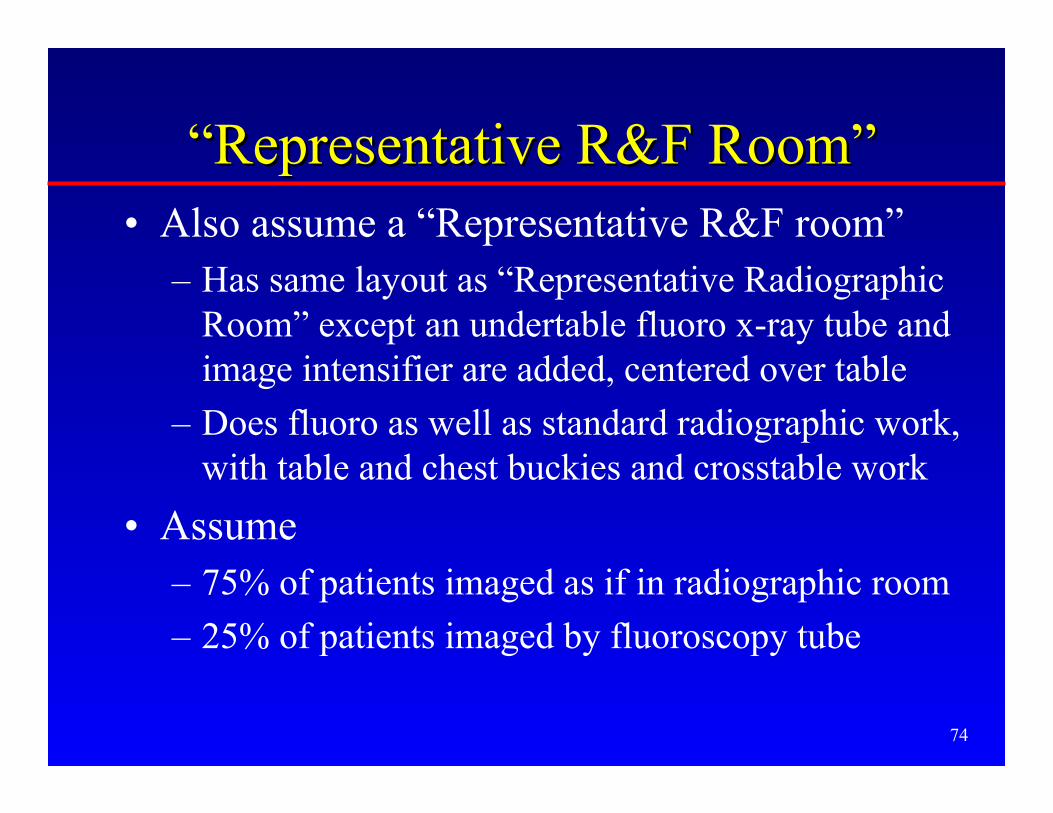
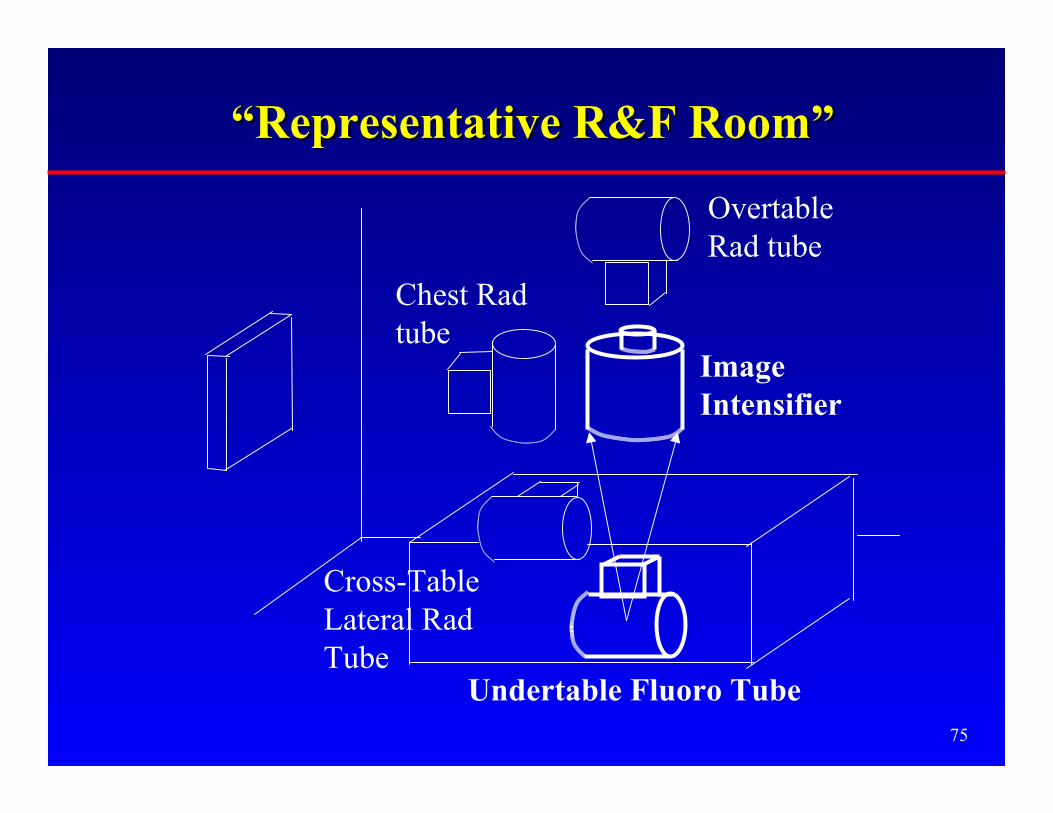
“Representative R&F Room”“Representative R&F Room”• Also assume a “Representative R&F room”
– Has same layout as “Representative RadiographicRoom” except an undertable fluoro x-ray tube andimage intensifier are added, centered over table
– Does fluoro as well as standard radiographic work,with table and chest buckies and crosstable work
• Assume– 75% of patients imaged as if in radiographic room
– 25% of patients imaged by fluoroscopy tube
75
Chest Radtube
Cross-TableLateral RadTube
OvertableRad tube
“Representative R&F Room”“Representative R&F Room”
ImageIntensifier
Undertable Fluoro Tube
76
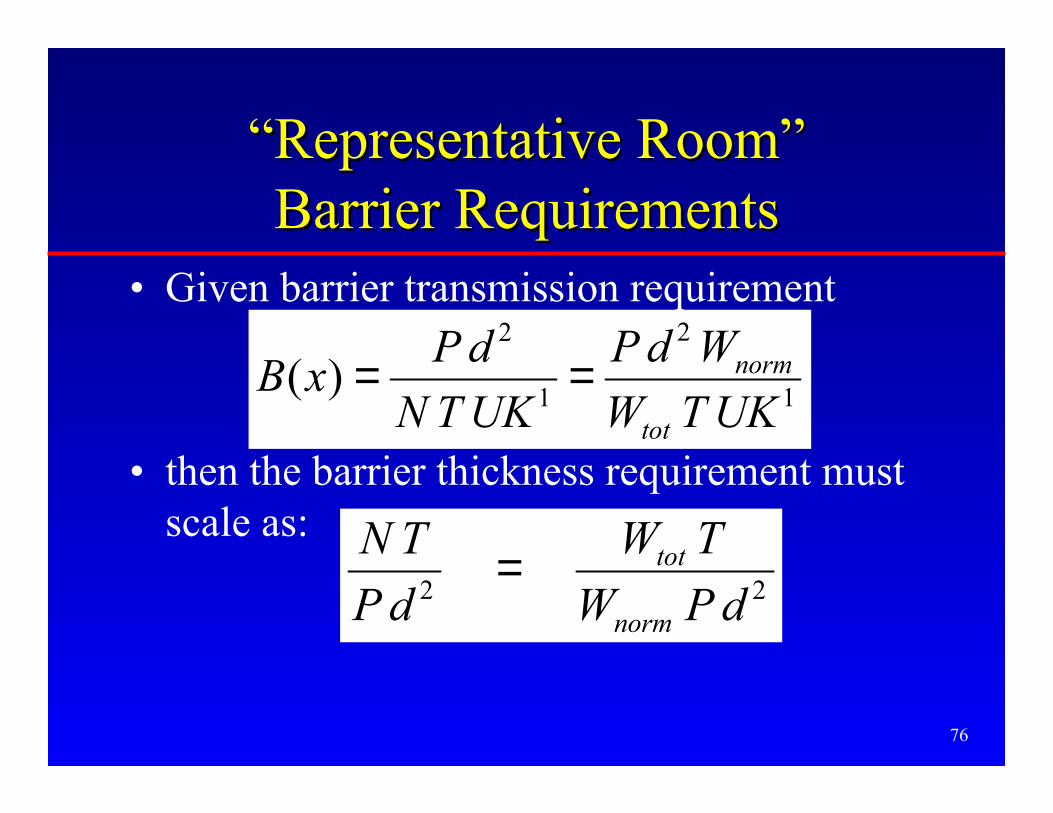
“Representative Room”“Representative Room”Barrier RequirementsBarrier Requirements
• Given barrier transmission requirement
• then the barrier thickness requirement mustscale as:
1
2
1
2
)(UKTW
WdP
UKTN
dPxB
tot
norm==
22 dPW
TW
dP
TN
norm
tot=

77
0 500 1000 1500 2000 2500 3000
NT/Pd2(mSv-1m-2)
0.0
0.1
0.2
0.3
0.4
0.5
0.6
0.7
0.8
0.9
1.0
1.1
1.2
1.3
1.4
1.5
1.6
Thi
ckne
ss o
f Lea
d R
equi
red
(mm
)
Floor
Chest Bucky W
all
Primary Barrie
r
Cross-table
Lateral Wall
Wall with 2%
Use Factor
Secondary Wall
Ceiling
Lead Shielding RequirementsStandard Radiographic Room
With Image Receptor Shielding
1/32 inch
1/16 inch
78
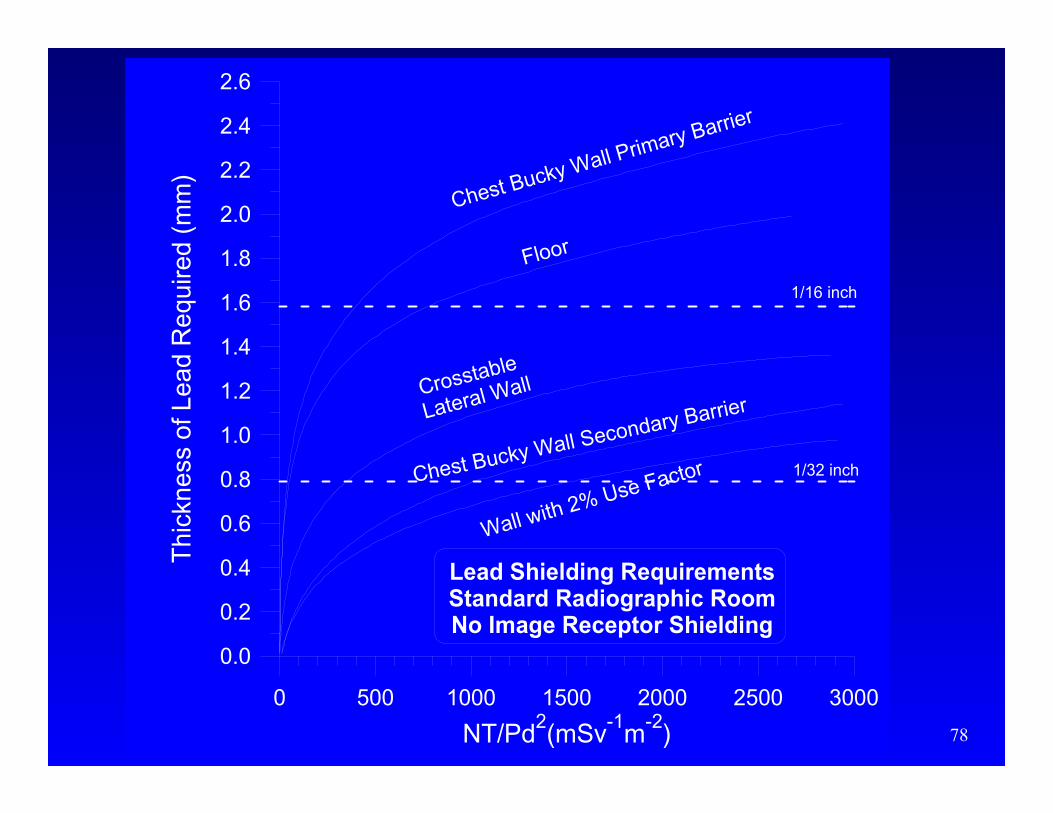
0 500 1000 1500 2000 2500 3000
NT/Pd2(mSv
-1m
-2)
0.0
0.2
0.4
0.6
0.8
1.0
1.2
1.4
1.6
1.8
2.0
2.2
2.4
2.6
Thi
ckne
ss o
f Lea
d R
equi
red
(mm
)
Lead Shielding RequirementsStandard Radiographic RoomNo Image Receptor Shielding
Floor
Chest Bucky Wall Primary Barrier
Crosstable
Lateral Wall
Wall with 2% Use FactorChest Bucky Wall Secondary Barrier
1/32 inch
1/16 inch

79
0.1 1.0 10.0 100.0 1000.0
NT/Pd2(mSv
-1m
-2)
0.0
0.2
0.4
0.6
0.8
1.0
1.2
1.4
1.6
1.8
2.0
2.2
Lea
d B
arri
er T
hic
knes
s R
equ
irem
ent
(mm
)
22.9 cm
30.5 cm
35.6 cm
Cardiac AngiographyShielding Barrier Requirements
Lead
Image IntensifierDiameter:
TO BE READ BYPHYSICISTS ONLY

80
Equivalency of Shielding MaterialsEquivalency of Shielding Materials
• From “representative room” calculations,conservatively conclude– Steel thickness requirement =
8 × Pb thickness requirement
– Gypsum wallboard thickness requirement =3.2 × concrete thickness requirement
– Glass thickness requirement =1.2 × concrete thickness requirement

81
CT Scanner Shielding: OverviewCT Scanner Shielding: Overview
• Estimate unshielded weekly kerma in occupiedarea near scanner, Kun
• Presume P/T
• Barrier requires transmission
• Get barrier thickness– Simpkin Health Phys 58, 363-7: 1990 (refit)
unK
TPB
/=
82
CT Scanners:CT Scanners:Estimate Unshielded KermaEstimate Unshielded Kerma
• Estimate Workload– 100 - 200 patient/wk typically
– Helical/multislice scanners: probably• 20 cm total thickness imaged for head patients
• 40-60 cm total thickness imaged for body patients
83
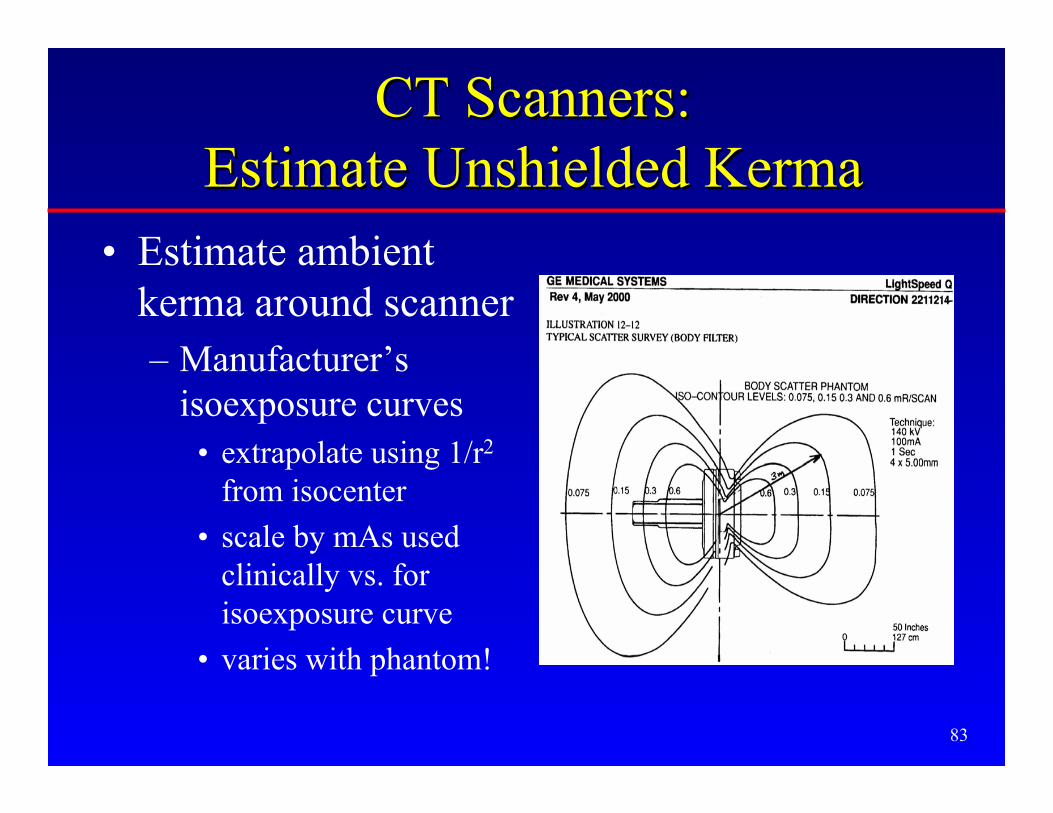
CT Scanners:CT Scanners:Estimate Unshielded KermaEstimate Unshielded Kerma
• Estimate ambientkerma around scanner– Manufacturer’s
isoexposure curves• extrapolate using 1/r2
from isocenter
• scale by mAs usedclinically vs. forisoexposure curve
• varies with phantom!
84
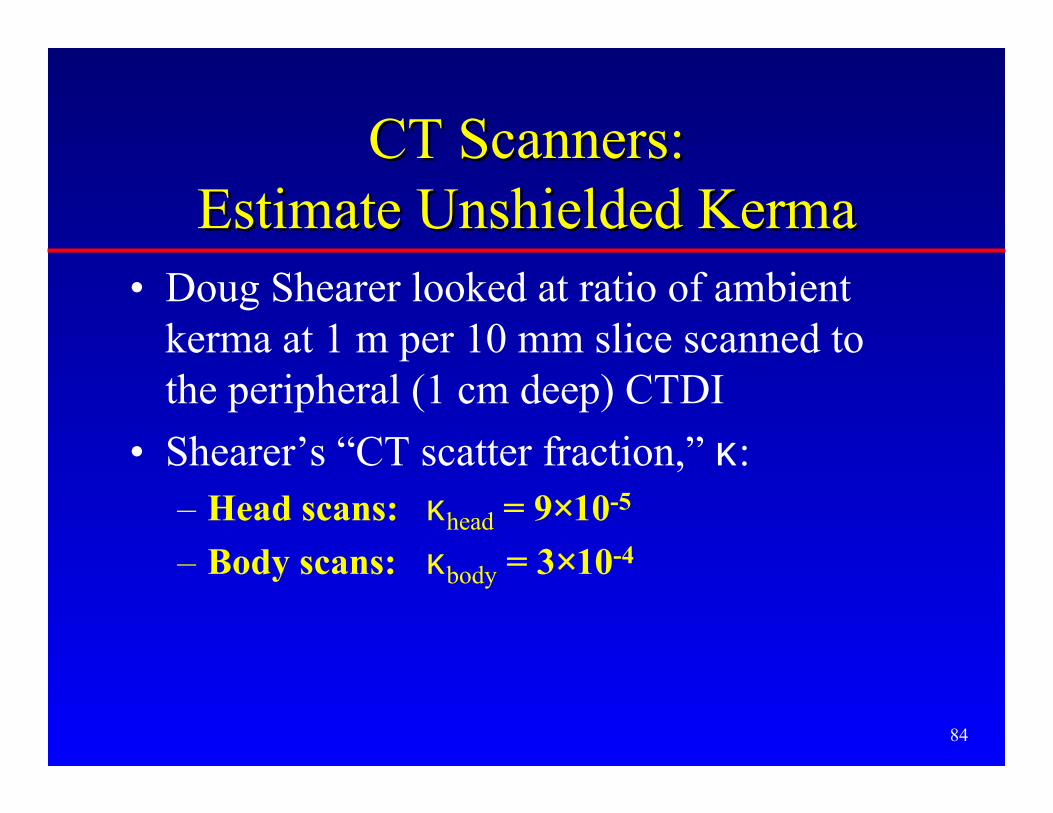
CT Scanners:CT Scanners:Estimate Unshielded KermaEstimate Unshielded Kerma
• Doug Shearer looked at ratio of ambientkerma at 1 m per 10 mm slice scanned tothe peripheral (1 cm deep) CTDI
• Shearer’s “CT scatter fraction,” κ:– Head scans: κhead = 9×10⁻⁵
– Body scans: κbody = 3×10⁻⁴

85
Unshielded Kerma from CTDIUnshielded Kerma from CTDI
• Estimate, for either head or body scans, theambient kerma per patient around scanner fora slice Tb (mm) thick generated by NR
rotations each at technique mAsClinical
Rb
clinicalCTDI
CT Nmm
mmTmAs
mAs
mGyCTDImGyK ××××=
10
)()()(1 κ

86
Unshielded Kerma from CTDIUnshielded Kerma from CTDI
• Can recast this in terms of the thickness ofeach patient imaged, L = NR × Tb × pitch , witheach rotation acquired at technique mAsClinical
pitchmm
mmLmAs
mAs
mGyCTDImGyK clinical
CTDICT
1
10
)()()(1 ××××= κ
87
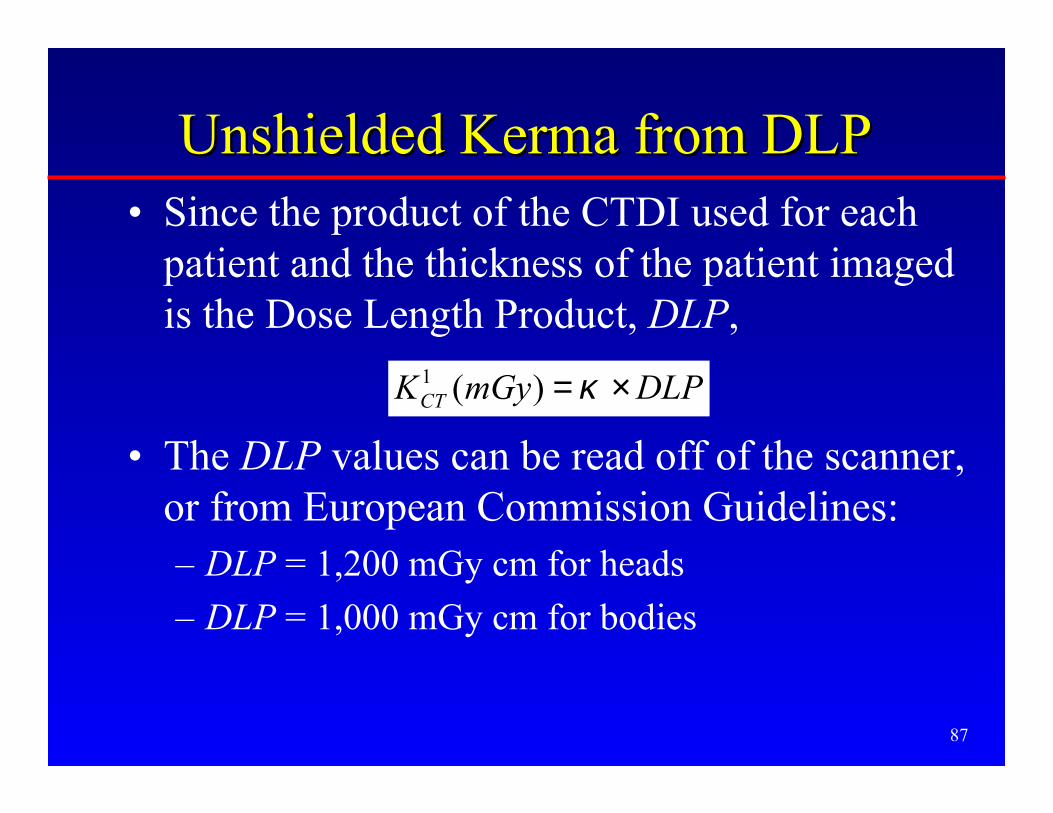
Unshielded Kerma from DLPUnshielded Kerma from DLP• Since the product of the CTDI used for each
patient and the thickness of the patient imagedis the Dose Length Product, DLP,
• The DLP values can be read off of the scanner,or from European Commission Guidelines:– DLP = 1,200 mGy cm for heads
– DLP = 1,000 mGy cm for bodies
DLPmGyKCT ×=κ)(1

88
CT Scanner ExampleCT Scanner Example• Wall near CT scanner: P/T = 0.02 mGy wk-1,
d=3 m
• 150 patients wk-1 (50 bodies, 100 heads)
• Assume– 600 mm thickness imaged for each body patient
– 200 mm for head patients
• CTDI(head)= 40 mGy, CTDI(body)= 2.5 mGy,at 140 kVp & mAs typical of clinical use.
• Pitch=1, 140 kVp

89
CT Scanner ExampleCT Scanner Example• Then, the unshielded kerma per head patient:
• and kerma per body patient is
• so total unshielded weekly kerma at 1 m isKun
1 = (100×0.072 mGy) + (50 ×0.45 mGy) = 29.7 mGy
mGymm
mmmGyKCT 072.0
10
200)109(40 51 =×××= −
mGymm
mmmGyKCT 45.0
10
600)103(25 41 =×××= −

90
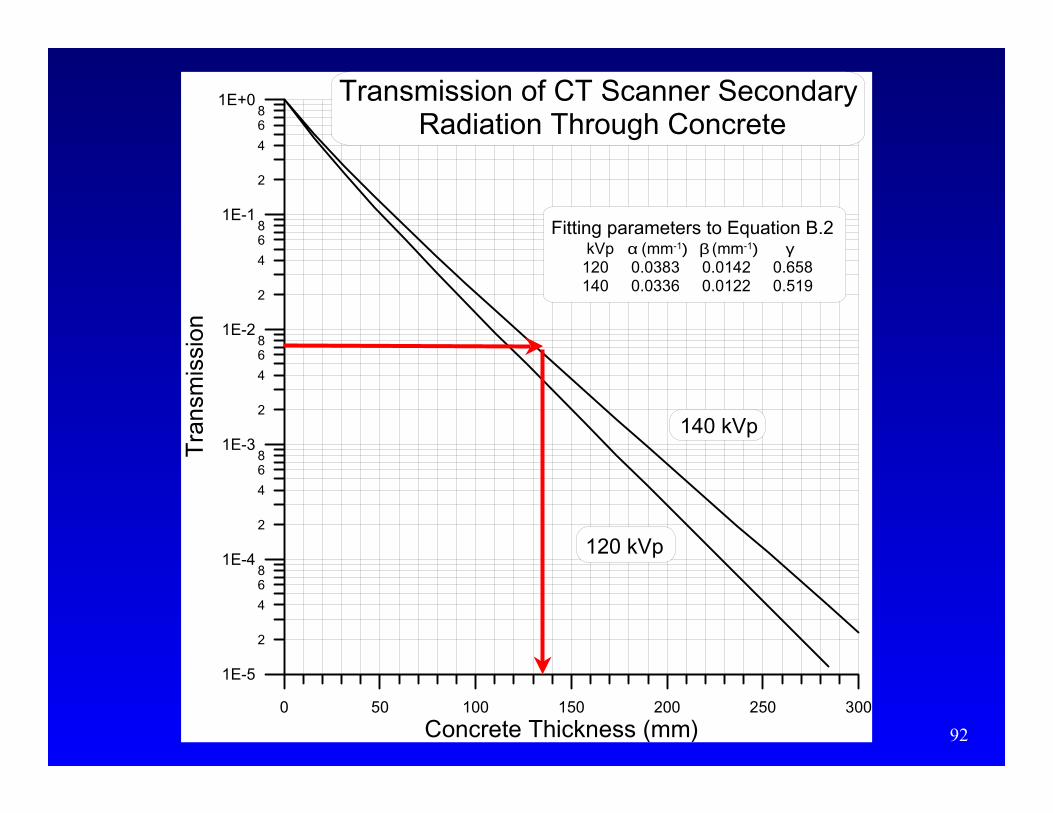
CT Scanner ExampleCT Scanner Example• The unshielded weekly kerma at 3 m is
• The transmission required in this wall istherefore
• which, at 140 kVp, is achieved by– 1.4 mm Pb, or
– 136 mm = 5.4 inches standard density concrete
3101.63.3
02.0 −×==mGy
mGyB
mGym
mGyKun 3.3
)3(
7.292
==
WATCH OUTABOVE &BELOW!

91
0 0.5 1 1.5 2 2.5 3
Lead Thickness (mm)
1E-4
1E-3
1E-2
1E-1
1E+0
2
4
68
2
4
68
2
4
68
2
4
68
Tra
nsm
issi
on
Transmission of CT ScannerSecondary Radiation Through Pb
140 kVp
120 kVp
Fitting parameters to Equation B.2 kVp α (mm-1) β (mm-1) γ 120 2.246 5.73 0.547 140 2.009 3.99 0.342
92
0 50 100 150 200 250 300
Concrete Thickness (mm)
1E-5
1E-4
1E-3
1E-2
1E-1
1E+0
2
4
68
2
4
68
2
4
68
2
4
68
2
4
68
Tra
nsm
issi
on
Transmission of CT Scanner Secondary Radiation Through Concrete
140 kVp
120 kVp
Fitting parameters to Equation B.2 kVp α (mm-1) β (mm-1) γ 120 0.0383 0.0142 0.658 140 0.0336 0.0122 0.519

93
Chapter 6: Surveys
• Inspect for proper shielding barrierplacement and/or voids– visual inspection during construction
– radiation survey with GM or scintillationsurvey meter looking at penetration of x- orgamma rays
94
Chapter 6: Surveys
• Evaluate adequacy of barrier thickness for theoccupied area– Determine thickness of barrier
• visually
• radiation survey
– Do “inverse shielding calculation” to determinehow many patients may be imaged per week so asnot to exceed design goal

95
Conclusions IConclusions I• Design goals, P:
– Controlled areas = 0.1 mGy/wk
– Uncontrolled areas = 0.02 mGy/wk
• Reasonable occupancy factors, T:– for individuals in uncontrolled areas
– effect is to increase kerma to P/T
• Transmission, B, is ratio of kermas with andwithout shielding– fit to Archer equation
– “hard” HVL results from beam hardening
96
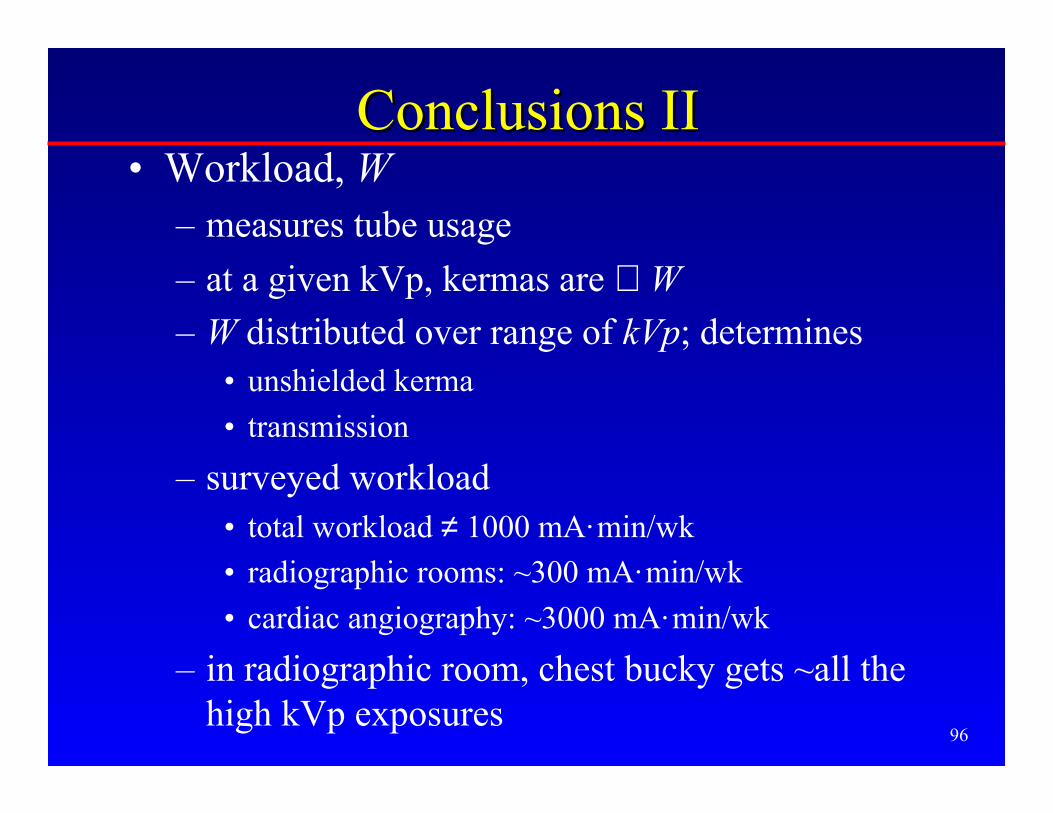
Conclusions IIConclusions II• Workload, W
– measures tube usage
– at a given kVp, kermas are ∝ W
– W distributed over range of kVp; determines• unshielded kerma
• transmission
– surveyed workload• total workload ≠ 1000 mA·min/wk
• radiographic rooms: ~300 mA·min/wk
• cardiac angiography: ~3000 mA·min/wk
– in radiographic room, chest bucky gets ~all thehigh kVp exposures
97
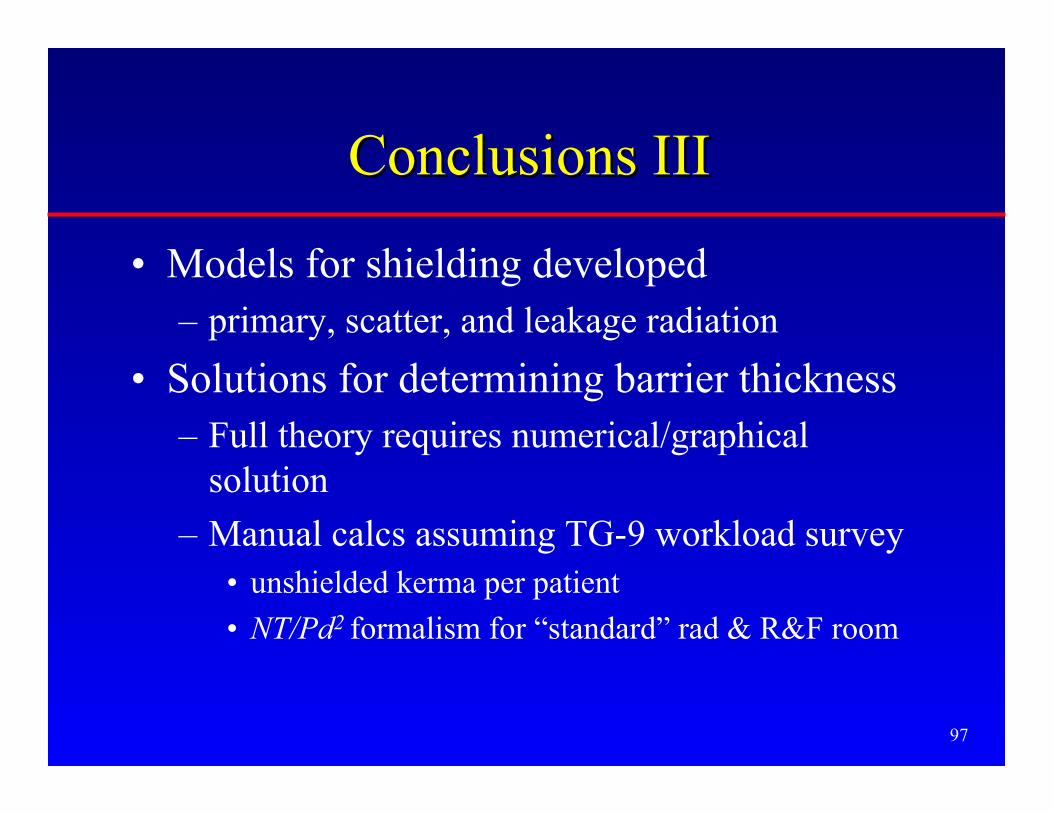
Conclusions IIIConclusions III
• Models for shielding developed– primary, scatter, and leakage radiation
• Solutions for determining barrier thickness– Full theory requires numerical/graphical
solution
– Manual calcs assuming TG-9 workload survey• unshielded kerma per patient
• NT/Pd2 formalism for “standard” rad & R&F room
98
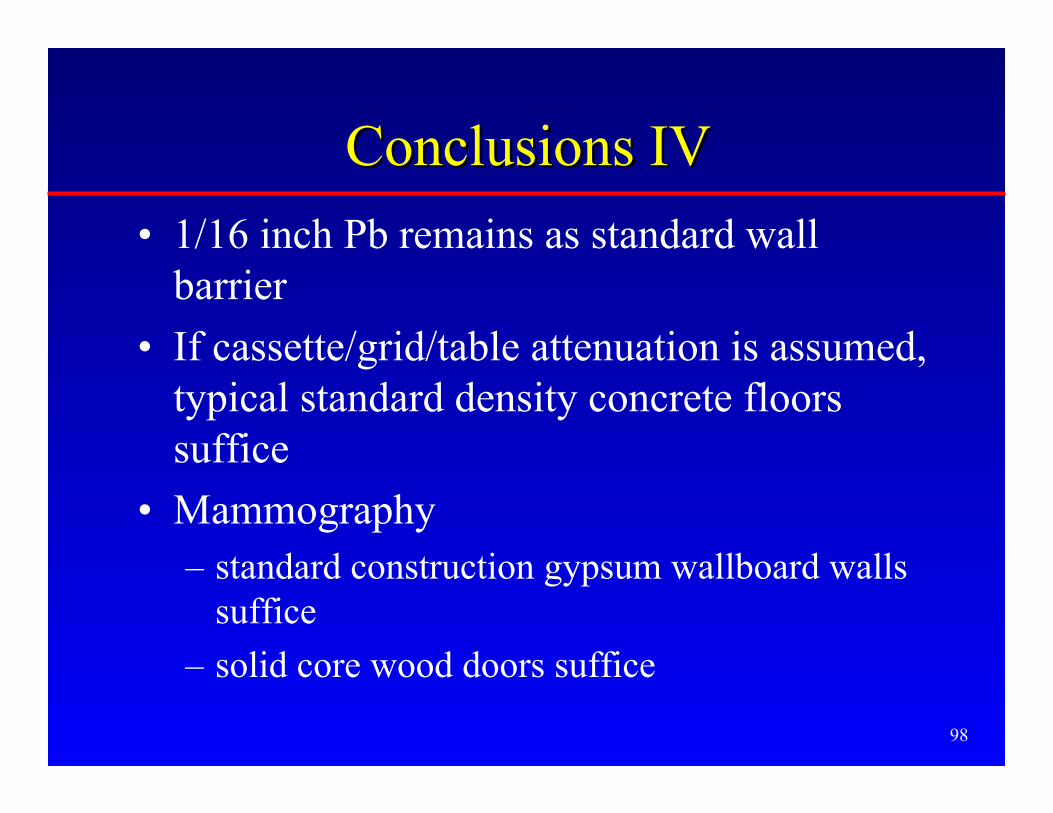
Conclusions IVConclusions IV
• 1/16 inch Pb remains as standard wallbarrier
• If cassette/grid/table attenuation is assumed,typical standard density concrete floorssuffice
• Mammography– standard construction gypsum wallboard walls
suffice
– solid core wood doors suffice

99
Conclusions VConclusions V• CT
– unshielded kerma• manufacturer’s isoexposure curves
• Shearer’s scatter fraction applied to CTDI, DLP
– workload is high– 100-200 patients/wk
– typically 200 mm heads, 600 mm bodies imaged
– transmission from Simpkin (1990) or hard HVL
– results• 1/16 inch Pb remains as standard wall barrier
• floors/ceilings may need attention
100
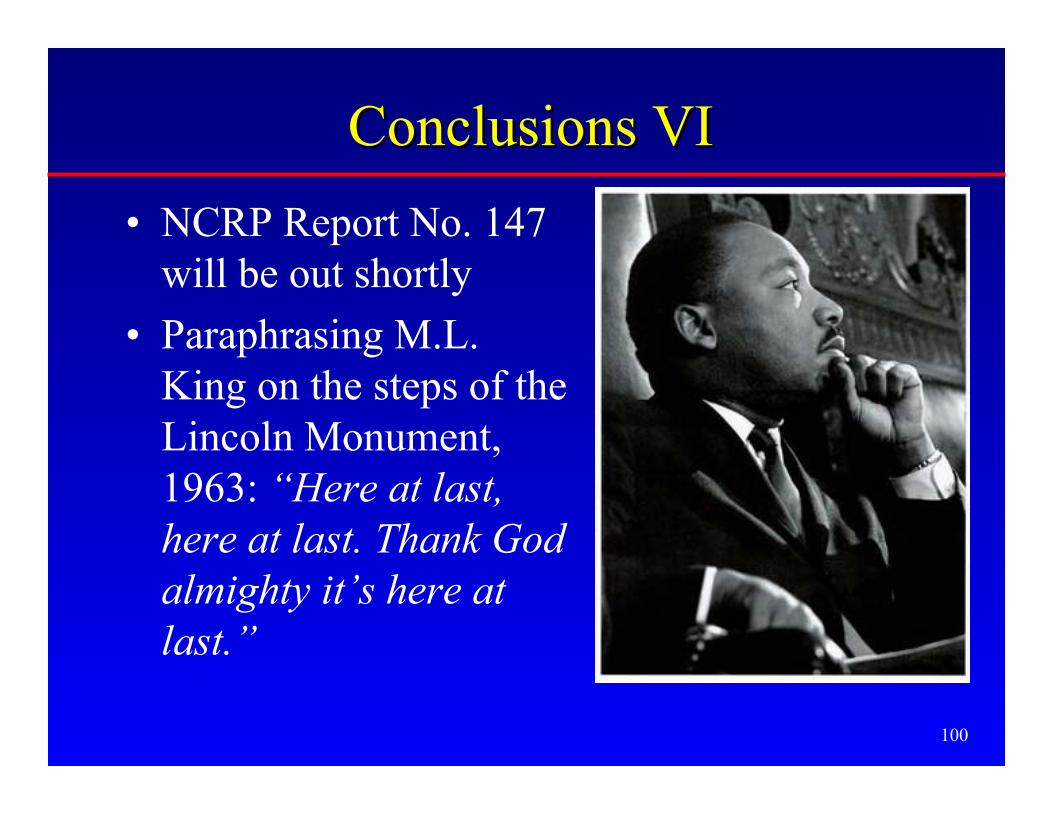
Conclusions VIConclusions VI
• NCRP Report No. 147will be out shortly
• Paraphrasing M.L.King on the steps of theLincoln Monument,1963: “Here at last,here at last. Thank Godalmighty it’s here atlast.”