diapositiva 1 - edm.es©s-8.pdfedm strategy european equities ... the advantages of its...
TRANSCRIPT


D
D

D
D

D
D


ED
M


EDM StrategyEuropean Equities
Return Date: 31/10/2016Portfolio Date: 31/10/2016
Historical Performance vs. BenchmarkTime Period: 01/01/2000 to 31/10/2016
2000 2002 2004 2006 2008 2010 2012 2014 201620,0
40,0
60,0
80,0
100,0
120,0
140,0
160,0
180,0
EDM Strategy STOXX 50 EURO STOXX 50Europe Large-Cap Growth Equity (Category)
Returns
YTD 1 year 3 years 5 years 7 years 10 years 15 years-40,0
-20,0
0,0
20,0
40,0
60,042,036,6
51,0
30,6
-0,3-15,6-12,4 -18,8-23,3
16,821,4
-2,3-12,5-9,3 -12,2
-23,7
11,4
28,1
-0,4-10,6-6,5
EDM Strategy STOXX 50 EURO STOXX 50
Retu
rn
Statistical Risk1 year 3 years 5 years 7 years 10 years 15 years
AlphaBetaVolatilityCorrelationSharpe RatioSortino Ratio
0,92
0,270,20
12,340,890,62
-0,41
0,84-0,380,88
12,343,511,00
-0,270,694,50
0,830,540,82
11,200,85
0,734,19
0,760,49
11,720,862,08
0,070,05
2,740,70
12,460,840,100,14
All EDM return data are expressed in euros and are stated net of expenses and fees. Each Set of comparisons takes into account: a) Retail class at fund level (the one with the highest charge). b) Price returns at Indice level (ex dividends)EDM Strategy is available on the following fund platforms: Allfunds Bank, Inversis, RBC and MFEX.
Fund´s Manager CommentEuropean equity markets lost ground during the month of October. EDM Strategy’s performance declined in the past month, shedding -4%, while the MSCI Europe closed with declines of -0.92%. The fund’s underperformance is attributable to several factors. On the one hand, it suffered the effects of the ongoing correction of the pharmaceutical industry: Novo Nordisk (-12%), Grifols (-8%), and Roche (-5.6%), which hold considerable positions in the fund. Moreover, Capita and Aggreko have continued to suffer from the compression of multiples. Essilor and Dassault Systèmes delivered additional adverse contributions in October, publishing slightly lower-than-expected third quarter sales results. The absence of banks, oil companies, and commodities in the fund has not helped matters, given that these more cyclical sectors are the only ones in the index that showed gains during the month.
On the last Friday of the month, Novo Nordisk announced its Q3 results, which were somewhat lower than expected in terms of sales though effective cost controls resulted in online profits. However, the company narrowed the range of growth guidelines to the bottom of the previous range for 2016 (+5-6% and +5-7% in sales and operating profit, respectively). It also released preliminary guidelines for 2017 of low single-digit growth, which would be lower than the consensus expects. Lastly,it slashed its growth guidelines for 2016-2020’s average annualised operating profit from +10% to +5%, due primarily to greater price pressure and increased insulin competition from the US. As a result of a major correction underway since early this year, it has depreciated considerably and trades at a 2017E P/E ratio of 15x, in line with the rest of the pharmaceutical sector, which is now justified to a certain extent. We believe, however, that Novo Nordisk will likely return to the path of double-digit growth from 2018, owing to its highly innovative product portfolio.
There was positive news from the luxury sector: LVMH published strong sales in the third quarter and our position in Christian Dior appreciated +10%, again highlighting the advantages of its diversification both by luxury segment and by geography. In Q3, like-for-like sales grew +6%, propelled by the fashion and leather goods division (+5%) where the Louis Vuitton brand is important, and the selective distribution division (Sephora stores), whose sales climbed +8% organically. The luxury firm, Richemont (Cartier and other brands), also contributed positively, appreciating +7.5% throughout the month.
We have started a position in the French company, Elis, the European leader in linen and work uniform rentals, laundry services, and health and hygiene services. Its mission is to help companies outsource activities that are not central to the business.
The EDM Strategy fund trades at a 2017E P/E ratio of 16x, which is a very attractive valuation for a selection of high-quality companies with profit growth that will outperform the European market in the coming years.
5 Years Risk-RewardTime Period: 01/11/2011 to 31/10/2016
Std Dev
0,0 3,0 6,0 9,0 12,0 15,0 18,0
0,0
2,0
4,0
6,0
8,0
10,0
12,0
14,0 EDM Strategy
STOXX 50
EURO STOXX 50
Europe Large-Cap Growth Equity (Category)
Retu
rn
Fund´s DataInception DateMonth End PriceFund Size (€)Base CurrencyAverage Market Cap (mil) (Long)ISIN
31/10/1995340,23
230.067.159Euro
17.162LU0028445327
SnapshotCategory
Custodian / Administrator
Auditor
Domicile
UCITS
Europe Equity Large Cap
RBC Investor Services Bank SA
Deloitte SA
Luxembourg
Yes
EDM Asset Management www.edmassetmanagement.com -1- Tel. +34914110398 +34934160143 [email protected]

EDM StrategyEuropean Equities
Return Date: 31/10/2016Portfolio Date: 31/10/2016
Holdings-Based Style Map
Mic
roSm
all
Mid
Larg
eG
iant
Deep-Val Core-Val Core Core-Grth High-Grth
EDM StrategySTOXX 50EURO STOXX 50Category
Style Box
0,0 26,4 49,5
9,0 5,4 9,7
0,0 0,0 0,1
LargeM
idSm
all
Value Blend Growth
Market Cap %
Market Cap Giant 42,7
Market Cap Large 31,6
Market Cap Mid 24,1
Market Cap Small 1,6
Market Cap Micro 0,0
Equity Sectors vs benchmarks
Strategy Stoxx 50 EuroStoxx
Basic Materials
Consumer Cyclical
Financial Services
Real Estate
Consumer Defensive
Healthcare
Utilities
Communication Services
Energy
Industrials
Technology
11,86
26,45
4,86
0,00
10,65
25,49
0,00
0,00
0,00
15,90
4,80
5,67
3,43
19,95
0,00
21,60
21,52
1,45
5,98
10,70
6,11
3,59
7,65
11,84
20,97
1,06
10,76
10,20
4,97
5,75
7,04
12,91
6,83
Equity Country Exposure%
Denmark 11,4
France 23,0
Germany 6,6
Spain 18,3
Sweden 3,0
Switzerland 20,2
United Kingdom 17,4
Equity Sectors%
Basic Materials 11,9
Consumer Cyclical 26,5
Financial Services 4,9
Real Estate 0,0
Consumer Defensive 10,6
Healthcare 25,5
Utilities 0,0
Communication Services 0,0
Energy 0,0
Industrials 15,9
Technology 4,8
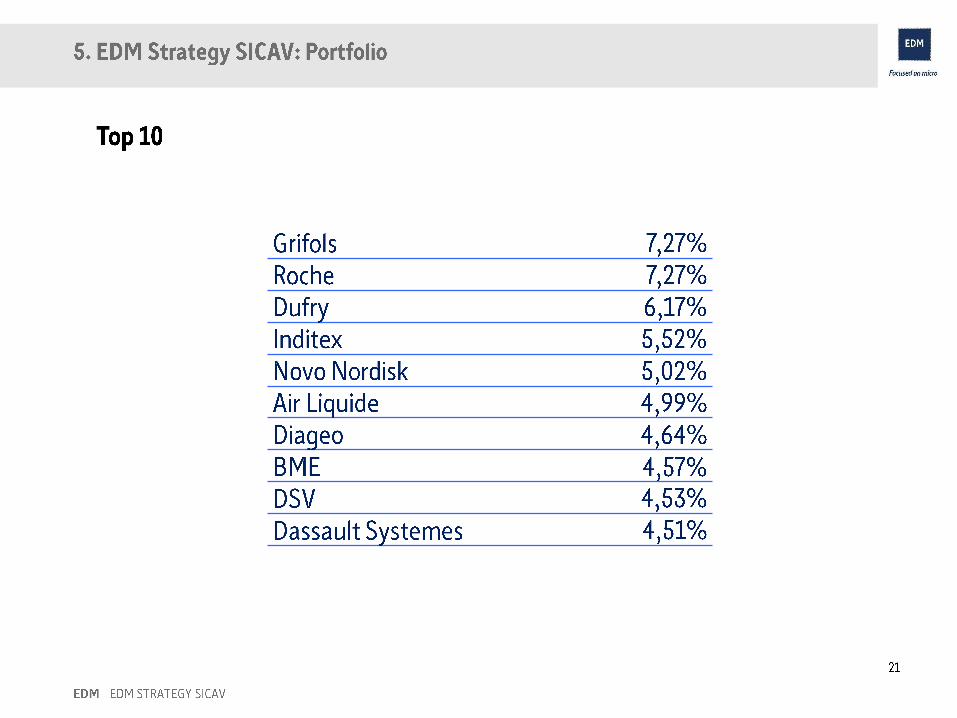
Portfolio HoldingsPortfolio Date: 31/07/2016
%Roche Holding AG Dividend Right Cert. 7,5Grifols SA ADR 7,3Novo Nordisk A/S B 6,4Capita PLC 5,8Dufry AG 5,4Industria De Diseno Textil SA 5,1ARM Holdings PLC 4,8Dassault Systemes SA 4,8Diageo PLC 4,6Air Liquide SA 4,3Bolsas y Mercados Espanoles 4,2DSV AS 4,2Essilor International SA 4,1Brenntag AG 4,1Reckitt Benckiser Group PLC 3,9Cie Financiere Richemont SA 3,6Other 19,8Total 100,0
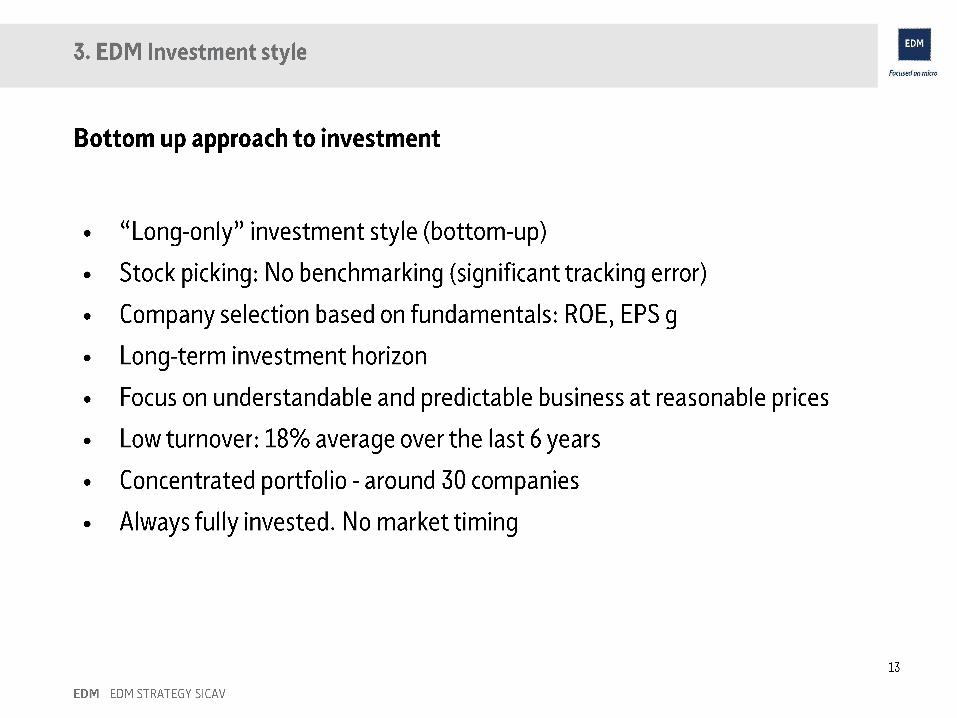
Portfolio construction• Long-only traditional investment style (bottom-up)
• Stock picking. No benchmarking (low overlapping against its benchmark)
• Long-term investment horizon
• Low turnover (18% average for the last 6 years)
• High liquidity (92% of the portfolio can be sold within one trading day)
• Restricted investment universe: only 100 companies globally
• Concentrated portfolio, maximum 30 companies
• Always fully equity invested (competition among stocks)
• 100% currency hedged (we do not predict currency fluctuations)
Stock picking methodology•Focus on understandable and predictable businesses at reasonable prices
• Management quality & integrity are crucial for us
• Demanding criteria: High quality of the business (Average Portfolio ROE = 25.5%)
• Sustainable EPS growth (5Y Average EPS Growth = 11.6%)
• Low debt balance-sheet (Net Debt/EBITDA = 1,2)
• Recurrent and solid cash-flows
• Companies focused on emerging markets to generate growth (1/3 Sales)
• Following certain long-term Macro-trends
• Lack of sectors whose profits are not easily foreseen
EDM Asset Management www.edmassetmanagement.com -2- Tel. +34914110398 +34934160143 [email protected]

EDM StrategyEuropean Equities
Return Date: 31/10/2016
Monthly returnsJan Feb Mar Apr May Jun Jul Aug Sep Oct Nov Dec YEAR
2016201520142013201220112010200920082007200620052004200320022001
-6,24 -1,31 0,17 0,77 3,52 -4,78 3,72 -1,24 -3,20 -4,055,71 6,52 1,80 -0,62 2,01 -3,66 2,81 -7,13 -2,19 7,99 2,28 -5,75-0,87 4,27 -1,84 -0,01 2,92 0,27 -3,11 1,25 -1,98 -1,53 3,26 -0,792,65 0,30 3,49 1,41 -0,11 -3,13 3,79 -0,30 1,63 2,08 1,73 1,260,80 6,53 0,53 -0,41 -3,20 0,97 7,65 0,26 2,61 -0,63 2,01 2,43-0,45 1,84 -0,30 3,52 0,39 -2,57 -1,27 -7,84 0,67 4,97 -6,97 3,781,08 0,25 5,72 0,98 -2,85 0,45 0,22 -0,57 3,60 0,99 -1,71 3,42-0,07 -4,36 -2,37 11,95 3,28 1,97 5,04 1,95 2,42 -0,96 0,75 4,24-9,86 2,90 -2,83 0,39 0,81 -7,99 1,45 2,81 -3,88 -10,11 -6,81 1,104,12 -1,47 1,85 3,76 -1,30 -1,69 0,32 0,01 1,55 -0,98 -2,01 -1,402,80 2,48 0,74 0,38 -4,07 0,99 4,16 1,49 1,22 1,35 0,98 2,62-0,16 3,58 1,56 1,11 3,44 0,37 4,53 -1,36 4,69 -3,27 3,49 4,043,71 3,80 -2,56 1,00 0,64 1,03 -2,73 -0,97 -0,26 -0,47 2,84 0,98-5,54 -5,88 2,00 5,14 -1,67 4,66 0,98 4,02 -1,66 2,33 0,40 -1,73-1,93 -0,14 3,13 -3,14 -5,24 -10,22 -11,01 0,96 -9,09 2,28 2,08 -7,52-4,44 0,92 -2,78 2,95 3,57 1,44 -1,98 -4,57 -9,60 2,30 1,34 2,88
8,831,5615,6120,82-5,0011,8825,50-28,742,5515,9823,966,962,35
-34,36-8,55
-12,41
Cumulative returnsYTD 1 year 2 years 3 years 5 years 7 years 10 years 15 years
EDM Strategy
STOXX 50
-12,41
-9,26
-15,57
-12,53
-2,34
-6,17
-0,28
-2,26
30,55
21,37
50,95
16,76
36,59
-23,33
41,98
-18,83
Annualized volatility1 year 2 years 3 years 5 years 7 years 10 years 15 years
EDM StrategySTOXX 50
12,1410,65
14,2914,89
12,3412,70
11,7211,55
11,2012,63
12,3414,91
12,4615,04
Sharpe Ratio1 year 2 years 3 years 5 years 7 years 10 years 15 years
EDM StrategySTOXX 50
-1,31-1,18
-0,01-0,14
0,050,00
0,490,37
0,540,20
0,20-0,20
0,10-0,14
Sortino Ratio1 year 2 years 3 years 5 years 7 years 10 years 15 years
EDM Strategy
STOXX 50
-1,43
-1,27
-0,01
-0,19
0,07
0,00
0,76
0,53
0,83
0,28
0,27
-0,25
0,14
-0,17
Annualized returnsYTD 1 year 2 years 3 years 5 years 7 years 10 years 15 years
EDM Strategy
STOXX 50
-12,41
-9,26
-15,57
-12,53
-1,18
-3,13
-0,09
-0,76
5,48
3,95
6,06
2,24
3,17
-2,62
2,36
-1,38
Statistical risk1 year 2 years 3 years 5 years 7 years 10 years 15 years
Up Capture RatioDown Capture RatioLongest Down-Streak Start DateLongest Down-Streak End DateDown NumberUp NumberBest QuarterWorst QuarterGain/Loss RatioMax DrawdownOverall DeviationOverall Capture Ratio
118,26122,74
01/08/201631/10/2016
7,005,00
-0,67-7,310,39
-17,451,610,96
105,1795,19
01/08/201631/10/2016
12,0012,0014,63-7,310,99
-17,97
1,10
97,8394,13
01/08/201631/10/2016
18,0018,0014,63-7,311,04
-17,97
1,04
102,0391,91
01/08/201631/10/2016
25,0035,0014,63-7,311,46
-17,97
1,11
91,3267,77
01/08/201631/10/2016
33,0051,0014,63-8,401,55
-17,97
1,35
81,5457,23
01/10/200731/01/2008
49,0071,0017,90
-15,311,28
-37,10
1,42
79,8663,72
01/10/200731/01/2008
71,00109,0017,90
-18,321,21
-42,22
1,25
Benchmark correlation1 year 2 years 3 years 5 years 7 years 10 years 15 years
AlphaBetaReturnInformation Ratio (geo)Tracking ErrorCorrelationR2
-0,271,00
-15,57-2,091,660,88
77,59
1,700,90
-1,180,395,200,94
87,82
0,620,89
-0,090,135,060,92
84,38
2,080,865,480,236,440,85
71,63
4,190,736,060,527,190,82
68,03
4,500,693,170,728,240,84
70,06
2,740,702,360,468,260,84
70,31
EDM Asset Management www.edm.es/en -1- Tel. +34934160143 +34914110398 [email protected]

EDM StrategyEuropean Equities
Return Date: 31/10/2016
Histogram Chart
Time Period: 01/01/2000 to 31/10/2016
-15,0 -11,0 -7,0 -3,0 1,0 5,0 9,0 13,0 15,00,0
4,0
8,0
12,0
16,0
20,0
24,0
28,0
32,0
36,0
EDM Strategy STOXX 50
Num
ber O
f Per
iod
Drawdown Chart
Time Period: 01/01/2000 to 31/10/2016
2000 2002 2004 2006 2008 2010 2012 2014 2016-67,5
-60,0
-52,5
-45,0
-37,5
-30,0
-22,5
-15,0
-7,5
0,0
EDM Strategy STOXX 50
12M Rolling Annualizede Volatility
11 12
2012
01 02 03 04 05 06 07 08 09 10 11 12
2013
01 02 03 04 05 06 07 08 09 10 11 12
2014
01 02 03 04 05 06 07 08 09 10 11 12
2015
01 02 03 04 05 06 07 08 09 10 11 12
2016
01 02 03 04 05 06 07 08 09 105,0
10,0
15,0
20,0
EDM Strategy STOXX 50
Vola
tility
3Y Rolling Alpha
Rolling Window: 3 Years 1 Month shift
11 12
2014
01 02 03 04 05 06 07 08 09 10 11 12
2015
01 02 03 04 05 06 07 08 09 10 11 12
2016
01 02 03 04 05 06 07 08 09 100,0
5,0
10,0
EDM Strategy STOXX 50
Alph
a
3Y Rolling Beta
Rolling Window: 3 Years 1 Month shift
11 12
2014
01 02 03 04 05 06 07 08 09 10 11 12
2015
01 02 03 04 05 06 07 08 09 10 11 12
2016
01 02 03 04 05 06 07 08 09 100,60,81,0
EDM Intern. SICAV Strategy R STOXX 50
Beta
All EDM return data are expressed in euros and are stated net of expenses and fees. Each Set of comparisons takes into account: a) Retail class at fund level (the one with the highest charge). b) Price returns at Indice level (ex dividends)
12M Rolling Annualized Return
11 12
2012
01 02 03 04 05 06 07 08 09 10 11 12
2013
01 02 03 04 05 06 07 08 09 10 11 12
2014
01 02 03 04 05 06 07 08 09 10 11 12
2015
01 02 03 04 05 06 07 08 09 10 11 12
2016
01 02 03 04 05 06 07 08 09 10-20,0
0,0
20,0
40,0
EDM Strategy STOXX 50
Retu
rn
EDM Asset Management www.edm.es/en -2- Tel. +34934160143 +34914110398 [email protected]


