dietary changes and their health implications in the ... · population with access to safe water...
TRANSCRIPT

Double burden of malnutrition in developing countries
205
Dietary changes and their health implications in the Philippines
M.R.A. Pedro and R.C. Benavides, Food and Nutrition Research Institute, and C.V.C. Barba, Institute of Human Nutrition and Food, University of the Philippines Los Baños
INTRODUCTION
In recent years, social, economic and demographic developments within the Southeast Asian region have accelerated to varying degrees. Nutritional status has improved widely in many countries, with some experiencing a transition in nutrition or the double burden of undernutrition and overnutrition. This report examines evidence of the dietary changes and whether or not the Philippines, in common with some of its neighbours in the region, is facing the double burden of under- and overnutrition.
The population of the Philippines was estimated at 85.5 million people in 2005, compared with 76.5 million in 2000. Growing at an annual 2.11 percent, the population is expected to reach 102.8 million in 2015. The Philippine economy has grown in recent years, with gross national product (GNP) expanding at an average of 5.05 percent and gross domestic product (GDP) at an average of 4.52 percent from 2001 to 2004 (NEDA, 2005). However, there has been a boom–bust pattern of growth over the 30 years from 1970 to 2000 (Figure 1). The sharp fall in growth of the economy from 1982 to 1984 coincided with political and economic crises. The dip from 1988 to 1990 reflected the impact of successive political shocks (i.e., coup attempts) and several natural disasters, as well as an economic slowdown that affected not only the Philippines but also the rest of the world; the Philippines was not spared the effects of the Asian crisis in 1997 (Templo, 2003).
FIGURE 1 Real GNP/GDP growth, 1970 to 2000
Source: Templo, 2003.
The Philippines has made remarkable progress in improving life expectancy and reducing infant mortality. Life expectancy has increased from 58 to about 70 years over the past 30 years, and infant mortality has decreased from 60 to 29 deaths per 1 000 live births
-15.0
-10.0
-5.0
0.0
5.0
10.0
15.0
1970
1972
1974
1976
19
78
19
80
1982
1984
1986
1988
1990
1992
1994
1996
1998
2000
GNP GDP
Perc
en
t

Dietary changes and their health implications in the Philippines 206
(UNDP, 2004). In addition to improvements in health care services, high levels of literacy (94 percent simple literacy rate), high primary school enrolment rates (90 percent elementary participation rate) and access to safe water (80 percent) have contributed to these remarkable reductions in infant mortality and increased life expectancy.
TABLE 1 Key development indicators
Indicator Value Year
Estimated total population 85.5 million 2005
Population growth rate 2.11% 2000–2005
Human development index (HDI), HDI rank 0.753, 83rd 2002
Gender development index (GDI), GDI rank 0.751, 66th 2002
GDP per capita (US$) 1 026 2004
Social sector expenditure (as % of total expenditure) 42.81% 2003
Share of poorest quintile in income or consumption 4.7% 2003
Share of richest quintile in income or consumption 53.3% 2003
Male life expectancy: (at birth in years) 67.2 2003
Female life expectancy: (at birth in years) 72.5 2003
Unemployment rate 10.9% 2004
Underemployment rate 16.9% 2004
Poverty headcount ratio (% of families below national poverty line) (Preliminary) 24.7% 2003
Population with access to safe water supply 80% 2002
Simple literacy rate 94% 2003
Elementary school participation rate 90% 2002
Under-five mortality rate (per 1 000 children) 40 2003
Maternal mortality rate (per 100 000 live births) 172 1998
Sources: NEDA; UNDP, 2004; Family Income Expediture Survey (FIES), 2003
The age structure of the population is also shifting. The dependency ratio (defined as the ratio of people aged 0 to 14 years or over 64 years per 100 people aged 15 to 64 years) has decreased from 88 to 64 over the past 30 years. This decrease is due more to changes in the proportion of children, rather than elderly people. The child dependency ratio dropped from 88 to 64, while the elderly dependency ratio has remained constant at 6 (UN Population Division, 2004).
The last 30 years witnessed rapid urbanization in the Philippines, with the urban proportion of the population rising from 32 percent in 1970 to 54 percent in 1995. In 2001, 59 percent of the population lived in urban areas, and the urban growth rate was 5.14 percent (Table 2). The proportion of urban population is expected to increase to 68 percent in 2015.
TABLE 2 Trends in urban and rural growth rates, 1960 to 2001
Source: Population Commission, 2002.
Indicators 1960 1970 1975 1980 1990 1995 2001
Percentage urban 29.8 31.8 33.3 37.2 48.6 54.1 59.1
Urban growth (%) 2.7 4.0 3.0 4.9 5.0 5.0 5.14
Rural growth (%) 2.5 2.6 2.6 1.5 0.3 0.3 -

Double burden of malnutrition in developing countries
207
A new methodology for estimating poverty was adopted in 1997. Figure 2 illustrates the trends in prevalence of poverty among Philippine families over the last 17 years, and compares the estimates made with the earlier official methodology, which applied a constant Engel’s coefficient (i.e., the proportion of food expenditure to total expenditure), with estimates from the new methodology, which employs a changing Engel’s coefficient (i.e., depending on the year). Poverty decreased between 1991 and 1997, while GNP and GDP were increasing (Figure 1), and then increased slightly or remained unchanged (depending on the method used to estimate poverty) during a short period of growth slump brought on by the Asian economic crisis. The estimates indicate that in 2003, 24.7 percent of Philippine families were considered poor (measured as income below the poverty threshold of 12 267 Philippine pesos [p]), compared with 28.4 percent in 2000.
FIGURE 2 Trends in prevalence of poverty among Philippine families, 1988 to 2000
Source: Reyes, 2003.
While poverty has decreased in urban areas, it persists essentially as a rural phenomenon. Three out of four poor people reside in rural areas. In 2000, 13 percent of urban and 36 percent of rural families were considered poor, or had income below the poverty threshold of 12 267 p per year (Reyes, 2003). Disparities in poverty are also seen across different regions of the country, with the autonomous region of Muslim Mindanao, the Caraga region and the Zamboanga Peninsula – all in Mindanao or Southern Philippines – being the poorest (NEDA, 2005).
Income distribution in the Philippines has remained largely unequal as measured by the GINI ratio, which assigns values ranging from 0 to 1 – the closer to 1 the more unequal. Compared with its Asian neighbours, the Philippines has wider disparity in terms of income distribution. Between 1998 and 2000, the Philippine GINI ratio worsened from 0.4446 to 0.4822, but then improved slightly to reach 0.4660 in 2003.
0
10
20
30
40
50
60
1988 1991 1994 1997 2000
Phil Phil (new methodology)
Urban Urban (new methodology)
Rural Rural (new methodology)
Per
cent

Dietary changes and their health implications in the Philippines 208
DATA SOURCES USED IN THE CASE STUDY
The major sources of data used in this case study are the surveys of the Food and Nutrition Research Institute, Department of Science and Technology (FNRI-DOST). These are periodic National Nutrition Surveys (NNS), and regional updating of the nutritional status of Philippine children. The dietary data reported here were obtained from the 1978, 1982, 1987, 1993 and 2003 NNS, while the data on nutritional status of various population groups and nutrition-related risk factors for non-communicable diseases (NCDs) among adults come from Regional Updating of the Nutritional Status of Children and the 1993, 1998 and 2003 NNS. Data on mortality trends are from the Field Health Service Information System (FHSIS) of the Department of Health. These are components of the Philippine Statistical System, and provide vital inputs to the country’s nutrition, health and development programmes.
National Nutrition Surveys FNRI-DOST conducts NNS every five years to obtain information on the nutritional status of the Philippine population through recording food consumption in households and using 24-hour recall for children and pregnant and lactating women. Surveys were carried out in 1978, 1982, 1987, 1993, 1998 and 2003, each of which included anthropometric, biochemical and clinical assessment of nutritional status. A food consumption survey component was carried out in all the surveys except for that of 1998.
Nutritional status is assessed by anthropometric measurements of all age groups, biochemical indicators (serum retinol and haemoglobin) in children aged 0 to five years and pregnant and lactating women, and urinary iodine excretion of children aged six to 12 years and pregnant and lactating women. Anthropometric measurements include weight and height for children and adults, and recumbent length for children under two years of age. Nutritional status of children 0 to ten years of age is assessed using the World Health Organization/National Center for Health Statistics (WHO/NCHS) growth curves (WHO, 1995); for pre-adolescents and adolescents aged 11 to 19 years body mass index (BMI)-for-age is used (Must, Dallal and Dietz, 1991), and for adults aged 20 years and over WHO’s recommendations for BMI are used (WHO, 1995). The nutritional status of pregnant women is based on a Philippine reference population (Magbitang et al., 1988).
The fifth (1998) and sixth (2003) NNS also included measurements of blood pressure, fasting blood glucose and blood lipids (triglyceride, cholesterol, HDL and LDL) for individuals aged 20 years and over in order to assess hypertension, diabetes and dyslipidaemia as nutritional factors associated with chronic degenerative diseases among adults.
Household food consumption data are collected through one-day household food weighing, which involves weighing all foods in “as-purchased” (AP) form before they are cooked. Food is weighed before breakfast, lunch and dinner. Food waste (i.e., edible and inedible food parts that are thrown away, given to pets, etc.) and plate waste are weighed after meals. Beginning and end inventories of all non-perishable food items such as coffee, sugar, salt and other condiments are taken, and food recall by all household members for foods eaten outside the home is recorded. The information generated is the aggregated measure of the foods eaten and the energy and nutrient intakes of all household members, which are divided by the number of people in the household during the reference period in order to derive per capita intakes. Energy and nutrient intakes from the foods consumed are based on the Philippines Food Composition Table (FCT); nutrient values of fortified foods, particularly of vitamin A, iron and iodine, are from food labels. The nutrient values in the latest Philippine FCT (1997) were revised using results from interlaboratory food

Double burden of malnutrition in developing countries
209
composition analyses. The revision included new iron values for about 30 food items, many of which were fresh and processed fish.
Per capita percentage adequacies of energy and nutrient intakes were estimated for each household, after computing for the mean recommended dietary allowances (RDAs) or recommended energy and nutrient intakes (RENI), by summing the RDAs of each household member and dividing by the number of household members. There have been two revisions to the original 1976 RDAs for the Philippines, one in 1989 and the other in 2002. The original 1976 RDAs were used in the 1978, 1982 and 1987 NNS, the 1989 revision was used to determine energy and nutrient adequacy in the 1993 survey, and the 2002 revision was used in 2003. (For more details see Annexes 1, 2 and 3.)
Assessment of the dietary intake of children aged 0 to five years and of pregnant and lactating women was included in the 1987, 1993 and 2003 NNS. Information on the food intake of these groups is obtained through 24-hour food recall. Mothers are asked to recall all the foods and beverages consumed by their children in the previous 24 hours. Aids to assist the estimation of portion sizes include using standard household measures, such as cups and spoons, and an album of standard food portion sizes, which the mother can look at to estimate the amount consumed by the child.
Sampling design of NNS All the NNS employed a multi-stage stratified sampling design, and covered all regions of the country. In the 1978, 1982, 1987 and 1993 NNS, the number of sample provinces or cluster areas for each of the regions and Metro Manila was selected based on probability proportional to the number of households. From each sample province, an equal allocation of urban and rural barangays1 (i.e., four urban and four rural barangays) were selected at random. In the case of Metro Manila, eight barangays – all urban – were selected per cluster. A systematic sample of ten households per barangay, with replacements, were then selected in the final stage of sampling. In the 1998 and 2003 surveys, all provinces were covered and the number of barangays or enumeration areas was based on probability proportional to the number of households. The 2003 NNS adopted the Master Sample developed by the Philippine Statistical System for the 2003 Family Income and Expenditure Survey (FIES) and other national surveys.
For the 1978, 1982, 1987, 1993 and 2003 NNS, the final sampling unit was the household, and all the members of each household were included. In the 1998 NNS (when there was no household food consumption survey), the final sampling unit was the individual – i.e., subjects or respondents aged 0 to five years, six to 12 years, 13 to 19 years and 20 years and over were sampled within sample barangays.
Regional Updating of the Nutritional Status of Children The nutritional status of children aged 0 to ten years is updated two to three years after each NNS, using anthropometry. The first updating survey was carried out in 1989/1990. The sampling design of the regional updating surveys is similar to that of the 1998 NNS, in which the barangay was the primary sampling unit and children aged 0 to ten years were the secondary sampling units. The update surveys generate national- and regional-level estimates.
1 A barangay is the smallest local government unit in the Philippines, and is similar to a village.

Dietary changes and their health implications in the Philippines 210
TABLE 3 Sampling design of NNS and the Regional Updating of the Nutritional Status of Children, 1978 to 2003
19781
19821 1987
1 1989/
19902
19931 1996
2 1998
1 2001
2 2003
1
Sampling design
Stratified 3-stage
Stratified 3-stage
Stratified 3-stage
Stratified 2-stage
Stratified 3-stage
Stratified 2-stage
Stratified 2-stage
Stratified 2-stage
Stratified 2-stage
Stratification Region
Urban/rural
Region
Urban/rural
Region
Urban/rural
Region
Province
Urban/rural
Region
Province
Urban/rural
Region
Province
Urban/rural
Region
Province
Urban/rural
Region
Province
Urban/rural
Region
Province
Sampling units
Province
Barangay
Household
Province
Barangay
Household
Province
Barangay
Household
Barangay
Individual
Barangay
Household
Barangay
Individual
Barangay
Individual
Barangay
Individual
Barangay
Household
Sample size
Households 2 800 2 280 3 200 4 050 5 514
0–5 years 6 932 4 977 10 385 28 698 10 634 4 111
6–10 years 5 382 3 223 15 530 3 040 1 791 3 436
11–19 years
4 111 6 079 4 856
20 years 8 480 9 299 11 685
Pregnant women
850 2 880 593
Lactating mothers
1 105 2 990 1 201
1 NNS: there was no food consumption survey component in NNS 1998. 2 Regional Updating of the Nutritional Status of Children included anthropometry among Philippine children only.
The Field Health Service Information System and Philippine Health Statistics FHSIS is a nationwide compilation of health indicators collected by city and provincial health offices from health facilities such as district hospitals, rural health units (RHUs) and barangay health stations (BHS). The indicators collected reflect the state of health programmes: Maternal and Child Health, Family Planning, the Expanded Programme on Immunization, Nutrition, Dental, Communicable and Non-Communicable Disease Prevention and Control, and Environmental Health. Philippine Health Statistics (PHS) provides summary statistical data of births and deaths registered and reported in a given year, as well as the notified diseases reported in FHSIS.
DIETARY CHANGES 1978 TO 2003
Trends in food consumption Food consumption in Philippine households has been analysed in two forms: as per capita intake in grams, and converted into kilocalories (kcal) of dietary energy. Food consumption recorded as raw as-purchased (AP) weight in grams has not changed significantly over the last 25 years. However, when converted into dietary energy, the mean daily per capita energy intake increased from 1 804 kcal in 1978 to 1 905 kcal in 2003 (Figure 3). Thus, while food intake has not increased in terms of weight, the energy density of diets is increasing. Figure 3 also demonstrates fluctuations in intake as measured both in grams and in kcal. The decreasing food intakes from 1982 to 1987 and from 1987 to 1993 may be related to the negative growth of the Philippine economy up to 1986 and from 1988 to 1991, the modest progress in reducing poverty, and lingering income inequality. The positive growth from 1991 to 1996 and from 1998 to 2003, on the other hand, reflects the increasing food intake from 1993 to 2003.

Double burden of malnutrition in developing countries
211
FIGURE 3 Trends in mean per capita food intake (g/day and kcal/day) in Philippine households,
1978 to 2003
Sample sizes: 1978, 2 800; 1982, 2 280; 1987, 3 200; 1993, 4 050; 2003, 5 514. Sources: NNS, 1978; 1982; 1987; 1993; 2003.
Trends in per capita food consumption (in grams) by food group Generally, the overall dietary pattern in Philippine households remains that of rice, vegetables and fish (Table 4), which contributed 34, 13 and 12 percent, respectively, of food weight in 2003. The proportional contributions of rice and fish have remained similar over the past 25 years, while the proportion of vegetables has declined slightly.
886
803
869
915
897
1905
1684
1753
18081804
700
750
800
850
900
950
1000
g/d
1550
1600
1650
1700
1750
1800
1850
1900
1950
kcal/d
g
kcal
1978 1982 1987 1993 2003

Dietary changes and their health implications in the Philippines 212
TABLE 4 Trends in mean daily per capita food consumption, by food group, 1978 to 2003
Consumption (g/day, raw, AP) Food group/sub-group
1978 1982 1987 1993 2003
Cereals and cereal products 367 356 345 340 364
Rice and products 308 304 303 282 303
Maize and products 38 34 24 36 31
Other cereals and products 21 18 18 22 30
Starchy roots and tubers 37 42 22 17 19
Sugars and syrups1
19 22 24 19 24
Fats and oils2
13 14 14 12 18
Fish, meat and poultry 133 154 157 147 185
Fish and products 102 113 111 99 104
Meat and products 23 32 37 34 61
Poultry 7 10 9 14 20
Eggs 8 9 10 12 13
Milk and milk products 42 44 43 44 49
Whole milk 35 35
Milk products 9 14
Dried beans, nuts and seeds3
8 10 10 10 10
Vegetables 145 130 111 106 111
Green leafy, yellow vegetables 34 37 29 30 31
Other vegetables 111 93 82 76 80
Fruits 104 102 107 77 54
Vitamin C-rich foods 30 18 24 21 12
Other fruits 74 84 83 56 42
Miscellaneous 21 32 26 19 39
Beverages4 26
Condiments 13
Total (g/day) 897 915 869 803 886
Sample sizes: 1978, 2 800; 1982, 2 280; 1987, 3 200; 1993, 4 050; 2003, 5 514. 1 Includes soft drinks (sugar content), sherbet and similar preparations. 2 Includes grated coconut and coconut milk (fat). 3 Includes mung beans, soybeans, peanuts and other dried beans, nuts. 4 Includes coffee, tuba (local wine), alcoholic beverages and others. Numbers may not add up to totals owing to rounding off.Sources: NNS, 1978; 1982; 1987; 1993; 2003.
Among the cereals, the intake of rice and its products has generally not changed; the mean per capita intake fluctuated from 282 g in 1993 – the lowest recorded intake in the 25-year period – to between 303 and 308 g during the other survey years, including 2003. The consumption of maize, which is more common as a staple in combination with rice in Central and Southern Philippines, particularly in rural areas, generally declined, except in 1993. The intake of starchy roots and tubers was half as much in 2003 (19 g/day) as in 1978 (37 g/day), reflecting the diminishing consumption of traditional and ethnic foods, such as snacks made from locally available yams and tubers.

Double burden of malnutrition in developing countries
213
FIGURE 4 Trends in per capita food intake (grams) by food group, 1978 to 2003
0
50
100
150
200
250
300
350
400
Cereals Starchy
roots and
tubers
Vegetables Fruits Meats Fish and
shellfish
Sugars Fats and
Oils
g/d
ay
1978 1982 1987 1993 2003
The consumption of other cereals and cereal products, which include breads and bakery products, noodles and snack foods made from wheat flour, peaked at 30 g in 2003 – an increase of 36 percent on the 22 g of 1993. The intake of sugars and syrups, including soft drinks, increased. The consumption of soft drinks increased by 150 percent, from 2 g in 1993 to 5 g in 2003.
Other food groups for which major increases in mean per capita intake between 1993 and 2003 were recorded include fats and oils (50 percent higher in 2003), meat and meat products (79 percent higher), poultry (43 percent higher), milk and milk products (11 percent higher) and miscellaneous food items (105 percent higher). With regard to meat and meat products, in 2003 the intake of pork (32 g) – whether fresh meat or popular processed meat products (e.g., hotdogs, meatloaf, sausages) and cooked foods – was greater than that of fresh beef (5 g) or organ meats (6 g). In 2003, processed meat products represented nearly 30 percent of meat intake. Among the miscellaneous food items, 33 percent (13 g) of the per capita daily intake in 2003 comprised alcoholic beverages. It will be important to track the trends in consumption of these foods and beverages over time, as excessive consumption of processed meat products (which contain more sodium and preservatives than fresh products) and alcoholic beverages may contribute to the incidence of hypertension and related NCDs.
Sample sizes: 1978, 2 800; 1982, 2 280; 1987, 3 200; 1993, 4 050; 2003, 5 514. Sources: NNS, 1978; 1982; 1987; 1993; 2003.

Dietary changes and their health implications in the Philippines 214
TABLE 5 Comparison of fresh and processed meat intakes (g/day), 2003
Food group/sub-group g/day
Fresh meat 38
Pork 32
Beef 5
Carabeef N
Other fresh meat 1
Organ meat 6
Pig 2
Cow 1
Carabao N
Chicken and other poultry 1
Other organ meats N
Organ meat recipes 2
Liver spread N
Processed meat 18
Popular processed meat 15
Canned 1
Cooked mixed recipes 2
Consumption of vegetables and fruits declined, as did their percentage contribution to total food intake. The intake of fruits, both vitamin C-rich and other, hit a low of 54 g in 2003, a decrease of 50 g since 1978 after a steady 30 percent reduction during the periods 1987 to 1993 and 1993 to 2003. Among vegetables, the intake of green leafy and yellow vegetables has remained the same since 1987, while that of other vegetables has increased – albeit by only 4 g – in the past decade.
Trends in per capita food consumption (in kilocalories) by food group Rice and rice products continue to be the major source of dietary energy, but their contribution to total per capita dietary energy intake has declined, particularly in the last 13 years (Table 6). Between 1978 and 1987, this group provided 1 050 to 1 022 kcal per capita/day (58 to 56 percent of total per capita dietary energy intake), decreasing to 1 006 kcal (53 percent of total intake) in 2003. The contribution of other traditional staples such as maize and starchy roots and tubers also declined between 1978 and 2003: maize from 137 to 98 kcal per capita/day, and starchy roots and tubers from 40 to 23 kcal. These two food groups fell from providing 10 percent of total dietary energy in 1978 to providing 6 percent in 2003. Other cereals and cereal products, meat and meat products, poultry, fats and oils, sugars and syrups, and miscellaneous food items, including beverages, have been increasing. The contribution of other cereals and cereal products to dietary energy increased from 4 to 10 percent (or 3 to 6 kcal/g), while that of fish, meats and poultry rose from 8 to 12 percent (or 1.00 to 1.24 kcal/g).
In 1978, the energy intake from milk and milk products (94 kcal) was more than three times that of later surveys, even though the quantity of milk and milk products remained very similar (Table 4). Sweetened condensed milk was more frequently consumed in 1978 than in succeeding periods. The energy value of sweetened condensed milk is 321 kcal/100 g compared with 60 kcal/100 g for whole milk and 35 kcal/100 g for skim milk (USDA, no date).

Double burden of malnutrition in developing countries
215
TABLE 6 Trends in per capita dietary energy intake (kcal) by food group and sub-group, 1978 to 2003
Consumption (kcal)
Food group/sub-group 1978 1982 1987 1993 2003
Cereals and cereal products 1 262 1 213 1 196 1 286
Rice and products 1 050 1 032 1 022 950 1 006
Maize and products 137 130 82 114 99
Other cereals and products 70 99 109 131 181
Starchy roots and tubers 40 42 23 17 23
Sugars and syrups1
67 81 84 71 84
Fats and oils2
88 112 110 99 112
Fish, meat and poultry 135 155 166 160 229
Fish and products 68 65 70 62 65
Meat and products 58 78 86 82 141
Poultry 9 11 11 17 23
Eggs 11 13 14 17 19
Milk and milk products 94 27 23 24 27
Whole milk 22 23
Milk products 2 4
Dried beans, nuts and seeds3
20 24 23 22 21
Vegetables 34 29 25 32
Green leafy, yellow vegetables 9 9 7 7 10
Other vegetables 25 20 60a 18 23
Fruits 45 42 35 30
Vitamin C-rich foods 14 11 12 8 4
Other fruits 31 31 29 27
Miscellaneous 11 18 18 18 42
Beverages4 30
Condiments 8
Others 4
Total (kcal) 1 804 1 808 1 753 1 684 1 905
Sample sizes: 1978, 2 800; 1982, 2 280; 1987, 3 200; 1993, 4 050; 2003, 5 514. 1 Includes soft drinks (sugar content), sherbet and similar preparations. 2 Includes grated coconut and coconut milk (fat). 3 Includes mung beans, soybeans, peanuts and other dried beans, nuts. 4 Includes coffee, tuba (local wine), alcoholic beverages and others. a Includes other fruits and other vegetables Numbers may not add up to totals owing to rounding off.Sources: NNS, 1978; 1982; 1987; 1993; 2003.
Trends in nutrient adequacy Based on absolute intakes, the mean per capita intakes of energy, protein, vitamin A, calcium, thiamine, riboflavin and niacin increased in 2003 from the levels in 1993 and earlier years. Intakes for most other nutrients, however, remained inadequate, particularly those for iron, calcium, riboflavin and vitamin C, all of which were less than 80 percent of the recommended levels – an indication that these nutrients are probably inadequately provided for by the average food consumption pattern in Philippine households (see reference RENIs for 2002 in Annex 3).

Dietary changes and their health implications in the Philippines 216
TABLE 7 Trends in per capita energy and nutrient intakes and percentage adequacy based on Philippine RDAs and RENIs, 1978 to 2003
Nutrients 19781 1982
1 1987
1 1993
2 2003
3
Energy
Intake (kcal) 1 804 1 808 1 753 1 684 1 905
% adequacy 88.6 89.0 87.1 87.8 98.3
Protein
Intake (g) 53.0 50.6 49.7 49.9 56.2
% adequacy 102.9 99.6 98.2 106.2 99.2
Iron
Intake (mg) 11.0 10.8 10.7 10.1 10.1
% adequacy 91.7 91.5 91.5 64.7 60.1
Vitamin A
Intake (ug RE ) - - 389.7 391.9 455.2
% adequacy - - 75.9 88.1 91.4
Calcium
Intake (g) 0.44 0.45 0.42 0.39 0.44
% adequacy 80.4 75.0 67.0 57.1
Thiamine
Intake (mg) 0.73 0.74 0.68 0.67 0.88
% adequacy 71.8 66.7 68.4 86.3
Riboflavin
Intake (mg) 0.53 0.58 0.56 0.56 0.73
% adequacy 56.3 54.4 57.1 68.0
Niacin
Intake (mg) 15.3 16.4 16.3 16.1 20.6
% adequacy 119.7 119.9 68.0 156.4
Ascorbic acid
Intake (mg) 66.8 61.6 53.6 46.7 46.5
% adequacy 91.1 80.0 73.2 75.0
Fats
Intake (g) 30 30 29 38
Carbohydrates
Intake (g) 327 313 310 333
Sample sizes: 1978, 2 800; 1982, 2 280; 1987, 3 200; 1993, 4 050; 2003, 5 514. 1 1976 RDA for Philippines (Annex 1). 2 1989 RDA for Philippines (Annex 2). 3 2002 RENI for Philippines (Annex 3). Sources: NNS, 1978; 1982; 1987; 1993; 2003.
The contributions of animal and plant food sources to total energy, protein, vitamin A and iron intakes are shown in Figure 5. Plant foods, particularly cereals such as rice and rice products, continue to be the major contributors of energy, protein and iron in Philippine diets. Rice and rice products alone contributed 53, 37 and 29 percent, respectively, of total energy, protein and iron intakes in Philippine households.

Double burden of malnutrition in developing countries
217
FIGURE 5 Percentage contributions of animal and plant foods to total energy, protein, vitamin A and
iron intakes, 2003
Sample size: 5 514. Source: NNS, 2003.
The declining intake of vitamin C over the years may be explained by the generally declining intake of vitamin C-rich fruits. There was also no increase in iron intake in 2003, in spite of the reported increased intake of meat, because most of this increase was in the form of pork, which in general has lower iron content (0.8 mg/100 g) than beef (2.8 mg/100 g). In addition, the revised iron values in the updated Philippine FCT – particularly those affecting about 30 food items, many of which were fresh and processed fish – were generally lower, as reflected in the lower iron contribution from fish in spite of an increased intake in 2003 (Annexes 6 and 7).
The remarkable drop in iron adequacy since 1987, from 91.5 to < 65 percent in 1993 and 2003 in spite of absolute intakes that remained nearly the same throughout the same period, is attributed to the revisions in recommended nutrient intakes already noted.Specifically for iron, differences in estimating the basal or obligatory losses and the requirements for growth among children resulted in higher requirements in the 1989 RDAs and 2002 RENIs compared with those of 1976. There were also notable changes in the niacin and calcium requirements. For niacin, the requirement in the 1976 RDAs and 2002 RENIs was based only on preformed niacin, and therefore lower than that in the 1989 RDA, which included the contribution of tryptophan. This explains the drop in mean per capita niacin adequacy in 1993, even though the absolute intake was virtually the same as in preceding years. With regard to calcium, the requirement was increased in the 2002 RENIs, primarily because of a shift in the paradigm for setting calcium requirements, i.e., a
Protein intake = 56.2g
Vitamin A intake = 455.2 g Iron intake = 10.1 mg
Total energy intake = 1905 kcal
Animal source 14.4%
Plant source 83.8% Rice and rice products 52.8%
Animal source 43 %
PPllaanntt ssoouurrccee 5577%%
Rice and rice products 37%
Plant source 32.9%
Animal source 67.1%
Plant source 74.4%
Animal source 28.4%
Rice and rice products 28.8%

Dietary changes and their health implications in the Philippines 218
change in objective from that of attaining calcium balance to that of preventing osteoporosis. This also explains the drop in calcium adequacy in 2003, in spite of an increase in calcium intake.
Achievement of population nutrient intake goals The increased intakes of fats and oils, fish, meats and poultry, and milk and milk products are consistent with the Nutritional Guidelines for the Philippines (Annex 4), which has called for specific improvements to the quality of Philippine diets by including more animal foods (Guideline no. 4), fats and oils (Guideline no. 6) and milk and milk products (Guideline no. 7). Overall, the proportion of animal foods in total food intake has increased – from 20 percent in 1978, to 25 percent in 1993 and to 28 percent in 2003 (Figure 6). These increases may also be attributed to the increasing trend in consumption of fast foods and could signal a detrimental increase in saturated fat and cholesterol, which will be discussed in the following sections.
FIGURE 6 Mean per capita food intake by source, 1993 and 2003.
Sample sizes: 1993, 4 050; 2003, 5 514. Sources: NNS, 1993; 2003.
The average contribution of fat to total dietary energy intake increased from 15 to 18 percent, and that of carbohydrate decreased from 74 to 70 percent. The proportion of households with per capita fat consumption or contribution within the WHO/FAO (2003) recommendations of 15 to 30 percent of energy intake increased from 38 percent in 1993 to 46 percent in 2003. The proportion of households with per capita carbohydrate consumption of between 55 and 75 percent of energy intake increased from 53 to 58 percent over the same period.
Mean per capita food intake = 803 g
Animal source 25%
Plant source 72% Miscellaneous 3%
1993
Animal source 28%
Plant source 68% Miscellaneous 4%
Mean per capita food intake = 886 g
2003

Double burden of malnutrition in developing countries
219
FIGURE 7 Percentage distribution of per capita dietary energy from fat, protein and carbohydrates,
1987, 1993 and 2003
The continuing pattern of decreasing fruit and vegetable consumption is reflected in the declining proportion of households that consume 400 g fruits and vegetables per capita per day, particularly in the last ten years. In 1993, 11.5 percent of Philippine households had a per capita intake of 400 g fruits and vegetables a day; this figure had declined to 8.2 percent in 2003 – a drop of about one-third (Table 8).
TABLE 8 Trends in achievement of population nutrient intake goals, 1993 and 2003
Year % of population with 15–30% energy
intake from fat
% of population with < 10% energy intake
from free sugars
% of population with 55–75% energy intake
from carbohydrate
% of population consuming 400 g/day fruits and
vegetables
1993 37.6 94.3 53.0 11.5
2003 46.2 92.1 57.9 8.2
Sample sizes: 1993, 4 050; 2003, 5 514. Sources: NNS, 1993; 2003.
The proportion of households with less than 100 percent of mean per capita energy adequacy was 57 percent in 2003, an improvement from 1993’s figure of 74 percent. The Millennium Development Goal (MDG) for hunger calls for halving the proportion of population below the minimum level of dietary energy consumption. Data collected by FAO to measure the proportion of undernourished people show a declining trend in the proportion of the population considered undernourished (FAO, 2003).
Trends in food and nutrient intakes in urban and rural areas The 1987 and 1993 NNS show urban and rural differences in food (Table 9) and energy and nutrient intakes (Table 10). Generally, in both years, the intakes of cereals and cereal products, particularly rice and maize products, starchy roots and tubers, fish, and vegetables, including green leafy and yellow and other vegetables were higher in rural than in urban areas. Urban households, on the other hand, had higher per capita intakes of other cereals and cereal products (which include breads and bakery products, noodles and snack
Kcal/day
0
2 0 0
4 0 0
6 0 0
8 0 0
1 0 0 0
1 2 0 0
1 4 0 0
1 6 0 0
1 8 0 0
2 0 0 0
kcal F a t
P ro te in
C a rb o h y d ra te
11%
15%
73.6%
11.5%
14.9%
69.9%
11.8%
18.3%
74%
1987 1993 2003

Dietary changes and their health implications in the Philippines 220
foods made from wheat flour), sugars and syrups, fats and oils, meat and poultry, eggs, milk and milk products, dried beans, nuts and seeds, and vitamin C-rich fruits. Between 1987 and 1993, the consumption of milk and milk products, in particular, increased in urban areas but decreased in rural ones.
TABLE 9 Trends in per capita food consumption (grams) by urban and rural residence, 1987 and 1993
Rural Urban Food group/sub-group
1987 1993 1987 1993
Cereals and cereal products 361 350 318 318
Rice and products 317 289 281 273
Maize and products 31 55 11 17
Other cereals and products 13 16 26 28
Starchy roots and tubers 25 21 17 13
Sugars and syrups1
22 17 26 20
Fats and oils2
12 11 15 14
Fish, meat and poultry 145 133 174 161
Fish and products 109 99 112 97
Meat and products 28 23 52 44
Poultry 8 9 11 19
Eggs 8 9 13 15
Milk and milk products 34 24 56 64
Whole milk 30 22 45 48
Milk products 4 2 11 16
Dried beans, nuts and seeds3
9 8 11 11
Vegetables 104 102 91 86
Green leafy, yellow vegetables 32 34 25 25
Other vegetables 72 68 66 61
Fruits 115 84 123 93
Vitamin C-rich foods 31 26 44 39
Other fruits 84 58 79 54
Miscellaneous 27 16 24 23
Beverages4 13 6 10 11
Condiments 11 9 11 9
Others 3 1 3 2
Total (g) 863 786 869 819
Sample sizes: 1987, 3 200; 1993, 4 050. 1 Includes soft drinks (sugar content), sherbet and similar preparations.
2 Includes grated coconut and coconut milk (fat).
3 Includes mung beans, soybeans, peanuts and other dried beans, nuts.
4Includes coffee, tuba (local wine), alcoholic beverages and others.
Numbers may not add up to totals owing to rounding off.Sources: NNS, 1987; 1993.
The food intake in rural areas has followed the same trend as that in urban areas. As in urban areas, the consumption of rice and rice products, starchy roots and tubers, and fruits decreased in rural areas between 1987 and 1993, while that of other cereals and cereal products increased. Urban patterns of food consumption are reflected significantly in the diets of the rural population for various reasons, including the influence of urban migrants on the families they leave behind, improved transport and communications between urban and rural areas, and the increasing availability of processed foods in rural markets. It should be noted that reduced intakes were reported for nearly all of the food groups in terms of weight and total dietary energy intake, in both urban and rural areas between 1987 and 1993; this is shown in the national data in Table 4.

Double burden of malnutrition in developing countries
221
In terms of adequacy of energy and nutrients in the diet, urban and rural households did not differ. In 1993, both had inadequate intakes of energy and nutrients, except protein in urban and rural areas and vitamin A in urban areas only. Per capita vitamin A intake was more than 100 percent adequate in urban households, but only 74 percent in rural ones.
TABLE 10 Trends in per capita nutrient intakes and percentage adequacy, by urban and rural residence, 1987 and 1993
Rural Urban Nutrients
19871
19932
19871
19932
Energy
Intake (kcal) 1 748 1 696 1 761 1 673
% adequacy 87.2 88.6 86.9 87.0
Protein
Intake (g) 49.1 49.1 50.7 50.8
% adequacy 97.6 104.9 99.0 107.6
Iron
Intake (mg) 10.5 9.9 10.9 10.2
% adequacy 91.3 64.3 91.6 64.6
Vitamin A
Intake (ug RE ) 357.5 327.9 440.4 457.0
% adequacy 70.3 73.8 84.9 102.7
Calcium
Intake (g) 0.43 0.39 0.42 0.39
% adequacy 76.8 66.1 76.4 67.2
Thiamine
Intake (mg) 0.65 0.65 0.73 0.70
% adequacy 63.7 66.3 70.9 71.4
Riboflavin
Intake (mg) 0.52 0.51 0.62 0.61
% adequacy 51.0 52.0 60.2 61.6
Niacin
Intake (mg) 16.1 15.8 16.6 16.5
% adequacy 118.4 86.3 121.2 89.7
Ascorbic acid
Intake (mg) 54.7 48.7 51.8 44.6
% adequacy 82.0 76.6 76.5 69.7
Sample sizes: 1987, 3 200; 1993, 4 050. 1 1976 RDA for Philippines (Annex 1). 2 1989 RDA for Philippines (Annex 2). Sources: NNS, 1987; 1993.
Urban and rural differences are also noted with regard to the contributions of fat, protein and carbohydrate to total dietary energy supply (Table 11). Generally, the contribution of fats to total dietary energy has been higher in urban (about 18 percent in 1987 and 1993) than in rural (13 percent) households, while the latter consume more carbohydrates (75 to 76 percent versus 70 percent of dietary energy).

Dietary changes and their health implications in the Philippines 222
TABLE 11 Trends in percentage proportions of per capita dietary energy from fat, protein and carbohydrates, by urban and rural residence, 1987 and 1993
Total dietary energy intake (kcal)
% dietary energy from fat
% dietary energy from protein
% dietary energy from carbohydrates
1987 1993 1987 1993 1987 1993 1987 1993
Urban 1 761 1 673 18.4 18 11.3 12.3 70.2 69.7
Rural 1 748 1 696 13.0 12.9 10.8 11.7 76.2 75.4
Sample sizes: 1987, 3 200; 1993, 4 050. Sources: NNS, 1987; 1993.
The urban–rural disaggregation of the 2003 NNS data is not yet available, but regionally disaggregated data on food intake (Annex 8) support the urban–rural differences in diet patterns that were noted from the earlier surveys. In very urban areas such as Metro Manila, the consumption of other cereals and cereal products, fats and oils, meats and meat products, and milk and milk products continues to be higher, while that of vegetables is lower than in other regions with varying extents of urbanization. Apart from Metro Manila, the regions with the highest proportion of urban population (specifically, Central Luzon and Calabarzon, which are at least 60 percent urban) have higher consumption of other cereals and cereal products, meats and meat products, eggs, and milk and milk products than the least urbanized regions (Cagayan Valley and Eastern Visayas, which are only 19 to 22 percent urban). Central Luzon and Calabarzon have lower intakes of starchy roots and tubers and vegetables than most of the other less urbanized regions.
Dietary changes in the Philippines in the past 25 years have followed much the same pattern as those described in the nutrition transition literature of, for example, Shetty and Gopalan (1998) and Popkin (1994). The Philippine diet has become more energy-dense, with a greater proportion of energy from fat. Important changes in the types of food in the diet include:
increasing intake of other cereals and cereal products, including breads and other bakery products and different forms of noodles and pasta; increasing intakes of sugars and syrups, fats and oils, and animal food sources such as meat, poultry, eggs and dairy products; decreasing intakes of fruit, vegetables, and starchy roots and tubers.
There are noticeable differences between the consumption patterns of urban and rural groups. In particular, urban residents are showing a strong trend towards consumption of non-traditional staples and animal source foods, accompanied by a declining intake of fruits and vegetables.
In general, the overall adequacy of the Philippine diet has improved, as illustrated by the increasing adequacy of energy and most micronutrients. There are, however, some declining trends in adequate intakes of iron and vitamin C. The latter is most probably associated with a steep drop in consumption of vitamin C-rich fruits, while the decline in iron intake is more difficult to understand, but most likely involves a combination of increasing requirements from the updated Philippine RENIs and decreasing amounts of iron considered to be bioavailable.
Food and nutrient intake of preschool-age children Infant and young child feeding practices in the Philippines have been shown to be inadequate. The prevalence of breastfeeding was 87 to 89 percent between 1993 and 2003

Double burden of malnutrition in developing countries
223
(Philippines National Demographic and Health Survey, 2003; NNS, 2003), but the mean duration of breastfeeding in 2003 was only 5.6 months (NNS, 2003). In the same year, the prevalence of exclusive breastfeeding was only 41.7 percent among infants under two months of age, and 33.4 percent among those aged two to three months; at four to five months of age, only 11.5 percent of infants were still exclusively breastfed (NNS, 2003).
There is a dearth of published national data on the food intake of Philippine preschool children. Unpublished reports on the food intake of non-breastfeeding preschool-age children from the 1978, 1982, 1993 and 2003 NNS imply that the food intake of preschool children in general has been inadequate in energy and the essential nutrients, except protein. Although, rice, milk and milk products, fish, meat and poultry, and fruits have been the major contributors to preschool children’s dietary patterns, intakes have apparently been inadequate to meet those recommended for several essential nutrients, particularly iron, vitamin A and calcium. The consequences of inadequate food and nutrient intakes among children are reflected in their poor nutritional status, which is described in the following sections.
TABLE 12 Trends in mean per capita food consumption (grams) in preschool-age children, 1978 to 2003
Food group/sub-group 1978a 1982
a 1993
b 2003
c
Cereals and cereal products - - 163 166
Rice and products 88 101 121 122
Maize and products - - 15 17
Other cereals and products - - 27 27
Fats and oils1
n 5 2 6
Fish, meat and poultry 71 82 85 95
Eggs 7 8 8 8
Milk and milk products 88 109 111 179
Vegetables 28 29 22 23
Fruits 77 72 70 31
Other food groups 1035 90
5
Starchy roots and tubers - - 11 8
Dried beans, nuts and seeds2 - - 6 4
Sugars and syrups3 - - 12 15
Miscellaneous4 - - 10 27
Total intake (g) 462 496 500 506
Sample sizes: 1978, 2 800; 1982, 2 280; 1993, 4 050. 1 Includes grated coconut and coconut milk (fat). 2 Includes mung beans, soybeans, peanuts and other dried beans, nuts. 3 Includes soft drinks (sugar content), sherbet and similar preparations. 4 Includes beverages, condiments and others. 5 Includes maize and maize products, other cereals, starchy roots and tubers, dried beans, nuts and seeds, sugars, and miscellaneous (beverages, condiments and others). a Six months to four years of age. b Three to 59 months of age (unpublished). c Six months to five years of age. – = less than 0.5 g. Numbers may not add up to totals owing to rounding off. Sources: NNS, 1978; 1982; 1993.

Dietary changes and their health implications in the Philippines 224
TABLE 13 Trends in mean per capita energy and nutrient intakes and percentage adequacy in preschool-age children, 1978 to 1993
Sample sizes: 1978, 2 800; 1982, 2 280; 1993, 4 050; 2003, 5 514. 1 1976 RDA for Philippines (Annex 1). 2 1989 RDA for Philippines (Annex 2). 3 2002 RENI for Philippines (Annex 3). a Six months to four years of age, non-breastfeeding. b Three to 59 months of age, non-breastfeeding. c Six months to five years of age, non-breastfeeding. Sources: NNS, 1978; 1982; 1993; 2003.
CHANGES IN NUTRITIONAL STATUS
Data on the nutritional status of the Philippine population come from the NNS rounds in 1993, 1998 and 2003 and the Regional Updating of the Nutritional Status of Children in 1989/1990, 1992, 1996 and 2001.
Trends in the nutritional status of children aged 0 to ten years Undernutrition among children continues to be a public health problem. In 2003, underweight and stunting still affected three out of every ten children aged 0 to 5.9 years (Figure 8) and six to 10.9 years (Figure 9). According to 2003 population projections based on 2000 census data from the National Statistics Office, there are 3.2 million underweight children aged 0 to 5.9 years, and 2.4 million aged six to 10.9 years; for stunting the respective figures are 3.4 million and 3.3 million.
Nutrient 1978
1a1982
1a1993
2b2003
3c
Energy
Intake (kcal) 742 873 887 980
% adequacy 53.8 63.3 68.0 83.0
Protein
Intake (g) 23.8 27.3 28.8 31.5
% adequacy 87.2 100 105.9 102.8
Iron
Intake (mg) 4.5 5.4 6.0 6.2
% adequacy 67.2 80.6 63.6 72.7
Vitamin A
Intake (ug RE ) - - 234.3 315.9
% adequacy - - 66.3 79.0
Calcium
Intake (g) 0.28 0.29 0.27 0.37
% adequacy 58.0 47.6 73.4
Thiamine
Intake (mg) 0.43 0.47 0.43 0.65
% adequacy 65.3 63.0 123.2
Riboflavin
Intake (mg) 0.41 0.44 0.41 0.74
% adequacy 61.1 61.8 142.3
Niacin
Intake (mg) 6.4 8.2 8.6 10.4
% adequacy 87.2 66.6 163.8
Ascorbic acid
Intake (mg) 29.4 28.9 25.0 31.7
% adequacy 77.1 68.5 105.5

Double burden of malnutrition in developing countries
225
However, there was declining prevalence of undernutrition – underweight and stunting – in both age groups between 1989/1990 and 2003. Within this period, the proportion of underweight children aged 0 to five years declined by 7.6 percentage points, from 34.5 to 26.9 percent (an average reduction of 0.58 percentage points a year); among six- to ten-year-old children, the prevalence of underweight dropped by 8.6 percentage points, from 34.2 to 25.6 percent (an average 0.66 percentage points a year). Stunting among 0- to five- and six- to ten-year-old children also declined by 10.0 (0.77 a year) and 9.0 (0.69 a year) percentage points, respectively. Meanwhile, the prevalence of acute malnutrition (wasting) among children aged 0 to five years has not improved, and increased from 5.0 percent in 1989/1990 to 5.3 percent in 2003.
FIGURE 8 Trends in the prevalence of malnutrition among children aged 0 to 5.9 years,
1989/1990 to 2003
Sample sizes: 1989/1990, 8 008; 1992, 7 243; 1993, 24 000 household members; 1996, 10 385; 1998, 28 698; 2001, 10 634; 2003, 4 110. References: International Reference Standard/NCHS Growth Reference: underweight = weight-for-age < -2SD; wasting = weight-for-height < -2SD; stunting = height-for-age < -2SD; overweight-for-age = weight-for-age > 2SD. Sources: NNS, 1993; 1998; 2003; Regional Updating of the Nutritional Status of Children, 1989/1990; 1992; 1996; 2001.
1,4
26,930,829,9
34,034,532,0
30,6
29,9
36,839,9
34,3 34,5 34,031,4
5,3
6,65,0
6,75,2 6,0 6,3
0,70,6 0,4 0,5 0,4 1,0
0
10
20
30
40
50
1989-90 1992 1993 1996 1998 2001 2003
Perc
ent
Underweight
Stunting
Wasting
Overweight

Dietary changes and their health implications in the Philippines 226
FIGURE 9 Trends in the prevalence of malnutrition among children aged six to 10.9 years,
1989/1990 to 2003
Sample sizes: 1989/1990, 4 306; 1993, 5 636; 1993, 24 000 household members; 1996, 15 530; 1998, 3 040; 2001, 1 791; 2003, 3 436.References: International Reference Standard/NCHS Growth Reference: underweight = weight-for-age < -2SD; wasting = weight-for-height < -2SD; stunting = height-for-age < -2SD; overweight-for-age = weight-for-age > 2SD. Sources: NNS, 1993; 1998; 2003; Regional Updating of the Nutritional Status of Children, 1989/1990; 1992; 1996; 2001.
The average annual percentage reduction of 0.58 percent is not sufficient to meet the MDG target of reducing the proportion of underweight-for-age children under five years of age to 17.25 percent by 2015. There are geographical (regional) disparities in the nutritional status of children, and measures to reduce the prevalence of undernutrition will have to be strengthened in the regions where the problem is greatest. The proportions of underweight-for-age children are higher in the Administrative Region of Muslim Mindanao (34 percent) – one of the poorest in the country – and Mimaropa region (34.2 percent) in Southern Luzon than in Metro Manila (17.8 percent), Central Luzon (21.7 percent) and the Cordillera Administrative Region (16.3 percent).
Meanwhile, although overweight-for-age affects smaller proportions of children (1.4 and 1.3 percent, respectively, in the 0 to 5.9 years and the six to 10.9 years age groups), it has increased significantly between 1998 and 2003. The prevalence of overweight among both age groups in 1989/1990 and 1998 was unchanged, but in 2003 it had increased nearly threefold among children aged 0 to 5.9 years and more than tenfold among those aged six to 10.9 years compared with 1998 levels.
Trends in the nutritional status of 11- to 19-year-olds In 2003, the proportion of underweight among adolescents aged 11 to 12 years was nearly the same as that among children up to ten years of age – about three out of ten (25.9 percent). Underweight among those aged 11 to 19 years decreased between 1993 and 2003 for both males and females, but the decrease among females was twice that among males, particularly after 1998. On the other hand, overweight increased, affecting 4.2 percent of 11- to 12-year-olds, and 3.4 percent of 13- to 19-year-olds in the same year. The prevalence of overweight among these groups has increased steadily, with larger percentage increases among females than males.
1.3
25.628.3
30.532.534.2
30.232.9
35.8
42.844.842.2
39.140.8 41.1
0.20.1 0.6 0.4 n 0.80
10
20
30
40
50
1989-90 1992 1993 1996 1998 2001 2003
Percent
Underweight
Stunting
Overweight

Double burden of malnutrition in developing countries
227
TABLE 14 Trends in the prevalence of underweight and overweight among 11- to 19-year-olds
Underweight Overweight
1993 1998 2003 1993 1998 2003
Gender/age group
% prevalence
Male
11–12 years
13–19 years
All males
Female
11–12 years
13–19 years
All females
Male and female
11–12 years
13–19 years
All adolescents
32.1
28.8
29.8
36.3
29.7
30.7
34.0
28.7
30.2
37.3
31.8
33.1
36.5
32.0
33.1
37.0
31.9
33.1
31.0
17.0
20.5
20.6
6.4
10.1
25.9
12.0
15.5
2.6
2.5
2.6
1.5
2.5
2.2
2.2
2.5
2.4
1.8
1.0
1.2
3.2
5.2
4.7
2.5
3.1
2.9
4.9
2.9
3.4
3.4
3.9
3.8
4.2
3.4
3.6
Sample sizes: 1993, 24 000 household members; 1998, 6 079; 2003, 4 860. References (Must, Dallal and Dietz, 1991): underweight = < 5 percentile of BMI-for-age; overweight = > 85 percentile of BMI-for-age. Sources: NNS, 1993; 1998; 2003.
Trends in the nutritional status of adultsIn 2003, 12.3 percent of adults were affected by undernutrition (BMI < 18.5). Based on the WHO cut-off for a healthy adult population in which only 3 to 5 percent have BMI below 18.5 (WHO, 1995), adult undernutrition in the Philippines is a problem that needs to be addressed. On the other hand, 24 percent of adults are overweight or obese, with more females (27.3 percent) than males (20.9 percent) affected (overweight = BMI of 25 to 30; obese = BMI 30). Although progress in reducing underweight has been slow (about 10 percent over ten years), prevalence of BMI > 25 has been increasing steadily by 20 percent in each five-year interval from 1993 to 2003. The BMI distribution of the population has shifted slightly to the right over the past five years (Figure 10).
TABLE 15 Prevalence of underweight and overweight among adults, 1993 to 2003
Underweight Overweight/obese
1993 1998 2003 1993 1998 2003 Gender/age group
% Prevalence
Male
Female
Male and female
20–39 years
40–59 years
60 years and over
All
11.5
16.1
11.0
14.5
29.1
13.9
11.1
15.4
11.2
12.0
25.4
13.2
10.6
14.2
10.6
10.4
23.4
12.3
14.4
18.6
14.4
23.2
11.4
16.6
17.0
23.3
18.5
25.3
14.6
20.2
20.9
27.3
20.6
30.8
19.1
24.0
Sample sizes: 1993, 24 000 household members; 1998, 9 299; 2003, 11 696. References: Underweight/chronic energy deficiency (CED) = BMI < 18.5; overweight/obese = BMI 25. Sources: NNS, 1993; 1998; 2003.

Dietary changes and their health implications in the Philippines 228
FIGURE 10 Changes in distribution of adult BMI, 1998 to 2003
Using the BMI cut-off points recommended by the WHO expert consultation to determine public health and clinical action in relation to cardiovascular disease (CVD) (i.e., BMI 23 to 27.4 = moderate risk; BMI 27.5 = high to very high risk), the proportion of Philippine adults with moderate to very high risk of co-morbidities related to CVD reaches even more significant proportions than even the overweight or obesity figures imply (Table 16).
TABLE 16 Distribution of adults by cut-off points for determining risk of co-morbidities of CVD based on BMI
Age group (years) CED (< 18.5) Low risk (18.5 to < 23.0) Moderate risk (23.0 to < 27.4) High risk (> 27.5)
20–39 10.6 53.0 27.4 9.0
40–59 10.4 40.6 34.8 14.1
60 and over 23.6 43.7 24.2 8.5
All 12.4 47.4 29.5 10.7
Sample size: 2003, 11 696. Reference (WHO Expert Consultation, 2004): CED = BMI < 18.5; low risk = BMI 18.5 to < 23.0; moderate risk = BMI 23.0 to < 27.4; high risk = BMI > 27.5.Source: NNS, 2003.
The problem of overnutrition among adults is further highlighted when waist-to-hip ratio (WHR) and waist circumference (WC) are used. WC reflects intra-abdominal fat mass, while WHR is an index of abdominal fat distribution. Both are indicators of android obesity, which is a risk factor for CVD. The 2003 statistics reflect an overnutrition problem of public health concern, especially among female adults (Tables 17 and 18). Using WHR, android obesity affects one in every two women (54.8 percent) 20 years of age and over; this figure is 38.7 percent higher than the 1998 level. Using WC, android obesity in women increased even more rapidly, by 70 percent (from 10.7 to 18.3 percent) between 1998 and 2003.
0
5
10
15
20
25
30
35
40
10
to
<13
13
to
<16
16
to
<19
19
to
<22
22
to
<25
25
to
<28
28
to
<31
31
to
<34
34
to
<37
37
to
<40
40
to
<43
43
to
<46
46
to
<49
49
to
<52
52
to
<55
55
to
<58
BMI
Pe
rce
nt
1998 2003

Double burden of malnutrition in developing countries
229
TABLE 17 Trends in prevalence of high WHR among adults, 1998 and 2003
1998 2003 Gender Age group (years) % prevalence
20–29 6.0
30–39 3.0
11.7
40–49 15.1
50–59 12.8
18.8
60–69 20.8
70 + 6.8
13.7
Male
All 7.9 12.1
20–29 38.7
30–39 36.3
49.6
40–49 66.2
50–59 45.8
70.0
60–69 64.4
70 + 38.6
62.0
Female
All 39.5 54.8
Sample sizes: 1998, 9 299; 2003, 4 753. Reference: male, WHR > 1.0; female, WHR > 0.85. Sources: NNS, 1998; 2003.
TABLE 18 Trends in the prevalence of high WC among adults, 1998 and 2003
1998 2003 Gender Age group (years) % prevalence
20–29 2.1
30–39 1.7
2.7
40–49 4.5
50–59 5.1
4.9
60–69 3.3
70 + 1.8
1.0
Male
All 2.7 3.1
20–29 10.2
30–39 10.0
10.7
40–49 23.8
50–59 11.7
34.8
60–69 22.9
70 + 11.5
21.5
Female
All 10.7 18.3
Sample sizes: 1998, 9 299; 2003, 4 753. Reference: male, WC > 102 cm; female, WC > 88 cm. Sources: NNS, 1998; 2003.
Micronutrient status of population groups Trends in iron deficiency Anaemia among infants aged six months to less than one year increased alarmingly from 49.2 percent in 1993 to 66 percent in 2003. Although anaemia was not of public health magnitude among children aged one to five years when aggregated as a group, 53 percent of children aged 12 to 23 months were found to be anaemic in 2003. Pregnant women and

Dietary changes and their health implications in the Philippines 230
lactating mothers also had anaemia prevalence that was higher than the public health cut-off of 40 percent, a situation that did not change in the ten years from 1993 to 2003.
The unabated problem of anaemia among young children and pregnant and lactating women is partly attributed to continuing inadequate iron intakes. Low birth weight also contributes to the risk of anaemia during early childhood, because low-birth-weight infants are born with low iron stores, which consequently become depleted early. Philippine data in the State of the world’s children (UNICEF, 2003) placed the prevalence of low birth weight over the period 1998 to 2003 at 20 percent. Among pregnant and lactating women, dietary iron intakes are very low – 28.8 and 33.4 percent, respectively, of those recommended (NNS, 2003). The government is addressing iron deficiency anaemia (IDA) through an iron supplementation programme for pregnant women. However, as the trends show (Figure 11), this supplementation has not been successful because the iron supplements need to be taken daily and their distribution – when supplies are available – depends on pregnant women making regular visits to health centres.
FIGURE 11 Prevalence of anaemia by age/physiologic group, 1993 to 2003
Sample sizes: 6 months to < 1 year – 1993, 400; 1998, 2 790; 2003, 329; 1 to 5 years – 1993, 3 859, 1998, 12 089; 2003, 3 291; 6to 12 years – 1993, 2 135; 1998, 3 069; 2003, 4 647; pregnant – 1993, 782; 1998, 3 103; 2003, 586; lactating – 1993, 1 043; 1998, 3 260; 2003, 1 190. Reference (WHO): children 6 months to 6 years, 11.0g/dl; children 6.1 to 14 years, 12.0g/dl; pregnant women, 11.0 g/dl; lactating women, 12.0g/dl. Sources: NNS, 1993; 1998; 2003.
Trends in vitamin A deficiency As with anaemia, vitamin A deficiency (VAD) – defined as serum retinol (SR) < 20 g/dl – is a lingering public health problem that has been affecting more than the public health cut-off of 15 percent of children aged six to 59 months and pregnant and lactating women over the last ten years. The data on VAD from the 2003 NNS reveal that the prevalence among children aged six to 59 months increased from 35 percent in 1993 and 38 percent in 1998 to 40.1 percent. The proportion of children with severe VAD (SR < 10 g/dl) was 8.5 percent, which is not significantly different from the 8.2 percent of 1998. The prevalence of VAD among lactating women increased from 16.5 percent in 1998 to 20.1 percent in
42.2
49.2
25.7
42.043.6 43.0
56.6
29.6
35.6
50.7
45.7
65.9
29.1
37.4
43.9
0
10
20
30
40
50
60
70
6 mos - < 1 y 1 - 5 y 6 - 12 y Pregnant women Lactating women
Pe
rce
nt
1993 1998 2003

Double burden of malnutrition in developing countries
231
2003. Referring back to dietary data presented in the previous section, it is clear that the vitamin A intake of preschool children (Table 13) was inadequate. The poor micronutrient status of pregnant and lactating women also explains in part why the prevalence of VAD in young children remains high, in spite of an ongoing national programme of twice-yearly vitamin A supplementation, which was started in 1993.
FIGURE 12 Prevalence of VAD by age/physiologic group, 1993 to 1998
0
5
10
15
20
25
30
35
40
45
Six months
to five years
Pregnant
women
Lactating
women
Six months
to five years
Pregnant
women
Lactating
women
Deficient SR <10 ug/dL Deficient and low SR <20 ug/dL
Pe
rce
nt
1993
1998
2003
Sample sizes: 6 months to 5 years – 1993, 5 073; 1998, 14 291; pregnant – 1993, 765; 1998, 2 963; lactating – 1993, 1 051; 1999, 3 165. Reference: deficient = SR < 10 ug/dl; deficient and low = SR < 20 ug/dl. Sources: NNS, 1993, 1998.
Trends in iodine deficiency In 1998, iodine deficiency was recognized as a mildly severe public health problem based on International Council for Control of Iodine Deficiency Disorders (ICCIDD) epidemiological criteria (i.e., median urinary iodine excretion [UIE] of between 50 to 99
g/l among children aged six to 12 years). In that year, the median UIE level among Philippine children aged six to 12 years was 71 g/L, and 36 percent of them had levels of less than 50 g/l. In 2003, a significant improvement in the iodine status was noted. The median UIE among six- to 12-year-old children had increased to 201 g/l, and the proportion of children with UIE levels less than 50 g/l was down to 11 percent.
TABLE 19 Iodine status of selected population groups, 1998 and 2003
Median UIE ( g/l) Prevalence (%) of iodine deficiency
(UIE < 50 g/l) Group
1998 2003 1998 2003
6–12 years 71 201 35.8 11.0
Pregnant 142 18.0
Lactating 111 23.7
Sample sizes: 6 months to 12 years – 1998, 10 616; 2003, 4 665; pregnant – 2003, 583; lactating – 2003, 1 184. Reference: UIE < 50 ug/l. Sources: NNS, 1998; 2003.
Dietary changes and their health implications in the Philippines 232
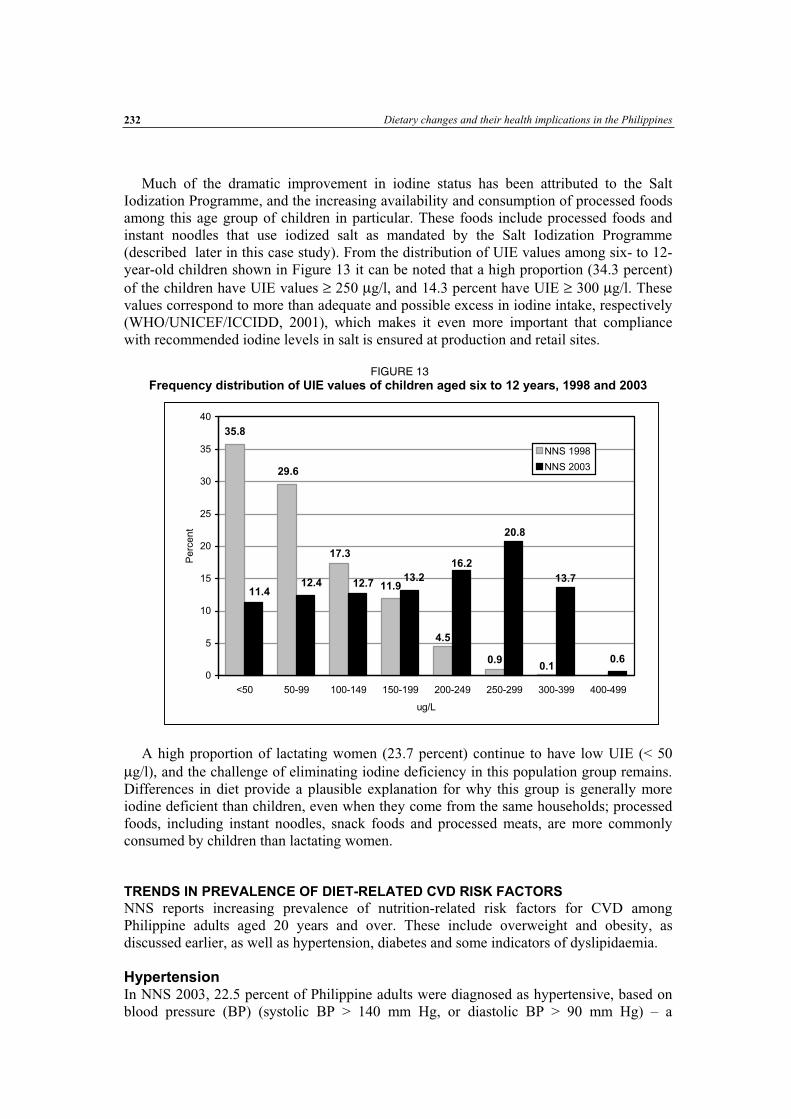
Much of the dramatic improvement in iodine status has been attributed to the Salt Iodization Programme, and the increasing availability and consumption of processed foods among this age group of children in particular. These foods include processed foods and instant noodles that use iodized salt as mandated by the Salt Iodization Programme (described later in this case study). From the distribution of UIE values among six- to 12-year-old children shown in Figure 13 it can be noted that a high proportion (34.3 percent) of the children have UIE values 250 g/l, and 14.3 percent have UIE 300 g/l. These values correspond to more than adequate and possible excess in iodine intake, respectively (WHO/UNICEF/ICCIDD, 2001), which makes it even more important that compliance with recommended iodine levels in salt is ensured at production and retail sites.
FIGURE 13 Frequency distribution of UIE values of children aged six to 12 years, 1998 and 2003
A high proportion of lactating women (23.7 percent) continue to have low UIE (< 50 g/l), and the challenge of eliminating iodine deficiency in this population group remains.
Differences in diet provide a plausible explanation for why this group is generally more iodine deficient than children, even when they come from the same households; processed foods, including instant noodles, snack foods and processed meats, are more commonly consumed by children than lactating women.
TRENDS IN PREVALENCE OF DIET-RELATED CVD RISK FACTORS
NNS reports increasing prevalence of nutrition-related risk factors for CVD among Philippine adults aged 20 years and over. These include overweight and obesity, as discussed earlier, as well as hypertension, diabetes and some indicators of dyslipidaemia.
Hypertension In NNS 2003, 22.5 percent of Philippine adults were diagnosed as hypertensive, based on blood pressure (BP) (systolic BP > 140 mm Hg, or diastolic BP > 90 mm Hg) – a
35.8
11.9
0.6
29.6
17.3
0.90.1
4.5
12.712.4 13.7
20.8
16.2
13.2
11.4
0
5
10
15
20
25
30
35
40
<50 50-99 100-149 150-199 200-249 250-299 300-399 400-499
ug/L
Pe
rce
nt
NNS 1998
NNS 2003

Double burden of malnutrition in developing countries
233
significant increase from the 21 percent of 1998. The figures among middle-aged and elderly adults were even higher, ranging from 26.4 percent among those aged 40 to 49 years, to 40.2 percent among those aged 50 to 59 years, 45.8 percent in the 60 to 69 years age group, and 56 percent among people aged 70 years and over.
TABLE 20 Trends in the prevalence of hypertension among adults aged 20 years and over, 1998 and 2003
1998 2003 Age group (years) % prevalence
20–29 8.8
30–39 11.3
14.1
40–49 26.4
50–59 29.0
40.2
60–69 45.8
70 + 44.3
56.0
All 21.0 22.5
Sample sizes: 1998, 9 299 ; 2003 – 20 to 39 years, 1402 ; 40 to 59 years, 1 021; 60 years, 2 330. Reference: systolic BP > 140 mm Hg; diastolic BP > 90 mm Hg. Source: NNS, 1998; 2003.
Dyslipidaemia The prevalence of hypercholesterolaemia among Philippine adults in 2003 was 8.5 percent, which is more than twice the rate of 4 percent in 1998. There was a significant increase in the prevalence of hypercholesterolaemia over this period, particularly among middle-aged and older adults, among whom the condition remained significantly more prevalent (at 10 to 20 percent and 15 percent, respectively) than it did in younger adults.
The prevalence of elevated LDL-cholesterol among Philippine adults in 2003 was 3.7 percent, which is significantly higher than (nearly double) the 1998 rate of 2 percent. Over the five-year period, the prevalence of elevated LDL-cholesterol increased significantly among middle-aged and elderly adults.
The increasing trend in hypercholesterolaemia and elevated LDL-cholesterol may be associated with increased consumption of animal-based foods, particularly meats and possibly fats and oils, as well as the decreasing fruit and vegetable consumption as discussed earlier. There is no evidence to suggest increases in the prevalence of low HDL-cholesterol (< 35 mg/dl), which was 3.5 percent in 2003. However, using the cut-off of < 40 mg/dl, 54.2 percent of Philippine adults in NNS 2003 had predisposition to low HDL. Low HDL is associated with low consumption of fruits and vegetables, low physical activity and smoking. In NNS 2003, 62 percent of Philippine adults reported being physically inactive, 35 percent were current smokers, and 10 percent were former smokers.

Dietary changes and their health implications in the Philippines 234
TABLE 21 Trends in dyslipidaemia among adults aged 20 years and over, 1998 and 2003
Elevated total cholesterol
1Elevated LDL-cholesterol
2Low HDL-
cholesterol3
Elevated triglycerides3
Age group (years)
1998 2003 1998 2003 2003 1998 2003
20–29 3.3 1.5 2.9 0.4
30–39 3.0
6.0 1.7
2.1 3.2 0.4
0.4
40–49 9.6 4.5 4.9 1.3
50–59 5.8
19.9 2.5
8.3 3.8 1.4
1.2
60–69 15.6 7.4 2.9 0.8
70 + 4.1
15.4 2.3
7.0 4.2 0.4
1.1
All 4.0 8.5 2.0 3.7 3.5 0.8 0.7
Sample sizes: 1998, 9 299; 2003 – 20 to 39 years, 1 402; 40 to 59 years, 1 021; 60 years, 2 330. 1 Elevated total cholesterol = 240 mg/dl. 2 Elevated LDL-cholesterol = > 190 mg/dl. 3 Low HDL-cholesterol = < 35 mg/dl. 4 Elevated triglycerides = 400 mg/dl. Source: NNS, 1998; 2003.
There is also no evidence of an increasing prevalence of elevated triglycerides that could be associated with the increasing consumption of fats and oils (most of which is coconut oil) in Philippine households. Overall, fewer than 1 percent (0.7 percent) of Philippine adults had elevated triglycerides, which was slightly lower than the 1998 rate (0.8 percent).
In a study on hypertension among Philippine adults, which used data from NNS 1998, Duante et al. (2001) identified triglyceride level as one of the significant risk factors for hypertension, but there was no attendant increase in triglycerides with the increased prevalence of hypertension between 1998 and 2003. However, disaggregating the data by age group reveals increasing prevalence of elevated triglycerides among the elderly, rising from only 0.4 percent in 1998 to 0.8 percent among 60- to 69-year-olds and 1.1 percent among those aged 70 years and over in 2003. These groups also had the highest prevalence of hypertension.
Diabetes The Philippine data show no evidence of a trend towards increasing prevalence of diabetes mellitus; this is surprising given that obesity increased significantly. The proportion of Philippine adults with diabetes mellitus was 3.9 percent in 1998, and 3.4 percent in 2003. However, the proportion of Philippine adults with impaired fasting blood glucose (FBG) – a prediabetic condition that increases the risk of diabetes – rose from 2.5 percent in 1998 to 3.2 percent in 2003 (FBS = 100 – 125 mg/dl).

Double burden of malnutrition in developing countries
235
TABLE 22 Trends in the prevalence of impaired FBG and diabetes mellitus among adults aged 20 years and over, 1998 and 2003
1998 2003
% prevalence Age group (years)
Impaired FBG1 Diabetes mellitus Impaired FBG
2Diabetes mellitus
20–29 1.2 0.7
30–39 1.9 2.6
2.1 2.0
40–49 5.0 4.9
50–59 3.1 5.4
5.7 8.9
60–69 5.6 6.3
70 + 3.2 6.2
6.2 5.1
All 2.5 3.9 3.2 3.4
Sample sizes: 1998, 9 299; 2003 – 20 to 39 years, 1 402; 40 to 59 years, 1 021; 60 years, 2 330. Diabetes mellitus = FBS 126 mg/dl. 1 FBS = 110 – 125 mg/dl. 2 FBS = 100 – 125 mg/dl. Source: NNS, 1998; 2003.
TRENDS IN MORTALITY FROM ALL CAUSES
Over the last 30 years, mortality from infections (including pneumonias, tuberculosis and bronchitis), other infectious diseases (such as gastroenteritis and colitis, diarrhoea and measles), tetanus, avitaminosis and other nutritional deficiencies has been declining significantly. In 1970, the reported deaths from pneumonia were 118 per 100 000 population, which dropped to 42.7 per 100 000 in 2000. Pneumonia was the leading cause of death in the Philippines in 1970 and until about 1985. Tuberculosis and other infectious diseases were the second and third leading causes of death, with 80 and 63 deaths per 100 000, respectively, in 1970; deaths due to all forms of tuberculosis were down to 36 per 100 000 by 2000. Meanwhile, the pattern regarding deaths from NCDs, such as diseases of the heart (including coronary artery disease and heart failure), diseases of the vascular system (e.g. strokes) and various cancers, has exhibited a significantly increasing trend in the last 30 years. This trend may be associated with changes in food consumption over the past 25 years, including increasing energy density with greater proportions of fat in total energy, and declining intakes of fruits, vegetables and traditional foods. It is also associated with the high prevalence of smoking. NNS 2003 revealed that 35 percent of Philippine adults were current, and 10 percent former, smokers. Diseases of the heart overtook other infectious diseases to become the third leading cause of death by 1975; they overtook tuberculosis as the second leading cause of death by 1980, and pneumonia as the number one cause of death by 1990. In 2000, diseases of the heart (at 79 deaths per 100 000 population), diseases of the vascular system (63 deaths) and various cancers (48 deaths) ranked first, second and fourth, respectively, as leading causes of deaths in the Philippines. Environment and other lifestyle-related diseases (including chronic obstructive pulmonary diseases, other respiratory diseases and diabetes) have emerged as a leading cause of mortality since 1995, and ranked as the third leading cause of death in 2000.

Dietary changes and their health implications in the Philippines 236
FIGURE 14 Mortality trends by cause of death, 1970 to 2000
0
50100150200250
300350400450
Dea
ths
/ 100
000
1970 1975 1980 1985 1990 1995 2000
Infectious diseases Environment and other lifestyle-related diseases
Diseases of the heart Diseases of the vascular system
Cancers Nephritis, nephrotic syndrome, nephrosis
Others
NATIONAL NUTRITION POLICIES, STRATEGIES AND PROGRAMMES The Philippines’ nutrition policies, strategies and programmes are reflected in the Medium-Term Philippine Plan of Action for Nutrition (MTPPAN), which is formulated every five to six years by the National Nutrition Council (NNC), whose members include representations from various government agencies (e.g., the Departments of Health, Agriculture, Education, Social Welfare, Science and Technology, Interior and Local Government, and Budget and Management) and non-governmental organizations (NGOs). The MTPPAN is the government’s blueprint for action to address the nutrition problems identified from NNS. The MTPPAN for 2005 to 2010 specifically aims to reduce underweight among children aged 0 to five years to levels based on the MDG target of 17.2 percent by 2015. This calls for accelerating the reduction rate of child undernutrition from the 0.58 percentage points a year (ppy) of 1998 to 2003, to no less than 0.81 ppy for 2005 to 2010 (NNC, 2005). The 2005 to 2010 MTPPAN also aims to reduce stunting and micronutrient deficiencies, particularly nutritional anaemia and VAD, among this group of children. Its other aims include reducing the following: underweight and stunting among children aged six to ten years; low birth weight; chronic energy deficiency among pregnant women; and micronutrient deficiencies among children aged six to 12 years and pregnant women. Targets are based on the reduction rates that were achieved in previous periods, or on the minimum prevalence for public health significance (e.g., 15 percent for VAD and 20 percent for iodine deficiency).
With regard to NCDs, the 2005 to 2010 MTPPAN will contribute to the achievement of targets that were identified by the National Coalition on the Prevention and Control of Non-Communicable Diseases, including reducing by 30 percent the prevalence of smoking, physical inactivity, hypertension, high FBG, obesity and total cholesterol among adults, and increasing the per capita intake of vegetables (NNC, 2005).
Sources: PHS, 1970; 1975; 1980; 1985; 1990; 1995; 2000.

Double burden of malnutrition in developing countries
237
A E 23 MTPPAN targets for 2005 to 2010
2005 2010
Estimated
% reduction1
Prevalence of underweight among children 0 5 years old 25 88 21 58 1 2
Prevalence of underweight among children 10 years old 25 54 22 4 11 4
Prevalence of stunting among children 0 5 years old 28 9 25 3 12 4
Prevalence of stunting among children 10 years old 34 78 30 48 12 4
Prevalence of chronic energy deficiency among pregnant women 24 9 20 8 1 4
Prevalence of IDA among infants 59 20 41 70 29
Prevalence of IDA among children 1 5 years old 25 10 15 10 39 8
Prevalence of IDA among children 12 years old 34 00 25 50 25 0
Prevalence of IDA among pregnant women 43 30 42 10 2 8
Prevalence of VAD among children months to 5 years old 32 90 15 00 54 7
Prevalence of VAD among pregnant women 15 2 10 92 30 1
Prevalence of VAD among lactating women 18 4 15 00 19 5
Prevalence of iodine deficiency among lactating women 22 4 20 00 11 7
Prevalence of current smoking among adult males 49 5 34 7 30%
Prevalence of current smoking among adolescent females 10 7 5 30%
Per capita total vegetable intake (g/day) 123 2 1 0 2
Prevalence of hypertension among adult males 19 8 13 9 30%
Prevalence of adults with high F G 3 0 2 1 30%
Prevalence of central obesity (WHR) among females 48 2 33 8 30%
Prevalence of high total serum cholesterol among adult males 7 5 5 2 30% 1 Computed by subtracting the 2010 target from the 2005 estimated baseline, and dividing by the 2005 estimated baseline.
In spite of its apparently uneven targets for under- and overnutrition, the 2005 to 2010 MTPPAN clearly recognizes and addresses undernutrition as a public health problem among children, and pregnant and lactating women; it also recognizes and addresses nutritional factors associated with overnutrition and risks of NCDs among adults. This can be inferred from the plan’s adoption of the life cycle approach, which recognizes that intergenerational consequences of undernutrition start from poor nutrition during pre-pregnancy and adolescence, and include the contribution of foetal undernutrition to adult chronic diseases (Aggett and Schofield, 2000).
The MTPPAN promotes the programmes described in the following paragraphs. Each of these programmes has the potential to address the double burden or coexistence of under- and overnutrition in households and communities, whether implicitly as in the case of micronutrient supplementation and food fortification, or explicitly as with home and community food production and nutrition education.
Home, school and community food production This programme involves kitchen gardens and small animal raising activities to increase the supply of inexpensive, nutrient-rich sources of energy, protein, vitamin A and iron, as well as dietary fibre, in households. It has the potential to increase home and community production of fresh fruits and vegetables, which can improve the quality of diets for both under- and overweight individuals, while increasing intakes of essential micronutrients (Hawkes et al., 2005). The MTPPAN document makes explicit reference to the role of home and community gardens in increasing the intakes of essential micronutrients and dietary fibre, thereby addressing both undernutrition and the nutrition-related risk factors for CVD, hypercholesterolaemia, elevated LDL-cholesterol levels and certain cancers.

Dietary changes and their health implications in the Philippines 238
Nutrition education This programme aims to promote desirable food, health and nutrition practices and lifestyle behaviours to ensure nutritional well-being, and addresses both under- and overnutrition. The intervention uses the Nutritional Guidelines for the Philippines (see Annex 4) as its framework, and follows the life cycle approach by targeting preschool children, schoolchildren, pre-adolescents, teenagers, pregnant and lactating women, and mothers and care providers. Promotion of the Nutritional Guidelines for the Philippines aims to address undernutrition by emphasizing the importance of exclusive breastfeeding, appropriate complementary feeding, consumption of a variety of foods, growth monitoring, and positive health-seeking behaviours. It also aims to address overweight and obesity and other diet and lifestyle factors associated with NCDs by, for example, limiting the consumption of fatty and salty foods, sugars and alcoholic beverages, increasing physical activity and avoiding smoking.
In addition, there are ongoing efforts to incorporate modules into the curricula of public and private schools; these are designed to increase physical activity and healthy lifestyles among schoolchildren. The National Coalition on the Prevention and Control of Non-Communicable Diseases and the Department of Health are carrying out other initiatives, including campaigns for healthy lifestyle in the workplace, communities and restaurants.
Food fortification To address the persistent problem of micronutrient deficiencies, the Philippines has enacted two laws on food fortification to ensure adequate intakes of vitamin A, iron and iodine among all sectors of the population. These laws include the mandatory fortification of staples such as rice with iron, sugar and cooking oil with vitamin A, and wheat flour with iron and vitamin A, which were introduced in 2000, and the iodization of salt, which was introduced in 1995. The programme also promotes voluntary micronutrient fortification of other processed foods. Under this scheme, the Department of Health awards a Sangkap Pinoy Seal of approval, which the manufacturer puts on to the food label indicating that the food contains the recommended amount and type of fortification. Currently, 142 processed foods on the market carry the Sangkap Pinoy Seal.
However, there has been resistance to the law on mandatory fortification of rice, sugar and cooking oil on the part of manufacturers who object to having to bear the additional costs involved. Legislative consultations with various interest groups, including manufacturers and the public, are being carried out to identify how best to address the concerns of both groups.
Micronutrient supplementation Similar to food fortification, the micronutrient supplementation programme aims to reduce micronutrient deficiencies. This programme includes universal vitamin A supplementation for all children six months to six years of age and for lactating women, and targeted supplementation to selected populations, particularly iron for infants and young children, pregnant and lactating women and adolescent females, and iodine for schoolchildren and women of child-bearing age in high-risk areas.
Between 1999 and 2003, the vitamin A supplementation programme reached 23 726 215 children, or 92.8 percent of those in the target 12 to 83 months age group, and 3 503 315 or 73.9 percent of nursing women. Over the same period, iron supplementation was provided to 12 979 689 (85.7 percent) pregnant and lactating women, 3 097 116 (80.3 percent) preschool-age children, 1 577 618 (73.3 percent) infants and 3 367 795 (83.2 percent) schoolchildren through the local health system (NNC, 2005). The outreach for

Double burden of malnutrition in developing countries
239
iodine supplementation has been far lower, covering 56.2 percent of targeted women and 74.4 percent of targeted schoolchildren.
Clearly, the country’s nutrient supplementation and food fortification programmes, except perhaps salt iodization, have not yet had the desired impact on the micronutrient status of target population groups. The iron supplementation programme has been beset with funding problems and inadequate supplies of iron supplements. The current six-monthly dosing schedule for the universal vitamin A supplementation programme, which started in 1993, may be inadequate for areas with high prevalence of VAD (Pedro et al.,2005; Perlas et al., 1996). It is not clear how the target 55 percent reduction of VAD in children can be achieved through universal six-monthly vitamin A supplementation alone.
Food assistance This programme serves as a short-term, stop-gap measure to rehabilitate undernourished
populations, particularly preschool children, immediately and to prevent undernutrition in areas affected by calamities or emergency situations during the critical periods of complementary feeding for children aged six to 24 months and among women in the second trimester of pregnancy. Food assistance also includes the provision of basic food commodities at subsidized prices to poor households in nutritionally and economically depressed communities, as a contribution to the government’s poverty alleviation programme. Also being tested are food-for-work and food-for-school schemes, which entail the provision of basic nutritional food commodities to poor households (NNC, 2005).
Other programmes in the 2005 to 2010 MTPPAN are livelihood assistance; the integration of nutrition concerns into mother-and-child health programmes, including newborn screening, infant and young child feeding, integrated management of childhood illnesses, adolescent health and early childhood care and development; and the provision of safe and potable water supply and environmental sanitation (NNC, 2005).
CONCLUSION
The dietary changes that have occurred in Philippine households in the last 25 years are reflections of the increasing urbanization of the country. Urbanization increased from 37 percent in 1980 to 60 percent in 2000. Urban diets have been associated with increasingly Westernized food habits, such as high-fat diets, processed foods and refined carbohydrates. Data from the Philippines exhibit a pattern of increasing intakes of fats and oils, sugars and syrups, meats and processed meat products, and other cereals and cereal products (including breads and bakery products, noodles, and snack foods made from wheat flour), and declining fruit and vegetable consumption. It is likely that these trends will continue given the escalating urbanization of the Philippine population (the urban proportion is expected to reach 68 percent by 2015), coupled with the effects of increasing globalization such as trade liberalization, which has increased the availability and variety of processed and fast foods, the frequency of eating outside the home, the use of computers and computer games, and the influence of mass media.
Based on national data, the food intake in Philippine households in 2003 represents general improvements in quality and quantity, except with regard to declining fruit and vegetable consumption. The improvements have been in the direction of dietary goals and Philippine nutritional guidelines, including increasing the intakes of animal foods (“to increase good quality proteins and absorbable iron to satisfy nutritional requirements”) and fats and oils (“as a remedy to caloric deficiency and to help lower the risk of vitamin A deficiency by facilitating its absorption and utilization”). In terms of the Philippines’

Dietary changes and their health implications in the Philippines 240
progress in achieving the MDGs, in 2003 fewer households had less than 100 percent per capita energy adequacy than in 1993. However, the improvement falls short of the rate necessary to meet the target. In spite of increased consumption of the food sources of iron, calcium and riboflavin, as demonstrated by increasing intake of animal source foods – including meats and dairy – these nutrients remain inadequate.
While the increased intake of animal foods and fats and oils was generally an improvement, there may be a trade-off in terms of increased cholesterol and saturated fats in diets, and increased overweight in children, adolescents and adults when coupled with sedentary lifestyles. Although the data show no evidence of increasing prevalence of low HDL-cholesterol and elevated triglycerides, the trend towards increasing obesity, hypercholesterolaemia and elevated LDL-cholesterol, which are known risk factors for CVD, is alarming. There has been increasing mortality from diseases of the heart and vascular system, which in the last ten years have become the top two leading causes of death in the country. While consumption of animal foods and fats and oils, prevalence of obesity, hypercholesterolaemia and elevated LDL-cholesterol, and mortality from CVD and other NCDs are moving in the same direction, the consumption of fruits and vegetables and other traditional staples such as maize and root crops has steadily declined over time. Among the reasons cited for the low intake of fruits and vegetables are cost or affordability and the declining production of fruits and vegetables, including indigenous produce, for local markets. This trend has been associated with policies on trade liberalization and globalization. It should not be discounted that other lifestyle-related factors, particularly physical inactivity and lack of exercise, stress, smoking and alcohol consumption – which are also known risk factors for obesity, hypertension, CVD and other chronic degenerative diseases – have contributed significantly to the increasing incidence of these lifestyle diseases.
“Unhealthy” or “faulty” diets, i.e., those characterized by high fat, refined carbohydrates and meat, are more likely to occur in certain sectors of the population than others: more among urban than rural dwellers, and more among higher-income than lower-income groups, even within urban areas. “Unhealthy” diets at the other end of the spectrum (i.e., those that are inadequate in energy, protein and many essential nutrients) are more common among lower-income groups. The available data on food consumption and nutritional status show national or regional estimates, and should therefore be disaggregated to ascertain disparities in the dietary patterns and malnutrition across income groups (although these are probably decreasing considering the declining income inequality as measured by the Gini ratio), as well as across age groups.
Although there has been progress in addressing undernutrition in the Philippines, it is still a problem of far greater magnitude than overnutrition is, especially among children. Out of every 100 children aged 0 to five years, 27 are underweight-for-age, 30 are stunted, more than 30 are anaemic, 40 are vitamin-A deficient, and only one is overweight. Out of every 100 children aged six to ten years, 27 are underweight, 37 are stunted, 37 are anaemic, 11 are iodine deficient, and again only one is overweight. The burden of undernutrition is also greater among 11- to 12-year-olds and 13- to 19-year-olds, with six underweight to every one overweight in the former, and four underweight to every one overweight in the latter age group. Among adults, on the other hand, there are twice as many cases of overweight as underweight.
There are indications that the country is facing a double burden of malnutrition, as evidenced by the coexistence at the population level of undernutrition among children and the elderly with overnutrition among adults. The malnutrition double burden within households, e.g., an underweight child and an overweight mother, is also reported to be

Double burden of malnutrition in developing countries
241
emerging, with prevalence of 8.2 percent in one poor urban community, rising to about 20 percent in a high-income urban community (Agdeppa, Laña and Barba, 2003). There is increasing scientific evidence to support Barker’s hypothesis that chronic diseases such as CVD, type-2 diabetes and hypertension in later life may have their origins in foetal cardiovascular, metabolic and endocrine adaptation to intrauterine growth retardation (Aggett and Schofield, 2000). The prevalence of low birth weight was estimated to be about 9 to 11 percent in the 1990 to 1997 period, rising to about 18 percent in 1995 to 2000 (UNICEF 2000; 2002; de Onis, Blössner and Villar, 1998). Based on this hypothesis, the increasing prevalence of non-communicable or chronic degenerative diseases may be associated with maternal and foetal undernutrition, rather than dietary and lifestyle changes alone. Thus, addressing undernutrition from early life, including pre-pregnancy and maternal undernutrition, will contribute to reducing NCDs in the Philippines. Overnutrition increases with age, so programmes aimed at preventing overweight/obesity and NCDs in later life should start with children, particularly by increasing physical activity and exercise.
The life cycle approach calls for integrated, rather than distinct, intervention programmes that address under- and overnutrition in both communities and households by, for example, increasing fruit and vegetable production and consumption, encouraging the consumption of dried beans, nuts and seeds, marine products and lean meats, and promoting increased physical activity and exercise in children and adults.
Dietary changes and their health implications in the Philippines 242
REFERENCES Agdeppa, I.A., Laña, R.D. & Barba, C.V.C. 2003. A case study on dual forms of malnutrition among selected households in District 1, Tondo, Manila. Asia Pacific J. Clin. Nutr., 12(4): 438–446. Aggett, P.J. & Schofield, L. 2000. Early nutrition and adult health: how strong are the links? Mal. J. Nutr.,6(2): 181–187. Cerdeña, C.M., Laña, R.D., Molano, W.L., Chavez, M.C. & Nones, C.A. 2002. Philippine Nutrition Facts and Figures Supplement 1: 2002 Update of the Nutritional Status of 0–10-year-old Filipino Children.Manila, FNRI-DOST. Cheong Revelita, Madriaga, J.R., Perlas, L.A., Desnacido, J.A., Marcos, J.M. & Cabrera, M.I.Z. 2001. Prevalence of anemia among Filipinos. Philippine Journal of Nutrition, 48(1–2): 45–57. De Onis, M., Blössner, M. & Villar, J. 1998. Levels and patterns of intrauterine growth retardation in developing countries. European J. of Clinical Nutrition, 52(S1): S5–S15. Department of Health. No date. Field Health Service Information System (FHSIS). Department of Health. No date. Health statistics. Available at www.doh.gov.ph. Duante, C.A., Velandra, F.V., Orense, C.L. & Tangco, J.B.M. 2001. Correlates of hypertension and android obesity among Filipino adults. Philippine Journal of Nutrition, 48(1–2): 81–102. FAO. 2003. The state of world food insecurity. Rome. Florentino, R.F., Pedro, M.R.A. & Molano, W.L. 1996.The changing dietary intake and food consumption patterns in the Philippines. In Changing dietary intake and food consumption in Asia and the Pacific. Tokyo, Asian Productivity Organization. FNRI-DOST. 1976. Recommended dietary allowance (RDA) for Philippines. Manila. FNRI-DOST. 1989. Recommended dietary allowance (RDA) for Philippines. Manila. FNRI-DOST. 2000. Nutritional guidelines for Philippines. Manila. FNRI-DOST. 2001. Philippine nutrition facts and figures. Manila. FNRI-DOST. 2002a. Baseline survey and data generation on nutritional status, psychosocial development and care of 0–6 year-old children in ECD provinces (final report). Manila. FNRI-DOST. 2002b. Recommended energy and nutrient intakes (RENI). Manila. Hawkes, C., Eckhardt, C., Ruel, M. & Minot, N. 2005. Diet quality, poverty and food policy: A new research agenda for obesity prevention in developing countries. SCN News, 29: 20–22. Kuizon, M.D., Perlas, L.A., Madriaga, J.R., Cheong, R.L., Desnacido, J.A., Marcos, J.M., Fuertes, R.T. & Valdez, D.H. 1993. Fourth National Nutrition Survey: Philippines, 1993. Part D. Biochemical Nutrition Survey. Manila, FNRI-DOST. Madriaga, J.R., Cheong Revelita, Desnacido, J.A., Marcos, J.M., Cabrera, M.I.Z. & Perlas, L.A. 2001. Prevalence of vitamin A deficiency among specific Filipino population groups. Philippine Journal of Nutrition, 48(1–2): 29–43. Madriaga, J.R., Cheong Revelita, Desnacido, J.A., Marcos, J.M., Loyola, A.S., Sison, C.C. & Cabrera, M.I.Z. 2001. Prevalence of iodine deficiency in the Philippines. Philippine Journal of Nutrition, 48(1–2): 59–68. Magbitang, J.A., Tangco, J.B.M., Dela Cruz, E.O., Flores, E.G. & Guanlao, F.E. 1988. Weight for height as measure of nutritional status in Filipino pregnant women. Public Health Asia Pacific Journal, 2(2): 96–104. Must, A., Dallal, G.E. & Dietz, W.H. 1991. Reference data for obesity: 85th and 96th percentiles of body mass index (wt/ht2) – a correction. American Journal of Clinical Nutrition, 53: 839–846. National Statistical Coordination Board. No date. Poverty statistics. Available at: www.nscb.gov.ph. National Statistics Office. 2003. Philippine National Demographic and Health Survey. Manila. NEDA. 2005. Medium Term Philippines Development Plan 2005–2010 (draft). Manila, National Economic Development Authority (NEDA). NNC. The Medium-Term Philippine Plan of Action for Nutrition 2005 to 2010. Manila. (draft) Pedro, M.R.A., Barba, C.V.C. & Candelaria, L.V. No date. Globalization, food consumption, health and nutrition in urban areas. Manila, FNRI-DOST. Pedro, M.R.A., Madriaga, J.R., Barba, C.V.C., Habito, R.F.C., Gana, A.E., Deitchler, M. & Mason, J.B. 2004. The national vitamin A supplementation and sub-clinical vitamin A deficiency among preschool children in the Philippines. Food and Nutrition Bulletin, 25(4): 319–329. Pedro, M.R.A., Cerdeña, C.M., Constantino, M.A.S., Patalen, M.L.P., Palafox, E.F., Delos Reyes, C.M., Castillo, E.V., De Leon, J.Y. & Barba, C.V.C. 2005. Sixth National Nutrition Survey: Philippines, 2003. National Food Consumption Survey: Household Level. Manila, FNRI-DOST. Pedro, M.R.A., Cerdeña, C.M., Patalen, M.L.P., Nones, C.A., Vargas, M.B., Laña, R.D., Castillo, E.V. & Barba, C.V.C. 2005. Sixth National Nutrition Survey: Philippines, 2003. Update on the Nutritional Status of Filipinos. Manila, FNRI-DOST.

Double burden of malnutrition in developing countries
243
Perlas, L.A., Florentino, R.F., Fuertes, R.T., Cheong Revelita, Madriaga, J.R., Desnacido, J.A., Marcos, J.M. & Cabrera, M.I.Z. 1996. Vitamin A status of Filipino preschool children given a massive oral dose. Southeast Asian Journal of Tropical Medicine, 27(4): 785–791. Perlas, L.A., Madriaga JR, Cheong Revelita, Marcos, J.M., Desnacido, J.A., Perez, E.S., Ulanday, J.R.C., Sumayao Jr., R.E., Cabrera, M.I.Z. & Barba, C.V.C. 2005. Sixth National Nutrition Survey: Philippines, 2003. Biochemical Phase. Manila, FNRI-DOST. Popkin, B. 1994. The nutrition transition in low-income countries: an emerging crisis. Nutrition Reviews, 52(9). Population Commission. 2002. APPC Country Report, pp. 27–32. Available at www.popcom.gov.ph. Reyes, C.M. 2003. Country development programming framework for the Philippines: assessment of the social sector. (unpublished paper) Shetty, P. & Gopalan, C., eds. 1998. Diet, nutrition and chronic disease: an Asian perspective. London, Smith-Gordon and Co. Templo, O.M. 2003. Country development programming framework for the Philippines: Philippine development context and challenges. (unpublished paper) UNDP. 2004. Human development report 2004. New York. UNICEF. 2000. The state of the world’s children 2000. New York. UNICEF. 2002. Official summary: The state of the world’s children 2002. New York. UNICEF. 2003. The state of the world’s children 2003. New York. UN Population Division. 2004. World population prospects: The 2004 revision and world urbanization prospects. New York, Department of Economic and Social Affairs of the United Nations Secretariat. USDA. No date. Nutrient Data Laboratory. Available at: www.nal.usda.gov/fnic/foodcomp/search/. Velandria, F.V., Duante, C.A., Mendoza, T.S., Mendoza, S.M. & Dela Cruz, E.O. 2001. Prevalence of android obesity among Filipino adults, 20 years and over. Philippine Journal of Nutrition, 48(1–2): 69–80. Villavieja, G.M., Valerio, T.E., Abaya, H.S.P., Angelo, T.N., Cerdeña, C.M. & Domdom, A.C. 1981. First Nationwide Nutrition Survey: Philippines, 1978. Part A – Food Consumption Survey, 2nd revision. Manila, FNRI, National Science Development Board. Villavieja, G.M., Valerio, T.E., Abaya, H.S.P., Cerdeña, C.M. & Domdom, A.C. 1984. Second Nationwide Nutrition Survey: Philippines, 1982. Part A – Food Consumption Survey. Manila, FNRI, National Science and Technology Authority. Villavieja, G.M., Cerdeña, C.M. & Chavez, M.C. 1985. Dietary assessment of infants and toddlers in the Philippines. Manila, FNRI, National Science and Technology Authority. Villavieja, G.M., Valerio, T.E., Cerdeña, C.M., Abaya, H.S.P., Feliciano, E.A., Boquecosa, J.P., Red, E.R., Nones, C.A. & Constantino, A.S. 1989. Third National Nutrition Survey: Philippines, 1987. Part A – Food Consumption Survey. Manila, FNRI-DOST. Villavieja, G.M., Cerdeña, C.M., Molano, W.L., Laña, R.D., Boquecosa, J.P., Raymundo, B.E., Nones, C.A., Abaya, H.S.P., Palafox, E.F., Chavez, M.C., Burayag, G.A., Pine, C.R., Recuenco, J.R.D., Saturno, D.S. & Delos Reyes, C.M. 1997. Fourth National Nutrition Survey: Philippines, 1993. Part A- Food Consumption Survey. Manila, FNRI-DOST. Villavieja, G.M., Molano, W.L., Cerdeña, C.M., Laña, R.D., Constantino, A.S., Tarrayo, M.E.R., Concepcion, D.S., Juguan, J.A. & Sario, I.S. 1997. Fourth National Nutrition Survey, Philippines, 1993. Part B Anthropometric Survey. Philippine Journal of Nutrition, 44(1–2): 34–48. Villavieja, G.M., Laña, R.D., Cerdeña, C.M., Constantino, A.S., Boquecosa, J.P., Chavez, M.C., Palafox, E.F., Nones, C.A., Concepcion, D.S., Tarrayo, M.E.R. & Casio, M.B. 1998. Updating of Nutritional Status of Filipino Children at the Provincial Level. Philippine Journal of Nutrition,48(1–2): 1–14. Villavieja, G.M., Constantino, A.S., Laña, R.D., Nones, C.A., Nueva España, M.B. & Pine, C.R. 2001. Anthropometric assessment of adolescents, adults, pregnant and lactating women: Philippines, 1998. Philippine Journal of Nutrition, 48(1–2): 15–28. WHO. 1995. Physical status: the use and interpretation of anthropometry. Report of a WHO Expert Committee. WHO Technical Report Series No. 854. Geneva. WHO/FAO. 2003. Diet, nutrition and the prevention of chronic diseases. Report of a Joint WHO/FAO Expert Consultation. WHO Technical Report Series No. 916. Geneva. WHO/UNICEF/ICCIDD. 2001. Assessment of iodine deficiency disorders and monitoring their elimination. Geneva. (WHO/NHD/01.1).

Dietary changes and their health implications in the Philippines 244
ANNEX 1: PHILIPPINE RDAs, 1976
Weight Energy Protein Calcium Iron Vitamin
AVitamin
B12 Thiamine Ribo-flavin Niacin
Vitamin C
Age group
kg kcal g g mg RE IU mg mg mg mg
Males
20 39 years 5 2 580 3 0 5 10 50 4 500 1 3 1 3 17 75
40 49 years 5 2 450 3 0 5 10 50 4 500 1 2 1 2 1 75
50 59 years 5 2 320 3 0 5 10 50 4 500 1 2 1 2 15 75
0 9 years 5 2 0 0 3 0 5 10 50 4 500 1 0 1 0 14 75
70 years 5 1 810 3 0 5 10 50 4 500 0 9 0 9 13 75
Females
20 39 years 48 1 920 54 0 5 18* 550 3 800 1 0 1 0 13 70
40 49 years 48 1 820 54 0 5 18* 550 3 800 0 9 0 9 13 70
50 59 years 48 1 730 54 0 5 8 550 3 800 0 9 0 9 13 70
0 9 years 48 1 540 54 0 5 8 550 3 800 0 8 0 8 13 70
70 years 48 1 340 54 0 5 8 550 3 800 0 7 0 7 13 70
Infants, 6–11 months 9 970 25 0 9 250 1 800 0 5 0 5 30
Children
1 3 years 13 1 310 2 0 5 250 1 800 0 7 0 7 9 35
4 years 18 1 40 32 0 5 8 325 2 300 0 8 0 8 11 45
7 9 years 24 1 870 37 0 5 7 400 2 800 0 9 0 9 12 55
Boys
10 12 years 32 2 270 43 0 7 11 500 3 500 1 1 1 1 15 5
13 15 years 44 2 510 59 0 7 12 550 4 300 1 3 1 3 17 75
1 19 years 55 2 700 7 0 13 50 4 500 1 4 1 4 18 90
Girls
10 12 years 35 2 170 48 0 7 18* 500 3 500 1 1 1 1 14 70
13 15 years 44 2 200 59 0 7 18* 550 4 300 1 1 1 1 15 75
1 19 years 48 2 0 0 59 0 18* 550 4 300 1 0 1 0 14 80
Double burden of malnutrition in developing countries
245
Age group Weight
kg
Energy
kcal
Protein
g
Calcium
g
Iron
mg
Vitamin A
RE
Vitamin
B12
IU
Thiamine
mg
Ribo-flavin
mg
Niacin
mg
Vitamin C
mg
Pregnant, 2nd and 3rd trimesters
13 15 years 2 30 73 1 0 18 25 4 300 1 5 1 5 18 120
1 19 years 2 490 73 1 0 18 25 4 300 1 4 1 4 17 120
20 39 years 2 350 8 1 0 18 575 4 000 1 4 1 4 1 120
40 49 years 2 250 8 1 0 18 575 4 000 1 3 1 3 1 120
Nursing, 1st 6 months
13 15 years 2 750 87 1 0 18 975 800 1 4 1 7 19 120
1 19 years 2 10 87 1 0 18 975 800 1 3 1 18 120
20 39 years 2 470 82 1 0 18 975 800 1 3 1 17 120
40 49 years 2 370 82 1 0 18 975 800 1 2 1 5 17 120
Nursing, next 6 months
13 15 years 2 40 75 1 0 18 800 5 00 1 4 1 5 18 120
1 19 years 2 500 75 1 0 18 800 5 00 1 3 1 4 17 120
20 39 years 2 3 0 70 1 0 18 800 5 00 1 3 1 4 1 120
40 49 years 2 2 0 70 1 0 18 800 5 00 1 2 1 3 1 120
Per capita/day
1 2 016 50 0.6 12 520 3 612 1.0 1.0 14 67
* It is preferable that these amounts be higher than indicated Supplemental iron is recommended during pregnancy,1 ased on 1977 population structure (low assumption)

Dietary changes and their health implications in the Philippines 246
ANNEX 2: PHILIPPINE RDAs, 1989
Age group
Weight
kg
Energy
kcal
Protein
g
Vitamin A
ug
Vitamin C
mg
Thiamine
mg
Ribo-flavin
mg
Niacin
mg
Folate
ug
Calcium
g
Iron
mg
Iodine
mg
Infants
3 < months 20 a 325 30 0 3 0 3 5 20 300 10 40
< 12 months 9 880 14 325 30 0 4 0 4 8 30 400 15 50
Children
1 3 years 13 1 350 27 350 35 0 7 0 7 13 40 00 9 55
4 years 18 1 00 32 375 45 0 8 0 8 15 0 00 10 5
7 9 years 24 1 740 35 400 55 0 9 0 9 17 80 00 12 70
Males
10 12 years 32 2 090 45 425 5 1 1 20 100 700 1 85
13 15 years 44 2 340 0 475 75 1 2 1 2 22 140 700 18 105
1 19 years 55 2 580 9 525 90 1 3 1 3 25 170 700 17 120
20 39 years 5 2 570 0 525 75 1 3 1 3 25 170 500 12 120
40 49 years 5 2 440 0 525 75 1 2 1 2 23 170 500 12 120
50 59 years 5 2 320 0 525 75 1 2 1 2 22 170 500 12 120
0 9 years 5 2 090 0 525 75 1 1 20 170 500 12 120
70 years 5 1 880 0 525 75 0 9 0 9 18 170 500 12 120
Females
10 12 years 35 1 910 49 400 70 1 1 18 110 700 17 80
13 15 years 44 2 010 5 425 75 1 1 19 140 700 21 100
1 19 years 48 2 020 5 450 80 1 1 19 150 500 25 100
20 39 years 49 1 900 52 450 70 1 1 18 150 500 2 100
40 49 years 49 1 800 52 450 70 0 9 0 9 17 150 500 2 100
50 59 years 49 1 710 52 450 70 0 8 0 8 1 150 500 11 100
0 9 years 49 1 540 52 450 70 0 8 0 8 15 150 500 11 100
70 years 49 1 390 52 450 70 0 7 0 7 13 150 500 11 100
Pregnant
1sttrimester 0 9 25 10 0 0 0 200 400 41 25
2ndtrimester 300 9 25 10 0 3 0 3 200 400 41 25
3rdtrimester 300 9 25 10 0 3 0 3 200 400 41 25
Lactating
1stmonths 500 1 325 35 0 4 0 4 5 100 400 23 50
2ndmonths 500 12 275 30 0 4 0 4 5 100 400 23 50

Double burden of malnutrition in developing countries
247
ANNEX 3: PHILLIPINE RENIs, 2002
Iodine Age group Weight
kg
Energy
kcal
Protein
g
Vitamin A
ug
Vitamin C
mg
Thiamine
mg
Ribo-flavin
mg
Niacin
mg
Folate
ug
Calcium
mg
Iron
mg mg
Infants
< 3 months 0 0 0 0 0 0 0 0 0 0 0
3 < months 5 0 9 375 30 0 2 0 3 1 5 5 200 0 90
< 12 months 9 720 14 400 30 0 4 0 4 4 80 400 10 90
Children
1 3 years 13 1 070 28 400 30 0 5 0 5 1 0 500 8 90
4 years 19 1 410 38 400 30 0 0 7 200 550 9 90
7 9 years 24 1 00 43 400 35 0 7 0 7 9 300 700 11 120
Males
10 12 years 34 2 140 54 400 45 0 9 1 12 400 1000 13 120
13 15 years 50 2 800 71 550 5 1 2 1 3 1 400 1000 20 150
1 18 years 58 2 840 73 00 75 1 4 1 5 1 400 1000 14 150
19 29 years 59 2 490 7 550 75 1 2 1 3 1 400 750 12 150
30 49 years 59 2 420 7 550 75 1 2 1 3 1 400 750 12 150
50 4 years 59 2 170 7 550 75 1 2 1 3 1 400 750 12 150
5 years 59 1 890 7 550 75 1 2 1 3 1 400 800 12 150
Females
10 12 years 35 1 920 49 400 45 0 9 0 9 12 400 1000 19 120
13 15 years 49 2 250 3 450 5 1 1 14 400 1000 21 150
1 18 years 50 2 050 59 450 70 1 1 1 1 14 400 1000 27 150
19 29 years 51 1 8 0 58 500 70 1 1 1 1 14 400 750 27 150
30 49 years 51 1 810 58 500 70 1 1 1 1 14 400 750 27 150
50 4 years 51 1 20 58 500 70 1 1 1 1 14 400 800 27 150
5 years 51 1 410 58 500 70 1 1 1 1 14 400 800 10 150
Pregnant
1sttrimester 0 800 80 1 4 1 7 18 00 800 27 200
2ndtrimester 300 800 80 1 4 1 7 18 00 800 34 200
3rdtrimester 300 800 80 1 4 1 7 18 00 800 38 200
Lactating
1stmonths 500 81 900 105 1 5 1 7 17 500 750 27 200
2ndmonths 500 7 900 100 1 5 1 7 17 500 750 30 200

Dietary changes and their health implications in the Philippines 248
ANNEX 4: NUTRITIONAL GUIDELINES FOR THE PHILIPPINES, 2000
1. Eat a variety of foods every day. 2. Breastfeed infants from birth to four to six months, and then give appropriate foods
while continuing breastfeeding. 3. Maintain children’s normal growth through proper diet, and monitor their growth
regularly. 4. Consume fish, lean meat, poultry or dried beans. 5. Eat more vegetables, fruits and root crops. 6. Eat foods cooked in edible/cooking oil daily. 7. Consume milk, milk products and other calcium-rich foods, such as small fish and
dark-green leafy vegetables, every day. 8. Use iodized salt, but avoid excessive intake of salty foods. 9. Eat clean and safe food. 10. For a healthy lifestyle and good nutrition, exercise regularly, do not smoke and avoid
drinking alcoholic beverages.

Double burden of malnutrition in developing countries
249
ANNEX 5: TRENDS IN PERCENTAGE CONTRIBUTION OF FOOD GROUPS TO TOTAL DIETARY ENERGY INTAKE (KCAL), 1978 TO 2003
% distribution Food group/sub-group
1978 1982 1987 1993 2003
Energy giving foods
Cereals and cereal products 9 7 9 8 9 2 71 0 7 5
Rice and products 58 2 57 1 58 3 5 4 52 8
Maize and products 7 7 2 4 7 8 5 2
Other cereals and products 3 9 5 5 2 7 8 9 5
Starchy roots and tubers 2 2 2 3 1 3 1 0 1 2
Sugars and syrups1 3 7 4 5 4 8 4 2 4 4
Fats and oils2 4 9 2 3 5 9 5 9
Body building foods
Fish, meat and poultry 7 5 8 9 5 9 5 12 0
Fish and products 3 8 3 4 0 3 7 3 4
Meat and products 3 2 4 3 4 9 4 9 7 4
Poultry 0 5 0 0 1 0 1 2
Eggs 0 0 7 0 8 1 0 1 0
Milk and milk products 5 2 1 5 1 3 1 4 1 4
Whole milk 1 3 1 2
Milk products 0 1 0 2
Dried beans, nuts and seeds3 1 1 1 3 1 3 1 3 1 1
Regulating foods
Vegetables 1 9 1 1 5 1 7
Green leafy and yellow vegetables 0 5 0 5 0 4 0 4 0 5
Other vegetables 1 4 1 1 3 4a 1 1 1 2
Fruits 2 5 2 3 2 1 1
Vitamin C-rich foods 0 8 0 0 7 0 5 0 2
Other fruits 1 7 1 7 1 7 1 4
Miscellaneous 0 1 0 1 0 1 1 2 2
everages4 1
Condiments 0 4
Others 0 2
Total kcal 1 804 1 808 1 753 1 684 1 887
Sample sizes: 1978, 2 800; 1982, 2 280; 1987, 3 200; 1993, 4 050; 2003, 5 514. 1 Includes soft drinks (sugar content), sherbet and similar preparations. 2 Includes grated coconut and coconut milk (fat). 3 Includes mung beans, soybeans, peanuts and other dried beans, nuts. 4 Includes coffee, tuba (local wine), alcoholic beverages and others. a Includes other fruits and other vegetables. Numbers may not add up to totals owing to rounding off.Sources: NNS, 1978; 1982; 1987; 1993; 2003.

Dietary changes and their health implications in the Philippines 250
ANNEX 6: TRENDS IN MEAN PER CAPITA IRON INTAKE (MG) BY FOOD GROUP, 1978 TO 2003
Consumption (mg) Food group/sub-group
1978 1982 1987 1993 2003
Energy giving foods
Cereals and cereal products 4.7 4.6 4.5 4.1 4.6
Rice and products 3.8 3.4 3.3 2.7 2.8
Maize and products 0.3 0.4 0.2 0.3 0.2
Other cereals and products 0.7 0.9 1.0 1.2 1.5
Starchy roots and tubers 0.3 0.3 0.2 0.2 0.2
Sugars and syrups1 0.1 0.0 0.0 0.0 0.1
Fats and oils2 0.1 0.1 0.1 0.1 0.1
Body building foods
Fish, meat and poultry 2.6 2.6 2.8 2.9 2.2
Fish and products 2.2 2.1 2.1 2.2 1.0
Meat and products 0.3 0.4 0.6 0.6 1.0
Poultry 0.1 0.1 0.1 0.1 0.2
Eggs 0.2 0.2 0.3 0.3 0.3
Milk and milk products 0.1 0.1 0.1 0.1 0.2
Whole milk 0.1 0.2
Milk products 0.1 0.0
Dried beans, nuts and seeds3 0.4 0.4 0.4 0.4 0.4
Regulating foods
Vegetables 1.3 1.2 1.1 1.1
Green leafy and yellow vegetables 0.7 0.7 0.6 0.6 0.5
Other vegetables 0.6 0.5 0.8a 0.5 0.5
Fruits 0.5 0.5 0.3 0.2
Vitamin C-rich foods 0.2 0.2 0.2 0.1 0.1
Other fruits 0.3 0.3 0.2 0.2
Miscellaneous 0.7 0.6 0.6 0.6 0.8
Beverages4 0.4
Condiments 0.3
Others 0.1
Total mg 11.0 10.8 10.7 10.1 10.0
Sample sizes: 1978, 2 800; 1982, 2 280; 1987, 3 200; 1993, 4 050; 2003, 5 514. 1 Includes soft drinks (sugar content), sherbet and similar preparations. 2 Includes grated coconut and coconut milk (fat). 3 Includes mung beans, soybeans, peanuts and other dried beans, nuts. 4 Includes coffee, tuba (local wine), alcoholic beverages and others. a Includes other fruits and other vegetables. Numbers may not add up to totals owing to rounding off.Sources: NNS, 1978; 1982; 1987; 1993; 2003.

Double burden of malnutrition in developing countries
251
ANNEX 7: TRENDS IN PERCENTAGE CONTRIBUTIONS OF FOOD GROUPS TO IRON INTAKE (MG), 1978 TO 2003
% distribution Food group/sub-group
1978 1982 1987 1993 2003
Energy giving foods
Cereals and cereal products 42.6 42.8 42.1 40.9 45.7
Rice and products 34.1 31.1 30.4 26.4 28.8
Maize and products 2.4 3.3 2.3 2.7 1.6
Other cereals and products 6.1 8.3 9.4 11.8 15.3
Starchy roots and tubers 3.0 3.0 1.7 1.5 1.7
Sugars and syrups1 1.3 0.4 0.4 0.3 0.5
Fats and oils2 0.6 0.9 0.8 0.7 0.7
Body building foods
Fish, meat and poultry 23.8 23.8 25.9 28.4 22.0
Fish and products 20.2 19.0 19.6 21.5 10.0
Meat and products 3.0 3.8 5.4 5.6 10.2
Poultry 0.6 0.9 0.9 1.3 1.8
Eggs 1.8 2.1 2.4 2.9 3.2
Milk and milk products 0.6 0.9 1.2 1.0 1.6
Whole milk 0.9 1.5
Milk products 0.5 0.1
Dried beans, nuts and seeds3 3.4 3.7 4.1 4.0 3.9
Regulating foods
Vegetables 11.7 11.5 11.0 10.5
Green leafy and yellow vegetables 6.7 6.6 5.7 5.7 5.2
Other vegetables 5.0 4.9 7.6a 5.3 5.3
Fruits 4.5 4.9 3.2 2.4
Vitamin C-rich foods 2.1 2.4 2.1 0.9 0.5
Other fruits 2.4 2.5 2.3 1.9
Miscellaneous 6.4 5.8 6.0 6.2 7.8
Beverages4 4.5
Condiments 2.8
Others 0.5
Total mg 11.0 10.8 10.7 10.1 10.0
Sample sizes: 1978, 2 800; 1982, 2 280; 1987, 3 200; 1993, 4 050; 2003, 5 514. 1 Includes soft drinks (sugar content), sherbet and similar preparations. 2 Includes grated coconut and coconut milk (fat). 3 Includes mung beans, soybeans, peanuts and other dried beans, nuts. 4 Includes coffee, tuba (local wine), alcoholic beverages and others. a Includes other fruits and other vegetables. Numbers may not add up to totals owing to rounding off.Sources: NNS, 1978; 1982; 1987; 1993; 2003.

Dietary changes and their health implications in the Philippines 252
ANNEX 8: MEAN DAILY PER CAPITA FOOD CONSUMPTION BY REGION, 2003
Philippines NCR Ilocos CAR Cagayan Valley
Central Luzon
Cala-barzon
Mima- ropa
Bicol Food group/sub-group
Consumption, in grams raw as purchased
Energy giving foods
Cereals and cereal products 364 320 377 393 389 363 352 399 361
Rice and products 303 267 350 363 359 325 315 371 296
Maize and products 31 5 a 1
a 4
a 6
a 4
a 4
a 4
a 27
a
Other cereals and products 30 47 26 26 24 34 33 24 38
Starchy roots and tubers 19 19 a 14
a 34
a 32
a 13
a 10 26
a 23
a
Sugars and syrups1 24 28 27 25 22 27 24 23 23
Fats and oils2 18 29 16
a14
a16 18 22 17
a17
Body building foods
Fish, meat and poultry 185 226 188 175 149 209 194 167 146
Fish and products 104 94 102 59 69 102 98 96 97
Meat and products 61 102 75 84 54a
82 73 59 43a
Poultry 20 30 a 11
a 3
a 2 26
a 25 23
a 12
a 6
a
Eggs 13 18 14 10 a 12 18 15
a 11 8
a
Milk and milk products 49 76 42 30 a 37
a 65 64 27 29
Whole milk 35 53 37 26 a 26
a 40 41 21 24
a
Milk products 14 23 5 4 11 25 23 6 5
Dried beans, nuts and seeds3 10 13
a 8 18
a 13 9 8 9
a 10
Regulating foods
Vegetables 111 88 171 155 132 99 99 129 118
Green leafy and yellow vegetables
31 22 43 49 46 19 24 22 30
Other vegetables 80 66 128 106 86 80 75 107 88
Fruits 54 60 a 41
a 49
a 22
a 56 43
a 87
a 52
a
Vitamin C-rich foods 12 15 a 11
a 16
a 7
a 13
a 10
a 16
a 13
a
Other fruits 42 45 a 30
a 33
a 15
a 43
a 33
a 71
a 39
a
Miscellaneous 39 56 a 29 26
a 26
a 38 50
a 41
a 25
a
Beverages4 26 43
a 16
a 18
a 15
a 20 36
a 28
a 14
a
Condiments 10 10 11 6 9 10 10 10 10
Others 3 3 2 2 2 8 4 3 1
Total food 886 933 927 929 850 915 881 936 812
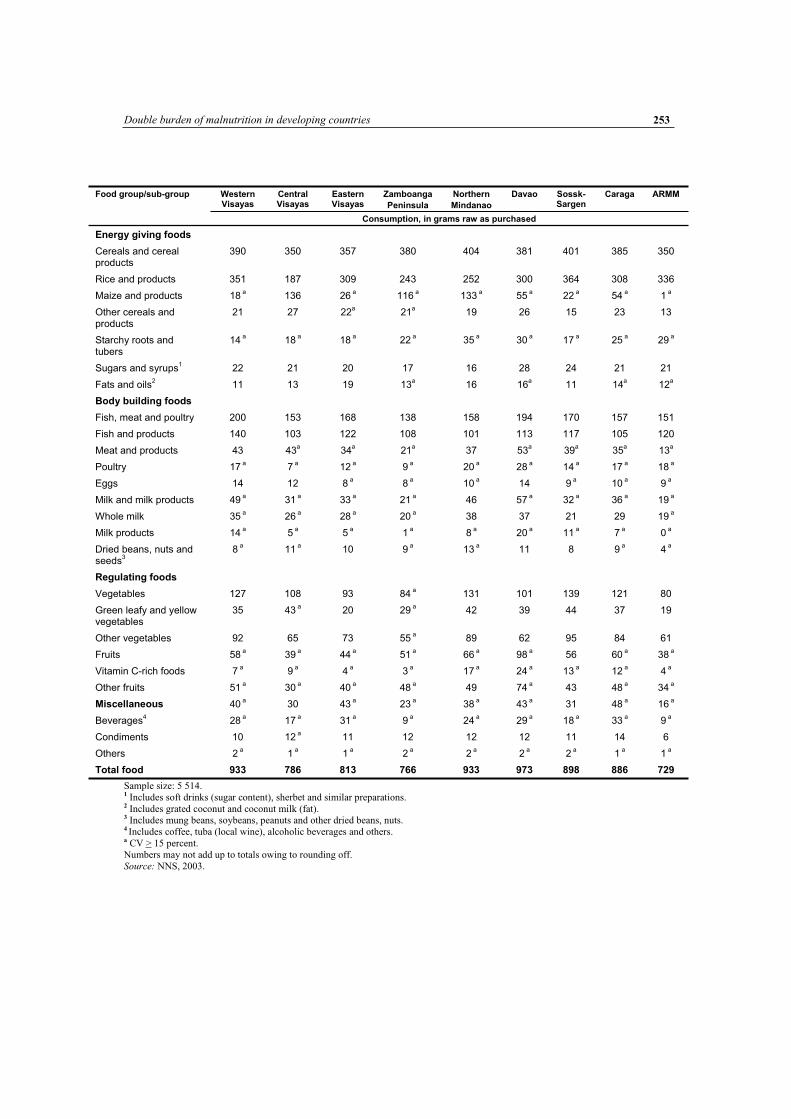
Double burden of malnutrition in developing countries
253
Western Visayas
Central Visayas
Eastern Visayas
Zamboanga
Peninsula
Northern
Mindanao
Davao Sossk-Sargen
Caraga ARMM Food group/sub-group
Consumption, in grams raw as purchased
Energy giving foods
Cereals and cereal products
390 350 357 380 404 381 401 385 350
Rice and products 351 187 309 243 252 300 364 308 336
Maize and products 18 a 136 26
a 116
a 133
a 55
a 22
a 54
a 1
a
Other cereals and products
21 27 22a
21a
19 26 15 23 13
Starchy roots and tubers
14 a 18
a 18
a 22
a 35
a 30
a 17
a 25
a 29
a
Sugars and syrups1 22 21 20 17 16 28 24 21 21
Fats and oils2 11 13 19 13
a16 16
a11 14
a12
a
Body building foods
Fish, meat and poultry 200 153 168 138 158 194 170 157 151
Fish and products 140 103 122 108 101 113 117 105 120
Meat and products 43 43a
34a
21a
37 53a
39a
35a
13a
Poultry 17 a 7
a 12
a 9
a 20
a 28
a 14
a 17
a 18
a
Eggs 14 12 8 a 8
a 10
a 14 9
a 10
a 9
a
Milk and milk products 49 a 31
a 33
a 21
a 46 57
a 32
a 36
a 19
a
Whole milk 35 a 26
a 28
a 20
a 38 37 21 29 19
a
Milk products 14 a 5
a 5
a 1
a 8
a 20
a 11
a 7
a 0
a
Dried beans, nuts and seeds
38
a 11
a 10 9
a 13
a 11 8 9
a 4
a
Regulating foods
Vegetables 127 108 93 84 a 131 101 139 121 80
Green leafy and yellow vegetables
35 43 a 20 29
a 42 39 44 37 19
Other vegetables 92 65 73 55 a 89 62 95 84 61
Fruits 58 a 39
a 44
a 51
a 66
a 98
a 56 60
a 38
a
Vitamin C-rich foods 7 a 9
a 4
a 3
a 17
a 24
a 13
a 12
a 4
a
Other fruits 51 a 30
a 40
a 48
a 49 74
a 43 48
a 34
a
Miscellaneous 40 a 30 43
a 23
a 38
a 43
a 31 48
a 16
a
Beverages4 28
a 17
a 31
a 9
a 24
a 29
a 18
a 33
a 9
a
Condiments 10 12 a 11 12 12 12 11 14 6
Others 2 a 1
a 1
a 2
a 2
a 2
a 2
a 1
a 1
a
Total food 933 786 813 766 933 973 898 886 729
Sample size: 5 514. 1 Includes soft drinks (sugar content), sherbet and similar preparations. 2 Includes grated coconut and coconut milk (fat). 3 Includes mung beans, soybeans, peanuts and other dried beans, nuts. 4 Includes coffee, tuba (local wine), alcoholic beverages and others. a CV > 15 percent. Numbers may not add up to totals owing to rounding off.Source: NNS, 2003.

Dietary changes and their health implications in the Philippines 254
ANNEX 9: MEAN DAILY PER CAPITA ENERGY AND NUTRIENT INTAKES AND PERCENTAGE ADEQUACY BY REGION, 2003
Region
NCR Ilocos Cagayan CAR Central Luzon
Cala-Barzon
Energy (kcal)
Intake 1 942 1 944 1 940 2 072 1 955 1 888
RNI 1 955 1 922 1 938 1 971 1 946 1 943
% adequacy 99.4 101.2 100.1 105.1 100.5 97.2
Protein (g)
Intake 61.4 56.6 53.3 60.4 57.9 56.7
RNI 56.8 56.8 56.9 57.3 56.9 56.9
% adequacy 108.1 99.6 93.5 105.4 101.8 99.7
Iron (mg)
Intake 11.2 11.0 10.2 11.4 10.6 10.4
RNI 17.3 16.3 16.6 16.8 16.8 17.2
% adequacy 64.6 67.5 61.3 67.8 62.8 60.3
Retinol equivalent (mcg)
Intake 557.1 524.3 461.1 718.2 374.2 583.5
RNI 499.6 497.8 497.7 497.9 500.0 498.2
% adequacy 111.5 105.3 92.6 144.2 74.8 117.1
Calcium (g)
Intake 0.46 0.50 0.45 0.47 0.42 0.41
RNI 0.76 0.77 0.77 0.77 0.76 0.77
% adequacy 60.8 65.5 58.5 60.4 55.2 54.1
Thiamine (mg)
Intake 0.97 0.93 0.89 1.17 0.89 0.91
RNI 1.03 1.03 1.03 1.03 1.03 1.03
% adequacy 93.9 90.3 86.8 113.1 86.6 88.3
Riboflavin (mg)
Intake 0.84 0.78 0.74 0.88 0.74 0.82
RNI 1.08 1.07 1.07 1.08 1.07 1.07
% adequacy 77.8 73.3 68.7 82.0 69.2 76.3
Niacin (mg)
Intake 22.4 21.4 20.2 24.7 20.9 21.6
RNI 13.3 13.2 13.3 13.3 13.2 13.3
% adequacy 168.4 161.5 152.2 185.6 157.9 162.5
Ascorbic acid (mg)
Intake 47.8 45.5 42.9 60.8 42.6 39.5
RNI 62.8 62.2 62.3 62.3 62.3 62.5
% adequacy 76.0 73.1 68.9 97.6 68.3 63.3

Double burden of malnutrition in developing countries
255
Region
Nutrients Mima-Ropa Bicol Western Visayas
Central
Visayas
Eastern Visayas
Zamboanga
Peninsula
Energy (kcal)
Intake 2 008 1 856 1 936 1 782 1 803 1 762
RNI 1 921 1 924 1 937 1 925 1 912 1 914
% adequacy 104.5 96.5 99.9 92.6 94.3 92.1
Protein (g)
Intake 54.8 50.6 58.0 51.8 51.6 50.6
RNI 56.0 56.7 56.4 56.4 55.9 56.0
% adequacy 97.8 89.2 102.8 91.8 92.4 90.4
Iron (mg)
Intake 10.1 9.2 10.5 8.7 8.7 7.9
RNI 16.6 16.5 16.5 16.5 16.1 16.7
% adequacy 61.2 55.9 63.8 52.9 53.9 47.7
Retinol equivalent (mcg)
Intake 469.5 371.3 426.2 349.1 361.5 337.7
RNI 495.0 500.7 496.1 495.6 491.5 492.1
% adequacy 94.9 74.2 85.9 70.4 73.5 68.6
Calcium (g)
Intake 0.43 0.40 0.50 0.42 0.41 0.37
RNI 0.76 0.76 0.76 0.77 0.76 0.77
% adequacy 56.5 51.8 65.8 54.4 54.4 48.6
Thiamine (mg)
Intake 0.88 0.80 1.08 0.79 0.77 0.69
RNI 1.01 1.03 1.02 1.02 1.01 1.01
% adequacy 87.1 77.7 106.2 77.3 76.6 68.0
Riboflavin (mg)
Intake 0.67 0.62 0.70 0.64 0.61 0.57
RNI 1.05 1.07 1.06 1.06 1.05 1.05
% adequacy 63.8 57.4 65.6 60.1 58.4 54.4
Niacin (mg)
Intake 21.3 18.3 21.7 16.2 19.4 16.8
RNI 13.0 13.2 13.1 13.1 12.9 13.0
% adequacy 163.5 138.6 165.1 124.1 149.6 129.5
Ascorbic acid (mg)
Intake 52.8 47.2 45.9 50.1 38.1 37.7
RNI 60.8 62.3 61.6 61.3 60.7 60.7
% adequacy 86.9 75.7 74.4 81.8 62.8 62.1

Dietary changes and their health implications in the Philippines 256
Region Nutrients
Northern
Mindanao
Davao Soccsk-Sargen
Caraga ARMM
Energy (kcal)
Intake 1 955 1 998 1 911 1 898 1 683
RNI 1 994 1 948 1 980 1 898 1 874
% adequacy 98.0 102.6 96.5 100.0 89.8
Protein (g)
Intake 57.7 59.0 56.8 52.6 47.4
RNI 58.1 56.9 57.2 55.4 53.7
% adequacy 99.3 103.8 99.2 94.9 88.3
Iron (mg)
Intake 9.9 10.4 9.3 9.8 7.5
RNI 16.6 16.9 16.8 16.2 16.0
% adequacy 59.2 61.3 55.6 60.8 46.8
Retinol equivalent (mcg)
Intake 399.3 451.5 380.0 597.9 236.2
RNI 505.0 504.1 502.0 495.6 484.7
% adequacy 79.1 89.6 75.7 120.7 48.7
Calcium (g)
Intake 0.46 0.45 0.41 0.44 0.32
RNI 0.77 0.76 0.77 0.75 0.75
% adequacy 59.6 58.5 53.2 58.1 43.3
Thiamine (mg)
Intake 0.83 0.87 0.83 0.80 0.59
RNI 1.05 1.03 1.03 1.00 0.97
% adequacy 78.8 84.9 80.9 79.9 61.6
Riboflavin (mg)
Intake 0.67 0.76 0.66 0.72 0.53
RNI 1.10 1.08 1.08 1.05 1.01
% adequacy 61.2 70.9 61.0 69.2 52.9
Niacin (mg)
Intake 19.8 21.8 22.3 19.4 19.1
RNI 13.5 13.2 13.3 12.9 12.3
% adequacy 146.6 165.1 167.9 151.1 155.3
Ascorbic acid (mg)
Intake 62.0 61.8 48.1 52.8 31.8
RNI 63.4 62.4 62.3 60.3 57.7
% adequacy 97.8 99.1 77.3 87.6 55.1
Sample size: 5 514. Source: NNS, 2003.
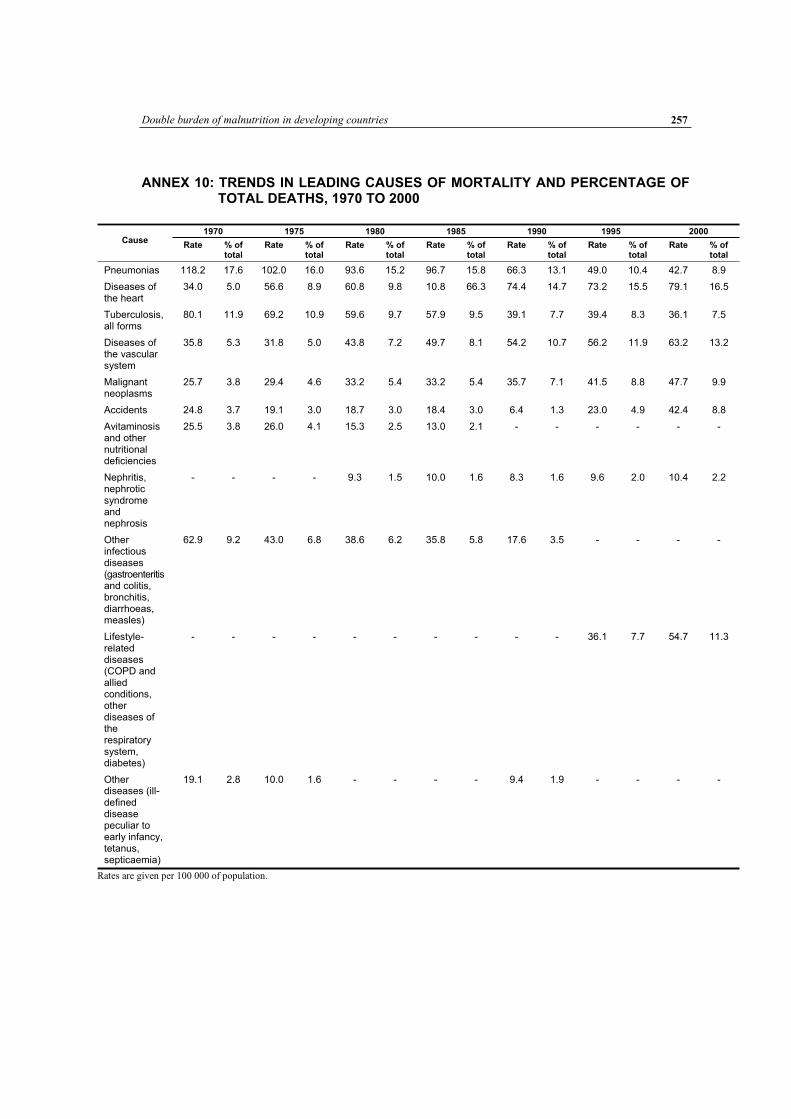
Double burden of malnutrition in developing countries
257
ANNEX 10: TRENDS IN LEADING CAUSES OF MORTALITY AND PERCENTAGE OF TOTAL DEATHS, 1970 TO 2000
1970 1975 1980 1985 1990 1995 2000 Cause
Rate % of total
Rate % of total
Rate % of total
Rate % of total
Rate % of total
Rate % of total
Rate % of total
Pneumonias 118.2 17.6 102.0 16.0 93.6 15.2 96.7 15.8 66.3 13.1 49.0 10.4 42.7 8.9
Diseases of the heart
34.0 5.0 56.6 8.9 60.8 9.8 10.8 66.3 74.4 14.7 73.2 15.5 79.1 16.5
Tuberculosis, all forms
80.1 11.9 69.2 10.9 59.6 9.7 57.9 9.5 39.1 7.7 39.4 8.3 36.1 7.5
Diseases of the vascular system
35.8 5.3 31.8 5.0 43.8 7.2 49.7 8.1 54.2 10.7 56.2 11.9 63.2 13.2
Malignant neoplasms
25.7 3.8 29.4 4.6 33.2 5.4 33.2 5.4 35.7 7.1 41.5 8.8 47.7 9.9
Accidents 24.8 3.7 19.1 3.0 18.7 3.0 18.4 3.0 6.4 1.3 23.0 4.9 42.4 8.8
Avitaminosis and other nutritional deficiencies
25.5 3.8 26.0 4.1 15.3 2.5 13.0 2.1 - - - - - -
Nephritis, nephrotic syndrome and nephrosis
- - - - 9.3 1.5 10.0 1.6 8.3 1.6 9.6 2.0 10.4 2.2
Other infectious diseases (gastroenteritis and colitis, bronchitis, diarrhoeas, measles)
62.9 9.2 43.0 6.8 38.6 6.2 35.8 5.8 17.6 3.5 - - - -
Lifestyle-related diseases (COPD and allied conditions, other diseases of the respiratory system, diabetes)
- - - - - - - - - - 36.1 7.7 54.7 11.3
Other diseases (ill-defined disease peculiar to early infancy, tetanus, septicaemia)
19.1 2.8 10.0 1.6 - - - - 9.4 1.9 - - - -
Rates are given per 100 000 of population.

Double burden of malnutrition in developing countries 259
Dietary changes and the health transition in South Africa:
implications for health policyN.P. Steyn, D. Bradshaw, R. Norman, J.D. Joubert, M. Schneiderand K. Steyn
INTRODUCTIONSouth Africa is a middle-income country with a variety of living conditions ranging through wealthy and middle-income suburbs, deprived peri-urban areas, rural farms and undeveloped rural areas. Changing social, political and economic factors have resulted in increased urbanization and changes in diet and health behaviours. Estimates for South Africa show that despite the high burden of infectious diseases, non-communicable diseases (NCDs) account for a large proportion of deaths. In 2000, infectious diseases accounted for 44 percent of deaths, and HIV/AIDS alone for 29 percent (Bradshaw et al.,2003). NCDs accounted for 37 percent of deaths; cardiovascular disease (CVD) and diabetes accounting for 19 percent, and cancers for a further 7.5 percent. In contrast, nutritional deficiencies related to undernutrition accounted for 1.2 percent of deaths. As a result of the relatively high burdens of injuries and HIV/AIDS, the burden of disease in South Africa has been described as a “quadruple burden” of conditions related to underdevelopment, emerging chronic diseases related to unhealthy lifestyles, HIV/AIDS, and injuries.
This case study provides data from published research of diet, dietary trends, nutritional status and diet-related chronic diseases in South Africa over recent decades. These are assessed in the context of trends in the communicable disease burden. A review of the changes in diet and the health transition experienced in South Africa could contribute to the development of a national strategy with a strong dietary policy component that would be effective in the long term.
Brief historical background South Africa has a heterogeneous population of approximately 46 million people of diverse origins. Historically, people of Khoi, San, Bantu, European and Indian descent pioneered the country, and at present more than a million people are from other African countries, Asia, Europe, Australia, New Zealand and the Americas. The rich heritage of South Africa has resulted in vast cultural and ethnic diversity, with 11 official languages and several other indigenous languages and dialects. The largest organized religion is Christianity, and others include Islam, Hinduism and Judaism. In addition, many people follow a “traditionalist” belief system (Department of Health, SAMRC and Measure DHS+, 2002). The 2001 census (Statistics South Africa, 2003) incorporated the following self-classified and self-reported population groups: black/African (79 percent), coloured/mixed origin (8.9 percent), white (9.6 percent) and Asian/Indian (2.5 percent).1
1 These population group classifications reflect self-reporting according to groups defined by the Population Registration Act of 1950. This classification highlights issues that reflect the effects of historical disparities, and the authors do not subscribe to it for any other purpose. The terms “black” and “African” are used interchangeably.

Dietary changes and the health transition in South Africa: implications for health policy 260
Segregation and discrimination had been part of South Africa’s history for hundreds of years. Over the last century, the country’s people endured complex systems of neo-colonial and Apartheid repression and oppression. In the 1980s, escalating conflict, civil unrest, changes in the ideology of the then-ruling National Party, declining economic growth and international sanctions contributed to the creation of alternative political views. Subsequent negotiations resulted in the country’s first democratic elections in April 1994 and the development of a new political dispensation (Blaauw and Gilson, 2001). South Africa is currently undergoing a profound social transition from its segregationist past to a democracy supported by a progressive constitution entrenching extensive human rights and fundamental political freedoms. The country’s political past was intertwined with its geographic formation and governing system. Hence, 11 geopolitical areas consisting of the former provinces, four independent states and six self-governing areas have been restructured into nine provinces (Figure 1), and a new governing system has been established at the national, provincial and local levels (Blaauw and Gilson, 2001).
The development challenge faced by South Africa is enormous. While aiming to build a society based on human rights and social justice, the country has to grapple with the legacy of an income distribution that is among the most unequal in the world, combined with high levels of poverty and unemployment. Furthermore, strategies to promote economic growth are likely to reduce the likelihood of eliminating these inequalities in the near future (Terreblanche, 2004).
Demographic and socio-economic indicators The dietary and individual risk behaviour of people defines their nutritional status, health, growth and development. These do not occur in a vacuum but within a cultural, economic, social and political context, which can either aggravate or promote health (WHO, 2003). As South Africa is undergoing major transformations, it is important to describe some demographic, economic, health and development trends that may play diverse roles in nutrition and health.
Selected demographic indicators Common to the situation in most sub-Saharan countries, South Africa’s demographic and epidemiological data systems have limitations. Determined efforts over the past decade have improved the processes and products of vital registration systems, but sources of complete and reliable vital statistics remain difficult to achieve (Bradshaw et al., 2003). The country’s rapidly growing AIDS epidemic has affected many demographic and epidemiological trends in atypical ways that would challenge data systems under even optimal circumstances. The internationally acknowledged model of the Actuarial Society of South Africa (ASSA) has the best potential for the purposes of this case study, which has used the ASSA2002 suite of models when empirical data were not available or reliable. Details of the models and their assumptions are available on the Internet at www.assa.org.za.

Double burden of malnutrition in developing countries 261
FIGURE 1
Current geographic composition of South Africa
0 100
kilometers
200
LESOTHOLESOTHOLESOTHOLESOTHOLESOTHOLESOTHOLESOTHOLESOTHOLESOTHO
SWAZILANDSWAZILANDSWAZILANDSWAZILANDSWAZILANDSWAZILANDSWAZILANDSWAZILANDSWAZILANDNORTH WESTNORTH WESTNORTH WESTNORTH WESTNORTH WESTNORTH WESTNORTH WESTNORTH WESTNORTH WEST
MPUMALANGAMPUMALANGAMPUMALANGAMPUMALANGAMPUMALANGAMPUMALANGAMPUMALANGAMPUMALANGAMPUMALANGA
GAUTENGGAUTENGGAUTENGGAUTENGGAUTENGGAUTENGGAUTENGGAUTENGGAUTENG
FREE STATE FREE STATE FREE STATE FREE STATE FREE STATE FREE STATE FREE STATE FREE STATE FREE STATE
WESTERN CAPEWESTERN CAPEWESTERN CAPEWESTERN CAPEWESTERN CAPEWESTERN CAPEWESTERN CAPEWESTERN CAPEWESTERN CAPE
LIMPOPOLIMPOPOLIMPOPOLIMPOPOLIMPOPOLIMPOPOLIMPOPOLIMPOPOLIMPOPO
KWAZULU-NATALKWAZULU-NATALKWAZULU-NATALKWAZULU-NATALKWAZULU-NATALKWAZULU-NATALKWAZULU-NATALKWAZULU-NATALKWAZULU-NATAL
NORTHERN CAPENORTHERN CAPENORTHERN CAPENORTHERN CAPENORTHERN CAPENORTHERN CAPENORTHERN CAPENORTHERN CAPENORTHERN CAPE
MmabathoMmabathoMmabathoMmabathoMmabathoMmabathoMmabathoMmabathoMmabathoJohannesburgJohannesburgJohannesburgJohannesburgJohannesburgJohannesburgJohannesburgJohannesburgJohannesburg
NelspruitNelspruitNelspruitNelspruitNelspruitNelspruitNelspruitNelspruitNelspruit
UpingtonUpingtonUpingtonUpingtonUpingtonUpingtonUpingtonUpingtonUpington
BloemfonteinBloemfonteinBloemfonteinBloemfonteinBloemfonteinBloemfonteinBloemfonteinBloemfonteinBloemfontein
Cape TownCape TownCape TownCape TownCape TownCape TownCape TownCape TownCape Town
BishoBishoBishoBishoBishoBishoBishoBishoBisho
PietersburgPietersburgPietersburgPietersburgPietersburgPietersburgPietersburgPietersburgPietersburg
PietermaritzburgPietermaritzburgPietermaritzburgPietermaritzburgPietermaritzburgPietermaritzburgPietermaritzburgPietermaritzburgPietermaritzburg
EASTERN CAPEEASTERN CAPEEASTERN CAPEEASTERN CAPEEASTERN CAPEEASTERN CAPEEASTERN CAPEEASTERN CAPEEASTERN CAPE
Map produced by the Health GIS Centre,
Medical Research Council of SA (2004)
Data Source: Municipal Demarcation Board
Current Provinces of South Africa with Provincial Capitals
Province boundaries
International boundaries
Source: HSRC, 2003.
Life expectancy and adult, child and infant mortality rates: After a steadily increasing average life expectancy at birth throughout the 1980s, the mortality impact of the country’s severe AIDS epidemic is evident in the considerable drop in life expectancy in the early 1990s, from 61.6 years in 1992 to 49.7 in 2006, and is also reflected in increased infant and child mortality. The harshness of the impact on women is made clear by the unusually rapid narrowing of the difference between female and male life expectancy, from eight years in the early 1990s to less than four years in 2010 (Figure 2). Both the fall in life expectancy and the change in the sex differential are mirrored in the steeply upward trend of the 45q15, or the probability that a person aged 15 years will not live another 45 years to reach 60 years of age (Figure 3). The infant and child mortality rates do not reflect the country’s middle-income economic status, particularly since the AIDS epidemic. However, assuming dedicated efforts to prevent vertical HIV transmission in the model, a recovery to and improvement of pre-AIDS trends in infant and child mortality are projected (Figure 4).

Dietary changes and the health transition in South Africa: implications for health policy 262
FIGURE 2
Average life expectancy at birth, 1985 to 2010
Source: ASSA2002 (ASSA, 2004). FIGURE 3
Adult mortality,1 1985 to 2010
1 nqx represents the proportion of people in a particular cohort who are alive at the beginning of an indicated age interval (x) and who will die before reaching the end of that age interval (x + n). In other words, the nqx values stand for the probability that a person at his/her xth birthday will die before reaching his/her x + nth birthday. So, 45q15 represents the probability that people aged 15 years will die before they reach the age of 60 (or 15 + 45). This can also be called “premature adult mortality”. The 45q15 is widely used as a demographic indicator of adult mortality. Source: ASSA2002 (ASSA, 2004).

Double burden of malnutrition in developing countries 263
FIGURE 4
Infant and child mortality rates, 1985 to 2010
Source: ASSA2002 (ASSA, 2004).
Total population and fertility rates: South Africa’s total fertility rate has been declining for several decades, and is currently estimated at 2.6 children born alive per woman during her reproductive lifetime, indicating that the population is well-advanced in its fertility transition (Moultrie and Timæus, 2003). With increasing mortality rates and decreasing fertility and birth rates, the average annual growth rate of the total population is projected to decline dramatically over a short period. These demographic changes reflect an epidemic with a vast impact. Figures 29 and 30, presented in another section of this case study, convey part of the vastness by illustrating the projected numbers of HIV-infected and AIDS-sick people, and showing the huge mortality from AIDS alone compared with that from all other diseases, disabilities and injuries combined.
Urbanization trends: Urbanization and other migration patterns are perceived as important issues in health and nutrition, but relationships and patterns of migration are complex in South Africa, and suitable data sources are very scarce. The 1996 population census provides data on internal migration for the entire population for the first time, but the absence of suitable data prior to this has constrained the analysis of migration data over time (Kok et al., 2003). Urbanization, in particular, has different histories for the country’s four main population groups, with the urbanization levels of black South Africans diverging most prominently from those of other groups. Until July 1986 when it was abolished, “influx control” legislation prevented the black population from settling permanently outside the independent and self-governing states. The “group areas” legislation, repealed in June 1990, enforced the resettlement of millions of South Africans, mostly black African people (Gelderblom and Kok, 1994; Kok et al., 2003). These and other political controls and legislation were directed not only towards restricting black migration, but also towards controlling black labour (Terreblanche and Nattrass, 1990). By 2001, almost 90 percent of the white and coloured population and nearly 100 percent of the Indian population were urbanized, compared with about 50 percent of the black population (P. Kok, personal communication, 2004).

Dietary changes and the health transition in South Africa: implications for health policy 264
Selected socio-economic indicators Gross domestic product (GDP): Sufficient, safe and varied food supply can prevent under- and overnutrition and reduce the risk of chronic disease. However, there is also evidence that poverty and inequity are part of the root causes of malnutrition (WHO, 2003). South Africa’s per capita GDP, corrected for purchasing power parity (PPP) at US$11 240 per year in 2001, placed it among the 50 wealthiest nations in the world (May, 2004). However, in 1993 the World Bank described the country as one of the world’s most unequal economies, with a Gini coefficient for income as high as 0.58 (World Bank, cited in May, 2004); this indicator had deteriorated to 0.69 in 2000, making South Africa the third most unequal society in the world (UNDP, 2001). This also suggests that income inequality has worsened nationally, despite official efforts to increase wages at the lower end of the income scale, such as for domestic and farm workers (cf. Department of Labour, 2002).
Figure 5 shows the country’s per capita GDP, corrected for PPP, which has increased steadily since the 1980s. However, such macroeconomic indicators conceal important concerns that may affect community or individual nutritional status and well-being. For example, in 1993, 19 million people – almost half of the country’s population – were categorized as poor (Klasen, 1997 cited in May, 1998), and 11.5 percent of the population were living on less than PPP$1 per day, while 35.8 percent lived on less than PPP$2 (World Bank, 2000 cited in May, 2004). In a rigorous analysis of poverty and related data, Woolard and Leibbrandt (2001 cited in May, 2004) used 1995 data to indicate that the situation continues to be bleak, with 40 to 50 percent of South Africans categorized as poor, including 25 percent ultra-poor. Although definitions of poverty have been adapted over the years and changes in the incidence and severity of poverty are debated, various studies suggest that poverty levels and the number of people living in poverty have increased over recent years (cf. Budlender, 2000; Statistics South Africa, 2002; Van der Ruit and May, 2003; Meth and Dias, 2004 – all cited in May, 2004).
FIGURE 5
GDP per capita: 1980, 1990 and annual values for 1994 to 2002
0
2,000
4,000
6,000
8,000
10,000
12,000
1980
1982
1984
1986
1988
1990
1992
1994
1996
1998
2000
2002
US
$ a
t P
PP
Data points for 1981 to 1989 and 1991 to 1993 are interpolated. Source: Quatec Dataset in UNDP, 2003.
Unemployment: Differing conceptual, methodological, theoretical and ideological positions can influence the measuring of unemployment, and this seems to be particularly true in South Africa (Archer et al., 1990). However, there is wide consensus that the unemployment rate has increased considerably over the past three decades (Figure 6). Since the mid-1970s, every year there have been fewer wage jobs available than the

Double burden of malnutrition in developing countries 265
number of people entering the labour market (Archer et al., 1990). Towards the turn of the century this observation was highlighted by May (1998), who said that the South African economy is creating employment too slowly to make a meaningful impression on unemployment levels. Despite employment creation efforts by the new government, after ten years of democracy the rate of unemployment had risen significantly – whether unemployment be defined broadly or narrowly (HSRC, 2003).
FIGURE 6
Unemployment rates, 1970 to 2002
0
5
10
15
20
25
30
35
1970
1972
1974
1976
1978
1980
1982
1984
1986
1988
1990
1992
1994
1996
1998
2000
2002
Per
cent
Unemployment rate
Sources: South African Reserve Bank Quarterly Bulletin 2003, q1; EIU Country Data; World Bank Global Development Indicators; and IMF Financial Statistics – reported in UNDP, 2003.
Housing and sanitation: The environment that people live in has the potential to aggravate or promote their health. Despite improvements over the past decade, almost a third of South Africa’s households live in informal and traditional dwellings, about a third have piped water inside their homes, slightly more than half use a flush or chemical toilet, and 14 percent have no toilet. A considerable number of households continue to lack basic services, and much still has to be done to enhance the country’s inherited skewed system of access to these services.
Burden of disease The initial burden of disease study of 2000 (Bradshaw et al., 2003) provides the first set of estimates of the causes of mortality experienced in South Africa. This study made use of several sources of cause of death data, together with the ASSA model to overcome the underregistration of deaths and the misclassification of causes. Figure 7 shows the age distribution of the estimated number of deaths in 2000 by broad cause group. The distinct age pattern of AIDS deaths among children and young adults is clear. Communicable diseases occur across all ages, while injuries affect particularly young adult men. NCDs occur in adult age groups. More such deaths occur under the age of 60, reflecting the age structure of the population. The South African National Burden of Disease Study (SANBDS) estimates that in 2000 NCDs accounted for 37 percent of deaths, followed by HIV/AIDS, which accounted for 30 percent. NCDs accounted for 40 percent of female and 36 percent of male deaths. Stroke is the most common fatal NCD among women, and ischaemic heart disease (IHD) among men. Hypertensive heart disease, diabetes mellitus and chronic obstructive pulmonary disease were also among the leading causes of fatal

Dietary changes and the health transition in South Africa: implications for health policy 266
NCDs in 2000. These conditions coexist with low birth weight, protein–energy malnutrition and other infectious diseases as leading causes of death.
FIGURE 7
Male and female deaths by age and cause, 2000
Source: 2000 SANBD in Bradshaw et al., 2003.
DIETARY TRENDS AND ASSOCIATED RISK FACTORS Changes in total dietary energy, carbohydrate, protein and fat intakes The food balance sheets for 1962, 1972, 1982, 1992 and 2001 were used to describe trends in per capita consumption and are presented in Annex 1 (FAO, 2004). The contributions of different macronutrients to total energy intake are shown in Figure 8. These ratios have not changed much, even though the available per capita energy supply has increased by more than 300 kcal. It is important to remember that food balance sheets present total amounts of food available (not consumed) and do not account for how commodities are distributed according to region, socio-economic sector, gender or other demographic factor. These
Male deaths by age, 2000
0
5
10
15
20
25
30
35
40
45
0 1 5 10 15 20 25 30 35 40 45 50 55 60 65 70 75 80 85+
Age group
Death
s (
'000)
Other communicable/mat/peri/nutrition HIV/AIDS Non-communicable Injuries
Female deaths by age, 2000
0
5
10
15
20
25
30
35
40
45
0 1 5 10 15 20 25 30 35 40 45 50 55 60 65 70 75 80 85+
Age group
Dea
ths
('0
00)
Other communicable/mat/peri/nutrition HIV/AIDS Non-communicable Injuries

Double burden of malnutrition in developing countries 267
data are regarded as very crude estimates of dietary intake and have only been included because national data on dietary intake surveys are not available prior to 1999.
FIGURE 8
Trends in dietary energy supplies from fat, protein and carbohydrate (CHO), 1962 and 2001
551
2921
19101778
300274711
2603
0
500
1000
1500
2000
2500
3000
3500
1962 2001
Kcal/day
CHO
Protein
Fat
Kcal
Source: FAO, 2004.
However, certain trends emerge for the 40-year period (Annex 1). The per capita available energy supply increased from 2 603 kcal/day in 1962 to 2 921 kcal in 2001, available protein supplies increased from 68.4 to 75.1 g, fat from 61.2 to 79 g, and available carbohydrate supplies from 445 to 478 g. The implication is that at the national level more food is available to consumers. However, the increase in fat availability per capita may be detrimental to health from a chronic diseases perspective.
The first nationally representative dietary study in South Africa – the National Food Consumption Survey (NFCS) – was undertaken in 1999 (Labadarios et al., 2000). It was a cross-sectional survey of children aged one to nine years, with provincial representation drawing on the 1996 census data. The aim of the survey was to collect baseline data from which to formulate appropriate policy guidelines for food fortification, as well as to develop appropriate nutrition education material for South African children. The final sample comprised 2 894 children, with a response rate of 93 percent. Socio-demographic, dietary and anthropometric data were collected for each participant.
As the NFCS was the first national dietary study in South Africa, it is not possible to compare macronutrients over time in a reliable manner. However, by examining two studies, one in adults and one in schoolchildren, some changes can be deduced. Bourne (1996) examined the macronutrient intake of black adults living in Cape Town (Figure 9). Certain trends are noticeable, for example, the intake of carbohydrate calculated as percentage of total energy intake decreased from 61.4 to 52.8 percent as people spent more of their lives in the city.2 In contrast, fat intake increased from 23.8 to 31.8 percent according to time spent in the city. Protein intake remained more or less the same over time, although the contribution of animal protein increased, whereas the amount of plant protein decreased. Fibre intake (not shown), also decreased significantly – from 20.7 to 16.7 g – with increased time living in the city.
2 People living in a city all their lives have spent 100 percent in an urban area. Alternatively, people living in rural areas for most of their lives (50 years) with five years in the city have spent only 10 percent of their lives in an urban area.

Dietary changes and the health transition in South Africa: implications for health policy 268
These changes are all consistent with a population undergoing the nutrition transition, i.e., changes in diet from a traditional high-carbohydrate, high-fibre, low-fat diet to one with higher fat and sugar intakes and lower carbohydrate and fibre intakes (Popkin, 2001).
FIGURE 9
Changes in contributions of macronutrients to total energy intake among black adults (19 to 44 years) according to percentage of time lived in the city (Cape Town)
Sample size: 649.Source: Bourne, 1996.
In urban areas of Gauteng, mean fat intake increased from 17 percent in 1962 to 25.8 percent in 1999, while carbohydrate intake decreased from 72 to 60.3 percent, as shown in Figure 10 (Lubbe, 1973; Labadarios et al., 2000). Some differences between the two studies need to be kept in mind, however. Results from the 1962 study are reported for six- to nine-year-olds, using a modified diet history, while results from 1999 are for one- to nine-year-olds, using a 24-hour recall dietary method. Despite these differences, schoolchildren showed similar patterns of macronutrient intakes to those of adults in the Cape Town study by Bourne (1996). These two studies support the trends that energy and fat intakes have increased since 1962, as shown by the food balance sheets.
FIGURE 10
Macronutrient distribution as percentages of total energy consumed by black schoolchildren in urban areas of Gauteng in 1962 (six to nine years) and 1999 (one to nine
years)
Sample sizes: 1962, 552; 1999, 427. Sources: 1962 – Lubbe, 1973; 1999 – NFCS, 1999 (Labadarios et al., 2000).
66
14
26
72
11
17
0
10
20
30
40
50
60
70
80
1962 1999
Pe
rce
nt
CHO
Protein
Fat
14 14 1415
23 25 25 30
6863 61
58
0
10
20
30
40
50
60
70
80
0-19 20-49 50-79 80-100
Percent time lived in city
Perc
en
t
Protein
Fat
CHO

Double burden of malnutrition in developing countries 269
Differences in nutrient intake among ethnic groups and between urban and rural areas It is important to note that there is a diversity of ethnic and cultural groups in South Africa with different traditional eating patterns. The white population consume a typical Western diet, which has a high fat intake (> 30 percent of total energy), low carbohydrate intake (< 55 percent energy), low fibre and high free sugar intake (> 10 percent energy) (Wolmarans et al., 1989). The Indian and coloured (mixed ancestry) populations have a very similar pattern to this, albeit each group consumes certain foods more commonly (Langenhoven, Steyn and van Eck, 1988). The black African population has two distinct types of eating patterns. The rural population still follows a very traditional diet, which is high in carbohydrates (> 65 percent of total energy), low in fat (< 25 percent total energy), low in sugar (< 10 percent total energy) and moderately high in fibre (Steyn et al., 2001). On the other hand, the urban black African population demonstrates an adoption of the Western diet of the other groups. The carbohydrate (< 65 percent total energy) and fibre intakes of this group are lower, and its fat intake is higher (> 25 percent total energy) (Bourne et al.,1993).
In Figure 11, macronutrient distributions show marked differences among whites, urban blacks and rural blacks. White males (aged 35 to 44 years) have the highest intakes of fat, protein and added sugar and the lowest intake of carbohydrates (Wolmarans et al., 1988). Rural black adults of the same age have the highest intake of carbohydrates and the lowest of protein, fat and added sugar (Steyn et al., 2001). Black urban males lie between the two extremes (Bourne et al.,1993). This figure suggests that there is a diet transition among urban blacks from a traditional rural diet to an urban one that is approaching the completely Westernized diet of the white population. However, it should be remembered that the studies were not undertaken at the same point in time, which may have influenced the results.
FIGURE 11
Macronutrient distribution as percentages of total daily energy among adult white urban (15 to 64 years), black urban (19 to 44 years) and black rural (20 to 65 years) males
Sample sizes: white urban, 454; black urban, 285; black rural, 74. Sources: white – Wolmarans et al., 1989; black urban – Bourne et al., 1993; black rural – Steyn et al., 2001.
Table 1 shows the differences in dietary intake among all the main ethnic groups (males) in South Africa, with urban and rural subgroups for blacks (Bourne et al., 1993; Langenhoven, Steyn and van Eck, 1988; Steyn et al., 2001; Vorster et al., 1995; Wolmarans et al., 1988; 1999). These studies were geographically and ethnically representative of the areas where they were undertaken, and can be regarded as a good reflection of the typical diet of each specific group.
44
6168
16 15 16
36
26
1713 11
6
0
10
20
30
40
50
60
70
80
White Black urban Black rural
Pe
rce
nt CHO
Protein
Fat
Sugar

Dietary changes and the health transition in South Africa: implications for health policy 270
The white, Indian and coloured groups have the highest intakes of fats, protein and free sugar, which are not in line with the WHO/FAO (2003) recommendations. Black males in rural areas have the lowest intakes of all types of fat and protein. Urban males, once again, illustrate the nutrition transition that has taken place. Table 2 shows various transitions that have taken place in the black population (MacIntyre et al., 2002).
The urban upper income group has the highest fat and protein intakes as a percentage of energy intake. This group also has the highest cholesterol intake, which is higher than the WHO/FAO (2003) recommendation (< 300 mg/day). At the other end of the scale are rural residents and rural farm workers, who have a prudent diet that is low in fat and high in carbohydrate.
TABLE 1 Comparison of macronutrient mean ranges in six dietary studies in adult males and females
Dietary factor
CORIS white rural
n = 1 113 15–64 years
DIKGALE black rural
n = 210 20–65 years
VIGHOR white urban
n = 317 15–64 years
BRISK black urban
n = 983 19–44 years
Indians urban
n = 370 15–69 years
CRISICcoloured
urban n = 276 20–34 years
WHO goals
% energy
Energy (kJ) 1 6.3–12.7 6.0–6.7 5.9–12.5 5.8–8.5 5–8.5 7.1–10.3
Energy (kcal) 1 500–3
024 1 434–1
590 1 405–2
976 1 386–2
035 1 190–2
024 1 690–2
452
Total fat (% E) 2 34.6–36.5 15.7–17.1 33.3–38.6 23.8–28.3 32.8–36.9 37.3–38 15–30%
SFA (% E) 3
12.6–13.6 3.7–4.4 12.2–14.6 8.5–9.2 7.0–9.8 11.8–11.9 < 10%
PUFAs (% E) 4
5.9–7.0 3.7–3.9 5.6–7.8 4.5–7.2 9.5–12.5 9.1–9.2 6–10%
CHO (% E) 5 44.1–51.5 62.4–70.8 46.9–53.3 59.2–64.3 45.5–53.0 45–46.5 55–75%
Free sugar (% E)
10.8–15.4 5.2–4.2 13.0–18.6 10.7–14.6 10.8–15.8 15–16 < 10%
Protein (% E) 13.8–16.6 14.2–15.6 13.6–16.3 13.1–15.3 11.9–13.8 14.9–15 10–15%
Cholesterol (mg) 243–509 144.9–116.6
140–176 mg /4.2kJ
-76–
117 mg /4.2kJ
290–440 300
mg/day
1 kJ = kilojoules. 2 E = energy. 3 SFA = saturated fats. 4 PUFA = poly-unsaturated fats. 5 CHO = carbohydrate. Sources: CORIS – Wolmarans et al., 1988; DIKGALE – Steyn et al., 2001; VIGHOR – Vorster et al., 1995; BRISK – Bourne et al.,1993; Indian Study – Wolmarans et al., 1999; CRISIC – Langenhoven, Steyn and van Eck, 1988; WHO/FAO, 2003.

Double burden of malnutrition in developing countries 271
TABLE 2 Distribution of macronutrients in the diet of black South African males (15 to 80 years), by area and income
Dietary factor Rural
Low-income n = 194
Farm workers
(rural) low-income n = 109
Urban (informal
settlement) low-income
n = 128
Urban middle-income n = 229
Urban high-income
n = 83
WHO7 goals % of energy
Energy (kJ) 9.6 8.9 9.3 9.9 9.8
Energy (kcal) 2 285 2 122 2 222 2 356 2 338
Total fat (% E) 22.9 22.8 24.3 26.0 30.6 15 - 30%
CHO (% E) 67.4 67.2 65.5 64 57.3 55 - 75%
Protein (% E) 11.6 12.1 12 11.8 13.2 10 - 15%
Cholesterol (mg)
315.6 283 332 377 420 300 mg
/day
Fibre (g) 19.2 15.6 17.4 18.8 19.7
Sources: MacIntyre et al., 2002; WHO/FAO, 2003.
Changes in intakes of types of food and food groups over time According to FAO data (Annex 1), cereal availability increased from 169.3 kg per capita per annum in 1962 to 187.8 kg in 2001; as did the availability of starchy roots (from 13 to 29.7 kg), vegetable oils (5.7 to 14.5 kg), fruits (24.1 to 36.0 kg), alcohol (43.8 to 56.8 litres), meat (31.6 to 37.5 kg), eggs (2.5 to 6.1 kg) and fish (5.5 to 7.9 kg). Foods whose per capita availability decreased were sugar and sweeteners (from 39.4 to 32.8 kg), offal (4.5 to 3.8 kg), animal fats (including butter) (3.0 to 0.7 kg) and milk (78.0 to 54.1 kg).
These data reflect a number of scenarios. Availability of staple cereals gradually increased, as did that of other items mentioned in the previous paragraph; these increases account for the overall increase in energy intake. Vegetable oil and meat per capita also increased significantly, which accounts for the large increase in fat and saturated fat intakes. Of concern is the fact that vegetable availability remained constant (at 43.5 to 44.2 kg per annum). Overall fruit and vegetable availability was 185 g/day (excluding starchy roots), which is far less than the recommended intake of 400 g/day (WHO/FAO, 2003). This has serious implications, because low fruit and vegetable intake is a risk factor for many NCDs.
Among black adults, the amounts consumed from different food groups changed with increasing time spent in Cape Town, as shown in Figure 12. Groups for which consumption rose were meat, fruit and vegetables, fats and non-basic foods (such as drinks and sweets), while consumption from the dairy and cereal groups decreased. Similar findings are presented for young females in Figure 13. The higher consumption of sugar-containing food items in urban compared with rural areas is shown in Figure 14.

Dietary changes and the health transition in South Africa: implications for health policy 272
FIGURE 12
Percentage contributions of different food groups to energy, by time spent in Cape Town by black adults (19 to 44 years)
Sample size: 649. Source: Bourne, 1996.
FIGURE 13
Food consumption of black female university students from urban and rural areas
Sample size: 115. Source: Steyn et al., 2000
0 50 100 150 200 250 300 350 400
Maize
Wheat
Dairy
Meat
Vegetables
Fats
Beverages
Sweets
g/day
Urban
Rural
0 10 20 30 40 50
0-19
20-49
50-79
80-100
Perc
ent
tim
e liv
ed in c
ity
Percent of energy
Dairy
Fruit andvegetablesFats
Meat
Cereals

Double burden of malnutrition in developing countries 273
FIGURE 14
Percentage consumption of sugar-containing items by children aged six to nine years
Sample size: 439. Cordial = a drink made from sweet sucrose concentrate. Cold drink = soft drink. Source: NFCS in Labadarios et al., 2000.
Current diet The results from NFCS provide the first nationally representative dietary data for South Africa. Table 3 indicates the mean nutrient intakes of children and compares them with recommended nutrient intakes (RNI) (FAO/WHO, 2002). Overall, the energy intakes of both rural groups were less than the RNIs, as were the intakes of vitamins A and C, niacin, vitamin B6 and zinc. For folate and calcium, urban and rural intakes were less than the RNIs. An important aspect of the study was the disparities in intakes between urban and rural areas. For most nutrients, the mean values in urban areas were significantly higher than those in rural ones.
To understand the dynamics of dietary change, the main food groups consumed by South African adults and children in urban and rural areas were examined (Table 4). In lieu of the lacking national data on adults, data from combined databases were summarized using secondary data analyses to show the dietary intakes of adults (Steyn et al., 2001; Nel and Steyn, 2002) and children (aged one to five years) (Labadarios et al., 2000). Although rural dwellers have higher cereal and vegetable intakes, urban adults and children far exceed the rural people’s consumption of most other food groups, particularly sugar, meat, vegetable oil, dairy, fruit, roots and tubers and alcohol.
9
1
12
6
1
1
11
11
25
12
0 5 10 15 20 25 30
Sweets
Cordials*
Jam
Cookies
Cold drinks
Percent
Urban
Rural

Dietary changes and the health transition in South Africa: implications for health policy 274
TABLE 3 Mean nutrient intakes of children
Children 1–3 years (n = 1 308) Children 4–6 years (n = 1 083) Nutrient Urban Rural RSA Urban Rural RSA
#Energy (kJ) 4 403 (2
043) 3 992* (1 790)
4 200 (1 933) 5 614 (2 375) 4 963* (2 283)
5 271* (2 349)
Energy (kcal) 1 048 (486) 950* (426) 1 000 (460) 1 337 (565) 1 182* (544) 1 255* (559)
CHO (g) 154 (72) 151 (71) 152 (72) 192 (80) 193 (91) 193 (86)
#Added sugar (g) 26 (23) 18 (17) 22 (21) 36 (30) 24 (34) 29 (33)
#Protein (g) 33 (18) 29 (17) 31 (18) 43 (21) 36 (19) 39 (21)
Fat (g) 29 (21) 22 (16) 25 (19) 38 (25) 42 (21) 31 (24)
Fibre (g) 9 (6) 10 (7) 9 (6) 13 (7) 13 (8) 13 (8)
#Vitamin A (RE) 463 (943) 252* (349) 359* (723) 544 (1 313) 319* (1 007) 425* (1 167)
#Vitamin C (mg) 41 (96) 20* (36) 31* (73) 36* (65) 29* (78) 33* (72)
Thiamine (mg) 0.6 (0.3) 0.6 (0.3) 0.6 (0.3) 0.7 (0.4) 0.7 (0.4) 0.7 (0.4)
#Riboflavin (mg) 0.8 (0.8) 0.6 (0.6) 0.7 (0.7) 1.0 (1.0) 0.7 (1.0) 0.8 (0.9)
#Niacin (mg) 6.4 (4.7) 4.8* (3.8) 5.6 (4.3) 9 (6.2) 6.3 * (4.4) 7.6 * (5.5)
#Vitamin B6 (mg) 0.6 (0.4) 0.4* (0.3) 0.5 (0.4) 0.8 (0.6) 0.5 * (0.4) 0.6 (0.5)
#Vitamin B 12 (ug) 2.7 (8.4) 1.4 (4.4) 2.1 (6.8) 3.7 (12.1) 2 (10.2) 2.8 (11.2)
#Folate (mg) 102* (81) 86* (84) 94* (83) 161* (119) 127* (111) 143* (116)
#Calcium (mg) 345* (326) 302* (326) 324* (327) 342* (282) 270 * (254) 304* (269)
#Iron (mg) 4.9* (3.6) 4.7* (3.8) 4.8 * (3.7) 6.7 (4.2) 6.1 (4.6) 6.4 (4.5)
#Zinc (mg) 4.5 (2.7) 3.9* (2.5) 4.2 (2.6) 5.9 (3.3) 4.8* (3.1) 5.3 (3.2)
* = mean intake is less than the FAO/WHO (2002) RNI. # = significant urban/rural differences (p < 0.01). Source: Steyn et al. in Labadarios et al., 2000
TABLE 4 Adults’ and children’s consumption, by food group and residence
Adults and children 10+ years (n = 817) Children 1–5 years (n = 2 048) Food group
RSA g/day
Urban g/day
Ruralg/day
RSA g/day
Urban g/day
Ruralg/day
Cereals 870 736 1 023 489 433 546
Sugar 76 120 27 65 93 39
Stimulants: tea, coffee 382 390 371 147 143 151
Vegetables 93 85 101 52 45 58
Meat and offal 86 102 67 45 56 34
Vegetable oils 8 11 5 5 6 3
Dairy 73 109 31 124 147 102
Fruit 61 83 36 48 70 27
Eggs 15 16 14 10 12 8
Legumes 35 34 36 17 15 18
Fish 12 14 10 7 8 5.8
Roots and tubers 40 59 19 29 32 27
Nuts and oilseeds 2 2 2 1 2 1
Alcohol 54 67 38 - - -
Soups 2.6 4.3 0.6 6 3 9
Condiments 0.5 0.7 0.3 0.2 0.2 0.1
Animal fat 1.0 1.6 0.4 0.1 0.1 0.2
Source: Nel and Steyn, 2002.

Double burden of malnutrition in developing countries 275
Changes in alcohol intake According to the food balance sheets, per capita alcohol consumption in South Africa increased between 1962 and 2001 (Annex 1). Certain trends are noticeable from two surveys carried out in the 1990s: SADHS in adults (Department of Health, SAMRC and Measure DHS+, 2002) and the Youth Risk Behaviour Study (YRBS) (Reddy et al., 2003) in teenagers (Figure 15). YRBS found that more than 30 percent of teenagers had drunk and/or binged on alcohol in the preceding 30 days. According to SADHS, nearly 30 percent of adult males reported using alcohol excessively, based on the CAGE test (Ewing, 1984), compared with 10 percent of females. High alcohol consumption is a risk factor for chronic diseases such as stroke, diabetes and cancer of the oesophagus, liver and breast, and so needs to be addressed as an underlying determinant in the prevention of NCDs (WHO/FAO, 2003).
FIGURE 15
Prevalence of teenager (13 to 19 years) school attendees reporting drinking alcohol or bingeing in the past month, and prevalence of alcohol-dependent adults
* Consumed an alcoholic drink on one or more days during the previous month. ** Consumed five or more alcoholic drinks on one or more days during the previous month. + According to the CAGE questionnaire. Sources: YRBS; SADHS.
TRENDS IN NUTRITIONAL STATUS Trends in the prevalence of undernutrition and protein–energy malnutrition Nationally representative and comparable anthropometric data over time are only available for 1994 and 1999 in children and for 1998 in adults; hence, they do not show long-term trends. In order to obtain longer time trends, smaller localized studies have been used to provide comparisons with the 1994 and 1999 data on children. Data on one localized and two national studies undertaken in South Africa between 1986 and 1999 are shown in Table 5. Given the differences in children’s ages, conclusions on trends should be interpreted cautiously. The 1986 study sampled black preschool children on farms in areas other than the “homelands”, where the greater part of the black population lived. Consequently, the data are not a true reflection of the actual prevalence of malnutrition, which would have been higher if these areas had been included. Before democratization,
38
2926
18
28
10
0
5
10
15
20
25
30
35
40
Drank in past month*,
YRBS
Binged in past
month**, YRBS
Alcohol dependent+,
SADHS
Pe
rce
nt
Male adolescents
Female adolescents
Male adults
Female adults

Dietary changes and the health transition in South Africa: implications for health policy 276
the health care services provided to the population in “homelands” were totally insufficient. In 1994, the South African Vitamin A Consultative Group (SAVACG, 1995) undertook a national study of preschool children, and the 1999 NFCS included school-going children. These studies showed similar results, with underweight ranging from 6.9 to 10.7 percent, stunting from 16.1 to 27 percent and wasting from 1.8 to 3.7 percent. Malnutrition prevalence was always higher in rural than urban areas. There appears to be a small improvement in the prevalence of stunting between 1994 and 1999 in these two nationally representative surveys.
Two earlier studies (1969 and 1975) were undertaken as representative studies of the Transvaal, now partly Gauteng (Figure 16). These studies used the Harvard–3rd percentile as an indicator of underweight, while the later studies used the National Center for Health Statistics (NCHS) percentiles, and there are some discrepancies even though the two standards are very similar. There are large decreases in the prevalence of underweight in urban and rural areas until 1994. The smaller increases after 1994 in urban Gauteng are probably because of the large migration into this region following the lifting of migration restrictions.
TABLE 5 Prevalence of low weight-for-height, height-for-age and weight-for-age in children, 1986, 1994 and 1999
1 Six to 71 months category not available. 2 12 to 96 months. Sources: 1986 – Kustner, 1987; 1994 – SAVACG, 1995; 1999 – Labadarios et al., 2000; Steyn et al., 2005.
1986 rural
0–591 months
1994 urban
6–71 months
1994 rural
6–71 months
1994 RSA
6–71 months
1999 RSA
12–721 months
N = 1 745 n = 4 757 n = 6 062 n = 10 819 n = 2 200
Weight-for-age < -2 SD (NCHS)
8.4 6.9 10.7 9.3 8.8 (9.7)2
95% confidence interval
6.8; 9.9 6.0; 7.9 9.6; 11.9 8.5; 10.1 7.6; 10.1
Height-for-age
< -2 SD 24.5 16.1 27.0 22.9 19.3 (22.1)
2
95% confidence interval
19.2; 29.7 14.4; 17.8 24.8; 29.3 21.4; 24.5 17.5; 21.2
Weight-for-height
< -2 SD 1.8 2.1 2.8 2.6 3.7 (3.7)2
95% confidence interval
1.3; 2.3 1.5; 2.7 2.3; 3.4 2.2; 2.9 3.0; 4.4

Double burden of malnutrition in developing countries 277
FIGURE 16
Prevalence of underweight in black preschool children (under 72 months), 1969, 1975, 1994 and 1999
18.6
31.7
26.327.9
6.97.1
10.910.7
0
5
10
15
20
25
30
35
1965 1975 1985 1995 2005
Perc
ent
Urban
Rural
Sample sizes: 1969, 2 073; 1975, 3 655; 1994, 11 238); 1999, 2 200. Sources: 1969 and 1975 – Richardson, 1977; 1994 – SAVACG, 1995; 1999 NFCS – Labadarios et al., 2000; Steyn et al., 2005.
Trends in the prevalence of overweight and obesity The prevalence rates of overweight and obese children at the time of NFCS 1999 are shown in Table 6. There were significant differences between urban and rural areas, among location domains and among age groups. Overweight was highest in formal urban areas and in children aged one to three years. The finding that overweight/obesity was higher in urban areas is an indication that the nutrition transition is under way, and that undernutrition and associated infectious diseases should not be the only health concern among policy-makers. The data show that the prevalence of combined overweight and obesity (17.1 percent) is nearly the same as that for stunting (21.6 percent) (Steyn et al.,2005). Furthermore, stunting was associated with an increased risk (OR = 1.80, CI = 1.48–2.20) of being overweight (BMI 25) (Steyn et al., 2005). This finding suggests that stunting in childhood predisposes to overweight or obesity when sufficient food becomes available. This poses a threat for the emergence of chronic disease risk factors when stunted children become obese adults.

Dietary changes and the health transition in South Africa: implications for health policy 278
TABLE 6 Percentages of children with BMI values 25 and 30 using the Cole et al. (2000) cut-off points
Domain analysis by area of residence*
Domain analysis by urban/rural*
Domain analysis by age group* BMI cut-
off points
Farms Formal urban
Informal urban Tribal Rural Urban 1–3
years 4–6
years 7–8
years
All
n = 108
n =946
n =272
n = 874
n = 982
n = 128
n = 795
n = 861
n = 544
n =2 200
% 30 BMI
3.54 6.18 5.89 3.74 3.71 6.11 7.78 3.81 2.98 5.04
Lower 95% CI
0.77 4.40 3.15 2.55 2.64 4.55 6.07 2.50 1.13 4.07
Upper 95% CI
6.30 7.96 8.63 4.93 4.79 7.67 9.49 5.12 4.83 6.02
% 25 BMI
10.76 20.10 13.41 15.83 15.27 18.61 23.75 15.79 9.53 17.12
Lower 95% CI
6.03 16.01 10.02 13.52 13.15 15.15 20.87 12.84 6.37 15.00
Upper 95% CI
15.50 24.19 16.80 18.14 17.40 22.06 26.62 18.75 12.69 19.23
Chi-square*
p = 0.0066 0.0257 < 0.0001
* Chi-square p-value for testing for associations, using weighted values, between BMI groupings, area of residence, urban/rural and age groups. CI= confidence interval. SD = standard deviation. Source: 1999 NFCS in Steyn et al., 2005.
SADHS (1998) was the first nationally representative health survey in adults aged 15 years
and over, so in order to examine trends from previous years and compare with these data it is necessary to evaluate earlier studies that were representative of specific ethnic groups. Interpretation of these data should keep these limitations in mind. The earlier studies include a baseline study in 1979 on coronary heart diseases risk factors in white adults in three towns of the Western Cape Province (CORIS) (Jooste et al., 1988), and similar studies in 1982 in the coloured population (CRISIC) (Steyn et al., 1985), the black population in Cape Town (BRISK) (Steyn et al., 1991) and the Indian population (Seedat et al., 1990).
Figures 17 and 18 show the extent of obesity as a problem in men and women in South Africa. In women, the prevalence of obesity has remained high in all studies since 1979, particularly in black women, who show the highest prevalence. In men there appears to be a large increase in obesity in whites when the 1979 study is compared with that of 1998.
The most recent SADHS data on overweight and obesity in adults indicate that obesity increases with age until about 35 years in both men and women and declines from about 55 years. More than 40 percent of women aged 35 years and over are obese, and more than 20 percent of all women are overweight. For the ethnic groups, obesity is highest in black women and white men. At 12.9 percent and 5.6 percent, respectively, for men and women, the prevalence rate of underweight (BMI < 18.5) in adults is far lower than those of overweight and obesity (Department of Health, SAMRC and Measure DHS+, 2002).
The rising prevalence of obesity in South Africa gives cause for serious concern because of the increased risk of diabetes and CVD (WHO/FAO, 2003). These diseases have direct costs, which may be as high as 6.8 percent of total health care costs, as well as indirect costs, such as

Double burden of malnutrition in developing countries 279
workdays lost, doctor visits, impaired quality of life and premature mortality (WHO/FAO, 2003).
The data presented in this section of the case study illustrate that both over- and undernutrition exist in South Africa, with the extremes being most clearly seen among the black population.
FIGURE 17
The prevalence of obesity (BMI 30) in women, 1979 to 1998
Sample sizes : 1979, 3 831; 1982, 498; 1990, 544); 1998, 7 970. Sources: 1979 – Jooste et al., 1988; 1982 – Steyn et al., 1985; 1990 – Seedat et al., 1990; Steyn et al., 1991; 1998 – Department of Health, SAMRC and Measure DHS+, 2002.
FIGURE 18
The prevalence of obesity (BMI 30) in men, 1979 to 1998
Sample sizes: 1979, 3 357; 1982, 478; 1990, 442; 1998, 5 558. Sources: 1979 – Jooste et al., 1988; 1982 – Steyn et al., 1985; 1990 – Seedat et al., 1990; Steyn et al., 1991; 1998 – Department of Health, SAMRC and Measure DHS+, 2002.
Trends in micronutrient status The nationally representative SAVACG survey in 1994 examined, among other factors, the vitamin A and iron status of children aged 0 to five years (SAVACG, 1995). This was the
0 5 10 15 20 25 30 35 40
1979
1982
1990
1998
Percent
Indian
Coloured
White
Black
0 5 10 15 20 25
1998
1990
1982
1979
Percent
Indian White Black

Dietary changes and the health transition in South Africa: implications for health policy 280
first study to examine micronutrients in children at the national level. Micronutrient intakes of children will be measured again in 2005.
About 3 percent (Figure 19) of the sampled children showed serum vitamin A deficiency (VAD) (serum retinol < 10 ug/dl), while 33 percent were marginally deficient (serum retinol < 20 ug/dl) (SAVACG, 1995). Children in the 36 to 47 months age group were the most affected, with 11 percent having haemoglobin concentrations of less than 11 g/dl and 25 percent with low iron stores (ferritin < 12 ug/dl) (Figure 20). The mandatory fortification of maize and wheat with vitamin A, iron and other micronutrients since 2003 is expected to decrease these micronutrient deficiencies in South African children in the future.
Results from an iodine deficiency survey in 1998 in primary schoolchildren show that within provinces between 0 and 42 percent of schools had children who were iodine deficient (Immelman, Towindo and Kalk, 2000) (Figure 21). Schools in rural areas of Mpumalanga and Limpopo provinces were most affected. The survey also found that mandatory salt iodization since 1995 had considerably improved the iodine status of children. However, there are still some minor weaknesses in the national salt iodization programme, such as the use of non-iodized salt in 6.5 percent of households and the under- or non-iodization of a substantial percentage of household salt.
FIGURE 19
Vitamin A status of children aged six to 71 months, 1994
Sample size: 4 283. Source: SAVACG, 1995.
2 3 3 3 4 3
24
3034
3735
32
0
5
10
15
20
25
30
35
40
6-11 12-23 24-35 36-47 48-59 60-71Months
Perc
ent
%<10 ug/dL
%<20 ug/dL
Double burden of malnutrition in developing countries 281
FIGURE 20
Iron status of children aged six to 71 months, 1994
0
10
20
30
40
50
60
6-11 12-23 24-35 36-47 48-59 60-71
Months
Pe
rce
nt
Ferritin %<12ug/L
Hb %<11g/dL
Sample size: 4 494. Source: SAVACG, 1995.
FIGURE 21
Percent of schools whose students have low median urinary iodine, by province
Sample size: 179 schools. Source: Immelman, Towindo and Kalk, 2000.
Micronutrient deficiencies continue to contribute to the burden of mortality in South Africa. Preliminary results of a study to assess the burden attributable to selected nutritional deficiencies estimate that in 2000 nearly 3 000 deaths to diarrhoea in children aged 0 to four years were attributed to VAD. Furthermore, about 200 maternal deaths were attributed to VAD in pregnant women, while more than 3 500 perinatal deaths and about 180 maternal deaths (0.7 percent of total deaths) were attributed to iron deficiency anaemia (IDA) (Nojilana et al., in press).
No national data on biochemical deficiencies among adults are available. However, numerous localized studies have shown high prevalence of iron deficiency in women (Kruger et al., 1994;
4
0
10
17
0
6
42
25
4
0 10 Percent
20 30 40 50
W. Cape
E. Cape
N. Cape
Free State
North West
Gauteng
MPUL
Limpopo
KZ. Natal

Dietary changes and the health transition in South Africa: implications for health policy 282
Dannhauser et al., 1999) and of VAD, particularly in HIV-infected adults (Kennedy-Oji et al.,2001; Visser et al., 2003).
OTHER CHRONIC DISEASES AND ASSOCIATED LIFESTYLE RISK FACTORS Physical inactivity There is a paucity of data on the physical activity levels of South Africans, making it difficult to show trends over time. Figure 22 shows current levels of inactivity in South African teenagers from a national survey undertaken in 2002 (Reddy et al., 2003). Overall, coloured girls have the highest levels of inactivity, with nearly 60 percent doing little or nothing. The high levels of inactivity go a long way to explaining the high levels of overweight, obesity and hypertension, particularly in women. Figure 23 reports data on inactivity in adults. With the exception of the black population, the prevalence of inactivity was very high (more than 90 percent), both at work and during leisure time.
FIGURE 22
Percentages of 13- to 19-year-olds reporting insufficient or no physical activity at work,* 2002
Sample size: 10 100. * Insufficient or no physical activity means the person did not participate in vigorous or moderate activity that would have been sufficient for a health benefit over the previous seven days. Source: YRBS, 2002 in Reddy et al., 2003.
0 10 20 30 40 50 60
Males
Females
All
Percent
Indian
White
Coloured
Black

Double burden of malnutrition in developing countries 283
FIGURE 23
Percentages of 15- to 64-year-olds reporting insufficient or no physical activity at work (< 32 300 kJ/wk) and during leisure times (< 8 400 kJ/wk)
Sample sizes: white, 7 188; coloured, 976; black, 986; Indian, 778 Sources: white – CORIS in Rossouw et al., 1983; coloured – CRISIC in Steyn et al., 1985; black – BRISK in Steyn et al., 1991; Indian – Seedat et al., 1990.
All these studies identified physical activity patterns by means of questionnaires. The measurement of physical activity by questionnaires is challenging in large epidemiological studies. Consequently, the patterns shown here must be interpreted with caution, but the overall trends suggest that the Indian and white populations are the most inactive at work and leisure, while the black population is the least inactive.
Tobacco intake Tobacco consumption patterns in South Africa between 1990 and 2004 illustrate the impact of an aggressive tobacco control policy that was phased in during this period. The policy had two distinct aspects: tobacco control legislation and rapidly increasing excise taxes. Major legislative milestones include the Tobacco Controls Act, which was passed in 1993 and introduced health warnings on cigarette packets and advertisements. The act was amended in 1999 with the banning of all advertisements and prohibitions on smoking in all indoor public areas and on selling tobacco products to minors. In 1994, the government announced the phasing in of an increased excise tax, which added 50 percent to the retail price of tobacco. This resulted in a real increase of 256 percent in the excise tax per pack of cigarettes between 1994 and 2004; the real price of cigarettes increased by 127 percent over the same period. WHO’s Tobacco Framework Convention has been ratified by South Africa and a sufficient number of Member States to require all countries to comply with these laws. South Africa is currently expanding its tobacco control legislation to ensure compliance (Van Walbeek, 2005).
In 1992, Martin, Steyn and Yach reported that 31.5 percent of South Africans smoked. The prevalence rate peaked at 34 percent in 1995, as recorded by Reddy et al. (1998), declining steadily thereafter to reach 24 percent in 2003. The average number of cigarettes per smoker per year decreased from 229 packs in 1993 to 163 in 2003. Africans, males, young adults and poorer people experienced the most rapid decreases in smoking prevalence, while the decrease was less pronounced among whites, females and older and more affluent people.
Despite these positive trends, the prevalence of tobacco smoking is still high, particularly among youth. A recent survey found that the prevalence of cigarette smoking (daily and occasionally) was higher in 14-year-old adolescent males than females (21.5 versus 15.7 percent)
0 20 40 60 80 100 120
Males work
Males leisure
Females work
Females leisure
Percent
Indian
White
Coloured
Black
Dietary changes and the health transition in South Africa: implications for health policy 284
(Reddy et al., 2003). At 16 years of age, 30.4 percent of males were already smoking cigarettes, rising to 38 percent in 18-year-old males.
In 1998, SADHS found that more than 39 percent of African, white, coloured and Indian adult males (15 years and over) smoked daily or occasionally, with the lowest prevalence in rural black males (37 percent). In rural areas, only 4 percent of black females smoked daily, compared with 6 percent in urban areas. The overall prevalence of daily smoking for females was lowest in the black population (5 percent) and highest among whites (27 percent) (Department of Health, SAMRC and Measure DHS+, 2002). Because tobacco use is a risk factor for heart disease and lung cancer, which are serious contributors to both morbidity and mortality in South Africa, it calls for preventive measures, particularly among youth. The finding that nearly one-third of 16-year-old males are current smokers is a serious concern. Figure 24 shows the prevalence of smoking in adult males for 1984 and 1998. The highest prevalence rates were in whites and Indians. Despite the finding that smoking prevalence peaked in 1995 (Reddy et al., 1998), it is still considerably higher than it was in 1984.
FIGURE 24
Prevalence of smoking in adult males by population group, 1984 and 1998
Sources: 1984 – Yach and Townshend, 1988; 1998 – SADHS.
Hypercholesterolaemia No national surveys on serum cholesterol levels have been conducted. Figure 25 presents the results from four studies undertaken in different ethnic groups in localized settings. White men had the highest mean total cholesterol values, and black men the lowest. Indian and coloured men had similar mean values to those of white men, albeit slightly lower. With the exception of black men, all were found to have mean values above the recommended limit of 5.2 mmol/l. Hence, high serum cholesterol was a strong risk factor for CHD in South African men who are not black. These studies were conducted in the late 1970s and early 1980s, and it is not possible to say what trends and changes have taken place in the cholesterol values of black males since then.
27.7
41.1
29.0
39.0 40.0
57.054.2
34.9
0
10
20
30
40
50
60
70
African Coloured White Indian
Pe
rce
nt
1984
1998

Double burden of malnutrition in developing countries 285
FIGURE 25
Mean total serum cholesterol values (mmol/l) in adult males, by age and ethnic group
Sources: black – Norman et al., unpublished data, 2005; white – CORIS in Rossouw et al., 1983; coloured – CRISIC in Steyn et al., 1985; Indian – Seedat et al., 1990.
Hypertension SADHS was the first national survey to measure blood pressure of adults, and its findings are presented in Figure 26. The lowest prevalence of hypertension (BP > 140/90 mmHg) was found in black men (20.2 percent) and the highest in white men (38 percent). Coloured and white women and Indian men also had very high prevalence, at close to 30 percent. Of great concern, however, are the levels of hypertension control, namely control of those who have hypertension (BP > 140/90 mmHg). The highest levels of control were found in white women and Indians, and the lowest in black men and coloured women. Fewer than 10 percent of the latter were found to be controlled. The high levels of hypertension illustrated in Figure 26, together with the high prevalence rates of obesity, tobacco use (shown earlier) and hypercholesterolaemia help to explain the high prevalence of CVD in adults.
FIGURE 26
Prevalence of hypertension (BP > 140/90 mmHg) in adults, 1998
Sample size: 2 049. BP controlled = among those with hypertension, BP is < 140/90 mmHg, i.e. controlled. Source: SADHS.
0
5
10
15
20
25
30
35
40
Blackmen
Blackwomen
Coloured men
Coloured women
Whitemen
Whitewomen
Indian men
Indian women
Perc
ent BP > 140/90 mmHg
BP controlled
0
1
2
3
4
5
6
7
25-34 35-44 45-54 55-69Age (years)
Mean c
hole
ste
rol
Black urban
Black rural
White
Coloured
Indian

Dietary changes and the health transition in South Africa: implications for health policy 286
Cardiovascular diseases and diabetes The poor quality of historical cause of death data makes it very difficult to assess trends in mortality. Bradshaw et al. (1995) calculated age-standardized deaths rates by population group for 1985, based on the deaths reported for the years 1984 to 1986 relative to population estimates for 1985. Rates for blacks were calculated for urban areas only because there was high underregistration of deaths for blacks in rural areas. These are compared with estimated death rates for 2000 (Bradshaw et al., 2004). Figure 27 shows age-standardized mortality rates for IHD, stroke, hypertensive heart disease and diabetes in 1984 to 1986 compared with 2000, by population group. These comparisons must be interpreted carefully as the estimates for 2000 have been adjusted for misclassification and underregistration of deaths, but those for 1984 to 1986 have not. The increase in IHD across all groups is likely to be a result of the adjustment for misclassification of ill-defined cardiac causes in 2000. From Figure 27, it appears that hypertensive disease and stroke increased dramatically in the black population. Diabetes mortality increased in all ethnic groups, but most in the black population. The increased rates in the black population may be an artefact of the adjustment for underregistration of deaths in the 2000 estimate.
IHD was the main cause of mortality among CVDs and diabetes in white males between 1949 and 1985 (Bradshaw et al., 1995). IHD mortality increased from 260 per 100 00 in 1949 to more than 300 per 100 000 between 1964 and 1979. It subsequently decreased from 312 per
100 000 in 1978 to 139 in 1989 (Walker, Adam and Küstner, 1993). IHD was also the main cause of CVD mortality in white females, although the rates were about half those of males.
IHD was the main cause of mortality among CVDs and diabetes in coloured males until 1969, when it was replaced by stroke (Bradshaw et al., 1995). There was a very large increase in mortality from IHD between 1958 and 1969; it then remained stable at about 150 per 100 000 until 1985. Stroke was the major cause of mortality in coloured females. Mortality from diabetes increased fourfold, from ten in 1949 to 40 in 1984.
IHD was the major cause of mortality from CVDs and diabetes in Indian males between 1949 and 1985, followed by stroke and diabetes (Bradshaw et al., 1995). During this period the mortality rates remained fairly constant, except that IHD increased to more than 250 per 100 000 and diabetes to more than 70 in 1985. Stroke was the major cause of mortality in Indian females. There was also a dramatic increase in the mortality rate from diabetes, from about 20 per 100 000 in 1949 to 70 in 1984.
These data seem to suggest that both IHD and stroke have high mortality rates and that hypertensive heart disease and diabetes may have been growing. IHD is particularly high for whites and Indians, while hypertensive heart disease and stroke are highest among the black population group.

Double burden of malnutrition in developing countries 287
FIGURE 27
Age-standardized mortality rates from hypertensive heart disease, stroke, IHD and diabetes, per 100 000 population, 1985 and 2000
Note: 2000 figures are adjusted for misclassification and underregistration of deaths, but not 1985 figures. 1985 figures for blacks are for urban blacks only. Sources: 1985 – Bradshaw et al., 1995; 2000 – Bradshaw et al., 2003.
Cancers In 2000, the South African National Burden of Disease Study (SANBDS) found that cancers as a group (the malignant neoplasms category) accounted for 41 691 deaths (7.5
Hypertensive heart disease
0
20
40
60
80
100
1985 2000
De
ath
s p
er
10
0 0
00
po
pu
latio
n
Stroke
0
20
40
60
80
100
120
140
160
1985 2000
De
ath
s p
er
10
0 0
00
po
pu
latio
n Black
White
Coloured
Indian
IHD
0
50
100
150
200
250
300
350
400
450
1985 2000
De
ath
s p
er
10
0 0
00
po
pu
latio
n
Diabetes
0
20
40
60
80
100
120
1985 2000
De
ath
s p
er
10
0 0
00
po
pu
latio
n
Black
White
Coloured
Indian

Dietary changes and the health transition in South Africa: implications for health policy 288
percent of all deaths), ranking them the fourth leading cause of death for all people and the second leading cause of death for people aged 60 years and over (Bradshaw et al., 2003). In males, trachea/bronchi/lung (also referred to as lung) cancer accounted for 22.5 percent of all cancer deaths, followed by oesophageal cancer (17.2 percent). Among the top causes of cancer deaths in females were cancer of the cervix (17.9 percent), breast (15.7 percent) and lung (10.9 percent).
Lung cancer There have been marked increases in mortality rates for lung cancer among males of all population groups, with those among whites increasing almost threefold between 1949 and 1979, while those among coloured males increased even more dramatically. Smaller increases are seen among females. In 1984, 34.5 percent of all white deaths could be attributed to smoking-related diseases, compared with 24.5 percent for Indians, 14.5 percent for coloureds and 3.9 percent for blacks (Yach and Townshend, 1988).
From 1984 to 1986 the age-standardized mortality for lung cancer was highest in coloured urban males (88.4/100 000), followed by white urban males (48.7/100 000), black urban males (27.9/100 000) and Indian urban males (21.8/100 000) (Bradshaw et al., 1995). National age-standardized death rates for 2000 (not disaggregated by urban/rural residence) showed that coloured males had the highest rates (82.1/100 000), followed by white males (54.3/100 000). In 2000, the age-standardized death rates of black males and females were 33.4 and 6.0 per 100 000, respectively (Bradshaw et al., 2003).
The differences in smoking rates among the population groups at different stages of the tobacco epidemic, as well as the gender differences, are reflected in the age-specific death rates for lung cancer. (It is important to note, however, that these death rates reflect exposure to tobacco in the past.) In the older age groups, black men had lower rates than coloured and white men, but the lung cancer death rates in black males in the 35 to 44 years and 45 to 54 years age groups were higher than those in the white population. This, however, is not seen in black women, who have lower lung cancer death rates at all ages.
Oesophageal cancer In South Africa, the incidence of oesophageal cancer has been increasing since the 1950s, with the risk being much higher than the national average for those living in the Eastern Cape, particularly in rural areas of the former Transkei “homeland”. Since the mid-1980s, the incidence of oesophageal cancer has decreased, as shown by a declining proportion of oesophageal cancers over time in the National Cancer Registry. The reasons for these secular trends remain uncertain.
There are marked differences among population groups, with the highest incidence rates in the African population. The National Cancer Registry recorded a shift from oesophageal cancer as the leading cancer among African males in 1995, to prostate cancer in 1996 to 1999. Oesophageal cancer then became the second leading cancer in African males (with an age-standardized incidence rate [ASR] of 14.1/100 000), who had a lifetime risk of developing oesophageal cancer of 1 in 59.0 in 1999. Among African females (with an ASR 7.0/100 000), oesophageal cancer was the third leading cancer (after cervical and breast cancers), and the lifetime risk was 1 in 113 (Mqoqi et al., 2004).
Because of its poor prognosis, oesophageal cancer contributes significantly to cancer mortality. In South Africa, it was the second leading cause of cancer deaths in males (17.2 percent of all male cancer deaths) and the fourth leading cause in females (10 percent). It was the leading cause of male cancer deaths in the African population (age-standardized mortality rate 43.5/100 000) and the second leading cause – after cervical cancer – in African females

Double burden of malnutrition in developing countries 289
(16.5/100 000), with relatively young age groups affected and rates increasing steadily from the 35 to 44 years age group (Bradshaw et al., 2003).
The main risk factors for oesophageal cancer are tobacco use and alcohol consumption, and the joint effect of these is multiplicative (Tuyns, Pequinot and Jensen, 1979; Day, 1984; IARC, 1988). Other possible risk factors include poor socio-economic conditions, poor nutritional intake and a diet lacking in vitamins A and C, riboflavin, nicotinic acid, magnesium and zinc (Cook-Mozaffari et al., 1979; Van Rensburg, 1981). Contamination of maize with Fusariumverticillioides (previously known as Fusarium moniliforme) and the consequent ingestion of mycotoxins (possibly fumonisins) produced by this fungus may also play a role.
Breast cancer In South Africa from 1984 to 1986, breast cancer age-standardized mortality rates were highest among coloured urban females (26.4/100 000) (Figure 28), followed closely by whites (26.0/100 000) and then urban Indians (14.6/100 000); black urban females had the lowest rates (9.6/100 000) (Bradshaw et al., 1995). In 2000, the age-standardized mortality rates appeared to have increased since 1984 to 1986, although the 2000 national rates were not available by urban/rural residence, and the rate in urban females was probably higher than the national average. As before, the age-standardized death rates for white females were almost threefold those of blacks: whites had the highest rates (33.0/100 000), followed closely by coloureds (31.0/100 000) and Indians (27.4/100 000); black females had the lowest rates (12.1/100 000) (Bradshaw et al., 2003).
However, the age-specific death rates indicate that black females aged 35 to 44 years have very similar rates to those in the corresponding white, coloured and Indian population groups, and it is only in the older age groups that black females have far lower rates. This pattern is also evident in terms of incidence.
FIGURE 28
Age-standardized mortality rates for females from breast cancer, 1985 and 2000
Note: 2000 figures are adjusted for misclassification and underregistration of deaths, but not 1985 figures. 1985 figures for blacks are for urban blacks only. Sources: 1985 – Bradshaw et al., 1995; 2000 – Bradshaw et al., 2003.
Black females consistently also had the lowest breast cancer incidence rates. In 1999, the national ASR in blacks was 18.4 per 100 000, compared with 76.5 for coloured and white females (Mqoqi et al., 2004). The differences in rates are more pronounced in older age groups; in the younger age groups, the incidence rates in black females are closer to those of white and coloured females.
The risk of breast cancer is clearly associated with high socio-economic status, and women with higher education or income are at higher risk (Parkin et al., 2003). These differences may be because of differences in the distribution of risk factors among social classes, such as
0
5
10
15
20
25
30
35
1985 2000
De
ath
s p
er
10
0 0
00
po
pu
lation
Black
White
Coloured
Indian

Dietary changes and the health transition in South Africa: implications for health policy 290
reproductive factors and other known risk factors for breast cancer, including alcohol, diet, smoking, body weight, physical activity and genetic factors. Increased body weight has been found to increase the risk of breast cancer, whereas physical activity has been found to be beneficial in reducing the breast cancer risk at all ages.
Colorectal cancer Cancers of the colon and rectum are the second most common malignancy in affluent societies, but are rarer in developing countries. In South Africa, colorectal cancer was the sixth leading cancer among males (5.3 percent) and the fifth among females (6.6 percent) in terms of deaths (Bradshaw et al., 2003). In 1999, colorectal cancer comprised 3.7 percent of all cancer cases in males and 3.4 percent in females, ranking third and fifth in females and males, respectively. The ASR for colorectal cancer in women was 6.6 per 100 000, while males had a higher rate of 9.7 (Mqoqi et al., 2004).
Colorectal cancer was the second leading cause of cancer deaths in the South African white population. The age-standardized death rate was more than five times greater in this population (21.1/100 000) than in the black population (4.1/100 000). Colorectal cancer incidence rates were also highest among white males and females. In 1999, colorectal cancer was the second leading cancer in white males and females in terms of incidence. Coloured males and females had the second highest rates, followed by Indian males and females, with the lowest rates reported in black males and females. The rates in white males (ASR of 25.4/100 000) are more than eight times those found in black males (3.0/100 000), while those in white females (17.5/100 000) are about seven times those in black females (2.3/100 000) (Mqoqi et al., 2004).
Age-specific incidence rates by population group suggest an increased risk in younger black South Africans, probably caused by changing lifestyle and diet, resulting in a reduction in the incidence gap observed in elderly South Africans. Although there is an almost tenfold difference in incidence among the older age groups (75 years and over), at younger ages the incidence rates among the black, white and coloured population groups are almost the same.
A diet high in energy (calories), rich in animal fat and poor in vegetables, fruit and fibre is associated with increased risk. Smoking, meat and alcohol consumption are known risk factors, while consumption of fruit and vegetables and physical activity are known to be protective. Hence, the importance of a healthy lifestyle cannot be overemphasized in the prevention of cancers.
COMMUNICABLE DISEASE BURDEN Human immunodeficiency virus/acquired immune deficiency syndrome (HIV/AIDS) The prevalence of HIV among pregnant women attending public sector clinics has been surveyed annually to monitor trends. The surveys show that prevalence has increased from 0.8 percent in 1990 to 27.9 percent in 2003, reflecting a remarkable spread of the epidemic within a decade (Figure 29). It is estimated that in 2004, about 12 percent of the total population was infected with the virus (Dorrington et al., 2004), and that by 2000 HIV/AIDS had become the biggest single cause of death in South Africa (Dorrington et al.,2004).
Prior to 2004, AIDS treatment was available only in the private sector, which restricted its use to people with medical insurance or sufficient money to pay for costly medication. In 2004, the government adopted a treatment five-year plan to roll-out anti-retroviral therapy in the public sector with the aim of meeting at least 80 percent of the need. The ASSA2002 model shows that in 2004 approximately 5 million people were HIV-positive, and 500 000 were AIDS-sick.

Double burden of malnutrition in developing countries 291
Allowing for the impact of the treatment intervention, the number of infected people is projected to peak in 2013 and then decrease slowly, while the number of AIDS-sick people increases slowly. It is further predicted that in 2015 the number of AIDS-sick people will be about three-quarters of a million, with a projected 5.4 million-plus HIV-positive people. Currently, about 10 percent of HIV-positive people are AIDS-sick, and this will rise to just less than 13 percent.
Figure 30 shows that the projected total number of deaths increased as a result of the gradual increase in non-AIDS deaths and the rapid increase in AIDS deaths during the late 1990s. In 2004, the model estimates 389 000 non-AIDS deaths and 311 000 AIDS deaths. The total deaths in 2004 were 701 000, i.e., about 44 percent of total deaths were AIDS deaths. The proportion of AIDS deaths to total deaths is fairly constant over the time span depicted in Figure 30.
FIGURE 29
Prevalence of HIV as determined by antenatal surveys, 1990 to 2002
Source: Health Systems Trust, 2004.
FIGURE 30
Projected annual numbers of AIDS and non-AIDS deaths, 1985 to 2025
Source: ASSA2002 (ASSA, 2004).
0
200,000
400,000
600,000
800,000
1,000,000
1985
1988
199
1
1994
199
7
200
0
2003
200
6
2009
2012
2015
2018
202
1
2024
A IDS deaths (in the y ear s tarting 1 July)Non-A IDS deaths (in the y ear s tarting 1 July)Total number of deaths
0
5
10
15
20
25
30
35
40
45
50
1990 1991 1992 1993 1994 1995 1996 1997 1998 1999 2000 2001 2002
Pe
rce
nt

Dietary changes and the health transition in South Africa: implications for health policy 292
Tuberculosis Tuberculosis (TB) has been an important disease in South Africa for many years, affecting workers, particularly miners, and poor communities. Despite national treatment programmes, TB has been among the leading causes of death, accounting for more than 5 percent of all deaths in 2000. This has been exacerbated by the HIV/AIDS epidemic, with TB being the common opportunistic infection among HIV-positive people.
In 2002, there were an estimated 243 000 cases of TB in South Africa, making it the country with the seventh highest number of TB cases. The number of TB cases, as well as the number of new smear cases, nearly doubled between 1996 and 2002 (Figure 31). The rise in the number of reported TB cases since the inception of the National TB Control Programme in 1996 reflects a real increase in the number of cases, as well as improved case detection and reporting. The real increase in the number of cases is largely because of the rising prevalence of HIV. HIV infection is now the main single risk factor for TB, and in 2003/2004 more than half the smear-positive TB patients were HIV-positive.
FIGURE 31
Numbers of TB, pulmonary TB and new smear cases reported, 1996 to 2000
0
50000
100000
150000
200000
250000
1996 1997 1998 1999 2000 2001 2002
Nu
mb
er
of ca
se
s
All TB cases Pulmonary TB New smear positive cases
Reproduced by permission of Health Systems Trust. Originally published in Bamford, L., Loveday, M. & Verkuijl, S. 2004. Tuberculosis. In P. Ijumba, C. Day, and A. Ntuli, eds. South African Health Review 2003/04. Durban, Health Systems Trust.
Malaria Malaria affects only the northern and northeastern regions of South Africa. Systematic control efforts introduced in the late 1940s and good access to treatment have generally kept the disease in check. In contrast to most other countries in sub-Saharan Africa, malaria is not a major cause of death in South Africa.
For the period 1976 to 1995, annual reported malaria cases ranged from 2 000 to 13 000 per year. In 1996, slightly more than 27 000 cases were reported, rising to more than 60 000 in 2000. The number of notified malaria cases decreased considerably thereafter (Figure 32). The malaria vectors’ resistance to existing pesticides, as well as antimalarial drug resistance, in part caused the dramatic increases in numbers of cases and deaths from malaria. Changes in the drugs and insecticide used contributed to the subsequent significant decrease in malaria morbidity and mortality in South Africa in subsequent years.

Double burden of malnutrition in developing countries 293
FIGURE 32
Annual notified malaria cases and deaths, 1971 to June 2003
Reproduced by permission of Health Systems Trust. Originally published in Moonasar, D., Johnson, C.L., Maloba, B., Kruger, P., le Grange, K., Mthembu,J. & van den Ende, J. 2004. Malaria. In P. Ijumba, C. Day, and A. Ntuli, eds. South African Health Review 2003/04. Durban, Health Systems Trust.
Diarrhoeal disease SANBD found that diarrhoea accounted for nearly 3 percent of all deaths in South Africa in 2000. However, death rates for diarrhoeal disease vary by province, ranging from 12 per 100 000 in the Western Cape to more than 60 in Limpopo Province (Figure 33). The average rates for South Africa are about 42 per 100 000 for males and slightly fewer for females. Clearly, in some provinces deaths from diarrhoea still make a significant contribution, affecting infants, children and the elderly in particular. Serious cholera outbreaks have occurred in recent years, affecting areas where there are poor water supplies and no sanitation. However, the case fatality rates during these outbreaks have been remarkably low.
FIGURE 33
Mortality from diarrhoeal diseases in children, by province and sex
Diarrhoeal disease
0
10
20
30
40
50
60
70
Easte
rn
Cape
Fre
e S
tate
Gaute
ng
Kw
a-Z
ulu
Nata
l
Lim
popo
Mpum
ala
nga
Northern
Cape
North W
est
Weste
rn
Cape
South
Afric
a
Death
s p
er 100 0
00
Male Female
Source: SANBDS 2000 in Bradshaw et al., 2004.
0
10000
20000
30000
40000
50000
60000
70000
1971
1973
1975
1977
1979
1981
1983
1985
1987
1989
1991
1993
1995
1997
1999
2001
2003
Time (years)
Nu
mb
er o
f ca
ses
0
50
100
150
200
250
300
350
400
450
500
Nu
mb
er o
f d
eath
s
Total no malaria cases Total no malaria deaths

Dietary changes and the health transition in South Africa: implications for health policy 294
SUMMARY Current burden of disease The data presented show that South Africa has a quadruple burden of disease: 1) continuation of the infectious diseases associated with underdevelopment, poverty and undernutrition; 2) an emerging epidemic of chronic diseases linked to overnutrition and Western types of diet and lifestyle; 3) the explosive HIV/AIDS epidemic; and 4) the continued burden of injury-related deaths. In 2000, NCDs accounted for 37 percent of deaths, and HIV/AIDS and infectious diseases together for 44 percent (Bradshaw et al.,2003). CVD and diabetes together accounted for 19 percent of total deaths, and cancers for a further 7.5 percent. In contrast, nutritional deficiencies related to undernutrition accounted for 1.2 percent of deaths. In terms of mortality from chronic diseases, in 2000 IHD and stroke accounted for 123 and 124 per 100 000 deaths, respectively, while hypertensive heart disease and diabetes accounted for 68 and 54 per 100 000 deaths, respectively (Bradshaw et al., 2004).
Current nutritional status of the population Undernutrition and its associated outcomes of stunting and underweight are still prevalent in children. In 1999, 22 percent of children aged one to nine years in South Africa were stunted, and 10 percent were underweight-for-age (Labadarios et al., 2000). However, at the same time, 17 percent of children were overweight and obese (BMI 25) (Steyn et al.,2005). In adults the prevalence of obesity (BMI 30) was very high in 1998, particularly in women, among whom it ranged from 21 to 31 percent in different population groups (Department of Health, SAMRC and Measure DHS+, 2002). In white males, the prevalence of obesity was 21 percent, while it was less than 10 percent in the other population groups; the prevalence of overweight (BMI 25) was 20 percent in all males. Underweight (BMI < 18.5) was less than 6 percent in the adult female population and 13 percent in males (Department of Health, SAMRC and Measure DHS+, 2002). Hence, both under- and overnutrition coexist in South Africa, and sometimes even in the same household, where a child is stunted and a parent/carer overweight or obese.
Micronutrient deficiencies are also still prevalent in children; in 1994, 39 percent of 0- to five-year-olds were marginally vitamin-A deficient and 25 percent had low iron stores (SAVACG, 1995). Iodine deficiency was still found to be prevalent in some provinces in 1998 (Immelman, Towindo and Kalk, 2000). No national data on biochemical deficiencies are available for adults, but numerous localized studies have shown high prevalence of iron deficiency in women (Kruger et al., 1994; Dannhauser et al., 1999) and of VAD, particularly in HIV-infected adults (Kennedy-Oji et al., 2001; Visser et al., 2003).
Current dietary intake patterns of the population National dietary intake data are only available for children aged one to nine years (Labadarios et al., 2000). The main findings from NFCS 1999 were that many children were deficient in energy and numerous micronutrients (vitamins A and C, niacin, vitamin B6, calcium, iron and zinc), and deficiency prevalence rates were always higher in rural areas. A few localized surveys provide some trends on dietary intake in adults. Studies in the white (Wolmarans et al., 1988), coloured (Langenhoven, Steyn and van Eck, 1988) and Indian (Wolmarans et al., 1999) populations showed that mean carbohydrate intakes were less than 55 percent of total energy, mean fat intakes more than 30 percent, and added (free) sugar intakes more than 10 percent. Rural blacks (Steyn et al., 2001) had a prudent diet with a mean fat intake of less than 20 percent of total energy, carbohydrate intake of more than 60 percent and free sugar intake of less than 10 percent. Urban blacks, on the

Double burden of malnutrition in developing countries 295
other hand, had mean intakes that lay between the extremes of the Western diet and the rural prudent diet (Bourne et al., 1993; Steyn et al., 2001). In the urban upper-income black group (MacIntyre et al., 2002) mean fat intake was more than 30 percent of total energy. Studies on dietary trends in urban blacks showed that the mean intake of fat increased from 24 to 32 percent of total energy among those aged 19 to 44 years as the time they spent in the city increased, while mean carbohydrate intakes decreased from 61 to 53 percent (Bourne, 1996). These trends are typical of the nutrition transition that is taking place.
CURRENT POLICIES AND STRATEGIES FOR ADDRESSING NUTRITION PROBLEMS IN SOUTH AFRICA Programmes to improve protein-calorie malnutrition and undernutrition Since the inauguration of the democratic government in 1994, the nutritional status of children has received a great deal of attention from the new government, which made child nutrition one of the cornerstones of its Reconstruction and Development Programme. A great deal of focus was placed on the high prevalence of stunting and underweight found in preschool children, as reported by SAVACG (1995). The Nutrition Directorate of the Department of Health subsequently developed an Integrated Nutrition Programme for South Africa in an attempt to deal with some of the critical issues related to undernutrition and infectious diseases (Department of Health, 1998). As part of this strategy, certain focus areas were devoted to improving the nutritional status of children and decreasing the prevalence of PEM nationally (Nutrition Directorate, 2001).
The most crucial focus area of this strategy is contributing to household food security with the objective of alleviating short-term hunger among primary schoolchildren. A school feeding programme was introduced into schools with needy learners in 1994 and about 5 million learners a year benefit annually from this. Despite many initial problems, a qualitative survey has indicated that the programme makes a major social contribution to schools in terms of difficult-to-measure qualities such as children being more alert and benefiting intellectually (McCoy, 1997).
Additionally, there are three more focus areas in the Integrated Nutrition Programme aimed at dealing with the development and consequences of undernutrition. These are: 1) disease-specific nutrition support, treatment and counselling; 2) growth monitoring and promotion; and 3) promotion of breastfeeding. These are implemented at the primary health care level, where infants and children are brought for routine immunizations and pregnant women come for antenatal and post-natal care. The main objectives of health policy-makers are to reduce the prevalence of low birth weight from 8.3 percent nationally and to reduce the prevalence of stunting and underweight in children from 21.6 and 10.3 percent, respectively, in 1999 to 18 and 8 percent, respectively, in 2007 (Nutrition Directorate, 2001).
Another aspect of dealing with undernutrition and dietary deficiencies has been the development and promotion of food-based dietary guidelines in South Africa. The Nutrition Directorate has adopted 11 guidelines, which were developed by a national working group (Love et al., 2001) to promote healthy eating habits in the child and adult populations. Paediatric guidelines to be introduced in the near future are currently being tested.
HIV/AIDS is another focus area to receive much support in terms of promoting nutrition. Recently, the Nutrition Directorate has implemented an intervention programme aimed at people with TB and/or HIV/AIDS. The objective of this strategy is to provide an energy-dense meal and micronutrient supplements to people who qualify for the scheme. Nutritional guidelines are already available for such patients (Nutrition Directorate, personal communication, 2005).

Dietary changes and the health transition in South Africa: implications for health policy 296
Programmes to improve micronutrient status The Department of Health has been successful regarding the implementation of fortification schemes to eliminate micronutrient deficiencies in the South African population. The iodization of salt became compulsory in 1995, and the fortification of maize and wheat flour in October 2003. The latter have to be fortified so as to deliver 33 percent of the RDA per serving at the point of consumption (National Food Fortification Task Group, 1998; 2002). The fortificants added are vitamin A, thiamine, riboflavin, niacin, folic acid, vitamin B6, iron and zinc. Nutrition support for women and children is provided by health care workers at primary care facilities and includes vitamin A and iron supplementation and health promotion aimed at improving diets (Nutrition Directorate, 2001). Adoption of the food-based dietary guidelines will also contribute to eliminating micronutrient deficiencies because one of the guidelines encourages dietary diversity and increased consumption of fruit and vegetables (Love et al., 2001).
Programmes to prevent and manage nutrition-related chronic diseases The Global Strategy on Diet, Physical Activity and Health has clearly indicated that every government has a primary steering and stewardship role in initiating and developing its own national strategy for the prevention and management of chronic diseases through a strategy for diet, physical activity and health. National circumstances determine the priorities in the development of such strategies (WHO, 2004).
In 1996 the Department of Health instituted the Directorate of Chronic Diseases, Disabilities and Geriatrics, and the first director was appointed. This marked the start of a period during which NCDs were prioritized at national- and provincial-level departments of health. For the first time, provinces appointed people responsible for NCDs; this can be seen as a milestone in the organization of long-term care delivery in the South African health system (C. Kotzenberg, personal communication, 2005).
In support of this initiative, the Department of Health has embarked on a surveillance programme, incorporating health indicators such as BMI, physical inactivity and blood pressure. A nationally representative survey (SADHS) was undertaken in 1998 and repeated in 2003/2004, in order to provide a way of monitoring secular trends for these health indicators in response to the national health strategy.
The Nutrition Directorate has also supported the development of strategies for nutrition-related chronic diseases. In the late 1990s, the department initiated a consultative process to develop a series of guidelines for the prevention and management of NCDs (separate guidelines are available for the prevention and management of diabetes, hypertension, hyperlipidaemia and overweight). In this regard it has set strategic objectives aimed at reducing the prevalence rates of obesity from 9.3 percent in males and 30.1 percent in females in 2000 to 7 and 25 percent, respectively (Nutrition Directorate, 2001). To date, however, there is no clear indication of how these targets will be achieved in terms of strategies at the primary care level.
There are also initiatives within the Ministries of Sport (Sport and Recreation South Africa) and Education, which provide a policy and programme framework that supports the strategic priorities for health care. Sport and Recreation South Africa is responsible for devising and implementing sport and recreation policy in South Africa, specifically targeting increased mass participation and sports development. This mandate is reflected in the theme of the ministerial White Paper on Sport and Recreation in South Africa, which is “getting the nation to play”.
The Directorates of Health Promotion and Chronic Diseases have also recognized the need to encourage physical activity, in particular among older adults, and have initiated guidelines for promoting “active ageing” (1999). More recently, in November 2004, the Directorate of Health Promotion in the Department of Health launched an intersectoral strategy aimed at promoting

Double burden of malnutrition in developing countries 297
healthy lifestyles and change from risky behaviour, particularly among youth. This forms part of a plan for comprehensive health care in South Africa, and is one of the strategic priorities for the period 2004 to 2009 (Nutrition Directorate, 2001).
Future policy needs to address the nutrition transition The rising prevalence of obesity in South Africa gives cause for grave concern because of the increased risk of diabetes and CVD (WHO/FAO, 2003). As well as direct costs, which may be as high as 6.8 percent of total health care costs, there are also indirect costs such as workdays lost, doctor visits, impaired quality of life and premature mortality (WHO/FAO 2003). Over the last three decades, many chronic diseases have featured significantly in terms of overall morbidity and mortality. This is particularly so for IHD, hypertensive disease, stroke, diabetes, chronic obstructive pulmonary diseases, lung, oesophageal, breast and colorectal cancers.
In addition, communicable diseases are still major causes of mortality and morbidity in South Africa, and should remain priorities on the health agenda. The death rates from infectious diseases such as HIV/AIDS, TB and diarrhoeal disease are still high, and in the case of HIV and TB increasing. In addition, both under- and overnutrition are coexisting. It is important that health care policy-makers do not neglect any of these areas of concern and, despite the immediate pressure for relief against infectious diseases, the government should also be looking for long-term solutions for chronic diseases. The first step in this regard will be prevention, and it is most feasible that prevention efforts should be aimed mainly at children.
Children are important targets for health interventions. It is increasingly recognized that the occurrence of adult chronic diseases is influenced by factors operating throughout the life course (Kuh and Schlomo, 2004). Increased risk may start in infancy, or even before birth, and continues to be influenced by health-related behaviours during childhood. Hence, future policies should focus on inculcating healthy behaviours in children, where feasible. Some recommendations for policies that can be adopted and implemented are presented in the following paragraphs.
Fiscal policies and levies Swinburn et al. (2004) highlighted the importance of introducing fiscal policies that influence the food supply in order to ensure that the population has access to safe and affordable foods that discourage the intake of high-fat/-sugar products. Another option in this regard would be for the government to introduce small levies on certain high-fat/-sugar foods, including such items as soft drinks and crisps.
School-based intervention programmes Schools are an established setting for health promotion activities and have the advantage of influencing health-related beliefs and behaviours early in the “health career” so that they become established as adult patterns. Children in schools also represent a large population who are present and accessible over prolonged periods in a setting that is relatively sheltered and where education and learning are the norm. Influencing children in their formative years is a potential mechanism for influencing the emerging culture and health beliefs of society.
An additional potential benefit of school-based health promotion is that by improving the health of schoolchildren, educational performance and learning may be enhanced. A large body of evidence indicates that positive educational outcomes are closely linked to good health in schoolchildren. These positive outcomes include classroom performance, school attendance, participation in school activities and student attitudes (Symons et al., 1997).

Dietary changes and the health transition in South Africa: implications for health policy 298
The importance of school health promotion programmes for the prevention of chronic diseases was underlined in a recent scientific statement by the American Heart Association (Hayman et al., 2004), which recommended that: “All schools should implement: evidence-based, comprehensive, age-appropriate curricula about cardiovascular health, methods for improving health behaviours, and the reduction of CVD risk; and age-appropriate and culturally sensitive curricula on changing students’ patterns of dietary intake, physical activity, and smoking behaviours.” An intervention programme to prevent smoking in adolescents is currently being tested at some schools in South Africa (P. Reddy, personal communication, 2005). It is hoped that this may lead to the introduction of similar strategies aimed at diet and physical activity.
Food labelling and claims Food labelling is currently being revised by the Department of Health, and new regulations are expected for the end of 2005 (Booyzen, Directorate of Food Control, personal communication, 2005). These new regulations are more informative than the present ones, and will provide consumers with detailed nutrition information. In future, consumers will be able to determine whether the products they purchase and consume comply with recommendations for a healthy diet, particularly in terms of fats, free sugars and sodium. Furthermore, the regulatory framework will minimize misleading food, health and nutrition claims. However, consumers need to be educated about these regulations and about how to select healthy foods accordingly. Clearly, the Nutrition Directorate of the Department of Health, together with the Directorate of Food Control, will need to plan and implement specific strategies to do this.
Marketing and advertising standards To date there have been no regulations regarding the marketing of energy-dense foods to children. Ideally it is hoped that in the near future there will be bans on the television advertising of energy-dense, high-fat and high-sugar foods to young children, particularly because this has been shown to be an effective way of persuading children to make undesirable and unhealthy choices (Swinburn et al., 2004).
Policies aimed at improving the environment Intersectoral action is required in order to modify the environment so that physical activity and a healthy diet are promoted and enhanced in schools, workplaces and communities. This should include limiting the exposure of young children to heavy marketing of energy-dense, micronutrient-poor foods, which can be done by introducing school policies that prohibit the presence of vending machines and unhealthy food sales in schools, crèches and after-school centres. Furthermore, it is essential that food items that are included in the primary school meal programme are healthy. It is also important to ensure that children have safe and adequate space at school and in the community for playing sports and games that promote physical activity. The onus rests with employers to make workplaces encouraging of physical activity and to provide healthy foods and meals.
Nutrition health logos In South Africa the Heart Foundation and the Cancer Association provide their logos to food products that meet certain specified health and nutrition standards. In doing so, these associations are raising the awareness of consumers and manufacturers about the value of using healthy foods. The Department of Health should encourage this trend in an effort to persuade the food industry of the benefits of producing healthier food and meal options.

Double burden of malnutrition in developing countries 299
Nutrition education programmes at primary health care facilities It is important that the food-based dietary guidelines initiated by the Nutrition Directorate be given priority as a tool for nutrition education, and be incorporated into primary health care programmes and school curricula. As these guidelines also cater for overnutrition and promote healthy eating habits for all South Africans, they need to be implemented by all departments and district health authorities, with an important emphasis on avoiding both over- and undernutrition.
Furthermore, it has been found that health professionals working at the primary care level have inadequate knowledge about nutrition and lifestyle modification regarding NCDs; their basic training therefore needs to be updated in this regard (Talip et al., unpublished data, 2005).
CONCLUSIONS The following important findings regarding nutrition and chronic diseases need to be kept high on the health agenda. First, it should be recognized that malnutrition (both under- and overnutrition) is prevalent in all ethnic groups in South Africa, and poor diet – together with other unhealthy behaviours – leads to the development of a substantial (and growing) burden of chronic diseases. Second, it should be recognized that many children and adults in South Africa have unhealthy lifestyles with high intakes of energy, total fat and added sugar, and low intakes of fruit and vegetables. Many people are inactive, smoke cigarettes and have high intakes of alcohol. In order to reduce the burden of chronic diseases over the next few decades these unhealthy behaviours need to be addressed now.

Dietary changes and the health transition in South Africa: implications for health policy 300
REFERENCES Archer, S., Bromberger, N., Nattrass, N. & Oldham, G. 1990. Unemployment and labour market issues – A beginner’s guide. In N. Nattrass and E. Ardington, eds. The political economy of South Africa. Cape Town, Oxford University Press. ASSA. 2004. ASSA AIDS and Demographic Models: AASA2002. AIDS Committee of ASSA. Available at: www.assa.org.za/. Actuarial Society of South Africa. Blaauw, D. & Gilson, L. 2001. Health and poverty reduction policies in South Africa. Johannesburg, Centre for Health Policy. Bourne, L.T. 1996. Dietary intake in an urban African population in South Africa – with special reference to the nutrition transition. University of Cape Town. (Ph.D. thesis) Bourne, L.T., Langenhoven, M.L., Steyn, K., Jooste, P.L., Laubscher, J.A. & van der Vyver, E. 1993. Nutrient intake in the urban African population of the Cape Peninsula, South Africa. The Brisk study. Cent. Afr. J. Medical, 39(12): 238–247. Bradshaw, D., Dorrington, R.E. & Sitas, F. 1992. The level of mortality in South Africa in 1985 – what does it tell us about health? S. Afr. Med. J., 82: 237–240. Bradshaw, D., Bourne, D., Schneider, M. & Sayed, R. 1995. Mortality patterns of chronic diseases of lifestyle in South Africa. In J. Fourie and K. Steyn, eds. Chronic diseases of lifestyle in South Africa, pp. 5–23. MRC Technical Report. Cape Town, SAMRC. Bradshaw, D., Groenewald, P., Laubscher, R., Nannan, N., Nojilana, B., Norman, R., Pieterse, D. & Schneider, M. 2003. Initial burden of disease estimates for South Africa, 2000. S. Afr. Med. J., 93(9): 682–688. Bradshaw, D., Nannan, N., Laubscher, R., Groenewald, P., Joubert, J., Nojilana, B., Norman, R., Pieterse, D. & Schneider, M. 2004. South African National Burden of Disease Study, 2000: Estimates of Provincial Mortality. Tygerberg, SAMRC. Cole, T.J., Bellizzi, M.C., Flegal, K.M. & Dietz, W.H. 2000. Establishing a standard definition for child overweight and obesity worldwide: international survey. BMJ, 320: 1240–1243. Cook-Mozaffari, P., Azordegan, F., Day, N.E., Ressicaud, A., Sabai, C. & Aramesh, B. 1979. Oesophageal cancer studies in the Caspian Littoral of Iran: Results of a case-control study. Br. J. Cancer, 39: 293. Dannhauser, A., Bam, R., Joubert, G. et al. 1999. Iron status of pregnant women attending the antenatal clinic at Pelonomi Hospital, Bloemfontein. S. Afr. J. Clin. Nutr., 12: 8–16. Day, N.E. 1984. The geographic pathology of cancer of the oesophagus. Br. Med. Bull., 40: 329–334. Department of Health. 1998. Integrated Nutrition Programme for South Africa. Summary of broad guidelines for implementation. Pretoria. Department of Health, SAMRC & Measure DHS+. 2002. South Africa Demographic and Health Survey 1998. Full report. Available at: www.doh.gov.za/facts/sadhs-f.html and www.doh.gov.za/facts/1998/sadhs98/. Department of Labour. 2002. Sectoral Determination 7: Domestic Worker Section of the Basic Conditions of Employment Act, No. 75 of 1997. Government Gazette No. 23732. Pretoria. Dorrington, R.E., Bradshaw, D., Johnson, L, & Budlender, D. 2004. The demographic impact of HIV/AIDS in South Africa. National indicators for 2004. Cape Town, Centre for Actuarial Research, SAMRC and ASSA. Ewing, J.A. 1984. Detecting alcoholism. The CAGE questionnaire. JAMA, 252: 1905–1907. FAO. 2004. Food balance sheets. Available at: www.fao.org/faostat. FAO/WHO. 2002. Human vitamin and mineral requirements. Report of a Joint FAO/WHO Expert Consultation. Rome. Gelderblom, D. & Kok, P. 1994. Urbanisation: South Africa's challenge. Volume 1: Dynamics. Pretoria, HSRC Publishers. Hayman, L.L., Williams, C.L., Daniels, S.R., Steinberger, J., Paridon, S., Dennison, B.A. & McCrindle, B.W. 2004. Cardiovascular health promotion in the schools. AHA Scientific Statement. Circulation, 110: 2266–2275.Health Systems Trust. 2004. South African Health Review, 2003/4. Durban. HSRC. 2003. Synthesis report on social and economic impacts of government programmes since 1994.Prepared for the Policy Coordination and Advisory Services, Office of the President. Pretoria, Human Sciences Research Council (HSRC) Publishers. IARC. 1988. Alcohol drinking. IARC Monographs on the Evaluation of the Carcinogenic Risk of Chemicals to Humans No. 44. Lyon, France, WHO, International Agency for Research on Cancer (IARC).

Double burden of malnutrition in developing countries 301
Immelman, R., Towindo, T. & Kalk, W.J. 2000. Report of the South African Institute for Medical Research (SAIMR) on the Iodine Deficiency Disorder Survey of Primary School Learners for the Department of Health, South Africa. Johannesburg, SAIMR. Jooste, P.L., Steenkamp, H.J., Benadé, A.J.S. & Rossouw, J.E. 1988. Prevalence of overweight and obesity and its relation to coronary heart diseases in the CORIS study. S. Afr. Med. J., 74: 101–104. Kennedy-Oji, C., Coutsoudis, A., Kuhn, L., Pillay, K., Mburu, A., Stein, Z. & Coovadia, H. 2001. Effects of vitamin A supplementation during pregnancy and early lactation on body weight of South African HIV-infected women. J. Health Popul. Nutr., 19(3):167–176. Kok, P., O’Donovan, M., Bouare, O. & Van Zyl, J. 2003. Post-apartheid patterns of internal migration in South Africa. Pretoria, HSRC Publishers. Kruger, M., Dhansay, M.A., Van Staden, E. et al. 1994. Anaemia and iron deficiency in women in the third trimester of pregnancy receiving selective iron supplementation. S. Afr. J. Food Sci. Nutr., 6: 132–137. Kuh. D.J.L. & Schlomo, B.Y. 2004. A life course approach to chronic disease epidemiology. Oxford, UK, Oxford University Press. Kustner, H.G.V. 1987. First RHOSA Nutrition Study: Anthropometric assessment of nutritional status in black under-fives in rural South Africa. Epidemiological Comments, 14(3): 1–32. Labadarios, D., Steyn, N.P., Maunder, E., MacIntyre, U., Swart, R., Gericke, G., Huskisson, J., Dannhauser, A., Vorster, H.H. & Nesamvuni, E.A. 2000. The National Food Consumption Survey (NFCS): Children aged 1–9 years, South Africa, 1999. Pretoria, Department of Health. Langenhoven, M.L, Steyn, K. & van Eck, M. 1988. The food and meal pattern in Cape Peninsula coloured population. Ecol. Food Nutr., 22: 107–116. Love, P., Maunder, E., Green, M., Ross, F., Smale-Lovely, J. & Charlton, K. 2001. South African food-based dietary guidelines: Testing of the preliminary guidelines among women in KwaZulu-Natal and the Western Cape. S. Afr. J. Clin. Nutr., 14: 9–19. Lubbe, A.M. 1973. Nutritional status of Pretoria schoolchildren from four racial groups. S. Afr. Med. J., 47: 679–688. MacIntyre, U.E., Kruger, H.S., Venter, C.S. & Vorster, H.H. 2002. Dietary intakes of an African population in different stages of transition in the North West Province, South Africa: the THUSA study. Nutr. Res., 22: 239–256. Martin, G., Steyn, K. & Yach, D. 1992. Beliefs about smoking and health and attitudes toward tobacco control measures. S. Afr. Med. J., 82: 241–245. May, J. 1998. Poverty and inequality in South Africa. Summary report. Available at: www.polity.org.za/html/govdocs/reports/poverty.html. May, J. 2004. Poverty, social policy and the social wage. Paper presented at a conference on The Politics of Socio-Economic Rights in South Africa: 10 years after Apartheid. Oslo, 8 to 9 June. McCoy, D. 1997. An evaluation of the Primary School Nutrition Programme. Durban, Health Systems Trust. Mostert, W.P., Hofmeyr, B.E., Oosthuizen, J.S. & Van Zyl, J.A. 1998. Demography: Textbook for the South African student. Pretoria, HSRC Publishers. Moultrie, T.A. & Timæus, I.M. 2003. The South African fertility decline: Evidence from two censuses and a Demographic and Health Survey. Population Studies, 57(3): 265–283. Mqoqi, N.P., Kellett, P., Madhoo, J. & Sitas, F. 2004. Cancer in South Africa: Incidence of histologically diagnosed cancer in South Africa, 1996–1997. Johannesburg, National Cancer Registry Report, National Health Laboratory Service. National Food Fortification Task Group. 1998 and 2002. Reports. Pretoria, Department of Health. Nel, J.H. & Steyn, N.P. 2002. Report on South Africa food consumption studies undertaken amongst different population groups (1983–2000): Average intakes of foods most commonly consumed. Available at: www.sahealthinfo.org/nutrition/scientific.htm. Nojilana, B., Norman, R., van Blerk, L. & Dhansay, A. in press. Estimating the burden of vitamin A deficiency in South Africa. Nutrition Directorate. 2001. Integrated Nutrition Programme Strategic Plan 2001/02 to 2006/7. Pretoria, Department of Health, Nutrition and Provincial Nutrition Units. Parkin, D.M., Ferlay, J., Hamdi-Chériff, M., Sitas, F., Thomas, J.O., Wabinga, H. & Whelan, S.L.2003. Cancer in Africa: Epidemiology and prevention. IARC Scientific Publication No.153. Lyon, France, IARC Press. Popkin, B.M. 2001. The nutrition transition and obesity in the developing world. J. Nutr., 131(3): 871S–873S. Reddy, S.P., Panday, S., Swart, D., Jinabhai, C.C., Amosun, S.L., James, S., Monyeki, K.D., Stevens, G., Morejele, N., Kambaran, N.S., Omardien, R.G. & Van den Borne, H.W. 2003. The 1st South African National Youth Risk Behaviour Survey 2002. Cape Town, SAMRC.

Dietary changes and the health transition in South Africa: implications for health policy 302
Reddy, P., Meyer-Weitz Abedian, I., Steyn, K. & Swart, D. 1998. Implementable strategies to strengthen comprehensive tobacco control in South Africa: Towards an optimal policy intervention mix. MRC Policy Brief. Cape Town, SAMRC. Richardson, B.D. 1977. Underweight – a nutritional risk. S. Afr. Med. J., 51: 42–48. Rossouw, J.E., du Plessis, J.P., Benadé, A.J.S., Jordaan, P.C., Kotze, J.P., Jooste, P.L. & Ferreira, J.J.1983. Coronary risk factor screening in three rural communities. S. Afr. Med. J., 64: 430–436. SAVACG. 1995. Children aged 6–71 months in South Africa, 1994: Their anthropometric, vitamin A, iron and immunization coverage status. Stellenbosch, University of Stellenbosch and South African Vitamin A Consultative Group (SAVACG). Seedat, Y.K., Mayet, F.G.H., Khan, S., Somer, S.R. & Joubert, G. 1990. Risk factors for coronary heart diseases in the Indians in Durban. S. Afr. Med. J., 78: 447–454. Statistics South Africa. 2003. Census 2001: Census in brief. Report No. 03-02-03 (2001). Pretoria. Steyn, K., Jooste, P., Langenhoven, M.L., Benadé, A.J., Rossouw, J.E., Steyn, M., Jordaan, P.C. & Parry, C.D. 1985. Coronary risk factors in the coloured population of the Cape Peninsula. S. Afr. Med. J.,67: 619–625. Steyn, K., Jooste, P.L., Bourne, L., Fourie, J., Badenhorst, C.J., Bourne, D.E., Langenhoven, M.L., Lombard, C.J., Truter, H., Katzenellenbogen, J., Marais, M. & Oelofse, A. 1991. Risk factors for coronary heart diseases in the black population of the Cape Peninsula. S. Afr. Med. J., 79: 480–485. Steyn, N.P., Senekal, M., Brits, S. & Nel, J.H. 2000. Urban and rural differences in dietary intake, weight status and nutrition knowledge of black female students. Asia Pacific J. Clin. Nutr., 9(1): 11–16. Steyn, N.P., Burger, S., Monyeki, K.D., Alberts, M. & Nthangeni, G. 2001. Variation in dietary intake of the adult population of Dikgale. S. Afr. J. Clin. Nutr., 14(4): 140–145. Steyn, N.P., Labadarios, D., Maunder, E., Nel, J. & Lombard C. 2005. Secondary anthropometric data analysis of the National Food Consumption Survey in South Africa: The double burden. Nutrition, 21: 4–13. Swinburn, B.A., Caterson, I., Seidell, J.C. & James, W.P.T. 2004. Diet, nutrition and the prevention of excess weight gain and obesity. PHN, 7(1A): 123–146. Symons, C., Cincelli, B., James, T.C. & Groff, P. 1997. Bridging student health risks and academic achievement through comprehensive school health programs. Journal of School Health, 6: 220–227.Terreblanche, S. 2004. A history of inequality in South Africa, 1652–2002. Pietermaritzburg, University of Natal Press and KMM Review Publishing Company. Terreblanche, S. & Nattrass, N. 1990. A periodization of the political economy from 1910. In N. Nattrass and E. Ardington, eds. The political economy of South Africa. Cape Town, Oxford University Press. Tuyns, A.J., Pequinot, G. & Jensen, D.M. 1979. Role of diet, alcohol and tobacco in oesophageal cancer, as illustrated by two contrasting high-incidence areas in the North of Iran and West of France. Front.Gastrointest. Res., 4: 101–110. UNDP. 2001. Human Development Report 2001. New York. UNDP. 2003. South Africa Human Development Report 2003. The challenge of sustainable development in South Africa: unlocking people’s creativity. Cape Town, Oxford University Press. Van Rensburg, S.J. 1981. Epidemiologic and dietary evidence for specific nutritional predisposition to oesophageal cancer. J. Natl. Cancer Inst., 67: 243. Van Walbeek, C. 2005. The economics of tobacco control in South Africa. Cape Town, University of Cape Town, Department of Economics. (Ph.D. thesis) Visser, M.E., Maartens, G., Kossew, G. & Hussey, G.D. 2003. Plasma vitamin A and zinc levels in HIV-infected adults in Cape Town, South Africa. Br. J. Nutr., 89(4): 475–482. Vorster, H.H., Oosthuizen, W., Steyn, H.S., Van der Merwe, A.M. & Kotze, J.P. 1995. Nutrient intakes of white South Africans – a cause for concern: The VIGHOR Study. S. Afr. J. Food Sci. Nutr., 7(3): 119–126. Walker, A.R.P., Adam, A. & Küstner, H.G.V. 1993. Changes in total death rate and in ischaemic heart disease death rate in interethnic South African populations, 1978–1989. S. Afr. Med. J., 83: 602–605. WHO. 2003. The World Health Report 2002. Reducing risks, promoting healthy life. WHO Technical Report Series No. 916. Geneva. WHO. 2004. Global strategy on diet, physical activity and health. Fifty-Seventh World Health Assembly. Agenda item 12.6, 17 April. Geneva. WHO/FAO. 2003. Diet, nutrition and the prevention of chronic diseases. Report of a Joint WHO/FAO Expert Consultation. WHO Technical Report Series No. 910. Geneva. Wolmarans, P., Langenhoven, M.L., Benadé, A.J.S., Swanepoel, A.S.P., Kotze, T.J.W. & Rossouw, J.E. 1988. Intake of macronutrients and their relationship with total cholesterol and high-density lipoprotein cholesterol. The Coronary Risk Factor Study, 1979. S. Afr. Med. J., 73(9): 12–15.

Double burden of malnutrition in developing countries 303
Wolmarans, P., Langenhoven, M.L., van Eck, M. & Swanepoel, A.S.P. 1989. The contribution of different food groups to the energy, fat and fibre intake of the Coronary Risk Factors Study (CORIS) population. S. Afr. Med. J., 75: 167–171. Wolmarans, P., Seedat, Y.K., Mayet, F.G.H., Joubert, G. & Wentzel, E. 1999. Dietary intake of Indians living in the metropolitan area of Durban. Public Health Nutr., 2(1): 55–60. Yach, D. & Townshend, D. 1988. Smoking and health in South Africa: The need for action. Centre for Epidemiological Research in Southern Africa Technical Report No. 1. Cape Town, SAMRC.
* D
ivid
e th
is a
mou
nt b
y 36
5 to
obt
ain
the
dail
y pe
r ca
pita
ava
ilab
ility
.
AN
NE
X 1
: F
AO
FO
OD
BA
LA
NC
E S
HE
ET
S F
OR
SO
UT
H A
FR
ICA
, 196
2 T
O 2
001
1962
19
72
1982
19
92
2001
Pro
du
ct
kg
* kca
l P
ro
Fat
kg*
kcal
Pro
F
at
kg*
kcal
Pro
F
at
kg*
kca
l P
ro
Fa
t kg
kca
l P
ro
Fat
To
tal
2
60
3
68
.4
61
.2
2
81
9
74.6
66
.4
2
90
5
77
.1
66.0
2 7
90
75
.3
68.8
2 9
21
75.1
7
9.0
Ce
real,
exc
lud
ing b
eer
16
9.3
1
43
4
38
.7
10
.9
17
3.4
1
46
7
39.9
10
.7
18
6.1
1
57
6
43
.1
11.1
17
3.4
1 4
80
40
.0
10.5
1
87
.8
1 6
01
42.6
1
1.5
Sta
rch
y ro
ots
1
3.2
27
0.5
0
.0
22
.6
45
0.9
0
.1
25
.3
50
1.0
0
.1
24
.9
50
1
.0
0.1
29
.7
58
1.2
0
.1
Sug
ar
an
d
sw
eete
ne
rs
39.4
38
3
0.0
40
.5
394
0.0
39
.6
386
0.0
35
.5
34
6
0.0
32
.8
31
9
0.0
Puls
es
2.5
23
1.5
0
.1
3.4
32
2.1
0
.1
3.2
2
9
1.9
0
.1
4.0
3
7
2.4
0
.2
2.8
25
1.7
0
.1
Tre
e n
uts
0
.1
0
0.0
0
.0
0.1
1
0.0
0
.1
0.1
1
0.0
0
.1
0.2
1
0
.0
0.1
0.3
2
0.1
0
.2
Oil
cro
ps
1.1
12
0.5
1
.0
1.5
16
0.6
1
.4
1.1
1
1
0.5
0
.8
1.5
1
4
0.8
1
.1
2.2
23
1.4
1
.8
Veg
eta
ble
oils
5
.7
13
7
0.0
15
.6
7.3
1
76
0.0
19
.9
7.5
1
83
0.0
2
0.6
9
.4
22
9
0.0
2
5.9
14
.5
35
2
0.0
3
9.8
Veg
eta
ble
s
43.5
35
1.6
0
.3
46
.8
36
1.6
0
.3
52
.8
39
1.7
0
.3
46
.1
35
1
.5
0.4
44
.2
36
1.5
0
.3
Fru
its
24.1
26
0.3
0
.2
38
.0
41
0.5
0
.3
30
.3
37
0.4
0
.2
35
.4
42
0
.5
0.2
36
.0
41
0.5
0
.3
Stim
ula
nts
1
.7
5
0.4
0
.3
1.8
6
0.4
0
.4
1.3
5
0.3
0
.4
1.1
2
0
.2
0.1
1.1
3
0.2
0
.2
Spic
es
0.4
4
0.1
0
.1
0.4
4
0.2
0
.1
0.4
4
0.2
0
.1
0.3
3
0
.1
0.1
0.2
2
0.1
0
.1
Alc
oh
olic
be
vera
ge
s
43.8
84
0.3
79
.4
146
0.6
79
.1
144
0.6
64
.4
13
2
0.6
56
.8
10
4
0.5
Me
at
31.6
20
2
11
.9
16
.8
35
.4
221
1
3.3
18
.3
36
.8
222
14
.0
18.0
43
.0
24
6
16
.6
19.4
37
.5
20
4
14.4
1
5.8
Offa
l, e
dib
le
4.5
14
2.1
0
.5
4.1
13
2.0
0
.4
4.0
1
3
2.0
0
.4
3.9
1
2
1.9
0
.4
3.8
12
1.9
0
.4
Anim
al fa
ts
3.0
58
0.1
6
.6
2.0
40
0.0
4
.5
1.9
4
0
0.0
4
.5
1.2
2
6
0.0
2
.9
0.7
14
0.0
1
.5
Milk
7
8.0
13
4
7.0
7
.9
94
.8
149
8.3
8
.2
85
.8
134
7.5
7
.5
60
.3
97
5
.3
5.5
54
.1
85
4.7
4
.8
Egg
s
2.5
9
0.8
0
.7
3.6
14
1.1
1
.0
4.6
1
8
1.4
1
.2
4.7
1
8
1.5
1
.3
6.1
23
2.0
1
.6
Fis
h
5.5
14
2.5
0
.4
7.9
19
3.0
0
.7
8.7
1
5
2.3
0
.5
9.2
1
9
2.9
0
.8
7.9
16
2.4
0
.6