digital health most wired - dhinsights.org
TRANSCRIPT

With the goal of improving outcomes and enhancing the patient experience, HealthCare’s Most Wired research continues to evolve and push the healthcare market to improve in terms of technology adoption and care delivery. In 2020, the COVID-19 pandemic forced the accelerated deployment of healthcare technology and strategies and increased the importance of continued innovation. Healthcare organizations rose to the challenge, expanding adoption of supportive technologies in key areas such as patient engagement and population health management. This report explores these and other national trends uncovered in the 2020 Most Wired research.
The first six sections touch on insights from acute care and ambulatory care organizations, with a primary focus on acute care. Unless otherwise noted, trends in these sections were very similar across acute and ambulatory care. The last section is dedicated to long-term care organizations. Where available and applicable, trends from 2018 to 2020 are also highlighted.
235791011
Value-Based CarePopulation Health ManagementPatient EngagementClinician Remote Capabilities & Data AccessSecurityOther Acute & Ambulatory Care FindingsLong-Term Care Findings
DIGITAL HEALTH
MOST WIRED: NATIONAL TRENDS
2020Introduction
Table of Contents

Percentage of Total Revenue Coming from the Following Payment Models
Fee-for-Service
2020 (n=424)
Pay-for-Performance
Shared Savings (Upside risk only)
Shared Savings (Upside and downside risk)
Bundled Payments
Capitation
7%
74%
71%
8%
8%
5%5%
3%
7%
4%5%
3%
2019 (n=459)
Patient payment estimates are more important than ever amid the growing consumer mindset in healthcare. While vendors are still refining the accuracy and visibility provided by price transparency solutions, it is exciting that nearly two-thirds of measured organizations have adopted revenue cycle contract management capabilities to facilitate patient estimates. In 2019, the first year in which the Most Wired survey measured adoption of price transparency capabilities, only one capability—pricing lists for offered procedures/services—had been adopted by more than 30% of respondents. In 2020, adoption across capabilities rose by an average of 5.6 percentage points. Adoption of cost-burden estimates that are based on insurance type saw the biggest increase; these estimates give patients more accurate prices since coverage varies not only by insurance carrier but also by specific type of insurance. While ambulatory organizations are slightly more likely than acute care organizations to have adopted cost-burden estimates, they are less likely to have adopted pricing lists for offered procedures/services.
Price Transparency Capabilities Expanding
Percentage of Organizations Participating in the Following Payment Models
Capitation
Bundled Payments
Shared Savings (Upside and downside risk)
Shared Savings (Upside risk only)
Pay-for-Performance
Fee-for-Service
Mos
t Adv
ance
dLe
ast
Adv
ance
d 91%
62%
52%
43%
34%
28%
0% 100%
2020 (n=424) 2019 (n=459)
93%
59%
53%
42%
34%
25%
87%80%
27%
27%
27%
25%
35%
40%
35%
32%
17%
14%
16%
15%
14%
10%
7%
Price Transparency Capabilities Provided to Patients (via patient portal, app, website, etc.)
9%
List of procedures/services with associated price
Price comparison/filtering based on hospital/health system
Education regarding capabilities
Price comparison based on region
Definition of key terms
Price comparison based on insurance network
Price comparison/filtering based on procedure/service type
Integration tools that help facilitate healthcare-fundraising efforts and transparency
Cost-burden estimation based on insurance type
Price comparison based on insurance plan/type
No price transparency capabilities available
List of clinicians with associated prices
Price comparison/filtering based on clinician
2020 (n=425) 2019 (n=496)
0% 100%
9%
6%
5%
16%
13%
12%
12%
11%
2
Value-Based Care
In 2019, alternative payment models accounted for, on average, 26% of healthcare organizations’ revenue; in 2020, that percentage increased to 29%. This marginal growth is spread across payment models, with the largest increases in adoption—3 percentage points each—being for pay-for-performance (least advanced, least amount of risk) and capitation (most advanced, greatest amount of risk). Adoption of alternative payment models is similar between acute and ambulatory care organizations, but it is worth noting that a higher percentage of ambulatory organizations (by 3 percentage points) currently utilize pay-for-performance or capitation.
Amid this slow progress, one positive sign is consistent growth in the adoption of revenue cycle contract management capabilities (e.g., calculation of total cost of care, reconciliation of patient charges, etc.). Such tools support the use of alternative payment models, and in 2020, their adoption grew by an average of 9 percentage points (compared to 5.6 points from 2018 to 2019). Charge aggregation capabilities—which allow organizations to better organize bundled payments for different payers—saw slow adoption growth between 2018 and 2019 (up just 2 points), but in 2020, adoption increased by 12 percentage points.
Alternative Payment Models Still Slow to Be Adopted

Population Health Management: Activity Completion & Technology Deployment
Prioritized guidance on patient care gaps and statuses
Quality measures and analytics at the physician level (including MIPS, MACRA, etc.)
Tracking clinician usage of population health tools and activities
Full CRM (including integrated patient portal, patient outreach, patient education, and patient satisfaction solutions)
Targeting patients for outreach
Network-utilization tracking and network-optimization analysis
Total-cost-of-care analytics
Financial performance tracking under risk-based contracts
Chronic disease management
Care management workflow empowered with data-driven intelligence
Care-gap identification
Identification and tagging of patient groups to develop internal registries
Tailored advanced predictive/prescriptive analytics (i.e., AI, machine learning)
Prioritized worklist
Use of social care networks for SDOH referrals to community organizations
Tools to monitor care management performance
New question in 2020
New question in 2020
New question in 2020
Risk-based patient stratification
Data Aggregation
Participation in PHM ActivitiesTypes of Tools Used for PHM Activity2020 Data (n=425)
Data Analysis
Care Management
Administrative & Financial Reporting
Patient Engagement
Clinician Engagement
0%
100%0%
Aggregation of other data sources (social determinants of health, genomics, imaging data, etc.)
Reliable master patient index, including duplicate-record merging/deletion
Compilation of longitudinal record that includes clinical, claims, and care management data
0%100%
0% 100%0%100%
EHR Only 3rd Party Only Combination of Both2020 (n=425) 2019 (n=496)
80%
76%
62%
82% 93%
91%
72%
91%
87% 96%
96%84%
71% 92%
77%
68% 88%
90%67%
64%
85% 96%
95%80%
70%
92%
97%
88%65%
69%
88%
40%
91%
89%
79%
46%
89%
93%
96% 59% 7% 34%
53%11%36%
36% 16% 48%
36% 12% 52%
47%8%45%
37% 17% 46%
39%
53%5%42%
46%
44% 9% 47%
39%
39%
38%46%16%
28% 31% 41%
54%8%38%
57% 9% 34%
48%19%33%
47% 8% 45%
46%8%46%
59% 11% 30%
44%17%
20% 45% 35%
22%39%
50%4%
13%48%
Secure messaging among patients, care providers, and care managers
3
Population Health Management
In the last year, population health management (PHM) activity has advanced dramatically—across a broad swath of activities, use of PHM tools has increased by 18 percentage points on average. The categories with the most growth are administrative & financial reporting (23 points on average) and data aggregation (20 points on average). Individual activities with exceptional growth (>25 points) are spread across multiple categories—such activities include full customer relationship management, physician-level quality measures and analytics, and aggregation of less-common data types. The activities with the least growth relate to care gaps, which have historically been a challenge to identify and prioritize.
95% of organizations use either their EHR or a third-party solution for PHM. A few still use manual workflows for certain activities, but even in these cases, manual workflows are very rarely the primary, let alone the only, tool used. Social care networks used for social determinants of health (SDOH) referrals are the exception—20% of organizations still manage these networks solely through manual workflows. Across PHM activities, it is most common for organizations to use both their EHR and third-party solutions (on average, 44% of organizations do so), followed by the EHR only (39%). Only 17% of organizations use just a third party. The story is different when looking specifically at administrative and financial reporting activities. In this category, many more organizations (31%–46% depending on the activity) use solely a third-party solution.
Dramatic Growth in Population Health Management Activities

Top 5 Population Health Activities with Greatest Impact on Patient and Financial Outcomes
Financial OutcomesPatient Outcomes
Financial performance tracking under risk-based contracts
Total-cost-of-care analytics
Care-gap identification
Compilation of longitudinal record that includes clinical, claims, and care management data
Risk-based patient stratification
Care-gap identification
Risk-based patient stratification
Chronic disease management
Care management workflow empowered with data-driven intelligence
Compilation of longitudinal record that includes clinical, claims, and care management data
4
Three Things Impact Patient and Financial Outcomes: Care Gaps, Longitudinal Record, and Risk-Based Patient Stratification
Disease Registry Adoption Expanding the Population Health Foundation
The end goal of population health management is to improve patient and financial outcomes—so what activities have the biggest impact? Unsurprisingly, a variety of care management activities come up frequently for driving positive patient outcomes (e.g., the second, fourth, and fifth activities listed in the “Patient Outcomes” column on the right). But the individual activity most often identified as having the biggest impact on patient outcomes is the compilation of a longitudinal record. This is a data-aggregation activity, supporting the idea that positive outcomes depend on providers having the right patient data to work from. In addition to the top five activities listed, targeted patient outreach also has a solid impact on patient outcomes. Naturally, activities related to administrative and financial reporting are frequently cited as driving financial outcomes (e.g., the first and second activities in the “Financial Outcomes” column). It is interesting to note that network utilization tracking and network optimization analysis, other activities in the same category, also support financial outcomes. Ambulatory organizations report the same top five activities, with some variation in how the activities are ranked.
Having a comprehensive, accessible disease registry contributes to success with PHM activities. Today, about 90% of surveyed organizations (acute or ambulatory care), report having a disease registry; in 2019, that percentage was in the low 80s. And an increasing number of organizations have expanded the foundation of their PHM strategy by pulling in more data sources—across the various types of sources, use has increased by an average of 6.2 percentage points since 2019. This growth is happening among both acute and ambulatory care organizations. The largest increase has been for post–acute care data (up 13 points in the last year); however, despite its importance in the continuum of care, post–acute care data is still the least likely to be integrated. While the number of data sources contributing to disease registries has grown, organizations have struggled to also advance accessibility of that data at the point of care. Over the last year, accessibility of disease-registry data has declined by 3–8 percentage points; the exceptions are acute care EHR and billing data and payer/claims data, which remain at about the same levels as in 2019. The data sources with the biggest declines in point-of-care access are HIE data and ADT data.
95%
92%
96%
96%87%
80%
84%
76%
61%
61%
67%
61%
97%
93%
93%
92%
82%
75%72%
67%
73%
65%62%
49%
0%
Data Sources That Contribute to Disease Registry
Disease-Registry Data Accessible at Point of Care
2020 (n=361)2019 (n=412)
2020 (n=361)2019 (n=412)
100%
Disease Registry: Contributing Data Sources & Data Access at Point of Care
Ambulatory care EHR and billing system
Acute care EHR and billing system ADT feeds HIE Payer/claims data Post–acute care data
(continuum of care)
Trend -3 -7 -8 -6+4 +7 +5 +8 +13+1

8%
31%
61%
Telehealth UsageAverage Percent of Patients Who Have Used Telehealth Services
0% 1%–9%
2020 (n=395)
2019 (n=448)
10%–24% 25%+
0%
35%
24%
100%
2% 32%
7%
Location at Which Telehealth Services Are Offered, 2018–2020
Hospitals
Physician offices
Post–acute care facilities
Patient homes
100%
0%
202020192018
30%
72%
28%
16%20%
60%
8%
12%
49%
5%
18%
(n=618) (n=496)
Note: Most Wired research did not measure post–acute care facilities until 2019.
(n=425)
Hospitals
Addiction treatment and consulting
Physician offices
Consultations and office visits
Inpatient management
Pharmacologic management
Rehabilitation
Stroke care
Genetic counseling
Post–acute care facilities
eICU
Patient homes
Psychiatric examination/psychotherapy
(n=425)
20%–39% 10%–19% <10%40%–60%>60%
Types of Telehealth Services Offered—By Location of Service
Note: Use of telehealth for addiction treatment and consulting was not included in Most Wired research until 2019.
5
Patient Engagement
At the onset of the COVID-19 pandemic, many organizations responded to the new care and technology demands by accelerating and expanding their patient engagement strategies, especially regarding telehealth. In 2019, only about 3 in 10 organizations had more than 10% of unique patients using telehealth. In 2020, 2 in 3 organizations met that threshold, and about half of those report usage above 25%.
Telehealth Usage and Adoption Have More Than Doubled
Parallel to increased telehealth use, there has also been rapid growth in the number of organizations that offer telehealth services in different care settings and in the types of services that are available. In 2019, adoption of telehealth across different care settings grew by an average of 3 percentage points. But in 2020, adoption increased by an average of 33 percentage points. In fact, most settings saw telehealth adoption increase by around 40 points. Even in post–acute care settings—where the pace was much slower—adoption still more than doubled in the last year. Consultations and office visits continue to be some of the telehealth services most often deployed—across settings, 74% of organizations on average offer this service virtually (up 30 percentage points since 2019). The telehealth offerings with the most growth since 2019 are rehabilitation services (up 44 points) and medication management—including pharmacologic management and addiction treatment/counseling (each up 42 points).

Clinical Communication Abilities Offered through Patient Portal (Not including pilot programs)
100%
Note: Other clinical communication abilities adopted by >90% of interviewed organizations in 2020 are not shown. These include access to discharge instructions, access to patient information, access to test results, access to visit summaries, and secure messaging with care team.
0%
Appointment reminders
Access to immunization records
Access to bill payment/status
Prescription-renewal request tool
Sharing hospital admissions information with another provider
Access to electronic copy of medical record
Access to patient information in non-English language(s)
Ability to share electronic copy of medical record New question in 2020
New question in 2020
Self-scheduling tools for appointments and reminders
Ability to automatically add medical history elements to EMR
Access to family or care team education
Ability to complete questionnaires added directly to EHR
Ability to update insurance information
Access to OpenNotes
Access to family or care team education in non-English language(s)
Self-management tools for chronic conditions
Asynchronous provider visits for defined list of problems
2020 (n=425) 2019 (n=496)
89%
87%
86%
84%
81%
81%
80%
77%
74%
72%
70%
69%
68%
65%
61%
56%
56%
86%
82%
82%
80%
75%
74%
67%
72%
65%
65%
63%
59%
58%
55%
44%
Patient Portals and Mobile Apps Support Remote CareMany patients use mobile apps or patient portals (accessed through a mobile app or a browser) to participate in their care. Three-quarters of acute care organizations say that more than 25% of unique patients have accessed their patient portal in the last 12 months; the trend is similar for ambulatory care organizations. Historically, patient portals have given patients access to their health information and facilitated secure communication with care teams, and
Percent of Patients Who Accessed Patient Portal in Last 12 Months
25%+
10%–24%
1%–9%
0%
(n=396)
74%
18%
7%
1%
today more than 90% of organizations support these capabilities in the patient portal. Adoption of patient portal telehealth capabilities has seen the largest growth (up 12 points since 2019). However, telehealth remains one of the least-often deployed capabilities in the patient portal, across both acute and ambulatory care organizations.
Since smartphones are now ubiquitous, it is increasingly critical that healthcare organizations engage patients through mobile apps. On average, adoption of mobile app capabilities has increased about twice as much (8.7 percentage points) as adoption of patient portal capabilities. As with patient portals, the most dramatic growth in mobile apps relates to telehealth abilities—adoption of eVisits and virtual assistant capabilities is up 22 points year over year. In contrast with patient portal trends, telehealth is one of the more commonly adopted mobile app capabilities.
Mobile App Capabilities Offered to Patients
100%
Secure messaging
Prescription renewal
Text appointment reminders
Personal health record
Visit scheduling
eVisit/virtual assistant
Health library
Personal health tracker
Alerts from mobile health devices
Click-to-call contact directory
Real-time news and blog feed
Price list for different services
Wayfinding with floor plans and maps
ER wait times information
Electronic insurance card
No mobile app is available
84%
78%
77%
75%
74%
62%
53%
51%
49%
41%
32%
28%
26%
26%
24%
80%
73%
65%
65%
69%
40%
46%
42%
38%
27%
27%
20%
23%
19%
15%
4% 9%
2020 (n=425) 2019 (n=496)
Note: Patient portal capabilities within a mobile app have been adopted by >90% of interviewed organizations in 2020; as a result, this capability is not shown above.
0%
6

Data & Functions Clinicians Can Access Remotely outside Hospital Network
100%
60%
86%
72%74%
55%
71%
92%
83%
73%
62%
49%
22%
96% 95%
90%
82% 81%
75%
65%
33%
82%
0%Virtual patient
visitsPatient
communicationSecure messaging
via HISPClinician guidelines/
pathways or evidence-based order sets
Alerts/notifications for chronic patientsNew question in 2019
New question in 2019
New question in 2020New question in 2020
Data from connected implants or RFID/RTLS on
smart devices
Image sharing from other organizations
Secure texting Secure messaging using non-HISP
method
2020
(n=425)
2018
(n=618)
2019
(n=496)
Information Sent Directly from Patient-Monitoring Equipment to the EHR2020 (n=420) Fully deployed
Deployed (fully/partially combined) Not deployed
Partially deployed Not deployed
2019 (n=496)
In-bed scale data (acute care only) 11%
15% 7% 78%89%
Blood pressure83% 17%
77% 16% 7%
Fetal monitoring data (acute care only) 76% 24%
86% 7% 7%
Pulse oximetry82% 18%
78% 16% 6%
Blood glucose87% 13%89% 5% 6%
Lab tests79% 21%
91% 5%4%
EKG data81% 19%84% 8% 8%
Temperature71%
68% 16% 16%29%
Cardiovascular catheter output 58%
71% 7% 22%42%
Ventilator data51%
56% 13% 31%49%
Intracranial monitor data44%
60% 7% 33%56%
IV pump data27%30% 9% 61%
73%
0% 100%
7
Clinician Remote Capabilities & Data Access
Since 2018, nearly all organizations—acute and ambulatory—have reported that their clinicians have full access to the EHR and to imaging data when working remotely. However, other types of remote functions and data have been much less accessible—in 2019, only 64% of acute care organizations on average facilitated non-EHR, non-imaging access. With the sudden shift in healthcare delivery in 2020, remote access to additional functionality and data beyond EHR data and images has increased on average by 12 percentage points. Virtual patient visits saw the largest increase, followed by alerts and notifications for chronic patients—these functionalities have been vital for caregivers during the COVID-19 pandemic.
Clinician Access to Remote Functionality Has Increased
In 2019, 63% of organizations on average had various patient monitoring data being sent directly from equipment to the EHR, an increase of about 4 percentage points since 2018. Adoption of this type of integration (either fully or partially deployed) accelerated in 2020, increasing an average of 14 points. The trend applies to both acute and ambulatory care organizations. The largest year-over-year increases were for intracranial monitor data, cardiovascular catheter output, and ventilator data. Integrating these types of data with the EHR is critical to keeping clinicians accurately informed and reducing human error.
41% of both acute and ambulatory care organizations have integrated data—either fully or partially—from 10 or more of the equipment types in the chart to the left; just 8% (acute or ambulatory care) have integrated all types. 5% of acute care organizations and 10% of ambulatory care organizations are integrating data from fewer than 3 patient monitoring tools. This shows clear room for improvement in breadth of integration.
Patient Monitoring Integration Varies

Types of Clinical Alerts Sent from EHR-Integrated Surveillance System
Alerts to critical care units
Alerts to general medical-surgical units
Alerts to step-down units
79%
66%
58%
51%
27%
33%
44%
58%
68%
56%
63%
73%
Alert data tied to present-on-admission reporting
100%
0%
202020192018(n=618) (n=496) (n=425)
Fully Deployed Surveillance System Functionalities Integrated with EHR
Percent of Organizations with Multiple Surveillance Functionalities Deployed
Monitoring patient vital signs
Monitoring lab test results
Monitoring other clinical information
Sending electronic alerts to caregivers
Monitoring medication administration
0%
0%
100%
100%
76%
65%
63%
60%
59%
321 4 5Number of Functionalities Deployed:
53%18%10%11%8%
(n=425)
(n=425)
Outside Entities from Which Discrete CCD Data Can Be Consumed
100%0%
External hospital system
External physician practice
Health information exchange
External laboratory
Government agency
Retail pharmacy
Home health agency
Insurance company/payer
Skilled nursing/chronic care facility 77%
78%
80%
86%77%70%
88%
89%
94%88%82%
95%
60%
70%
67%60%
81%
83%
2020 (n=425) 2019 (n=496) 2018 (n=618)
85%89%
81%76% 86%
65%
New question in 2019
New question in 2019
New question in 2019
8
82% of Organizations Have Integrated Clinical Surveillance DataMost acute care organizations have integrated clinical surveillance systems with their EHR to facilitate accurate and timely clinician alerts. In 2020, 82% of organizations report having an EHR-integrated surveillance system, compared to 71% in 2019 and 65% in 2018. Organizations have also expanded the types of alerts their systems can deliver—adoption of different alert types has increased by 11 percentage points on average, with the largest increase being in alerts to critical care units. Just over half of organizations report deploying all five measured clinical surveillance functionalities; the remaining 47% have room for improvement as they work to incorporate additional functionality and information into their surveillance systems.
More Organizations Incorporating Discrete Data into EHRThe percentage of organizations that can consume discrete data from outside sources has steadily grown over the last few years, from 64% in 2018, to 70% in 2019, to 80% in 2020. Using discrete data ensures that patient information moves from facility to facility as specific values and in specific formats, helping maintain its accuracy. In 2020, 18% of organizations are still incorporating data as text blobs (this is a decrease of 7 percentage points from last year). Year-over-year growth in the ability to consume discrete data from various sources ranged from 5% to 13%. The sources with the highest growth are skilled nursing/chronic care facilities and home health agencies. In 2020, organizations were also asked what facility types they can send CCDs to. Interestingly, there are some gaps between sending and receiving capabilities with various entities—this may be because CCDs are not the only way to consume discrete data. Responding organizations are least likely to be able to send CCDs to external labs (70% have the capability), insurance companies/payers (71%), and retail pharmacies (72%).

Percent of Organizations with a Comprehensive Security Program
Comprehensive†
Non-comprehensive
2020 (n=425)
2019 (n=496)
34%
66%76%
24%
Note: 2019’s “HealthCare’s Most Wired: National Trends” report incorrectly stated that 30% of respondents had a comprehensive security program. The correct number was actually 24%. That error has been corrected in this report.
100%99%
99%
97%
93%
80%
92%
90%
81%
64%
61%
70%
100%
99%
96%
94%
93%
91%
85%
79%
74%
72%
Note: In 2019’s “HealthCare’s Most Wired: National Trends” report, organizations that reported their documented risk management program to the board were incorrectly counted as reporting to all levels of leadership, including executives and IT leaders. That error has been corrected in this report. Note: No new components of a comprehensive security program have been added to this research since 2019.
2020 (n=425)
2019 (n=496)
Adoption of Core Components of a Comprehensive Security Program
100%0%
Security deficiencies reported to board at least annually
Inventory of all business associates updated annually
Security workforce receives training/education
Tabletop exercise performed annually
Documented risk management program reported to board in a formal way
Dedicated cybersecurity committee
Risk assessment to identify compliance gaps and security vulnerabilities conducted at least annually
Designated CISO
Board is given security updates at least annually
Dedicated security operations center (SOC)
Security progress reported to board at least annually
Organizations with a comprehensive security program are more likely than their peers to have implemented various security measures to protect their organization (on average, adoption among those with a comprehensive program is 22 percentage points higher). They are also more likely (by 13 points) to participate in cybersecurity sharing groups. Across respondents, tool adoption for medical device security and next-generation end-point protection has
Both Technology and Cybersecurity Sharing Groups Enhance Security
† A comprehensive program entails adoption of all core components listed in the chart titled "Adoption of Core Components of a Comprehensive Security Program."
100%
Secure system baseline images
Inventory of authorized medical devices
Network access control—enforcement of devices joining network
Automated user-access provisioning systems
PKI/digital signature systems
Social engineering risk assessment performed at least annually
Governance, risk, and compliance (GRC) systems
Next-generation endpoint protection systems
Testing recovery plan (all tiers) performed at least annually
Medical device security tools
Anomalous network monitoring and analytics
Adaptive/risk-based authentication for network access
Adoption of Security MeasuresOrganizations with a comprehensive† security program: 2020 (n=144) 2019 (n=148)
2020 (n=281) 2019 (n=348)Organizations with a non-comprehensive security program:
0% 20% 40% 60% 80%
Since 2019, about one-third of interviewed organizations (acute and ambulatory care) have seen an increase in security-related incidents, and organizations have also increased their adoption of core security components (average increase of 5 percentage points). Some of the largest growth was seen in the
grown. Having dedicated security leadership is one of the biggest factors driving organizations with comprehensive programs to participate in cybersecurity sharing groups. One of the largest gaps between comprehensive and non-comprehensive organizations is participation in H-ISAC, one of the market’s leading cybersecurity sharing groups.
Participation in Information Sharing & Analysis Groups to Identify Security Threats/Vulnerabilities
0% 100%
Comprehensive† (n=144) Non-comprehensive (n=281)
89%80%
1%
69%61%
69%54%
51%34%
83%79%
82%52%
64%48%
43%23%
69%55%
49%44%
73%70%
Informal sharing in professional society
None
Commercial service providers (CSPs)
Department of homeland security
NCCIC
Informal sharing in HIT user groups
Health information sharing & analysis center (H-ISAC)
Cyber information sharing & collaboration program (CISCP)
HC3
HIE partners
HITRUST Alliance
State hospital associations
0%
percentage of organizations that report a documented risk management program to their board (up 15 points), along with components related to having dedicated security resources (e.g., security operations center and cybersecurity committee). Organizations with a comprehensive security program—i.e., those that have adopted all core components—are more likely to report getting a high impact from their security technologies compared to peers that don’t have a comprehensive program.
New question in 2020
9
Security
Comprehensive Security Program Adoption Has Increased
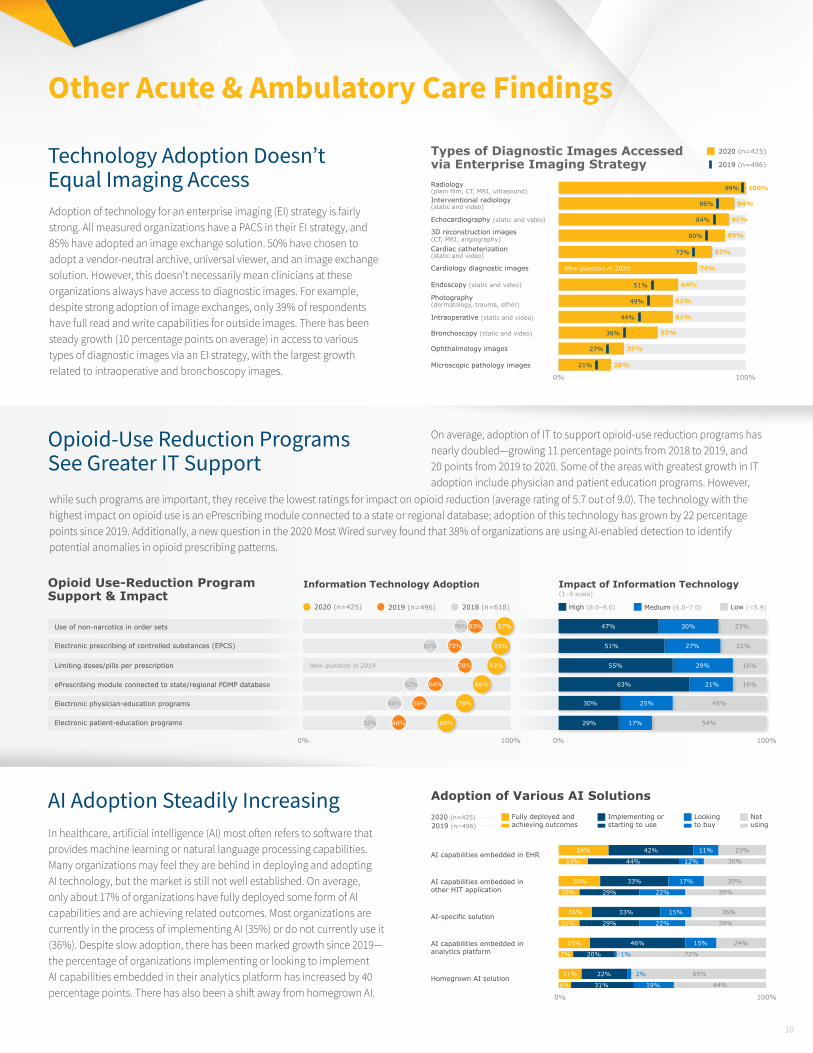
On average, adoption of IT to support opioid-use reduction programs has nearly doubled—growing 11 percentage points from 2018 to 2019, and 20 points from 2019 to 2020. Some of the areas with greatest growth in IT adoption include physician and patient education programs. However,
Opioid-Use Reduction Programs See Greater IT Support
Adoption of technology for an enterprise imaging (EI) strategy is fairly strong. All measured organizations have a PACS in their EI strategy, and 85% have adopted an image exchange solution. 50% have chosen to adopt a vendor-neutral archive, universal viewer, and an image exchange solution. However, this doesn’t necessarily mean clinicians at these organizations always have access to diagnostic images. For example, despite strong adoption of image exchanges, only 39% of respondents have full read and write capabilities for outside images. There has been steady growth (10 percentage points on average) in access to various types of diagnostic images via an EI strategy, with the largest growth related to intraoperative and bronchoscopy images.
Technology Adoption Doesn’t Equal Imaging Access
AI Adoption Steadily IncreasingIn healthcare, artificial intelligence (AI) most often refers to software that provides machine learning or natural language processing capabilities. Many organizations may feel they are behind in deploying and adopting AI technology, but the market is still not well established. On average, only about 17% of organizations have fully deployed some form of AI capabilities and are achieving related outcomes. Most organizations are currently in the process of implementing AI (35%) or do not currently use it (36%). Despite slow adoption, there has been marked growth since 2019—the percentage of organizations implementing or looking to implement AI capabilities embedded in their analytics platform has increased by 40 percentage points. There has also been a shift away from homegrown AI. 0% 100%
Adoption of Various AI Solutions2020 (n=425) Fully deployed and
achieving outcomesImplementing or starting to use
Looking to buy
Not using2019 (n=496)
AI-specific solution16% 33% 15% 36%
Homegrown AI solution11% 22% 2% 65%
AI capabilities embedded in other HIT application
20% 33% 17% 30%
30%
39%
39%
44%
72%
AI capabilities embedded in EHR24%
14%
10%
10%
6%
44%
29%
29%
31%
20%
12%
22%
22%
19%
1%
42% 11% 23%
AI capabilities embedded in analytics platform
15% 46% 15% 24%
7%
while such programs are important, they receive the lowest ratings for impact on opioid reduction (average rating of 5.7 out of 9.0). The technology with the highest impact on opioid use is an ePrescribing module connected to a state or regional database; adoption of this technology has grown by 22 percentage points since 2019. Additionally, a new question in the 2020 Most Wired survey found that 38% of organizations are using AI-enabled detection to identify potential anomalies in opioid prescribing patterns.
Types of Diagnostic Images Accessed via Enterprise Imaging StrategyRadiology (plain film, CT, MRI, ultrasound)Interventional radiology (static and video)
Echocardiography (static and video)
Photography (dermatology, trauma, other)
3D reconstruction images (CT, MRI, angiography)
Intraoperative (static and video)
Cardiac catheterization (static and video)
Cardiology diagnostic images
Bronchoscopy (static and video)
Endoscopy (static and video)
Ophthalmology images
Microscopic pathology images
0% 100%
86%
84%
80%
73%
51%
49%
44%
36%
27%
21%
99% 100%
94%
91%
89%
82%
74%
64%
61%
61%
53%
35%
28%
2020 (n=425)
2019 (n=496)
New question in 2020
Opioid Use-Reduction Program Support & Impact
Information Technology Adoption Impact of Information Technology
Electronic physician-education programs
Electronic patient-education programs
0% 0%100% 100%
2020 (n=425) High (8.0–9.0)
(1–9 scale)
2019 (n=496) Medium (6.0–7.0)2018 (n=618) Low (<5.9)
Electronic prescribing of controlled substances (EPCS)
ePrescribing module connected to state/regional PDMP database
Limiting doses/pills per prescription
Use of non-narcotics in order sets
16%
45%
54%
23%
22%95%73%61%
86%64%52%
78%56%44%
69%46%32%
93%78%
97%76% 83%
16%
29%
21%
25%
17%
30%
27%
55%
63%
30%
29%
47%
51%
New question in 2019
10
Other Acute & Ambulatory Care Findings

82% of responding long-term care organizations have a technology solution for chronic condition management—just slightly less than ambulatory organizations. The specific methods and tools used to manage chronic conditions in patient homes vary between long-term care and ambulatory settings. On average, more long-term care organizations (by 6.3 percentage points) manage chronic care via EHR integration or via medication compliance through secure email. Long-term care organizations particularly outpace ambulatory peers in using EHR integration for heart disease (higher by 14 points) as well as COPD and ESRD (by 10 points). In terms of medication compliance, the biggest gap is for obesity (higher adoption by long-term care organizations by 17 points). However, there is still improvement to be made in terms of real-time care management—on average, more ambulatory organizations utilize this approach for chronic conditions in patient homes (by 11.5 points).
Overall, Long-Term Care Behind Other Care Settings in Technology AdoptionLong-term care facilities tend to stand out for slower adoption of the various technologies and strategies measured in the Most Wired research. Compared to acute and ambulatory care organizations, long-term care organizations have particularly lower adoption (by 6–8 percentage points) in patient engagement, population health management, and clinical quality and safety (not highlighted specifically in this report). Lower reimbursements account for some of this discrepancy. However, long-term care organizations have strong adoption of certain technologies that are highly important to their particular setting and for their specific type of patient care. For example, tools like wander management (an
aspect of clinical quality and safety) are not necessarily applicable to ambulatory organizations but are crucial for most long-term care organizations and many acute care ones as well. Significantly more long-term care organizations compared to acute care organizations (a gap of 25 percentage points) have wireless technologies or applications to support wander management.
Slightly Higher Percentage of Long-Term Care Organizations Engaged in Complex Value-Based CareWhile the percentage of organizations engaged in fee-for-service contracts is similar across organization types (91% on average), the percentage of long-term care organizations involved in more complex value-based contracts is slightly above average. This is largely due to recent CMS regulations requiring post–acute care organizations to adopt value-based care with
Average Most Wired Overall Score†—By Facility Type
Acute care (n=425)
Ambulatory care (n=277)
50.0 100.0
Long-term care (n=47)
(100-point scale)
†The Most Wired Overall Score, given to all organizations participating in the Most Wired Survey, is calculated based on respondent answers to questions about a variety of healthcare technology topics.
67.8
67.7
63.9
Long-Term Care Ahead in EHR Integration for Chronic Condition Management
Percent of Organizations Participating in Complex Value-Based Care Payment Models
Shared savings (upside risk)
Bundled payments
Shared savings (upside and downside risk)
Capitation
52% 57%
47%
38%
15%
43%
34%
28%
Acute care (n=425)Long-term care (n=47)
0% 100%
patient-driven payment and grouping models. Long-term care organizations are more likely than acute care organizations to be engaged in shared savings with upside risk only, bundled payments, and shared savings with upside and downside risk (by 5, 4, and 4 percentage points, respectively). Compared to acute care organizations, long-term care organizations are nearly half as likely to be engaged in capitation—the most complex or high-risk alternative payment type.
Asthma
Behavioral health
Cancer
COPD
CHF
Diabetes
Heart disease
Hypertension
Obesity
Sickle cell anemia
ESRD
Manual entry of self-test results online
Submission of self-test results via internet-
enabled monitoring device
Medication management/compliance using
secure email
Real-time care management
EHR integration
75%+ 65%–74% 55%–64% 45%–54% 35%–44%
Long-Term Care Facilities’ Use of Care Management Tools—By Condition Type
<35%
(n=47)
11
Long-Term Care Findings

Telehealth Deployment Higher across Long-Term Care Facility Types Across long-term care facility types, 98% of organizations report that some portion of their patients have used telehealth services in the last 12 months. The locations in which telehealth is used and the types of services it is used for are very similar across acute and ambulatory care organizations, but a higher percentage of long-term care organizations use telehealth in each setting type except one (hospitals). Delivery is especially high in post–acute care facilities and in patient homes. Due to the specialized and extended nature of long-term care, it makes sense that long-term care organizations would be more likely to deploy telehealth in these settings. Regardless of organization type, telehealth services are least likely to be available in post–acute care settings. 0%
100%
Average Telehealth Deployment—By Location of Service
Physician offices Hospitals Post–acute care facilities
Patient homes
Acute care & ambulatory care (n=425)
Note: For a full list of what services are included under telehealth, see page 5. Note that for long-term care facilities, remote patient monitoring was also included as a possible telehealth service.
Long-term care (n=47)
Aver
age
tele
heal
th d
eplo
ymen
t
64%60%
69%72%
34%
18%
62%
49%
ABOUT
CHIMEThe College of Healthcare Information Management Executives (CHIME) is an executive organization dedicated to serving chief information officers (CIOs), chief medical information officers (CMIOs), chief nursing information officers (CNIOs), chief innovation officers (CIOs), chief digital officers (CDOs) and other senior healthcare IT leaders. With more than 2,900 members in 56 countries and over 150 healthcare IT business partners and professional services firms, CHIME provides a highly interactive, trusted environment enabling senior professional and industry leaders to collaborate; exchange best practices; address professional development needs; and advocate the effective use of information management to improve the health and care in the communities they serve. For more information, please visit chimecentral.org.
Powered by
12