dimensions - georgia · a ton o b omi a o eta ae a son eab oas eer t fannin a yette flo d forsth r...
TRANSCRIPT
Georgia Unemployment Rate(Seasonally Adjusted)
Georgia Employment (Seasonally Adjusted)
Baldwin
Banks
Barrow
Bartow
Burke
Butts
Carroll
Catoosa
Chattooga
Cherokee
Clarke
Clayton
Cobb
Columbia
Coweta
Dade
Dawson
DeKalbDouglas
Elbert
Fannin
Fayette
Floyd Forsyth
Franklin
Fulton
Gilmer
Gordon
Greene
Gwinnett
Haber-�sham
Hall
Hancock
Haralson
Hart
Heard
Henry
Jackson
Jasper
JeffersonJonesLamar
Lincoln
McDuffie
Madison
Meriwether Monroe
Morgan
Murray
Newton
Oconee OglethorpePaulding
Pickens
Pike
Polk
Putnam
Rabun
Richmond
Rock-�dale
Spalding
Stephens
Taliaferro
Towns
Troup
Union
Walker
Walton
Warren
Washington
White
Whitfield
Wilkes Edgefield,�
SC
Aiken,�
SC
Appling
Atkinson
Bacon
Ben Hill
Berrien
Brantley
CalhounClay CoffeeDougherty Irwin
Jeff �Davis
LeeLiberty
Long
McIntosh
Pierce
Quitman
Randolph Terrell
Tift
Turner
Ware
WayneWorth
Baker
BrooksCamden
CharltonClinch
ColquittCook
Early
Echols
Glynn
Lanier
Lowndes
MillerMitchell
ThomasDecatur GradySeminole
Bibb
Bleckley
Bryan
BullochCandlerChattahoo-� chee
Crawford
Crisp
DodgeDooly
Effingham
Emanuel
Evans
Glascock
HarrisJenkins
Johnson
LaurensMaconMarion
Montgomery
Muscogee
PulaskiSchley
Screven
Stewart Sumter
Talbot
Tattnall
Taylor
Telfair
Toombs
Treutlen
Twiggs
Upson
Webster WheelerWilcox
Wilkinson
Russell,�AL
Hamilton,�TN
Houston
Peach
Lumpkin
Chatham
D I M E N S I O N SMeasuring Georgia’s Workforce
Georgia Employment (Seasonally Adjusted)
Georgia Unemployment Rate(Seasonally Adjusted)
For more information, contactCorey Smith or Evan Cross at (404) 232-3875
[email protected]@gdol.ga.gov
Equal Opportunity Employer/Program•Auxiliary Aids and Services Available upon Request to Individuals with Disabilities
In millions
Workforce Statistics & Economic Research
November 2019 Data Volume XLV, Number 11
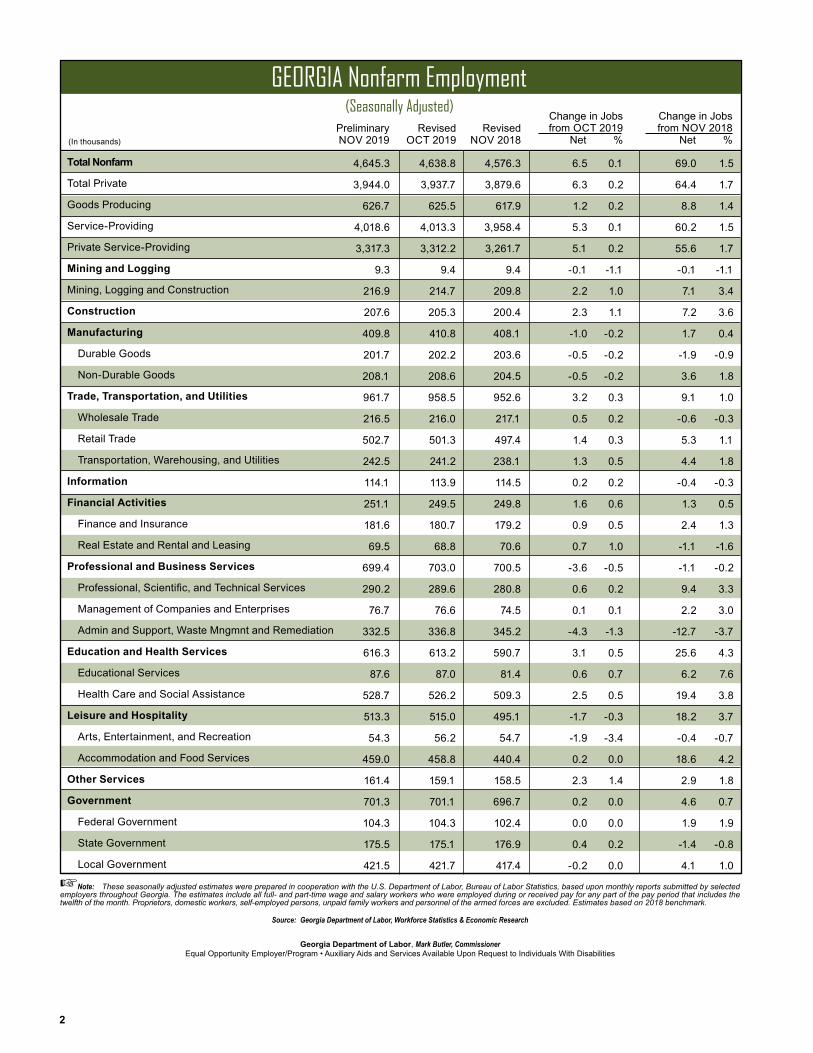
Total nonfarm employment in Georgia rose by 6,500 in November. Job sectors growing the most from October to November were Trade, Transportation, and Utilities; Education and Health Services; Construction; and Other Services. Professional and Business Services, Leisure and Hospitality, and Manufacturing employment de-clined the most over the month.
Trade, Transportation, and Utilities employment rose by 3,200 in November, marking the sixth consecutive month of job growth in the sector. The Retail Trade industry added 1,400 jobs, while Wholesale Trade added 500 workers, and Transportation, Warehousing, and Utilities employment was up 1,300 over the month. Education and Health Services saw employment grow by 3,100 in November as healthcare positions were up 2,500 over the month and education jobs grew by 600. After three straight months of cuts, Construction employment increased by 2,300 in November. Other Services employment also grew by 2,300 in November after the sector shed 1,100 jobs in October.
The number of Professional and Business Services jobs in the state declined by 3,600 in November. Administra-tive and Support Services cut 4,300 positions, Manage-ment of Companies grew by 100 jobs, and Professional and Technical Services added 600 workers to its payrolls over the month. Leisure and Hospitality employment declined by 1,700 in November after six consecutive months of growth. With Durable Goods and Non-Dura-ble Goods each cutting 500 jobs over the month, Manu-facturing jobs were down 1,000 in November after being down 2,000 in October.
Employment in Georgia has grown by 69,000, or 1.5 percent, over the year. Education and Health Services (+25,600 jobs); Leisure and Hospitality (+18,200 jobs); Trade, Transportation, and Utilities (+9,100 jobs); and Construction (+7,200 jobs each) have added the most jobs over the year.
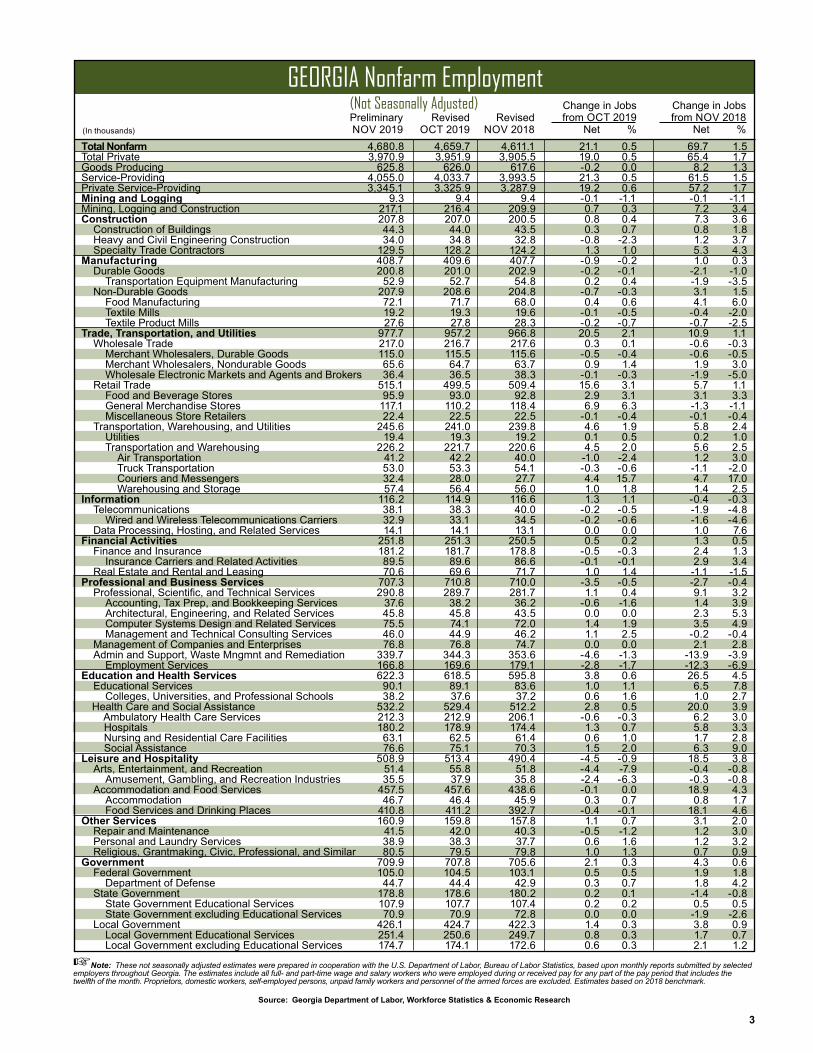
Georgia’s unemployment rate (seasonally adjusted) de-clined to 3.3 percent in November 2019 from 3.4 percent in October. Over the year, the unemployment rate is down from 3.7 percent in November 2018.
November 2019 Employment Situation
4.58 4.59 4.60 4.60 4.60 4.59 4.60 4.61 4.62 4.64 4.64 4.64 4.65
Nov-18 Dec-18 Jan-19 Feb-19 Mar-19 Apr-19 May-19 Jun-19 Jul-19 Aug-19 Sep-19 Oct-19 Nov-19
3.7% 3.7%
3.8%
3.9% 3.9%
3.8% 3.8%
3.7%
3.6% 3.6%
3.5%
3.4%
3.3%
Nov-18 Dec-18 Jan-19 Feb-19 Mar-19 Apr-19 May-19 Jun-19 Jul-19 Aug-19 Sep-19 Oct-19 Nov-19
2
Total Nonfarm
Total Private
Goods Producing
Service-Providing
Private Service-Providing
Mining and Logging
Mining, Logging and Construction
Construction
Manufacturing
Durable Goods
Non-Durable Goods
Trade, Transportation, and Utilities
Wholesale Trade
Retail Trade
Transportation, Warehousing, and Utilities
Information
Financial Activities
Finance and Insurance
Real Estate and Rental and Leasing
Professional and Business Services
Professional,Scientific,andTechnicalServices
Management of Companies and Enterprises
Admin and Support, Waste Mngmnt and Remediation
Education and Health Services
Educational Services
Health Care and Social Assistance
Leisure and Hospitality
Arts, Entertainment, and Recreation
Accommodation and Food Services
Other Services
Government
Federal Government
State Government
Local Government
(In thousands)
☞Note: These seasonally adjusted estimates were prepared in cooperation with the U.S. Department of Labor, Bureau of Labor Statistics, based upon monthly reports submitted by selected employers throughout Georgia. The estimates include all full- and part-time wage and salary workers who were employed during or received pay for any part of the pay period that includes the twelfth of the month. Proprietors, domestic workers, self-employed persons, unpaid family workers and personnel of the armed forces are excluded. Estimates based on 2018 benchmark.
Source: Georgia Department of Labor, Workforce Statistics & Economic Research
GEoRGiA Nonfarm Employment(Seasonally Adjusted)
Georgia Department of Labor, Mark Butler, CommissionerEqualOpportunityEmployer/Program•AuxiliaryAidsandServicesAvailableUponRequesttoIndividualsWithDisabilities
Change in Jobsfrom OCT 2019
Net %PreliminaryNOV 2019
RevisedOCT 2019
Change in Jobsfrom NOV 2018
Net %Revised
NOV 2018
4,645.3 4,638.8 4,576.3 6.5 0.1 69.0 1.5
3,944.0 3,937.7 3,879.6 6.3 0.2 64.4 1.7
626.7 625.5 617.9 1.2 0.2 8.8 1.4
4,018.6 4,013.3 3,958.4 5.3 0.1 60.2 1.5
3,317.3 3,312.2 3,261.7 5.1 0.2 55.6 1.7
9.3 9.4 9.4 -0.1 -1.1 -0.1 -1.1
216.9 214.7 209.8 2.2 1.0 7.1 3.4
207.6 205.3 200.4 2.3 1.1 7.2 3.6
409.8 410.8 408.1 -1.0 -0.2 1.7 0.4
201.7 202.2 203.6 -0.5 -0.2 -1.9 -0.9
208.1 208.6 204.5 -0.5 -0.2 3.6 1.8
961.7 958.5 952.6 3.2 0.3 9.1 1.0
216.5 216.0 217.1 0.5 0.2 -0.6 -0.3
502.7 501.3 497.4 1.4 0.3 5.3 1.1
242.5 241.2 238.1 1.3 0.5 4.4 1.8
114.1 113.9 114.5 0.2 0.2 -0.4 -0.3
251.1 249.5 249.8 1.6 0.6 1.3 0.5
181.6 180.7 179.2 0.9 0.5 2.4 1.3
69.5 68.8 70.6 0.7 1.0 -1.1 -1.6
699.4 703.0 700.5 -3.6 -0.5 -1.1 -0.2
290.2 289.6 280.8 0.6 0.2 9.4 3.3
76.7 76.6 74.5 0.1 0.1 2.2 3.0
332.5 336.8 345.2 -4.3 -1.3 -12.7 -3.7
616.3 613.2 590.7 3.1 0.5 25.6 4.3
87.6 87.0 81.4 0.6 0.7 6.2 7.6
528.7 526.2 509.3 2.5 0.5 19.4 3.8
513.3 515.0 495.1 -1.7 -0.3 18.2 3.7
54.3 56.2 54.7 -1.9 -3.4 -0.4 -0.7
459.0 458.8 440.4 0.2 0.0 18.6 4.2
161.4 159.1 158.5 2.3 1.4 2.9 1.8
701.3 701.1 696.7 0.2 0.0 4.6 0.7
104.3 104.3 102.4 0.0 0.0 1.9 1.9
175.5 175.1 176.9 0.4 0.2 -1.4 -0.8
421.5 421.7 417.4 -0.2 0.0 4.1 1.0
3
Total NonfarmTotal PrivateGoods ProducingService-ProvidingPrivate Service-ProvidingMining and LoggingMining, Logging and ConstructionConstruction Construction of Buildings Heavy and Civil Engineering Construction Specialty Trade ContractorsManufacturing Durable Goods Transportation Equipment Manufacturing Non-Durable Goods Food Manufacturing Textile Mills Textile Product MillsTrade, Transportation, and Utilities Wholesale Trade Merchant Wholesalers, Durable Goods Merchant Wholesalers, Nondurable Goods Wholesale Electronic Markets and Agents and Brokers Retail Trade Food and Beverage Stores General Merchandise Stores Miscellaneous Store Retailers Transportation, Warehousing, and Utilities Utilities Transportation and Warehousing Air Transportation Truck Transportation Couriers and Messengers Warehousing and StorageInformation Telecommunications Wired and Wireless Telecommunications Carriers Data Processing, Hosting, and Related ServicesFinancial Activities Finance and Insurance Insurance Carriers and Related Activities Real Estate and Rental and LeasingProfessional and Business Services Professional,Scientific,andTechnicalServices Accounting, Tax Prep, and Bookkeeping Services Architectural, Engineering, and Related Services Computer Systems Design and Related Services Management and Technical Consulting Services Management of Companies and Enterprises Admin and Support, Waste Mngmnt and Remediation Employment ServicesEducation and Health Services Educational Services Colleges, Universities, and Professional Schools Health Care and Social Assistance Ambulatory Health Care Services Hospitals Nursing and Residential Care Facilities Social AssistanceLeisure and Hospitality Arts, Entertainment, and Recreation Amusement, Gambling, and Recreation Industries Accommodation and Food Services Accommodation Food Services and Drinking PlacesOther Services Repair and Maintenance Personal and Laundry Services Religious, Grantmaking, Civic, Professional, and Similar Government Federal Government Department of Defense State Government State Government Educational Services State Government excluding Educational Services Local Government Local Government Educational Services Local Government excluding Educational Services
GEoRGiA Nonfarm Employment(Not Seasonally Adjusted)
(In thousands)
☞Note: These not seasonally adjusted estimates were prepared in cooperation with the U.S. Department of Labor, Bureau of Labor Statistics, based upon monthly reports submitted by selected employers throughout Georgia. The estimates include all full- and part-time wage and salary workers who were employed during or received pay for any part of the pay period that includes the twelfth of the month. Proprietors, domestic workers, self-employed persons, unpaid family workers and personnel of the armed forces are excluded. Estimates based on 2018 benchmark.
Source: Georgia Department of Labor, Workforce Statistics & Economic Research
Change in Jobsfrom OCT 2019
Net %PreliminaryNOV 2019
RevisedOCT 2019
Change in Jobsfrom NOV 2018
Net %Revised
NOV 2018 4,680.8 4,659.7 4,611.1 21.1 0.5 69.7 1.5 3,970.9 3,951.9 3,905.5 19.0 0.5 65.4 1.7 625.8 626.0 617.6 -0.2 0.0 8.2 1.3 4,055.0 4,033.7 3,993.5 21.3 0.5 61.5 1.5 3,345.1 3,325.9 3,287.9 19.2 0.6 57.2 1.7 9.3 9.4 9.4 -0.1 -1.1 -0.1 -1.1 217.1 216.4 209.9 0.7 0.3 7.2 3.4 207.8 207.0 200.5 0.8 0.4 7.3 3.6 44.3 44.0 43.5 0.3 0.7 0.8 1.8 34.0 34.8 32.8 -0.8 -2.3 1.2 3.7 129.5 128.2 124.2 1.3 1.0 5.3 4.3 408.7 409.6 407.7 -0.9 -0.2 1.0 0.3 200.8 201.0 202.9 -0.2 -0.1 -2.1 -1.0 52.9 52.7 54.8 0.2 0.4 -1.9 -3.5 207.9 208.6 204.8 -0.7 -0.3 3.1 1.5 72.1 71.7 68.0 0.4 0.6 4.1 6.0 19.2 19.3 19.6 -0.1 -0.5 -0.4 -2.0 27.6 27.8 28.3 -0.2 -0.7 -0.7 -2.5 977.7 957.2 966.8 20.5 2.1 10.9 1.1 217.0 216.7 217.6 0.3 0.1 -0.6 -0.3 115.0 115.5 115.6 -0.5 -0.4 -0.6 -0.5 65.6 64.7 63.7 0.9 1.4 1.9 3.0 36.4 36.5 38.3 -0.1 -0.3 -1.9 -5.0 515.1 499.5 509.4 15.6 3.1 5.7 1.1 95.9 93.0 92.8 2.9 3.1 3.1 3.3 117.1 110.2 118.4 6.9 6.3 -1.3 -1.1 22.4 22.5 22.5 -0.1 -0.4 -0.1 -0.4 245.6 241.0 239.8 4.6 1.9 5.8 2.4 19.4 19.3 19.2 0.1 0.5 0.2 1.0 226.2 221.7 220.6 4.5 2.0 5.6 2.5 41.2 42.2 40.0 -1.0 -2.4 1.2 3.0 53.0 53.3 54.1 -0.3 -0.6 -1.1 -2.0 32.4 28.0 27.7 4.4 15.7 4.7 17.0 57.4 56.4 56.0 1.0 1.8 1.4 2.5 116.2 114.9 116.6 1.3 1.1 -0.4 -0.3 38.1 38.3 40.0 -0.2 -0.5 -1.9 -4.8 32.9 33.1 34.5 -0.2 -0.6 -1.6 -4.6 14.1 14.1 13.1 0.0 0.0 1.0 7.6 251.8 251.3 250.5 0.5 0.2 1.3 0.5 181.2 181.7 178.8 -0.5 -0.3 2.4 1.3 89.5 89.6 86.6 -0.1 -0.1 2.9 3.4 70.6 69.6 71.7 1.0 1.4 -1.1 -1.5 707.3 710.8 710.0 -3.5 -0.5 -2.7 -0.4 290.8 289.7 281.7 1.1 0.4 9.1 3.2 37.6 38.2 36.2 -0.6 -1.6 1.4 3.9 45.8 45.8 43.5 0.0 0.0 2.3 5.3 75.5 74.1 72.0 1.4 1.9 3.5 4.9 46.0 44.9 46.2 1.1 2.5 -0.2 -0.4 76.8 76.8 74.7 0.0 0.0 2.1 2.8 339.7 344.3 353.6 -4.6 -1.3 -13.9 -3.9 166.8 169.6 179.1 -2.8 -1.7 -12.3 -6.9 622.3 618.5 595.8 3.8 0.6 26.5 4.5 90.1 89.1 83.6 1.0 1.1 6.5 7.8 38.2 37.6 37.2 0.6 1.6 1.0 2.7 532.2 529.4 512.2 2.8 0.5 20.0 3.9 212.3 212.9 206.1 -0.6 -0.3 6.2 3.0 180.2 178.9 174.4 1.3 0.7 5.8 3.3 63.1 62.5 61.4 0.6 1.0 1.7 2.8 76.6 75.1 70.3 1.5 2.0 6.3 9.0 508.9 513.4 490.4 -4.5 -0.9 18.5 3.8 51.4 55.8 51.8 -4.4 -7.9 -0.4 -0.8 35.5 37.9 35.8 -2.4 -6.3 -0.3 -0.8 457.5 457.6 438.6 -0.1 0.0 18.9 4.3 46.7 46.4 45.9 0.3 0.7 0.8 1.7 410.8 411.2 392.7 -0.4 -0.1 18.1 4.6 160.9 159.8 157.8 1.1 0.7 3.1 2.0 41.5 42.0 40.3 -0.5 -1.2 1.2 3.0 38.9 38.3 37.7 0.6 1.6 1.2 3.2 80.5 79.5 79.8 1.0 1.3 0.7 0.9 709.9 707.8 705.6 2.1 0.3 4.3 0.6 105.0 104.5 103.1 0.5 0.5 1.9 1.8 44.7 44.4 42.9 0.3 0.7 1.8 4.2 178.8 178.6 180.2 0.2 0.1 -1.4 -0.8 107.9 107.7 107.4 0.2 0.2 0.5 0.5 70.9 70.9 72.8 0.0 0.0 -1.9 -2.6 426.1 424.7 422.3 1.4 0.3 3.8 0.9 251.4 250.6 249.7 0.8 0.3 1.7 0.7 174.7 174.1 172.6 0.6 0.3 2.1 1.2

4
Total NonfarmTotal PrivateGoods ProducingService-ProvidingPrivate Service-ProvidingTrade, Transportation, and Utilities Retail TradeProfessional and Business ServicesLeisure and HospitalityGovernment Federal Government State Government Local Government
☞Note: These not seasonally adjusted estimates were prepared in cooperation with the U.S. Department of Labor, Bureau of Labor Statistics, based upon monthly reports submitted by selected employers in the Athens-Clarke County Metropolitan Statistical Area, which includes Clarke, Madison, Oconee and Oglethorpe counties. The estimates include all full- and part-time wage and salary workers who were employed during or received pay for any part of the pay period that includes the twelfth of the month. Proprietors, domestic workers, self-employed persons, unpaid family workers and personnel of the armed forces are excluded. Estimates based on 2018 benchmark.
Source: Georgia Department of Labor, Workforce Statistics & Economic Research
(Not Seasonally Adjusted)
(In thousands)
AthENS-ClARkE CoUNty MSA Nonfarm Employment
☞Note: These not seasonally adjusted estimates were prepared in cooperation with the U.S. Department of Labor, Bureau of Labor Statistics, based upon monthly reports submitted by selected employers in the Albany Metropolitan Statistical Area, which includes Baker, Dougherty, Lee, Terrell and Worth counties. The estimates include all full- and part-time wage and salary workers who were employed during or received pay for any part of the pay period that includes the twelfth of the month. Proprietors, domestic workers, self-employed persons, unpaid family-workers and personnel of the armed forces are excluded. Estimates based on 2018 benchmark.
Source: Georgia Department of Labor, Workforce Statistics & Economic Research
AlbANy MSA Nonfarm Employment
Total NonfarmTotal PrivateGoods ProducingService-ProvidingPrivate Service-ProvidingTrade, Transportation, and Utilities Retail TradeGovernment Federal Government State Government Local Government
(Not Seasonally Adjusted)
(In thousands)
PreliminaryNOV 2019
RevisedOCT 2019
Change in Jobsfrom OCT 2019
Net %
Change in Jobsfrom NOV 2018
Net %Revised
NOV 2018
101.9 101.6 101.5 0.3 0.3 0.4 0.4 72.3 72.1 70.3 0.2 0.3 2.0 2.8 10.1 10.1 10.1 0.0 0.0 0.0 0.0 91.8 91.5 91.4 0.3 0.3 0.4 0.4 62.2 62.0 60.2 0.2 0.3 2.0 3.3 16.8 16.5 16.8 0.3 1.8 0.0 0.0 11.3 11.1 11.1 0.2 1.8 0.2 1.8 9.3 9.4 9.3 -0.1 -1.1 0.0 0.0 11.8 11.8 11.3 0.0 0.0 0.5 4.4 29.6 29.5 31.2 0.1 0.3 -1.6 -5.1 1.1 1.1 1.2 0.0 0.0 -0.1 -8.3 20.5 20.5 22.0 0.0 0.0 -1.5 -6.8 8.0 7.9 8.0 0.1 1.3 0.0 0.0
63.7 63.4 63.8 0.3 0.5 -0.1 -0.2 51.5 51.2 51.3 0.3 0.6 0.2 0.4 7.0 7.0 7.1 0.0 0.0 -0.1 -1.4 56.7 56.4 56.7 0.3 0.5 0.0 0.0 44.5 44.2 44.2 0.3 0.7 0.3 0.7 12.0 11.8 12.5 0.2 1.7 -0.5 -4.0 7.6 7.4 7.9 0.2 2.7 -0.3 -3.8 12.2 12.2 12.5 0.0 0.0 -0.3 -2.4 2.5 2.5 2.6 0.0 0.0 -0.1 -3.9 2.5 2.5 2.6 0.0 0.0 -0.1 -3.9 7.2 7.2 7.3 0.0 0.0 -0.1 -1.4
PreliminaryNOV 2019
RevisedOCT 2019
Change in Jobsfrom JAN 2019
Net %
Change in Jobsfrom NOV 2018
Net %Revised
NOV 2018

5
Total NonfarmTotal PrivateGoods ProducingService-ProvidingPrivate Service-ProvidingMining and LoggingMining, Logging and ConstructionConstruction Construction of Buildings Specialty Trade ContractorsManufacturing Durable Goods Transportation Equipment Manufacturing Non-Durable Goods Food ManufacturingTrade, Transportation, and Utilities Wholesale Trade Merchant Wholesalers, Durable Goods Merchant Wholesalers, Nondurable Goods Wholesale Electronic Markets and Agents and Brokers Retail Trade Food and Beverage Stores General Merchandise Stores Miscellaneous Store Retailers Transportation, Warehousing, and Utilities Utilities Transportation and Warehousing Air Transportation Truck Transportation Couriers and MessengersInformation Telecommunications Wired and Wireless Telecommunications Carriers Data Processing, Hosting, and Related ServicesFinancial Activities Finance and Insurance Insurance Carriers and Related Activities Real Estate and Rental and LeasingProfessional and Business Services Professional,Scientific,andTechnicalServices Accounting, Tax Prep, and Bookkeeping Services Architectural, Engineering, and Related Services Computer Systems Design and Related Services Management and Technical Consulting Services Management of Companies and Enterprises Admin and Support, Waste Mngmnt and Remediation Employment ServicesEducation and Health Services Educational Services Health Care and Social Assistance Ambulatory Health Care Services Hospitals Social AssistanceLeisure and Hospitality Arts, Entertainment, and Recreation Accommodation and Food Services Accommodation Food Services and Drinking PlacesOther Services Repair and Maintenance Personal and Laundry ServicesGovernment Federal Government State Government Local Government
AtlANtA MSA Nonfarm Employment
☞Note: These not seasonally adjusted estimates were prepared in cooperation with the U.S. Department of Labor, Bureau of Labor Statistics, based upon monthly reports submitted by selected employers in the Atlanta Metropolitan Statistical Area, which includes Barrow, Bartow, Butts, Carroll, Cherokee, Clayton, Cobb, Coweta, Dawson, DeKalb, Douglas, Fayette, Forsyth, Fulton, Gwinnett, Haralson, Heard, Henry, Jasper, Lamar, Meriwether, Morgan, Newton, Paulding, Pickens, Pike, Rockdale, Spalding and Walton counties. The estimates include all full- and part-time wage and salary workers who were employed during or received pay for any part of the pay period that includes the twelfth of the month. Proprietors, domestic workers, self-employed persons, unpaid family workers and personnel of the armed forces are excluded. Estimates based on 2018 benchmark.
Source: Georgia Department of Labor, Workforce Statistics & Economic Research
(In thousands)
(Not Seasonally Adjusted)
2,887.9 2,873.5 2,826.7 14.4 0.5 61.2 2.2 2,543.2 2,529.9 2,487.5 13.3 0.5 55.7 2.2 310.4 310.9 302.1 -0.5 -0.2 8.3 2.8 2,577.5 2,562.6 2,524.6 14.9 0.6 52.9 2.1 2,232.8 2,219.0 2,185.4 13.8 0.6 47.4 2.2 1.6 1.6 1.6 0.0 0.0 0.0 0.0 135.6 135.6 129.9 0.0 0.0 5.7 4.4 134.0 134.0 128.3 0.0 0.0 5.7 4.4 31.9 32.0 28.9 -0.1 -0.3 3.0 10.4 85.6 85.0 82.7 0.6 0.7 2.9 3.5 174.8 175.3 172.2 -0.5 -0.3 2.6 1.5 89.8 89.7 89.3 0.1 0.1 0.5 0.6 15.2 15.2 15.3 0.0 0.0 -0.1 -0.7 85.0 85.6 82.9 -0.6 -0.7 2.1 2.5 27.2 27.1 26.2 0.1 0.4 1.0 3.8 624.4 611.7 617.0 12.7 2.1 7.4 1.2 155.0 154.8 154.5 0.2 0.1 0.5 0.3 84.1 84.5 83.4 -0.4 -0.5 0.7 0.8 41.5 40.8 40.8 0.7 1.7 0.7 1.7 29.4 29.5 30.3 -0.1 -0.3 -0.9 -3.0 304.6 293.5 300.3 11.1 3.8 4.3 1.4 58.9 57.4 57.7 1.5 2.6 1.2 2.1 64.6 59.8 65.1 4.8 8.0 -0.5 -0.8 14.9 14.9 14.9 0.0 0.0 0.0 0.0 164.8 163.4 162.2 1.4 0.9 2.6 1.6 10.0 10.0 9.9 0.0 0.0 0.1 1.0 154.8 153.4 152.3 1.4 0.9 2.5 1.6 40.1 41.2 39.4 -1.1 -2.7 0.7 1.8 34.2 34.2 34.1 0.0 0.0 0.1 0.3 22.8 20.8 21.0 2.0 9.6 1.8 8.6 101.9 99.9 98.7 2.0 2.0 3.2 3.2 31.6 31.8 33.3 -0.2 -0.6 -1.7 -5.1 27.5 27.7 29.1 -0.2 -0.7 -1.6 -5.5 13.4 13.4 12.6 0.0 0.0 0.8 6.4 175.4 175.5 174.8 -0.1 -0.1 0.6 0.3 124.8 125.6 122.5 -0.8 -0.6 2.3 1.9 62.3 62.7 59.8 -0.4 -0.6 2.5 4.2 50.6 49.9 52.3 0.7 1.4 -1.7 -3.3 546.3 545.0 538.4 1.3 0.2 7.9 1.5 241.2 238.4 227.6 2.8 1.2 13.6 6.0 28.0 28.7 27.0 -0.7 -2.4 1.0 3.7 34.9 34.9 33.7 0.0 0.0 1.2 3.6 64.3 62.8 61.1 1.5 2.4 3.2 5.2 41.4 40.1 40.4 1.3 3.2 1.0 2.5 64.2 64.3 62.5 -0.1 -0.2 1.7 2.7 240.9 242.3 248.3 -1.4 -0.6 -7.4 -3.0 122.1 122.5 127.9 -0.4 -0.3 -5.8 -4.5 375.3 372.6 360.4 2.7 0.7 14.9 4.1 59.8 59.3 58.5 0.5 0.8 1.3 2.2 315.5 313.3 301.9 2.2 0.7 13.6 4.5 129.3 129.7 125.1 -0.4 -0.3 4.2 3.4 106.6 105.8 102.8 0.8 0.8 3.8 3.7 47.5 46.4 44.7 1.1 2.4 2.8 6.3 311.3 315.9 298.7 -4.6 -1.5 12.6 4.2 39.3 42.5 37.9 -3.2 -7.5 1.4 3.7 272.0 273.4 260.8 -1.4 -0.5 11.2 4.3 25.6 25.6 25.5 0.0 0.0 0.1 0.4 246.4 247.8 235.3 -1.4 -0.6 11.1 4.7 98.2 98.4 97.4 -0.2 -0.2 0.8 0.8 23.6 23.8 23.4 -0.2 -0.8 0.2 0.9 27.1 26.7 26.4 0.4 1.5 0.7 2.7 344.7 343.6 339.2 1.1 0.3 5.5 1.6 48.4 48.1 47.5 0.3 0.6 0.9 1.9 79.5 79.2 77.4 0.3 0.4 2.1 2.7 216.8 216.3 214.3 0.5 0.2 2.5 1.2
PreliminaryNOV 2019
RevisedOCT 2019
RevisedNOV 2018
Change in Jobsfrom NOV 2018
Net %
Change in Jobsfrom OCT 2019
Net %
6
Total NonfarmTotal PrivateGoods ProducingService-ProvidingPrivate Service-ProvidingMining, Logging and ConstructionManufacturingTrade, Transportation, and Utilities Wholesale Trade Retail Trade Transportation, Warehousing, and UtilitiesInformationFinancial ActivitiesProfessional and Business ServicesEducation and Health ServicesLeisure and HospitalityOther ServicesGovernment Federal Government State Government Local Government
☞Note: These not seasonally adjusted estimates were prepared in cooperation with the U.S. Department of Labor, Bureau of Labor Statistics, based upon monthly reports submitted by selected employers in the Augusta-Richmond County Metropolitan Statistical Area, which includes Burke, Columbia, Lincoln, McDuffie and Richmond counties in Georgia and Aiken and Edge-field counties in South Carolina. The estimates include all full- and part-time wage and salary workers who were employed during or received pay for any part of the pay period that includes the twelfth of the month. Proprietors, domestic workers, self-employed persons, unpaid family workers and personnel of the armed forces are excluded. Estimates based on 2018 benchmark.
Total NonfarmTotal PrivateGoods ProducingService-ProvidingPrivate Service-ProvidingTrade, Transportation, and Utilities Retail TradeGovernment Federal Government State Government Local Government
☞Note: These not seasonally adjusted estimates were prepared in cooperation with the U.S. Department of Labor, Bureau of Labor Statistics, based upon monthly reports submitted by selected employers in the Brunswick Metropolitan Statistical Area, which includes Brantley, Glynn and McIntosh counties. The estimates include all full- and part-time wage and salary workers who were employed during or received pay for any part of the pay period that includes the twelfth of the month. Proprietors, domestic workers, self-employed persons, unpaid family workers and personnel of the armed forces are excluded. Estimates based on 2018 benchmark.
Source: Georgia Department of Labor, Workforce Statistics & Economic Research
bRUNSWiCk MSA Nonfarm Employment
(In thousands)
(In thousands)
(Not Seasonally Adjusted)
(Not Seasonally Adjusted)
AUGUStA-RiChMoNd CoUNty MSA Nonfarm Employment
246.6 244.6 242.7 2.0 0.8 3.9 1.6 199.0 197.1 195.3 1.9 1.0 3.7 1.9 40.2 39.8 39.0 0.4 1.0 1.2 3.1 206.4 204.8 203.7 1.6 0.8 2.7 1.3 158.8 157.3 156.3 1.5 1.0 2.5 1.6 17.9 17.7 16.9 0.2 1.1 1.0 5.9 22.3 22.1 22.1 0.2 0.9 0.2 0.9 42.0 41.1 41.4 0.9 2.2 0.6 1.5 5.8 5.8 5.8 0.0 0.0 0.0 0.0 28.1 27.4 27.7 0.7 2.6 0.4 1.4 8.1 7.9 7.9 0.2 2.5 0.2 2.5 2.6 2.5 2.6 0.1 4.0 0.0 0.0 6.7 6.7 6.7 0.0 0.0 0.0 0.0 35.9 35.8 35.8 0.1 0.3 0.1 0.3 35.9 35.5 34.7 0.4 1.1 1.2 3.5 27.4 27.4 26.8 0.0 0.0 0.6 2.2 8.3 8.3 8.3 0.0 0.0 0.0 0.0 47.6 47.5 47.4 0.1 0.2 0.2 0.4 9.7 9.7 9.7 0.0 0.0 0.0 0.0 16.3 16.2 16.1 0.1 0.6 0.2 1.2 21.6 21.6 21.6 0.0 0.0 0.0 0.0
PreliminaryNOV 2019
RevisedOCT 2019
Change in Jobsfrom OCT 2019
Change in Jobsfrom NOV 2018
Net %Revised
NOV 2018
45.9 45.7 45.1 0.2 0.4 0.8 1.8 37.2 36.9 36.5 0.3 0.8 0.7 1.9 3.8 3.8 4.1 0.0 0.0 -0.3 -7.3 42.1 41.9 41.0 0.2 0.5 1.1 2.7 33.4 33.1 32.4 0.3 0.9 1.0 3.1 10.1 9.9 10.4 0.2 2.0 -0.3 -2.9 6.5 6.3 6.3 0.2 3.2 0.2 3.2 8.7 8.8 8.6 -0.1 -1.1 0.1 1.2 2.0 2.0 2.0 0.0 0.0 0.0 0.0 1.8 1.8 1.8 0.0 0.0 0.0 0.0 4.9 5.0 4.8 -0.1 -2.0 0.1 2.1
PreliminaryNOV 2019
RevisedOCT 2019
RevisedNOV 2018
Change in Jobsfrom OCT 2019
Net %
Change in Jobsfrom NOV 2018
Net %

7
Total NonfarmTotal PrivateGoods ProducingService-ProvidingPrivate Service-ProvidingMining, Logging and ConstructionManufacturingTrade, Transportation, and Utilities Wholesale Trade Retail Trade Transportation, Warehousing, and UtilitiesInformationFinancial Activities Finance and Insurance Insurance Carriers and Related ActivitiesProfessional and Business ServicesEducation and Health ServicesLeisure and HospitalityOther ServicesGovernment Federal Government State Government Local Government
☞Note: These not seasonally adjusted estimates were prepared in cooperation with the U.S. Department of Labor, Bureau of Labor Statistics, based upon monthly reports submitted by selected employers in the Columbus Metropolitan Statistical Area, which includes Chattahoochee, Harris, Marion and Muscogee counties in Georgia and Russell County in Alabama. The estimates include all full- and part-time wage and salary workers who were employed during or received pay for any part of the pay period that includes the twelfth of the month. Proprietors, domestic workers, self-employed persons, unpaid family workers and personnel of the armed forces are excluded. Estimates based on 2018 benchmark.
ColUMbUS MSA Nonfarm Employment
Total NonfarmTotal PrivateGoods ProducingService-ProvidingPrivate Service-ProvidingManufacturing Textile Mills Textile Product MillsTrade, Transportation, and Utilities Retail Trade Transportation, Warehousing, and UtilitiesProfessional and Business ServicesGovernment Federal Government State Government Local Government
☞Note: These not seasonally adjusted estimates were prepared in cooperation with the U.S. Department of Labor, Bureau of Labor Statistics, based upon monthly reports submitted by selected employers in the Dalton Metropolitan Statistical Area, which includes Murray and Whitfield counties. The estimates include all full- and part-time wage and salary workers who were em-ployed during or received pay for any part of the pay period that includes the twelfth of the month. Proprietors, domestic workers, self-employed persons, unpaid family workers and personnel of the armed forces are excluded. Estimates based on 2018 benchmark.
Source: Georgia Department of Labor, Workforce Statistics & Economic Research
dAltoN MSA Nonfarm Employment
(In thousands)
(In thousands)
(Not Seasonally Adjusted)
(Not Seasonally Adjusted)
69.0 69.2 68.5 -0.2 -0.3 0.5 0.7 62.0 62.1 61.4 -0.1 -0.2 0.6 1.0 26.2 26.3 26.2 -0.1 -0.4 0.0 0.0 42.8 42.9 42.3 -0.1 -0.2 0.5 1.2 35.8 35.8 35.2 0.0 0.0 0.6 1.7 24.7 24.8 24.9 -0.1 -0.4 -0.2 -0.8 4.2 4.2 4.6 0.0 0.0 -0.4 -8.7 13.9 14.0 14.4 -0.1 -0.7 -0.5 -3.5 14.0 14.1 14.3 -0.1 -0.7 -0.3 -2.1 6.1 6.0 6.2 0.1 1.7 -0.1 -1.6 3.3 3.3 3.3 0.0 0.0 0.0 0.0 7.1 7.1 7.1 0.0 0.0 0.0 0.0 7.0 7.1 7.1 -0.1 -1.4 -0.1 -1.4 0.2 0.2 0.2 0.0 0.0 0.0 0.0 1.1 1.2 1.1 -0.1 -8.3 0.0 0.0 5.7 5.7 5.8 0.0 0.0 -0.1 -1.7
RevisedOCT 2019
RevisedNOV 2018
Change in Jobsfrom OCT 2019
Net %
Change in Jobsfrom NOV 2018
Net %PreliminaryNOV 2019
123.8 123.1 124.3 0.7 0.6 -0.5 -0.4 100.1 99.5 99.4 0.6 0.6 0.7 0.7 16.0 16.1 16.2 -0.1 -0.6 -0.2 -1.2 107.8 107.0 108.1 0.8 0.8 -0.3 -0.3 84.1 83.4 83.2 0.7 0.8 0.9 1.1 5.2 5.3 5.0 -0.1 -1.9 0.2 4.0 10.8 10.8 11.2 0.0 0.0 -0.4 -3.6 19.3 19.0 19.2 0.3 1.6 0.1 0.5 2.6 2.6 2.6 0.0 0.0 0.0 0.0 14.0 13.8 14.0 0.2 1.5 0.0 0.0 2.7 2.6 2.6 0.1 3.9 0.1 3.9 1.3 1.2 1.3 0.1 8.3 0.0 0.0 13.6 13.5 13.6 0.1 0.7 0.0 0.0 11.6 11.5 11.5 0.1 0.9 0.1 0.9 4.5 4.4 4.3 0.1 2.3 0.2 4.7 13.8 13.6 14.0 0.2 1.5 -0.2 -1.4 16.6 16.5 16.1 0.1 0.6 0.5 3.1 15.2 15.3 14.7 -0.1 -0.7 0.5 3.4 4.3 4.3 4.3 0.0 0.0 0.0 0.0 23.7 23.6 24.9 0.1 0.4 -1.2 -4.8 6.5 6.6 6.6 -0.1 -1.5 -0.1 -1.5 4.0 4.0 4.6 0.0 0.0 -0.6 -13.0 13.2 13.0 13.7 0.2 1.5 -0.5 -3.7
PreliminaryNOV 2019
RevisedOCT 2019
RevisedNOV 2018
Change in Jobsfrom OCT 2019
Net %
Change in Jobsfrom NOV 2018
Net %

8
Total NonfarmTotal PrivateGoods ProducingService-ProvidingPrivate Service-ProvidingGovernment Federal Government State Government Local Government
☞Note: These not seasonally adjusted estimates were prepared in cooperation with the U.S. Department of Labor, Bureau of Labor Statistics, based upon monthly reports submitted by selected employers in the Hinesville Metropolitan Statistical Area, which includes Liberty and Long counties. The estimates include all full- and part-time wage and salary workers who were employed during or received pay for any part of the pay period that includes the twelfth of the month. Proprietors, domestic workers, self-employed persons, unpaid family workers and person-nel of the armed forces are excluded. Estimates based on 2018 benchmark.
Source: Georgia Department of Labor, Workforce Statistics & Economic Research
hiNESvillE MSA Nonfarm Employment
Total NonfarmTotal PrivateGoods ProducingService-ProvidingPrivate Service-ProvidingTrade, Transportation, and Utilities Retail TradeGovernment Federal Government State Government Local Government
☞Note: These not seasonally adjusted estimates were prepared in cooperation with the U.S. Department of Labor, Bureau of Labor Statistics, based upon monthly reports submitted by selected employers in the Gainesville Metropolitan Statistical Area, which comprises Hall county. The estimates include all full- and part-time wage and salary workers who were employed dur-ing or received pay for any part of the pay period that includes the twelfth of the month. Proprietors, domestic workers, self-employed persons, unpaid family workers and personnel of the armed forces are excluded. Estimates based on 2018 benchmark.
GAiNESvillE MSA Nonfarm Employment
(In thousands)
(In thousands)
(Not Seasonally Adjusted)
(Not Seasonally Adjusted)
21.1 21.1 20.8 0.0 0.0 0.3 1.4 13.1 13.1 13.0 0.0 0.0 0.1 0.8 3.0 3.1 3.0 -0.1 -3.2 0.0 0.0 18.1 18.0 17.8 0.1 0.6 0.3 1.7 10.1 10.0 10.0 0.1 1.0 0.1 1.0 8.0 8.0 7.8 0.0 0.0 0.2 2.6 3.8 3.9 3.8 -0.1 -2.6 0.0 0.0 0.4 0.4 0.4 0.0 0.0 0.0 0.0 3.8 3.7 3.6 0.1 2.7 0.2 5.6
RevisedOCT 2019
RevisedNOV 2018
Change in Jobsfrom OCT 2019
Net %
Change in Jobsfrom NOV 2018
Net %PreliminaryNOV 2019
98.6 98.0 95.2 0.6 0.6 3.4 3.6 87.4 86.9 84.3 0.5 0.6 3.1 3.7 26.5 26.5 25.7 0.0 0.0 0.8 3.1 72.1 71.5 69.5 0.6 0.8 2.6 3.7 60.9 60.4 58.6 0.5 0.8 2.3 3.9 17.9 17.5 17.6 0.4 2.3 0.3 1.7 9.7 9.5 9.4 0.2 2.1 0.3 3.2 11.2 11.1 10.9 0.1 0.9 0.3 2.8 0.5 0.5 0.4 0.0 0.0 0.1 25.0 3.0 2.9 2.8 0.1 3.5 0.2 7.1 7.7 7.7 7.7 0.0 0.0 0.0 0.0
RevisedOCT 2019
RevisedNOV 2018
Change in Jobsfrom OCT 2019
Net %
Change in Jobsfrom NOV 2018
Net %PreliminaryNOV 2019
9
Total NonfarmTotal PrivateGoods ProducingService-ProvidingPrivate Service-ProvidingManufacturingTrade, Transportation, and Utilities Retail TradeEducation and Health ServicesGovernment Federal Government State Government Local Government
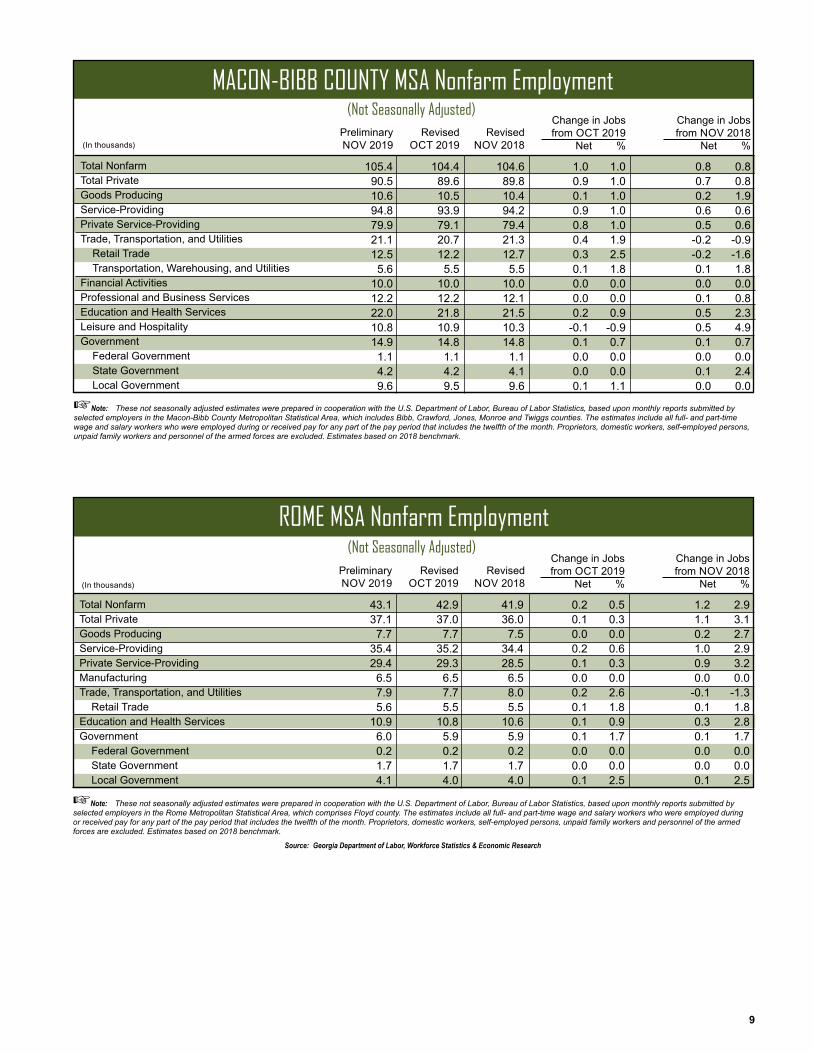
☞Note: These not seasonally adjusted estimates were prepared in cooperation with the U.S. Department of Labor, Bureau of Labor Statistics, based upon monthly reports submitted by selected employers in the Rome Metropolitan Statistical Area, which comprises Floyd county. The estimates include all full- and part-time wage and salary workers who were employed during or received pay for any part of the pay period that includes the twelfth of the month. Proprietors, domestic workers, self-employed persons, unpaid family workers and personnel of the armed forces are excluded. Estimates based on 2018 benchmark.
Source: Georgia Department of Labor, Workforce Statistics & Economic Research
RoME MSA Nonfarm Employment
Total NonfarmTotal PrivateGoods ProducingService-ProvidingPrivate Service-ProvidingTrade, Transportation, and Utilities Retail Trade Transportation, Warehousing, and UtilitiesFinancial ActivitiesProfessional and Business ServicesEducation and Health ServicesLeisure and HospitalityGovernment Federal Government State Government Local Government
☞Note: These not seasonally adjusted estimates were prepared in cooperation with the U.S. Department of Labor, Bureau of Labor Statistics, based upon monthly reports submitted by selected employers in the Macon-Bibb County Metropolitan Statistical Area, which includes Bibb, Crawford, Jones, Monroe and Twiggs counties. The estimates include all full- and part-time wage and salary workers who were employed during or received pay for any part of the pay period that includes the twelfth of the month. Proprietors, domestic workers, self-employed persons, unpaid family workers and personnel of the armed forces are excluded. Estimates based on 2018 benchmark.
MACoN-bibb CoUNty MSA Nonfarm Employment
(In thousands)
(In thousands)
(Not Seasonally Adjusted)
(Not Seasonally Adjusted)
43.1 42.9 41.9 0.2 0.5 1.2 2.9 37.1 37.0 36.0 0.1 0.3 1.1 3.1 7.7 7.7 7.5 0.0 0.0 0.2 2.7 35.4 35.2 34.4 0.2 0.6 1.0 2.9 29.4 29.3 28.5 0.1 0.3 0.9 3.2 6.5 6.5 6.5 0.0 0.0 0.0 0.0 7.9 7.7 8.0 0.2 2.6 -0.1 -1.3 5.6 5.5 5.5 0.1 1.8 0.1 1.8 10.9 10.8 10.6 0.1 0.9 0.3 2.8 6.0 5.9 5.9 0.1 1.7 0.1 1.7 0.2 0.2 0.2 0.0 0.0 0.0 0.0 1.7 1.7 1.7 0.0 0.0 0.0 0.0 4.1 4.0 4.0 0.1 2.5 0.1 2.5
RevisedOCT 2019
RevisedNOV 2018
Change in Jobsfrom OCT 2019
Net %
Change in Jobsfrom NOV 2018
Net %PreliminaryNOV 2019
105.4 104.4 104.6 1.0 1.0 0.8 0.8 90.5 89.6 89.8 0.9 1.0 0.7 0.8 10.6 10.5 10.4 0.1 1.0 0.2 1.9 94.8 93.9 94.2 0.9 1.0 0.6 0.6 79.9 79.1 79.4 0.8 1.0 0.5 0.6 21.1 20.7 21.3 0.4 1.9 -0.2 -0.9 12.5 12.2 12.7 0.3 2.5 -0.2 -1.6 5.6 5.5 5.5 0.1 1.8 0.1 1.8 10.0 10.0 10.0 0.0 0.0 0.0 0.0 12.2 12.2 12.1 0.0 0.0 0.1 0.8 22.0 21.8 21.5 0.2 0.9 0.5 2.3 10.8 10.9 10.3 -0.1 -0.9 0.5 4.9 14.9 14.8 14.8 0.1 0.7 0.1 0.7 1.1 1.1 1.1 0.0 0.0 0.0 0.0 4.2 4.2 4.1 0.0 0.0 0.1 2.4 9.6 9.5 9.6 0.1 1.1 0.0 0.0
RevisedOCT 2019
RevisedNOV 2018
Change in Jobsfrom OCT 2019
Net %
Change in Jobsfrom NOV 2018
Net %PreliminaryNOV 2019
10
Total NonfarmTotal PrivateGoods ProducingService-ProvidingPrivate Service-ProvidingMining, Logging and ConstructionManufacturingTrade, Transportation, and Utilities Wholesale Trade Retail Trade Transportation, Warehousing, and UtilitiesInformationFinancial ActivitiesProfessional and Business ServicesEducation and Health ServicesLeisure and HospitalityOther ServicesGovernment Federal Government State Government Local Government
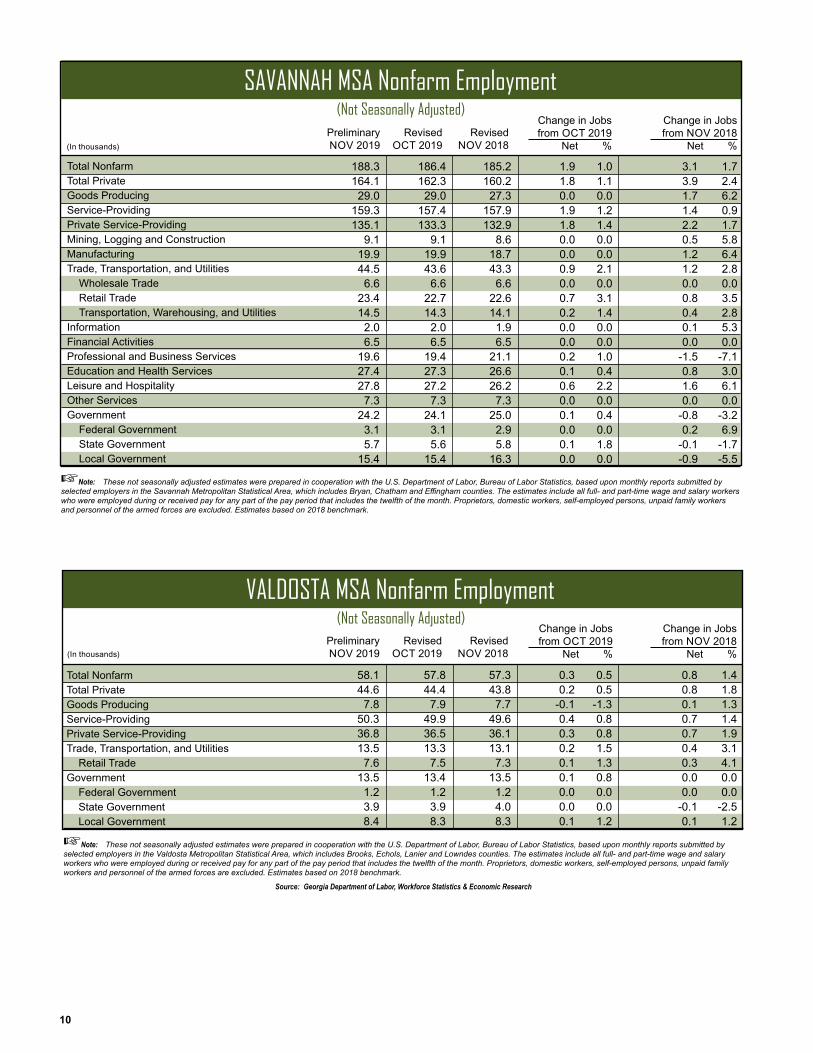
☞Note: These not seasonally adjusted estimates were prepared in cooperation with the U.S. Department of Labor, Bureau of Labor Statistics, based upon monthly reports submitted by selected employers in the Savannah Metropolitan Statistical Area, which includes Bryan, Chatham and Effingham counties. The estimates include all full- and part-time wage and salary workers who were employed during or received pay for any part of the pay period that includes the twelfth of the month. Proprietors, domestic workers, self-employed persons, unpaid family workers and personnel of the armed forces are excluded. Estimates based on 2018 benchmark.
SAvANNAh MSA Nonfarm Employment
Total NonfarmTotal PrivateGoods ProducingService-ProvidingPrivate Service-ProvidingTrade, Transportation, and Utilities Retail TradeGovernment Federal Government State Government Local Government
☞Note: These not seasonally adjusted estimates were prepared in cooperation with the U.S. Department of Labor, Bureau of Labor Statistics, based upon monthly reports submitted by selected employers in the Valdosta Metropolitan Statistical Area, which includes Brooks, Echols, Lanier and Lowndes counties. The estimates include all full- and part-time wage and salary workers who were employed during or received pay for any part of the pay period that includes the twelfth of the month. Proprietors, domestic workers, self-employed persons, unpaid family workers and personnel of the armed forces are excluded. Estimates based on 2018 benchmark.
Source: Georgia Department of Labor, Workforce Statistics & Economic Research
vAldoStA MSA Nonfarm Employment
(In thousands)
(In thousands)
(Not Seasonally Adjusted)
(Not Seasonally Adjusted)
188.3 186.4 185.2 1.9 1.0 3.1 1.7 164.1 162.3 160.2 1.8 1.1 3.9 2.4 29.0 29.0 27.3 0.0 0.0 1.7 6.2 159.3 157.4 157.9 1.9 1.2 1.4 0.9 135.1 133.3 132.9 1.8 1.4 2.2 1.7 9.1 9.1 8.6 0.0 0.0 0.5 5.8 19.9 19.9 18.7 0.0 0.0 1.2 6.4 44.5 43.6 43.3 0.9 2.1 1.2 2.8 6.6 6.6 6.6 0.0 0.0 0.0 0.0 23.4 22.7 22.6 0.7 3.1 0.8 3.5 14.5 14.3 14.1 0.2 1.4 0.4 2.8 2.0 2.0 1.9 0.0 0.0 0.1 5.3 6.5 6.5 6.5 0.0 0.0 0.0 0.0 19.6 19.4 21.1 0.2 1.0 -1.5 -7.1 27.4 27.3 26.6 0.1 0.4 0.8 3.0 27.8 27.2 26.2 0.6 2.2 1.6 6.1 7.3 7.3 7.3 0.0 0.0 0.0 0.0 24.2 24.1 25.0 0.1 0.4 -0.8 -3.2 3.1 3.1 2.9 0.0 0.0 0.2 6.9 5.7 5.6 5.8 0.1 1.8 -0.1 -1.7 15.4 15.4 16.3 0.0 0.0 -0.9 -5.5
RevisedOCT 2019
RevisedNOV 2018
Change in Jobsfrom OCT 2019
Net %
Change in Jobsfrom NOV 2018
Net %PreliminaryNOV 2019
58.1 57.8 57.3 0.3 0.5 0.8 1.4 44.6 44.4 43.8 0.2 0.5 0.8 1.8 7.8 7.9 7.7 -0.1 -1.3 0.1 1.3 50.3 49.9 49.6 0.4 0.8 0.7 1.4 36.8 36.5 36.1 0.3 0.8 0.7 1.9 13.5 13.3 13.1 0.2 1.5 0.4 3.1 7.6 7.5 7.3 0.1 1.3 0.3 4.1 13.5 13.4 13.5 0.1 0.8 0.0 0.0 1.2 1.2 1.2 0.0 0.0 0.0 0.0 3.9 3.9 4.0 0.0 0.0 -0.1 -2.5 8.4 8.3 8.3 0.1 1.2 0.1 1.2
RevisedOCT 2019
RevisedNOV 2018
Change in Jobsfrom OCT 2019
Net %
Change in Jobsfrom NOV 2018
Net %PreliminaryNOV 2019

11
Total NonfarmTotal PrivateGoods ProducingService-ProvidingPrivate Service-ProvidingTrade, Transportation, and Utilities Retail TradeGovernment Federal Government State Government Local Government
☞Note: These not seasonally adjusted estimates were prepared in cooperation with the U.S. Department of Labor, Bureau of Labor Statistics, based upon monthly reports submitted by selected employers in the Warner Robins Metropolitan Statistical Area, which includes Houston, Peach and Pulaski counties. The estimates include all full- and part-time wage and salary work-ers who were employed during or received pay for any part of the pay period that includes the twelfth of the month. Proprietors, domestic workers, self-employed persons, unpaid family workers and personnel of the armed forces are excluded. Estimates based on 2018 benchmark.
WARNER RobiNS MSA Nonfarm Employment
☞Note: These seasonally adjusted estimates were prepared in cooperation with the U.S. Department of Labor, Bureau of Labor Statistics, based upon monthly reports submitted by selected employers throughout Georgia. The estimates include all full- and part-time wage and salary workers who were employed during or received pay for any part of the pay period that includes the twelfth of the month. Proprietors, domestic workers, self-employed persons, unpaid family workers and personnel of the armed forces are excluded. Estimates based on 2018 benchmark.
Source: Georgia Department of Labor, Workforce Statistics & Economic Research
Albany MSA
Athens-Clarke County MSA
Atlanta MSA
Augusta-Richmond County MSA
Brunswick MSA
Columbus MSA
Dalton MSA
Gainesville MSA
Hinesville MSA
Macon-Bibb County MSA
Rome MSA
Savannah MSA
Valdosta MSA
Warner Robins MSA
total Nonfarm Employment by Metro Statistical Area
(In thousands)
(Seasonally Adjusted)
(In thousands)
(Not Seasonally Adjusted)
77.7 77.4 76.6 0.3 0.4 1.1 1.4 49.1 48.7 48.5 0.4 0.8 0.6 1.2 10.1 10.1 10.3 0.0 0.0 -0.2 -1.9 67.6 67.3 66.3 0.3 0.5 1.3 2.0 39.0 38.6 38.2 0.4 1.0 0.8 2.1 11.4 11.1 11.1 0.3 2.7 0.3 2.7 8.9 8.7 8.6 0.2 2.3 0.3 3.5 28.6 28.7 28.1 -0.1 -0.4 0.5 1.8 16.0 15.9 15.6 0.1 0.6 0.4 2.6 2.5 2.7 2.5 -0.2 -7.4 0.0 0.0 10.1 10.1 10.0 0.0 0.0 0.1 1.0
RevisedOCT 2019
RevisedNOV 2018
Change in Jobsfrom OCT 2019
Net %
Change in Jobsfrom NOV 2018
Net %PreliminaryNOV 2019
Change in Jobsfrom OCT 2019
Net %PreliminaryNOV 2019
RevisedOCT 2019
Change in Jobsfrom NOV 2018
Net %Revised
NOV 2018
62.9 63.0 63.0 -0.1 -0.2 -0.1 -0.2
100.2 100.1 99.9 0.1 0.1 0.3 0.3
2,865.0 2,861.2 2,802.9 3.8 0.1 62.1 2.2
245.9 245.0 241.7 0.9 0.4 4.2 1.7
45.9 45.8 45.1 0.1 0.2 0.8 1.8
122.5 122.5 122.9 0.0 0.0 -0.4 -0.3
69.1 69.3 68.5 -0.2 -0.3 0.6 0.9
97.9 97.6 94.5 0.3 0.3 3.4 3.6
21.0 21.1 20.7 -0.1 -0.5 0.3 1.4
104.4 104.3 103.6 0.1 0.1 0.8 0.8
42.9 42.8 41.7 0.1 0.2 1.2 2.9
187.6 186.2 184.7 1.4 0.8 2.9 1.6
57.4 57.4 56.5 0.0 0.0 0.9 1.6
77.5 77.5 76.4 0.0 0.0 1.1 1.4
12
☞Note: These not seasonally adjusted estimates were prepared in cooperation with the U.S. Department of Labor, Bureau of Labor Statistics, based upon monthly reports submitted by selected employers throughout Georgia. The estimates include all full- and part-time wage and salary workers who were employed during or received pay for any part of the pay period that includes the twelfth of the month. Proprietors, domestic workers, self-employed persons, unpaid family workers and personnel of the armed forces are excluded. Estimates based on 2018 benchmark.
Source: Georgia Department of Labor, Workforce Statistics & Economic Research
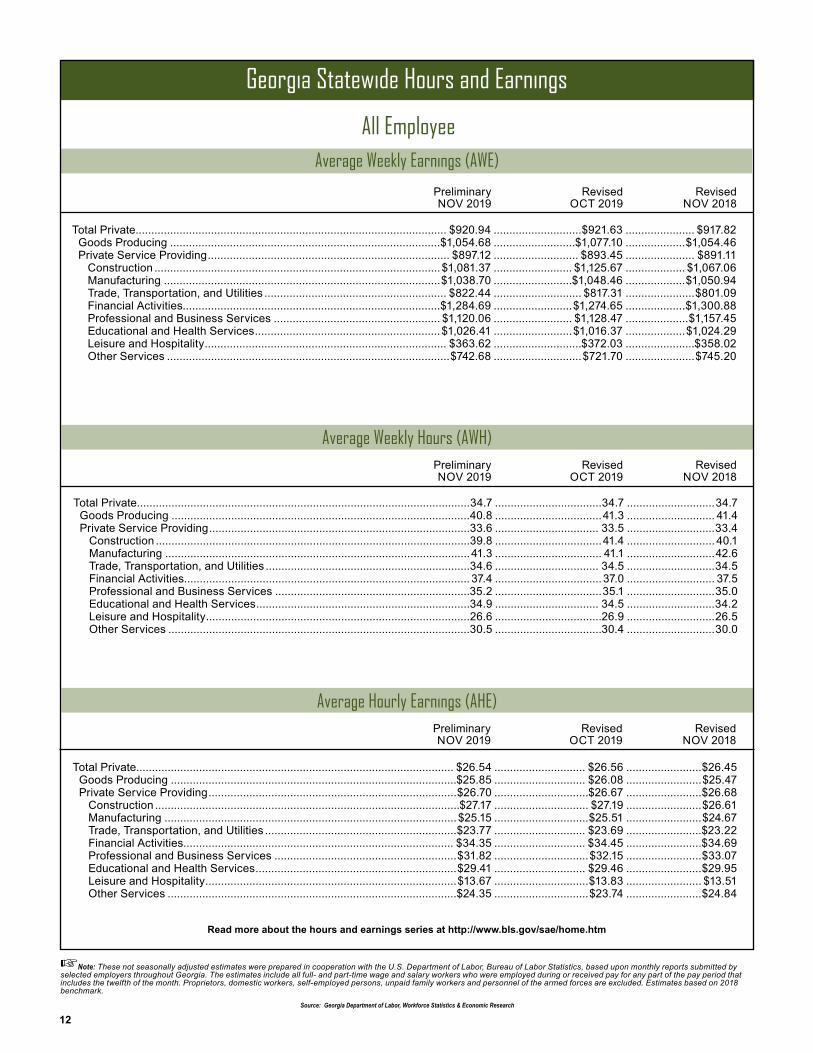
Georgia Statewide hours and Earnings
All Employee
Read more about the hours and earnings series at http://www.bls.gov/sae/home.htm
Total Private ..........................................................................................................34.7 ..................................34.7 ............................34.7 Goods Producing ...............................................................................................40.8 ..................................41.3 ............................ 41.4 Private Service Providing ...................................................................................33.6 ................................. 33.5 ............................33.4 Construction ....................................................................................................39.8 ..................................41.4 ............................ 40.1 Manufacturing .................................................................................................41.3 .................................. 41.1 ............................42.6 Trade, Transportation, and Utilities .................................................................34.6 ................................. 34.5 ............................34.5 Financial Activities........................................................................................... 37.4 ..................................37.0 ............................ 37.5 Professional and Business Services ..............................................................35.2 ..................................35.1 ............................35.0 Educational and Health Services ....................................................................34.9 ................................. 34.5 ............................34.2 Leisure and Hospitality ....................................................................................26.6 ..................................26.9 ............................26.5 Other Services ................................................................................................30.5 ..................................30.4 ............................30.0
Total Private ................................................................................................... $920.94 ............................$921.63 ...................... $917.82 Goods Producing ......................................................................................$1,054.68 ..........................$1,077.10 ...................$1,054.46 Private Service Providing ............................................................................. $897.12 ........................... $893.45 ...................... $891.11 Construction ........................................................................................... $1,081.37 ......................... $1,125.67 ................... $1,067.06 Manufacturing ........................................................................................$1,038.70 .........................$1,048.46 ...................$1,050.94 Trade, Transportation, and Utilities .......................................................... $822.44 ............................ $817.31 ......................$801.09 Financial Activities..................................................................................$1,284.69 .........................$1,274.65 ...................$1,300.88 Professional and Business Services ..................................................... $1,120.06 ......................... $1,128.47 ....................$1,157.45 Educational and Health Services ...........................................................$1,026.41 .........................$1,016.37 ...................$1,024.29 Leisure and Hospitality ............................................................................. $363.62 ............................$372.03 ......................$358.02 Other Services ..........................................................................................$742.68 ............................$721.70 ......................$745.20
Average Weekly Earnings (AWE)
Preliminary Revised Revised NOV 2019 OCT 2019 NOV 2018
Average Weekly hours (AWh) Preliminary Revised Revised
NOV 2019 OCT 2019 NOV 2018
Average hourly Earnings (AhE) Preliminary Revised Revised
NOV 2019 OCT 2019 NOV 2018
Total Private ..................................................................................................... $26.54 ............................. $26.56 ........................$26.45 Goods Producing ...........................................................................................$25.85 ............................. $26.08 ........................$25.47 Private Service Providing ...............................................................................$26.70 ..............................$26.67 ........................$26.68 Construction .................................................................................................$27.17 .............................. $27.19 ........................$26.61 Manufacturing ............................................................................................. $25.15 ..............................$25.51 ........................$24.67 Trade, Transportation, and Utilities .............................................................$23.77 ............................. $23.69 ........................$23.22 Financial Activities...................................................................................... $34.35 ............................. $34.45 ........................$34.69 Professional and Business Services ..........................................................$31.82 ..............................$32.15 ........................$33.07 Educational and Health Services ................................................................$29.41 ............................. $29.46 ........................$29.95 Leisure and Hospitality ................................................................................$13.67 ..............................$13.83 ........................ $13.51 Other Services ............................................................................................$24.35 ..............................$23.74 ........................$24.84

13
☞Note: These not seasonally adjusted estimates were prepared in cooperation with the U.S. Department of Labor, Bureau of Labor Statistics, based upon monthly reports submitted by selected employers throughout Georgia. The estimates include all full- and part-time wage and salary workers who were employed during or received pay for any part of the pay period that includes the twelfth of the month. Proprietors, domestic workers, self-employed persons, unpaid family workers and personnel of the armed forces are excluded. Estimates based on 2018 benchmark.
Source: Georgia Department of Labor, Workforce Statistics & Economic Research
All Employee – total Private
Read more about the hours and earnings series at http://www.bls.gov/sae/home.htm
Georgia MSA hours and Earnings
Average Weekly Earnings (AWE) Preliminary Revised Revised
NOV 2019 OCT 2019 NOV 2018
Average Weekly hours (AWh) Preliminary Revised Revised
NOV 2019 OCT 2019 NOV 2018
Average hourly Earnings (AhE) Preliminary Revised Revised
NOV 2019 OCT 2019 NOV 2018
Albany MSA ...................................................................................................$772.16 ............................$758.91 ...................... $707.54Athens-Clarke County MSA ..........................................................................$743.59 ............................$750.09 ...................... $747.80Atlanta MSA ..............................................................................................$1,006.65 ........................ $1,008.04 ..................... $995.44Augusta-Richmond County MSA ..................................................................$870.41 ........................... $848.72 ...................... $827.75Brunswick MSA ........................................................................................... $625.06 ........................... $638.35 ..................... $656.56Columbus MSA .............................................................................................$861.50 ........................... $850.86 ...................... $771.15Dalton MSA ................................................................................................. $695.23 ............................$715.53 ...................... $771.13Gainesville MSA .........................................................................................$1,091.35 .........................$1,028.43 ...................$1,030.20Hinesville MSA ..............................................................................................$776.77 ........................... $795.37 ......................$748.35Macon-Bibb County MSA ............................................................................ $893.92 ........................... $884.86 ..................... $906.95Rome MSA ....................................................................................................$776.65 ............................$790.15 ...................... $714.42Savannah MSA ..............................................................................................$757.58 ............................$787.57 ......................$738.87Valdosta MSA ............................................................................................... $768.60 ........................... $776.06 ......................$725.87Warner Robins MSA ......................................................................................$809.17 ............................ $811.78 ......................$769.06
Albany MSA .........................................................................................................35.6 ................................. 35.2 ............................34.0Athens-Clarke County MSA ................................................................................30.5 ..................................30.1 ............................ 31.7Atlanta MSA .......................................................................................................34.7 ..................................34.7 ............................34.6Augusta-Richmond County MSA ........................................................................34.9 ..................................35.1 ............................35.0Brunswick MSA ..................................................................................................31.3 ..................................31.2 ............................32.2Columbus MSA ...................................................................................................34.2 ................................. 34.9 ............................ 35.1Dalton MSA ........................................................................................................33.7 ..................................34.6 ............................35.9Gainesville MSA ..................................................................................................39.7 ..................................39.8 ............................40.4Hinesville MSA ....................................................................................................34.6 ..................................35.1 ............................ 36.1Macon-Bibb County MSA ...................................................................................37.2 ................................. 36.9 ............................36.6Rome MSA ..........................................................................................................36.6 ..................................36.7 ............................ 37.7Savannah MSA ....................................................................................................33.3 ..................................33.4 ............................33.0Valdosta MSA ......................................................................................................35.6 ..................................35.1 ............................ 35.1Warner Robins MSA ............................................................................................ 37.9 ................................. 38.4 ............................36.5
Albany MSA .....................................................................................................$21.69 ..............................$21.56 ........................$20.81Athens-Clarke County MSA ............................................................................$24.38 ..............................$24.92 ........................$23.59Atlanta MSA ...................................................................................................$29.01 ............................. $29.05 ........................$28.77Augusta-Richmond County MSA ....................................................................$24.94 .............................. $24.18 ........................$23.65Brunswick MSA ..............................................................................................$19.97 ............................. $20.46 ........................$20.39Columbus MSA ...............................................................................................$25.19 ..............................$24.38 ........................$21.97Dalton MSA ....................................................................................................$20.63 ............................. $20.68 ........................$21.48Gainesville MSA ..............................................................................................$27.49 ............................. $25.84 ........................$25.50Hinesville MSA ............................................................................................... $22.45 ............................. $22.66 ........................$20.73Macon-Bibb County MSA ...............................................................................$24.03 ............................. $23.98 ........................$24.78Rome MSA ......................................................................................................$21.22 ..............................$21.53 ........................$18.95Savannah MSA ................................................................................................$22.75 ............................. $23.58 ........................$22.39Valdosta MSA ..................................................................................................$21.59 .............................. $22.11 ........................$20.68Warner Robins MSA ........................................................................................$21.35 .............................. $21.14 ........................ $21.07

Dimensions - Measuring Georgia’s labor Force
14
State unemployment rates
Unemployment rates — Georgia and U.S.
Source: Georgia Department of Labor, Workforce Statistics & Economic Research
TX3.4
CA3.9
MT3.4
AZ4.7
NV4.0
NM4.8
CO2.6
OR3.9
UT2.4
WY3.7
ID2.9
KS3.1
SD3.1
NE3.1
MN3.3
ND2.5
OK3.4
MO3.1
FL3.1
WA4.4
WI3.3
IA2.6
IL3.8
GA3.3
AL2.7
AR3.6
NC3.8
NY4.0
LA4.7
PA4.3
MS5.6
TN3.3
MI4.0
KY4.4
VA2.6
OH4.2IN
3.2
SC2.4
ME2.8
WV4.9
VT2.3
NH2.6
MD3.6
NJ3.4
MA2.9
CT3.7DE3.8
RI3.5
DC5.3
AK6.1
HI2.6
State Unemployment RatesNovember 2019
Rates are seasonally adjustedNational Unemployment Rate: 3.5%
Unemployment rate6.0% or greater5.0% to 5.9%4.0% to 4.9%3.0% to 3.9%Less than 3.0%
PR7.9
3%
4%
5%
Nov Dec Jan Feb Mar Apr May Jun Jul Aug Sep Oct Nov
Georgia U.S.

Georgia labor Force EstimatesPlace of Residence - Persons 16 Years and Older
15
☞Note: MSA data are not seasonally adjusted. Employment includes nonagricultural wage and salary employment, self-employment, unpaid family and private household workers and agricultural workers. Persons in labor disputes are counted as employed. The use of unrounded data does not imply that the numbers are exact.
Albany MSA: Baker, Dougherty, Lee, Terrell, and Worth counties. Athens-Clarke County MSA: Clarke, Madison, Oconee, and Oglethorpe counties. Atlanta MSA: Barrow, Bartow, Butts, Carroll, Cherokee, Clayton, Cobb, Coweta, Dawson, DeKalb, Douglas, Fayette, Forsyth, Fulton, Gwinnett, Haralson, Heard, Henry, Jasper, Lamar, Meriwether, Morgan, Newton, Paulding, Pickens, Pike, Rockdale, Spalding, and Walton counties. Augusta-Richmond County MSA:Burke,Columbia,Lincoln,McDuffie,andRichmondcountiesinGeorgiaandAikenandEdgefieldcountiesinSouthCarolina. Brunswick MSA: Brantley, Glynn, and McIntosh counties. Columbus MSA: Chattahoochee, Harris, Marion, and Muscogee counties in Georgia and Russell County in Alabama. Dalton MSA:MurrayandWhitfieldcounties. Gainesville MSA: Hall County. Hinesville MSA: Liberty and Long counties. Macon-Bibb County MSA: Bibb, Crawford, Jones, Monroe, and Twiggs counties. Rome MSA: Floyd County. Savannah MSA:Bryan,Chatham,andEffinghamcounties. Valdosta MSA: Brooks, Echols, Lanier, and Lowndes counties. Warner Robins MSA: Houston, Peach and Pulaski counties.
Source: Georgia Department of Labor, Workforce Statistics & Economic Research
Civilian labor forceEmployedUnemployedRate
Civilian labor forceEmployedUnemployedRate
Civilian labor forceEmployedUnemployedRate
Civilian labor forceEmployedUnemployedRate
Civilian labor forceEmployedUnemployedRate
Civilian labor forceEmployedUnemployedRate
Civilian labor forceEmployedUnemployedRate
Civilian labor forceEmployedUnemployedRate
Civilian labor forceEmployedUnemployedRate
Civilian labor forceEmployedUnemployedRate
Albany MSA
Athens -Clarke County MSA
Atlanta MSA
Augusta-Richmond County MSA
Brunswick MSA
Columbus MSA
Dalton MSA
Gainesville MSA
Georgia (Seasonally adjusted)
Georgia (Not Seasonally
adjusted)
Employment Status
5,125,617 5,119,637 5,115,538 5,980 10,079 4,958,760 4,947,585 4,924,369 11,175 34,391 166,857 172,052 191,169 -5,195 -24,312 3.3 3.4 3.7
5,124,821 5,132,608 5,111,058 -7,787 13,763 4,985,527 4,976,331 4,935,035 9,196 50,492 139,294 156,277 176,023 -16,983 -36,729 2.7 3.0 3.4
66,712 66,773 68,204 -61 -1,492 64,450 64,326 65,185 124 -735 2,262 2,447 3,019 -185 -757 3.4 3.7 4.4
102,378 102,735 103,622 -357 -1,244 99,888 99,847 100,363 41 -475 2,490 2,888 3,259 -398 -769 2.4 2.8 3.1
3,093,261 3,098,361 3,066,497 -5,100 26,764 3,013,566 3,009,077 2,966,411 4,489 47,155 79,695 89,284 100,086 -9,589 -20,391 2.6 2.9 3.3
268,091 268,468 266,171 -377 1,920 260,564 260,321 256,626 243 3,938 7,527 8,147 9,545 -620 -2,018 2.8 3.0 3.6
53,524 53,603 53,430 -79 94 52,108 51,965 51,646 143 462 1,416 1,638 1,784 -222 -368 2.6 3.1 3.3
123,115 123,569 124,888 -454 -1,773 119,181 119,252 119,946 -71 -765 3,934 4,317 4,942 -383 -1,008 3.2 3.5 4.0
60,534 61,253 60,942 -719 -408 58,340 58,548 58,323 -208 17 2,194 2,705 2,619 -511 -425 3.6 4.4 4.3
105,044 104,994 103,495 50 1,549 102,849 102,497 100,683 352 2,166 2,195 2,497 2,812 -302 -617 2.1 2.4 2.7
Change FromPreliminaryNOV 2019
RevisedOCT 2019
RevisedNOV 2018 OCT 2019 NOV 2018

Georgia labor Force Estimates
16
☞Note: MSA data are not seasonally adjusted. Employment includes nonagricultural wage and salary employment, self-employment, unpaid family and private household workers and agricultural workers. Persons in labor disputes are counted as employed. The use of unrounded data does not imply that the numbers are exact.
Albany MSA: Baker, Dougherty, Lee, Terrell, and Worth counties. Athens-Clarke County MSA: Clarke, Madison, Oconee, and Oglethorpe counties. Atlanta MSA: Barrow, Bartow, Butts, Carroll, Cherokee, Clayton, Cobb, Coweta, Dawson, DeKalb, Douglas, Fayette, Forsyth, Fulton, Gwinnett, Haralson, Heard, Henry, Jasper, Lamar, Meriwether, Morgan, Newton, Paulding, Pickens, Pike, Rockdale, Spalding, and Walton counties. Augusta-Richmond County MSA:Burke,Columbia,Lincoln,McDuffie,andRichmondcountiesinGeorgiaandAikenandEdgefieldcountiesinSouthCarolina. Brunswick MSA: Brantley, Glynn, and McIntosh counties. Columbus MSA: Chattahoochee, Harris, Marion, and Muscogee counties in Georgia and Russell County in Alabama. Dalton MSA:MurrayandWhitfieldcounties. Gainesville MSA: Hall County. Hinesville MSA: Liberty and Long counties. Macon-Bibb County MSA: Bibb, Crawford, Jones, Monroe, and Twiggs counties. Rome MSA: Floyd County. Savannah MSA:Bryan,Chatham,andEffinghamcounties. Valdosta MSA: Brooks, Echols, Lanier, and Lowndes counties. Warner Robins MSA: Houston, Peach and Pulaski counties.
Source: Georgia Department of Labor, Workforce Statistics & Economic Research
Civilian labor forceEmployedUnemployedRate
Civilian labor forceEmployedUnemployedRate
Civilian labor forceEmployedUnemployedRate
Civilian labor forceEmployedUnemployedRate
Civilian labor forceEmployedUnemployedRate
Civilian labor forceEmployedUnemployed Rate
Civilian labor forceEmployedUnemployed Rate
Macon-Bibb County MSA
Rome MSA
Savannah MSA
Valdosta MSA
Warner Robins MSA
United States (Seasonally adjusted)
United States (Not Seasonally
adjusted)
Hinesville MSA Civilian labor forceEmployedUnemployedRate
Employment Status
Employment StatusArea
Place of Residence - Persons 16 Years and Older
United States labor Force EstimatesPlace of Residence - Persons 16 Years and Older
Change FromPreliminaryNOV 2019
RevisedOCT 2019
RevisedNOV 2018 OCT 2019 NOV 2018
164,404,000 164,364,000 162,821,000 40,000 1,583,000 158,593,000 158,510,000 156,803,000 83,000 1,790,000 5,811,000 5,855,000 6,018,000 -44,000 -207,000 3.5 3.6 3.7
164,386,000 164,576,000 162,665,000 -190,000 1,721,000 158,945,000 159,067,000 157,015,000 -122,000 1,930,000 5,441,000 5,510,000 5,650,000 -69,000 -209,000 3.3 3.3 3.5
33,754 33,831 33,634 -77 120 32,713 32,671 32,402 42 311 1,041 1,160 1,232 -119 -191 3.1 3.4 3.7
103,931 103,651 104,859 280 -928 100,882 100,212 100,697 670 185 3,049 3,439 4,162 -390 -1,113 2.9 3.3 4.0
44,682 44,712 44,113 -30 569 43,293 43,241 42,440 52 853 1,389 1,471 1,673 -82 -284 3.1 3.3 3.8
188,546 187,966 187,340 580 1,206 183,701 182,475 181,377 1,226 2,324 4,845 5,491 5,963 -646 -1,118 2.6 2.9 3.2
65,045 64,945 65,291 100 -246 63,172 62,891 63,025 281 147 1,873 2,054 2,266 -181 -393 2.9 3.2 3.5
85,677 86,015 86,877 -338 -1,200 83,363 83,268 83,033 95 330 2,314 2,747 3,844 -433 -1,530 2.7 3.2 4.4
Change FromNOV 2019 OCT 2019 NOV 2018 OCT 2019 NOV 2018

17
Labor Employ- Unemployment Force ment Number Rate
Labor Employ- Unemployment Force ment Number Rate
Labor Employ- Unemployment Force ment Number Rate
Source: Georgia Department of Labor, Workforce Statistics & Economic Research
Georgia labor Force Estimates by County (not seasonally adjusted)Place of Residence - Persons 16 Years and Older
Georgia 5,124,821 4,985,527 139,294 2.7 5,132,608 4,976,331 156,277 3.0 5,111,058 4,935,035 176,023 3.4
Appling 9,012 8,746 266 3.0 9,036 8,742 294 3.3 9,205 8,872 333 3.6Atkinson 4,583 4,484 99 2.2 4,594 4,480 114 2.5 4,391 4,274 117 2.7Bacon 5,083 4,923 160 3.1 5,102 4,924 178 3.5 5,158 4,989 169 3.3Baker 1,224 1,174 50 4.1 1,215 1,166 49 4.0 1,291 1,235 56 4.3Baldwin 17,391 16,732 659 3.8 17,351 16,715 636 3.7 17,053 16,314 739 4.3
Banks 9,881 9,660 221 2.2 9,785 9,551 234 2.4 9,934 9,680 254 2.6Barrow 40,012 39,131 881 2.2 40,078 39,068 1,010 2.5 39,669 38,554 1,115 2.8Bartow 50,514 49,189 1,325 2.6 50,582 49,105 1,477 2.9 50,131 48,506 1,625 3.2Ben Hill 5,174 4,915 259 5.0 5,201 4,939 262 5.0 5,463 5,204 259 4.7Berrien 7,579 7,254 325 4.3 7,570 7,227 343 4.5 7,654 7,394 260 3.4
Bibb 68,565 66,491 2,074 3.0 68,417 66,050 2,367 3.5 69,176 66,285 2,891 4.2Bleckley 4,653 4,473 180 3.9 4,658 4,456 202 4.3 4,844 4,575 269 5.6Brantley 7,302 7,072 230 3.1 7,314 7,055 259 3.5 7,335 7,051 284 3.9Brooks 7,116 6,911 205 2.9 7,092 6,874 218 3.1 7,271 7,025 246 3.4Bryan 17,853 17,427 426 2.4 17,816 17,312 504 2.8 17,745 17,218 527 3.0
Bulloch 36,768 35,723 1,045 2.8 36,651 35,471 1,180 3.2 38,233 36,883 1,350 3.5Burke 9,252 8,888 364 3.9 9,236 8,854 382 4.1 9,351 8,889 462 4.9Butts 10,790 10,520 270 2.5 10,806 10,500 306 2.8 10,751 10,377 374 3.5Calhoun 2,229 2,164 65 2.9 2,207 2,131 76 3.4 2,398 2,314 84 3.5Camden 21,031 20,450 581 2.8 21,109 20,431 678 3.2 21,047 20,289 758 3.6
Candler 5,475 5,354 121 2.2 5,500 5,352 148 2.7 5,577 5,415 162 2.9Carroll 55,714 54,198 1,516 2.7 55,812 54,114 1,698 3.0 55,298 53,422 1,876 3.4Catoosa 33,196 32,427 769 2.3 33,295 32,419 876 2.6 33,082 32,118 964 2.9Charlton 4,783 4,644 139 2.9 4,793 4,635 158 3.3 4,824 4,659 165 3.4Chatham 140,762 137,042 3,720 2.6 140,315 136,132 4,183 3.0 139,848 135,275 4,573 3.3
Chattahoochee 1,931 1,866 65 3.4 1,940 1,864 76 3.9 1,998 1,900 98 4.9Chattooga 10,211 9,879 332 3.3 10,270 9,886 384 3.7 10,520 10,086 434 4.1Cherokee 134,018 131,136 2,882 2.2 134,246 130,957 3,289 2.4 132,607 129,020 3,587 2.7Clarke 61,682 60,062 1,620 2.6 61,918 60,038 1,880 3.0 62,428 60,319 2,109 3.4Clay 882 825 57 6.5 890 835 55 6.2 887 827 60 6.8
Clayton 137,111 132,434 4,677 3.4 137,284 132,214 5,070 3.7 136,161 130,431 5,730 4.2Clinch 2,723 2,641 82 3.0 2,723 2,635 88 3.2 2,779 2,679 100 3.6Cobb 429,877 419,798 10,079 2.3 430,495 419,208 11,287 2.6 425,559 413,027 12,532 2.9Coffee 18,741 18,176 565 3.0 18,760 18,147 613 3.3 18,787 18,119 668 3.6Colquitt 21,563 21,038 525 2.4 21,749 21,142 607 2.8 22,268 21,583 685 3.1
Columbia 74,607 72,828 1,779 2.4 74,673 72,632 2,041 2.7 74,463 72,180 2,283 3.1Cook 8,028 7,783 245 3.1 8,025 7,772 253 3.2 8,040 7,785 255 3.2Coweta 74,085 72,403 1,682 2.3 74,211 72,288 1,923 2.6 73,426 71,317 2,109 2.9Crawford 5,663 5,506 157 2.8 5,655 5,469 186 3.3 5,786 5,528 258 4.5Crisp 9,356 9,062 294 3.1 9,403 9,044 359 3.8 9,850 9,030 820 8.3
Preliminary November 2019 Revised October 2019 Revised November 2018

Georgia labor Force Estimates by County (not seasonally adjusted)Place of Residence - Persons 16 Years and Older
18
Labor Employ- Unemployment Force ment Number Rate
Labor Employ- Unemployment Force ment Number Rate
Labor Employ- Unemployment Force ment Number Rate
Source: Georgia Department of Labor, Workforce Statistics & Economic Research
Dade 8,260 8,053 207 2.5 8,289 8,057 232 2.8 8,228 7,966 262 3.2Dawson 12,110 11,854 256 2.1 12,147 11,839 308 2.5 12,050 11,689 361 3.0Decatur 11,510 11,153 357 3.1 11,449 11,050 399 3.5 11,807 11,325 482 4.1DeKalb 402,233 391,313 10,920 2.7 402,873 390,741 12,132 3.0 398,757 384,970 13,787 3.5Dodge 7,092 6,778 314 4.4 7,130 6,782 348 4.9 7,167 6,839 328 4.6
Dooly 5,006 4,852 154 3.1 5,034 4,856 178 3.5 5,591 5,125 466 8.3Dougherty 37,997 36,566 1,431 3.8 38,040 36,504 1,536 4.0 38,717 36,901 1,816 4.7Douglas 73,365 71,265 2,100 2.9 73,475 71,162 2,313 3.1 72,726 70,113 2,613 3.6Early 4,390 4,240 150 3.4 4,413 4,265 148 3.4 4,578 4,378 200 4.4Echols 1,928 1,886 42 2.2 1,919 1,872 47 2.4 2,001 1,947 54 2.7
Effingham 29,931 29,232 699 2.3 29,835 29,031 804 2.7 29,747 28,884 863 2.9Elbert 7,543 7,284 259 3.4 7,609 7,314 295 3.9 7,777 7,485 292 3.8Emanuel 8,264 7,922 342 4.1 8,303 7,893 410 4.9 8,329 7,936 393 4.7Evans 4,828 4,699 129 2.7 4,856 4,710 146 3.0 4,975 4,829 146 2.9Fannin 11,601 11,301 300 2.6 11,655 11,308 347 3.0 11,085 10,736 349 3.1
Fayette 58,226 56,869 1,357 2.3 58,318 56,780 1,538 2.6 57,721 55,978 1,743 3.0Floyd 44,682 43,293 1,389 3.1 44,712 43,241 1,471 3.3 44,113 42,440 1,673 3.8Forsyth 119,127 116,577 2,550 2.1 119,349 116,400 2,949 2.5 118,057 114,804 3,253 2.8Franklin 9,917 9,633 284 2.9 9,954 9,631 323 3.2 10,040 9,717 323 3.2Fulton 558,722 543,302 15,420 2.8 559,674 542,487 17,187 3.1 554,076 534,793 19,283 3.5
Gilmer 11,858 11,526 332 2.8 11,937 11,563 374 3.1 11,929 11,506 423 3.5Glascock 1,278 1,239 39 3.1 1,283 1,240 43 3.4 1,317 1,269 48 3.6Glynn 40,055 39,033 1,022 2.6 40,117 38,930 1,187 3.0 39,876 38,587 1,289 3.2Gordon 28,240 27,475 765 2.7 28,399 27,523 876 3.1 27,829 26,958 871 3.1Grady 10,533 10,237 296 2.8 10,529 10,191 338 3.2 10,836 10,474 362 3.3
Greene 6,871 6,662 209 3.0 6,933 6,694 239 3.4 6,948 6,681 267 3.8Gwinnett 491,594 479,943 11,651 2.4 492,487 479,294 13,193 2.7 486,786 472,158 14,628 3.0Habersham 19,287 18,667 620 3.2 19,208 18,625 583 3.0 19,528 18,928 600 3.1Hall 105,044 102,849 2,195 2.1 104,994 102,497 2,497 2.4 103,495 100,683 2,812 2.7Hancock 2,518 2,384 134 5.3 2,490 2,376 114 4.6 2,511 2,388 123 4.9
Haralson 12,599 12,254 345 2.7 12,618 12,237 381 3.0 12,466 12,058 408 3.3Harris 16,434 16,043 391 2.4 16,498 16,039 459 2.8 16,731 16,245 486 2.9Hart 11,466 11,145 321 2.8 11,567 11,118 449 3.9 11,751 11,393 358 3.0Heard 5,251 5,106 145 2.8 5,249 5,096 153 2.9 5,217 5,044 173 3.3Henry 114,585 111,375 3,210 2.8 114,777 111,181 3,596 3.1 113,847 109,686 4,161 3.7
Houston 69,794 67,959 1,835 2.6 70,026 67,887 2,139 3.1 70,468 67,592 2,876 4.1Irwin 3,106 2,986 120 3.9 3,116 2,983 133 4.3 3,457 3,302 155 4.5Jackson 37,910 37,183 727 1.9 37,086 36,257 829 2.2 37,641 36,688 953 2.5Jasper 6,989 6,819 170 2.4 6,993 6,807 186 2.7 6,973 6,742 231 3.3JeffDavis 5,996 5,776 220 3.7 6,043 5,802 241 4.0 6,026 5,778 248 4.1
Preliminary November 2019 Revised October 2019 Revised November 2018

Georgia labor Force Estimates by County (not seasonally adjusted)Place of Residence - Persons 16 Years and Older
19
Labor Employ- Unemployment Force ment Number Rate
Labor Employ- Unemployment Force ment Number Rate
Labor Employ- Unemployment Force ment Number Rate
Source: Georgia Department of Labor, Workforce Statistics & Economic Research
Jefferson 6,554 6,298 256 3.9 6,557 6,269 288 4.4 6,797 6,502 295 4.3Jenkins 3,134 3,022 112 3.6 3,158 3,029 129 4.1 3,185 3,042 143 4.5Johnson 4,110 3,993 117 2.8 4,101 3,976 125 3.0 4,220 4,081 139 3.3Jones 13,829 13,467 362 2.6 13,769 13,377 392 2.8 13,920 13,467 453 3.3Lamar 8,138 7,892 246 3.0 8,165 7,882 283 3.5 8,088 7,764 324 4.0
Lanier 3,868 3,746 122 3.2 3,861 3,730 131 3.4 3,879 3,733 146 3.8Laurens 19,353 18,603 750 3.9 19,345 18,535 810 4.2 19,697 18,910 787 4.0Lee 14,805 14,423 382 2.6 14,804 14,399 405 2.7 15,026 14,563 463 3.1Liberty 25,711 24,901 810 3.2 25,768 24,872 896 3.5 25,562 24,610 952 3.7Lincoln 3,577 3,466 111 3.1 3,575 3,453 122 3.4 3,620 3,482 138 3.8
Long 8,043 7,812 231 2.9 8,063 7,799 264 3.3 8,072 7,792 280 3.5Lowndes 52,133 50,629 1,504 2.9 52,073 50,415 1,658 3.2 52,140 50,320 1,820 3.5Lumpkin 17,002 16,603 399 2.3 17,071 16,585 486 2.8 16,742 16,206 536 3.2McDuffie 8,922 8,536 386 4.3 8,942 8,512 430 4.8 8,913 8,475 438 4.9McIntosh 6,167 6,003 164 2.7 6,172 5,980 192 3.1 6,219 6,008 211 3.4
Macon 4,712 4,545 167 3.5 4,714 4,517 197 4.2 5,130 4,604 526 10.3Madison 13,745 13,420 325 2.4 13,792 13,417 375 2.7 13,880 13,476 404 2.9Marion 3,341 3,236 105 3.1 3,354 3,236 118 3.5 3,432 3,281 151 4.4Meriwether 8,991 8,666 325 3.6 9,003 8,650 353 3.9 8,953 8,567 386 4.3Miller 2,825 2,749 76 2.7 2,829 2,748 81 2.9 2,929 2,824 105 3.6
Mitchell 8,396 8,031 365 4.3 8,363 8,009 354 4.2 8,652 8,260 392 4.5Monroe 12,977 12,643 334 2.6 12,919 12,562 357 2.8 13,060 12,639 421 3.2Montgomery 3,645 3,501 144 4.0 3,678 3,505 173 4.7 3,811 3,633 178 4.7Morgan 9,134 8,912 222 2.4 9,152 8,895 257 2.8 9,112 8,845 267 2.9Murray 15,816 15,139 677 4.3 15,961 15,189 772 4.8 15,898 15,163 735 4.6
Muscogee 77,475 74,690 2,785 3.6 77,789 74,685 3,104 4.0 78,805 75,414 3,391 4.3Newton 52,043 50,463 1,580 3.0 52,148 50,380 1,768 3.4 51,720 49,735 1,985 3.8Oconee 19,787 19,417 370 1.9 19,849 19,412 437 2.2 20,009 19,495 514 2.6Oglethorpe 7,164 6,989 175 2.4 7,176 6,980 196 2.7 7,305 7,073 232 3.2Paulding 84,590 82,611 1,979 2.3 84,705 82,474 2,231 2.6 83,876 81,384 2,492 3.0
Peach 11,775 11,408 367 3.1 11,867 11,392 475 4.0 12,161 11,431 730 6.0Pickens 15,268 14,913 355 2.3 15,303 14,892 411 2.7 15,142 14,680 462 3.1Pierce 8,586 8,354 232 2.7 8,577 8,302 275 3.2 8,728 8,441 287 3.3Pike 8,813 8,599 214 2.4 8,824 8,585 239 2.7 8,767 8,482 285 3.3Polk 18,348 17,814 534 2.9 18,376 17,800 576 3.1 18,361 17,701 660 3.6
Pulaski 4,108 3,996 112 2.7 4,122 3,989 133 3.2 4,248 4,010 238 5.6Putnam 8,175 7,909 266 3.3 8,210 7,911 299 3.6 8,204 7,847 357 4.4Quitman 802 768 34 4.2 802 769 33 4.1 819 777 42 5.1Rabun 7,044 6,829 215 3.1 7,140 6,894 246 3.4 7,088 6,854 234 3.3Randolph 2,540 2,431 109 4.3 2,553 2,439 114 4.5 2,543 2,406 137 5.4
Preliminary November 2019 Revised October 2019 Revised November 2018

Georgia labor Force Estimates by County (not seasonally adjusted)
20
Labor Employ- Unemployment Force ment Number Rate
Labor Employ- Unemployment Force ment Number Rate
Labor Employ- Unemployment Force ment Number Rate
Source: Georgia Department of Labor, Workforce Statistics & Economic Research
Place of Residence - Persons 16 Years and Older
Richmond 85,822 82,773 3,049 3.6 85,858 82,528 3,330 3.9 85,866 82,057 3,809 4.4Rockdale 45,086 43,745 1,341 3.0 45,176 43,680 1,496 3.3 44,753 43,050 1,703 3.8Schley 2,174 2,105 69 3.2 2,191 2,113 78 3.6 2,187 2,101 86 3.9Screven 5,004 4,800 204 4.1 5,017 4,804 213 4.2 5,379 5,121 258 4.8Seminole 3,269 3,169 100 3.1 3,309 3,192 117 3.5 3,081 2,932 149 4.8
Spalding 28,646 27,749 897 3.1 28,713 27,705 1,008 3.5 28,543 27,344 1,199 4.2Stephens 10,637 10,302 335 3.1 10,660 10,304 356 3.3 11,015 10,598 417 3.8Stewart 2,352 2,276 76 3.2 2,347 2,265 82 3.5 2,386 2,277 109 4.6Sumter 12,615 12,113 502 4.0 12,726 12,169 557 4.4 13,037 12,142 895 6.9Talbot 2,821 2,725 96 3.4 2,835 2,727 108 3.8 2,853 2,728 125 4.4
Taliaferro 583 553 30 5.1 585 555 30 5.1 583 556 27 4.6Tattnall 9,469 9,188 281 3.0 9,512 9,198 314 3.3 9,773 9,432 341 3.5Taylor 3,151 3,046 105 3.3 3,181 3,050 131 4.1 2,859 2,623 236 8.3Telfair 4,054 3,702 352 8.7 4,062 3,702 360 8.9 4,242 4,018 224 5.3Terrell 3,572 3,450 122 3.4 3,583 3,443 140 3.9 3,805 3,494 311 8.2
Thomas 16,754 16,184 570 3.4 16,845 16,225 620 3.7 16,986 16,284 702 4.1Tift 19,515 18,974 541 2.8 19,515 18,909 606 3.1 19,670 18,977 693 3.5Toombs 11,417 10,995 422 3.7 11,543 11,009 534 4.6 11,934 11,388 546 4.6Towns 3,931 3,781 150 3.8 4,005 3,839 166 4.1 3,858 3,679 179 4.6Treutlen 2,557 2,457 100 3.9 2,599 2,466 133 5.1 2,668 2,541 127 4.8
Troup 36,783 35,797 986 2.7 36,883 35,816 1,067 2.9 36,329 35,217 1,112 3.1Turner 3,119 3,018 101 3.2 3,134 3,024 110 3.5 3,228 3,079 149 4.6Twiggs 2,897 2,775 122 4.2 2,891 2,754 137 4.7 2,917 2,778 139 4.8Union 10,421 10,179 242 2.3 10,435 10,159 276 2.6 10,449 10,134 315 3.0Upson 11,281 10,937 344 3.0 11,322 10,937 385 3.4 11,340 10,895 445 3.9
Walker 31,162 30,351 811 2.6 31,255 30,339 916 2.9 31,158 30,119 1,039 3.3Walton 45,630 44,530 1,100 2.4 45,698 44,456 1,242 2.7 45,265 43,871 1,394 3.1Ware 15,495 15,033 462 3.0 15,463 14,936 527 3.4 15,740 15,174 566 3.6Warren 2,792 2,683 109 3.9 2,799 2,679 120 4.3 2,742 2,607 135 4.9Washington 6,989 6,748 241 3.4 6,993 6,740 253 3.6 7,118 6,823 295 4.1
Wayne 11,385 11,034 351 3.1 11,410 11,008 402 3.5 11,367 10,897 470 4.1Webster 1,008 974 34 3.4 1,018 973 45 4.4 1,035 973 62 6.0Wheeler 1,602 1,497 105 6.6 1,607 1,490 117 7.3 1,680 1,580 100 6.0White 16,456 16,120 336 2.0 16,609 16,224 385 2.3 16,107 15,697 410 2.5Whitfield 44,718 43,201 1,517 3.4 45,292 43,359 1,933 4.3 45,044 43,160 1,884 4.2
Wilcox 2,745 2,654 91 3.3 2,783 2,678 105 3.8 2,815 2,649 166 5.9Wilkes 3,866 3,705 161 4.2 3,891 3,718 173 4.4 3,904 3,755 149 3.8Wilkinson 3,903 3,773 130 3.3 3,924 3,795 129 3.3 3,804 3,654 150 3.9Worth 9,114 8,837 277 3.0 9,131 8,814 317 3.5 9,365 8,992 373 4.0
Preliminary November 2019 Revised October 2019 Revised November 2018

21
Note: City estimates were prepared in cooperation with the U.S. Department of Labor, Bureau of Labor Statistics. All cities listed have total population of 25,000 or more and an asterisks (*) designates cities with population of 50,000 or more.
Source: Georgia Department of Labor, Workforce Statistics & Economic Research
Labor Employ- Unemployment Force ment Number Rate
Labor Employ- Unemployment Force ment Number Rate
Labor Employ- Unemployment Force ment Number Rate
City labor Force Estimates Place of Residence - Persons 16 Years and Older
Preliminary November 2019 Revised October 2019 Revised November 2018
*Albany 30,690 29,518 1,172 3.8 30,746 29,468 1,278 4.2 31,299 29,789 1,510 4.8
*Alpharetta 36,905 36,127 778 2.1 36,985 36,072 913 2.5 36,542 35,561 981 2.7
*Athens 61,682 60,062 1,620 2.6 61,918 60,038 1,880 3.0 62,428 60,319 2,109 3.4
*Atlanta 257,907 250,493 7,414 2.9 258,404 250,118 8,286 3.2 256,060 246,559 9,501 3.7
Dekalb Part 20,572 20,128 444 2.2 20,613 20,098 515 2.5 20,364 19,802 562 2.8
Fulton Part 237,335 230,365 6,970 2.9 237,791 230,020 7,771 3.3 235,696 226,757 8,939 3.8
*Augusta 85,822 82,773 3,049 3.6 85,858 82,528 3,330 3.9 85,866 82,057 3,809 4.4
*Brookhaven 34,457 33,847 610 1.8 34,473 33,797 676 2.0 34,049 33,298 751 2.2
*Canton 14,976 14,676 300 2.0 15,000 14,656 344 2.3 14,790 14,439 351 2.4
Carrollton 11,678 11,292 386 3.3 11,722 11,274 448 3.8 11,604 11,130 474 4.1
*Chamblee 20,512 20,161 351 1.7 20,550 20,131 419 2.0 20,301 19,834 467 2.3
*Columbus 77,475 74,690 2,785 3.6 77,789 74,685 3,104 4.0 78,805 75,414 3,391 4.3
Dalton 14,110 13,606 504 3.6 14,277 13,656 621 4.3 14,226 13,593 633 4.4
Douglasville 17,274 16,739 535 3.1 17,292 16,715 577 3.3 17,090 16,469 621 3.6
Duluth 16,249 15,882 367 2.3 16,290 15,861 429 2.6 16,081 15,625 456 2.8
*Dunwoody 27,930 27,389 541 1.9 27,980 27,349 631 2.3 27,682 26,945 737 2.7
East Point 17,055 16,405 650 3.8 17,115 16,380 735 4.3 16,899 16,148 751 4.4
Gainesville 20,019 19,569 450 2.2 20,026 19,502 524 2.6 19,723 19,157 566 2.9
Hinesville 15,164 14,697 467 3.1 15,174 14,680 494 3.3 15,041 14,525 516 3.4
*Johns Creek 45,611 44,605 1,006 2.2 45,715 44,538 1,177 2.6 45,118 43,907 1,211 2.7
Kennesaw 20,445 19,965 480 2.3 20,457 19,937 520 2.5 20,196 19,643 553 2.7
LaGrange 15,159 14,673 486 3.2 15,179 14,680 499 3.3 14,945 14,435 510 3.4
Lawrenceville 14,627 14,216 411 2.8 14,641 14,197 444 3.0 14,503 13,985 518 3.6
*Macon-Bibb 68,565 66,491 2,074 3.0 68,417 66,050 2,367 3.5 69,176 66,285 2,891 4.2
*Marietta 36,164 35,322 842 2.3 36,224 35,273 951 2.6 35,782 34,753 1,029 2.9
Milton 20,316 19,848 468 2.3 20,334 19,818 516 2.5 20,092 19,537 555 2.8
Newnan 18,230 17,761 469 2.6 18,286 17,733 553 3.0 18,074 17,494 580 3.2
Peachtree City 18,553 18,164 389 2.1 18,562 18,136 426 2.3 18,373 17,879 494 2.7
P’tree Corners 25,154 24,583 571 2.3 25,188 24,550 638 2.5 24,887 24,185 702 2.8
Rome 15,557 15,032 525 3.4 15,550 15,014 536 3.4 15,353 14,736 617 4.0
*Roswell 54,580 53,463 1,117 2.0 54,618 53,383 1,235 2.3 54,025 52,626 1,399 2.6
*Sandy Springs 65,300 63,915 1,385 2.1 65,368 63,819 1,549 2.4 64,623 62,914 1,709 2.6
*Savannah 67,762 65,792 1,970 2.9 67,572 65,355 2,217 3.3 67,423 64,943 2,480 3.7
*Smyrna 35,617 34,823 794 2.2 35,666 34,774 892 2.5 35,279 34,261 1,018 2.9
Statesboro 13,881 13,341 540 3.9 13,845 13,247 598 4.3 14,442 13,774 668 4.6
Stockbridge 14,375 13,903 472 3.3 14,394 13,879 515 3.6 14,277 13,693 584 4.1
Tucker 20,081 19,586 495 2.5 20,080 19,557 523 2.6 19,925 19,269 656 3.3
*Valdosta 25,537 24,720 817 3.2 25,514 24,616 898 3.5 25,550 24,569 981 3.8
*Warner Robins 33,029 32,098 931 2.8 33,161 32,064 1,097 3.3 33,347 31,927 1,420 4.3
Woodstock 17,210 16,863 347 2.0 17,266 16,840 426 2.5 17,055 16,591 464 2.7

22
Source: Georgia Department of Labor, Workforce Statistics and Economic Research
Georgia Unemployment Rates by County
November 2019
Ware3.0
Burke3.9
Clinch3.0
Hall2.1
Laurens3.9
Early3.4
Lee2.6
Wayne3.1
Floyd3.1
Worth3.0
Coffee3.0
Bulloch2.8
Charlton2.9
Fulton2.8
Tift2.8
Screven4.1
Emanuel4.1
Decatur3.1
Harris2.4
Long2.9
Troup2.7
Dodge4.4
Liberty3.2
Carroll2.7
Bryan2.4
Grady2.8
Irwin3.9
Wilkes4.2
Telfair8.7
Polk2.9
Camden2.8
Colquitt2.4
Dooly3.1
Sumter4.0
Brooks2.9
Thomas3.4
Walker2.6
Bartow2.6
Tattnall3.0
Gilmer2.8
Jones2.6
Cobb2.3
Appling3.0
Mitchell4.3
Talbot3.4
Elbert3.4
Hart2.8
Berrien4.3
Taylor3.3
Glynn2.6
Stewart3.2
Macon3.5
Coweta2.3
Echols2.2
Rabun3.1
Baker4.1
Fannin2.6
Washington3.4
Union2.3
Greene3.0
Jefferson3.9
Wilcox3.3
Jasper2.4
Henry2.8
Hancock5.3
Lowndes2.9
Bibb3.0
Pierce2.7
Terrell3.4
Marion3.1
Monroe2.6
Brantley3.1
Crisp3.1
Twiggs4.2
Pike2.4
Heard2.8
Miller2.7
Murray4.3
Upson3.0
Gwinnett2.4
Clay6.5
Chatham2.6
Walton2.4
Gordon2.7
Morgan2.4
Putnam3.3
Effingham2.3
Cherokee2.2
Toombs3.7
Meriwether3.6
Wilkinson3.3
Jenkins3.6
Houston2.6
Turner3.2
Randolph4.3
Bacon3.1
Cook3.1
White2.0
McIntosh2.7
Jackson1.9
Warren3.9
Oglethorpe2.4
DeKalb2.7
Banks2.2
Atkinson2.2
Newton3.0
Paulding2.3
Crawford2.8
Butts2.5
Johnson2.8
Madison2.4
Pulaski2.7
Jeff Davis3.7
Calhoun2.9
Baldwin3.8
Lumpkin2.3
Franklin2.9
Forsyth2.1
Columbia2.4
Ben Hill5.0
Haralson2.7
Candler2.2
Dougherty3.8
Lanier3.2
Chattooga3.3
Evans2.7
Pickens2.3
Lamar3.0
Wheeler6.6
Lincoln3.1
Dade2.5
Whitfield3.4
Richmond3.6
McDuffie4.3Fayette
2.3
Towns3.8
Dawson2.1
Seminole3.1
Bleckley3.9
Webster3.4
Habersham3.2
Treutlen3.9
Schley3.2
Douglas2.9
Oconee 1.9
Peach3.1
Barrow2.2
Spalding3.1
Muscogee3.6
Taliaferro 5.1
Catoosa2.3
Stephens3.1
Montgomery4.0
Clarke 2.6
Clayton3.4
Quitman4.2
Chattahoochee3.4
Glascock 3.1
Rockdale3.0
UNEMPLOYMENT RATE BY COUNTIESNOVEMBER 2019
Georgia's Unemployment Rate: 2.7%(not seasonally adjusted)
Percentages of number of countiesmay not total 100 due to rounding
5.0% or greater6 counties (4%)4.0% to 4.9%14 counties (9%)3.0% to 3.9%66 counties (42%)Less than 3.0%73 counties (46%)
Georgia’s Unemployment Rate: 2.7 %(Not Seasonally Adjusted)

23
☞Note: Initial claims include intrastate initial and additional claims, as well as agent state initial and additional claims for regular UI only. Average duration of benefits is represented in weeks.Data does not include state or federal extended benefits.
Source: Georgia Department of Labor, Workforce Statistics and Economic Research
Georgia Unemployment insurance Claims by County
November 2019 Average Average Initial Weekly Duration County Claims Benefit Weeks
November 2019 Average Average Initial Weekly Duration County Claims Benefit Weeks
November 2019 Average Average Initial Weekly Duration County Claims Benefit Weeks
Georgia 19,703 .......$310 ........8.2
Appling 75 ....... $311 ........9.1Atkinson 16 .......$255 ........4.3Bacon 25 .......$317 ........5.9Baker 4 .......$177 ........9.6Baldwin 93 .......$270 ........7.9Banks 36 .......$281 ........5.1Barrow 80 .......$274 ........8.1Bartow 216 .......$273 ........5.3Ben Hill 46 .......$248 ........4.8Berrien 32 .......$260 ........5.0Bibb 267 .......$232 ........8.9Bleckley 39 .......$241 ........9.8Brantley 26 .......$257 ........8.2Brooks 32 .......$265 ........7.7Bryan 43 .......$278 ........8.0Bulloch 96 .......$223 ........6.1Burke 75 .......$280 ........6.7Butts 39 .......$268 ........9.2Calhoun 11 .......$222 ........7.5Camden 34 .......$239 ........8.9Candler 25 .......$217 ........6.7Carroll 193 .......$265 ........7.8Catoosa 84 .......$288 ........4.7Charlton 11 .......$288 ......11.2Chatham 387 .......$268 ........8.4Chattahoochee 6 .......$331 ........8.4Chattooga 64 .......$274 ........6.9Cherokee 266 .......$299 ........8.3Clarke 262 .......$248 ........5.7Clay 10 .......$186 ........8.8Clayton 734 .......$264 ........9.4Clinch 14 .......$252 ........6.1Cobb 1,042 .......$291 ........9.2Coffee 81 .......$233 ........6.2Colquitt 68 .......$204 ........7.3Columbia 141 .......$278 ........7.7Cook 51 .......$236 ........7.1Coweta 156 .......$292 ........6.3Crawford 14 .......$212 ........7.8Crisp 67 .......$251 ........7.3Dade 9 .......$242 ........6.5Dawson 40 .......$285 ........8.3Decatur 56 .......$243 ......10.0DeKalb 1,315 .......$274 ........9.3Dodge 35 .......$210 ......11.2Dooly 23 .......$206 ........6.3Dougherty 209 .......$237 ........8.6Douglas 286 .......$289 ........9.0Early 26 .......$192 ........9.6Echols 3 .......$282 ........7.6Effingham 66 .......$291 ........7.0
Muscogee 485 .......$244 ........8.1Newton 236 .......$275 ........8.9Oconee 26 .......$281 ........8.8Oglethorpe 18 .......$223 ........7.1Paulding 226 .......$271 ........8.2Peach 44 .......$218 ........6.5Pickens 40 .......$274 ........6.4Pierce 23 .......$253 ........6.3Pike 32 .......$234 ........7.1Polk 140 .......$304 ........5.3Pulaski 19 .......$263 ......10.3Putnam 33 .......$277 ........7.4Quitman 2 .......$209 ........7.2Rabun 69 .......$296 ........5.2Randolph 21 .......$203 ........8.0Richmond 424 .......$247 ........7.6Rockdale 184 .......$265 ........9.2Schley 15 .......$216 ........8.0Screven 50 .......$289 ........4.9Seminole 24 .......$199 ......10.3Spalding 160 .......$253 ........7.5Stephens 112 .......$270 ........4.8Stewart 19 .......$198 ......10.4Sumter 139 .......$253 ........8.6Talbot 21 .......$233 ........9.5Taliaferro 10 .......$282 ........4.1Tattnall 39 .......$239 ........8.8Taylor 30 .......$212 ........5.5Telfair 41 .......$248 ......13.5Terrell 25 .......$199 ........7.2Thomas 51 .......$253 ........8.3Tift 73 .......$231 ........7.3Toombs 65 .......$257 ........6.1Towns 17 .......$246 ........7.5Treutlen 17 .......$200 ........7.5Troup 151 .......$276 ........5.9Turner 23 .......$261 ........6.8Twiggs 28 .......$279 ........9.0Union 31 .......$298 ........8.2Upson 103 .......$238 ........6.1Walker 143 .......$289 ........4.6Walton 105 .......$274 ........8.4Ware 90 .......$227 ........6.1Warren 18 .......$291 ........6.3Washington 37 .......$253 ........8.8Wayne 35 .......$276 ........9.4Webster 4 .......$165 ........8.5Wheeler 18 .......$243 ......10.1White 56 .......$289 ........5.7Whitfield 741 .......$283 ........3.9Wilcox 14 .......$250 ........9.5Wilkes 19 .......$283 ........8.2Wilkinson 14 .......$293 ........7.8Worth 35 .......$271 ........7.3
Elbert 82 .......$209 ........5.2Emanuel 70 .......$237 ........7.7Evans 15 .......$248 ........8.8Fannin 38 .......$243 ........8.3Fayette 111 .......$295 ........8.8Floyd 330 .......$274 ........5.3Forsyth 165 .......$299 ........9.1Franklin 69 .......$285 ........4.9Fulton 1,807 .......$276 ........9.4Gilmer 46 .......$270 ........5.6Glascock 3 .......$295 ........6.5Glynn 135 .......$242 ........6.9Gordon 237 .......$283 ........4.4Grady 31 .......$252 ........7.3Greene 42 .......$250 ........6.8Gwinnett 999 .......$291 ........9.1Habersham 218 .......$291 ........4.2Hall 280 .......$284 ........6.8Hancock 34 .......$291 ........7.4Haralson 26 .......$274 ........7.9Harris 39 .......$254 ........7.8Hart 78 .......$261 ........5.2Heard 20 .......$259 ........5.8Henry 408 .......$288 ........9.0Houston 201 .......$245 ........7.8Irwin 26 .......$298 ........5.8Jackson 87 .......$267 ........7.3Jasper 24 .......$231 ........7.5JeffDavis 38 .......$262 ........9.1Jefferson 39 .......$269 ........6.9Jenkins 23 .......$237 ........5.3Johnson 27 .......$259 ........6.6Jones 31 .......$282 ........8.4Lamar 31 .......$256 ........7.4Lanier 17 .......$292 ........7.4Laurens 165 .......$245 ........8.7Lee 53 .......$284 ........7.5Liberty 100 .......$254 ........9.2Lincoln 18 .......$270 ........6.7Long 20 .......$231 ........9.9Lowndes 201 .......$244 ........8.1Lumpkin 60 .......$287 ........5.9Macon 44 .......$249 ........8.4Madison 66 .......$290 ........5.4Marion 13 .......$218 ........8.2McDuffie 67 .......$241 ........6.4McIntosh 15 .......$224 ........6.1Meriwether 50 .......$281 ........7.5Miller 12 .......$169 ......11.6Mitchell 51 .......$204 ........8.1Monroe 69 .......$265 ........8.7Montgomery 27 .......$210 ........7.8Morgan 28 .......$254 ........5.8Murray 327 .......$277 ........4.6

Mark Butler, Commissioner
148 Andrew Young International Boulevard, N.E.Atlanta, Georgia 30303-1751
Return Service Requested