directory of major sample surveys in...
TRANSCRIPT
Central Statistics Office, Ministry of Statistics & Programme
Implementation Government of India, New Delhi
Website:http//mospi.gov.in
DIRECTORY OF MAJOR
SAMPLE SURVEYS IN INDIA Occasional Report-2012
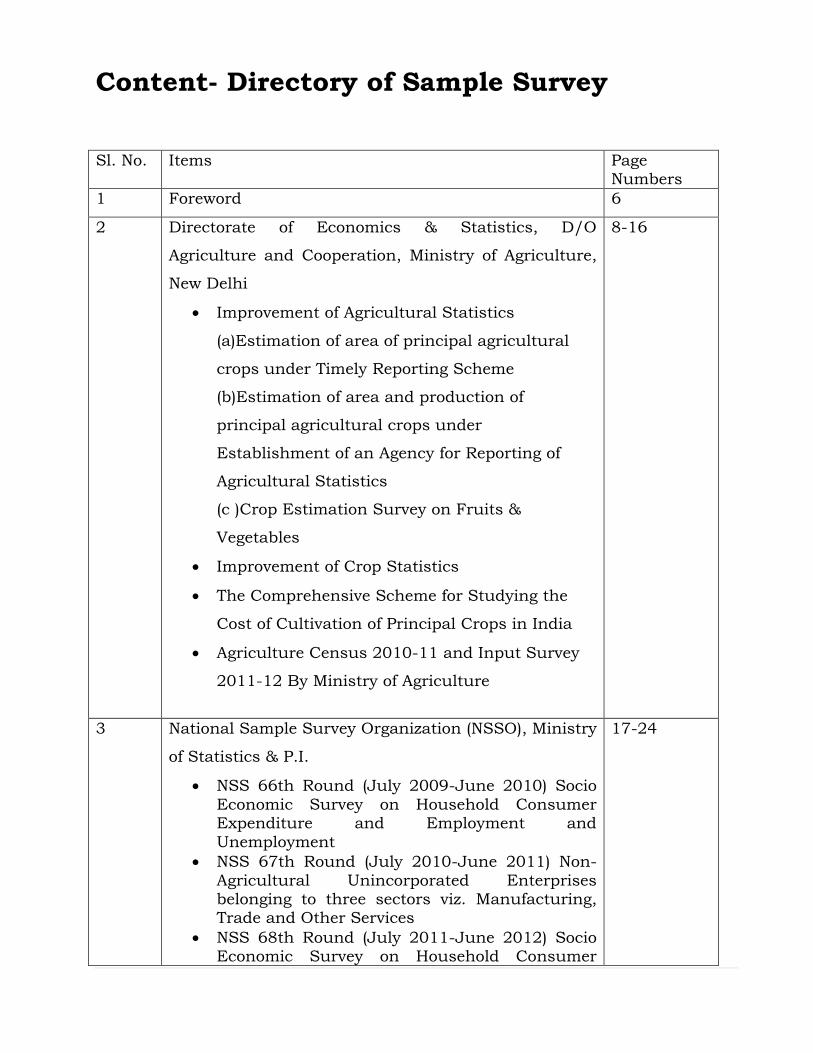
Content- Directory of Sample Survey
Sl. No. Items Page Numbers
1 Foreword 6
2 Directorate of Economics & Statistics, D/O
Agriculture and Cooperation, Ministry of Agriculture,
New Delhi
Improvement of Agricultural Statistics
(a)Estimation of area of principal agricultural
crops under Timely Reporting Scheme
(b)Estimation of area and production of
principal agricultural crops under
Establishment of an Agency for Reporting of
Agricultural Statistics
(c )Crop Estimation Survey on Fruits &
Vegetables
Improvement of Crop Statistics
The Comprehensive Scheme for Studying the
Cost of Cultivation of Principal Crops in India
Agriculture Census 2010-11 and Input Survey
2011-12 By Ministry of Agriculture
8-16
3 National Sample Survey Organization (NSSO), Ministry
of Statistics & P.I.
NSS 66th Round (July 2009-June 2010) Socio
Economic Survey on Household Consumer Expenditure and Employment and
Unemployment
NSS 67th Round (July 2010-June 2011) Non-
Agricultural Unincorporated Enterprises belonging to three sectors viz. Manufacturing, Trade and Other Services
NSS 68th Round (July 2011-June 2012) Socio Economic Survey on Household Consumer
17-24
Expenditure and Employment and
Unemployment
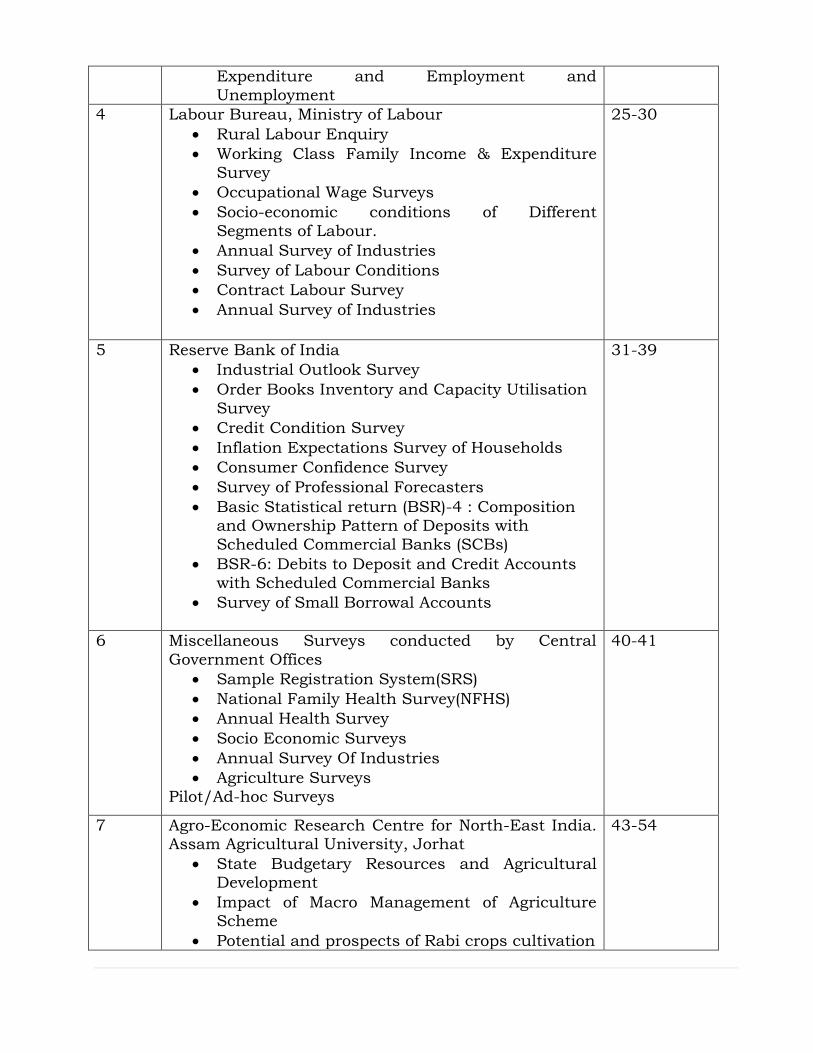
4 Labour Bureau, Ministry of Labour
Rural Labour Enquiry
Working Class Family Income & Expenditure
Survey
Occupational Wage Surveys
Socio-economic conditions of Different
Segments of Labour.
Annual Survey of Industries
Survey of Labour Conditions
Contract Labour Survey
Annual Survey of Industries
25-30
5 Reserve Bank of India
Industrial Outlook Survey
Order Books Inventory and Capacity Utilisation
Survey
Credit Condition Survey
Inflation Expectations Survey of Households
Consumer Confidence Survey
Survey of Professional Forecasters
Basic Statistical return (BSR)-4 : Composition and Ownership Pattern of Deposits with
Scheduled Commercial Banks (SCBs)
BSR-6: Debits to Deposit and Credit Accounts
with Scheduled Commercial Banks
Survey of Small Borrowal Accounts
31-39
6 Miscellaneous Surveys conducted by Central
Government Offices
Sample Registration System(SRS)
National Family Health Survey(NFHS)
Annual Health Survey
Socio Economic Surveys
Annual Survey Of Industries
Agriculture Surveys
Pilot/Ad-hoc Surveys
40-41
7 Agro-Economic Research Centre for North-East India. Assam Agricultural University, Jorhat
State Budgetary Resources and Agricultural Development
Impact of Macro Management of Agriculture Scheme
Potential and prospects of Rabi crops cultivation
43-54
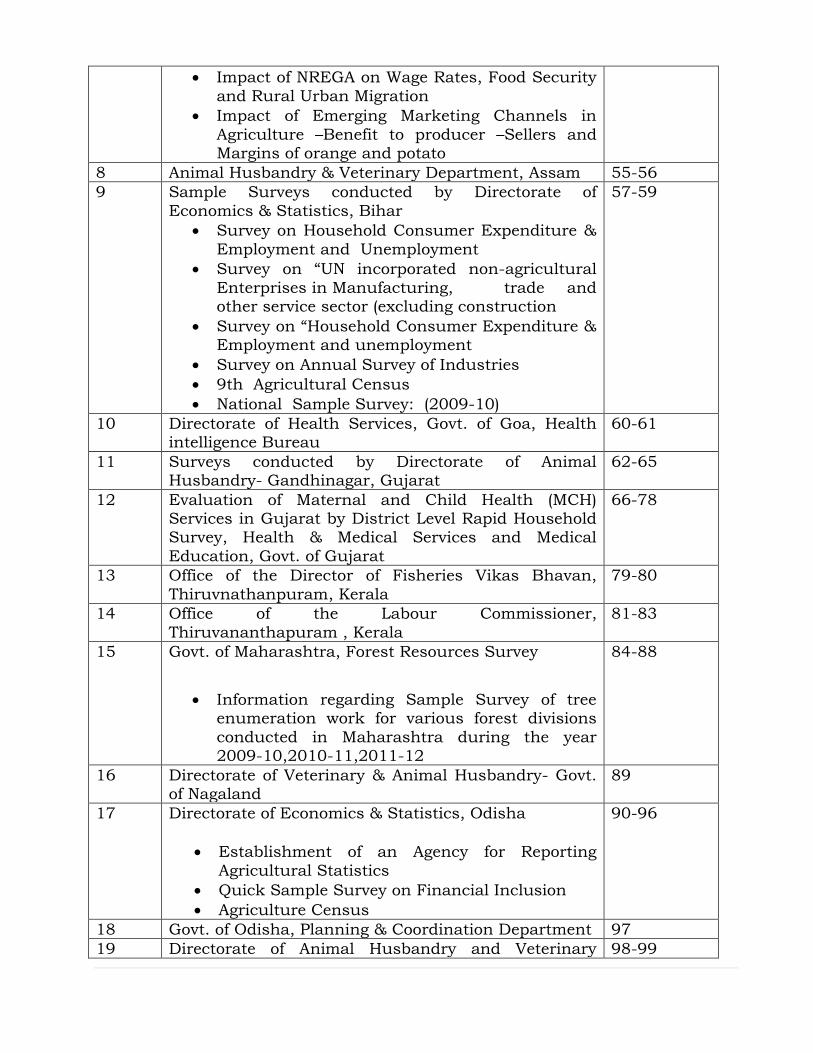
Impact of NREGA on Wage Rates, Food Security
and Rural Urban Migration
Impact of Emerging Marketing Channels in
Agriculture –Benefit to producer –Sellers and Margins of orange and potato
8 Animal Husbandry & Veterinary Department, Assam 55-56
9 Sample Surveys conducted by Directorate of
Economics & Statistics, Bihar
Survey on Household Consumer Expenditure &
Employment and Unemployment
Survey on “UN incorporated non-agricultural
Enterprises in Manufacturing, trade and other service sector (excluding construction
Survey on “Household Consumer Expenditure & Employment and unemployment
Survey on Annual Survey of Industries
9th Agricultural Census
National Sample Survey: (2009-10)
57-59
10 Directorate of Health Services, Govt. of Goa, Health intelligence Bureau
60-61
11 Surveys conducted by Directorate of Animal Husbandry- Gandhinagar, Gujarat
62-65
12 Evaluation of Maternal and Child Health (MCH) Services in Gujarat by District Level Rapid Household Survey, Health & Medical Services and Medical
Education, Govt. of Gujarat
66-78
13 Office of the Director of Fisheries Vikas Bhavan,
Thiruvnathanpuram, Kerala
79-80
14 Office of the Labour Commissioner,
Thiruvananthapuram , Kerala
81-83
15 Govt. of Maharashtra, Forest Resources Survey
Information regarding Sample Survey of tree enumeration work for various forest divisions
conducted in Maharashtra during the year 2009-10,2010-11,2011-12
84-88
16 Directorate of Veterinary & Animal Husbandry- Govt. of Nagaland
89
17 Directorate of Economics & Statistics, Odisha
Establishment of an Agency for Reporting
Agricultural Statistics
Quick Sample Survey on Financial Inclusion
Agriculture Census
90-96
18 Govt. of Odisha, Planning & Coordination Department 97
19 Directorate of Animal Husbandry and Veterinary 98-99
Services, Odisha, Cuttack
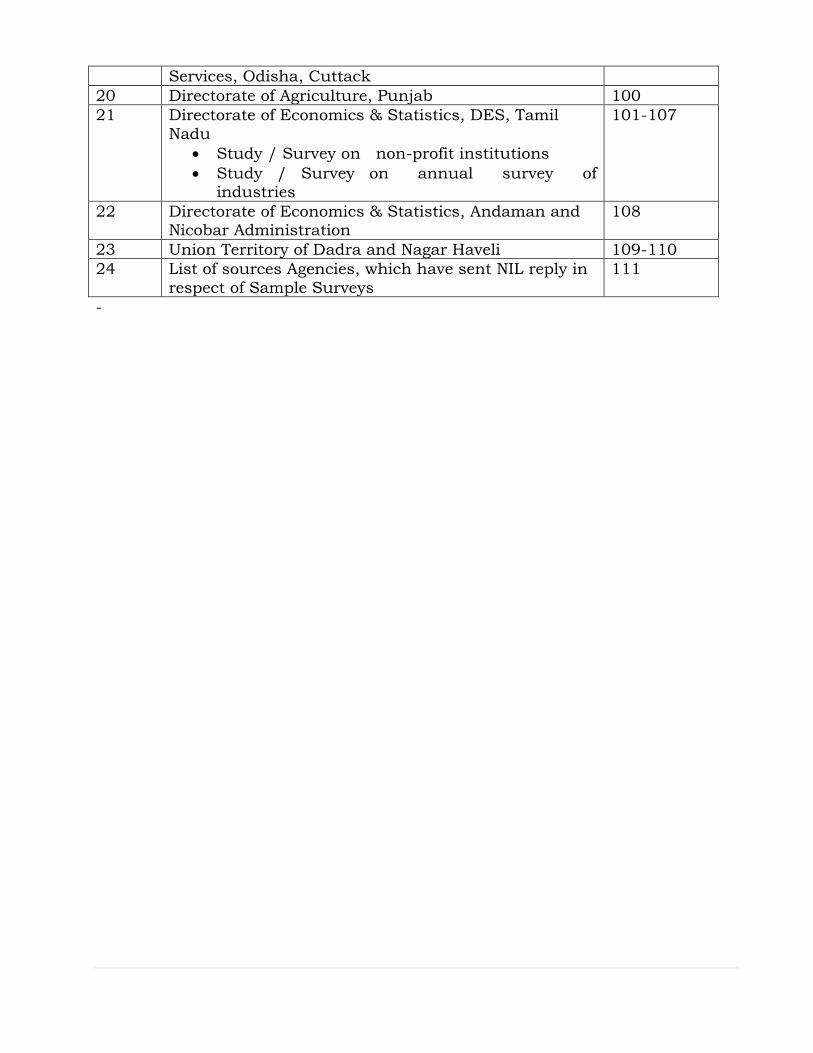
20 Directorate of Agriculture, Punjab 100
21 Directorate of Economics & Statistics, DES, Tamil
Nadu
Study / Survey on non-profit institutions
Study / Survey on annual survey of industries
101-107
22 Directorate of Economics & Statistics, Andaman and Nicobar Administration
108
23 Union Territory of Dadra and Nagar Haveli 109-110
24 List of sources Agencies, which have sent NIL reply in
respect of Sample Surveys
111
-
FOREWORD
As part of its mandate to coordinate statistical activities amongst Ministries/Departments of the
Government of India and with the State agencies involved in statistical activities with a view to improving the
quality of data; identifying gaps in data availability and suggestions remedial measures, including methodology
and analysis of data, the Ministry of Statistics and Programme Implementations has been bringing out the
publication “Directory of Sample Surveys in India” on an ad-hoc basis.
I am glad that the Coordination and Publication Division of the Ministry has now brought the
“Directory” covering sample surveys conducted/initiated by Central and State agencies during the years
2009,2010 & 2011, as reported by them. Sample Surveys conducted by various Ministries/Departments of
Government of India as also its organizations, have been reported in the publication. Coverage of sample
surveys carried out by the State/UT Directorates of Economics and Statistics (DESs) has also been included in
the report.
I am sure that various line departments of the State/UT Government are also conducting sample
surveys in their respective fields of interest, and in the next issue, efforts would be made to cover them in the
report. In today’s’ information age with the advent of internet and with most of the State DESs as also
Ministries/Departments of Government of India having their own web sites, more demanding users could see
the web sites of the concerned agencies or approach time for further details, when required.
I would like to add a word of caution here. It is possible that some organizations might have conducted
a few more surveys/studies, in addition to those reported by them. However, the report carries information as
received from them. This publication is only a ‘Compilation” of what has been reported to the Ministry, and it
does not necessarily endorse the methodology followed, sampling design adopted, sample size and whether it
was representative, conclusion drawn etc. The MOSPI would, however, be ever willing to assist the
Ministries/Department/Organizations as also State Government in designing their sample surveys or even in
preparing survey instruments, if approached for the purpose in advance so as to accord credibility to the
surveys conducted and conclusions drawn.
The Ministry would like to place on record its appreciation to all the concerned agencies for their
cooperation in supplying the information needed for preparation of this publication.
Efforts made by the Coordination and Publication Division (CAP) of the Ministry to bring out this
publication in a short period and coordinating with a large number of organizations are praise worthy, and I
congratulate all the officers and staff of the Division.
The directory is not an exhaustive one, however, Despite the various limitations, the information help
enrich understanding of the major sample surveys in India. I hope that users would find the report informative
and useful. We would also, of course, welcome suggestions for any improvement in the publication.
(Signed)
Dr. T.C.A. Anant
Secretary to the Government of India & Chief Statistician of India
New Delhi, the 28th March, 2013
MAJOR SAMPLE SURVEYS
CONDUCTED BY THE CENTRAL MINISTRIES
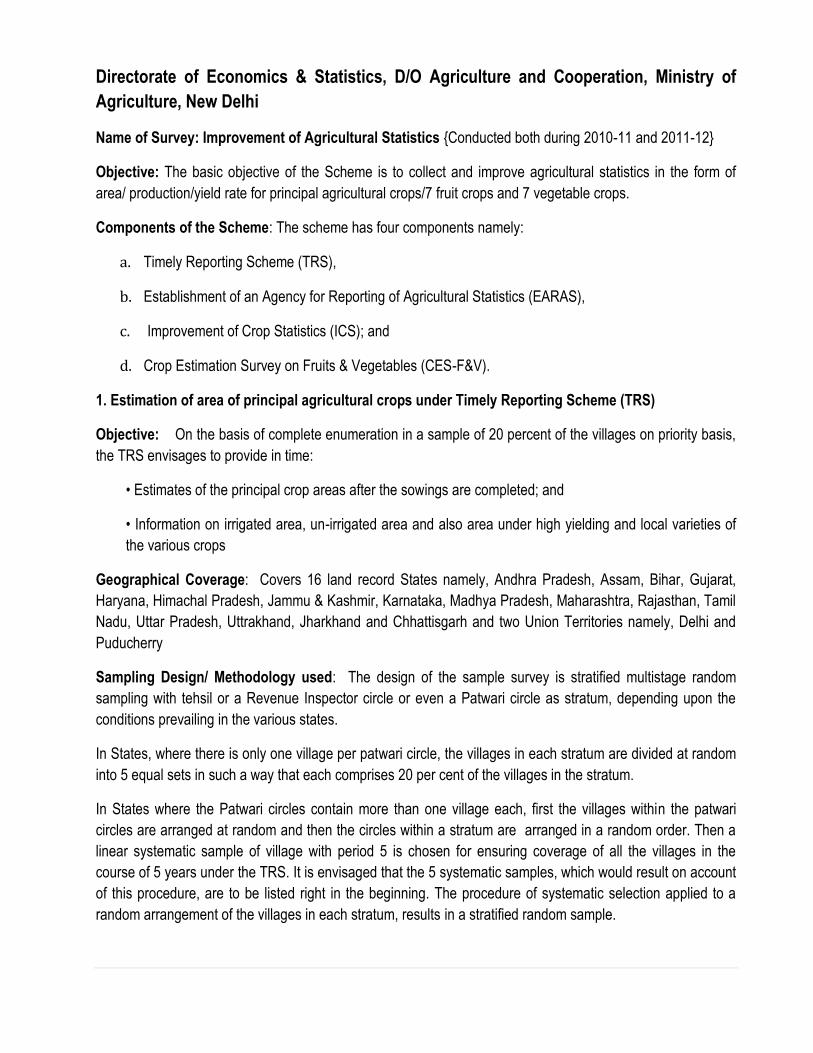
Directorate of Economics & Statistics, D/O Agriculture and Cooperation, Ministry of
Agriculture, New Delhi
Name of Survey: Improvement of Agricultural Statistics {Conducted both during 2010-11 and 2011-12}
Objective: The basic objective of the Scheme is to collect and improve agricultural statistics in the form of
area/ production/yield rate for principal agricultural crops/7 fruit crops and 7 vegetable crops.
Components of the Scheme: The scheme has four components namely:
a. Timely Reporting Scheme (TRS),
b. Establishment of an Agency for Reporting of Agricultural Statistics (EARAS),
c. Improvement of Crop Statistics (ICS); and
d. Crop Estimation Survey on Fruits & Vegetables (CES-F&V).
1. Estimation of area of principal agricultural crops under Timely Reporting Scheme (TRS)
Objective: On the basis of complete enumeration in a sample of 20 percent of the villages on priority basis,
the TRS envisages to provide in time:
• Estimates of the principal crop areas after the sowings are completed; and
• Information on irrigated area, un-irrigated area and also area under high yielding and local varieties of
the various crops
Geographical Coverage: Covers 16 land record States namely, Andhra Pradesh, Assam, Bihar, Gujarat,
Haryana, Himachal Pradesh, Jammu & Kashmir, Karnataka, Madhya Pradesh, Maharashtra, Rajasthan, Tamil
Nadu, Uttar Pradesh, Uttrakhand, Jharkhand and Chhattisgarh and two Union Territories namely, Delhi and
Puducherry
Sampling Design/ Methodology used: The design of the sample survey is stratified multistage random
sampling with tehsil or a Revenue Inspector circle or even a Patwari circle as stratum, depending upon the
conditions prevailing in the various states.
In States, where there is only one village per patwari circle, the villages in each stratum are divided at random
into 5 equal sets in such a way that each comprises 20 per cent of the villages in the stratum.
In States where the Patwari circles contain more than one village each, first the villages within the patwari
circles are arranged at random and then the circles within a stratum are arranged in a random order. Then a
linear systematic sample of village with period 5 is chosen for ensuring coverage of all the villages in the
course of 5 years under the TRS. It is envisaged that the 5 systematic samples, which would result on account
of this procedure, are to be listed right in the beginning. The procedure of systematic selection applied to a
random arrangement of the villages in each stratum, results in a stratified random sample.
In this way, 5 independent non-over lapping groups of 20 percent villages are formed, the main idea being that
over a period of 5 years all the villages in State would be covered under the scheme. Out of 5 sets, a sample
of one set is selected randomly with equal probability year after year.
Coverage/Sample Size: In the villages selected for TRS programme, the concerned Patwaris are to carry out
crop inspection on cent per cent basis and prepare the Khasra register.
Period of the survey: Agriculture Year (July-June)
Name(s) of the Agency which conducted the survey : State Agricultural Statistics Authority (SASA)
Name of the Sponsoring Agency (if any) : Directorate of Economics & Statistics, Ministry of Agriculture,
New Delhi
Conclusion/Findings/ Final Results of the Survey: Agricultural statistics, in the form of area under principal
agricultural crops during the years was derived.
2. Estimation of area and production of principal agricultural crops under Establishment of an Agency
for Reporting of Agricultural Statistics (EARAS) {Conducted both during 2010-11 and 2011-12}
Objective: On the basis of complete enumeration in a sample of 20 percent of the villages, to provide:
(i) Estimates of the principal crop areas and production; and
(ii) Information on irrigated area, un-irrigated area and also area under high yielding and local varieties
of the various crops.
Besides area statistics, EARAS provides frame to select plots for conduct of crop cutting experiments
to estimate yield rates.
Geographical Coverage : EARAS is implemented in three non-land record States namely, Kerala, Orissa and
West Bengal and four North Eastern States namely, Arunachal Pradesh, Nagaland, Sikkim and Tripura. In the
absence of any Government Department for the regular updation of land records in these States, collection of
statistics of area, production and yield rate is done through EARAS in each of the implementing States.
Sampling Design/ Methodology used: The design of the sample survey is stratified multistage random
sampling with tehsil as a stratum. Villages in each stratum are to be divided at random into 5 equal sets such
that each comprises 20 per cent of the villages in the stratum. Five independent non-over lapping groups of 20
percent villages are formed, the idea being to cover all the villages in State under the scheme over a period of
5 years. Out of 5 sets, a sample of one set is selected randomly with equal probability year after year.
In West Bengal and Orissa, the crop- wise area enumeration work is done in all Mouzas/Villages selected
under EARAS. In Kerala, for collection of area statistics, the State is divided into 811 Investigator Zones. A
sample of 100 key plots is selected from each Investigator Zone. With respect to each key plot, a cluster
consisting of 5 sub survey division numbers is formed and land utilisation statistics are collected from these
100 clusters of 5 sub survey division numbers.
Coverage/Sample Size: In the selected villages, primary worker carry out crop inspection on cent-percent
basis.
Period of the survey: Agriculture Year (July-June)
Name(s) of the Agency which conducted the survey: State Agricultural Statistics Authority (SASA)
Name of the Sponsoring Agency (if any): Directorate of Economics & Statistics, Ministry of Agriculture,
New Delhi
Conclusion/Findings/ Final Results of the Survey (in brief): Agricultural statistics in the form of
area/production/yield rate for principal agricultural crops were derived.
3. Crop Estimation Survey on Fruits & Vegetables (CES-F&V) {Conductedboth during 2010-11 and 2011-
12}
Objective : To obtain reliable estimates of area, yield and production of selected fruit and vegetable crops.
Geographical Coverage : Covers 11 States namely, Andhra Pradesh, Gujarat, Haryana, Himachal Pradesh,
Karnataka, Maharashtra, Orissa, Punjab, Rajasthan, Tamil Nadu and Uttar Pradesh.
Sampling Design/ Methodology used : To estimate area and productivity of fruits, stratified multistage
random sampling is used and stratification is done at talukas/sub-division level. A total of 150-200 villages are
selected in a district. To estimate area under fruit crops, the number of villages in the district is selected by
probability proportional to size with replacement, taking area under the fruit as the size measure. Villages are
completely enumerated to obtain information on the area under fruit orchards and the number of trees, both in
the orchards as well as stray trees. Five orchards in the selected villages and three clusters of four trees of
bearing age in the orchards are then selected with Simple Random Sampling Without Replacement
(SRSWOR) for estimation of yield. Data on yield is recorded throughout the harvesting season.
To estimate area and productivity of vegetables, sub-stratification of talukas is done on the basis of village-
wise area under vegetables. 3 to 4 sub-stratum with equal area under vegetables is formed. Clusters of three
villages are taken as primary sampling units. 20% clusters are selected with SRSWOR and are completely
enumerated for estimating area under vegetables. The area enumeration is done in the beginning of each
period consisting of three months. In 50% of the clusters selected for area enumeration, 6 to 8 fields of each
important vegetable are selected and crop cutting experiments are conducted in a randomly selected plot of
5m x 5m in each field to estimate yield by observing all the pickings in each period.
Coverage/Sample Size : 150-200 villages are selected in a district. In the selected villages, primary worker
carry out crop inspection on cent-percent basis. Seven fruits viz. Mango, Apple, Banana, Grapes, Guava,
Pineapple and Citrus, Five vegetables viz. Cauliflower, Potato, Onion, Tomato and Cabbage, and two spices,
viz. Ginger and Turmeric are covered.
Period of the survey: Agriculture Year (July-June)
Name(s) of the Agency which conducted the survey: The scheme is being implemented through State
Directorates of Economics and Statistics in Andhra Pradesh, Orissa, Maharashtra, Karnataka and Tamilnadu.
In the States of Punjab, UP and Haryana, it is being implemented through Directorate of Horticulture. In the
States of Gujarat, Rajasthan and HP, the responsibility has been given to Directorate of Agriculture, Board of
Revenue and Directorate of Land Records respectively.
Name of the Sponsoring Agency (if any) : Directorate of Economics & Statistics, Ministry of Agriculture,
New Delhi
Conclusion/Findings/ Final Results of the Survey (in brief) : Under the scheme, area of production and
productivity of selected horticulture crops in 11 selected States are being generated.
Improvement of Crop Statistics (ICS) {Conducted both during 2010-11 and 2011-12}
Objective: The objective is to bring improvements in crop statistics by conducting spot supervision of:
a) area enumeration,
b) area aggregation, and
c) crop cutting experiments on a sample basis.
Geographical Coverage : The sample check covers 16 land record States namely, Andhra Pradesh, Assam,
Bihar, Gujarat, Haryana, Himachal Pradesh, Jammu & Kashmir, Karnataka, Madhya Pradesh, Maharashtra,
Rajasthan, Tamil Nadu, Uttar Pradesh, UttraKhand, Jharkhand and Chhattisgarh and Union Territory of
Puducherry.
Sampling Design/ Methodology used: The check on area enumeration consists of selecting and locating a
sample of 20 survey/sub-survey numbers within each selected village with the help of Khasara register and
village maps and then recording the actual utilisation by the supervisor.
The sample check on preparation of crop abstract consists of checking of page-wise totals of area figures
under crops and area utilisation as recorded in the khasara register and recording the totals of crop areas and
utilisation.
Inspection of crop cutting experiments at harvest stage covers specified major crops and consist of examining
whether the State primary worker conducts the experiments conforming to the procedure laid down under the
general crop estimation surveys of the State. The aspect of check includes the selection of survey
numbers/sub-survey numbers; selection of fields and random coordinates; marking of plots, and; harvesting &
weighting of produce.
Coverage/Sample Size : Supervision of area enumeration is carried out in 10,000 villages by both Centre and
State. (5,000 villages by central agency-NSSO and 5,000 villages by State machinery).
Similarly, about 30,000 crop cutting experiments (CCEs) are covered for checking every year.
Period of the survey: Agriculture Year (July-June)
Name(s) of the Agency which conducted the survey: State Agricultural Statistics Authority (SASA)
Name of the Sponsoring Agency (if any) : Directorate of Economics & Statistics, Ministry of Agriculture,
New Delhi
Conclusion/Findings/ Final Results of the Survey (in brief) : The objective to locate lacuna, if any, in the
State system of collection of agricultural statistics and to suggest measures to effect lasting improvements in
the system through joint efforts of the Central and State authorities, were achieved.
4. The Comprehensive Scheme for Studying the Cost of Cultivation of Principal Crops in India
{Conducted both during 2009-10 and 2010-11}
Objective: The main objective of the scheme is to generate crop-wise and state-wise costs of cultivation and
production estimates to enable Commission for Agriculture Cost and Prices(CACP) to recommend the
Minimum Support Prices to the Government. These estimates are also used by the Ministry of Agriculture for
implementation of Market Intervention Scheme.
Geographical Coverage: The scheme is implemented in 19 States namely Andhra Pradesh, Assam, Bihar,
Chhattisgarh, Gujarat, Haryana, Himachal Pradesh, Jharkhand, Karnataka, Kerala, Madhya Pradesh,
Maharashtra, Orissa, Punjab, Rajasthan, Tamil Nadu, Uttar Pradesh, Uttaranchal and West Bengal.
Sampling Design/ Methodology used: The sampling design of the scheme is a three stage stratified random
sampling design with tehsil as the first- stage unit, village/cluster of villages as the second-stage unit and
operational holdings as the third and ultimate- stage unit. Each State is divided into homogenous agro-climatic
zones, based on cropping pattern, soil types, rainfall, etc. The primary sampling units (tehsils) are allocated to
different zones in proportion to the total area of all the crops covered by the study.
The primary sampling units are selected in each zone (stratum) with probability proportional to the area under
the selected crops and with replacement. Within each tehsil, the village/ cluster is also selected following the
same procedure. In each selected village/cluster, all the operational holdings are enumerated and classified
according to size into 5 size classes, the class limits being fixed uniformly for all villages/clusters. The 5 size
classes, at present, are operational holdings with area less than 1 hectare; between 1 and 2 hectares,
between 2 and 4 hectares, between 4 and 6 hectares and above 6 hectares. In each size class, two holdings
are selected by simple random sampling, without replacement. However, if in any village/ cluster, a particular
size class does not contain even two holdings, more holdings are selected from adjacent size-classes to make
up the deficit.
The detailed cost related data are collected on cost accounting method in respect of selected sample holdings.
The scheme envisages collection of representative data on inputs and outputs in physical and monetary terms
on a comparable and comprehensive basis following uniform methodology. Under the scheme, daily entries of
debit/credit for the expenditure/ income are made in order to assess the total cost /benefit incurred/accrued to
each farmer covered under the scheme. The field data are collected by the field men, each one of them filling
around 60 schedules. Of these 60 schedules, 20 show details of operations like use of fertilizers, power and
water etc. and are filled up on daily basis after making inquiries from 10 farm-holdings which may comprise
more than 10 fields. The supervision of collection of the field-data is done by the Field Supervisors. Each Field
Supervisor, on an average, supervises work of 7.5 field-men.
The items of cost of cultivation cover both the paid-out costs (out-of-pocket expenses) and the imputed costs.
The items covered under these costs are:
a) Paid-out Costs
i) Hired labour (human, animal and machinery);
ii) Maintenance expenses on owned animals and machinery;
iii) Expenses on material inputs such as seed (home grown and purchased), fertilizer, manure (owned
and purchased), pesticides and irrigation;
iv) Depreciation on implements, farm buildings (such as cattle sheds, machine sheds, storage sheds)
and land revenue;
v) Rent paid for leased- in land; and
vi)Miscellaneous expenses.
b) Imputed Costs
i) Value of family labour;
ii) Managerial input of family;
iii) Rent of owned land; and
iv) Interest on owned fixed capital, for which the farmer does not incur any cash expenses.
Coverage/Sample Size : The scheme presently covers 28 crops i.e. paddy, wheat, jowar, bajra, maize, ragi,
barley, moong, urad, arhar, gram, masur, peas, groundnut, rapeseed and mustard, nigerseed, soyabean,
sunflower, safflower, sesamum, cotton, jute, sugarcane, VFC tobacco, onion, potato, black pepper and
coconut. Study of VFC Tobacco has been discontinued w.e.f. 20012-13. These crops are selected for a block
period of three years. The combination of crops covered in each State varies from State to State, depending
upon their importance in terms of its relative contribution in the production of the relevant crop at All-India
level.
Period of the survey: The survey is conducted annually
Name(s) of the Agency which conducted the survey: The Scheme is implemented through 16 Agricultural /
General Universities / Colleges. Besides, the Directorate of Tobacco Development undertakes a special study
on VFC tobacco in the state of Andhra Pradesh which has been discontinued w.e.f. 2012-13.
List of Implementing Agencies is as under:
Assam Agricultural University, Jorhat, Assam
Acharya N.G. Ranga Agricultural University, Hyderabad, A.P.
Rajendra Agricultural University, Samastipur, Bihar
Sardar Patel University, Gujarat
CCS Haryana Agriculture University, Hissar
Himachal Pradesh University, Shimla, H.P.
University of Agri. Sciences, Bangalore, Karnataka
University of Kerala, Thiruvananthapuram
JLN Krishi Viswa Vidyalaya, Jabalpur, M.P.
Mahatma Phule Krishi VidyaPeeth, Ahmednagar, Maharashtra
Orissa University of Agri. & Tech., Bhubaneswar
Punjab Agriculral University, Ludhiana
MaharanaPratap U/0 Agri& Technology, Udaipur, Rajasthan
Tamil Nadu Agriculure University, Coimbatore
R.B.S. College, Agra, U.P.
Bidhan Chandra Krishi Viswa Vidyalaya, West Bengal
Directorate of Tobacco Development, Chennai, Tamil Nadu (discontinued w.e.f. 2012-13.
Arecanut, Karnataka ( by University of Agri. Sciences, Bangalore, Karnataka)
Name of the Sponsoring Agency (if any): Directorate of Economics and Statistics, Ministry of Agriculture,
New Delhi.
Conclusion/Findings/ Final Results of the Survey (in brief) : On the basis of data so collected, the
estimates of cost of cultivation and cost of production are generated as per the prescribed scientific
methodology recommended by Experts.
Agriculture Census 2010-11 and Input Survey 2011-12,Ministry of Agriculture
Introduction & Objectives: Agriculture Census in India is conducted at an interval of five years to collect and
compile data on operational holdings in the country. The basic unit of information in the Agriculture Census is
the operational holding as distinct from the ownership holding. Agriculture Census in the country is conducted
in a Census – cum – Sample Survey method and data is collected three distinct phases. During Phase-I and
Phase-II of the Census, data on number, area and agriculture characteristics of operational holdings are
collected. The Phase-III of Agriculture Census, (Referred as Input Survey) is conducted as a follow up survey
to the Agriculture Census (reference year as next year to that of the Agriculture Census) to collect data on
input use pattern of operational holdings in the country. Eight Agriculture Censuses since 1970-71 have been
completed in the country so far and current Agriculture Census 2010-11 is ninth in the series. Main objectives
of the Agriculture Census are:
To describe the structure and characteristics of agriculture providing statistical data on
operational holdings, operated area, land utilization, live-stock, agricultural machinery and
implements, use of fertilizers, pattern of input use etc.
To provide bench-mark data needed for formulating new agricultural development
programmes and evaluating their progress.
To provide basic framework of operational holdings and its characteristics for carrying out
future agriculture surveys.
To lay basis for developing integrated programme for current agricultural statistics.
Geographical Coverage of the Survey: The Agriculture Census 2010-11 and Input Survey 2011-12 is
implemented in all States /UTs of the country.
Methodology Used/Coverage/Sample Size: In India, the Agriculture Census data (Phase-I/Phase-II) is
collected following two broad approaches; in States where comprehensive land records exist (Land Record
States), data is collected and compiled through re-tabulation of information available in the Village Land
Records. For other States (Non-Land record States), the data is collected on sample basis. In Phase-I of the
Census,data on primary characteristics like number of operational holdings and area operated by different size
class (marginal, small, semi-medium, medium and large), social groups (SC, ST, Others), gender
(male/female), types of holding (individual, joint and institutional), etc. is collected. This operation covers all the
villages in land record States and 20% of the villages in non-land record States.
During, Phase-II, holding schedule is canvassed in selected 20% villages in each tehsil for collecting
detailed data on irrigation status, tenancy particulars, terms of leasing, cropping pattern and dispersal of
holdings, etc. The estimates of agricultural characteristics of operational holdings are prepared in at
Tehsil/District/State level. In Phase III, referred generally as `Input Survey’, relates to collection of data on
pattern of input use (fertilizer, irrigation seed, pest management), agriculture credit, size of the household, age
and educational level of the holders, multiple cropping, across various crops, States and size group of holders.
This survey is conducted in 7% of villages selected in each tehsil.
The data of Input Survey is collected through field inquiries from the selected operational holders of
sample villages. The estimate for Input characteristics is prepared at District / State level. For Input Survey,
institutional holdings and holdings operated by persons not residing in the village, are excluded in the purview
of the survey (i.e., only individual and joint holdings operated by resident cultivators constitute universe
(population) for this survey).
Period of the Survey: The reference year for Agriculture Census 2010-11 and Input Survey 2011-12 are
Agricultural Year 2010-11 (i.e. July 2010 to June 2011) and Agricultural Year 2011-12 respectively. Fieldwork
for Phase-I of the Census has been completed and data is expected to be finalised by October, 2012. The
data collection activities for Phase-II and Phase-III (Input Survey) of the Census are progressing in various
States.
Name(s) of the Agency which conducts the survey: Directorate of Economics & Statistics, Department of
Revenue and Agriculture etc. of the States/UTs are responsible for conducting the field work.
Name of the Sponsoring Agency: Ministry of Agriculture, New Delhi.
Conclusion/Findings/Final Results of the Survey: On completion of field work, the data for Agriculture
Census 2010-11 and Input Survey 2011-12 is entered, processed and validated for generation of results. After
finalization of the data, the results will be published in the form of reports and hosted in the website at
http://agcenus.nic.in for public use.
National Sample Survey Organization (NSSO):
NSS 66th Round (July 2009-June 2010) Socio Economic Survey on Household Consumer
Expenditure and Employment and Unemployment
Objectives: To collect data on the subjects of Household Consumer Expenditure and Employment and
Unemployment. The survey is conducted quinquennialy. This is the eighth quinquennial survey in the series
and the last one was conducted in 61st round (July 2004 – June 2005).
Geographical Coverage : Whole of India Union except (i) interior villages of Nagaland situated beyond five
kilometers of the bus route and villages of Andaman and Nicobar Islands which remain inaccessible
throughout the year.
Sampling Design/Methodology used: A Stratified multi-stage design has been adopted for the survey.
Coverage/Sample Size: 12784 FSUs for Central Sample.
Period of the survey: Field work started from 1st July 2009 and ending on 30th June 2010. The survey period
was divided into the four sub-rounds of three months each.
Name of the Agency which conducted the survey: Field work undertaken by Field Operations Division of
National Sample Survey Office (NSSO) under Ministry of Statistics and Programme Implementation.
Data Processing: Data processing is done by the NSSO, Data Processing Division (Hq), Kolkata and its
various Data Processing Centers located at Delhi, Ahmedabad, Bangalore, Nagpur and Giridih.
Major Findings:
1. As per the report no. 537, the highlight of the Employment and Unemployment Survey are as under:
A Household and Population
About 70 per cent of the households in India belonged to the rural areas and accounted for about 73
per cent of the total population.
The average household size in India was about 4.4. It was about 4.6 in rural India and about 4.1 in
urban India. The sex ratio (females per 1000 of males) in India was 936. It was 947 in rural India and
909 in urban India.
About 12 per cent of households in both the rural and urban areas were headed by females.
Compared to all households, they had, on an average, a relatively smaller household size (about 3.2
in rural areas and about 3.1 in urban areas) and a much higher sex-ratio (about 1785 in rural areas
and about 1808 in urban areas).
Among those households having at least one member of age 15 years and above, about 5 per cent in
the rural areas and 10 per cent in the urban areas had no usually employed member of age 15 years
and above.
The population in the age group 15-59 years comprised about 59 per cent of the rural males and 61
per cent rural females. In the urban areas, about 66 per cent each of the males and females belonged
to this age group.
In the rural areas, during 2009-10, about 71 per cent of males and 53 per cent of the females were
literate. The corresponding proportions, in the urban areas, were 84 per cent and 74 per cent.
In 2009-10, about 35 per cent of the rural households had MGNREG job cards. During this period,
about 24 per cent of the rural households got work in MGNREG works and 19 per cent of the rural
households sought but did not get MGNREG works.
B Labour Force
According to the usual status (ps+ss), about 56 per cent of rural males and 27 per cent of rural
females belonged to the labour force. In the urban areas, the corresponding proportions were 56 per
cent of males and 15 per cent for females.
During the period 2004-05 to 2009-10, the LFPRs according to usual status (ps+ss) remained almost
the same for rural males but decreased by about 6 percentage points for rural females. During that
period, LFPRs according to usual status (ps+ss) decreased by about 1 percentage point for the urban
males and decreased by about 3 percentage points for the urban females.
C Work Force
About 39 per cent of the population in the country was usually employed. The proportion was 41 per
cent in the rural and 35 per cent in the urban.
The gender differential in the worker population ratio (WPR) was distinct. The WPR for rural males
was 55 per cent while it was 26 per cent for rural females. In the urban areas, it was 54 per cent for
males and 14 per cent for females.
The daily status rates were slightly lower than the current weekly status rates, which, in turn, were
slightly lower than the usual status rates. The current weekly status WPR was 53 per cent for rural
male, 22 per cent for rural females, 54 per cent for urban males and 13 per cent for urban females.
The currentdaily status rateswere 50 per cent, 18 per cent, 52 per cent and 12 per cent for rural
males, rural females, urban males and urban females, respectively.
Among the usually employed (ps+ss), about 54 per cent of the rural males and 56 per cent of rural
females were self-employed. In the urban areas, corresponding proportions were 41 per cent for both
males and females. In the urban areas, about 42 per cent of the usually employed males and 39 per
cent of the usually employed females were regular salaried/wage employees.
Between 2004-05 and 2009-10, in the rural areas, WPR in the usual status approach remained almost
the same for the males and decreased by about 7 percentage points for the females. In the urban
areas, the rates decreased by about 1 percentage point for the males and 3 percentage points for the
females.
In rural India, the proportion of usually employed (ps+ss) male workers engaged in the agricultural
activities declined gradually from 81 per cent in 1977-78 to 63 per cent in 2009-10 whereas for the
female workers, the decline was less - from 88 per cent to 79 per cent during the same period.
In urban India, the ‘trade, hotel and restaurant' sector engaged about 27 per cent of the usually
employed (ps+ss) male workers while each of ‘manufacturing’ and ‘other services’ sector accounted
for nearly 22 per cent of them. On the other hand, among the usually employed urban females, ‘other
services’ sector accounted for the highest proportion (39 per cent), followed by ‘manufacturing’ (28 per
cent).
The proportion of urban females employed in ‘other services’ sector increased from 36 per cent in
2004-05 to 39 percent in 2009-10 and the ‘agriculture’ sector revealed a fall in its share by about 4
percentage points during this period.
D Unemployment Rate
The unemployment rate (number of person unemployed per 1000 persons in the labour force),
according to usual status (ps+ss), was 16 in the rural areas and 34 in the urban areas. It was 57 for
urban females, 28 for urban males and 16 for both males and females in the rural areas.
The unemployment rates according to the current daily status (cds) approach are higher than the rates
obtained according to usual status approach and weekly status approach, thereby indicating a high
degree of intermittent unemployment. The unemployment rate according to the current weekly status
(cws) approach was 33 in rural areas and 42 in the urban areas. According to the current daily status
(cds) approach, it was 68 in the rural areas and 58 in the urban areas.
During the period 2004-05 and 2009-10, the unemployment rate in terms of the usual status (ps+ss),
remained almost the same for rural males and decreased by 1 percentage point for urban males. For rural
females also it remained almost the same whereas for urban females it decreased by 1 percentage point.
In both the rural and urban areas, unemployment rate among the educated (secondary and above)
persons of age 15 years and above was higher than that among those whose education level was
lower than secondary: for usual status (ps+ss), unemployment rate among the educated was 4 per
cent for each of rural and urban males while it was 12 per cent for each of rural and urban female.
The unemployment rate was much higher among the youth (15-29) as compared to that in the overall
population. According to the usual status (ps+ss), unemployment rate among the youth was 5 per
cent each for male and female in rural areas, 8 per cent for urban male and 14 per cent for urban
female.
Among the educated youth (age:15-29 years and level of education: secondary and above), the
unemployment rate was predominantly high in both the rural and urban areas. According to the usual
status (ps+ss), the rates were 8 per cent for rural males, 18 per cent for rural females, 10 per cent for
urban males and 23 per cent for urban females.
E Underemployment
During 2009-10, the proportion of usually employed (ps+ss) females who were found not to be
employed during the week preceding the date of survey was 15 per cent in rural India and nearly 6 per
cent in urban India. The corresponding percentages for usually employed males were 3 and 1 only.
The proportion of person-days of the usually employed (ps+ss) utilised for work, in the rural and
urban areas, was estimated at about 69 per cent and 85 per cent, respectively for females, and 92
and 96 per cent, respectively for males.
During 2009-10, in the age group 15 years and above, about 11 per cent of usually employed rural
males and 6 per cent of usually employed urban males sought or were available for additional work.
The corresponding percentages for females were around 8 in rural areas and 6 in urban areas.
During 2009-10, in the age group 15 years and above, about 10 per cent of rural males, 7 per cent of
rural females and 5 per cent each of urban males and females reported availability for alternative
work.
F Labour Mobility
During the two years preceding the date of survey, only a negligible proportion (less than 1 per cent)
among the usually (ps) working persons had changed work status while change of establishment
among the usually (ps) employed was reported for 5 per cent for rural male, 6 per cent for rural
female, 4 per cent for urban male and 5 per cent for urban female.
The proportion of persons who changed their establishment is much less among those with education
level highersecondary and above as compared to those with lower levels of education - be it in rural
areas or in urban areas.
During the two years preceding the date of survey, about 1 per cent of rural males, urban males,
urban females, and negligible proportion (0.3 per cent) of rural females who were workers in usual
status (ps) reported change in their industry of work.
During the two years preceding the date of survey, about 1 per cent of rural males, urban males,
urban females, and negligible proportion (.3 per cent) of rural females who were workers in usual
status (ps) reported change in their occupation.
2. As perthe report no. 538, the highlight of the Consumer Expenditure Survey is as under:
A LEVEL OF CONSUMPTION
Using the MMRP (Modified Mixed Reference Period) method of measurement of MPCE (Monthly Per
Capita Consumer Expenditure), average MPCE in 2009-10 was estimated as Rs.1053.64 in rural India
and Rs.1984.46 in urban India.
The poorest 10% of India’s rural population had an average MPCE of Rs.453. The poorest 10% of the
urban population had an average MPCE of Rs.599.
The top 10% of the rural population, ranked by MPCE, had an average MPCE of Rs.2517 – about 5.6
times that of the bottom 10%. The top 10% of the urban population had an average MPCE of Rs.5863 –
about 9.8 times that of the bottom 10%.
Among the major States, Kerala (Rs.1835) had the highest rural MPCE. It was followed by Punjab
(Rs.1649) and Haryana (Rs.1510). In all other major States, average rural MPCE was between Rs.750
and Rs.1250.
Average rural MPCE was lowest in Bihar and Chhattisgarh (around Rs.780), and also low in Orissa and
Jharkhand (around Rs.820), as well as in Uttar Pradesh and Madhya Pradesh (around Rs.900).
Maharashtra (Rs.2437) and Kerala (Rs.2413) were the two major States with the highest MPCE in the
urban sector, followed by Haryana (Rs.2321). Urban MPCE was lowest in Bihar (Rs.1238).
The median level of MPCE was Rs.895 in rural India the and Rs.1502 in urban India.
In the 22-year period from 1987-88 to 2009-10, real MPCE measured by the Uniform Reference Period
method was estimated to have grown by only 19% in rural India, but by as much as 42% in urban India.
The growth in real urban MPCE over the 16-year period between 1993-94 and 2009-10 was about 34%.
Measured by the Mixed Reference Period method, real MPCE grew by about 19% in rural India during
the 16-year-period from 1993-94 to 2009-10, and by as much as 37½% in urban India over the same
period.
B PATTERN OF CONSUMPTION
Using the MMRP (Modified Mixed Reference Period) method of MPCE measurement, food was
estimated to account for about 57% of the value of the average rural Indian’s household consumption
during 2009-10. This included 14% for cereals and cereal substitutes, a little less than 8% for milk and
milk products, and 8% on vegetables. Among non-food item categories, fuel for cooking and lighting
accounted for about 8%, clothing and footwear for 6%, medical expenses for a little over 5%,
conveyance and education for about 3½% each, other consumer services for 4%, and consumer
durables for 3½%.
For the average urban Indian, over 44% of the value of household consumption was accounted for by
food, including 8% by cereals and 7% by milk and its products.
The share of most of the food item groups in total consumption expenditure was higher in rural India
than in urban India, fruits and processed food being exceptions. For non-food item groups, the share
was usually higher in urban India. The most noticeable differences were in case of cereals (urban share:
8%, rural share: 13.8%), rent (urban: 6%, rural share: 0.5%) and education (urban: 8%, rural: 3.6%).
In the major States, the share of food in rural MPCE varied from 46% for Kerala and 48% for Punjab to
64% in Assam and 65% in Bihar. In the urban sector it varied from 40-41% in Kerala and Maharashtra to
52% in Jharkhand and 53% in Bihar and Assam.
The share of cereals in total expenditure in rural India varied across the major States from 7% in Punjab
and Haryana to 21% in Assam and Bihar. In urban India, the share varied from 6% for Haryana, Punjab
and Kerala to 13% in Assam and 15% in Bihar.
The budget share of cereals was 23-24% for the bottom decile class of rural India but fell with rise in
MPCE to about 7-8% for the top decile class. In urban India the share of cereals fell from 18-19% for the
bottom decile class to 3-4% for the top decile class.
The budget share of milk and milk products in rural household consumer expenditure was seen to rise
with MPCE level from 3-4% in the bottom decile class to 9% in the ninth decile class. For urban India,
however, the share was higher for the middle third of the population than for the highest decile classes.
The share of fuel and light in household consumer expenditure was around 10-11% for the bottom decile
class in both sectors. With rise in MPCE it was seen to fall to about 6% in the top decile class for rural
India and 5% for urban India.
C QUANTITY OF CEREAL CONSUMPTION
Average cereal consumption per person per month was 11.3 kg in rural India and 9.4 kg in urban India.
In rural India, average monthly per capita cereal consumption was around 10.2 kg for the poorest 10%
of the population. With rise in MPCE it was seen to increase, quickly at first, to reach 11 kg in the third
decile class, and then more slowly. It was above 12 kg for the top two decile classes. In urban India, per
capita cereal consumption was seen to increase from under 9.5 kg to about 9.7 kg per month over the
first five decile classes but then to fall, finally plunging to 8.6 kg for the top decile class of population.
Over the 16-year period from 1993-94 to 2009-10, estimated monthly per capita cereal consumption
(which does not include cereal content of purchased processed food) fell from 13.4 kg to 11.35 kg in
rural India and from 10.6 kg to 9.39 kg in urban India. The fall was spread over all major States.
D INEQUALITY IN CONSUMPTION LEVELS
Using the MMRP (Modified Mixed Reference Period) method of MPCE measurement, the Lorenz ratio
for the distribution of MPCE was estimated as 0.270 for rural India and 0.362 for urban India.
Comparison of Lorenz ratios from the present survey with those obtained from the survey of 2004-05,
using the Uniform Reference Period method of measurement of MPCE, showed a slight reduction from
0.297 to 0.291 in the rural sector and a slight increase from 0.373 to 0.381 in the urban sector of the
country.
3. NSS 67th Round (July 2010-June 2011) Non-Agricultural Unincorporated Enterprises belonging
to three sectors viz. Manufacturing, Trade and Other Services
Objectives: To collect data on Non-Agricultural Unincorporated Enterprises belonging to three sectors viz.
Manufacturing, Trade and Other Services.
Geographical Coverage : Whole of India Union except (i) interior villages of Nagaland situated beyond five
kilometers of the bus route and villages of Andaman and Nicobar Islands which remain inaccessible
throughout the year.
Sampling Design/Methodology used: A Stratified multi-stage design has been adopted for the survey.
Coverage/Sample Size: 16000 FSUs for Central Sample.
Period of the survey: Field work started from 1st July 2010 and ended on 30th June 2011. The survey period
was divided into the four sub-rounds of three months each.
Name of the Agency which conducted the survey: Field work undertaken by Field Operations Division of
National Sample Survey Office (NSSO) under Ministry of Statistics and Programme Implementation.
Data Processing :Data processing is done by the NSSO, Data Processing Division (Hq), Kolkata and its
various Data Processing Centers located at Delhi, Ahmedabad, Bangalore, Nagpur and Giridih.
Major Findings: As per the Press release of Survey on Unincorporated Non-agricultural Enterprises
(excluding construction),the salient findings of the survey are as under :
Out of the estimated 5.77 crore unincorporated non-agricultural enterprises (excluding construction),
about 54 per cent enterprises were located in rural areas and 46 per cent were located in urban areas.
At all India level, 30%, 36% and 34% enterprises were engaged in manufacturing, trading and other
services sector respectively. In rural India, these enterprises were more or less equally distributed
(between 33 to 34 percent) among broad activity categories. In urban India, enterprises engaged in
trading sector had the dominant share (38%) followed by other services sector (35.5%) and
manufacturing sector (26.5%).
At all India level, the OAEs (85%) had the dominant share of enterprises and also OAEs outnumbered
establishments in all the three broad activity category namely Manufacturing (84%), Trade (86%) and
Other Services (84%). The same pattern of dominance is observed in rural and urban areas also.
Out of 4.9 crore OAEs, 58% and 42% were in rural and urban areas respectively. However,
establishments in urban areas outnumbered establishments in rural area. Out of 89 lakh establishments,
urban areas have a share of 70% against 30% in rural areas.
About 10.8 crore workers were engaged in unincorporated non-agricultural enterprise (excluding
construction). While about 51 percent of workers were located in urban areas, 49 per cent were located
in rural areas. At all India level, the sector ‘other services’ had the highest percentage (36%) of workers.
‘trade’ and ‘manufacturing’ sectors had almost equal share (32%) of workers.
At all India level, the OAEs had dominant share (65%) of workers and also the workers engaged in
OAEs outnumbered those engaged in establishments in all the three broad activity category namely
manufacturing (60%), trade (72%) and other services (63%). Though the dominance of workers in OAEs
is observed in rural areas also, urban areas recorded slightly higher share of workers in establishments
in the categories of manufacturing (53%) and other services (51%).
At all-India level, aggregate annual gross value added (GVA) was estimated as Rs.628,356crores. The
establishments contributed 55% to aggregate GVA. The overall GVA contribution of urban enterprises
(68%) was much higher than rural enterprises (32%). Enterprises engaged in trade (39%) had
contributed maximum to overall GVA followed by other services (36%) and manufacturing (25%). Share
of OAEs in aggregate GVA was much higher in rural areas (63%) than that for urban areas (37%).
At all-India level, annual gross value added per enterprise (GVAPE) was estimated as Rs. 1,08,951. For
rural India, annual GVAPE for OAEs and Establishments were estimated as Rs. 44,101 and Rs.
2,77,829 respectively. The corresponding estimates for urban areas were Rs. 76,813 and Rs. 4,38,003
respectively. Highest GVAPE was for enterprises engaged in trading (Rs.1,17,454) followed by other
services (Rs.1,16,633) and manufacturing (Rs.89,900).
At all-India level, the annual gross value added per worker (GVAPW) was estimated as Rs. 58,193. For
rural areas, annual GVAPW was estimated as Rs. 37,241 and the corresponding estimate for urban
areas was Rs. 78,527. Highest GVAPW was for enterprise engaged in trading estimated as Rs.71,412
followed by other services (Rs.59,010) and ‘Manufacturing’ (Rs.44,347).
The annual emoluments per hired worker (EPHW) for rural, urban and all India were estimated as Rs.
36,362, Rs. 51,603 and Rs. 47,020 respectively. EPHW was highest for enterprises engaged in other
services, which was estimated as Rs. 40,861, Rs. 57,054 and Rs. 52,281 in rural, urban and rural &
urban combined areas respectively.
4. NSS 68th Round (July 2011-June 2012) Socio Economic Survey on Household Consumer
Expenditure and Employment and Unemployment
Objectives: To collect data on the subjects of Household Consumer Expenditure and Employment and
Unemployment. The last survey on the subject was conducted during its 66th round which was eighth
quinquennial survey in the series. The current survey is similar to a Quinquennial survey as far as subjects of
enquiry, design, questionnaires and sample sizes are concerned.
Geographical Coverage : Whole of India Union except (i) interior villages of Nagaland situated beyond five
kilometers of the bus route and villages of Andaman and Nicobar Islands which remain inaccessible
throughout the year.
Sampling Design/Methodology used: A Stratified multi-stage design has been adopted for the survey.
Coverage/Sample Size: 12784 FSUs for Central Sample.
Period of the survey: Field work started from 1st July 2011 and ended on 30th June 2012. The survey period
was divided into the four sub-rounds of three months each.
Name of the Agency which conducted the survey: Field work undertaken by Field Operations Division of
National Sample Survey Office (NSSO) under Ministry of Statistics and Programme Implementation.
Data Processing: Data processing is done by the NSSO, Data Processing Division (Hq), Kolkata and its
various Data Processing Centers located at Delhi, Ahmedabad, Bangalore, Nagpur and Giridih.
Major Findings: Results are yet to be released.
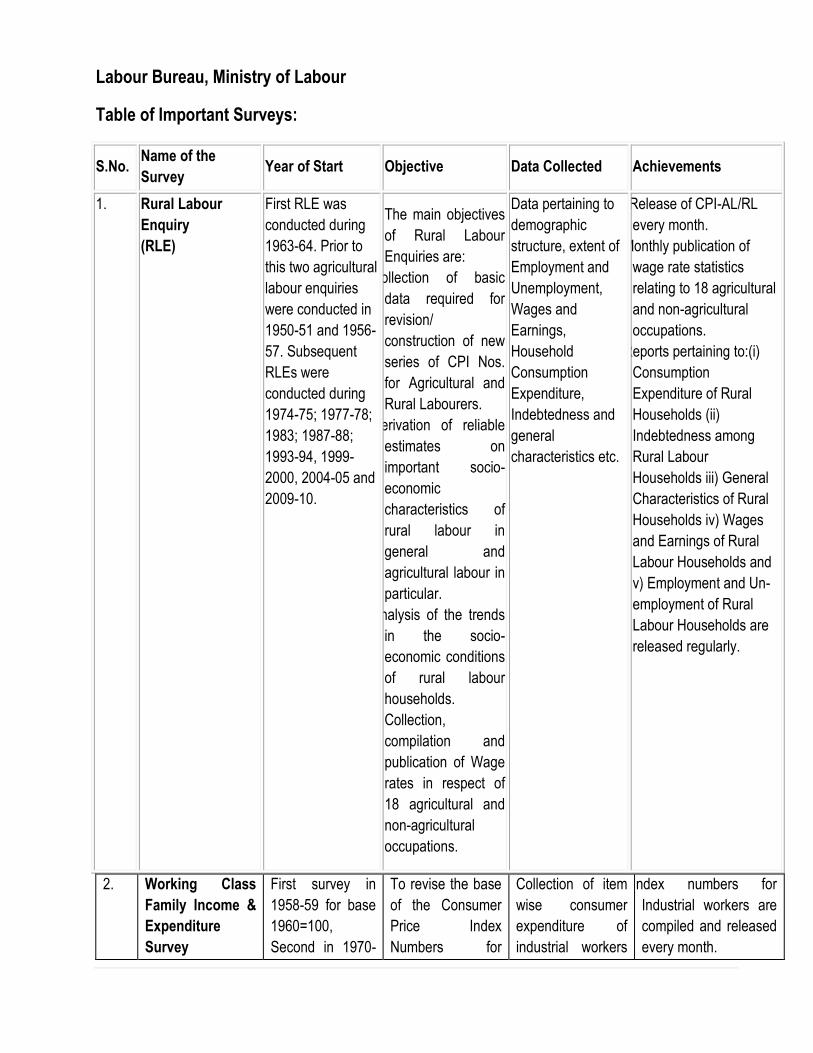
Labour Bureau, Ministry of Labour
Table of Important Surveys:
S.No. Name of the
Survey Year of Start Objective Data Collected Achievements
1. Rural Labour
Enquiry
(RLE)
First RLE was
conducted during
1963-64. Prior to
this two agricultural
labour enquiries
were conducted in
1950-51 and 1956-
57. Subsequent
RLEs were
conducted during
1974-75; 1977-78;
1983; 1987-88;
1993-94, 1999-
2000, 2004-05 and
2009-10.
The main objectives
of Rural Labour
Enquiries are:
1.Collection of basic
data required for
revision/
construction of new
series of CPI Nos.
for Agricultural and
Rural Labourers.
2.Derivation of reliable
estimates on
important socio-
economic
characteristics of
rural labour in
general and
agricultural labour in
particular.
3.Analysis of the trends
in the socio-
economic conditions
of rural labour
households.
Collection,
compilation and
publication of Wage
rates in respect of
18 agricultural and
non-agricultural
occupations.
Data pertaining to
demographic
structure, extent of
Employment and
Unemployment,
Wages and
Earnings,
Household
Consumption
Expenditure,
Indebtedness and
general
characteristics etc.
1.RRelease of CPI-AL/RL
every month.
2. Monthly publication of
wage rate statistics
relating to 18 agricultural
and non-agricultural
occupations.
3. Reports pertaining to:(i)
Consumption
Expenditure of Rural
Households (ii)
Indebtedness among
Rural Labour
Households iii) General
Characteristics of Rural
Households iv) Wages
and Earnings of Rural
Labour Households and
v) Employment and Un-
employment of Rural
Labour Households are
released regularly.
2. Working Class
Family Income &
Expenditure
Survey
First survey in
1958-59 for base
1960=100,
Second in 1970-
To revise the base
of the Consumer
Price Index
Numbers for
Collection of item
wise consumer
expenditure of
industrial workers
1.IIndex numbers for
Industrial workers are
compiled and released
every month.
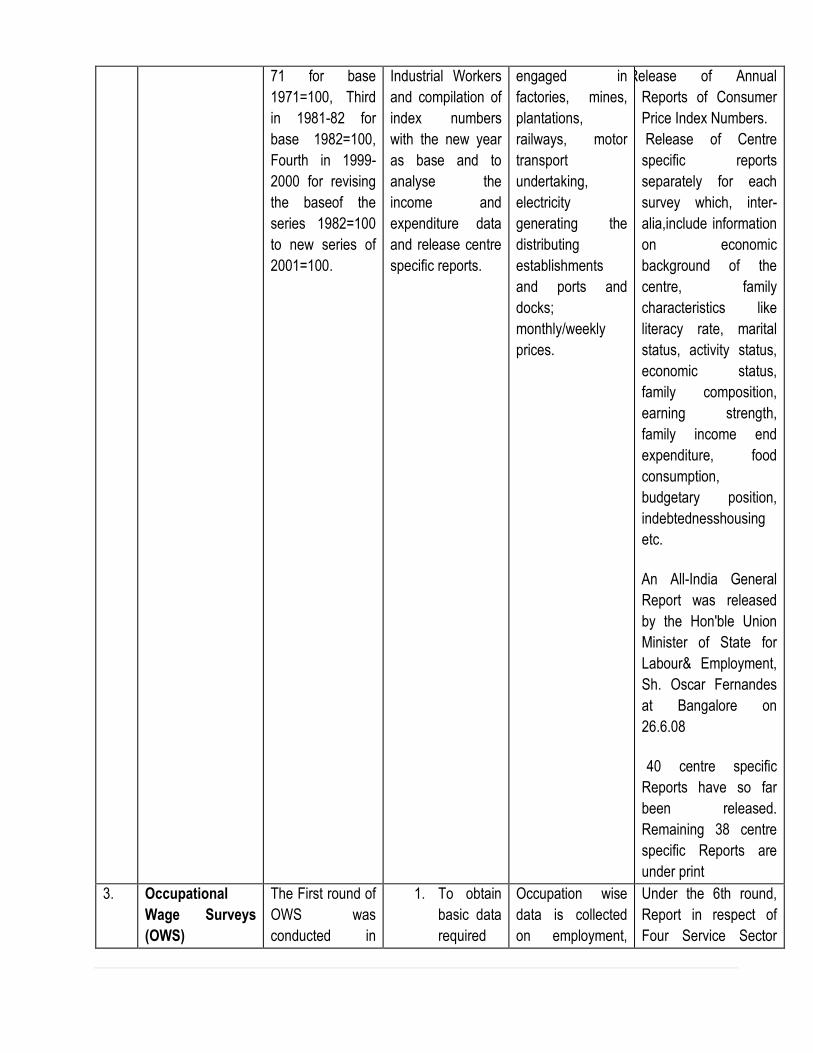
71 for base
1971=100, Third
in 1981-82 for
base 1982=100,
Fourth in 1999-
2000 for revising
the baseof the
series 1982=100
to new series of
2001=100.
Industrial Workers
and compilation of
index numbers
with the new year
as base and to
analyse the
income and
expenditure data
and release centre
specific reports.
engaged in
factories, mines,
plantations,
railways, motor
transport
undertaking,
electricity
generating the
distributing
establishments
and ports and
docks;
monthly/weekly
prices.
2.Release of Annual
Reports of Consumer
Price Index Numbers.
3. Release of Centre
specific reports
separately for each
survey which, inter-
alia,include information
on economic
background of the
centre, family
characteristics like
literacy rate, marital
status, activity status,
economic status,
family composition,
earning strength,
family income end
expenditure, food
consumption,
budgetary position,
indebtednesshousing
etc.
4. An All-India General
Report was released
by the Hon'ble Union
Minister of State for
Labour& Employment,
Sh. Oscar Fernandes
at Bangalore on
26.6.08
5. 40 centre specific
Reports have so far
been released.
Remaining 38 centre
specific Reports are
under print
3. Occupational
Wage Surveys
(OWS)
The First round of
OWS was
conducted in
1. To obtain
basic data
required
Occupation wise
data is collected
on employment,
Under the 6th round,
Report in respect of
Four Service Sector
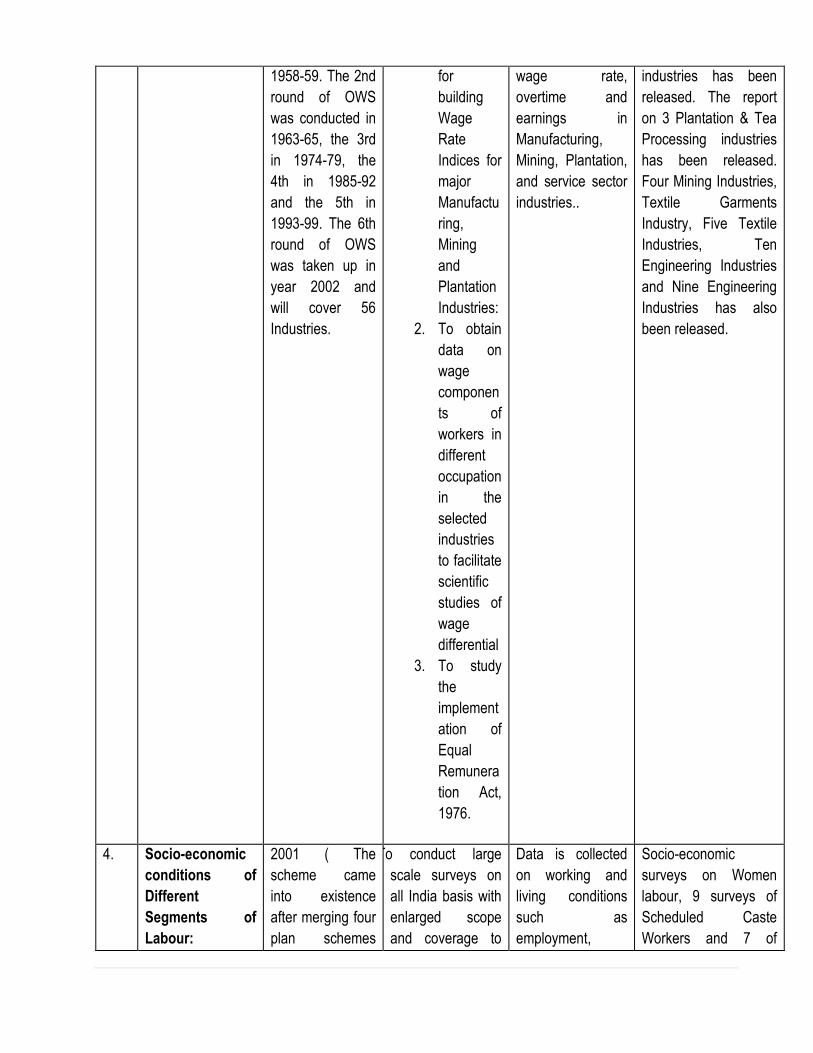
1958-59. The 2nd
round of OWS
was conducted in
1963-65, the 3rd
in 1974-79, the
4th in 1985-92
and the 5th in
1993-99. The 6th
round of OWS
was taken up in
year 2002 and
will cover 56
Industries.
for
building
Wage
Rate
Indices for
major
Manufactu
ring,
Mining
and
Plantation
Industries:
2. To obtain
data on
wage
componen
ts of
workers in
different
occupation
in the
selected
industries
to facilitate
scientific
studies of
wage
differential
3. To study
the
implement
ation of
Equal
Remunera
tion Act,
1976.
wage rate,
overtime and
earnings in
Manufacturing,
Mining, Plantation,
and service sector
industries..
industries has been
released. The report
on 3 Plantation & Tea
Processing industries
has been released.
Four Mining Industries,
Textile Garments
Industry, Five Textile
Industries, Ten
Engineering Industries
and Nine Engineering
Industries has also
been released.
4. Socio-economic
conditions of
Different
Segments of
Labour:
2001 ( The
scheme came
into existence
after merging four
plan schemes
1.To conduct large
scale surveys on
all India basis with
enlarged scope
and coverage to
Data is collected
on working and
living conditions
such as
employment,
Socio-economic
surveys on Women
labour, 9 surveys of
Scheduled Caste
Workers and 7 of
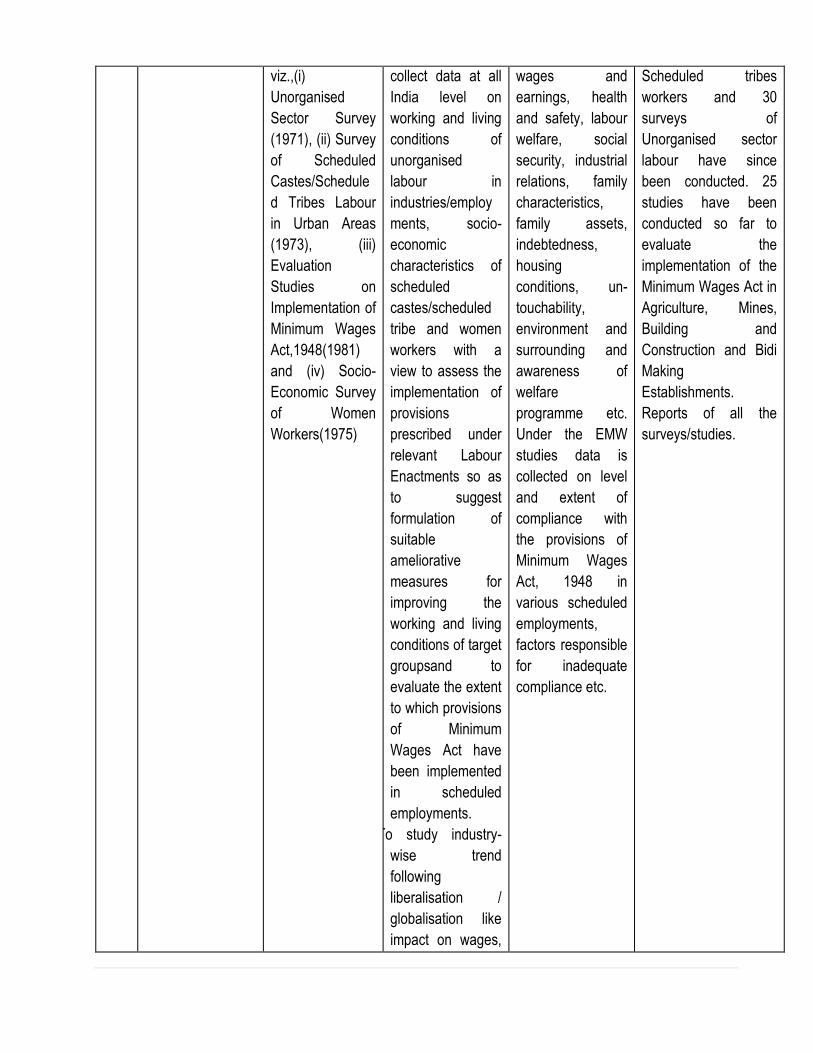
viz.,(i)
Unorganised
Sector Survey
(1971), (ii) Survey
of Scheduled
Castes/Schedule
d Tribes Labour
in Urban Areas
(1973), (iii)
Evaluation
Studies on
Implementation of
Minimum Wages
Act,1948(1981)
and (iv) Socio-
Economic Survey
of Women
Workers(1975)
collect data at all
India level on
working and living
conditions of
unorganised
labour in
industries/employ
ments, socio-
economic
characteristics of
scheduled
castes/scheduled
tribe and women
workers with a
view to assess the
implementation of
provisions
prescribed under
relevant Labour
Enactments so as
to suggest
formulation of
suitable
ameliorative
measures for
improving the
working and living
conditions of target
groupsand to
evaluate the extent
to which provisions
of Minimum
Wages Act have
been implemented
in scheduled
employments.
2.To study industry-
wise trend
following
liberalisation /
globalisation like
impact on wages,
wages and
earnings, health
and safety, labour
welfare, social
security, industrial
relations, family
characteristics,
family assets,
indebtedness,
housing
conditions, un-
touchability,
environment and
surrounding and
awareness of
welfare
programme etc.
Under the EMW
studies data is
collected on level
and extent of
compliance with
the provisions of
Minimum Wages
Act, 1948 in
various scheduled
employments,
factors responsible
for inadequate
compliance etc.
Scheduled tribes
workers and 30
surveys of
Unorganised sector
labour have since
been conducted. 25
studies have been
conducted so far to
evaluate the
implementation of the
Minimum Wages Act in
Agriculture, Mines,
Building and
Construction and Bidi
Making
Establishments.
Reports of all the
surveys/studies.
employment level,
upgraded skill
requirements and
skills made
redundant.
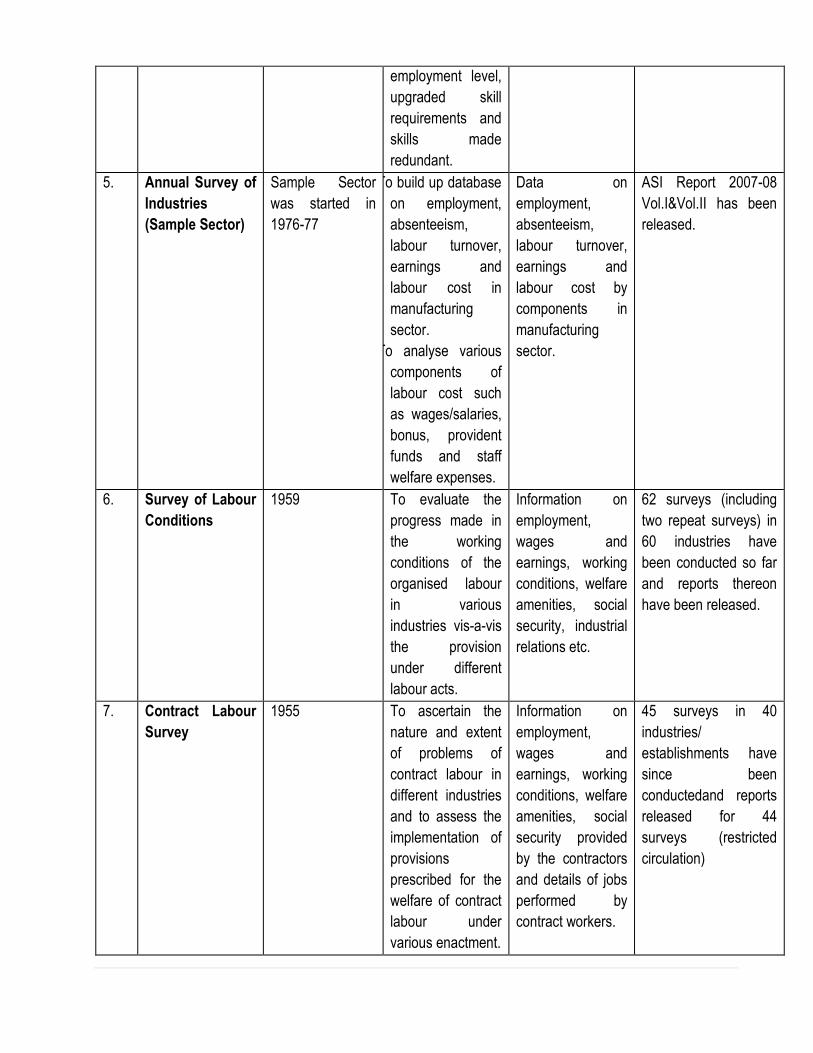
5. Annual Survey of
Industries
(Sample Sector)
Sample Sector
was started in
1976-77
1.To build up database
on employment,
absenteeism,
labour turnover,
earnings and
labour cost in
manufacturing
sector.
2.To analyse various
components of
labour cost such
as wages/salaries,
bonus, provident
funds and staff
welfare expenses.
Data on
employment,
absenteeism,
labour turnover,
earnings and
labour cost by
components in
manufacturing
sector.
ASI Report 2007-08
Vol.I&Vol.II has been
released.
6. Survey of Labour
Conditions
1959 To evaluate the
progress made in
the working
conditions of the
organised labour
in various
industries vis-a-vis
the provision
under different
labour acts.
Information on
employment,
wages and
earnings, working
conditions, welfare
amenities, social
security, industrial
relations etc.
62 surveys (including
two repeat surveys) in
60 industries have
been conducted so far
and reports thereon
have been released.
7. Contract Labour
Survey
1955 To ascertain the
nature and extent
of problems of
contract labour in
different industries
and to assess the
implementation of
provisions
prescribed for the
welfare of contract
labour under
various enactment.
Information on
employment,
wages and
earnings, working
conditions, welfare
amenities, social
security provided
by the contractors
and details of jobs
performed by
contract workers.
45 surveys in 40
industries/
establishments have
since been
conductedand reports
released for 44
surveys (restricted
circulation)
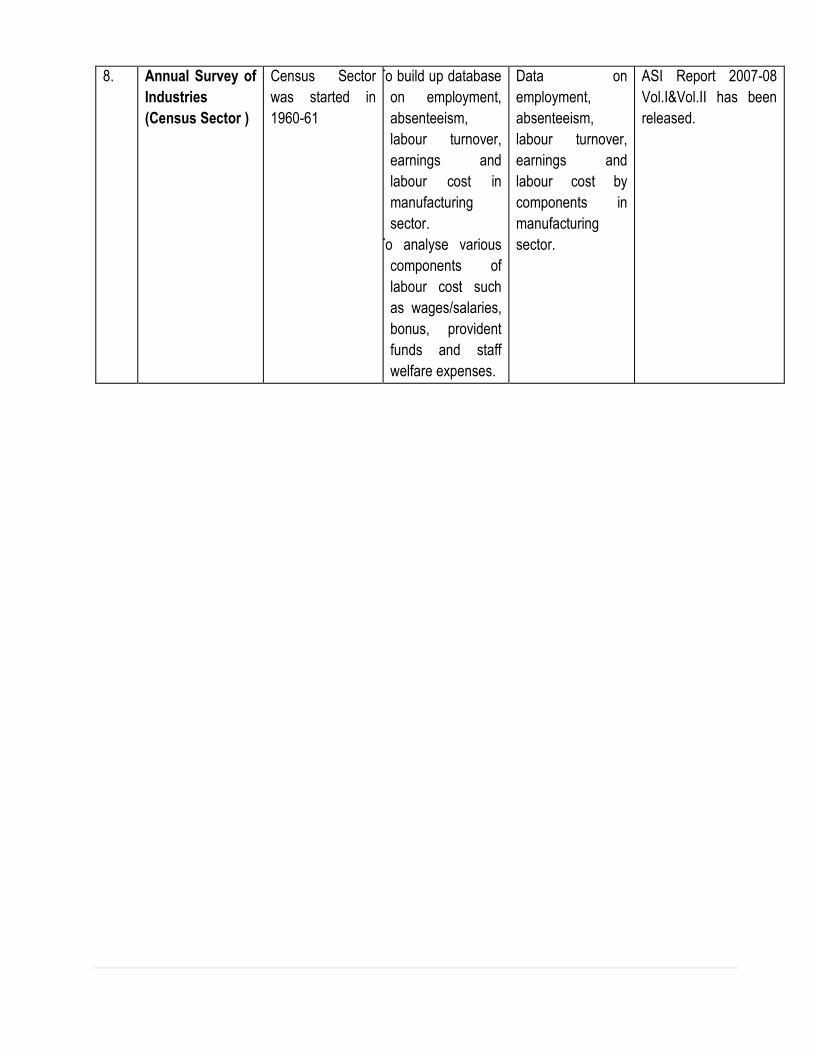
8. Annual Survey of
Industries
(Census Sector )
Census Sector
was started in
1960-61
1.To build up database
on employment,
absenteeism,
labour turnover,
earnings and
labour cost in
manufacturing
sector.
2.To analyse various
components of
labour cost such
as wages/salaries,
bonus, provident
funds and staff
welfare expenses.
Data on
employment,
absenteeism,
labour turnover,
earnings and
labour cost by
components in
manufacturing
sector.
ASI Report 2007-08
Vol.I&Vol.II has been
released.
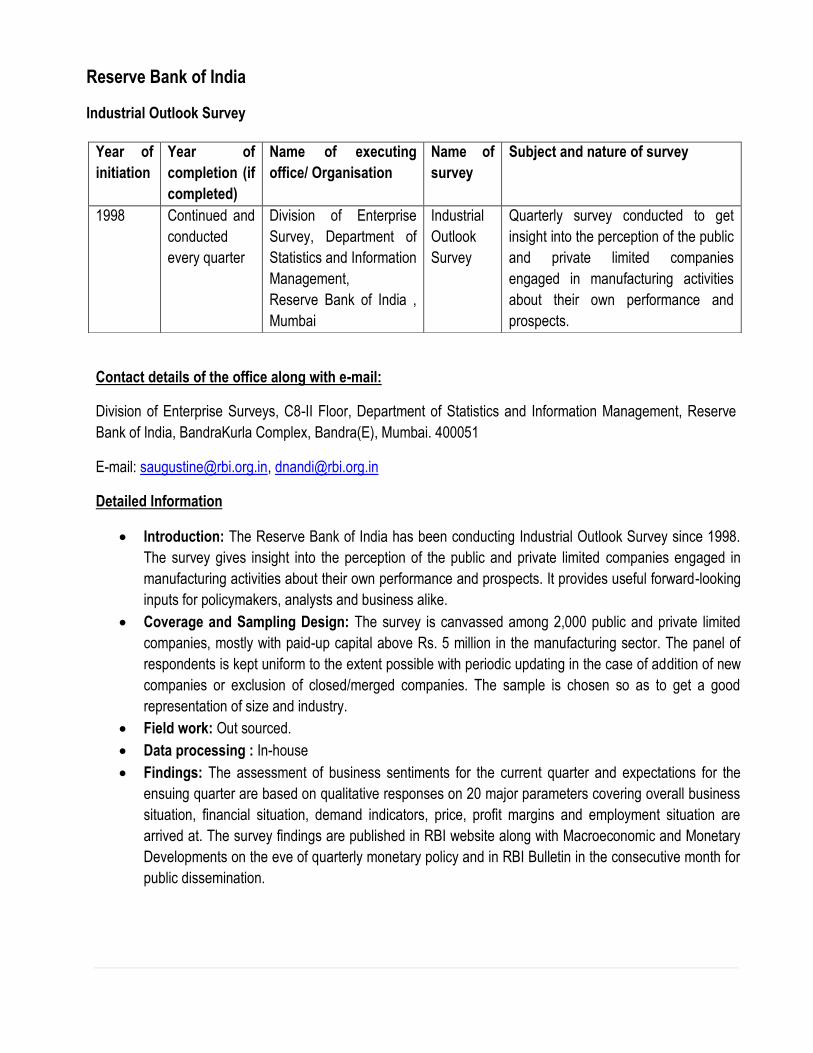
Reserve Bank of India
Industrial Outlook Survey
Contact details of the office along with e-mail:
Division of Enterprise Surveys, C8-II Floor, Department of Statistics and Information Management, Reserve
Bank of India, BandraKurla Complex, Bandra(E), Mumbai. 400051
E-mail: [email protected], [email protected]
Detailed Information
Introduction: The Reserve Bank of India has been conducting Industrial Outlook Survey since 1998.
The survey gives insight into the perception of the public and private limited companies engaged in
manufacturing activities about their own performance and prospects. It provides useful forward-looking
inputs for policymakers, analysts and business alike.
Coverage and Sampling Design: The survey is canvassed among 2,000 public and private limited
companies, mostly with paid-up capital above Rs. 5 million in the manufacturing sector. The panel of
respondents is kept uniform to the extent possible with periodic updating in the case of addition of new
companies or exclusion of closed/merged companies. The sample is chosen so as to get a good
representation of size and industry.
Field work: Out sourced.
Data processing : In-house
Findings: The assessment of business sentiments for the current quarter and expectations for the
ensuing quarter are based on qualitative responses on 20 major parameters covering overall business
situation, financial situation, demand indicators, price, profit margins and employment situation are
arrived at. The survey findings are published in RBI website along with Macroeconomic and Monetary
Developments on the eve of quarterly monetary policy and in RBI Bulletin in the consecutive month for
public dissemination.
Year of
initiation
Year of
completion (if
completed)
Name of executing
office/ Organisation
Name of
survey
Subject and nature of survey
1998 Continued and
conducted
every quarter
Division of Enterprise
Survey, Department of
Statistics and Information
Management,
Reserve Bank of India ,
Mumbai
Industrial
Outlook
Survey
Quarterly survey conducted to get
insight into the perception of the public
and private limited companies
engaged in manufacturing activities
about their own performance and
prospects.
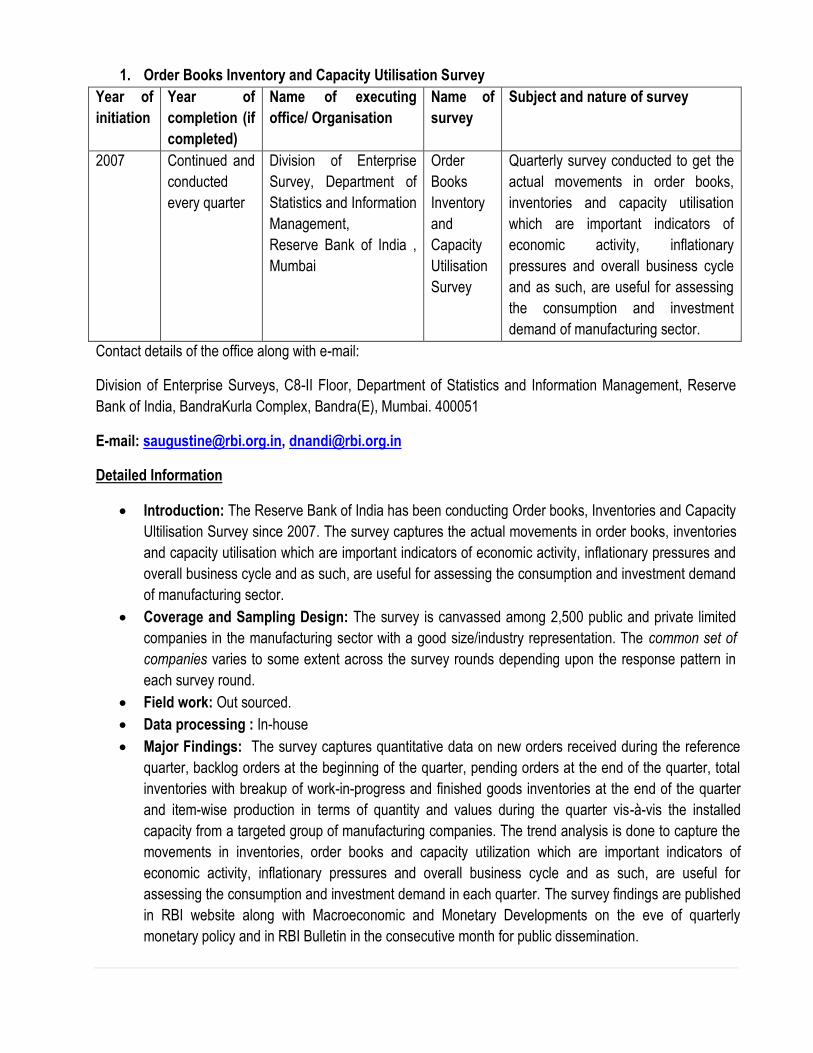
1. Order Books Inventory and Capacity Utilisation Survey
Year of
initiation
Year of
completion (if
completed)
Name of executing
office/ Organisation
Name of
survey
Subject and nature of survey
2007 Continued and
conducted
every quarter
Division of Enterprise
Survey, Department of
Statistics and Information
Management,
Reserve Bank of India ,
Mumbai
Order
Books
Inventory
and
Capacity
Utilisation
Survey
Quarterly survey conducted to get the
actual movements in order books,
inventories and capacity utilisation
which are important indicators of
economic activity, inflationary
pressures and overall business cycle
and as such, are useful for assessing
the consumption and investment
demand of manufacturing sector.
Contact details of the office along with e-mail:
Division of Enterprise Surveys, C8-II Floor, Department of Statistics and Information Management, Reserve
Bank of India, BandraKurla Complex, Bandra(E), Mumbai. 400051
E-mail: [email protected], [email protected]
Detailed Information
Introduction: The Reserve Bank of India has been conducting Order books, Inventories and Capacity
Ultilisation Survey since 2007. The survey captures the actual movements in order books, inventories
and capacity utilisation which are important indicators of economic activity, inflationary pressures and
overall business cycle and as such, are useful for assessing the consumption and investment demand
of manufacturing sector.
Coverage and Sampling Design: The survey is canvassed among 2,500 public and private limited
companies in the manufacturing sector with a good size/industry representation. The common set of
companies varies to some extent across the survey rounds depending upon the response pattern in
each survey round.
Field work: Out sourced.
Data processing : In-house
Major Findings: The survey captures quantitative data on new orders received during the reference
quarter, backlog orders at the beginning of the quarter, pending orders at the end of the quarter, total
inventories with breakup of work-in-progress and finished goods inventories at the end of the quarter
and item-wise production in terms of quantity and values during the quarter vis-à-vis the installed
capacity from a targeted group of manufacturing companies. The trend analysis is done to capture the
movements in inventories, order books and capacity utilization which are important indicators of
economic activity, inflationary pressures and overall business cycle and as such, are useful for
assessing the consumption and investment demand in each quarter. The survey findings are published
in RBI website along with Macroeconomic and Monetary Developments on the eve of quarterly
monetary policy and in RBI Bulletin in the consecutive month for public dissemination.
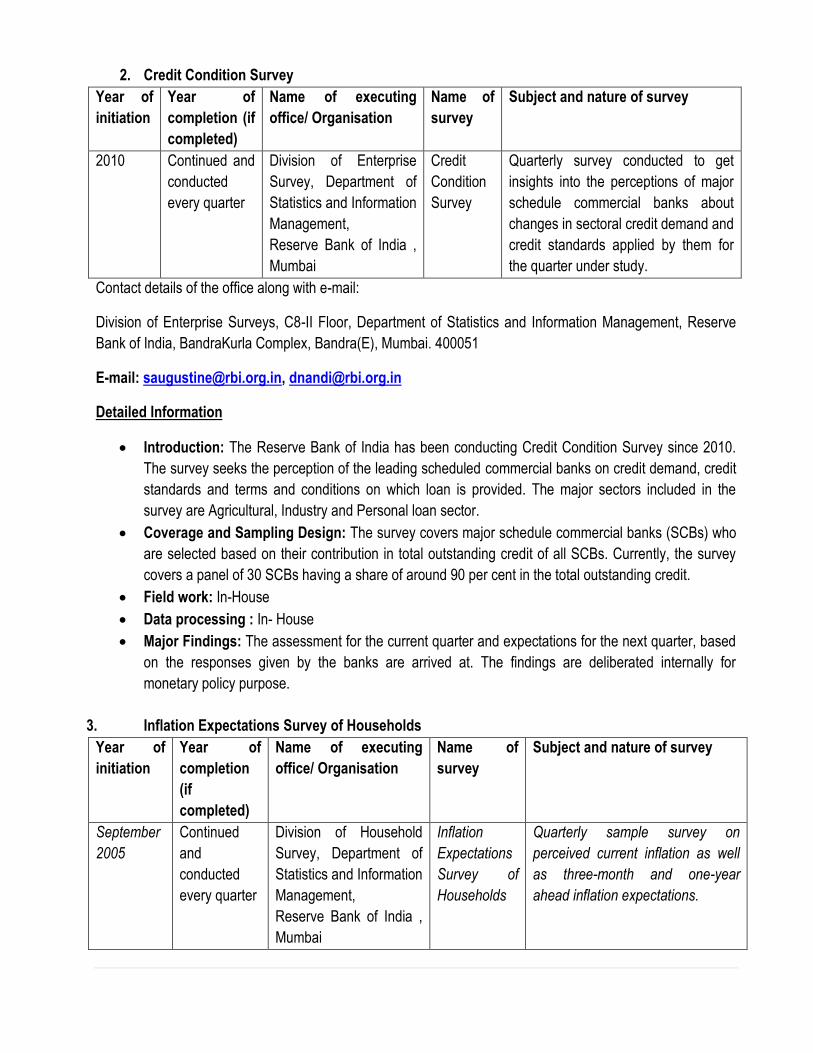
2. Credit Condition Survey
Year of
initiation
Year of
completion (if
completed)
Name of executing
office/ Organisation
Name of
survey
Subject and nature of survey
2010 Continued and
conducted
every quarter
Division of Enterprise
Survey, Department of
Statistics and Information
Management,
Reserve Bank of India ,
Mumbai
Credit
Condition
Survey
Quarterly survey conducted to get
insights into the perceptions of major
schedule commercial banks about
changes in sectoral credit demand and
credit standards applied by them for
the quarter under study.
Contact details of the office along with e-mail:
Division of Enterprise Surveys, C8-II Floor, Department of Statistics and Information Management, Reserve
Bank of India, BandraKurla Complex, Bandra(E), Mumbai. 400051
E-mail: [email protected], [email protected]
Detailed Information
Introduction: The Reserve Bank of India has been conducting Credit Condition Survey since 2010.
The survey seeks the perception of the leading scheduled commercial banks on credit demand, credit
standards and terms and conditions on which loan is provided. The major sectors included in the
survey are Agricultural, Industry and Personal loan sector.
Coverage and Sampling Design: The survey covers major schedule commercial banks (SCBs) who
are selected based on their contribution in total outstanding credit of all SCBs. Currently, the survey
covers a panel of 30 SCBs having a share of around 90 per cent in the total outstanding credit.
Field work: In-House
Data processing : In- House
Major Findings: The assessment for the current quarter and expectations for the next quarter, based
on the responses given by the banks are arrived at. The findings are deliberated internally for
monetary policy purpose.
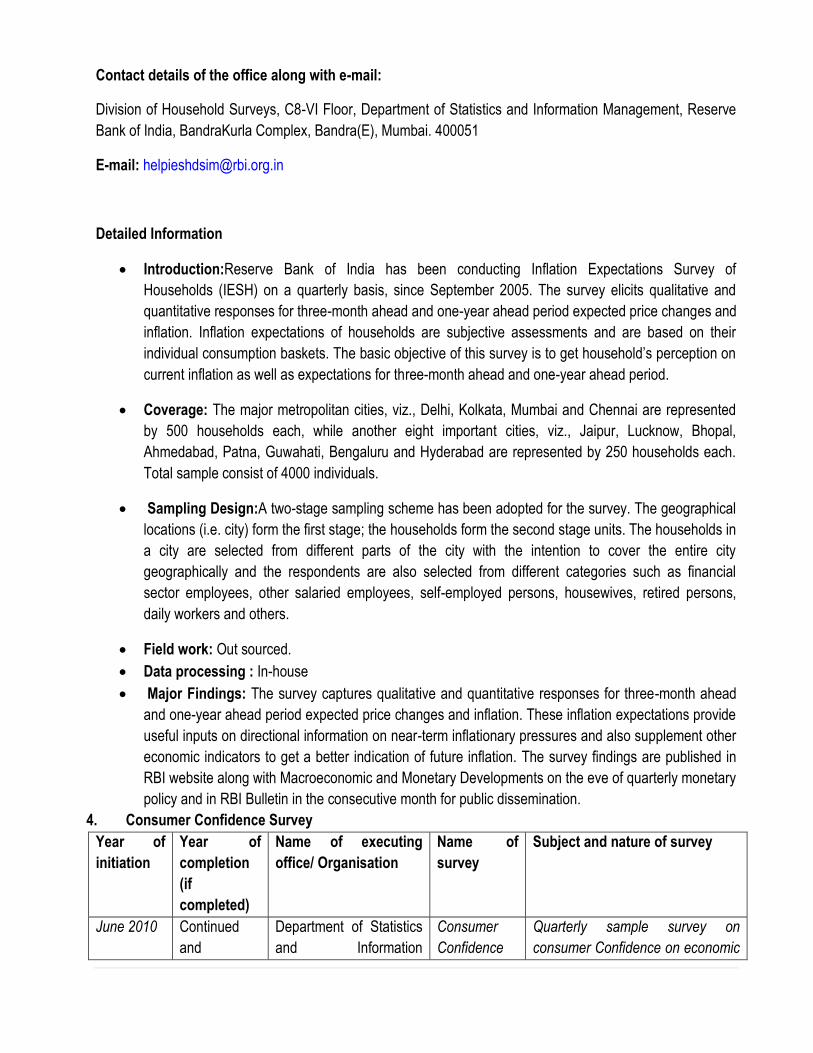
3. Inflation Expectations Survey of Households
Year of
initiation
Year of
completion
(if
completed)
Name of executing
office/ Organisation
Name of
survey
Subject and nature of survey
September
2005
Continued
and
conducted
every quarter
Division of Household
Survey, Department of
Statistics and Information
Management,
Reserve Bank of India ,
Mumbai
Inflation
Expectations
Survey of
Households
Quarterly sample survey on
perceived current inflation as well
as three-month and one-year
ahead inflation expectations.
Contact details of the office along with e-mail:
Division of Household Surveys, C8-VI Floor, Department of Statistics and Information Management, Reserve
Bank of India, BandraKurla Complex, Bandra(E), Mumbai. 400051
E-mail: [email protected]
Detailed Information
Introduction:Reserve Bank of India has been conducting Inflation Expectations Survey of
Households (IESH) on a quarterly basis, since September 2005. The survey elicits qualitative and
quantitative responses for three-month ahead and one-year ahead period expected price changes and
inflation. Inflation expectations of households are subjective assessments and are based on their
individual consumption baskets. The basic objective of this survey is to get household’s perception on
current inflation as well as expectations for three-month ahead and one-year ahead period.
Coverage: The major metropolitan cities, viz., Delhi, Kolkata, Mumbai and Chennai are represented
by 500 households each, while another eight important cities, viz., Jaipur, Lucknow, Bhopal,
Ahmedabad, Patna, Guwahati, Bengaluru and Hyderabad are represented by 250 households each.
Total sample consist of 4000 individuals.
Sampling Design:A two-stage sampling scheme has been adopted for the survey. The geographical
locations (i.e. city) form the first stage; the households form the second stage units. The households in
a city are selected from different parts of the city with the intention to cover the entire city
geographically and the respondents are also selected from different categories such as financial
sector employees, other salaried employees, self-employed persons, housewives, retired persons,
daily workers and others.
Field work: Out sourced.
Data processing : In-house
Major Findings: The survey captures qualitative and quantitative responses for three-month ahead
and one-year ahead period expected price changes and inflation. These inflation expectations provide
useful inputs on directional information on near-term inflationary pressures and also supplement other
economic indicators to get a better indication of future inflation. The survey findings are published in
RBI website along with Macroeconomic and Monetary Developments on the eve of quarterly monetary
policy and in RBI Bulletin in the consecutive month for public dissemination.
4. Consumer Confidence Survey
Year of
initiation
Year of
completion
(if
completed)
Name of executing
office/ Organisation
Name of
survey
Subject and nature of survey
June 2010 Continued
and
Department of Statistics
and Information
Consumer
Confidence
Quarterly sample survey on
consumer Confidence on economic
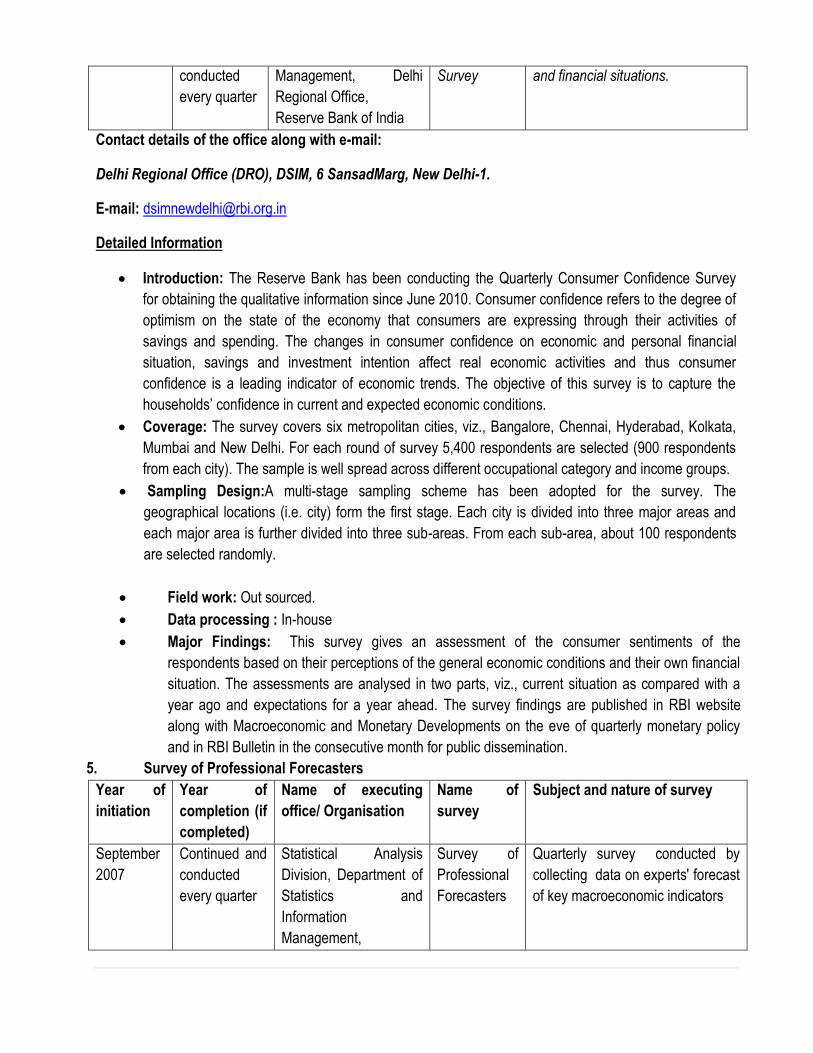
conducted
every quarter
Management, Delhi
Regional Office,
Reserve Bank of India
Survey and financial situations.
Contact details of the office along with e-mail:
Delhi Regional Office (DRO), DSIM, 6 SansadMarg, New Delhi-1.
E-mail: [email protected]
Detailed Information
Introduction: The Reserve Bank has been conducting the Quarterly Consumer Confidence Survey
for obtaining the qualitative information since June 2010. Consumer confidence refers to the degree of
optimism on the state of the economy that consumers are expressing through their activities of
savings and spending. The changes in consumer confidence on economic and personal financial
situation, savings and investment intention affect real economic activities and thus consumer
confidence is a leading indicator of economic trends. The objective of this survey is to capture the
households’ confidence in current and expected economic conditions.
Coverage: The survey covers six metropolitan cities, viz., Bangalore, Chennai, Hyderabad, Kolkata,
Mumbai and New Delhi. For each round of survey 5,400 respondents are selected (900 respondents
from each city). The sample is well spread across different occupational category and income groups.
Sampling Design:A multi-stage sampling scheme has been adopted for the survey. The
geographical locations (i.e. city) form the first stage. Each city is divided into three major areas and
each major area is further divided into three sub-areas. From each sub-area, about 100 respondents
are selected randomly.
Field work: Out sourced.
Data processing : In-house
Major Findings: This survey gives an assessment of the consumer sentiments of the
respondents based on their perceptions of the general economic conditions and their own financial
situation. The assessments are analysed in two parts, viz., current situation as compared with a
year ago and expectations for a year ahead. The survey findings are published in RBI website
along with Macroeconomic and Monetary Developments on the eve of quarterly monetary policy
and in RBI Bulletin in the consecutive month for public dissemination.
5. Survey of Professional Forecasters
Year of
initiation
Year of
completion (if
completed)
Name of executing
office/ Organisation
Name of
survey
Subject and nature of survey
September
2007
Continued and
conducted
every quarter
Statistical Analysis
Division, Department of
Statistics and
Information
Management,
Survey of
Professional
Forecasters
Quarterly survey conducted by
collecting data on experts' forecast
of key macroeconomic indicators
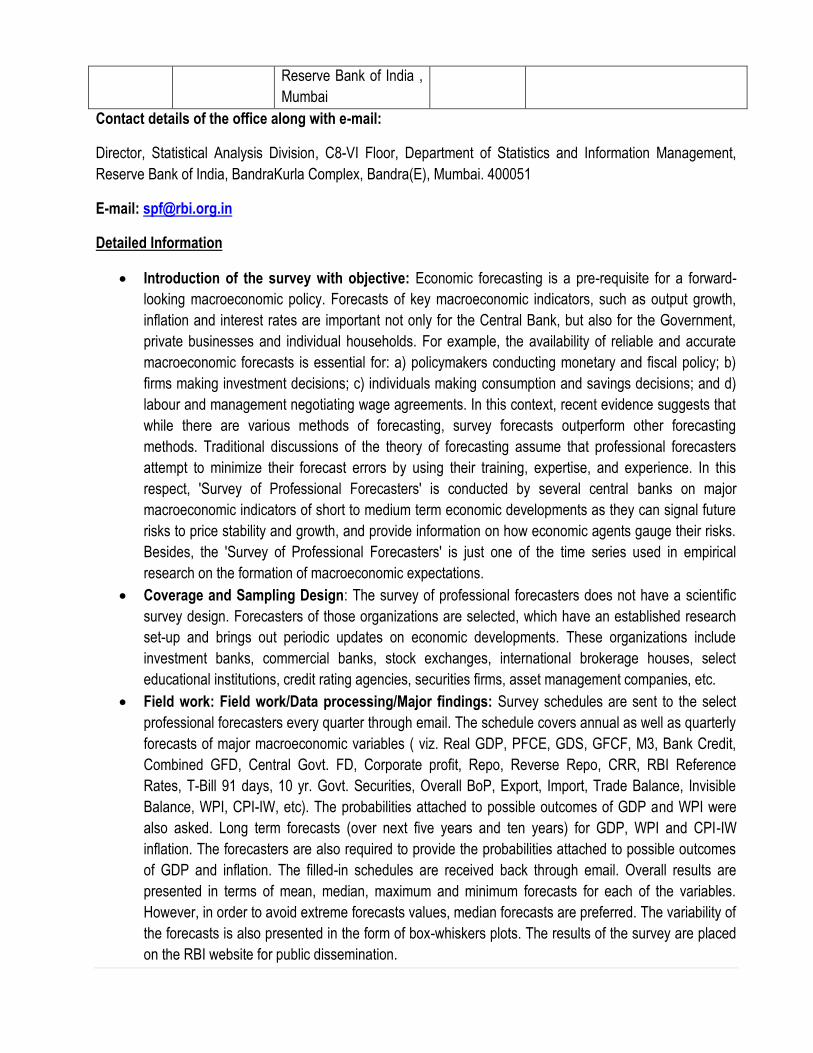
Reserve Bank of India ,
Mumbai
Contact details of the office along with e-mail:
Director, Statistical Analysis Division, C8-VI Floor, Department of Statistics and Information Management,
Reserve Bank of India, BandraKurla Complex, Bandra(E), Mumbai. 400051
E-mail: [email protected]
Detailed Information
Introduction of the survey with objective: Economic forecasting is a pre-requisite for a forward-
looking macroeconomic policy. Forecasts of key macroeconomic indicators, such as output growth,
inflation and interest rates are important not only for the Central Bank, but also for the Government,
private businesses and individual households. For example, the availability of reliable and accurate
macroeconomic forecasts is essential for: a) policymakers conducting monetary and fiscal policy; b)
firms making investment decisions; c) individuals making consumption and savings decisions; and d)
labour and management negotiating wage agreements. In this context, recent evidence suggests that
while there are various methods of forecasting, survey forecasts outperform other forecasting
methods. Traditional discussions of the theory of forecasting assume that professional forecasters
attempt to minimize their forecast errors by using their training, expertise, and experience. In this
respect, 'Survey of Professional Forecasters' is conducted by several central banks on major
macroeconomic indicators of short to medium term economic developments as they can signal future
risks to price stability and growth, and provide information on how economic agents gauge their risks.
Besides, the 'Survey of Professional Forecasters' is just one of the time series used in empirical
research on the formation of macroeconomic expectations.
Coverage and Sampling Design: The survey of professional forecasters does not have a scientific
survey design. Forecasters of those organizations are selected, which have an established research
set-up and brings out periodic updates on economic developments. These organizations include
investment banks, commercial banks, stock exchanges, international brokerage houses, select
educational institutions, credit rating agencies, securities firms, asset management companies, etc.
Field work: Field work/Data processing/Major findings: Survey schedules are sent to the select
professional forecasters every quarter through email. The schedule covers annual as well as quarterly
forecasts of major macroeconomic variables ( viz. Real GDP, PFCE, GDS, GFCF, M3, Bank Credit,
Combined GFD, Central Govt. FD, Corporate profit, Repo, Reverse Repo, CRR, RBI Reference
Rates, T-Bill 91 days, 10 yr. Govt. Securities, Overall BoP, Export, Import, Trade Balance, Invisible
Balance, WPI, CPI-IW, etc). The probabilities attached to possible outcomes of GDP and WPI were
also asked. Long term forecasts (over next five years and ten years) for GDP, WPI and CPI-IW
inflation. The forecasters are also required to provide the probabilities attached to possible outcomes
of GDP and inflation. The filled-in schedules are received back through email. Overall results are
presented in terms of mean, median, maximum and minimum forecasts for each of the variables.
However, in order to avoid extreme forecasts values, median forecasts are preferred. The variability of
the forecasts is also presented in the form of box-whiskers plots. The results of the survey are placed
on the RBI website for public dissemination.
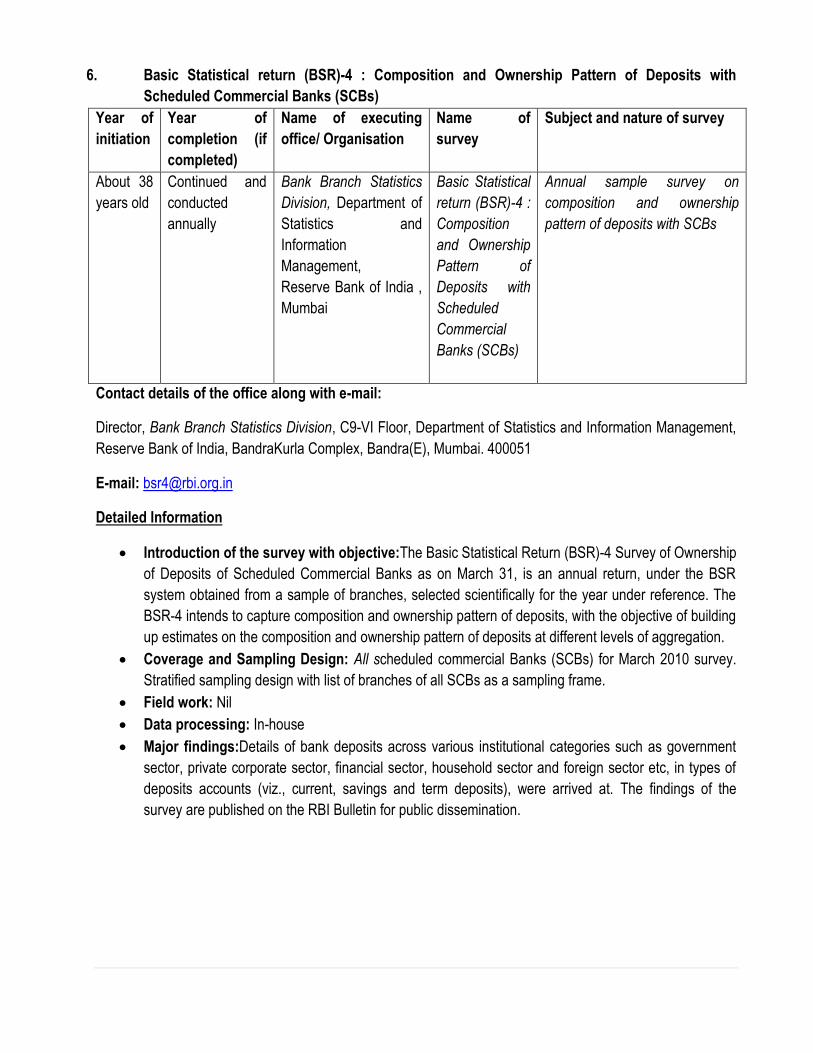
6. Basic Statistical return (BSR)-4 : Composition and Ownership Pattern of Deposits with
Scheduled Commercial Banks (SCBs)
Year of
initiation
Year of
completion (if
completed)
Name of executing
office/ Organisation
Name of
survey
Subject and nature of survey
About 38
years old
Continued and
conducted
annually
Bank Branch Statistics
Division, Department of
Statistics and
Information
Management,
Reserve Bank of India ,
Mumbai
Basic Statistical
return (BSR)-4 :
Composition
and Ownership
Pattern of
Deposits with
Scheduled
Commercial
Banks (SCBs)
Annual sample survey on
composition and ownership
pattern of deposits with SCBs
Contact details of the office along with e-mail:
Director, Bank Branch Statistics Division, C9-VI Floor, Department of Statistics and Information Management,
Reserve Bank of India, BandraKurla Complex, Bandra(E), Mumbai. 400051
E-mail: [email protected]
Detailed Information
Introduction of the survey with objective:The Basic Statistical Return (BSR)-4 Survey of Ownership
of Deposits of Scheduled Commercial Banks as on March 31, is an annual return, under the BSR
system obtained from a sample of branches, selected scientifically for the year under reference. The
BSR-4 intends to capture composition and ownership pattern of deposits, with the objective of building
up estimates on the composition and ownership pattern of deposits at different levels of aggregation.
Coverage and Sampling Design: All scheduled commercial Banks (SCBs) for March 2010 survey.
Stratified sampling design with list of branches of all SCBs as a sampling frame.
Field work: Nil
Data processing: In-house
Major findings:Details of bank deposits across various institutional categories such as government
sector, private corporate sector, financial sector, household sector and foreign sector etc, in types of
deposits accounts (viz., current, savings and term deposits), were arrived at. The findings of the
survey are published on the RBI Bulletin for public dissemination.
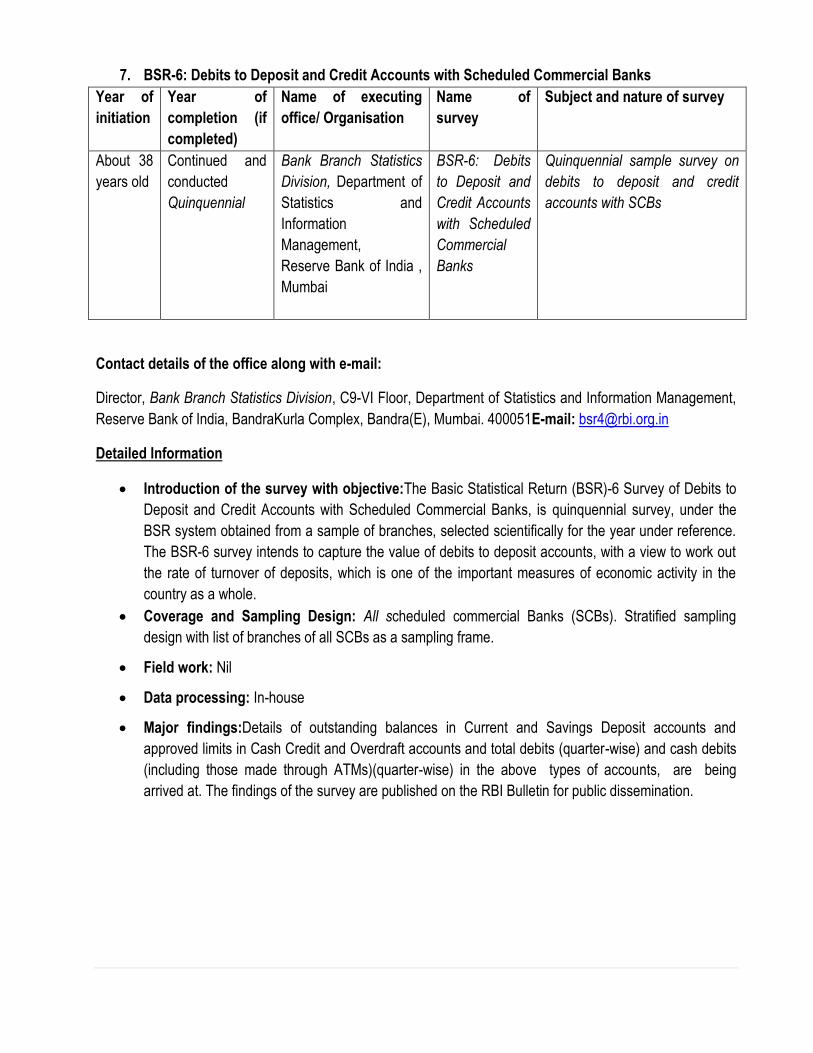
7. BSR-6: Debits to Deposit and Credit Accounts with Scheduled Commercial Banks
Year of
initiation
Year of
completion (if
completed)
Name of executing
office/ Organisation
Name of
survey
Subject and nature of survey
About 38
years old
Continued and
conducted
Quinquennial
Bank Branch Statistics
Division, Department of
Statistics and
Information
Management,
Reserve Bank of India ,
Mumbai
BSR-6: Debits
to Deposit and
Credit Accounts
with Scheduled
Commercial
Banks
Quinquennial sample survey on
debits to deposit and credit
accounts with SCBs
Contact details of the office along with e-mail:
Director, Bank Branch Statistics Division, C9-VI Floor, Department of Statistics and Information Management,
Reserve Bank of India, BandraKurla Complex, Bandra(E), Mumbai. 400051E-mail: [email protected]
Detailed Information
Introduction of the survey with objective:The Basic Statistical Return (BSR)-6 Survey of Debits to
Deposit and Credit Accounts with Scheduled Commercial Banks, is quinquennial survey, under the
BSR system obtained from a sample of branches, selected scientifically for the year under reference.
The BSR-6 survey intends to capture the value of debits to deposit accounts, with a view to work out
the rate of turnover of deposits, which is one of the important measures of economic activity in the
country as a whole.
Coverage and Sampling Design: All scheduled commercial Banks (SCBs). Stratified sampling
design with list of branches of all SCBs as a sampling frame.
Field work: Nil
Data processing: In-house
Major findings:Details of outstanding balances in Current and Savings Deposit accounts and
approved limits in Cash Credit and Overdraft accounts and total debits (quarter-wise) and cash debits
(including those made through ATMs)(quarter-wise) in the above types of accounts, are being
arrived at. The findings of the survey are published on the RBI Bulletin for public dissemination.
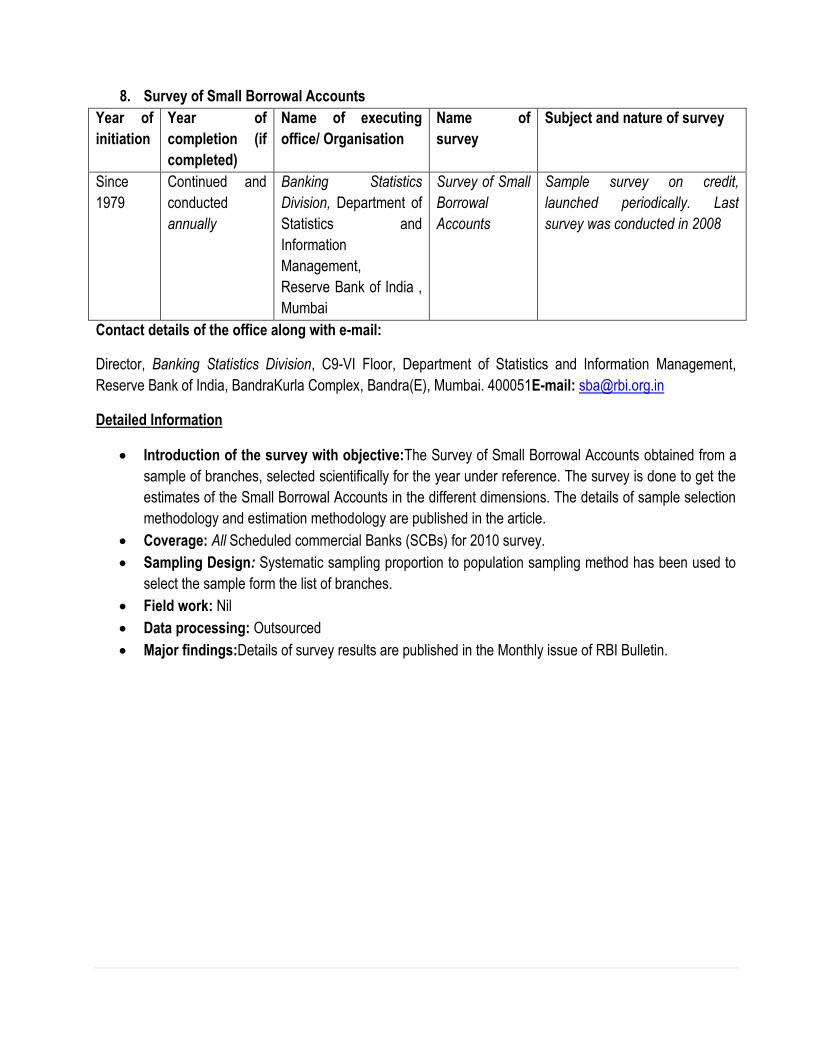
8. Survey of Small Borrowal Accounts
Year of
initiation
Year of
completion (if
completed)
Name of executing
office/ Organisation
Name of
survey
Subject and nature of survey
Since
1979
Continued and
conducted
annually
Banking Statistics
Division, Department of
Statistics and
Information
Management,
Reserve Bank of India ,
Mumbai
Survey of Small
Borrowal
Accounts
Sample survey on credit,
launched periodically. Last
survey was conducted in 2008
Contact details of the office along with e-mail:
Director, Banking Statistics Division, C9-VI Floor, Department of Statistics and Information Management,
Reserve Bank of India, BandraKurla Complex, Bandra(E), Mumbai. 400051E-mail: [email protected]
Detailed Information
Introduction of the survey with objective:The Survey of Small Borrowal Accounts obtained from a
sample of branches, selected scientifically for the year under reference. The survey is done to get the
estimates of the Small Borrowal Accounts in the different dimensions. The details of sample selection
methodology and estimation methodology are published in the article.
Coverage: All Scheduled commercial Banks (SCBs) for 2010 survey.
Sampling Design: Systematic sampling proportion to population sampling method has been used to
select the sample form the list of branches.
Field work: Nil
Data processing: Outsourced
Major findings:Details of survey results are published in the Monthly issue of RBI Bulletin.
Miscellaneous Surveys conducted by Central Government Offices
Sample Registration System: Registration of births and deaths is an important source for demographic
data for socio-economic development and population control in developing countries. The data on population
growth, fertility and mortality serves as the starting point for population projections. Apart from these vital
indicators, an adequate evaluation of a number of programs in the health sector, including family planning,
maternal and reproductive health, immunization programs, is dependent upon the availability of accurate, up-
to-date fertility and mortality data. In India, the need for dependable demographic data was felt soon after
independence heralding the era of five year planning. The registration of births and deaths started on voluntary
basis and there was no uniformity in statistical returns resulting in both under-registration and incomplete
coverage. In order to unify the civil registration activities, the Registration of Births & Deaths Act, 1969 was
enacted. Despite having the registration of birth & death compulsory under the statute, the level of registration
of births and deaths under the Act has continued to be far from satisfactory in several states/UTs. With a view
to generate reliable and continuous data on these indicators, the Office of the Registrar General, India,
initiated the scheme of sample registration of births and deaths in India popularly known as Sample
Registration System (SRS) in 1964- 65 on a pilot basis and on full scale from 1969- 70. The SRS since then
has been providing data on regular basis.
National Family Health Survey (NFHS):The National Family Health Survey (NFHS) is a large-scale,
multi-round survey conducted in a representative sample of households throughout India. The survey provides
state and national information for India on fertility, infant and child mortality, the practice of family planning,
maternal and child health, reproductive health, nutrition, anaemia, utilization and quality of health and family
planning services. Each successive round of the NFHS has had two specific goals: a) to provide essential data
on health and family welfare needed by the Ministry of Health and Family Welfare and other agencies for
policy and programme purposes, and b) to provide information on important emerging health and family
welfare issues. The Ministry of Health and Family Welfare (MOHFW), Government of India, designated the
International Institute for Population Sciences (IIPS) Mumbai, as the nodal agency, responsible for providing
coordination and technical guidance for the survey. IIPS collaborated with a number of Field Organizations
(FO) for survey implementation. Each FO was responsible for conducting survey activities in one or more
states covered by the NFHS.
Annual Health Survey (AHS): AHS yields a comprehensive, representative and reliable dataset on core
vital indicators including composite ones like IMR, MMR and TFR along with their co-variants (process and
outcome indicators) at the district level and maps changes therein on an annual basis.
These benchmarks would help in better and holistic understanding and timely monitoring of various
determinants on well-being and health of population particularly Reproductive and Child Health. It is conducted
by O/o Registrar General, India, Ministry of Home Affairs, Government of India.
Socio- Economic Surveys: The Socio-Economic (SE) Surveys is mainly conducted by National Sample
Survey Organization (NSSO)and are in the form of Rounds, each round being normally of one-year duration.
The subject coverage of SE inquiries for different rounds is decided on the basis of a 10 year time frame. In
this cycle, 1 year is devoted to land and live stock holdings, debt and Investment; 1 year to social consumption
( education and health care, etc. ), 2 years to quinquennial surveys on household consumer expenditure,
employment & un-employment situation and 4 years to non- agricultural enterprises, namely, manufacturing,
trade and services in un-organized sector. The remaining 2 years are for open rounds in which subjects of
current/special interest on the demand of Central Ministries, State Governments and research organizations
are covered. Well qualified and trained Investigators of NSSO and the State Governments collect information
through enquiry method, using the same methodology & schedules that are specially designed for the survey.
Annual Survey of Industries: The Annual Survey of Industries (ASI) is an important survey of the
Central Statistical Organization (CSO), MOS&PI and NSSO(FOD) conducts its field work. It is a statutory
survey conducted under the provisions of the Collection of Statistics Act, 1953. The Deputy Director General,
NSSO (FOD), New Delhi has been appointed as the Statistics Authority (SA) for the purpose. The SA is
empowered by the act/legislation to collect and authorize officials to collect information from any industrial and
commercial concern. The ASI provides data on various vital aspects of the registered manufacturing sector for
use in the estimation of national income, studies of industrial structure and policy formulation. It generates data
on input, output, employment, wage bill, capital formation etc., on an annual basis.
Agriculture Surveys: The Field Operations Division of NSSO has the overall responsibility of providing
technical guidance to the States in developing suitable survey techniques for obtaining timely and reliable
estimates of crop yield, bringing out uniformity in definitions and concepts and providing assistance in training
the State field personnel. It also undertakes supervision over the primary field work of the State Governments
in respect of area enumeration, area aggregation and Crop Cutting Experiments.
The supervision on field work for qualitative improvement in Agricultural Statistics is carried out through well-
organized sample survey under Improvement of Crop Statistics (ICS) Scheme. The Scheme aims at locating,
through joint efforts of Central and State agencies, the deficiencies in the State system of Crop Statistics and
suggesting remedial measures for effecting lasting improvements.
The responsibilities of supervisory staff of the NSSO (FOD) and State Governments inter-alia involve sample
check in non-overlapping samples on (i) area enumeration and aggregation in about 10,000 sample villages in
each season (ii) about 30,000 Crop Cutting Experiments in a year carried out by State primary workers. The
findings of the sample supervision are brought out in the form of State-wise reports for two major seasons and
an All India Status Report titled Review of Crop Statistics System in India through Scheme for Improvement of
Crop Statistics.
Work related to planning of survey, compilation & analysis of data and publication of the reports is done at
Agricultural Statistics (AS) Wing of NSSO (FOD) located at Faridabad, Haryana, India.
Pilot/Ad-hoc Surveys: Besides the regular socio-economic surveys of NSSO, taken up through 10-year
survey cycle, NSSO from time to time, also undertakes pilot enquiries and ad-hoc or special surveys. Such
surveys are conducted either for methodological studies or on the basis of specific requests received for such
surveys, from other agencies.
MAJOR SAMPLE SURVEYS
CONDUCTED BY THE STATE/ UTGOVERNMENTS
Agro-Economic Research Centre for North-East India, Assam Agricultural University,
Jorhat
Study No.1: State Budgetary Resources and Agricultural Development- A study in Assam.
Year /month of initiation: April, 2007.
Year/month of completion: July, 2009.
Name of the Executing Office/Organization: Agro-Economic Research Centre for North-East India. Assam
Agricultural University.Jorhat-785013.
Name of the Survey: State Budgetary Resources and Agricultural Development-A study in Assam.
Subject & Nature of the Survey-: Field Survey, data collection, tabulation, compilation, and report writing.
Contact details of the office along with e-mail id:
Director,Agro-Economic Research Centre for North-East India.
Assam Agricultural University Campus, Jorhat-785013.
Introduction of the Survey with objectives: The Budget of a country or a State simply means an annual
statement of accounts in terms of receipts and expenditure under different heads of developments. In each
annual Budget, Government either at Central level or at State level gives receipts and expenditure statements
through different policies initiatives adopted. It has been observed that the budgetary allocation against each
development sector has been increasing in high rate to attain the required growth rate of the economy of the
country. Declaration and stagnation in agricultural productivity growth almost all the crops across the States in
the last few years is a matter of great concern of the country and the State as well. Due to down ward trend of
crop production and productivity, the country in general and the State in particular is not able to maintain
demand and supply side in balance for which the price of agricultural commodities is rising in the recent years.
. As a result, it hurts common people and decreases their purchasing power. The State Assam is still not self-
sufficient in food front. To meet the demand, the State has to bank on imported agricultural commodities from
other States of the country. As a result a large amount of money drains out from the State’s exchequer.
Objectives: The study will focus on the following specified objectives:
To analyse the trend in allocation of resources to the agricultural sector as a whole and sub-
sectors of agriculture in particular in the State.
To document and analyse schemes under operation in the State contributing to the development
of the agriculture sector.
To enlist and analyse the impact of Central sector schemes operating in agricultural sector of the
State.
Coverage: The study is based on the following 10 nos. sectors of Agriculture and allied sectors of Assam:
Crop Husbandry
Soil and Water conservation
Animal Husbandry
Dairy Development
Animal Husbandry
Forestry & Wild life
Food, Storage & Warehousing
Agriculture Research & Education
Co-operation
Agricultural Finance Institution.
Sampling Design: The study is based on the secondary level data collected from the state budget
documents for financial resources allocated against 10 numbers of sectors of agriculture and allied sectors as
mentioned above.
Field Work: The field work is done in different sectors as in the methodology of the study above.
Data Processing: The data is processed by different heads viz. agriculture, land utilization, expenditure,
revenue, Plan, Scheme, GSDP, NSDP, etc. of Assam by simple mathematical & statistical tools and
implements.
Major Findings: The state agriculture has already crossed more than 5 decades of economic planning but still
it fails to lift agriculture sector of Assam from deficit level of food grains. The stagnation in productivity of major
crops in the last few years is great cause of concerned. There are lots of controversies among economist and
agriculture scientists regarding the cause of failure of agricultural planning in the State. One of the causes is
that there is a wide gap between allocation and actual expenditure under different heads of development for
which most of the development programmes suffer from inadequacy of budgetary expenditure in the State of
Assam. Inadequate plan allocation is also one of the reasons for failure of State agriculture. It seems that
ongoing technological changes have reached in its limitation to raise the productivity from existing level of
productivity crops in the last few years. Addition of new area to net crop area of the State is not an easy task
as it has its own limitation. The farmers of Assam are not able to adopt new technology fully for poor
economic condition and lack of knowledge of the farmers. In absence of one technological input or partly used
of technology is the major cause in stagnation of agricultural productivity in the State. Some important input
like HYV seed is not available in the right time for which the State agriculture suffers a lot. Higher productivity
can be expected only when all the inputs are applied in at right proportion and at right time which is not
happening in Assam. As agriculture is now a day’s capital intensive venture, therefore adequate credit supply
to the farmers is utmost important this is still in sufficient and inadequate in the state. From the study, it has
been established that the role of revenue expenditure on the growth in terms of NSDP of crop husbandry,
animal husbandry & dairy, fishery and forestry were found very slow. Therefore, it needs a proper review to
find out the reasons for not attaining the targeted goal of achievement.
Study No 2: Impact of Macro Management of Agriculture Scheme- A study in Assam
Year/month of initiation: April,2007
Year/month of completion: July 2010
Name of the Executing Office/ Organization: Agro-Economic Research Centre for North-East India. Assam
Agricultural University.Jorhat-785013.
Name of the Survey: Impact of Macro Management of Agriculture scheme-A Study in Assam.
Subject & Nature of the Survey: Field Survey, data collection, tabulation, compilation, and report writing.
Contact details of the office along with e-mail id: Director, Agro-Economic Research Centre for North-East
India. Assam Agricultural University Campus, Jorhat-785013
Introduction of the Survey with objectives: Agriculture is the largest unorganized sector, which provides
employment and income to the majority of working population in the rural sector. Land resources of Assam are
quite a rich. Rainfall and climate are congenial for growing a variety of crops including food crops, cash crops
and a host of other horticultural crops. The State has allotted about 71.0 per cent of cultivable land under rice
and more than 90 per cent of total land under food grains. Yet, the State is deficit in food front since early 60's
due to low productivity of food crops mainly because of low adoption of technology for crop cultivation, shortage
of infrastructural and institutional support and for high growth of' population. Moreover, poor performance of
agricultural sector can be attributed to small holdings, low cropping intensity, low level of adoption of new farm
technology, inadequate irrigation facility and consequently low productivity of principal crops below the national
average.
Under the Macro Management, the Central Government has been supplementing and complementing the
State Governments' efforts through regionally differentiated `Work Plans' comprising of crop/area/target group
and specific interventions, formulated in an inert-active mode implementing a spirit of partnership with States.
As a step towards this with effect from 2000-01, 27 Centrally Sponsored Schemes were merged with the
umbrella `Macro Management' leaving the full flexibility to the States to develop and pursue activities because
of their regional priorities. With launching of the Technology Mission on Horticulture for the North-Eastern
States, 10 other schemes pertaining to horticulture sector were kept out side of this Macro Management Mode
of Agriculture Schemes for this region. In North-Eastern States of India and Assam in particular, about 17
important schemes have been merged under Macro Management. The pattern of assistance under the
scheme is in the ratio of 90:10 for the Centre and the States respectively except in the case of North-eastern
States where 100 per cent Central assistance was envisaged. The Central assistance consists of Grant and
loan in the ratio of 80:20. Subsidy is available under the scheme on various components including agriculture
implements. Training programmes on different crop cultivation were also introduced in the State. Considering
the importance of agriculture in the economy of the State, top most priority was put in all the Five Years Plan
by the Government on the supportive services for the development of agriculture sector. Achieving self-
sufficiency in production of food grains has been the primary objectives of the Government. The efforts have
been directed to make optimum and efficient use of available resources to maximize the sector's contribution
to the NSDP. Therefore, much emphasis has been laid on enhancing the production and productivity of the
crops including the horticultural crops by harnessing the best in frontier technologies through improved farm
mechanization and assured irrigation, use of quality certified seeds of HYV, popularizing the Integrated
Nutrient and Pest Management with the special use of bio-fertilizer and bio-pesticides.
Objectives of the Study: To assess the impact of the sub-schemes under the Macro Management of
Agriculture Scheme on the production and productivity of various crops with minimum cost, the following
objectives were framed:
To assess the impact of the sub-schemes under the Macro Management of Agriculture Scheme on
the production and productivity of various crops with minimum cost,
To analyse the impact of efforts made by the State in increasing the seed replacement rates, in
terms of ensuring timely availability of sufficient quantity of good quality seeds and
To analyse the impact of the activities to promote Balance Integrated Nutrient Management to
maintain soil fertility and environment.
Coverage: The Study Covers two crops- Paddy and Jute in Nagaon District in Assam including three
blocks in each crop.
Sampling Design: In order to draw sample a complete district wise investment lists under MMMA
schemes for the year 2007-08 was collected from the Directorate of Agriculture, Assam. After receiving the
lists, Nagaon district of Assam was selected as the district had the highest investment under MMMA. A
complete beneficiaries list of ICDP rice and Special Jute Development Programme was collected from the
District Agriculture Office and Sub-Divisional Agricultural Office of the Nagaon district. In consultation with
the State Agricultural Department and District Agricultural Office, Nagaon the Community Development
Blocks (C.D. Blocks) and sample villages were selected by adopting the following criteria:
o Out of 18 (eighteen) C.D. Blocks of the district, 3 (three) C.D. Blocks were selected
considering the highest demonstrations and trainings of different agricultural schemes
under MMMA.
o From the 3 (three) selected C.D. Blocks, 12 (twelve) villages (4 (four) villages from each
C.D. Blocks) were selected depending on the highest beneficiaries (rice and jute) in the
villages.
After selecting the C.D. Blocks as well as the sample villages for the present investigation samples of
beneficiaries were drawn following two stage random sampling technique. In the first strata, the
beneficiaries were stratified according to type of the agricultural schemes. In the second strata, the
beneficiaries were selected by random sampling method from each agricultural scheme covering 60 (sixty)
samples 5 (five) beneficiary farmers from each village) as representative samples in each agricultural
scheme. Thus, a total of 120 (one hundred twenty) beneficiary farmer households were selected for the
study. The field level data were collected through personal interview method with the help of a set of
specially designed schedules by the Coordinating Centre. Information on the socio-economic position of
the beneficiaries, nature of agricultural activities as well as uses of seeds of different crops, uses of
Integrated Nutrient and Pest Management and constraints were obtained from the individual
beneficiaries of the different agricultural schemes.
Field Work: Field Work has done by a special schedule covering the objectives of the study by oral
investigation through above methodology.
Data Processing: The data is processed by different Heads viz, Demographic pattern, education, land
utilization, area, production, yield of the crop, income and expenditure etc by simple mathematical and
statistical formula.
Major Findings: The present study on the impact of ICDP rice and SJDP (jute) under MMMA scheme
on field level data indicated that in spite of efforts under the programmes the impacts were not found
very encouraging as the economic condition of the sample farmers were not improved as expected. It
was observed that the schemes were based on “Work Plan” of the Government, but the study revealed
that more emphasis was often put on the targets and achievements without considering the weak points
of the schemes and the problems of the farmers. These schemes often did not serve the real purpose of
the needy farmers. The plan and policies of the Governments were very good. So, far making the
agricultural development programmes successful in the state, development of infrastructural supports
are necessary and it also requires efficient planning, monitoring and sincere execution of the policies by
the Government agencies to make the schemes viable.
Study No.3: Potential and prospects of Rabi crops cultivation in Assam
Year /month of initiation: Sept.2009.
Year/month of completion: Sept.2011.
Name of the Executing Office/Organization: Agro-Economic Research Centre for North-East India. Assam
Agricultural University.Jorhat-785013
4. Name of the Survey: Potential and prospects of Rabi crops cultivation in Assam.
5. Subject & Nature of the Survey: Field Survey, data collection, tabulation, compilation, and report writing.
6. Contact details of the office: Director, Agro-Economic Research Centre for North-East India. Assam
Agricultural University Campus.Jorhat-785013
Introduction of the Survey with objectives: The summary of the importance of agriculture in overall
development of our economy can best be put in the jargons used in the National Agricultural Policy 2000 of
Government of India- "Agriculture is a way of life, a tradition, which, for centuries, has shaped the thought, the
outlook, the culture and the economic life of the people of India, Agriculture, therefore, is and will continue to
be central to all strategies for planned socio- economic development of the country. Rapid growth of
agriculture is essential not only to achieve self-reliance at national level but also for household food security
and to bring about equity in distribution of income and wealth resulting in rapid reduction in levels”. The
majority of the rural population earn their livelihood from and therefore the sector not only provides the much
needed food and fiber but employment to the rural mass, capital for economic transformation and thereby
responsible to increase the total rural welfare in numerous way.
Objectives: The specific objectives of the present study are:
To analyse the area, production and productivity of rabicrops in the district of Nagaonvis-a-vis
Assam
To study the economics of production of rabi crops in the sample farmers
To study the factors affecting productivity of rabicrops
To find out the constraints of production of rabicrops and suggest policy measures.
Coverage: The study covers the crops- Rape & Mustard, Pulses & Summer rice etc. in Nogaon district
of Assam.
Sampling Design: The present study was undertaken in Nagaon district of Assam. The district was
purposively selected as most of the rabi crops are grown extensively in the district- Among the rabi crops;
summer rice, pulses arid oilseeds were covered by the study Although rabi vegetables are also grown by the
farmers of the district for commercial purposes, it was not covered under the study due to the fact that summer
rice, pulse and oilseeds are the major food crops of Assam. From the district, two community development
blocks i.e.Kathiatoli and Batadrawa were selected for the study in consultation with the District Agriculture
Officer. Fromeach block, three villages were selected for field investigation where rabi crops were exclusively
grown by the farmers. Accordingly, from Kathiatoli block Chang Chaki Uttar Chang Chaki and ChariaHagi
villages and from Batadrawa block Solouguri. AthgaonChapori and Kandhulimari villages were selected for
data collection. Then from each selected village, 20 farmers of various farm size groups are selected by
following random sampling method. Thus a total of' 120 farmer households were covered by the study. The
study is based on both primary and secondary level data. The relevant summary data were collected with the
help of a set of specially designed schedules and questionnaire. The data were collected from the sample
households through personal interview method.
Field Work: Field Work has done by a special schedule covering the objectives of the study by oral
investigation through above methodology.
Data Processing: The data are processing different Heads viz, Demographic pattern, education, land
utilization, area, production, yield of the crop, income and expenditure etc by simple mathematical and
statistical formula.
Major Findings: The study highlighted that rabi crops have enormous potential in the study area despite a
number of constraints being faced by the farmers. The officials in the State Agriculture Department and the
scientists of' agricultural university are to work in tandem to ensure that the fruits of technology reach the
farmers at the grass roots. In order to achieve the desired level of productivity of rabi crops in the state, the
Government must operate in a big and effective way in creating basic infrastructural facilities and in co-
ordinating with related departments. A selective ‘area approach’ has been considered more effective to
consolidate the situation and to boost up the production of rabi crops. In chronically flood affected areas,
special programmes should be taken up for oilseed, pulses and summer rice cultivation in rabi seasons. In
view of the situation, it is necessary for the State Government to make concerted effort to bring all tile potential
areas under rabi cultivation to attain self- sufficiency in food grain production. However, all efforts to increase
agricultural production will have no impact unless the farmers are effectively involved in the development
programmes. For successful implementation of the agricultural development programmes, it is desirable to
involve the farmers in the decision making process as well as in implementation of the programmes.
Study No.4: Impact of NREGA on Wage Rates, Food Security and Rural Urban Migration –A
study in Assam
Year/month of initiation: Sept.2009
Year/month of completion: 2011.
Name of the Executing Office/Organization: Agro-Economic Research Centre for North-East India. Assam
Agricultural University.Jorhat-785013
Name of the Survey: Impact of NREGA on Wage Rates, Food Security and Rural Urban Migration -A study in
Assam.
Subject & Nature of the Survey: Field Survey, data collection, tabulation, compilation, and report writing.
Contact details of the office along with e-mail id: Director, Agro-Economic Research Centre for North-
East India. Assam Agricultural University Campus.Jorhat-785013
Introduction of the Survey with objectives: India is a country of villages and about 50 per cent of the villages
have very poor economic condition. In Assam, a large percentage of population i.e. more than85 per cent of the
total population still lives in rural areas. Indebtedness, unemployment, unproductive expenses, low level of
productivity, lack of adequate basic needs and minimum services are very common problems of the villagers of
Assam. In the state, there are more than 26,312 villages constituting 4.12 per cent of the total numbers of
villages in India as per 2001 census. The Directorate of Panchayat and Rural Development, Assam has two
wings. One is Panchayat Wings and other is Rural Development Wings. Both the wings have been
implementing various state and centrally sponsored schemes through 21 Zila Parishad, 219 blocks, 189
Anchalik Panchayat and 2202 Gram Panchayat, covering 27 districts. Keeping in view to this large chunk of
rural population, the father of nation, Mahatma Gandhi had given much emphasis to the concept "gram swaraj",
which deals with economic, political and cultural freedom of the villagers for all rounds of developments of rural
India. His concept of Swaraj is associated with more political freedom for socio-economic development of the
village people through Panchayati Raj. Although the Panchayats have historically been an integral part of rural
life in
India, but Panchayati Raj was formally introduced only in 1959. In 2009-10, it has been rechristened as
Mahatma Gandhi National Rural Employment Guarantee Act (MGNREGA). The act aims at enhancing at least
one hundred days of guaranteed wage in a financial year to every household whose adult members volunteer to
do unskilled manual work. The Act also emphasizes to uplift the rural economy in terms of livelihood, income,
employment and income distribution. In addition to this, it has taken a special care to empower women by
reducing gender differences in wages and their children. The Act also mandates 33 per cent participation for
women in NREGA work programmes. The NREGA implemented by the Ministry of Rural Development is the
flagship programme of the Central Government that directly touches the lives of the poor and promotes inclusive
growth. The National Rural Employment Guarantee Act was notified on September 7, 2005 and was the first of
its kind in the world. It was brought under per view of an act for rural employment at an unprecedented scale in
order to provide employment when other employment alternatives are scarce or inadequate. The Act came into
force on February 2, 2006 and was implemented in a phased manner. Phase-I (notified in 200 districts with
effect from February 2nd 2006), Phase-II (extended to 130 districts in the financial year 2007-08 (113 districts
from April 1st 2007 and 17 districts of UP were notified with effect from May 15th 2007) and Phase-III (remaining
districts in all the States/UTs were notified from April 1st 2008).
Main Objectives of the Study: Keeping in view to the above observations, the present study was carried out in Assam
with the following objectives
Measure the extent of manpower employment generated under NREGA, their various socio-economic
characteristics and gender variability in all the
districts implementing NREGA since its inception in the selected states.
To compare wage differentials between NREGA activities and other wage employment activities. Effect
on NREGA on the pattern of migration from rural to urban areas.

To find out the nature of assets created under NREGA and their durability. Identification of factors
determining the participation of people in NREGA scheme and whether NREGA has been successful in
ensuring better food security to the beneficiaries.
To assess the implementation of NREGA, it's functioning and to suggest suitable policy measures to
further strengthen the Programme
Coverage: In this study an attempt has been made in order to highlight of State NREGA in employment generation
in 27 districts in general and 5 sample districts viz., Bongaigaon, Cachar, Dibrugarh,Nagaon and Sonitpur of
Assam.
Sampling Design:The study is based on both primary and secondary data. From each district, two villages were
selected keeping into account their distance from the Head Quarter. One village is selected from the nearby
periphery of around 5 kilometers of the district Head Quarter and the second village is selected from a further
location of 15 kilometers or more. From each selected village, primary survey is carried out on 20 participants in
NREGA and 5 non-participant workers as wage employed. In this fashion, altogether 10 villages are surveyed in
detail to construct a baseline for the sake of comparison. For selecting participant households, a list of all
beneficiaries (participants) in the village is obtained from the Gram Panchayat or Programme Officer in the village
along with the information of caste factor of the workers. After getting the list, a Stratified Random Sampling
Method is adopted for selection of the participant households giving proportionate representation of the Caste, i.e.
(i) Schedule Caste (ii) Schedule Tribe (iii) Other Backward Caste (iv) Forward Castes (other). In this regard, a
point to be noted here is that the population of villages of Assam usually is homogeneous in caste structure.
Therefore, caste wise stratification could not be done. But utmost care is taken to include different caste in
selection of samples as a whale. Due attention is also paid to the gender factor. For
the selection of non-participants, no such list is available. Therefore, the non-
participant households are selected randomly from those households that are not
participating in NREGA but constitute the similar caste and gender characteristics as that of selected participant
households to maintain the uniformity and to avoid the selection bias. While selecting the districts, prescribed
guidelines are followed. In addition to household questionnaire, a village schedule is also designed to capture the
general changes that have taken place in the village during the last one decade and to take note of increase in
labour changes for agricultural operations after the implementation of NREGA. The village schedules also have
qualitative questions relating to change in life style of the villagers that are taking place during the period under
reference. One village schedule in each village is filled up with the help of a Group Discussion with the Panchayat
Members, Officials, educated person and other well informed inhabitants of the villages.
Field Work: Field Work has done by a special schedule covering the objectives of the study by personal interview
through above methodology
Data processing: The data is processed by various mathematical & statistical tools and implements through
socio-economic condition of the sample farmer, employment and unemployment, demographic profile, wages etc.
Major Findings: The NREGA can be considered as a new life line of the rural people who earn their livelihood
as wage earners. It gears up the social relationship among the rural people which is a pre requisite condition to
build a strong society or a nation. It also reduces the gender differences for some selected works. It is also
observed that female workers, both urban and rural, received lesser wages than that of their male counterparts
for doing the same set of jabs. The Act of the NREGS removed the gender difference in wages. The
participation of women folk in works was made compulsory as per the Act of NREGA. Accordingly, there must
be at least 33 per cent participation for women. The provision for caring minor children in the work site of the
NREGS is an extra advantage. It has been observed during field investigation that most of the households
earned their livelihood as unskilled casual labourers. Only, a few households' possess own cultivated land. They
usually go for Kharif paddy cultivation and a few households go for Rabi crops, mainly vegetables to meet the
household need only. Very few households could sell their produce as the production was not sufficient due to
inadequate coverage of area and low yield rate. Asset positions of most of the households were in a pathetic
condition. They had no option other than to go for wage earning or to act as petty vegetable vendors. Even as
wage earners, they do not get work for every day. They have to sit idle for at least for 3 to 4 days in a week.
Most of the households lived below the poverty line. Other socio-economic indicators were also far from
satisfactory level. However, BPI rice at subsidized rate under the scheme and Antyodaya Anna Yojona (AAY)
are giving a relief to the selected families to overcome the food shortage. In Assam, about 22.30 per cent people
are still living under poverty line. The implementation of NREGS activated the Panchayati Raj system which was
almost in a dormant state prior to its introduction. Age group wise classification of sample households, a sizable
share of population is in the age group 60 & above. It proves that expectancy of life is increasing on account of
improvement of medical care, etc. By and large, the NREGS is a ray of hope for this section people and it is an
opportunity for them to take part in the development agenda of the country with dignity. However, the NREGS
may have an adverse effect on availability of labourers for agricultural operations. Since labourers prefer to work
under NREGA on account of less supervision and less work, that too, in groups with some other facilities, the
farmers are bound to compete among themselves to offer higher wages to meet the shortage labourers in peak
season which consequently increase the cost of production. If the farmer fails to bear the rising expenditure
incurred in farming, they will have no option but to switch over from farming to other activities to earn their
livelihood. From the observations and personal interviews, it can be inferred that the
scheme could not fulfills its commitment of providing 100 days of employment in a year to the rural workers and
it failed to create assets convincingly as desired but it seemed to have paid good political dividends for the
governments.
Study No.5: Impact of Emerging Marketing Channels in Agriculture –Benefit to producer –Sellers and
Margins of orange and potato in Assam
1. Year/ month of initiation: Sept.2009
2. Year/month of completion: 2011
3. Name of the Executing Office/Organization: Agro-Economic Research Centre for North-East India. Assam
Agricultural University.Jorhat-785013
4. Name of the Survey: Impact of Emerging Marketing Channels in Agriculture –Benefit to producer –Sellers
and Margins of orange and potato in Assam.
5. Subject & Nature of the Survey: Field Survey, data collection, tabulation, compilation, and report writing.
6. Contact details of the office: Director, Agro-Economic Research Centre for North-East India. Assam
Agricultural University Campus.Jorhat-785013
Introduction of the Survey with objectives: Agricultural market reforms have been introduced in India since
the Eight Five Year Plan (1992-97). As the Government needs to depend more on market forces for price
stabilization and regulation, planning is now indicative more on private sector as it has a greater role to play.
Normally, the market mechanism favours the richer section of the society and the poor growers are always
remain at the receiving end. Hence, under new mechanism, provisions have been made to make the markets
friendly towards the growers by fixing the minimum support prices. Else, the efficiency of production, skill
formation, adoption of technology and generation of marketable surplus get adversely affected. It has to be
accepted that no mechanism in the market can equally distribute the fruits of development to all parts of the
country at a time.
Over the years, the Government of India set up several Committees and Expert Groups to suggest the
direction of reforms in the field of agricultural marketing. The first was in the line was Expert Group on
Agricultural Marketing (Acharya) constituted by the Union Ministry of Rural Development in 1998. Following
the constitution of this Expert Group, a major structural change occurred leading to the transfer of agricultural
marketing division of Union Government from the Ministry of Rural Development to the Ministry of Agriculture.
In December 2000, the Union Ministry of Agriculture constituted an Expert Committee on Strengthening and
Developing Agricultural Marketing System in the Country. This Committee (Guru Committee) reviewed the
entire system of agricultural marketing in the country and submitted its specific recommendations to the
Government in June 2001. The Expert Committee’s recommendations include various legislative reforms as
well as reorientation of policies and programmes (Government of India, 2001).
In India, with growing distortions in the supply chain for agricultural commodities, there is need for greater
efficiency in the supply chain. The emerging marketing channels are supposed to reduce the transaction costs
and ensure that the high margins that certain intermediary agents get in the regular marketing channels is
reduced. Some of the emerging channels include group-marketing, e-trading, direct marketing, contract
farming, modern terminal markets, future trading, ITC Choupal, self-help groups and NGOs in the marketing
chain.
Agricultural marketing functions are considered as the main planks of economic development in a state
like Assam. An efficient marketing system is indispensable for the success of the agricultural production
programme, which is launched in recent years. Marketing is an important link in the chain of production
activities of agriculture sector. Organised marketing therefore, is a precondition to sustain production
programme, more particularly, in respect of horticultural production. Marketing of horticultural crops in Assam
is largely unorganized and predominantly in the hands of intermediaries such as retail traders, wholesalers,
the pre- harvest contractors and others.
At present, the area under horticultural crops in Assam is 5.40 lakh hectares, which is 14 per cent of the
net cropped area of the State. This sector annually produces 14.02 lakh MT of fruits, 39.16 lakh MT of
vegetables, 2.18 lakh MT of spices besides nut crops, flowers and medicinal & aromatic plants (Economic
Survey 2009-10 ( Govt.of Assam). The state is surplus as regards to fruits, vegetables and spices production.
The important fruit crops grown include orange, pineapple, banana, lime lemon, jackfruits, guava, litchi, mango
etc. and more than 10 minor fruits. In case of vegetables, mention may be made of potato, various cole crops
and brinjal. Major spices grown are chilly, coriander, black pepper, ginger and turmeric. It is expected that the
study, once accomplished, will be useful to assess the efficacy of the emerging marketing channels vis-à-vis
regular marketing channels in Assam.
Objectives: The study is proposed with the following main objectives:
To estimate the share of the farmer in the consumer rupee in emerging marketing models vis-à-vis
the traditional marketing channels.
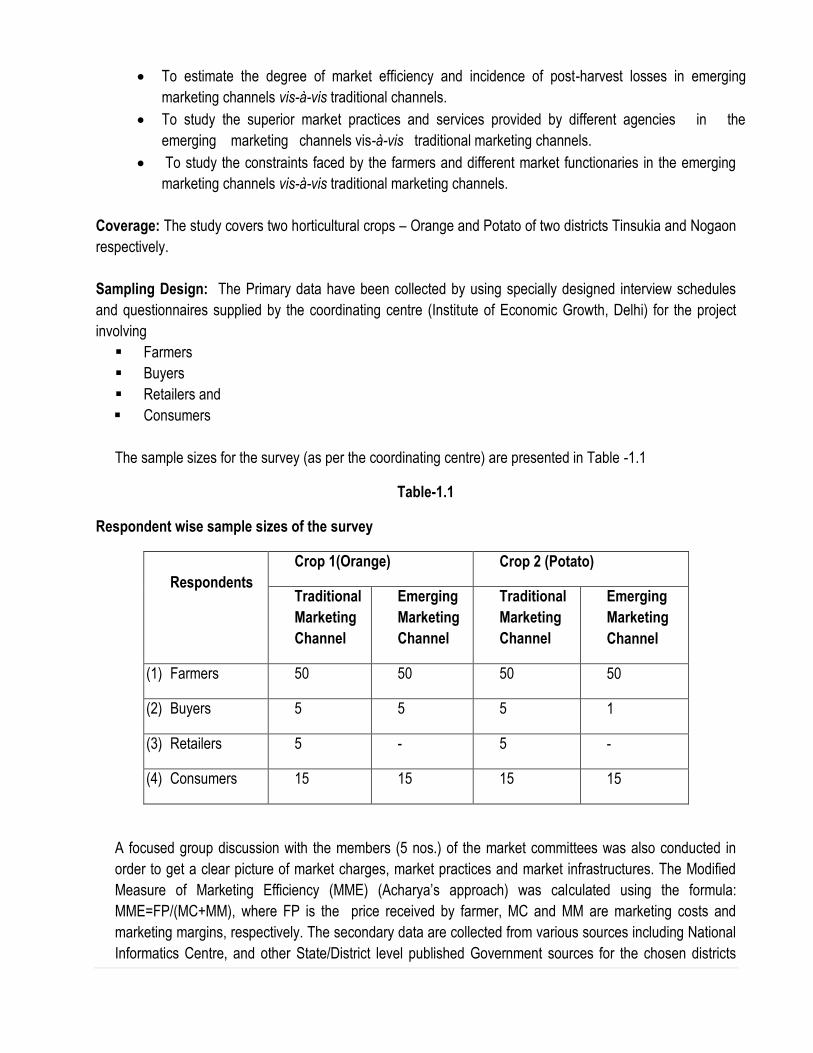
To estimate the degree of market efficiency and incidence of post-harvest losses in emerging
marketing channels vis-à-vis traditional channels.
To study the superior market practices and services provided by different agencies in the
emerging marketing channels vis-à-vis traditional marketing channels.
To study the constraints faced by the farmers and different market functionaries in the emerging
marketing channels vis-à-vis traditional marketing channels.
Coverage: The study covers two horticultural crops – Orange and Potato of two districts Tinsukia and Nogaon
respectively.
Sampling Design: The Primary data have been collected by using specially designed interview schedules
and questionnaires supplied by the coordinating centre (Institute of Economic Growth, Delhi) for the project
involving
Farmers
Buyers
Retailers and
Consumers
The sample sizes for the survey (as per the coordinating centre) are presented in Table -1.1
Table-1.1
Respondent wise sample sizes of the survey
Respondents
Crop 1(Orange) Crop 2 (Potato)
Traditional
Marketing
Channel
Emerging
Marketing
Channel
Traditional
Marketing
Channel
Emerging
Marketing
Channel
(1) Farmers 50 50 50 50
(2) Buyers 5 5 5 1
(3) Retailers 5 - 5 -
(4) Consumers 15 15 15 15
A focused group discussion with the members (5 nos.) of the market committees was also conducted in
order to get a clear picture of market charges, market practices and market infrastructures. The Modified
Measure of Marketing Efficiency (MME) (Acharya’s approach) was calculated using the formula:
MME=FP/(MC+MM), where FP is the price received by farmer, MC and MM are marketing costs and
marketing margins, respectively. The secondary data are collected from various sources including National
Informatics Centre, and other State/District level published Government sources for the chosen districts
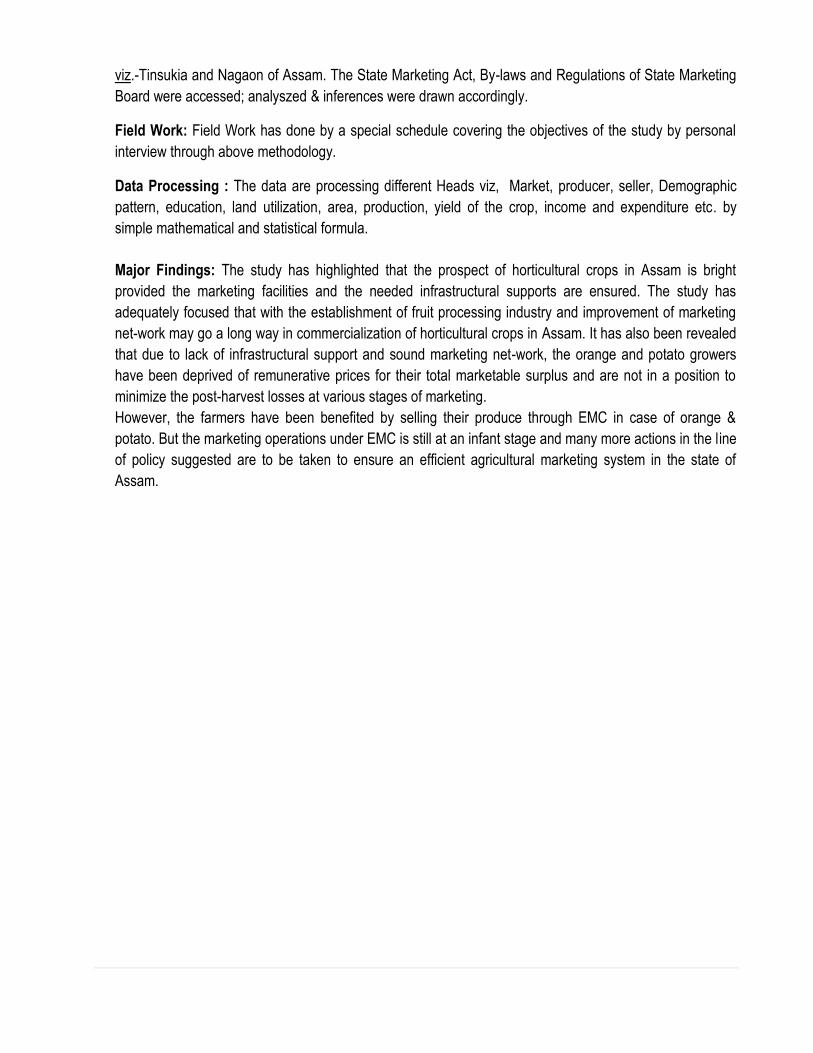
viz.-Tinsukia and Nagaon of Assam. The State Marketing Act, By-laws and Regulations of State Marketing
Board were accessed; analyszed & inferences were drawn accordingly.
Field Work: Field Work has done by a special schedule covering the objectives of the study by personal
interview through above methodology.
Data Processing : The data are processing different Heads viz, Market, producer, seller, Demographic
pattern, education, land utilization, area, production, yield of the crop, income and expenditure etc. by
simple mathematical and statistical formula.
Major Findings: The study has highlighted that the prospect of horticultural crops in Assam is bright
provided the marketing facilities and the needed infrastructural supports are ensured. The study has
adequately focused that with the establishment of fruit processing industry and improvement of marketing
net-work may go a long way in commercialization of horticultural crops in Assam. It has also been revealed
that due to lack of infrastructural support and sound marketing net-work, the orange and potato growers
have been deprived of remunerative prices for their total marketable surplus and are not in a position to
minimize the post-harvest losses at various stages of marketing.
However, the farmers have been benefited by selling their produce through EMC in case of orange &
potato. But the marketing operations under EMC is still at an infant stage and many more actions in the line
of policy suggested are to be taken to ensure an efficient agricultural marketing system in the state of
Assam.
Animal Husbandry & Veterinary Department, Assam
INFORMATION ON SAMPLE SURVEYS
Year / month of initiation: March
Year/ month of completion (if completed): February
Name of the Executing officer/ Organization: Statistical Section under the Directorate of A.H. & Veterinary.
Name of the Survey: Integrated Sample Survey.
Subject & Nature of the Survey: A study on the estimation of milk, egg and meat. Nature of the study is
seasonal.
Contact details of the office along with e-mail id: Contact No. of Director- 03612668609
Introduction of the survey with objectives: The estimation of production of milk, egg and meat in the state
of Assam is done under ’Integrated Sample Survey ’a centrally sponsored scheme following the technical
supervision of Technical Committee of Direction, Ministry of Agriculture, Govt. of India. The scheme presently
is a centrally sponsored one in the Department of Animal Husbandry having the expenditure on salary
between centre and state on 50:50 basis. The Technical Committee of Direction approves the estimates of
Integrated Sample Survey. The main objective of the survey is to make available current estimates on
livestock numbers and production of livestock products on a regular basis and also to study Animal Husbandry
attendant practices being adopted in different parts of the state.
Coverage: The Integrated Sample Survey covers 25 Districts of entire state of Assam.
Sampling Design: The plan of sampling design adopted for the survey is one of the three stages of stratified
random sampling for each season out of three seasons comprising of four months in a season. The entire
state is divided into strata as many as number of districts. Village of each district is the first stage, household in
the village is second stage and livestock/ poultry in the selected household is the third stage. In each season
complete enumeration of animals in the household of the selected villages is done in the first month while
detail study about livestock/poultry is conducted in the subsequent months of the season.
Field work: In order to conduct sample survey a year is divided into three seasons as follows:
Summer season : March to June
Rainy season : July to October
Winter Season : November to February.
In the field the data are collected by the field level enumerators and supervised by the Sub-Inspector or
Inspectors.
Data processing: When the field data reaches the Head Quarter, they are analyzed and estimation is
prepared seasonally for the seasons. An annual report is also prepared on the basis of seasonal reports and
submitted to the Animal Husbandry Statistics Division for necessary scrutiny. After the approval is received
from the Technical Committee of Direction, the report is made for public.
Major Findings: Integrated Sample Survey Report for the Year 2009-10; 2010-11 & 2011-12.
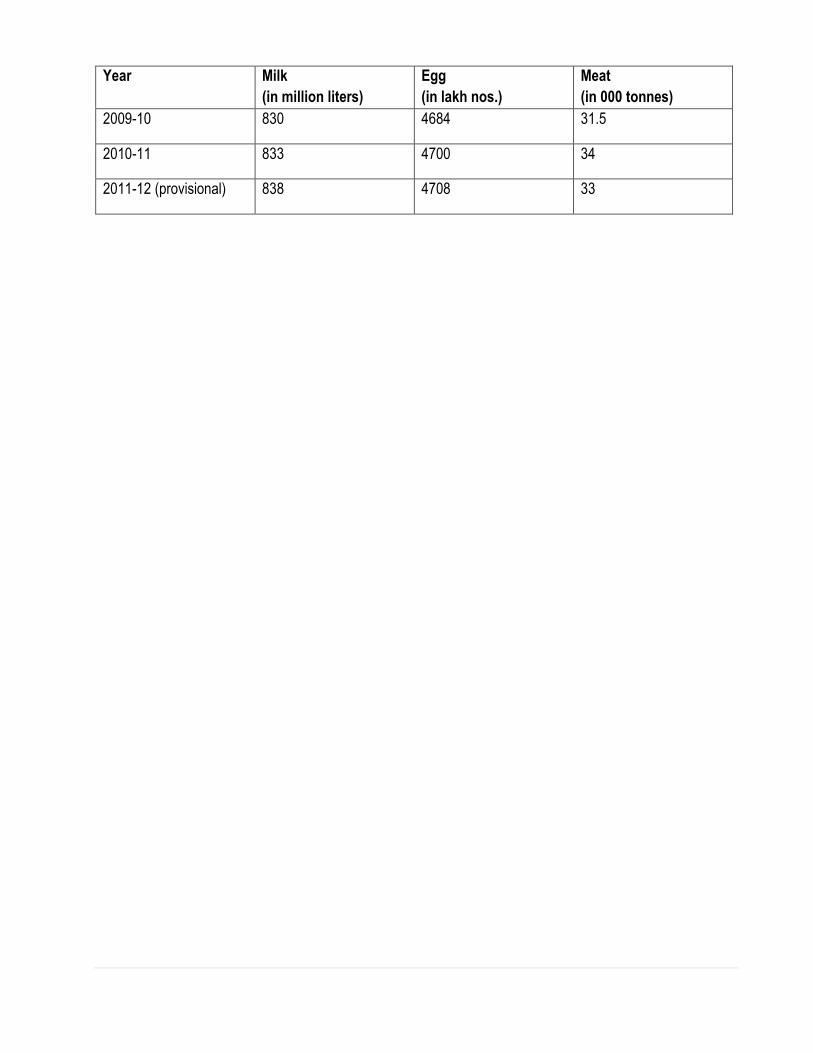
Year Milk
(in million liters)
Egg
(in lakh nos.)
Meat
(in 000 tonnes)
2009-10 830 4684 31.5
2010-11 833 4700 34
2011-12 (provisional) 838 4708 33
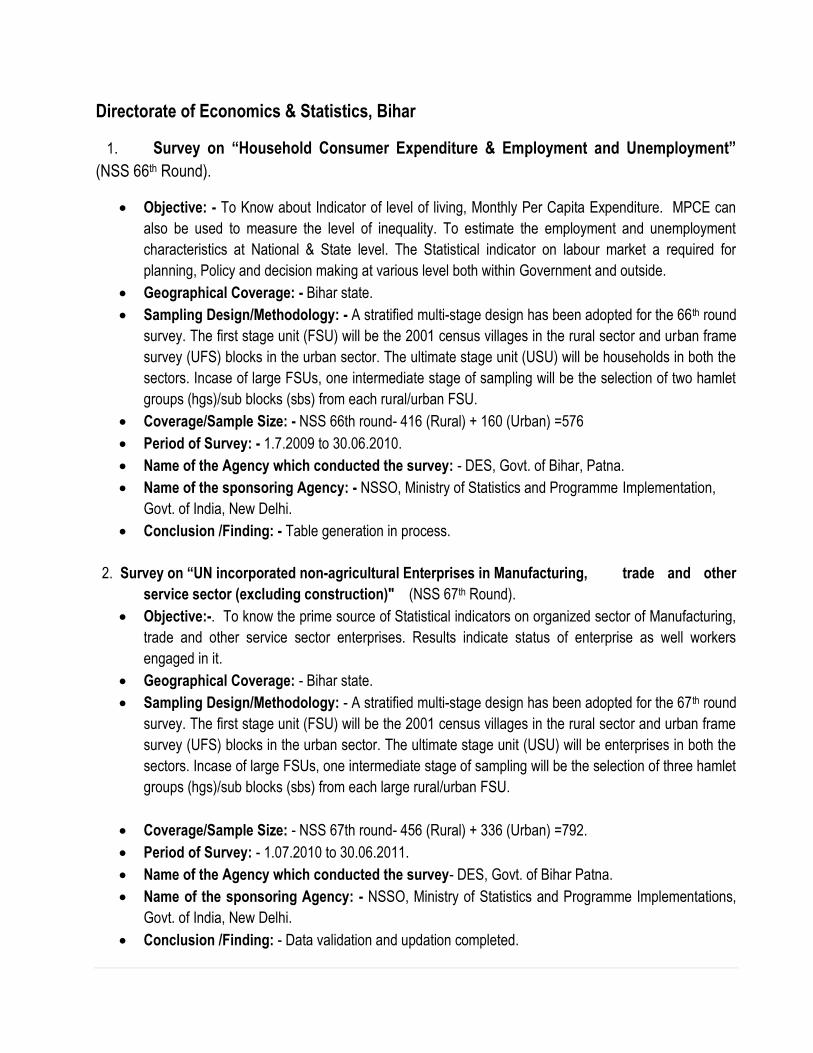
Directorate of Economics & Statistics, Bihar
1. Survey on “Household Consumer Expenditure & Employment and Unemployment”
(NSS 66th Round).
Objective: - To Know about Indicator of level of living, Monthly Per Capita Expenditure. MPCE can
also be used to measure the level of inequality. To estimate the employment and unemployment
characteristics at National & State level. The Statistical indicator on labour market a required for
planning, Policy and decision making at various level both within Government and outside.
Geographical Coverage: - Bihar state.
Sampling Design/Methodology: - A stratified multi-stage design has been adopted for the 66th round
survey. The first stage unit (FSU) will be the 2001 census villages in the rural sector and urban frame
survey (UFS) blocks in the urban sector. The ultimate stage unit (USU) will be households in both the
sectors. Incase of large FSUs, one intermediate stage of sampling will be the selection of two hamlet
groups (hgs)/sub blocks (sbs) from each rural/urban FSU.
Coverage/Sample Size: - NSS 66th round- 416 (Rural) + 160 (Urban) =576
Period of Survey: - 1.7.2009 to 30.06.2010.
Name of the Agency which conducted the survey: - DES, Govt. of Bihar, Patna.
Name of the sponsoring Agency: - NSSO, Ministry of Statistics and Programme Implementation,
Govt. of India, New Delhi.
Conclusion /Finding: - Table generation in process.
2. Survey on “UN incorporated non-agricultural Enterprises in Manufacturing, trade and other
service sector (excluding construction)" (NSS 67th Round).
Objective:-. To know the prime source of Statistical indicators on organized sector of Manufacturing,
trade and other service sector enterprises. Results indicate status of enterprise as well workers
engaged in it.
Geographical Coverage: - Bihar state.
Sampling Design/Methodology: - A stratified multi-stage design has been adopted for the 67th round
survey. The first stage unit (FSU) will be the 2001 census villages in the rural sector and urban frame
survey (UFS) blocks in the urban sector. The ultimate stage unit (USU) will be enterprises in both the
sectors. Incase of large FSUs, one intermediate stage of sampling will be the selection of three hamlet
groups (hgs)/sub blocks (sbs) from each large rural/urban FSU.
Coverage/Sample Size: - NSS 67th round- 456 (Rural) + 336 (Urban) =792.
Period of Survey: - 1.07.2010 to 30.06.2011.
Name of the Agency which conducted the survey- DES, Govt. of Bihar Patna.
Name of the sponsoring Agency: - NSSO, Ministry of Statistics and Programme Implementations,
Govt. of India, New Delhi.
Conclusion /Finding: - Data validation and updation completed.
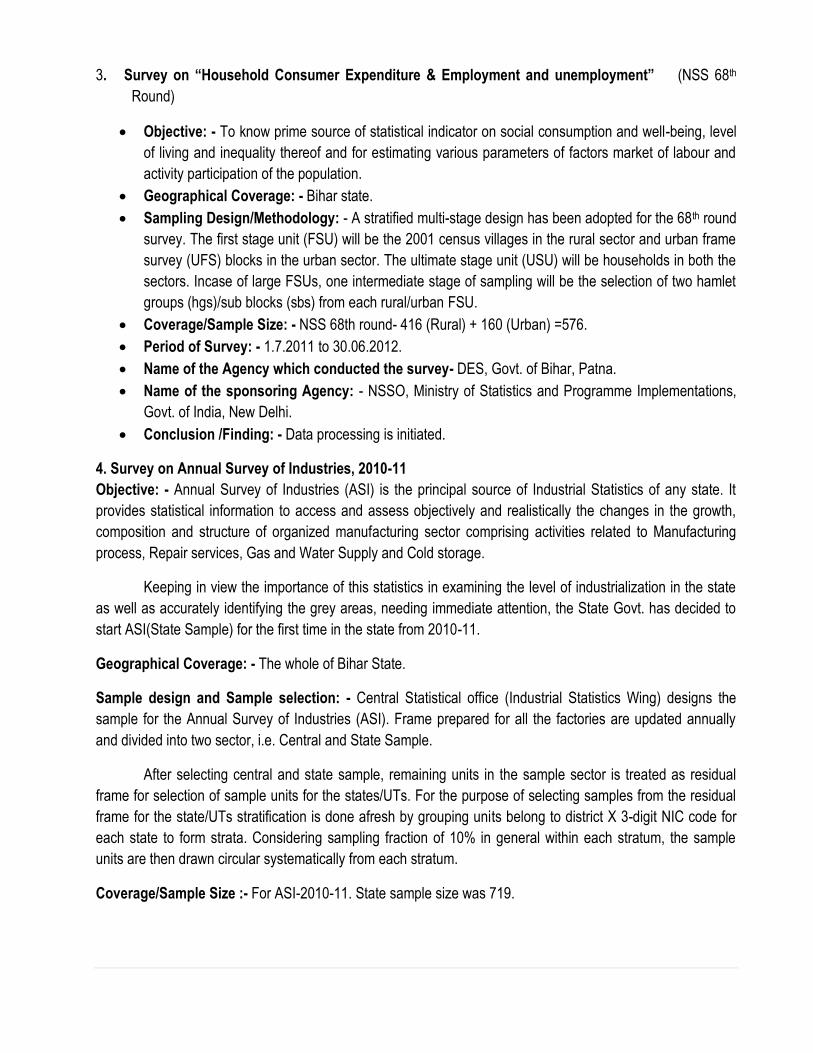
3. Survey on “Household Consumer Expenditure & Employment and unemployment” (NSS 68th
Round)
Objective: - To know prime source of statistical indicator on social consumption and well-being, level
of living and inequality thereof and for estimating various parameters of factors market of labour and
activity participation of the population.
Geographical Coverage: - Bihar state.
Sampling Design/Methodology: - A stratified multi-stage design has been adopted for the 68th round
survey. The first stage unit (FSU) will be the 2001 census villages in the rural sector and urban frame
survey (UFS) blocks in the urban sector. The ultimate stage unit (USU) will be households in both the
sectors. Incase of large FSUs, one intermediate stage of sampling will be the selection of two hamlet
groups (hgs)/sub blocks (sbs) from each rural/urban FSU.
Coverage/Sample Size: - NSS 68th round- 416 (Rural) + 160 (Urban) =576.
Period of Survey: - 1.7.2011 to 30.06.2012.
Name of the Agency which conducted the survey- DES, Govt. of Bihar, Patna.
Name of the sponsoring Agency: - NSSO, Ministry of Statistics and Programme Implementations,
Govt. of India, New Delhi.
Conclusion /Finding: - Data processing is initiated.
4. Survey on Annual Survey of Industries, 2010-11
Objective: - Annual Survey of Industries (ASI) is the principal source of Industrial Statistics of any state. It
provides statistical information to access and assess objectively and realistically the changes in the growth,
composition and structure of organized manufacturing sector comprising activities related to Manufacturing
process, Repair services, Gas and Water Supply and Cold storage.
Keeping in view the importance of this statistics in examining the level of industrialization in the state
as well as accurately identifying the grey areas, needing immediate attention, the State Govt. has decided to
start ASI(State Sample) for the first time in the state from 2010-11.
Geographical Coverage: - The whole of Bihar State.
Sample design and Sample selection: - Central Statistical office (Industrial Statistics Wing) designs the
sample for the Annual Survey of Industries (ASI). Frame prepared for all the factories are updated annually
and divided into two sector, i.e. Central and State Sample.
After selecting central and state sample, remaining units in the sample sector is treated as residual
frame for selection of sample units for the states/UTs. For the purpose of selecting samples from the residual
frame for the state/UTs stratification is done afresh by grouping units belong to district X 3-digit NIC code for
each state to form strata. Considering sampling fraction of 10% in general within each stratum, the sample
units are then drawn circular systematically from each stratum.
Coverage/Sample Size :- For ASI-2010-11. State sample size was 719.
Period of Survey :- Sept. to April Every financial year for all items in a calendar year. As ASI-2010-11 was the
first attempt by the state, due to procedural delay the survey was scheduled for March, 2012 to Feb. 2013. The
field work has been completed in Oct. 2012.
Name of the Agency which conducted the survey:- DES, Deptt. of Planning and Development, Govt. of
Bihar.
Name of the Sponsoring Agency: CSO(ISW). Kolkata, Ministry of Statistics and Programme Implementation
, Govt. of India.
Conclusion/ Finding: - Field work has been completed. The work of data of schedules as per guidelines
received from CSO (ISW), is in progress. Hence, findings are still awaited.
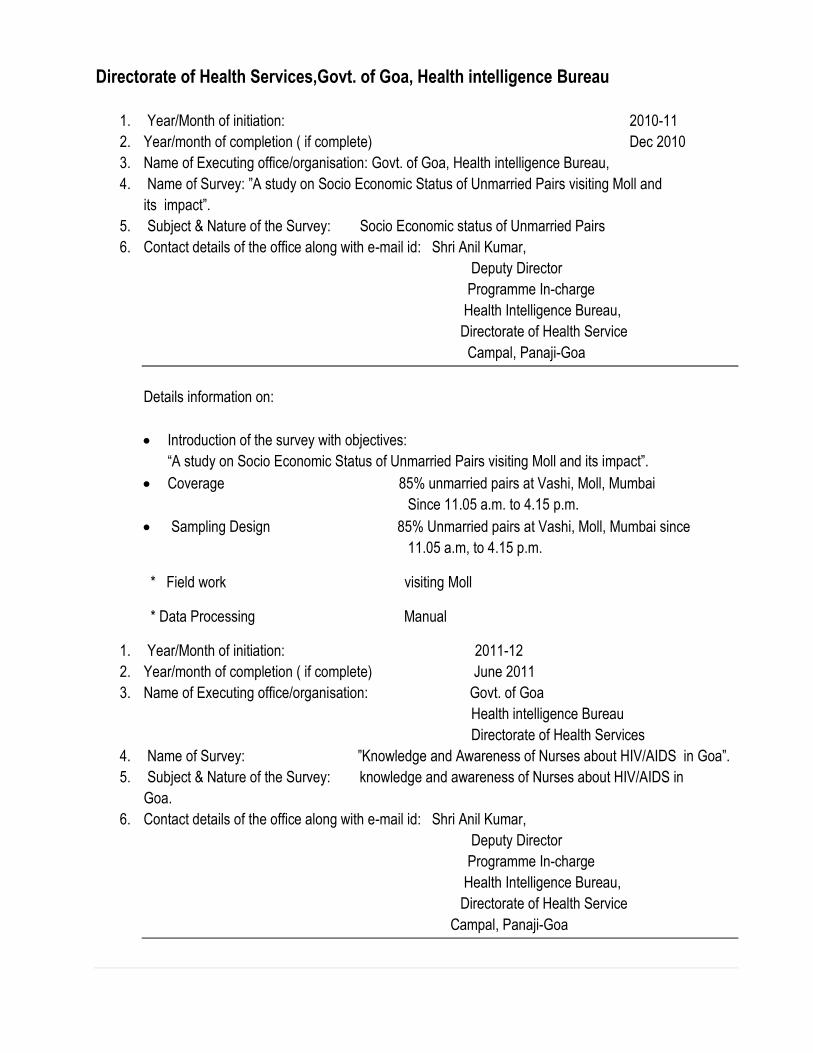
Directorate of Health Services,Govt. of Goa, Health intelligence Bureau
1. Year/Month of initiation: 2010-11
2. Year/month of completion ( if complete) Dec 2010
3. Name of Executing office/organisation: Govt. of Goa, Health intelligence Bureau,
4. Name of Survey: ”A study on Socio Economic Status of Unmarried Pairs visiting Moll and
its impact”.
5. Subject & Nature of the Survey: Socio Economic status of Unmarried Pairs
6. Contact details of the office along with e-mail id: Shri Anil Kumar,
Deputy Director
Programme In-charge
Health Intelligence Bureau,
Directorate of Health Service
Campal, Panaji-Goa
Details information on:
Introduction of the survey with objectives:
“A study on Socio Economic Status of Unmarried Pairs visiting Moll and its impact”.
Coverage 85% unmarried pairs at Vashi, Moll, Mumbai
Since 11.05 a.m. to 4.15 p.m.
Sampling Design 85% Unmarried pairs at Vashi, Moll, Mumbai since
11.05 a.m, to 4.15 p.m.
* Field work visiting Moll
* Data Processing Manual
1. Year/Month of initiation: 2011-12
2. Year/month of completion ( if complete) June 2011
3. Name of Executing office/organisation: Govt. of Goa
Health intelligence Bureau
Directorate of Health Services
4. Name of Survey: ”Knowledge and Awareness of Nurses about HIV/AIDS in Goa”.
5. Subject & Nature of the Survey: knowledge and awareness of Nurses about HIV/AIDS in
Goa.
6. Contact details of the office along with e-mail id: Shri Anil Kumar,
Deputy Director
Programme In-charge
Health Intelligence Bureau,
Directorate of Health Service
Campal, Panaji-Goa
Details information :
Introduction of the survey with objectives:
Introduction of the survey with objects: Knowledge and Awareness of Nurses about HTV/AIDS in
Goa”.
Coverage 10% Nurses of different Hospitals.
Sampling Design 10% Nurses of different Hospitals.
11.05 a.m, to 4.15 p.m.
Field work Hospital based
Data Processing Manual
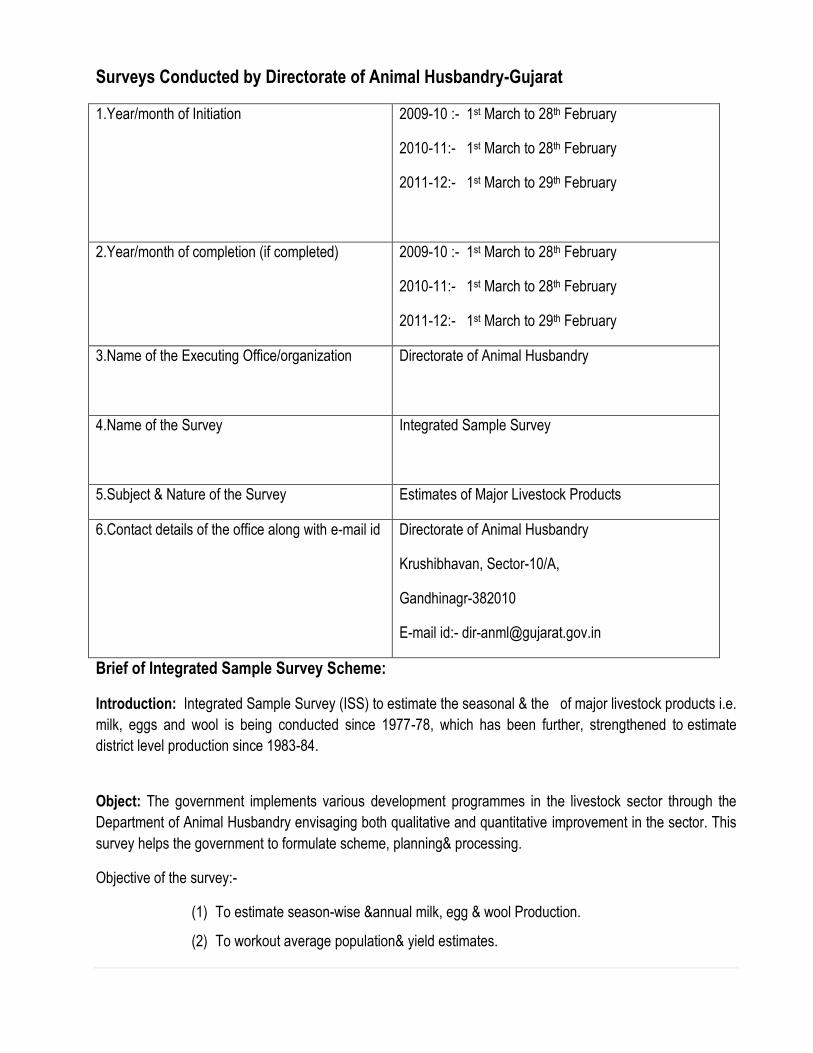
Surveys Conducted by Directorate of Animal Husbandry-Gujarat
1.Year/month of Initiation 2009-10 :- 1st March to 28th February
2010-11:- 1st March to 28th February
2011-12:- 1st March to 29th February
2.Year/month of completion (if completed)
2009-10 :- 1st March to 28th February
2010-11:- 1st March to 28th February
2011-12:- 1st March to 29th February
3.Name of the Executing Office/organization
Directorate of Animal Husbandry
4.Name of the Survey Integrated Sample Survey
5.Subject & Nature of the Survey Estimates of Major Livestock Products
6.Contact details of the office along with e-mail id Directorate of Animal Husbandry
Krushibhavan, Sector-10/A,
Gandhinagr-382010
E-mail id:- [email protected]
Brief of Integrated Sample Survey Scheme:
Introduction: Integrated Sample Survey (ISS) to estimate the seasonal & the of major livestock products i.e.
milk, eggs and wool is being conducted since 1977-78, which has been further, strengthened to estimate
district level production since 1983-84.
Object: The government implements various development programmes in the livestock sector through the
Department of Animal Husbandry envisaging both qualitative and quantitative improvement in the sector. This
survey helps the government to formulate scheme, planning& processing.
Objective of the survey:-
(1) To estimate season-wise &annual milk, egg & wool Production.
(2) To workout average population& yield estimates.
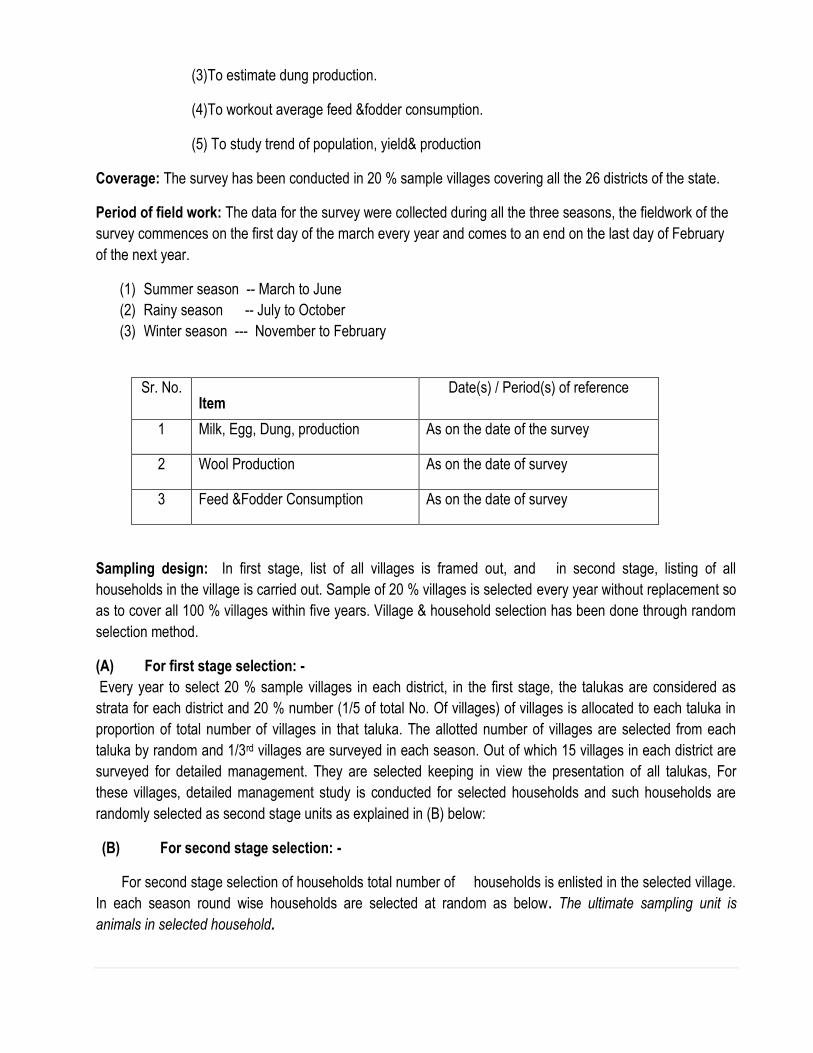
(3)To estimate dung production.
(4)To workout average feed &fodder consumption.
(5) To study trend of population, yield& production
Coverage: The survey has been conducted in 20 % sample villages covering all the 26 districts of the state.
Period of field work: The data for the survey were collected during all the three seasons, the fieldwork of the
survey commences on the first day of the march every year and comes to an end on the last day of February
of the next year.
(1) Summer season -- March to June
(2) Rainy season -- July to October
(3) Winter season --- November to February
Sr. No. Item
Date(s) / Period(s) of reference
1 Milk, Egg, Dung, production As on the date of the survey
2 Wool Production As on the date of survey
3 Feed &Fodder Consumption As on the date of survey
Sampling design: In first stage, list of all villages is framed out, and in second stage, listing of all
households in the village is carried out. Sample of 20 % villages is selected every year without replacement so
as to cover all 100 % villages within five years. Village & household selection has been done through random
selection method.
(A) For first stage selection: -
Every year to select 20 % sample villages in each district, in the first stage, the talukas are considered as
strata for each district and 20 % number (1/5 of total No. Of villages) of villages is allocated to each taluka in
proportion of total number of villages in that taluka. The allotted number of villages are selected from each
taluka by random and 1/3rd villages are surveyed in each season. Out of which 15 villages in each district are
surveyed for detailed management. They are selected keeping in view the presentation of all talukas, For
these villages, detailed management study is conducted for selected households and such households are
randomly selected as second stage units as explained in (B) below:
(B) For second stage selection: -
For second stage selection of households total number of households is enlisted in the selected village.
In each season round wise households are selected at random as below. The ultimate sampling unit is
animals in selected household.
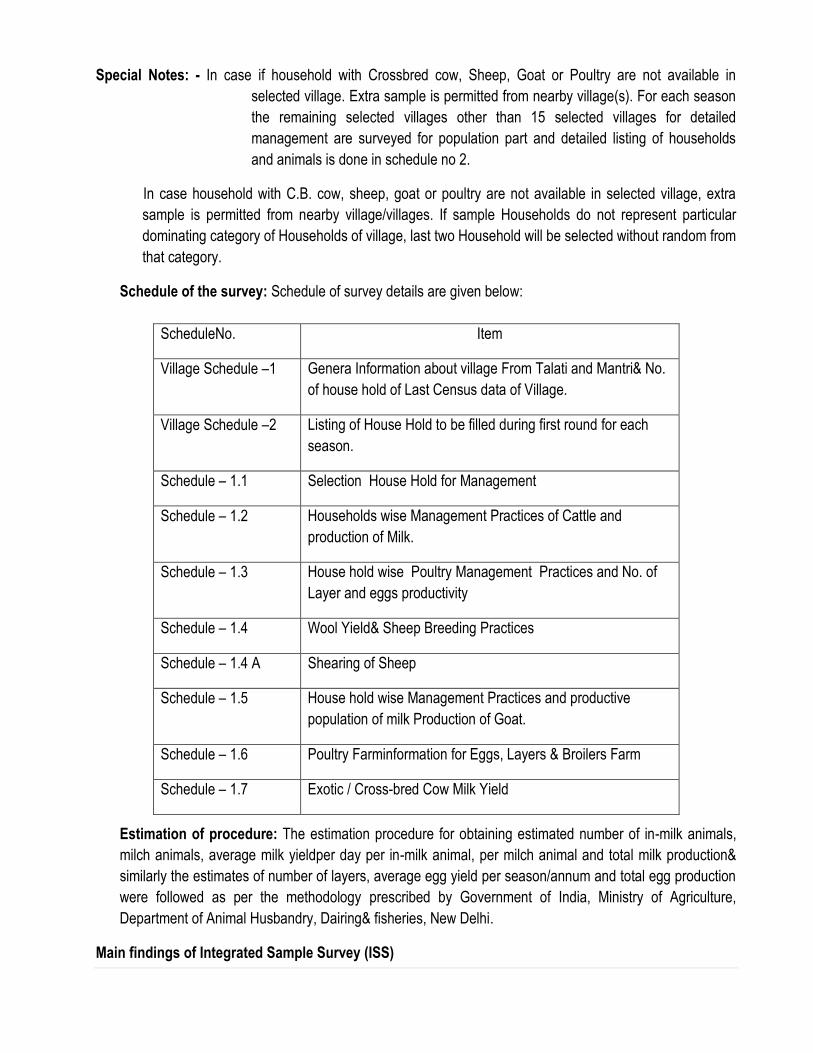
Special Notes: - In case if household with Crossbred cow, Sheep, Goat or Poultry are not available in
selected village. Extra sample is permitted from nearby village(s). For each season
the remaining selected villages other than 15 selected villages for detailed
management are surveyed for population part and detailed listing of households
and animals is done in schedule no 2.
In case household with C.B. cow, sheep, goat or poultry are not available in selected village, extra
sample is permitted from nearby village/villages. If sample Households do not represent particular
dominating category of Households of village, last two Household will be selected without random from
that category.
Schedule of the survey: Schedule of survey details are given below:
Estimation of procedure: The estimation procedure for obtaining estimated number of in-milk animals,
milch animals, average milk yieldper day per in-milk animal, per milch animal and total milk production&
similarly the estimates of number of layers, average egg yield per season/annum and total egg production
were followed as per the methodology prescribed by Government of India, Ministry of Agriculture,
Department of Animal Husbandry, Dairing& fisheries, New Delhi.
Main findings of Integrated Sample Survey (ISS)
ScheduleNo. Item
Village Schedule –1 Genera Information about village From Talati and Mantri& No.
of house hold of Last Census data of Village.
Village Schedule –2 Listing of House Hold to be filled during first round for each
season.
Schedule – 1.1 Selection House Hold for Management
Schedule – 1.2 Households wise Management Practices of Cattle and
production of Milk.
Schedule – 1.3 House hold wise Poultry Management Practices and No. of
Layer and eggs productivity
Schedule – 1.4 Wool Yield& Sheep Breeding Practices
Schedule – 1.4 A Shearing of Sheep
Schedule – 1.5 House hold wise Management Practices and productive
population of milk Production of Goat.
Schedule – 1.6 Poultry Farminformation for Eggs, Layers & Broilers Farm
Schedule – 1.7 Exotic / Cross-bred Cow Milk Yield
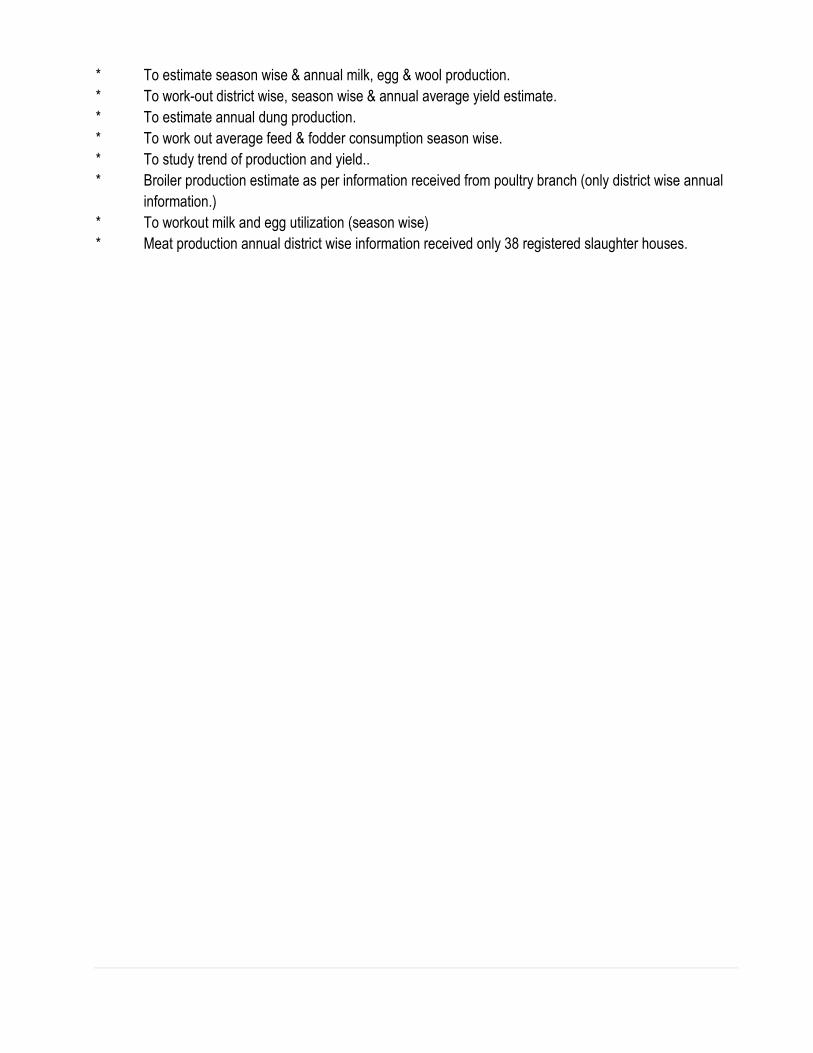
* To estimate season wise & annual milk, egg & wool production.
* To work-out district wise, season wise & annual average yield estimate.
* To estimate annual dung production.
* To work out average feed & fodder consumption season wise.
* To study trend of production and yield..
* Broiler production estimate as per information received from poultry branch (only district wise annual
information.)
* To workout milk and egg utilization (season wise)
* Meat production annual district wise information received only 38 registered slaughter houses.
Evaluation of Maternal and Child Health (MCH) Services in Gujarat by District Level Rapid
Household Survey, Health & Medical Services and Medical Education, Govt. of Gujarat
Introduction of the Survey with objectives
Gujarat state of India has come a long way in improving the health indicators since independence, but
progress in reducing vital rates (CBR, CDR, IMR, MMR etc.) has been slow and largely unmeasured or
documented. There are several challenges for reducing these vital statistics to the targeted to assess progress
towards achievements of MDG. In spite of several national level surveys (NFHS & RCH) there are several
challenges yet to be addressed to know the reach of the services being imparted to the resident population in
an area. Government of Gujarat has initiated its efforts to know the status of some important MCH service
indicators as well vital statistics at district level and the state level in the state of Gujarat
Background: The dramatic economic growth and food surplus witnessed in India in recent times have
unfortunately not had the desired health impacts on two of the most vulnerable population groups, viz., women
and children. High rates of maternal mortality in the country suggest that childbearing, which continues to be a
primary role for the majority of Indian women, is far from safe; in addition, the country also has embarrassingly
high rates of infant and child mortality. Thus it is unlikely that India will be able to achieve MDGs 4 and 5 by the
targeted date. Recognizing the short comings of the health care system to effectively deliver the most crucial
services for a safe pregnancy and delivery as well as ensure child survival, the Ministry of Health and Family
Welfare, Government of India, launched a major initiative, the National Rural Health Mission (NRHM) in 2005
to carry out various corrections in the basic health delivery system. Among other things suggested in the Plan
of Action under the NRHM is the increased allocation of public funds on health, optimize health manpower,
ensure community participation and ownership of assets and upgrade community health centres (CHCs) into
functional hospitals that conform to the Indian Public Health Standards. A major paradigm shift has occurred
under the NRHM focusing on decentralized planning, a pro-poor more equitable health system, and rights-
based service delivery. Community participation is envisaged in the form of Village Health and Sanitation
Committees and appointment of a cadre of grassroots volunteers- the Accredited Social Health Activist
(ASHA) at the village level. Simultaneously, RogiKalyan Samitis (RKS) have also been established at various
levels of health facilities to ensure monitoring of health activities and proper utilization of funds allocated for the
same.
In addition to implementing the various activities envisaged under the NRHM, the Government of
Gujarat is implementing special schemes such as the Chiranjeevi Yojana and the Mid-Day Meal to save
maternal lives and fight against malnutrition. To consolidate and redouble the efforts to curb maternal and child
mortality, the NirogiBalakYojana has also been launched since 2000. Furthermore, to tackle neonatal
mortality, which accounts for almost three-fifths of infant mortality in the state, the BalSakha Yojana as part of
public-private partnership (along the lines of the Chiranjeevi Yojana for increasing institutional deliveries), has
also been launched to provide high quality neonatal care, by a qualified pediatrician, especially to newborns of
BPL mothers who are most likely to be “at risk”.To further ensure better reach of maternal and child services,
the Government of Gujarat was the first to launch a programme, the e-Mamta, whereby health workers are
enabled to track all pregnant women in their area and provide timely antenatal services and subsequently also
provide immunization services after childbirth.
In view of these recent developments in the national programme and certain initiatives also launched
by the state government, it becomes essential to have periodic estimates on various parameters of maternal
and child health to understand the impact of the programme and take remedial action where necessary. In
spite of periodic conduct of several national and state level surveys, such as NFHS and DLHS over the years
in the country, there are major challenges yet to be addressed to ascertain the reach of the services,
particularly among the vulnerable sections of the population in a district and such feedback should be on a
regular basis and quick enough for remedial action where necessary. In this regard, Government of Gujarat
has initiated efforts to assess the status of maternal and child health as well as the changes in the level of
fertility and infant mortality that occurred at the district level, to understand the impact of the various
programmes in the state, by hiring their one of the empanelled consultant of Gujarat Social Infrastructure
Development Board Society (GSIDBS). The present first round District Level Rapid Household Survey
(DLRHS-I) is an attempt in this direction.
Objective: The main objective of the present DLRHS is to evaluate focused MCH and Family Planning
indicators, covering particularly the following aspects:
Coverage of antenatal check-up and related immunization and nutrition services
Institutional/safe deliveries
JSY/ CY beneficiaries
Post- natal check- up and neonatal care
Child feeding practices
Child immunization and vitamin A supplementation
Diarrhoea and ARI management among children
Contraceptive prevalence rates and use of spacing methods
Besides, an attempt is made to identify events of births and deaths in the surveyed population to provide some
crude vital indicators (Birth; Death; under five; infant etc.) to judge the performance of MCH and FP services at
the district as well as the state level.
Sample Coverage: The present survey (DLRHS) could actually cover a total of 1, 14,675 households and
99,207 currently married women (CMW) age 15-49 years, enumerating 390 PSUs (224 rural and 128 urban),
in the state of Gujarat.
The response rates are 94 and 96 percent for households and currently married women respectively.
The present study is based on sampled de jure population of 5, 14,888 persons, of whom 66.5 percent
lived in the rural areas of Gujarat.
Sampling Design: A multi-stage systematic sampling design was adopted for DLRHS. In each district, a total
of 15 primary sampling units (PSUs) which are census villages in rural areas and census enumeration blocks
(CEBs) in urban areas, were covered. In rural areas, first villages were selected by probability proportional to
size (PPS) systematic sampling and at the second stage all the households in the PSU were selected after the
segmenting the selected village as mentioned in the relevant section.
For urban areas, first wards were selected by PPS systematic sampling, followed by selection of CEBs at the
second stage by PPS sampling and selection of all the house-holds in the selected PSU were selected at the
third stage. The Census of India, 2001 was used as the sampling frame for the present survey. To provide
reliable estimates of various demographic and health indicators, such as, the level of immunization, antenatal
check-up and institutional delivery as well as the vital rates (based on recent births to women in the
households), the number of households representing a district is range in between a minimum of 2,725 to
maximum about 4,750, depending on its population size. The sample size of the district also takes care of
nonresponse. Thus, the study was expected to cover about 117,000 households, from all the 26 districts in the
state of Gujarat.
The PSUs were allocated to rural and urban areas of each district proportionally to the actual rural-urban
population ratio (2011 census) and within the rural-urban domains. It was proposed to cover, on an average,
300 households per PSU in the rural areas, while it was 150 households per CEB in the urban areas. It may
be noted that segmentation procedure was adopted in those PSUs where the total number of households in
the selected PSU exceeded the targeted sample size. Further, to make a proper rural PSU, selected villages
with less than 300 households were linked with another contiguous village. As mentioned earlier, selected
villages with more than 300 households were divided into two or more segments and one segment of 300 HHs
was randomly selected so as to have standard size PSUs. All the currently married women (CMW) age 15-49
years from the sampled households were the respondents for the Woman’s Questionnaire on pregnancy
history, RCH and family planning, while any adult household member was the respondent for the Household
Questionnaire in DLRHS. Two main instruments namely, Household (HH) and Currently Married Woman
(CMW) were used to collect data in DLRHS. These questionnaires were developed in local Gujarati language
and were pre-tested before their finalization and printing.
Field Work
Household Questionnaire: The household questionnaire listed all usual residents in each sample
household including those who were temporarily out (but excluding any visitors). For individual
household members, information on age, sex, marital status and relationship to the head of the
household were collected. Information on births and deaths that occurred to the usual members of the
household during three years preceding the survey was also recorded. Efforts were made to get
information about infant and maternal deaths.
Currently Married Woman’s Questionnaire: The respondents to the currently married woman’s
questionnaire were married women age 15-49 years co-habiting with their husbands in the sampled
households. Details on their age, age at marriage, age at cohabitation, educational attainment,
number of biological children ever born and surviving by sex were collected. The details of the recent
pregnancies and their outcome that occurred during five years preceding the survey were also
collected. Additionally, based on women’s recent births their detailed accounts of antenatal check-up,
experience of pregnancy related complications, place of delivery, attendance at delivery , post natal
care, neonatal care, child feeding practices, diarrhea and ARI management and child immunization
including vitamin A supplementation were gathered in the woman’s questionnaire. As mentioned
earlier, for the recent births, immunizations status of children was collected either from the vaccination
card or by asking the mother about the status of immunization of the child. The final section of the
questionnaire dealt with the history of contraceptive use in brief.
Data Processing
Field Operations and Quality Control: Actual field operations under DLRHS in all the districts of Gujarat
state were implemented in a uniform manner. Data from the selected PSUs were collected by 13 teams, each
consisting of 6 person’s viz., 1 Supervisor, 1 Field Editor and 4 Female Investigators who had a graduate
degree. The survey was carried out from May 2011 to October 2011 (with one month break due to heavy
torrential rainfall). All the selected field staff was provided extensive training on various aspects of fertility,
mortality, family planning and maternal and child health by the senior member of the project team and invited
experts. They were also taught about interviewing technique and how to fill and edit Household and Woman’s
questionnaire. A separate training session was also organised for Editors and Supervisors to acquaint them
about their roles and responsibilities during the field survey. Two-day field training was also arranged for the
field staff, after the successful completion of five-day class room training. A minimum of two days visit to each
sampled PSU was followed during data collection to ensure 100percent coverage of all the households and
currently married women.
A strict quality check protocol was put in by way of spot and back check of a team. An individual with
supervisory rank was placed throughout the period of the field work for supervising the survey operations. The
field and office level monitoring and supervision of the data collection were also carried out by the consultant
himself. The filled in schedules were brought to the headquarters (Baroda) for office editing and data entry.
The analysis of data and their tabulation was done with the help of partly with CSR Pro and Statistical
Software SPSS.
Design of Report: The report was divided into seven parts. Chapter one give the brief background of the
survey with objective and sample designing; chapter two describes the back ground characteristic of
household; chapter 3 provides characteristic of women fertility; chapter 4 of maternal health care; chapter five
describe child health and immunization; chapter 6 about family planning, while chapter 7 on fertility and
mortality and last chapter summarized the finding with recommendation.
Major Finding:
The salient findings of the survey are presented here.
1) Sample Coverage:
The present survey (DLRHS) could actually cover a total of 1, 14,675 households and 99,207
currently married women (CMW) age 15-49 years, enumerating 390 PSUs (224 rural and 128 urban),
in the state of Gujarat.
The response rates are 94 and 96 percent for households and currently married women respectively.
The present study is based on sampled de jure population of 5, 14,888 persons, of whom 66.5 percent
lived in the rural areas of Gujarat.
2) Age Structure & Sex Ratio:
The mean family size per household in the state is about 4.8 which is slightly higher (4.9) in rural
areas than that noted in urban areas (4.6).
The age-sex distribution of population of Gujarat depicts a scenario of declining fertility with a
shrinking base, but yet a young and growing population with 30 percent below the age of 15 years.
The overall sex ratio of 933 females per 1000 males is recorded for the de jure population in Gujarat.
The sex ratio is more skewed (920) in favour of males, in urban areas compared to that (940) in rural
areas. A similar pattern is noted across the districts, although the overall sex ratio (f/m x 1000) varies
widely, from 995 in The Dangs district to as low as 884 in Surat district.
The overall sex ratio for the 0-6 age group population in the state of Gujarat is very low and is about
893 females 1000 males, which however closely matches with 2011 Census figure of 886 for the
state.
As expected, the child sex ratio is more skewed (879) in favour of males, in urban areas compared to
that (899) in rural areas.
3) Religion & Caste:
Of the total households interviewed in Gujarat, majority of the household heads are Hindu (93
percent), 6 percent are Muslim, and rest belong to other religions in Gujarat.
About 19 percent of the households in Gujarat belong to schedule castes (SCs), 20 percent to
schedule tribes (STs) and 40 percent to other backward castes (OBCs), while the remaining 20
percent of the households are headed by other castes.
4) BPL and RSBY Cards:
About one-third of households in Gujarat, as reported, fall under the BPL category, which however
varies widely across the districts from less than 11 percent in Porbander to as high as 74 percent in
Narmada.
Most of the tribal districts are found to have BPL families in higher proportion. As expected, the
proportion of BPL families is relatively much higher in rural areas than in urban areas.
As regards the status of holding a BPL card in the household, majority of the households in most of
the districts in the state reported that they do have a BPL card, although a very large proportion of
households in certain districts could not produce them for verification.
On an average, 47.1 of the household reported having RSBY card in Gujarat. Of Which about 27.7%
do have a RSBY card, another 19.4% have RSBY card but could not produce it, and the remaining
52.9% reported having no RSBY card in Gujarat.
The households reporting having RSBY card varied from low as one percent in Jamnagar to 52% in
Tapi district.
5) Birth & Deaths:
It is satisfying to note that 95-100 percent of the households in almost all the districts reported to have
registered births and majority of those who registered births, in each district do have a birth certificate.
With respect to death registration, it is 89 percent at the state level. Among those households
reporting death registration, majority of them (93-95 percent) do have death certificate.
6) Demographic Characteristic:
The proportion of non-literate women is still quite high in the state (30 percent) and in most of the
districts, particularly in the districts of Banaskantha, Panchmahals, Dahod, Ahmadabad, Tapi, Patan,
Jamnagar and The Dangs, where it is 35 percent or more.
The mean current age of the CMW ranges between 32-34 years across the districts and it is about 33
years in the state.
The mean age at first marriage among the CMW ranges between 18-21 years in most of the districts,
except a few districts like Banaskantha, Sabarkantha, Gandhinagar and The Dangs, where it is less
than 18 years.
About one-fifth of the women in Gujarat are still getting married before completing the legal age of 18
years, while this proportion is much higher (25 percent) in rural than in urban areas (15 percent).
With regard to childbearing practices, it is noted that mean age at first birth is almost same in the rural
and urban areas of the state and ranges between 20-22 years across the districts.
A significant proportion of births out of total births to CMW are still occurring among women age less
than 20 years in Gujarat. It is about 8 percent in the state and is higher (9 percent) in rural than in
urban areas (7 percent), indicating that teenage fertility is still high in the state.
The proportion of births of order 3 and above is about 33 percent in the state and it ranges from as low
as about 12 percent in Amreli and Navsari to as high as 53 percent in Dahod.
7) Children Ever Born (CEB):
The mean number of children ever born to currently married women age 15-49, by district, varies from
a high of 3.1 children in Dohad, followed by 2.8 in Panchmahals, to 2.0 to 2.1 children in Anand,
Kheda and Valsad districts, while the state average is 2.4 children.
As a more effective measure, the level of completed fertility as measured by mean number of children
ever born to CMW of age 40-49 years is computed by district in Gujarat.
The analysis reveals that 12 out of 26 districts are above the state average of 3.4 children, where
women in these districts are ending up with 3.5-4.4 children in their reproductive life in Gujarat.
In other words, these 12 districts have relatively much higher fertility than other districts in the state
and need focused approach under the family planning programme.
8) Ante-natal Care (ANC):
The registration of pregnancy by the first trimester is still quite far from cent percent in Gujarat, as it is
only 67-73 percent in rural and urban areas of the state.
It is only in case of one-third of the districts in the state that more than 75 percent of the mothers had
registered in the 1st trimester, while it is as low as 32 percent in The Dangs.
With respect to specific antenatal care, it is noted that the proportion of mothers with at least 3 ANC
check-ups is about 69 percent in the state as a whole, which varies from 28 percent in Amreli to 99
percent in Navsari, although it is more than 50 percent in majority of the districts in Gujarat.
The proportion of mother who got least one dose of TT injection during their last pregnancy is as low
as 36 percent in Amreli, although this proportion rises to at least three-fifths (62 percent) in other
districts of the state.
The state as a whole has done poorly with respect to this ANC indicator (64
percent). The situation is relatively better in the urban (74 percent) than in rural areas (60 percent) in
the state.
The proportion of women who received 100 or more IFA tablets during their last pregnancy was lowest
(9 percent) in Narmada and highest (58 percent) in Tapi, although it is less than 40 percent in majority
of the districts. The state average is only 32 percent and it is slightly higher (35 percent) in urban than
in rural areas (31 percent).
The percent of mothers who received full ANC is not more than one-third in 21 out of the 26 districts in
the state, while it is relatively better (38-52 percent) in the remaining districts viz. Bhavnagar,
Jamnagar, Navsari, Surendranagar and Tapi. As a result, the overall proportion of mothers who
received full ANC is only 26 percent in the state and it is slightly higher in urban (28 percent) than in
the rural areas (25percent).
The main services received during ANC visits are height/ weight measurement, BP check-up, blood
test, abdominal check-up, and counseling for diet and delivery in most cases (92-99 percent), while
services like breast examination, sonography and counseling for HIV/ AIDS were not provided in most
cases.
9) Natal Care (Delivery):
With regard to natal care, the data reveal that institutional delivery has improved substantially not only
in the urban areas but also in the rural areas of most districts in the state.
More than three-fourth of the deliveries were reported to be taking place in an institution across the
rural and urban areas of the districts in the state, except the districts like Banaskantha, Panchmahal,
Tapi, Surendranagar and The Dangs, where more than one-fourth of the deliveries are taking place at
home and that too without the assistance of trained health personnel in majority of cases.
The overall state average for institutional delivery is 87 percent which is slightly higher in urban (92
percent) than in rural areas (87 percent).
With regard to mode of transportation used for the purpose of delivery, it is noted that about 37
percent of the mothers used 108 Ambulance, another 10 percent used CHC/PHC vehicle and as high
as 53 percent used private vehicle.
The results of total deliveries in Gujarat points out that, bout 86 percent were normal, 9.5 percent
reported complication and 4.5 percent to be caesarean.
10) MCH Schemes:
The number of beneficiaries under CY is very small in most of other districts, the state average being
only 13 percent.
Most of the districts benefited under JSY, as the proportion of mothers reporting benefits under JSY
varies from a minimum of 10 percent in Kheda to 69 percent in Tapi across the districts in the state.
On an average, only about 23 percent of the mothers reported benefits under the JSY scheme in the
state. Such beneficiaries are relatively higher in rural areas (27 percent) than in urban areas (17
percent).
At the state level, about 48 percent of the beneficiaries received cash before
delivery and the remaining 52 percent were paid after delivery under the JSY scheme.
11) Post Natal Care (PNC):
With regard to post natal care, it is satisfying to note that more than 90 percent of the mothers
received PNC within 48 hours of delivery of their last child in all the districts, except five viz.
Banaskantha, Gandhinagar, Panchmahals, Valsad and Tapi, where only 59-73 percent received PNC
by the same time.
At the state level, about 88 percent of the mothers received PNC within 48 hours of delivery of their
last child.
As part of PNC, more than four-fifths of the newborn babies in most of the districts in the state of
Gujarat received check-up within 24 hours of delivery and as a result the corresponding proportion is
89 percent at the state level. This proportion is slightly higher in urban (94 percent) than in rural areas
(87 percent).
As expected, this proportion increases slightly in most of the districts when newborn babies received
such check-up within 10 days of birth. At the state level, about 91 percent (95 percent in urban and 89
percent in rural) received check-up within 10 days of birth.
As regards the source of such maternal health services, about 65-74 percent of women in the state
(59-67 percent in urban and 67-77 percent in rural) relied on government sector and 22-24 percent
(27-32 percent in urban and 16-20 percent in rural) relied on private sector for seeking ANC, natal and
PNC services, while the rest of them (2-13 percent) sought such services at home, mainly through
doorstep services available under the public health delivery system.
12) Neo Natal Care:
As regards awareness of danger signs and symptoms of new- born baby, majority of the respondents
in all the districts , except a few like Mehesana, Porbandar, Narmada, Bharuch and Tapi, could recall
a number of danger signs and symptoms of newborn.
About 70-78 percent of the CMW in the state reported about their awareness of danger signs and
symptoms of new-born, like baby did not cry, poor sucking of breast, convulsions and breathing
problem, while about 55-64 percent also reported knowledge of other signs and symptoms, such as
blue tongue and lips, abnormal movement and development of yellow staining of palm and soles.
As regards the actual practices with regard to newborn care, more than 90 percent of the CMW (with
youngest child born during three years preceding the survey), in both rural and urban areas in almost
all the districts, were reported to have taken proper care of their baby soon after the birth, by following
norm of routine care given to the newborn, such as, cleaning but no bathing, keeping baby warm by
wrapping and room-in, which are quite encouraging to note.
About 91-98 percent of the respondents in the state reported to have given above mentioned care to
their newborn babies.
Another important component of newborn care is taking of weight of the newborn at the right time. The
proportion of children whose birth weight was taken varies from a low of 67-68 percent in
Surendranagar and Banaskantha to 99 percent in Jamnagar across the districts in the state, indicating
that on an average 87 percent of the children were weighed after their birth in the state.
At the state level, 21 percent of the children (18 percent in urban and 22 percent in rural) were
reported to have birth weight of less than 2500 gms, which is a cause for concern.
13) Breast Feeding Practices:
About 90 percent of children below 3 years (born after January 1, 2008) were fed with colostrum after
birth for few days and there is a small variation by residence in the state. There is also not much
variation across districts with at least 80 percent of children being fed with colostrum in most of the
districts in the state, except Sabarkantha, Banaskantha, Patan, Junagadh and Narmada, where 60-79
percent of the children were fed with colostrum.
The proportion of youngest surviving children who were exclusively breastfed for at least 6 months
was 46 percent (51 percent in urban and 44 percent in rural) in the state. However, there is wide
variation across the districts from a very low of 10-26 percent in districts like Banaskantha,
Sabarkantha and Amreli to 75-83 percent in the district of Kachchh, Junagadh, Porbandar and Surat.
The supplementation of semi-solid / solid food at the right age has not yet improved substantially in
Gujarat. About 60-96 percent of the children were reported to have received food supplementation by
the right age in only half of the districts.
The state also needs to educate women with respect to the proper practice of feeding children with
other fluids before age of six months, as 70-91 percent of the children in only one-third of the districts
in Gujarat were rightly not given water before age six months, while this proportion is less than 50
percent in 11 districts.
The state average works out to be only 52 percent, indicating that the remaining 48 percent were
given water before age of 6 months.
14) Diarrhea& ARI Management:
With respect to treatment seeking and management in case of any episode of diarrhea or ARI, it is
satisfying to note that out of the 9 percent of children who suffered from diarrhea during two weeks
preceding the survey, 96 percent of them received advice/treatments, and 76 percent among them
were treated by ORS.
The treatment seeking is almost same in rural and urban areas, although ORS therapy is slightly more
in rural than in urban areas in the state.
The treatment seeking or use of ORS for diarrhea is particularly low in the districts of Jamnagar,
Amreli, Junagadh, Porbandar and Banaskantha, where one third of the children or less were treated
for diarrhea.
In Gujarat, 6 percent of children in rural and urban areas suffered from ARI during two weeks
preceding the survey.
About 82 percent of the children, who suffered from ARI, were provided treatment. The treatment
seeking for ARI is slightly higher in urban (88 percent) than in rural areas (79 percent).
In fact, 69-100 percent of the children who suffered from ARI, received medical treatment in most of
the districts, except Banaskantha and Patan where only 43-52 percent received medical treatment.
15) Immunization & Vitamin A:
As regards the status of immunization card, majority of the children aged 12-23 months in most of the
districts in Gujarat is provided with an immunization card, as reported by their mothers, although a
large proportion of them could not produce it for verification of record of various immunizations, which
is particularly high in certain districts like Ahmedabad, Patan, Jamnagar, Amreli and Panchmahals
(40-68 percent).
The main defaulter districts, with respect to possession of no immunization card (in case of 15-32
percent of children), are Banaskantha, Patan, Porbandar and Valsad, while the corresponding
proportion in other districts is low and varies from 1-11 percent.
At the state level, about 67 percent do hold an immunization card and another 25 percent do have but
could not produce it for verification of immunization records, while the remaining 8 percent do not have
any such card.
A little over two-thirds of children (69 percent) aged 12-23 months received full immunization
comprising BCG, three doses of DPT, three doses of polio and measles.
About 75 percent of the children in urban areas had received all the recommended vaccinations by the
time of the survey, compared with 67 percent in rural areas.
There is a wide variation in full immunization rate across the districts in Gujarat from a low of 35-38
percent in Panchmahals and The Dangs to 94 percent in Mehsana.
Coverage of each vaccination is much higher than the percentage fully vaccinated, although coverage
of each vaccination is not yet cent percent in most of the districts in the state. It is particularly true in
case of measles vaccine where coverage is less than 75 percent in case of about one-third of the
districts. In fact, the relatively lower percentages of fully vaccinated in certain districts can largely be
attributed to lower coverage of measles in those districts.
The coverage with respect to Vitamin A supplementation is also much less in most of the districts in
the state. For example, proportion of children age 9-35 months who received at least one dose of
vitamin A is only about 65 percent in the state, although it varies from a low of 42 percent in
Banaskantha to 88 percent in Vadodara.
The proportion of children who received 3 or more doses of vitamin A reduces to 34 percent at the
state level. The coverage with respect to each vaccination and vitamin A supplementation is slightly
higher in urban than in rural areas of the state.
16) Family Planning:
The data on current contraceptive use among the currently married women reveal that 62 percent are
using any family planning method in the state of Gujarat.
The use of any modern method is slightly lower (61 percent) than any method, indicating that use of
any traditional method is very small in the state.
Oral pills and IUD are being used by only 3.3 and 3.0 percent of CMW respectively.
Female sterilization is predominant among the contraceptive methods, it being used by 49 percent of
CMW aged 15-49 years, while acceptance of male sterilization is very small (1 percent) in the state.
The use of popular male oriented spacing or temporary methods like condom is reported by only 4
percent of the CMW.
The rural-urban differentials in the use of any method are not very large, although use of any method
is slightly higher in urban (67 percent) than in rural areas (60 percent) in Gujarat.
The current use of contraception is highest in Tapi (76 percent), followed by Porbandar and Vadodara
(74 percent each) and Amreli, Navsari and Jamnagar (71- 72 percent), while it is lowest in the district
of Dahod (46 percent).
The current use of female sterilization ranges from 30 percent in The Dangs district to 61 percent in
Navsari. The use of male sterilization is less than 3 percent in most of the districts, except The Dangs
and Tapi where its current use is 11-13 percent.
The variation in contraceptive prevalence at district level is basically due to the variation in the use of
permanent methods.
17) Vital Statistic:
The ultimate impact of the MCH and Family Planning Programme at the district and state level can
best be judged from its current level of fertility and mortality, particularly infant, child and maternal
mortality.
17a) Crude Birth Rate:
Based on estimates for the three year period before DLRHS (2008-10), the crude birth rate (CBR) was
about 22.5 births per 1000 population in the state of Gujarat (for mid-year 2009).
Incidentally, this estimate is quite close to SRS estimate of 22.3 for Gujarat during 2009. The level of
CBR varies from a very high of 32.7 births per 1000 population in The Dangs district, followed by 30.6
in Dahod, to as low as 15.5 in Navsari district.
Most of the tribal districts and Kachchh have a CBR of about 25 or more, while the remaining two-
thirds of the districts are either close to the state average or below the state average in terms of their
level of fertility.
17b) Crude Death Rate:
Based on estimates for the three year period before DLRHS, the crude death rate (CDR) was 6.6
deaths per 1000 population in the state of Gujarat (during 2009). This estimate is slightly lower than
SRS estimate of 6.9 for the corresponding period.
The level of CDR varies from a high of 9.4 deaths per 1000 population in Dahod, followed by a level of
8.7-8.8 in Banaskantha and The Dangs, to a level of 5.0 in Navsari district. Here again, most of the
tribal districts and two other districts viz. Kachchh and Surendranagar, have relatively higher level of
mortality than most of the other districts in the state.
17c) Infant Mortality Rate:
According to the present DLRHS estimate, infant mortality in Gujarat was about 48 deaths per 1000
live births for the year 2008, it being mid-year of the period 2006-10.
This DLRHS based estimate is slightly lower than the SRS estimate of 50 deaths per 1000 live births
for the year 2008. It is however important to note that there is a large variation in IMR across the
districts in the state of Gujarat, as it varies from a low of 32 deaths per 1000 live births in Anand to as
high as 63 in Dahod.
In fact, it is once again disturbing to note that most of the tribal districts and Kachchh are also found to
have relatively higher level of infant mortality (51 or more), compared to other districts in the state.
17d) Under Five Mortality:
The under-five mortality in Gujarat was 61 deaths per 1000 live births for the year 2008 (period 2006-
10).
This DLRHS based estimate is quite close to SRS estimate of 60 deaths per 1000 live births for the
corresponding period.
Like the pattern observed in the case of IMR, there is a large variation in under five mortality across
the districts in the state of Gujarat as it varies from a low level of 39 deaths per 1000 live births in
Anand to as high as 85 deaths per 1000 live births in Dahod.
As noted earlier in case of IMR, the level of child mortality is also higher than the state average of 61
deaths per 1,000 live births in case of most of the tribal districts except Tapi; as well as in case of
Kachchh and Surendranagar.
It is also important to note the leading districts in the state. In this regard, it may be noted that the five
districts viz., Anand, Navsari, surat, Rajkot and Ahmedabad, which are noted to have least level of
IMR, have also done well in reducing child mortality to the level of 50 or less number of deaths per
1,000 live births.
Most of the other districts which have relatively lower level of child mortality than the State average
are yet to reach at least to the level reached by the leading districts, while the most laggard districts
are those which are tribal dominated and those which mainly fall under Kachchh and Saurashtra
region.
17e) Maternal Mortality Rate:
An attempt has also been made under the present DLRHS, to provide an estimate of MMR at the
state level for the three-year period preceding the survey, although the samples selected for each of
the districts in the state are not large enough to provide an estimate at the district level.
The average maternal mortality ratio at the state level for the three-year period preceding the survey is
142 deaths per 100,000 live births. The approximate 95 percent confidence interval (CI), for the
present estimate of MMR ranges from 101 to 183 per 100,000 live births. The present estimate
corresponds to the period 2008-10.
The corresponding SRS estimate for the period 2007-09 was 148 (95%CI: 100-196) deaths per
100,000 live births for the state of Gujarat. Thus, as expected, our present estimate (2008-10) is
slightly lower than the SRS estimate (2007-09) due to the slight difference in the reference period.
It is important to note that there is considerable overlap in the confidence intervals of the estimates
from the two surveys (SRS and the present DLRHS), indicating that the difference between the above
two estimates of MMR is not significant statistically.
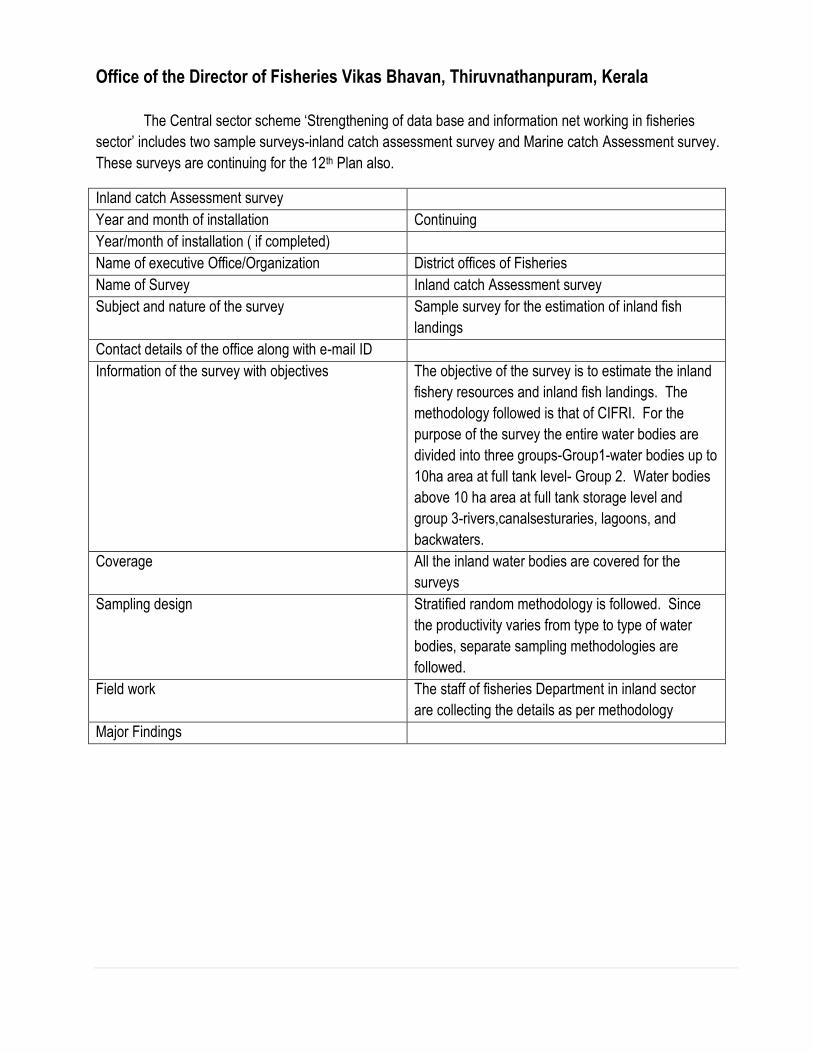
Office of the Director of Fisheries Vikas Bhavan, Thiruvnathanpuram, Kerala
The Central sector scheme ‘Strengthening of data base and information net working in fisheries
sector’ includes two sample surveys-inland catch assessment survey and Marine catch Assessment survey.
These surveys are continuing for the 12th Plan also.
Inland catch Assessment survey
Year and month of installation Continuing
Year/month of installation ( if completed)
Name of executive Office/Organization District offices of Fisheries
Name of Survey Inland catch Assessment survey
Subject and nature of the survey Sample survey for the estimation of inland fish
landings
Contact details of the office along with e-mail ID
Information of the survey with objectives The objective of the survey is to estimate the inland
fishery resources and inland fish landings. The
methodology followed is that of CIFRI. For the
purpose of the survey the entire water bodies are
divided into three groups-Group1-water bodies up to
10ha area at full tank level- Group 2. Water bodies
above 10 ha area at full tank storage level and
group 3-rivers,canalsesturaries, lagoons, and
backwaters.
Coverage All the inland water bodies are covered for the
surveys
Sampling design Stratified random methodology is followed. Since
the productivity varies from type to type of water
bodies, separate sampling methodologies are
followed.
Field work The staff of fisheries Department in inland sector
are collecting the details as per methodology
Major Findings
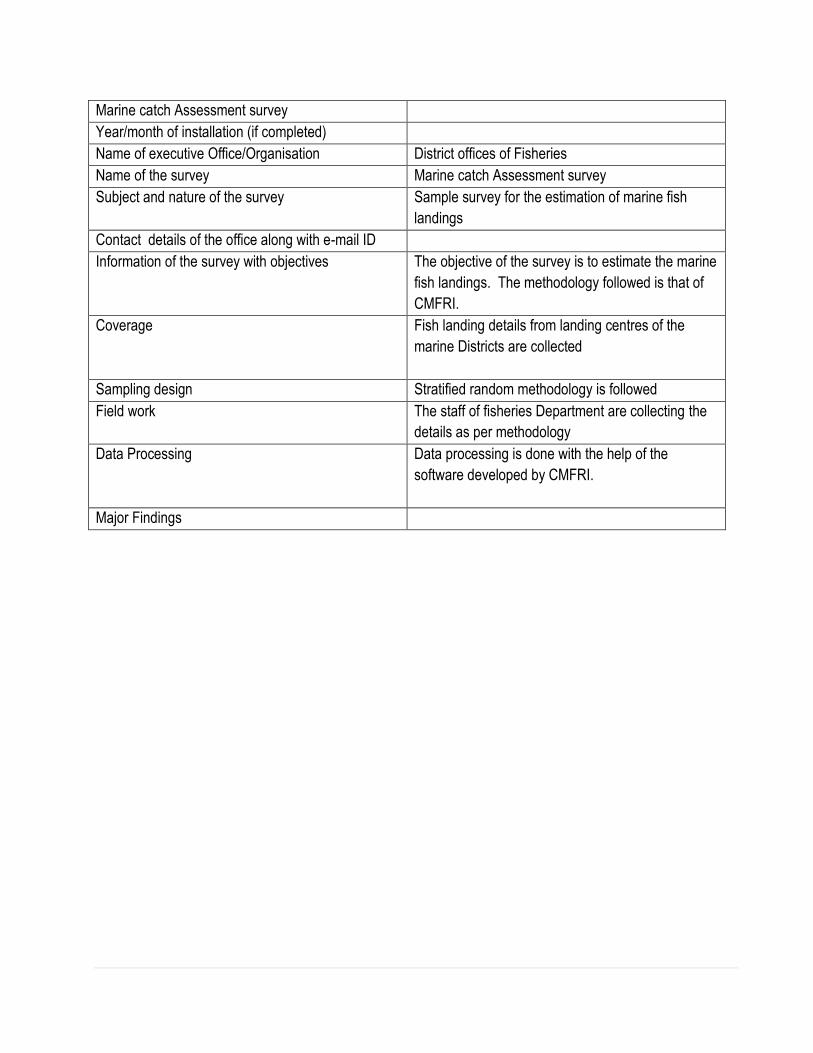
Marine catch Assessment survey
Year/month of installation (if completed)
Name of executive Office/Organisation District offices of Fisheries
Name of the survey Marine catch Assessment survey
Subject and nature of the survey Sample survey for the estimation of marine fish
landings
Contact details of the office along with e-mail ID
Information of the survey with objectives The objective of the survey is to estimate the marine
fish landings. The methodology followed is that of
CMFRI.
Coverage Fish landing details from landing centres of the
marine Districts are collected
Sampling design Stratified random methodology is followed
Field work The staff of fisheries Department are collecting the
details as per methodology
Data Processing Data processing is done with the help of the
software developed by CMFRI.
Major Findings

Office of the Labour Commissioner, Thiruvananthapuram , Kerala
Information Related to the Working Class Family Budget Survey 2011-12
1. Year/Month of initiation
The Working Class Family Budget Survey was started Statewide on 1st February 2011.
2. Year/Mont of Completion
The first phase, i.e., field work of the survey has been completed on 31st January 2012. The second
phases of the (data entry) has been completed on October 2012. The work relating to the report
generation of the survey is in progress.
3. Name of the Executing office/organization
Department of Economics & Statistics, Govt. of Kerala
4. Name of the Survey:
Working class Family Budget Survey 2011-12.
5. Subject and Nature of the Survey
Consumer expenditure-consumption pattern among the industrial workers and agicultural labourers
will be collected during the survey. Based on these data, the weighting diagram required for the
revision of consumer price index numbers will be prepared. Usually, the survey is conducted once in
10 years.
6. Contact details of the office along with e-mail id
The Director
Directorate of Economics & Statistics
Vikasbhavan P.O
Ph. No 0471-2308318
Fax no. 0471-2305317
E mail id: [email protected]/[email protected]
Detailed Information on the Working Class Family Budget Survey2011-12
1. Introduction of the Survey with Objectives: The present base year being followed for the
computation of Consumer Price Index is 1998-99. Over the last twelve years, considerable changes
have been effected as regards to consumption pattern, purchasing capacity etc. of the industrial
workers and agricultural labourers. Hence, updation of the base year- for which conduct of a fresh
family Budget Survey is inevitable – is suggested. The Department of Economic & Statistics, Govt. of
Kerala is entrusted with the computation of the Working Class consumer price Index.
2. Coverage of the Survey
The working class family budget survey 2011-12 has covered the following 15 sectors:
1. Agricultural sector – Agricultural services, Farming of animals, Fishing hunting etc.
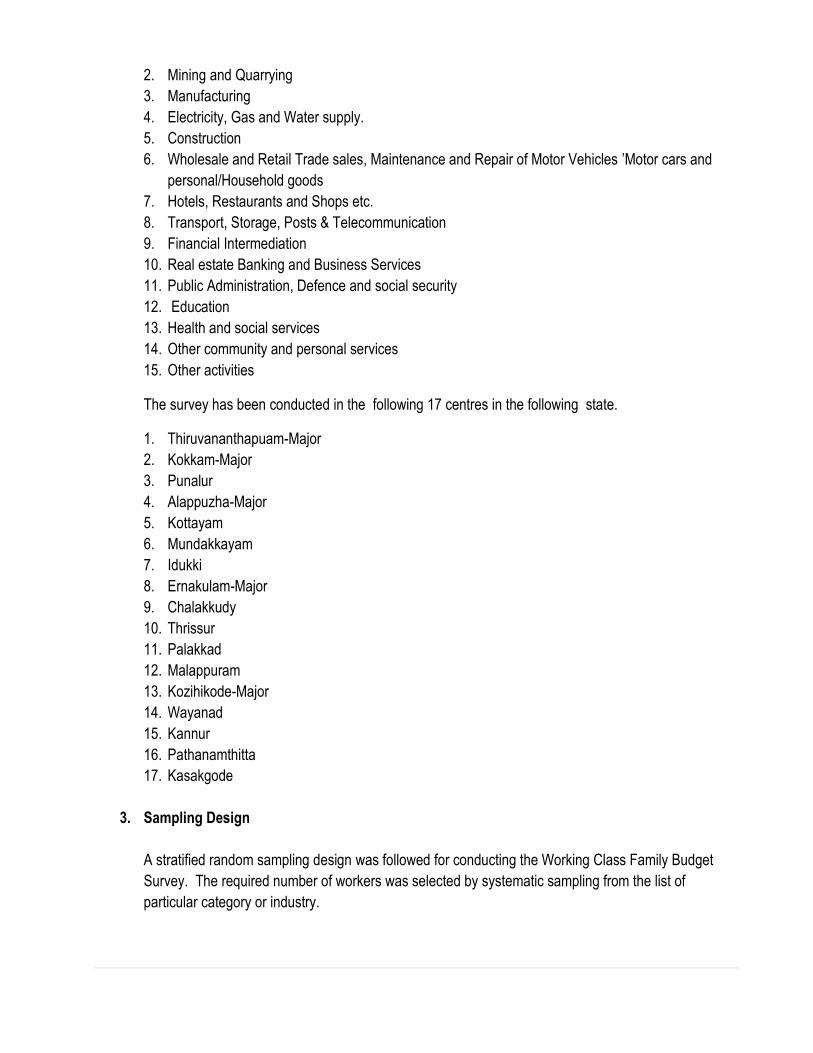
2. Mining and Quarrying
3. Manufacturing
4. Electricity, Gas and Water supply.
5. Construction
6. Wholesale and Retail Trade sales, Maintenance and Repair of Motor Vehicles ’Motor cars and
personal/Household goods
7. Hotels, Restaurants and Shops etc.
8. Transport, Storage, Posts & Telecommunication
9. Financial Intermediation
10. Real estate Banking and Business Services
11. Public Administration, Defence and social security
12. Education
13. Health and social services
14. Other community and personal services
15. Other activities
The survey has been conducted in the following 17 centres in the following state.
1. Thiruvananthapuam-Major
2. Kokkam-Major
3. Punalur
4. Alappuzha-Major
5. Kottayam
6. Mundakkayam
7. Idukki
8. Ernakulam-Major
9. Chalakkudy
10. Thrissur
11. Palakkad
12. Malappuram
13. Kozihikode-Major
14. Wayanad
15. Kannur
16. Pathanamthitta
17. Kasakgode
3. Sampling Design
A stratified random sampling design was followed for conducting the Working Class Family Budget
Survey. The required number of workers was selected by systematic sampling from the list of
particular category or industry.
The method of pay roll sampling was adopted for the selection of workers and their families. The
sample size for industrial workers was fixed as 600 each for the major centres and 300 each for the
minor centres. In addition to these 120 samples each from the major centres were also collected, in
order to ensure the representation of agricultural labourers. A stratified sampling design was adopted
for the survey. The total workers were classified in to the three income groups
Low Income Group Up to Rs.4000/- p.m.
Medium Income Group Rs.4000/- to Rs.7000/-
High Income Group Rs. 7000/- & above p.m.
The required number of sample workers were selected from that group by circular Systematic
Random sampling methods. These sample workers were contacted in their house and the detail
were collected by the investigators by personal interview.
4. Having completed the preliminary works such as listing of industries, copying of pay roll etc. the field
enumeration of the survey was started on 1stfeb 2011 and ended on January 2012.
5. Data processing: Data entry work of the filled up schedule has been completed byOct.2012. The
processing of the data is in progress.
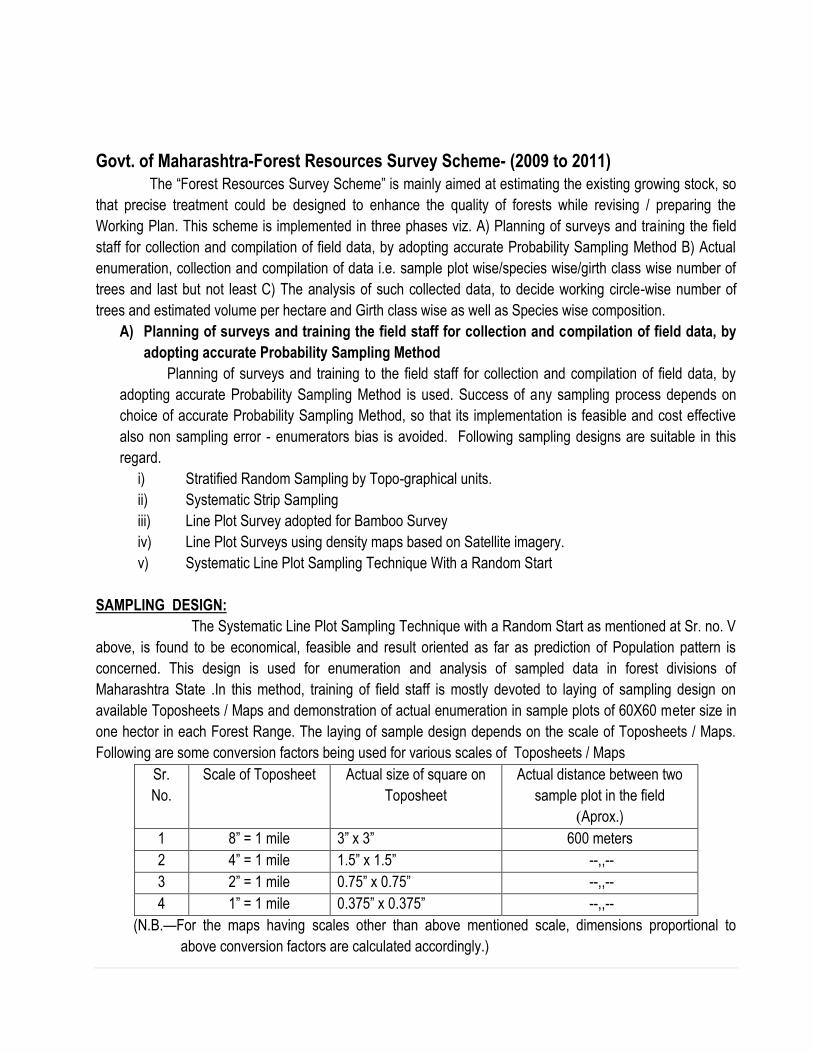
Govt. of Maharashtra-Forest Resources Survey Scheme- (2009 to 2011)
The “Forest Resources Survey Scheme” is mainly aimed at estimating the existing growing stock, so
that precise treatment could be designed to enhance the quality of forests while revising / preparing the
Working Plan. This scheme is implemented in three phases viz. A) Planning of surveys and training the field
staff for collection and compilation of field data, by adopting accurate Probability Sampling Method B) Actual
enumeration, collection and compilation of data i.e. sample plot wise/species wise/girth class wise number of
trees and last but not least C) The analysis of such collected data, to decide working circle-wise number of
trees and estimated volume per hectare and Girth class wise as well as Species wise composition.
A) Planning of surveys and training the field staff for collection and compilation of field data, by
adopting accurate Probability Sampling Method
Planning of surveys and training to the field staff for collection and compilation of field data, by
adopting accurate Probability Sampling Method is used. Success of any sampling process depends on
choice of accurate Probability Sampling Method, so that its implementation is feasible and cost effective
also non sampling error - enumerators bias is avoided. Following sampling designs are suitable in this
regard.
i) Stratified Random Sampling by Topo-graphical units.
ii) Systematic Strip Sampling
iii) Line Plot Survey adopted for Bamboo Survey
iv) Line Plot Surveys using density maps based on Satellite imagery.
v) Systematic Line Plot Sampling Technique With a Random Start
SAMPLING DESIGN:
The Systematic Line Plot Sampling Technique with a Random Start as mentioned at Sr. no. V
above, is found to be economical, feasible and result oriented as far as prediction of Population pattern is
concerned. This design is used for enumeration and analysis of sampled data in forest divisions of
Maharashtra State .In this method, training of field staff is mostly devoted to laying of sampling design on
available Toposheets / Maps and demonstration of actual enumeration in sample plots of 60X60 meter size in
one hector in each Forest Range. The laying of sample design depends on the scale of Toposheets / Maps.
Following are some conversion factors being used for various scales of Toposheets / Maps
Sr.
No.
Scale of Toposheet Actual size of square on
Toposheet
Actual distance between two
sample plot in the field
(Aprox.)
1 8” = 1 mile 3” x 3” 600 meters
2 4” = 1 mile 1.5” x 1.5” --,,--
3 2” = 1 mile 0.75” x 0.75” --,,--
4 1” = 1 mile 0.375” x 0.375” --,,--
(N.B.—For the maps having scales other than above mentioned scale, dimensions proportional to
above conversion factors are calculated accordingly.)
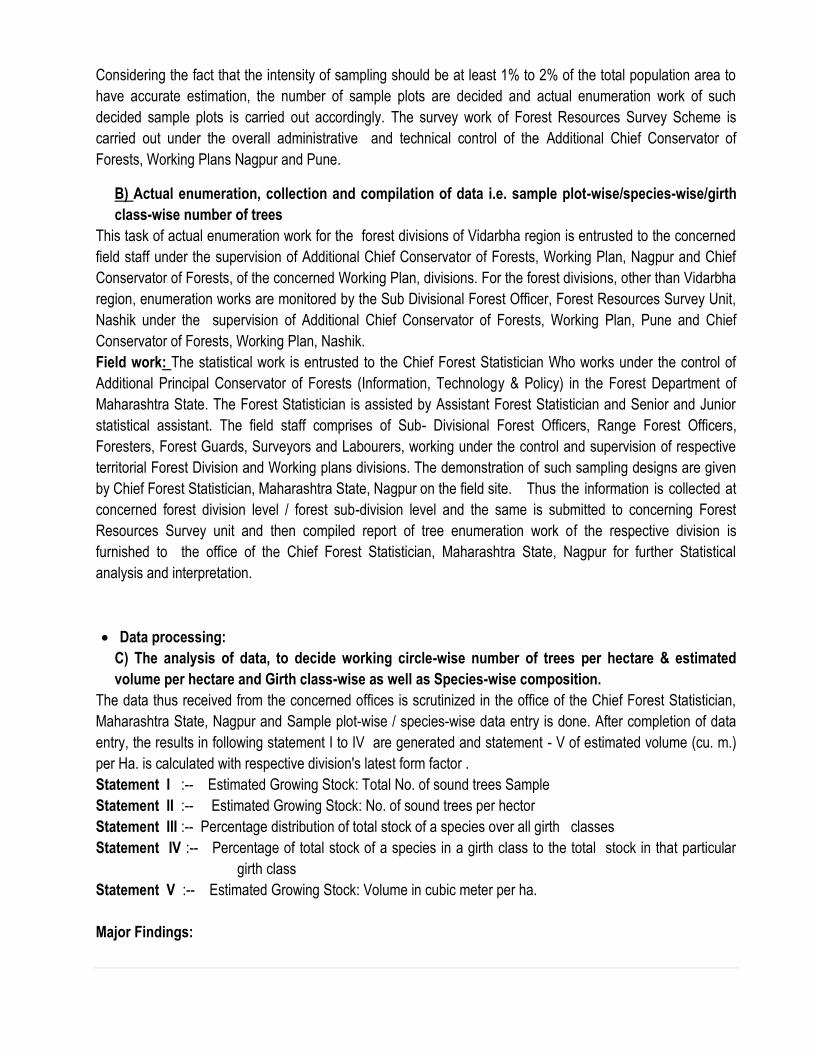
Considering the fact that the intensity of sampling should be at least 1% to 2% of the total population area to
have accurate estimation, the number of sample plots are decided and actual enumeration work of such
decided sample plots is carried out accordingly. The survey work of Forest Resources Survey Scheme is
carried out under the overall administrative and technical control of the Additional Chief Conservator of
Forests, Working Plans Nagpur and Pune.
B) Actual enumeration, collection and compilation of data i.e. sample plot-wise/species-wise/girth
class-wise number of trees
This task of actual enumeration work for the forest divisions of Vidarbha region is entrusted to the concerned
field staff under the supervision of Additional Chief Conservator of Forests, Working Plan, Nagpur and Chief
Conservator of Forests, of the concerned Working Plan, divisions. For the forest divisions, other than Vidarbha
region, enumeration works are monitored by the Sub Divisional Forest Officer, Forest Resources Survey Unit,
Nashik under the supervision of Additional Chief Conservator of Forests, Working Plan, Pune and Chief
Conservator of Forests, Working Plan, Nashik.
Field work: The statistical work is entrusted to the Chief Forest Statistician Who works under the control of
Additional Principal Conservator of Forests (Information, Technology & Policy) in the Forest Department of
Maharashtra State. The Forest Statistician is assisted by Assistant Forest Statistician and Senior and Junior
statistical assistant. The field staff comprises of Sub- Divisional Forest Officers, Range Forest Officers,
Foresters, Forest Guards, Surveyors and Labourers, working under the control and supervision of respective
territorial Forest Division and Working plans divisions. The demonstration of such sampling designs are given
by Chief Forest Statistician, Maharashtra State, Nagpur on the field site. Thus the information is collected at
concerned forest division level / forest sub-division level and the same is submitted to concerning Forest
Resources Survey unit and then compiled report of tree enumeration work of the respective division is
furnished to the office of the Chief Forest Statistician, Maharashtra State, Nagpur for further Statistical
analysis and interpretation.
Data processing:
C) The analysis of data, to decide working circle-wise number of trees per hectare & estimated
volume per hectare and Girth class-wise as well as Species-wise composition.
The data thus received from the concerned offices is scrutinized in the office of the Chief Forest Statistician,
Maharashtra State, Nagpur and Sample plot-wise / species-wise data entry is done. After completion of data
entry, the results in following statement I to IV are generated and statement - V of estimated volume (cu. m.)
per Ha. is calculated with respective division's latest form factor .
Statement I :-- Estimated Growing Stock: Total No. of sound trees Sample
Statement II :-- Estimated Growing Stock: No. of sound trees per hector
Statement III :-- Percentage distribution of total stock of a species over all girth classes
Statement IV :-- Percentage of total stock of a species in a girth class to the total stock in that particular
girth class
Statement V :-- Estimated Growing Stock: Volume in cubic meter per ha.
Major Findings:

All these statements are tabulated species wise and girth-class wise, to have idea of composition of
forest cover in entire population area. As the results are based on sampling design, they are subjected to
certain errors. The Standard error for each working circle is calculated and intimated to the concerned
divisions. Apart from this, considering the latest Volume Conversion Factors prepared for the division in
question or similar areas, estimated volume per hector is calculated and intimated. This information is added in
new working plan & sanction is taken by Government of India for further Management, Silvi-cultural
implementing activities. Finally, the analytical report of tree enumeration works by using sampling techniques
is prepared by the Statistical cell at state level. Such analytical report is then sent to the concerned forest
territorial division and working plan division for their information and further use in the preparation/ revision of
new working plan.
Information regarding Sample Survey of tree enumeration work for various forest divisions conducted
in Maharashtra during the year 2009-10,2010-11,2011-12:
1.CENTRAL CHANDA DIVISION
1. Year/month of initiation : April 2010
2. Year/month of completion( if completed) : January 2011
3. Name of the Executing office/organization : Additional Principal Chief Conservator of
Forests (Working Plan) East Nagpur.
4. Name of the survey : Tree Enumeration
5. Subject & Nature of the survey : Tree Enumeration by " Systematic Line
Plot Sampling Technique With a Random Start."
6. Contact details of the office along with e-mail id : Additional Principal Chief Conservator of Forests
(Information , Technology & Policy) Nagpur. Ph. No. Off: 0712-25556 [email protected]
2.NANDED DIVISION
1. Year/month of initiation : 2010
2. Year/month of completion( if completed) : 2011
3. Name of the Executing office/organization: Additional Principal Chief of Conservator Forests (Working
Plan) West Pune
4. Name of the survey : Tree Enumeration
5. Subject & Nature of the survey: Tree Enumeration by "Systematic Line Plot
Sampling Technique With a Random Start"
6. Contact details of the office along with e-mail id : Additional Principal Chief Conservator of Forests
(Information, Technology & Policy) , Nagpur. Ph. No. Off: 0712-255567, [email protected]
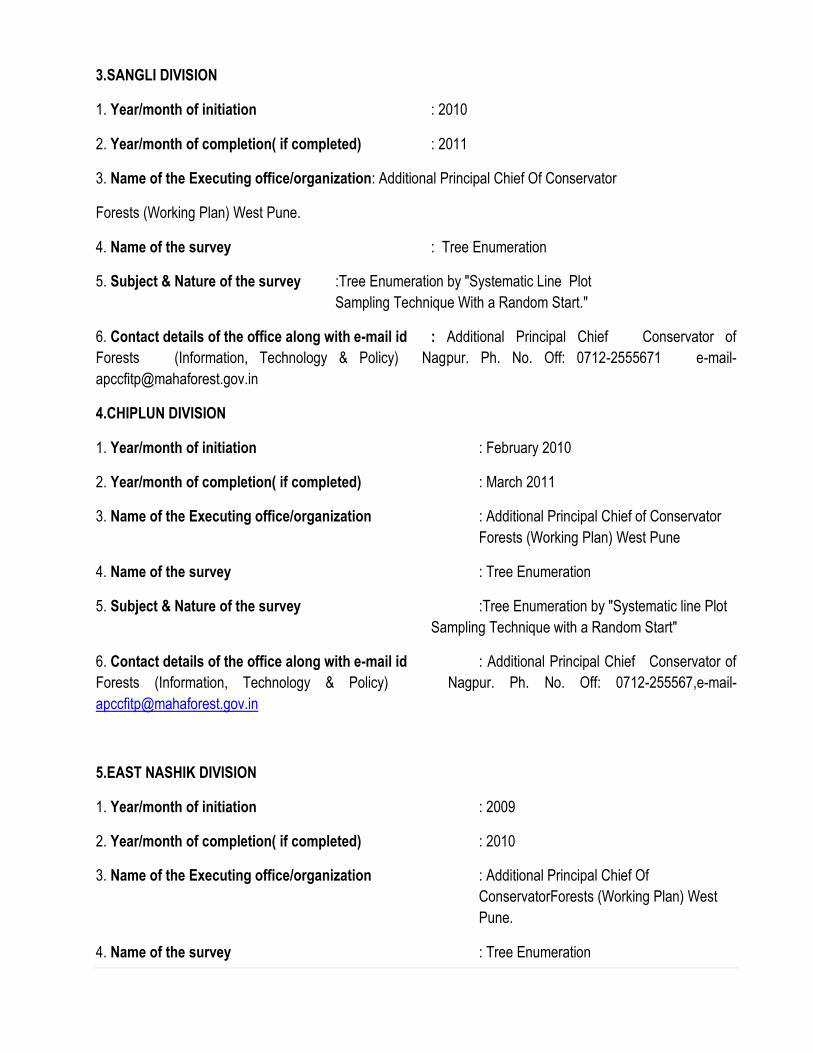
3.SANGLI DIVISION
1. Year/month of initiation : 2010
2. Year/month of completion( if completed) : 2011
3. Name of the Executing office/organization: Additional Principal Chief Of Conservator
Forests (Working Plan) West Pune.
4. Name of the survey : Tree Enumeration
5. Subject & Nature of the survey :Tree Enumeration by "Systematic Line Plot
Sampling Technique With a Random Start."
6. Contact details of the office along with e-mail id : Additional Principal Chief Conservator of
Forests (Information, Technology & Policy) Nagpur. Ph. No. Off: 0712-2555671 e-mail-
4.CHIPLUN DIVISION
1. Year/month of initiation : February 2010
2. Year/month of completion( if completed) : March 2011
3. Name of the Executing office/organization : Additional Principal Chief of Conservator
Forests (Working Plan) West Pune
4. Name of the survey : Tree Enumeration
5. Subject & Nature of the survey :Tree Enumeration by "Systematic line Plot
Sampling Technique with a Random Start"
6. Contact details of the office along with e-mail id : Additional Principal Chief Conservator of
Forests (Information, Technology & Policy) Nagpur. Ph. No. Off: 0712-255567,e-mail-
5.EAST NASHIK DIVISION
1. Year/month of initiation : 2009
2. Year/month of completion( if completed) : 2010
3. Name of the Executing office/organization : Additional Principal Chief Of
ConservatorForests (Working Plan) West
Pune.
4. Name of the survey : Tree Enumeration

5. Subject & Nature of the survey : Tree Enumeration by "Systematic Line Plot
Sampling Technique with a Random Start."
6. Contact details of the office along with e-mail id : Additional Principal Chief Conservator of Forests
(Information, Technology & Policy) Nagpur. Ph.No. Off: 0712-2555671,[email protected]
Directorate of Veterinary & Animal Husbandry- Govt. of Nagaland
Information on sample surveys
1. Year/Month of initiation : Monsoon Season - March
Rainy - July
Winter - November
2. Year/Month of completion : Monsoon Season - June
Rainy - October
Winter - February
3. Name of the Executing Office/Organization: Directorate of Veterinary & A.H.(Statistical Branch) Nagaland,
Kohima.
4. Name of Survey : Integrated Sample Survey
5. Subject & Nature of Survey : Survey for estimate of Livestock Products viz.
Milk, Egg & Meat in the State.
6. Contact detail of the Office along with e-mail : Directorate of Veterinary & A.H.Nagaland, Kohima. Pin
No. 797001 e-mail: [email protected]
Introduction of the Survey with objectives: The main object of the survey is to estimate the District and
State Level production of major livestock viz, milk, egg & meat annually and to provide reliable data for the
development of A.H. & Dairying Sector.
Coverage: Survey covers all the 11 (eleven) Districts of Nagaland.
Sampling Design: The sample design adopted was three stages stratified random sampling as prescribed by
the Ministry of Agriculture, Deptt. of A.H. & Dairying.
Field Work: Covering all Districts with 15 % sample size of the total villages which are equally distributed
among the three seasons for complete enumeration.
Data processing: After collection of data from selected villages the reports are being compiled at the state
level in the Directorate of Veterinary & A.H. and send the final report to the Govt. of India.
Major findings: State Level production of Milk, Egg & Meat
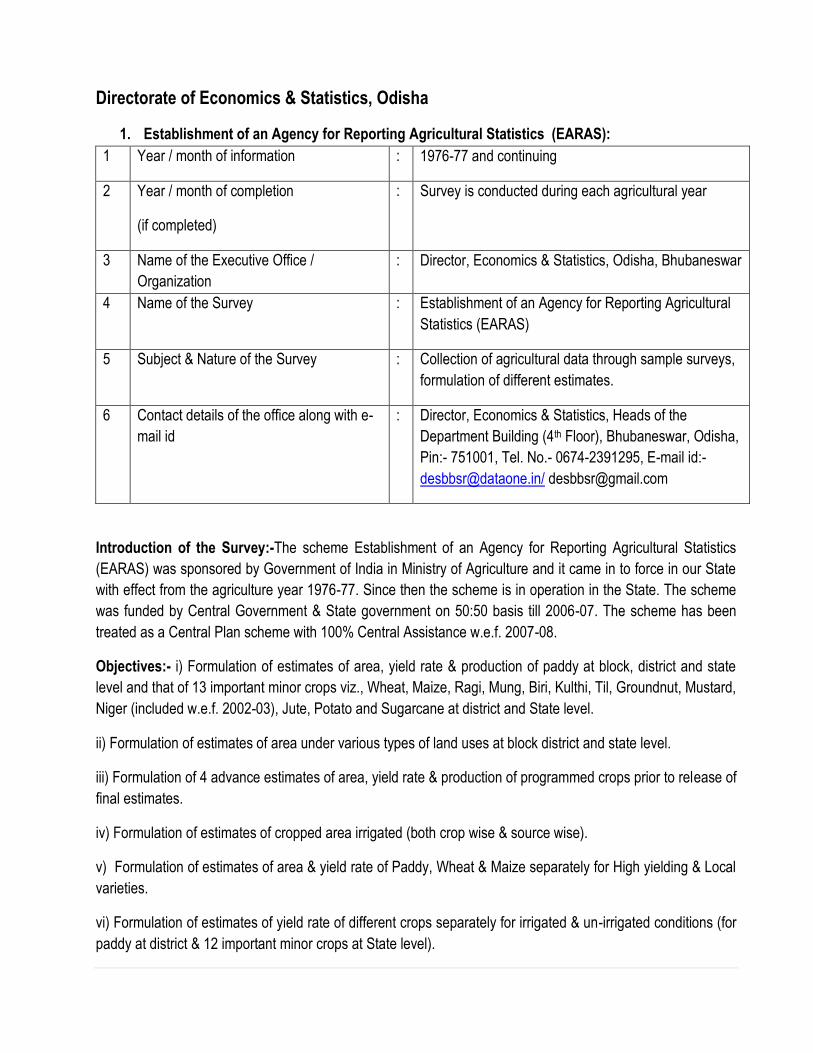
Directorate of Economics & Statistics, Odisha
1. Establishment of an Agency for Reporting Agricultural Statistics (EARAS):
1 Year / month of information : 1976-77 and continuing
2 Year / month of completion
(if completed)
: Survey is conducted during each agricultural year
3 Name of the Executive Office /
Organization
: Director, Economics & Statistics, Odisha, Bhubaneswar
4 Name of the Survey : Establishment of an Agency for Reporting Agricultural
Statistics (EARAS)
5 Subject & Nature of the Survey : Collection of agricultural data through sample surveys,
formulation of different estimates.
6 Contact details of the office along with e-
mail id
: Director, Economics & Statistics, Heads of the
Department Building (4th Floor), Bhubaneswar, Odisha,
Pin:- 751001, Tel. No.- 0674-2391295, E-mail id:-
[email protected]/ [email protected]
Introduction of the Survey:-The scheme Establishment of an Agency for Reporting Agricultural Statistics
(EARAS) was sponsored by Government of India in Ministry of Agriculture and it came in to force in our State
with effect from the agriculture year 1976-77. Since then the scheme is in operation in the State. The scheme
was funded by Central Government & State government on 50:50 basis till 2006-07. The scheme has been
treated as a Central Plan scheme with 100% Central Assistance w.e.f. 2007-08.
Objectives:- i) Formulation of estimates of area, yield rate & production of paddy at block, district and state
level and that of 13 important minor crops viz., Wheat, Maize, Ragi, Mung, Biri, Kulthi, Til, Groundnut, Mustard,
Niger (included w.e.f. 2002-03), Jute, Potato and Sugarcane at district and State level.
ii) Formulation of estimates of area under various types of land uses at block district and state level.
iii) Formulation of 4 advance estimates of area, yield rate & production of programmed crops prior to release of
final estimates.
iv) Formulation of estimates of cropped area irrigated (both crop wise & source wise).
v) Formulation of estimates of area & yield rate of Paddy, Wheat & Maize separately for High yielding & Local
varieties.
vi) Formulation of estimates of yield rate of different crops separately for irrigated & un-irrigated conditions (for
paddy at district & 12 important minor crops at State level).
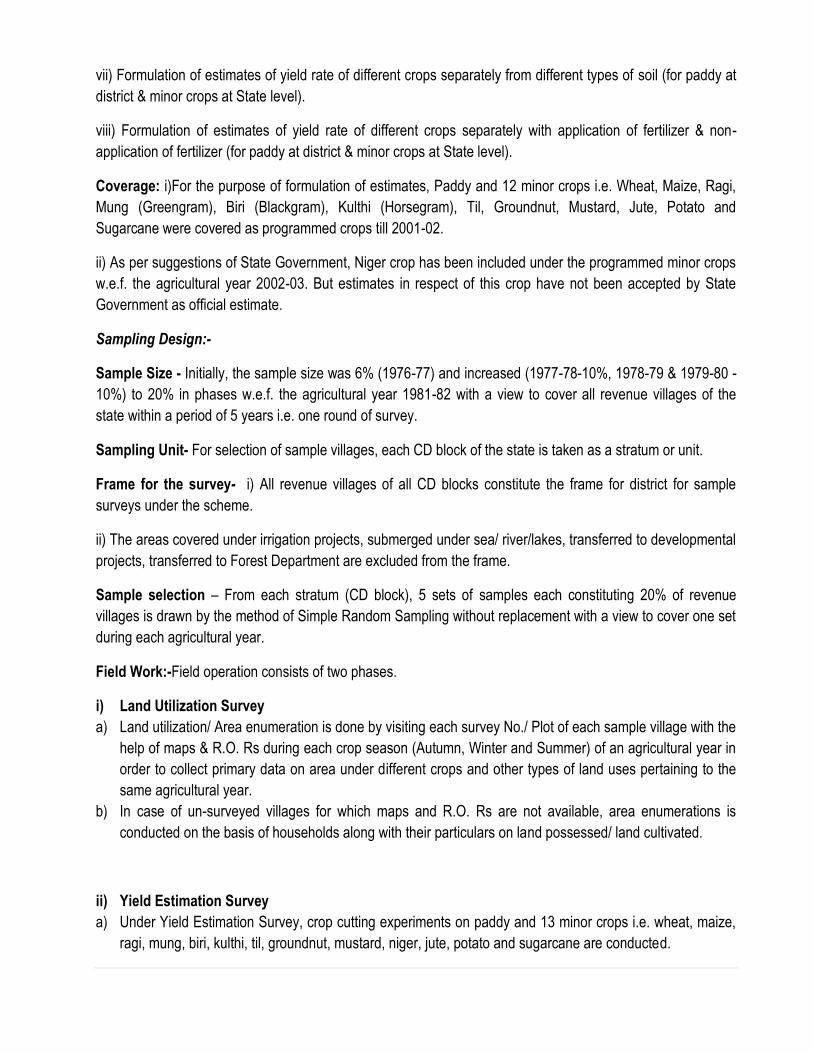
vii) Formulation of estimates of yield rate of different crops separately from different types of soil (for paddy at
district & minor crops at State level).
viii) Formulation of estimates of yield rate of different crops separately with application of fertilizer & non-
application of fertilizer (for paddy at district & minor crops at State level).
Coverage: i)For the purpose of formulation of estimates, Paddy and 12 minor crops i.e. Wheat, Maize, Ragi,
Mung (Greengram), Biri (Blackgram), Kulthi (Horsegram), Til, Groundnut, Mustard, Jute, Potato and
Sugarcane were covered as programmed crops till 2001-02.
ii) As per suggestions of State Government, Niger crop has been included under the programmed minor crops
w.e.f. the agricultural year 2002-03. But estimates in respect of this crop have not been accepted by State
Government as official estimate.
Sampling Design:-
Sample Size - Initially, the sample size was 6% (1976-77) and increased (1977-78-10%, 1978-79 & 1979-80 -
10%) to 20% in phases w.e.f. the agricultural year 1981-82 with a view to cover all revenue villages of the
state within a period of 5 years i.e. one round of survey.
Sampling Unit- For selection of sample villages, each CD block of the state is taken as a stratum or unit.
Frame for the survey- i) All revenue villages of all CD blocks constitute the frame for district for sample
surveys under the scheme.
ii) The areas covered under irrigation projects, submerged under sea/ river/lakes, transferred to developmental
projects, transferred to Forest Department are excluded from the frame.
Sample selection – From each stratum (CD block), 5 sets of samples each constituting 20% of revenue
villages is drawn by the method of Simple Random Sampling without replacement with a view to cover one set
during each agricultural year.
Field Work:-Field operation consists of two phases.
i) Land Utilization Survey
a) Land utilization/ Area enumeration is done by visiting each survey No./ Plot of each sample village with the
help of maps & R.O. Rs during each crop season (Autumn, Winter and Summer) of an agricultural year in
order to collect primary data on area under different crops and other types of land uses pertaining to the
same agricultural year.
b) In case of un-surveyed villages for which maps and R.O. Rs are not available, area enumerations is
conducted on the basis of households along with their particulars on land possessed/ land cultivated.
ii) Yield Estimation Survey
a) Under Yield Estimation Survey, crop cutting experiments on paddy and 13 minor crops i.e. wheat, maize,
ragi, mung, biri, kulthi, til, groundnut, mustard, niger, jute, potato and sugarcane are conducted.
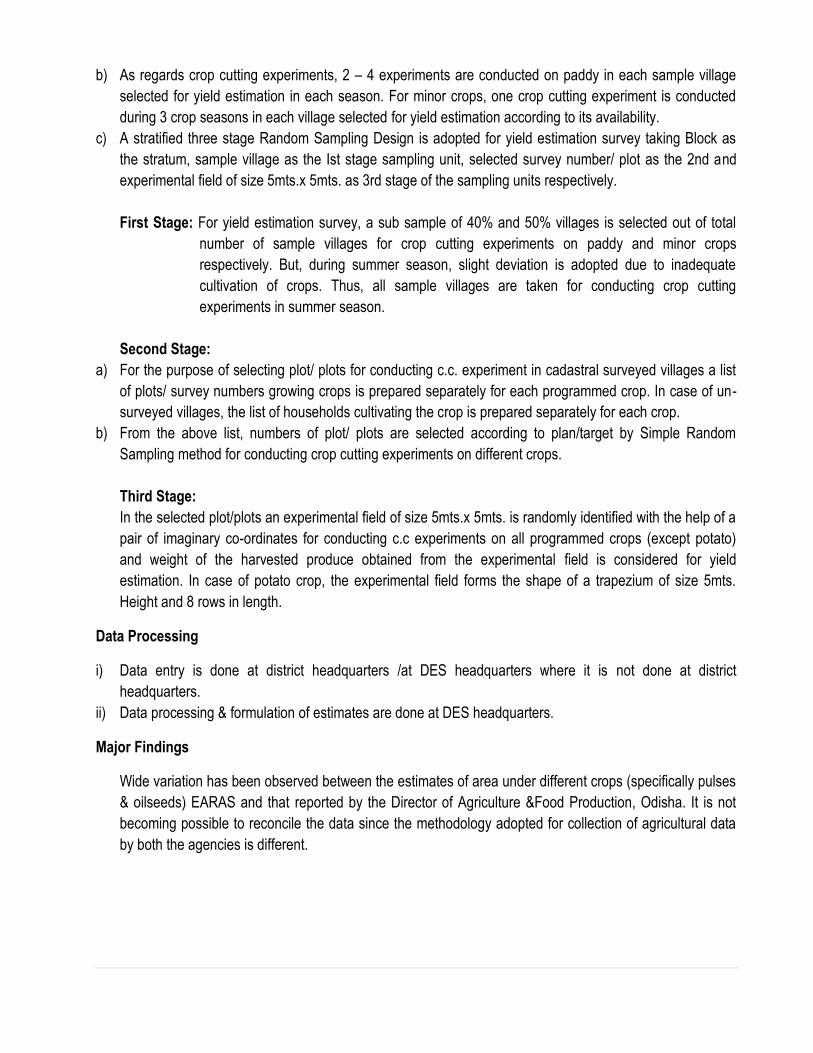
b) As regards crop cutting experiments, 2 – 4 experiments are conducted on paddy in each sample village
selected for yield estimation in each season. For minor crops, one crop cutting experiment is conducted
during 3 crop seasons in each village selected for yield estimation according to its availability.
c) A stratified three stage Random Sampling Design is adopted for yield estimation survey taking Block as
the stratum, sample village as the Ist stage sampling unit, selected survey number/ plot as the 2nd and
experimental field of size 5mts.x 5mts. as 3rd stage of the sampling units respectively.
First Stage: For yield estimation survey, a sub sample of 40% and 50% villages is selected out of total
number of sample villages for crop cutting experiments on paddy and minor crops
respectively. But, during summer season, slight deviation is adopted due to inadequate
cultivation of crops. Thus, all sample villages are taken for conducting crop cutting
experiments in summer season.
Second Stage:
a) For the purpose of selecting plot/ plots for conducting c.c. experiment in cadastral surveyed villages a list
of plots/ survey numbers growing crops is prepared separately for each programmed crop. In case of un-
surveyed villages, the list of households cultivating the crop is prepared separately for each crop.
b) From the above list, numbers of plot/ plots are selected according to plan/target by Simple Random
Sampling method for conducting crop cutting experiments on different crops.
Third Stage:
In the selected plot/plots an experimental field of size 5mts.x 5mts. is randomly identified with the help of a
pair of imaginary co-ordinates for conducting c.c experiments on all programmed crops (except potato)
and weight of the harvested produce obtained from the experimental field is considered for yield
estimation. In case of potato crop, the experimental field forms the shape of a trapezium of size 5mts.
Height and 8 rows in length.
Data Processing
i) Data entry is done at district headquarters /at DES headquarters where it is not done at district
headquarters.
ii) Data processing & formulation of estimates are done at DES headquarters.
Major Findings
Wide variation has been observed between the estimates of area under different crops (specifically pulses
& oilseeds) EARAS and that reported by the Director of Agriculture &Food Production, Odisha. It is not
becoming possible to reconcile the data since the methodology adopted for collection of agricultural data
by both the agencies is different.
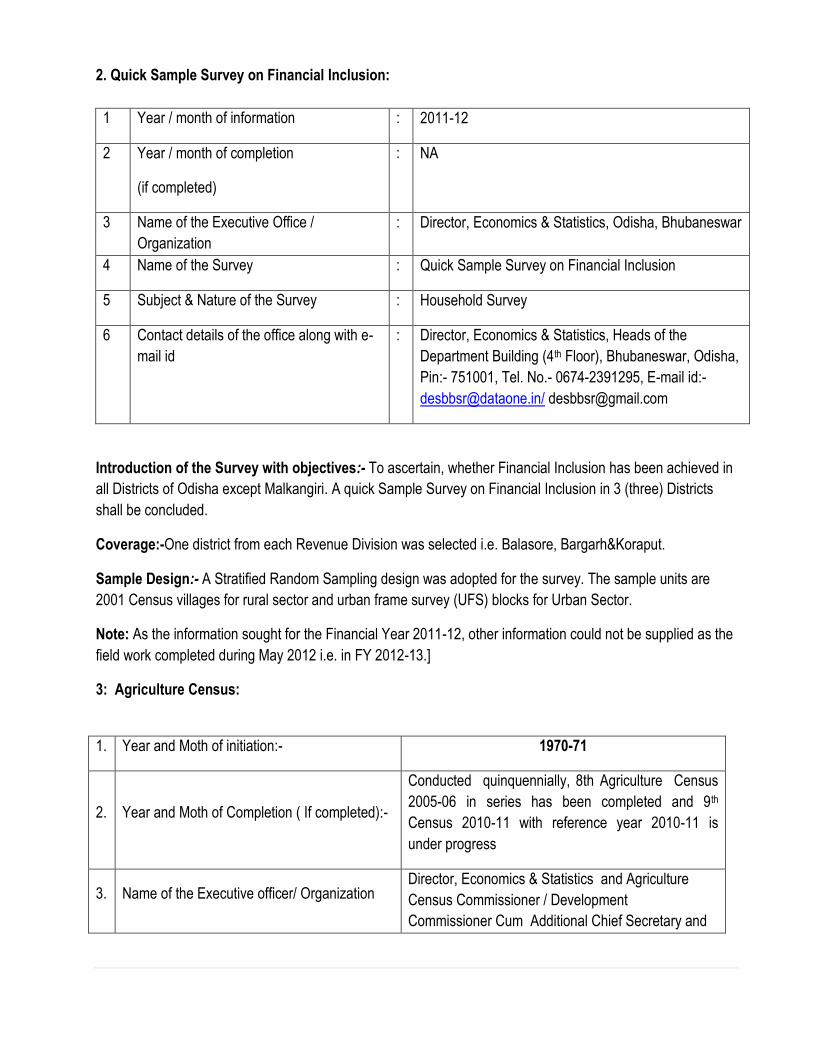
2. Quick Sample Survey on Financial Inclusion:
1 Year / month of information : 2011-12
2 Year / month of completion
(if completed)
: NA
3 Name of the Executive Office /
Organization
: Director, Economics & Statistics, Odisha, Bhubaneswar
4 Name of the Survey : Quick Sample Survey on Financial Inclusion
5 Subject & Nature of the Survey : Household Survey
6 Contact details of the office along with e-
mail id
: Director, Economics & Statistics, Heads of the
Department Building (4th Floor), Bhubaneswar, Odisha,
Pin:- 751001, Tel. No.- 0674-2391295, E-mail id:-
[email protected]/ [email protected]
Introduction of the Survey with objectives:- To ascertain, whether Financial Inclusion has been achieved in
all Districts of Odisha except Malkangiri. A quick Sample Survey on Financial Inclusion in 3 (three) Districts
shall be concluded.
Coverage:-One district from each Revenue Division was selected i.e. Balasore, Bargarh&Koraput.
Sample Design:- A Stratified Random Sampling design was adopted for the survey. The sample units are
2001 Census villages for rural sector and urban frame survey (UFS) blocks for Urban Sector.
Note: As the information sought for the Financial Year 2011-12, other information could not be supplied as the
field work completed during May 2012 i.e. in FY 2012-13.]
3: Agriculture Census:
1. Year and Moth of initiation:- 1970-71
2. Year and Moth of Completion ( If completed):-
Conducted quinquennially, 8th Agriculture Census
2005-06 in series has been completed and 9th
Census 2010-11 with reference year 2010-11 is
under progress
3. Name of the Executive officer/ Organization Director, Economics & Statistics and Agriculture
Census Commissioner / Development
Commissioner Cum Additional Chief Secretary and
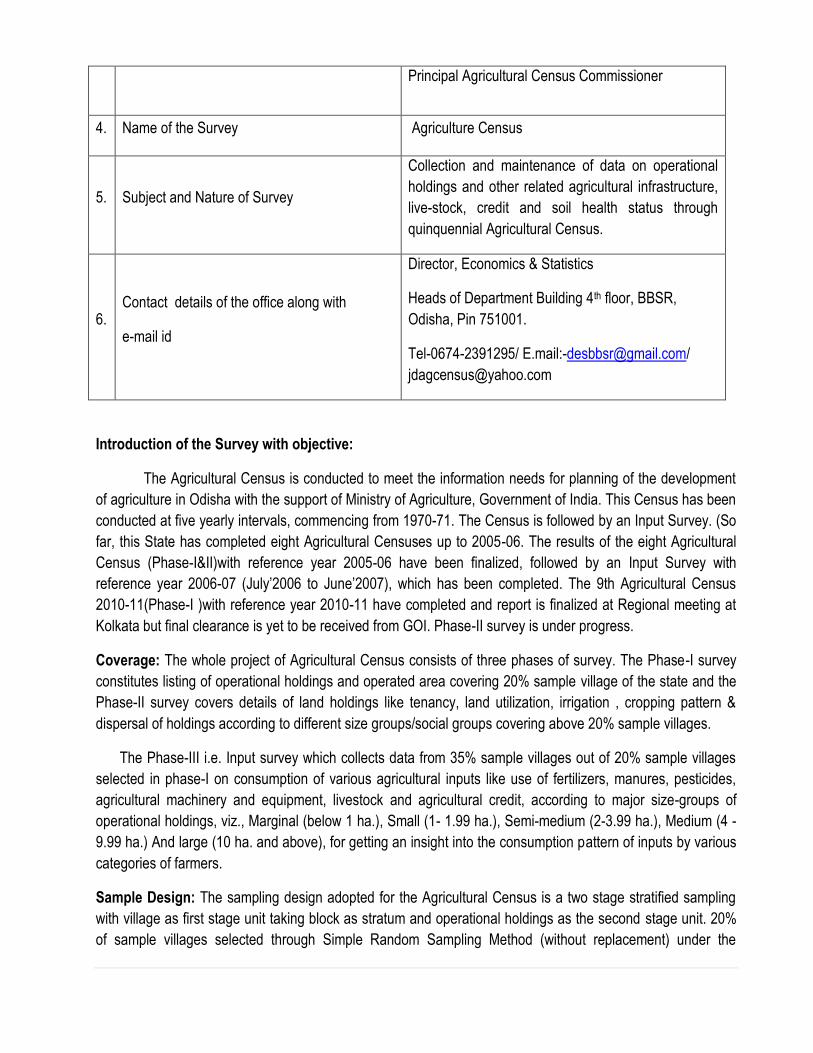
Principal Agricultural Census Commissioner
4. Name of the Survey Agriculture Census
5. Subject and Nature of Survey
Collection and maintenance of data on operational
holdings and other related agricultural infrastructure,
live-stock, credit and soil health status through
quinquennial Agricultural Census.
6. Contact details of the office along with
e-mail id
Director, Economics & Statistics
Heads of Department Building 4th floor, BBSR,
Odisha, Pin 751001.
Tel-0674-2391295/ E.mail:[email protected]/
Introduction of the Survey with objective:
The Agricultural Census is conducted to meet the information needs for planning of the development
of agriculture in Odisha with the support of Ministry of Agriculture, Government of India. This Census has been
conducted at five yearly intervals, commencing from 1970-71. The Census is followed by an Input Survey. (So
far, this State has completed eight Agricultural Censuses up to 2005-06. The results of the eight Agricultural
Census (Phase-I&II)with reference year 2005-06 have been finalized, followed by an Input Survey with
reference year 2006-07 (July’2006 to June’2007), which has been completed. The 9th Agricultural Census
2010-11(Phase-I )with reference year 2010-11 have completed and report is finalized at Regional meeting at
Kolkata but final clearance is yet to be received from GOI. Phase-II survey is under progress.
Coverage: The whole project of Agricultural Census consists of three phases of survey. The Phase-I survey
constitutes listing of operational holdings and operated area covering 20% sample village of the state and the
Phase-II survey covers details of land holdings like tenancy, land utilization, irrigation , cropping pattern &
dispersal of holdings according to different size groups/social groups covering above 20% sample villages.
The Phase-III i.e. Input survey which collects data from 35% sample villages out of 20% sample villages
selected in phase-I on consumption of various agricultural inputs like use of fertilizers, manures, pesticides,
agricultural machinery and equipment, livestock and agricultural credit, according to major size-groups of
operational holdings, viz., Marginal (below 1 ha.), Small (1- 1.99 ha.), Semi-medium (2-3.99 ha.), Medium (4 -
9.99 ha.) And large (10 ha. and above), for getting an insight into the consumption pattern of inputs by various
categories of farmers.
Sample Design: The sampling design adopted for the Agricultural Census is a two stage stratified sampling
with village as first stage unit taking block as stratum and operational holdings as the second stage unit. 20%
of sample villages selected through Simple Random Sampling Method (without replacement) under the
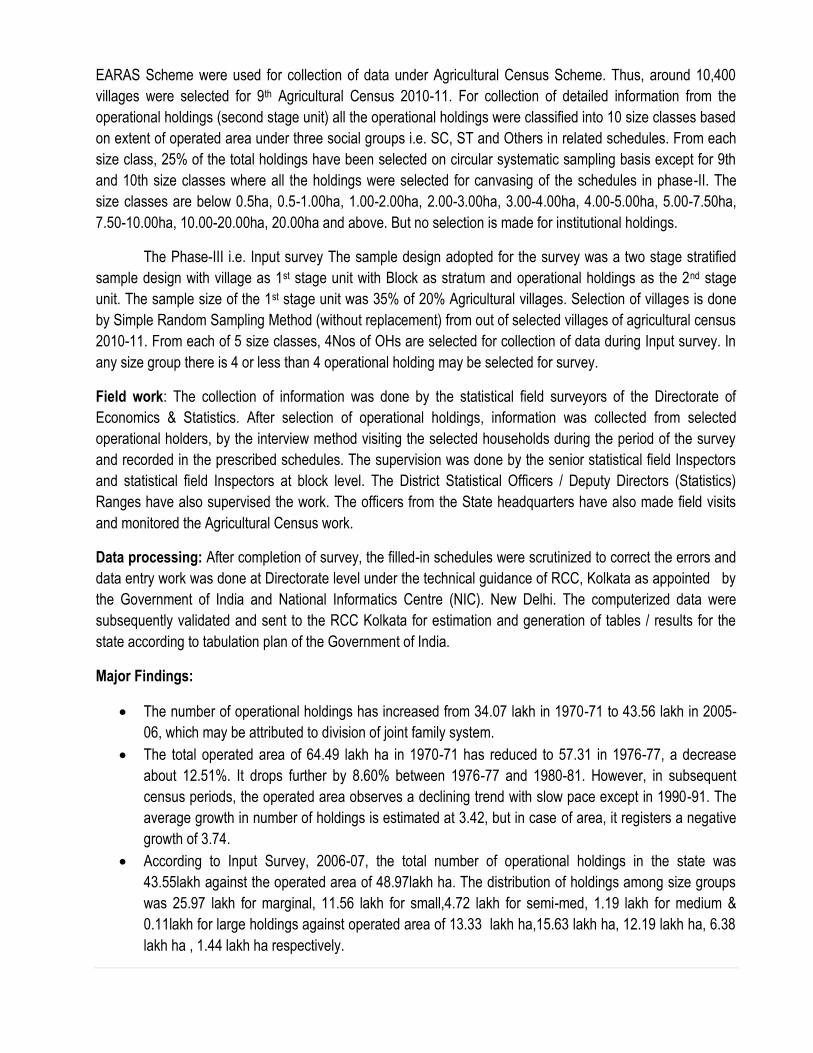
EARAS Scheme were used for collection of data under Agricultural Census Scheme. Thus, around 10,400
villages were selected for 9th Agricultural Census 2010-11. For collection of detailed information from the
operational holdings (second stage unit) all the operational holdings were classified into 10 size classes based
on extent of operated area under three social groups i.e. SC, ST and Others in related schedules. From each
size class, 25% of the total holdings have been selected on circular systematic sampling basis except for 9th
and 10th size classes where all the holdings were selected for canvasing of the schedules in phase-II. The
size classes are below 0.5ha, 0.5-1.00ha, 1.00-2.00ha, 2.00-3.00ha, 3.00-4.00ha, 4.00-5.00ha, 5.00-7.50ha,
7.50-10.00ha, 10.00-20.00ha, 20.00ha and above. But no selection is made for institutional holdings.
The Phase-III i.e. Input survey The sample design adopted for the survey was a two stage stratified
sample design with village as 1st stage unit with Block as stratum and operational holdings as the 2nd stage
unit. The sample size of the 1st stage unit was 35% of 20% Agricultural villages. Selection of villages is done
by Simple Random Sampling Method (without replacement) from out of selected villages of agricultural census
2010-11. From each of 5 size classes, 4Nos of OHs are selected for collection of data during Input survey. In
any size group there is 4 or less than 4 operational holding may be selected for survey.
Field work: The collection of information was done by the statistical field surveyors of the Directorate of
Economics & Statistics. After selection of operational holdings, information was collected from selected
operational holders, by the interview method visiting the selected households during the period of the survey
and recorded in the prescribed schedules. The supervision was done by the senior statistical field Inspectors
and statistical field Inspectors at block level. The District Statistical Officers / Deputy Directors (Statistics)
Ranges have also supervised the work. The officers from the State headquarters have also made field visits
and monitored the Agricultural Census work.
Data processing: After completion of survey, the filled-in schedules were scrutinized to correct the errors and
data entry work was done at Directorate level under the technical guidance of RCC, Kolkata as appointed by
the Government of India and National Informatics Centre (NIC). New Delhi. The computerized data were
subsequently validated and sent to the RCC Kolkata for estimation and generation of tables / results for the
state according to tabulation plan of the Government of India.
Major Findings:
The number of operational holdings has increased from 34.07 lakh in 1970-71 to 43.56 lakh in 2005-
06, which may be attributed to division of joint family system.
The total operated area of 64.49 lakh ha in 1970-71 has reduced to 57.31 in 1976-77, a decrease
about 12.51%. It drops further by 8.60% between 1976-77 and 1980-81. However, in subsequent
census periods, the operated area observes a declining trend with slow pace except in 1990-91. The
average growth in number of holdings is estimated at 3.42, but in case of area, it registers a negative
growth of 3.74.
According to Input Survey, 2006-07, the total number of operational holdings in the state was
43.55lakh against the operated area of 48.97lakh ha. The distribution of holdings among size groups
was 25.97 lakh for marginal, 11.56 lakh for small,4.72 lakh for semi-med, 1.19 lakh for medium &
0.11lakh for large holdings against operated area of 13.33 lakh ha,15.63 lakh ha, 12.19 lakh ha, 6.38
lakh ha , 1.44 lakh ha respectively.
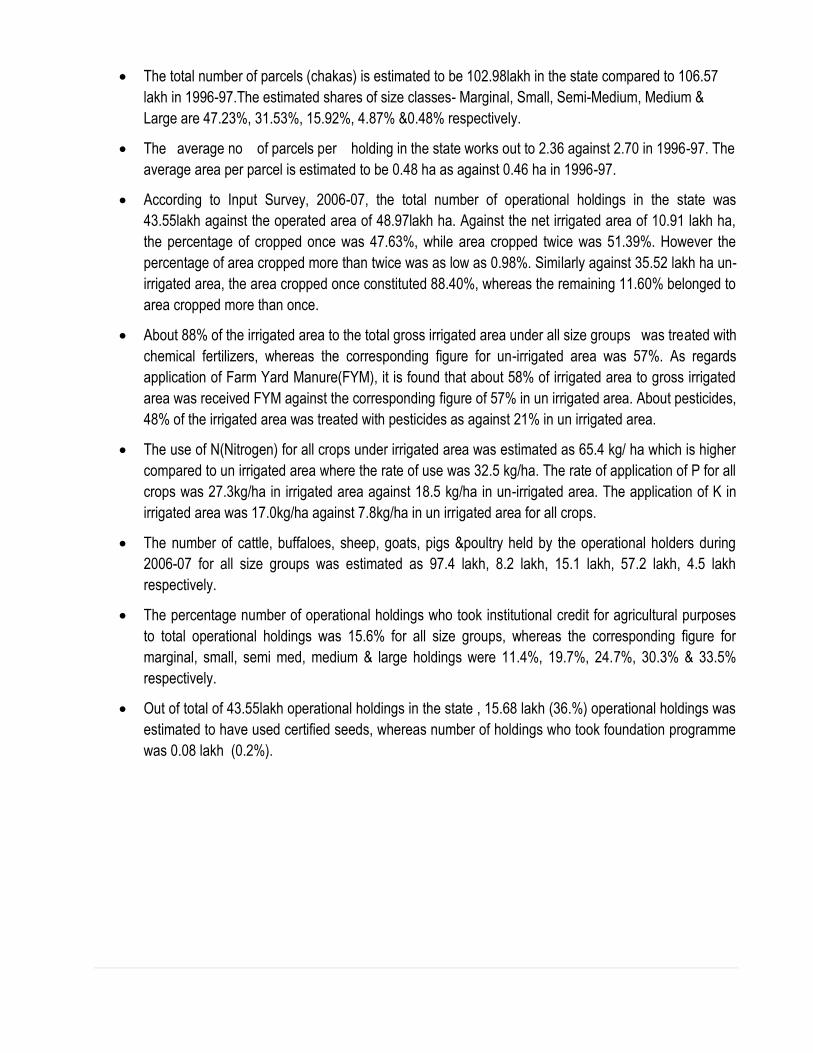
The total number of parcels (chakas) is estimated to be 102.98lakh in the state compared to 106.57
lakh in 1996-97.The estimated shares of size classes- Marginal, Small, Semi-Medium, Medium &
Large are 47.23%, 31.53%, 15.92%, 4.87% &0.48% respectively.
The average no of parcels per holding in the state works out to 2.36 against 2.70 in 1996-97. The
average area per parcel is estimated to be 0.48 ha as against 0.46 ha in 1996-97.
According to Input Survey, 2006-07, the total number of operational holdings in the state was
43.55lakh against the operated area of 48.97lakh ha. Against the net irrigated area of 10.91 lakh ha,
the percentage of cropped once was 47.63%, while area cropped twice was 51.39%. However the
percentage of area cropped more than twice was as low as 0.98%. Similarly against 35.52 lakh ha un-
irrigated area, the area cropped once constituted 88.40%, whereas the remaining 11.60% belonged to
area cropped more than once.
About 88% of the irrigated area to the total gross irrigated area under all size groups was treated with
chemical fertilizers, whereas the corresponding figure for un-irrigated area was 57%. As regards
application of Farm Yard Manure(FYM), it is found that about 58% of irrigated area to gross irrigated
area was received FYM against the corresponding figure of 57% in un irrigated area. About pesticides,
48% of the irrigated area was treated with pesticides as against 21% in un irrigated area.
The use of N(Nitrogen) for all crops under irrigated area was estimated as 65.4 kg/ ha which is higher
compared to un irrigated area where the rate of use was 32.5 kg/ha. The rate of application of P for all
crops was 27.3kg/ha in irrigated area against 18.5 kg/ha in un-irrigated area. The application of K in
irrigated area was 17.0kg/ha against 7.8kg/ha in un irrigated area for all crops.
The number of cattle, buffaloes, sheep, goats, pigs &poultry held by the operational holders during
2006-07 for all size groups was estimated as 97.4 lakh, 8.2 lakh, 15.1 lakh, 57.2 lakh, 4.5 lakh
respectively.
The percentage number of operational holdings who took institutional credit for agricultural purposes
to total operational holdings was 15.6% for all size groups, whereas the corresponding figure for
marginal, small, semi med, medium & large holdings were 11.4%, 19.7%, 24.7%, 30.3% & 33.5%
respectively.
Out of total of 43.55lakh operational holdings in the state , 15.68 lakh (36.%) operational holdings was
estimated to have used certified seeds, whereas number of holdings who took foundation programme
was 0.08 lakh (0.2%).
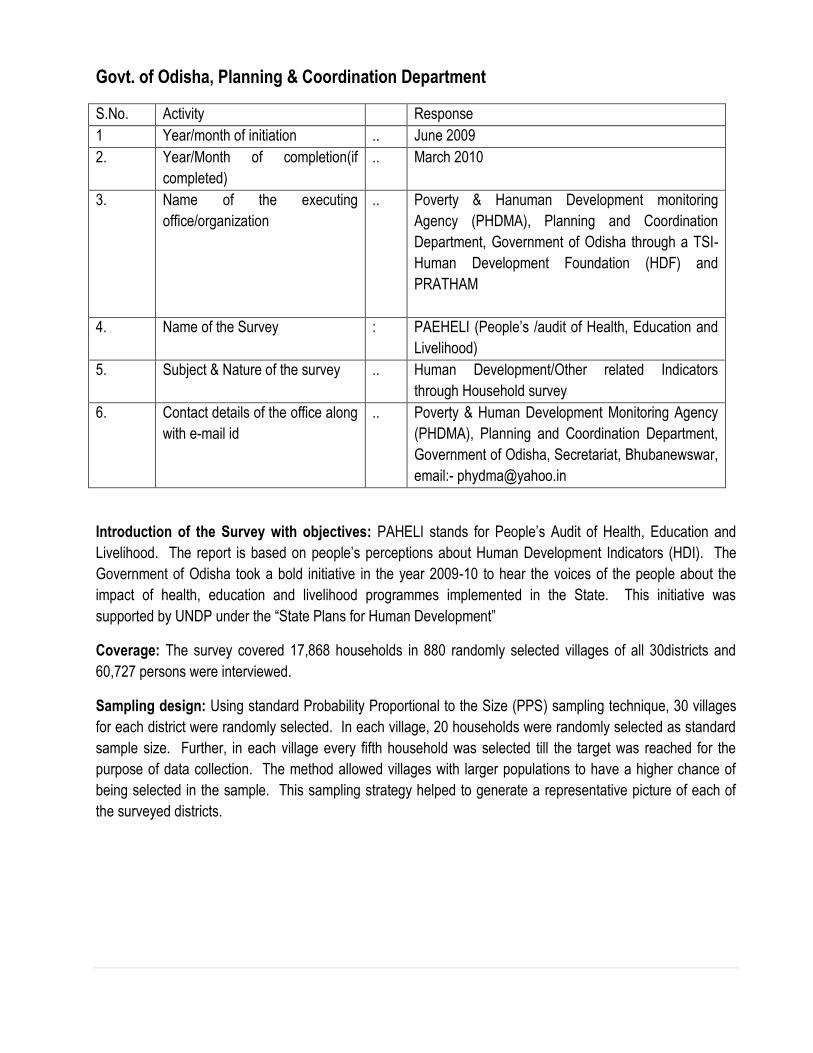
Govt. of Odisha, Planning & Coordination Department
S.No. Activity Response
1 Year/month of initiation .. June 2009
2. Year/Month of completion(if
completed)
.. March 2010
3. Name of the executing
office/organization
.. Poverty & Hanuman Development monitoring
Agency (PHDMA), Planning and Coordination
Department, Government of Odisha through a TSI-
Human Development Foundation (HDF) and
PRATHAM
4. Name of the Survey : PAEHELI (People’s /audit of Health, Education and
Livelihood)
5. Subject & Nature of the survey .. Human Development/Other related Indicators
through Household survey
6. Contact details of the office along
with e-mail id
.. Poverty & Human Development Monitoring Agency
(PHDMA), Planning and Coordination Department,
Government of Odisha, Secretariat, Bhubanewswar,
email:- [email protected]
Introduction of the Survey with objectives: PAHELI stands for People’s Audit of Health, Education and
Livelihood. The report is based on people’s perceptions about Human Development Indicators (HDI). The
Government of Odisha took a bold initiative in the year 2009-10 to hear the voices of the people about the
impact of health, education and livelihood programmes implemented in the State. This initiative was
supported by UNDP under the “State Plans for Human Development”
Coverage: The survey covered 17,868 households in 880 randomly selected villages of all 30districts and
60,727 persons were interviewed.
Sampling design: Using standard Probability Proportional to the Size (PPS) sampling technique, 30 villages
for each district were randomly selected. In each village, 20 households were randomly selected as standard
sample size. Further, in each village every fifth household was selected till the target was reached for the
purpose of data collection. The method allowed villages with larger populations to have a higher chance of
being selected in the sample. This sampling strategy helped to generate a representative picture of each of
the surveyed districts.
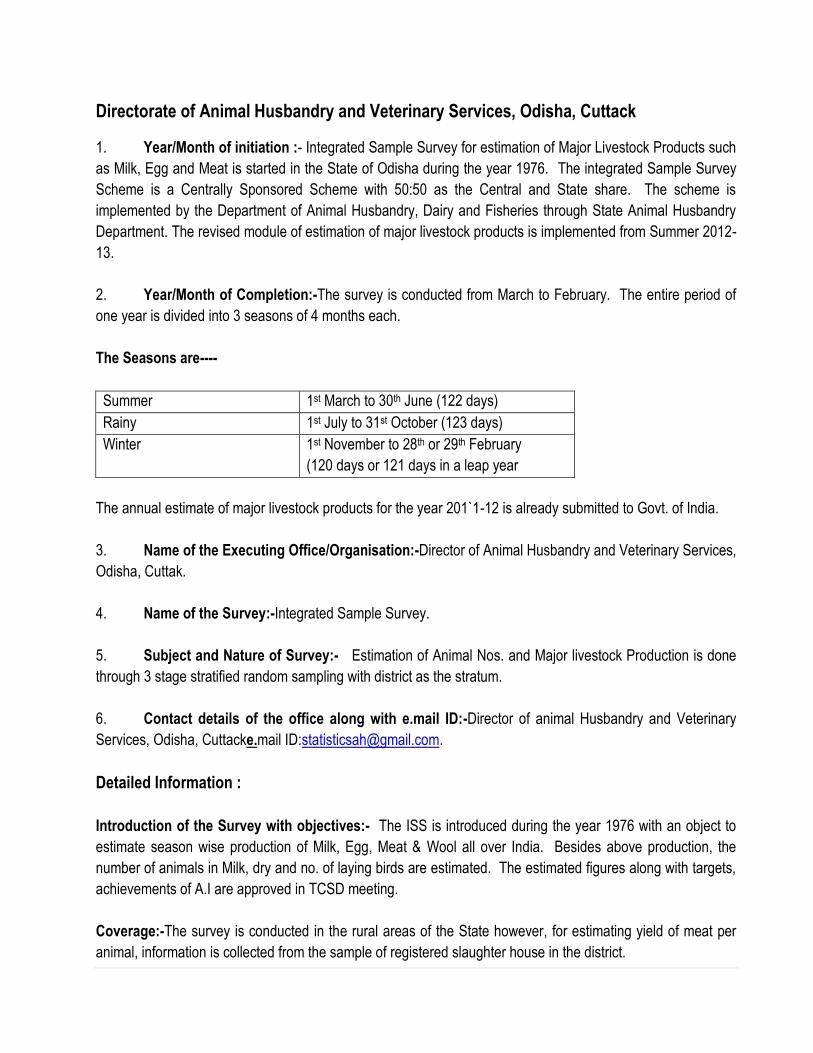
Directorate of Animal Husbandry and Veterinary Services, Odisha, Cuttack
1. Year/Month of initiation :- Integrated Sample Survey for estimation of Major Livestock Products such
as Milk, Egg and Meat is started in the State of Odisha during the year 1976. The integrated Sample Survey
Scheme is a Centrally Sponsored Scheme with 50:50 as the Central and State share. The scheme is
implemented by the Department of Animal Husbandry, Dairy and Fisheries through State Animal Husbandry
Department. The revised module of estimation of major livestock products is implemented from Summer 2012-
13.
2. Year/Month of Completion:-The survey is conducted from March to February. The entire period of
one year is divided into 3 seasons of 4 months each.
The Seasons are----
Summer 1st March to 30th June (122 days)
Rainy 1st July to 31st October (123 days)
Winter 1st November to 28th or 29th February
(120 days or 121 days in a leap year
The annual estimate of major livestock products for the year 201`1-12 is already submitted to Govt. of India.
3. Name of the Executing Office/Organisation:-Director of Animal Husbandry and Veterinary Services,
Odisha, Cuttak.
4. Name of the Survey:-Integrated Sample Survey.
5. Subject and Nature of Survey:- Estimation of Animal Nos. and Major livestock Production is done
through 3 stage stratified random sampling with district as the stratum.
6. Contact details of the office along with e.mail ID:-Director of animal Husbandry and Veterinary
Services, Odisha, Cuttacke.mail ID:[email protected].
Detailed Information :
Introduction of the Survey with objectives:- The ISS is introduced during the year 1976 with an object to
estimate season wise production of Milk, Egg, Meat & Wool all over India. Besides above production, the
number of animals in Milk, dry and no. of laying birds are estimated. The estimated figures along with targets,
achievements of A.I are approved in TCSD meeting.
Coverage:-The survey is conducted in the rural areas of the State however, for estimating yield of meat per
animal, information is collected from the sample of registered slaughter house in the district.
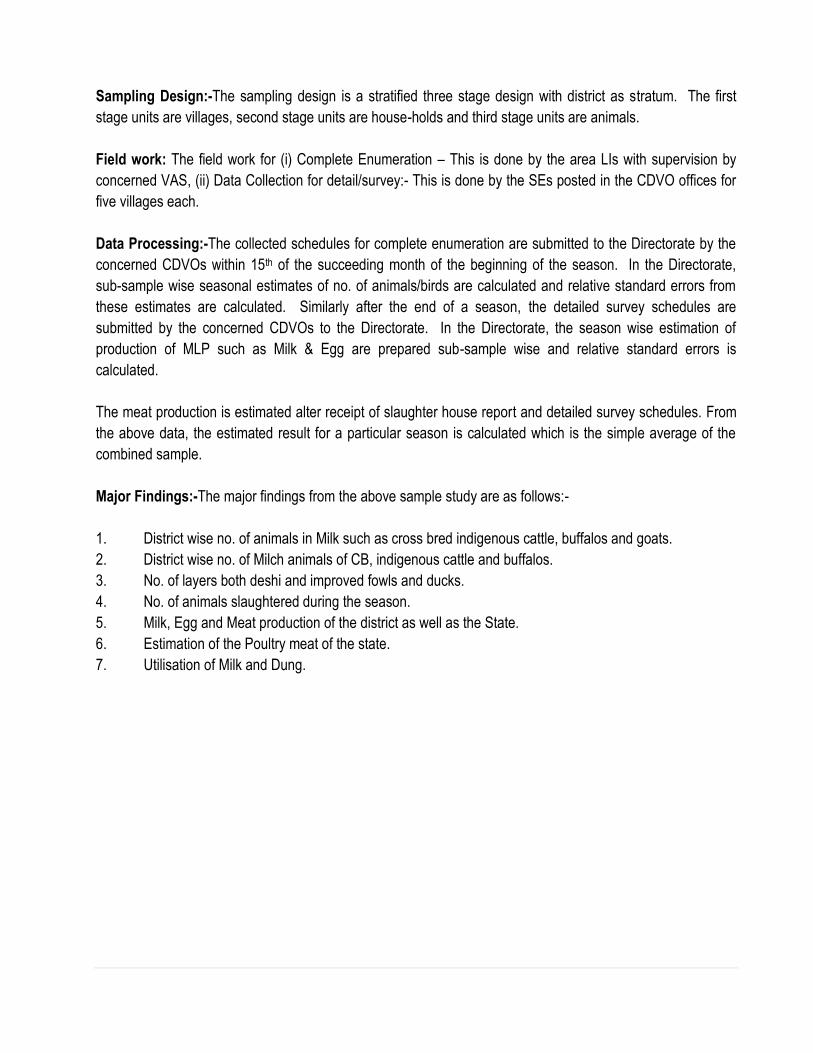
Sampling Design:-The sampling design is a stratified three stage design with district as stratum. The first
stage units are villages, second stage units are house-holds and third stage units are animals.
Field work: The field work for (i) Complete Enumeration – This is done by the area LIs with supervision by
concerned VAS, (ii) Data Collection for detail/survey:- This is done by the SEs posted in the CDVO offices for
five villages each.
Data Processing:-The collected schedules for complete enumeration are submitted to the Directorate by the
concerned CDVOs within 15th of the succeeding month of the beginning of the season. In the Directorate,
sub-sample wise seasonal estimates of no. of animals/birds are calculated and relative standard errors from
these estimates are calculated. Similarly after the end of a season, the detailed survey schedules are
submitted by the concerned CDVOs to the Directorate. In the Directorate, the season wise estimation of
production of MLP such as Milk & Egg are prepared sub-sample wise and relative standard errors is
calculated.
The meat production is estimated alter receipt of slaughter house report and detailed survey schedules. From
the above data, the estimated result for a particular season is calculated which is the simple average of the
combined sample.
Major Findings:-The major findings from the above sample study are as follows:-
1. District wise no. of animals in Milk such as cross bred indigenous cattle, buffalos and goats.
2. District wise no. of Milch animals of CB, indigenous cattle and buffalos.
3. No. of layers both deshi and improved fowls and ducks.
4. No. of animals slaughtered during the season.
5. Milk, Egg and Meat production of the district as well as the State.
6. Estimation of the Poultry meat of the state.
7. Utilisation of Milk and Dung.
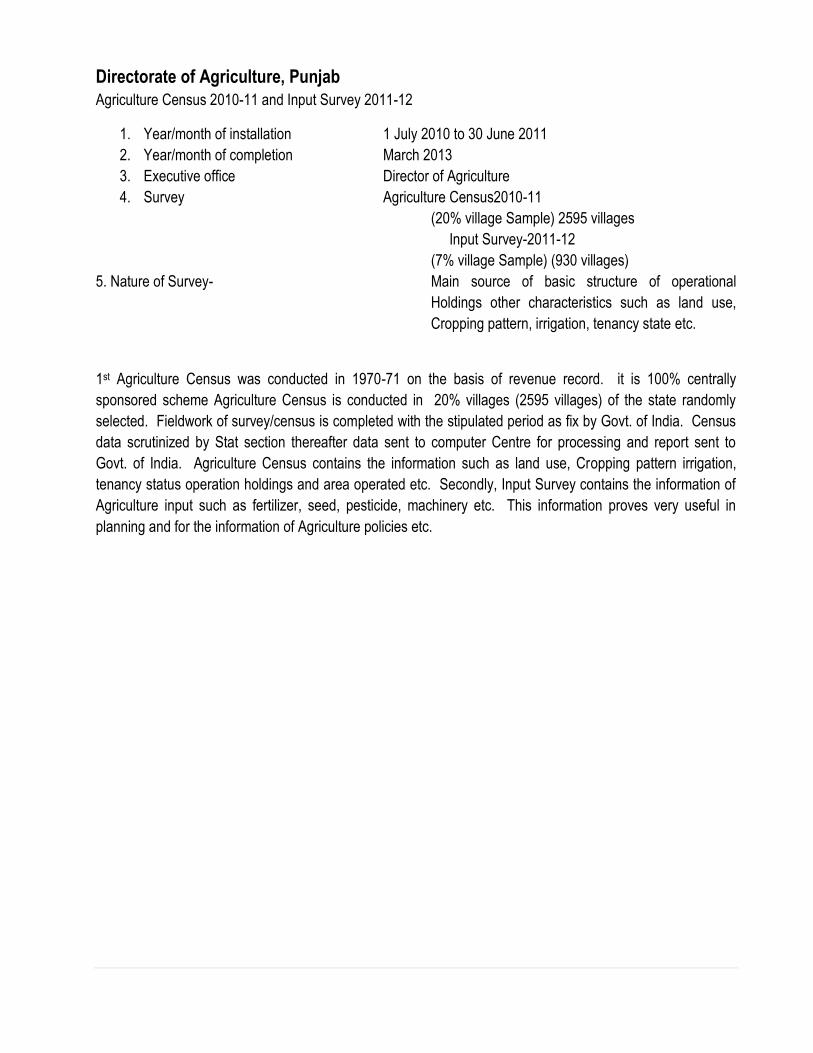
Directorate of Agriculture, Punjab
Agriculture Census 2010-11 and Input Survey 2011-12
1. Year/month of installation 1 July 2010 to 30 June 2011
2. Year/month of completion March 2013
3. Executive office Director of Agriculture
4. Survey Agriculture Census2010-11
(20% village Sample) 2595 villages
Input Survey-2011-12
(7% village Sample) (930 villages)
5. Nature of Survey- Main source of basic structure of operational
Holdings other characteristics such as land use,
Cropping pattern, irrigation, tenancy state etc.
1st Agriculture Census was conducted in 1970-71 on the basis of revenue record. it is 100% centrally
sponsored scheme Agriculture Census is conducted in 20% villages (2595 villages) of the state randomly
selected. Fieldwork of survey/census is completed with the stipulated period as fix by Govt. of India. Census
data scrutinized by Stat section thereafter data sent to computer Centre for processing and report sent to
Govt. of India. Agriculture Census contains the information such as land use, Cropping pattern irrigation,
tenancy status operation holdings and area operated etc. Secondly, Input Survey contains the information of
Agriculture input such as fertilizer, seed, pesticide, machinery etc. This information proves very useful in
planning and for the information of Agriculture policies etc.
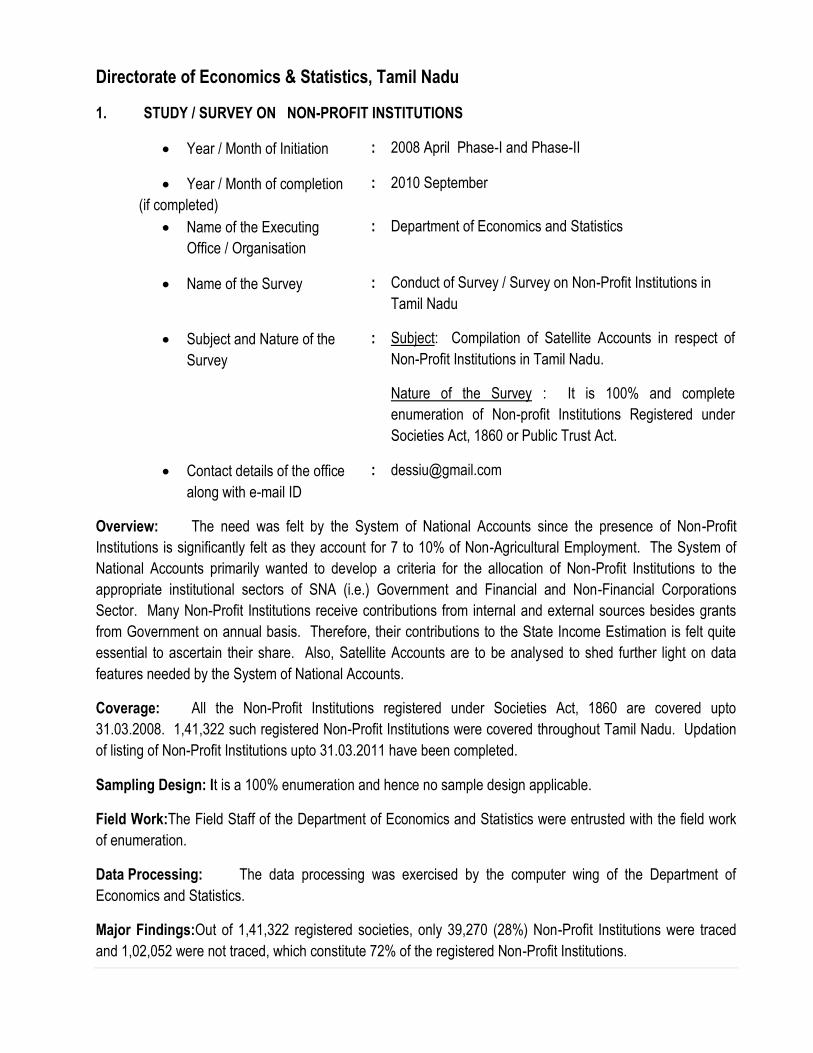
Directorate of Economics & Statistics, Tamil Nadu
1. STUDY / SURVEY ON NON-PROFIT INSTITUTIONS
Year / Month of Initiation : 2008 April Phase-I and Phase-II
Year / Month of completion
(if completed)
: 2010 September
Name of the Executing
Office / Organisation
: Department of Economics and Statistics
Name of the Survey : Conduct of Survey / Survey on Non-Profit Institutions in
Tamil Nadu
Subject and Nature of the
Survey
: Subject: Compilation of Satellite Accounts in respect of
Non-Profit Institutions in Tamil Nadu.
Nature of the Survey : It is 100% and complete
enumeration of Non-profit Institutions Registered under
Societies Act, 1860 or Public Trust Act.
Contact details of the office
along with e-mail ID
Overview: The need was felt by the System of National Accounts since the presence of Non-Profit
Institutions is significantly felt as they account for 7 to 10% of Non-Agricultural Employment. The System of
National Accounts primarily wanted to develop a criteria for the allocation of Non-Profit Institutions to the
appropriate institutional sectors of SNA (i.e.) Government and Financial and Non-Financial Corporations
Sector. Many Non-Profit Institutions receive contributions from internal and external sources besides grants
from Government on annual basis. Therefore, their contributions to the State Income Estimation is felt quite
essential to ascertain their share. Also, Satellite Accounts are to be analysed to shed further light on data
features needed by the System of National Accounts.
Coverage: All the Non-Profit Institutions registered under Societies Act, 1860 are covered upto
31.03.2008. 1,41,322 such registered Non-Profit Institutions were covered throughout Tamil Nadu. Updation
of listing of Non-Profit Institutions upto 31.03.2011 have been completed.
Sampling Design: It is a 100% enumeration and hence no sample design applicable.
Field Work:The Field Staff of the Department of Economics and Statistics were entrusted with the field work
of enumeration.
Data Processing: The data processing was exercised by the computer wing of the Department of
Economics and Statistics.
Major Findings:Out of 1,41,322 registered societies, only 39,270 (28%) Non-Profit Institutions were traced
and 1,02,052 were not traced, which constitute 72% of the registered Non-Profit Institutions.
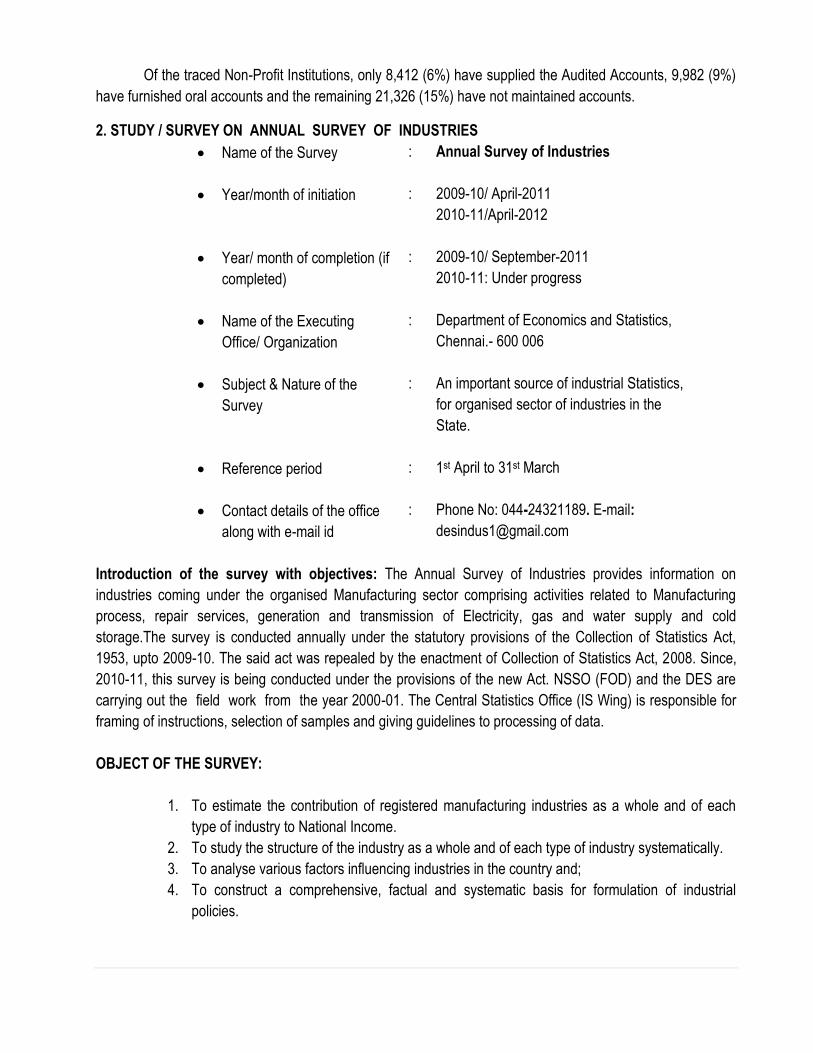
Of the traced Non-Profit Institutions, only 8,412 (6%) have supplied the Audited Accounts, 9,982 (9%)
have furnished oral accounts and the remaining 21,326 (15%) have not maintained accounts.
2. STUDY / SURVEY ON ANNUAL SURVEY OF INDUSTRIES
Name of the Survey : Annual Survey of Industries
Year/month of initiation
: 2009-10/ April-2011
2010-11/April-2012
Year/ month of completion (if
completed)
: 2009-10/ September-2011
2010-11: Under progress
Name of the Executing
Office/ Organization
: Department of Economics and Statistics,
Chennai.- 600 006
Subject & Nature of the
Survey
: An important source of industrial Statistics,
for organised sector of industries in the
State.
Reference period : 1st April to 31st March
Contact details of the office
along with e-mail id
: Phone No: 044-24321189. E-mail:
Introduction of the survey with objectives: The Annual Survey of Industries provides information on
industries coming under the organised Manufacturing sector comprising activities related to Manufacturing
process, repair services, generation and transmission of Electricity, gas and water supply and cold
storage.The survey is conducted annually under the statutory provisions of the Collection of Statistics Act,
1953, upto 2009-10. The said act was repealed by the enactment of Collection of Statistics Act, 2008. Since,
2010-11, this survey is being conducted under the provisions of the new Act. NSSO (FOD) and the DES are
carrying out the field work from the year 2000-01. The Central Statistics Office (IS Wing) is responsible for
framing of instructions, selection of samples and giving guidelines to processing of data.
OBJECT OF THE SURVEY:
1. To estimate the contribution of registered manufacturing industries as a whole and of each
type of industry to National Income.
2. To study the structure of the industry as a whole and of each type of industry systematically.
3. To analyse various factors influencing industries in the country and;
4. To construct a comprehensive, factual and systematic basis for formulation of industrial
policies.
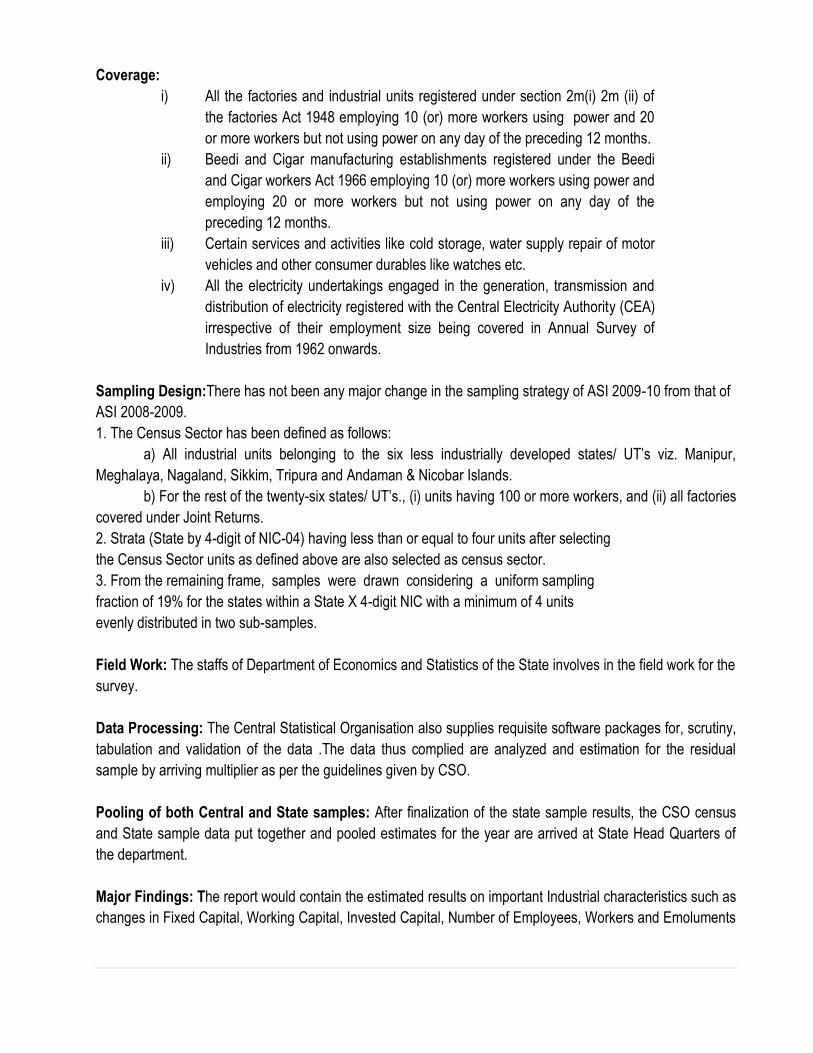
Coverage:
i) All the factories and industrial units registered under section 2m(i) 2m (ii) of
the factories Act 1948 employing 10 (or) more workers using power and 20
or more workers but not using power on any day of the preceding 12 months.
ii) Beedi and Cigar manufacturing establishments registered under the Beedi
and Cigar workers Act 1966 employing 10 (or) more workers using power and
employing 20 or more workers but not using power on any day of the
preceding 12 months.
iii) Certain services and activities like cold storage, water supply repair of motor
vehicles and other consumer durables like watches etc.
iv) All the electricity undertakings engaged in the generation, transmission and
distribution of electricity registered with the Central Electricity Authority (CEA)
irrespective of their employment size being covered in Annual Survey of
Industries from 1962 onwards.
Sampling Design:There has not been any major change in the sampling strategy of ASI 2009-10 from that of
ASI 2008-2009.
1. The Census Sector has been defined as follows:
a) All industrial units belonging to the six less industrially developed states/ UT’s viz. Manipur,
Meghalaya, Nagaland, Sikkim, Tripura and Andaman & Nicobar Islands.
b) For the rest of the twenty-six states/ UT’s., (i) units having 100 or more workers, and (ii) all factories
covered under Joint Returns.
2. Strata (State by 4-digit of NIC-04) having less than or equal to four units after selecting
the Census Sector units as defined above are also selected as census sector.
3. From the remaining frame, samples were drawn considering a uniform sampling
fraction of 19% for the states within a State X 4-digit NIC with a minimum of 4 units
evenly distributed in two sub-samples.
Field Work: The staffs of Department of Economics and Statistics of the State involves in the field work for the
survey.
Data Processing: The Central Statistical Organisation also supplies requisite software packages for, scrutiny,
tabulation and validation of the data .The data thus complied are analyzed and estimation for the residual
sample by arriving multiplier as per the guidelines given by CSO.
Pooling of both Central and State samples: After finalization of the state sample results, the CSO census
and State sample data put together and pooled estimates for the year are arrived at State Head Quarters of
the department.
Major Findings: The report would contain the estimated results on important Industrial characteristics such as
changes in Fixed Capital, Working Capital, Invested Capital, Number of Employees, Workers and Emoluments
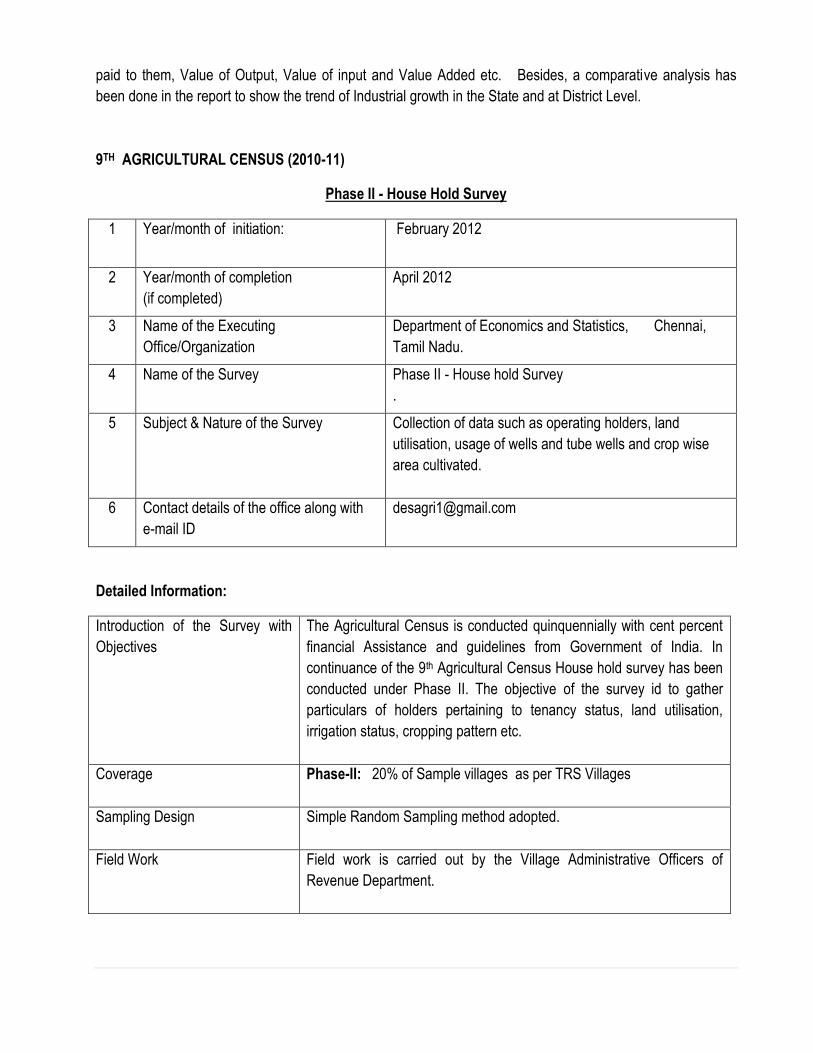
paid to them, Value of Output, Value of input and Value Added etc. Besides, a comparative analysis has
been done in the report to show the trend of Industrial growth in the State and at District Level.
9TH AGRICULTURAL CENSUS (2010-11)
Phase II - House Hold Survey
1 Year/month of initiation: February 2012
2 Year/month of completion
(if completed)
April 2012
3 Name of the Executing
Office/Organization
Department of Economics and Statistics, Chennai,
Tamil Nadu.
4 Name of the Survey Phase II - House hold Survey
.
5 Subject & Nature of the Survey Collection of data such as operating holders, land
utilisation, usage of wells and tube wells and crop wise
area cultivated.
6 Contact details of the office along with
e-mail ID
Detailed Information:
Introduction of the Survey with
Objectives
The Agricultural Census is conducted quinquennially with cent percent
financial Assistance and guidelines from Government of India. In
continuance of the 9th Agricultural Census House hold survey has been
conducted under Phase II. The objective of the survey id to gather
particulars of holders pertaining to tenancy status, land utilisation,
irrigation status, cropping pattern etc.
Coverage Phase-II: 20% of Sample villages as per TRS Villages
Sampling Design Simple Random Sampling method adopted.
Field Work Field work is carried out by the Village Administrative Officers of
Revenue Department.
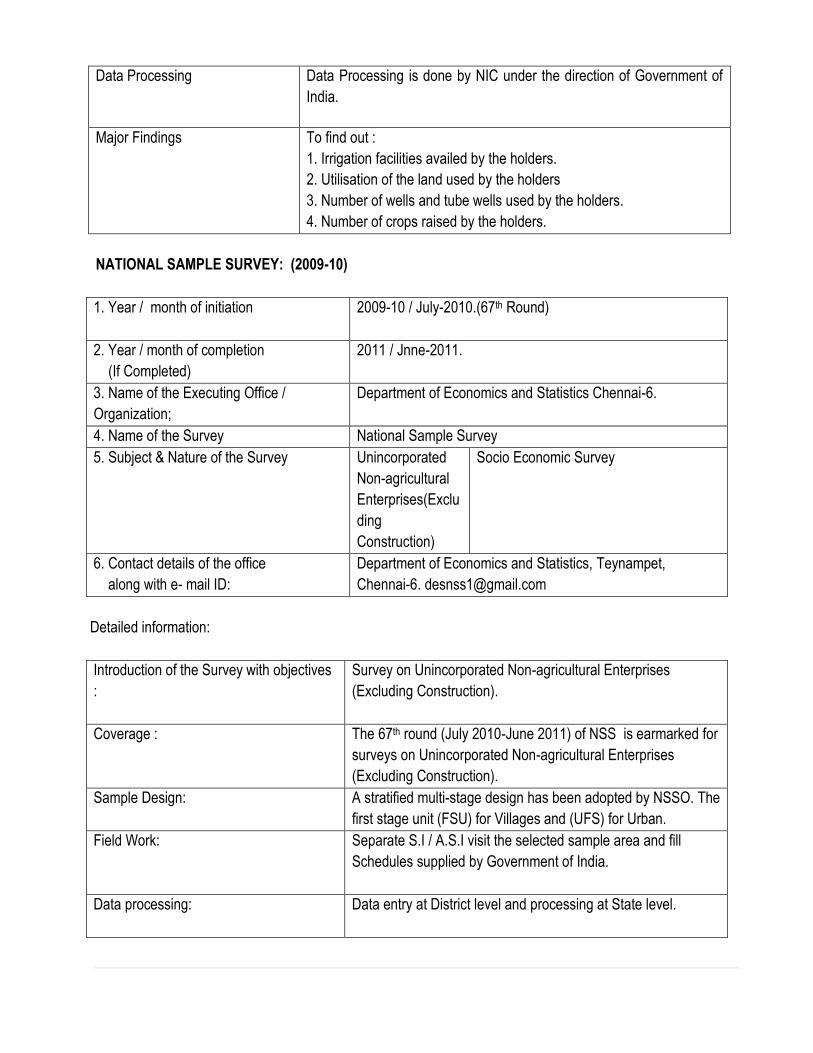
Data Processing Data Processing is done by NIC under the direction of Government of
India.
Major Findings To find out :
1. Irrigation facilities availed by the holders.
2. Utilisation of the land used by the holders
3. Number of wells and tube wells used by the holders.
4. Number of crops raised by the holders.
NATIONAL SAMPLE SURVEY: (2009-10)
1. Year / month of initiation
2009-10 / July-2010.(67th Round)
2. Year / month of completion
(If Completed)
2011 / Jnne-2011.
3. Name of the Executing Office /
Organization;
Department of Economics and Statistics Chennai-6.
4. Name of the Survey National Sample Survey
5. Subject & Nature of the Survey Unincorporated
Non-agricultural
Enterprises(Exclu
ding
Construction)
Socio Economic Survey
6. Contact details of the office
along with e- mail ID:
Department of Economics and Statistics, Teynampet,
Chennai-6. [email protected]
Detailed information:
Introduction of the Survey with objectives
:
Survey on Unincorporated Non-agricultural Enterprises
(Excluding Construction).
Coverage :
The 67th round (July 2010-June 2011) of NSS is earmarked for
surveys on Unincorporated Non-agricultural Enterprises
(Excluding Construction).
Sample Design:
A stratified multi-stage design has been adopted by NSSO. The
first stage unit (FSU) for Villages and (UFS) for Urban.
Field Work:
Separate S.I / A.S.I visit the selected sample area and fill
Schedules supplied by Government of India.
Data processing:
Data entry at District level and processing at State level.
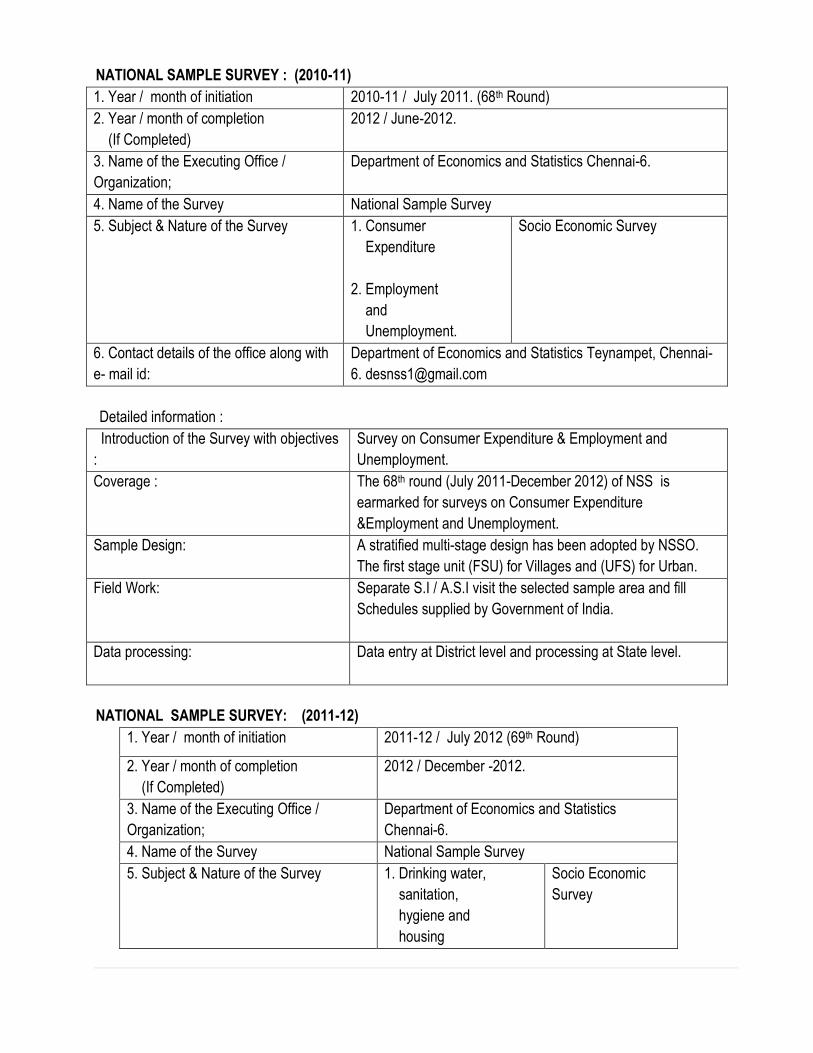
NATIONAL SAMPLE SURVEY : (2010-11)
1. Year / month of initiation 2010-11 / July 2011. (68th Round)
2. Year / month of completion
(If Completed)
2012 / June-2012.
3. Name of the Executing Office /
Organization;
Department of Economics and Statistics Chennai-6.
4. Name of the Survey National Sample Survey
5. Subject & Nature of the Survey 1. Consumer
Expenditure
2. Employment
and
Unemployment.
Socio Economic Survey
6. Contact details of the office along with
e- mail id:
Department of Economics and Statistics Teynampet, Chennai-
Detailed information :
Introduction of the Survey with objectives
:
Survey on Consumer Expenditure & Employment and
Unemployment.
Coverage :
The 68th round (July 2011-December 2012) of NSS is
earmarked for surveys on Consumer Expenditure
&Employment and Unemployment.
Sample Design:
A stratified multi-stage design has been adopted by NSSO.
The first stage unit (FSU) for Villages and (UFS) for Urban.
Field Work:
Separate S.I / A.S.I visit the selected sample area and fill
Schedules supplied by Government of India.
Data processing:
Data entry at District level and processing at State level.
NATIONAL SAMPLE SURVEY: (2011-12)
1. Year / month of initiation 2011-12 / July 2012 (69th Round)
2. Year / month of completion
(If Completed)
2012 / December -2012.
3. Name of the Executing Office /
Organization;
Department of Economics and Statistics
Chennai-6.
4. Name of the Survey National Sample Survey
5. Subject & Nature of the Survey 1. Drinking water,
sanitation,
hygiene and
housing
Socio Economic
Survey
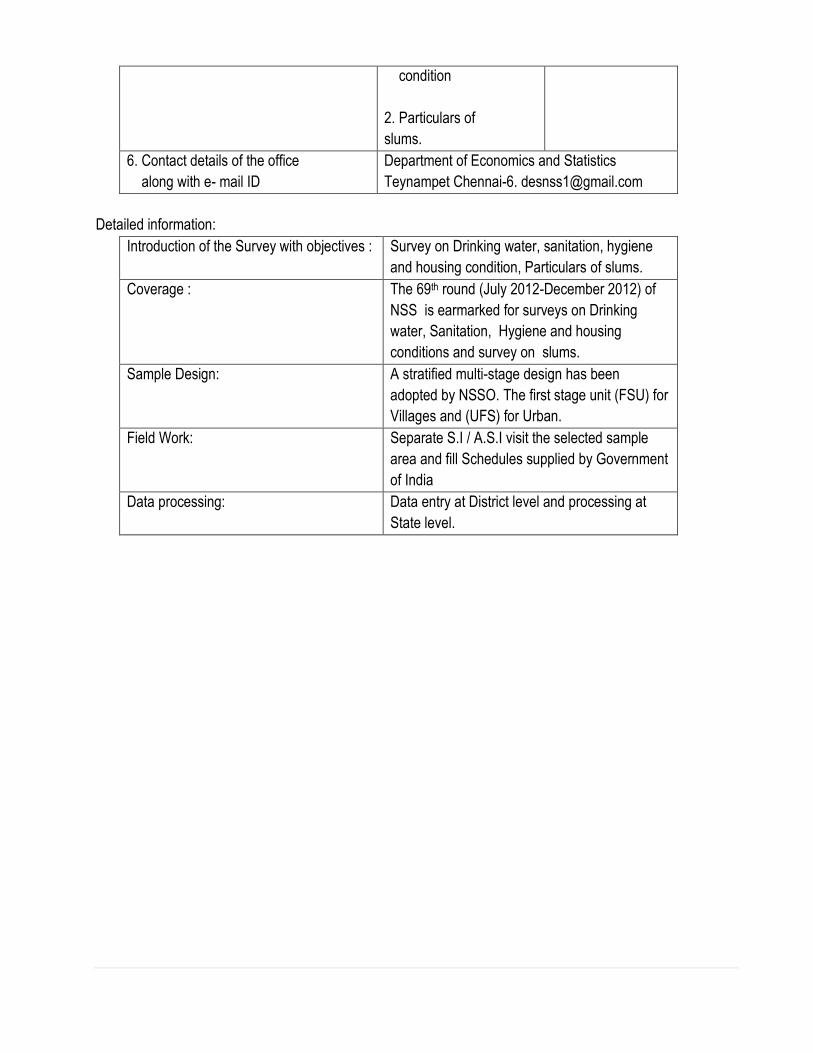
condition
2. Particulars of
slums.
6. Contact details of the office
along with e- mail ID
Department of Economics and Statistics
Teynampet Chennai-6. [email protected]
Detailed information:
Introduction of the Survey with objectives :
Survey on Drinking water, sanitation, hygiene
and housing condition, Particulars of slums.
Coverage :
The 69th round (July 2012-December 2012) of
NSS is earmarked for surveys on Drinking
water, Sanitation, Hygiene and housing
conditions and survey on slums.
Sample Design:
A stratified multi-stage design has been
adopted by NSSO. The first stage unit (FSU) for
Villages and (UFS) for Urban.
Field Work:
Separate S.I / A.S.I visit the selected sample
area and fill Schedules supplied by Government
of India
Data processing:
Data entry at District level and processing at
State level.
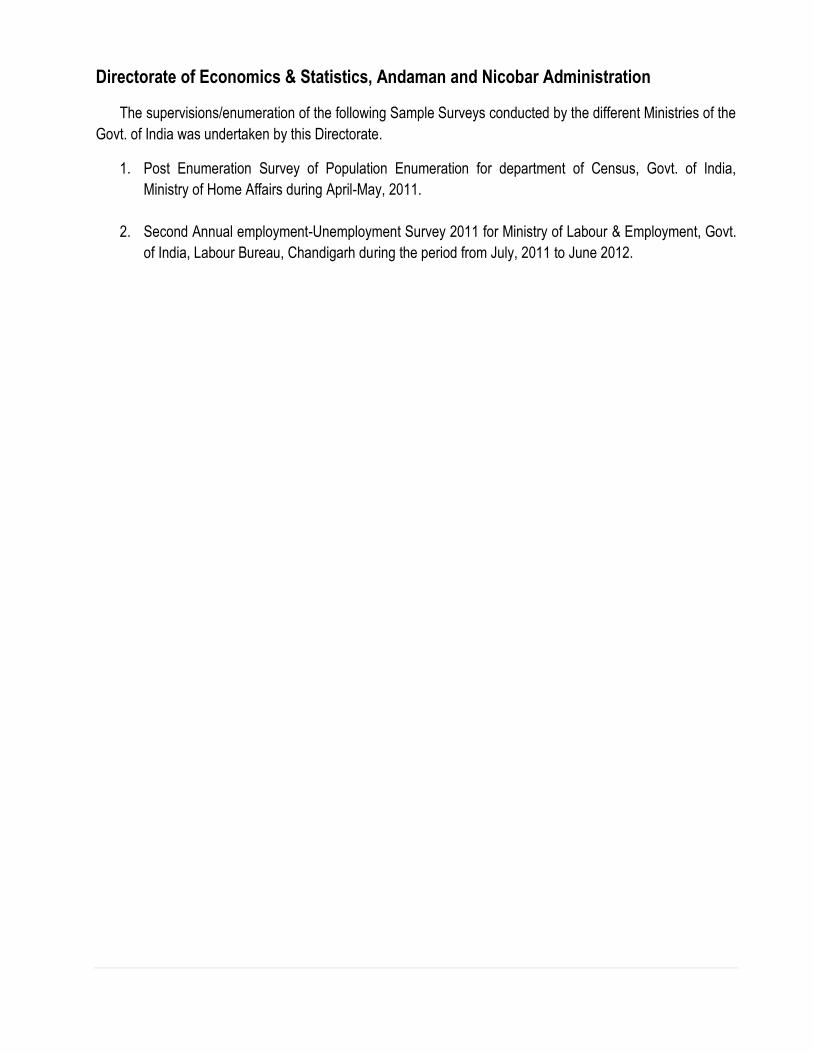
Directorate of Economics & Statistics, Andaman and Nicobar Administration
The supervisions/enumeration of the following Sample Surveys conducted by the different Ministries of the
Govt. of India was undertaken by this Directorate.
1. Post Enumeration Survey of Population Enumeration for department of Census, Govt. of India,
Ministry of Home Affairs during April-May, 2011.
2. Second Annual employment-Unemployment Survey 2011 for Ministry of Labour & Employment, Govt.
of India, Labour Bureau, Chandigarh during the period from July, 2011 to June 2012.
Union Territory of Dadra and Nagar Haveli
SAMPLE SURVEYS DURING 2009-10
1. Year/Month of initiation : 1971-72
2. Year/month of completion (if completed) : Not applicable.
3. Name of the Executing office/Organization :Department of Planning &Statistics
4. Name of Survey :Crop Estimation Survey of Kharif crops (Paddy and
Ragi)
5. Subject & Nature of the survey : To estimate the average yield and total
Production of the two major Kharifcrps (Paddy and
ragi) in the Union Territory.
6. Contact details of the office along with
e-mal id : Shri U.R. Vyas,Asstt.Director (Plg. & Stat.)
Administration of Dadra and Nagar Haveli,
2nd Floor, Secretariat,
Silvassa-396230.
Ph.No. & Fax No. (o260)-2642985
e-mail id: [email protected]
Detailed information :
- Introduction of the survey with objectives:
Crop Estimation Survey of Kharifcrops(Paddy and Ragi). The survey is conducted every year to
estimate the average yield and total production of the two major Kharif crops (Paddy and Ragi) in the
Union territory. There are 72 villages in the U.T but survey is restricted to 70 villages as area of two
villages is submerged due to Damanaganga Reservoir Project.
Coverage
Size of plot being selected is 5 mts x 5 mts.Selection of Survey number/plot –hissa and plot
marking have been made at a time. Keeping in view the available infrastructure total 152
experiments are planned in such a way that 2 experiments per crop per village are conducted.
The random sampling technique is adopted for the survey. As a first size stratum and the
requisite number of sample villages are selected by simple sampling without replacement. The
second stage stratum of the design is the selection of the survey number (i.e. plot-hissa) by
random method. While the selected plot of 5 mts.x5 mts. is the third stage stratum, for which
random number applicable to the former was referred to.
Sampling Design:
Out of 70 villages 39 villages selected, 55.71% of the total villages, which are considered
common for both the paddy and ragi crops under the survey. Size of plot being slected since 1971-72
is 5 mts.x5mts.
Field Work:
For the work of field enumeration, 21 enumerators i.e. Patel Talaties( Revenue Department) and
the Gram Sevaks ( Development & Planning Department0 are appointed, for the work of
supervision 9 supervisors i.e. investigators and Statistical Asstt. From the Statistical cadre are
appointed under the overall supervision of the Asstt. Director (Planning & Statistics), DNH,
Silvassa. The period of Survey is Septemher-2009 to December, 2009.
Data Processing:
After completion of field work all filed in schedules are scrutinized and data entry made at H.Q.
Different Tables are generated and U.T level Tables in consolidated form are submitted in N.S.S.O.,
FOD, Faridabad.
Major Findings:
No Major finding observed up to last year. The current year data is yet to be compiled.
List of Source Agencies, which have sent NIL reply in respect of Sample Surveys:
1. Directorate of Economics & Statistics (DES), Delhi
2. Ministry of Chemicals & Fertilizers, New Delhi
3. Ministry of Finance, Department of Revenue , New Delhi
4. Ministry of Road Transport & Highway, New Delhi
5. Director Economics & Statistics (DES), Jharkhand
6. Directorate of Agriculture, Meghalaya
7. Director Economics & Statistics, Chandigarh Administration
8. Director Economics & Statistics , Andaman & Nicobar Administration
9. Ministry/o Tourism, New Delhi
10. Health & Family Welfare Training Centre, Karnataka
11. Ministry of Mines, Indian Bureau of Mines, Nagpur
12. Ministry of Communication & Information Technology, New Delhi
13. Central Water Commission, New Delhi
14. Directorate of Economics & Statistics, Rajasthan
15. Planning, Programme Monitoring and Statistics Department Karnataka
16. Labour Bureau, Haryana Chandigarh
17. Tariff Commission, New Delhi
18. Directorate of Mines & Geology, Goa
19. Office of the Director of Health Services, Meghalaya
20. Directorate Of Evaluation Organisation, Rajasthan
21. Directorate of Economics & Statistics, Andhra Pradesh
22. Directorate of Planning & Statistics, Lakshadweep
23. Directorate Of Textiles, Nagpur, Maharashtra
24. Directorate of Industry & Commerce, Thiruvananthapuram
25. Tamil Nadu, Forest Department
26. Office of the Commissioner of Labour, Gandhinagar Gujarat
27. University of Kashmir, Srinagar
******************
Officials associated with the publication:
Shri A.K . Mehra,
Additional Director General
Shri R.K. Khurana,
Deputy Director General
Smt. Pravin Horo Singh,
Director
Shri Nitish Kumar
Joint Director
Shri P.K. Srivastava
Deputy Director
Shri D.P. Dhugga
Assistant Director
Ms. Chavi Maheshwari
Statistical Investigator Gr. II