discussion papers in economics - university of york · pdf filediscussion papers in economics...
TRANSCRIPT

Discussion Papers in Economics
Department of Economics and Related Studies
University of York
Heslington
York, YO10 5DD
No. 14/03
Optimal Price-Setting in Pay for Performance
Schemes in Health Care
Søren Rud Kristensen, Luigi Siciliani
and Matt Sutton


*Corresponding author: Manchester Centre for Health Economics, University of Manchester, Oxford Road, Manchester M13 9PL, United Kingdom. Tel.: +44 161 275 5846. Email address: [email protected]
Optimal Price-Setting in Pay for Performance Schemes
in Health Care
Søren Rud Kristensen1,* Luigi Siciliani2 Matt Sutton1
1Manchester Centre for Health Economics, University of Manchester, United Kingdom
2Department of Economics and Related Studies, University of York, United Kingdom
Abstract
The increased availability of process measures implies that quality of care is in some
areas de facto verifiable. Optimal price-setting for verifiable quality is well-described in
the incentive-design literature. We seek to narrow the large gap between actual price-
setting behaviour in Pay-For-Performance schemes and the incentive literature. We
present a model for setting prices for process measures of quality and show that
optimal prices should reflect the marginal benefit of health gains, providers’ altruism
and the opportunity cost of public funds. We derive optimal prices for processes
incentivised in the Best Practice Tariffs for emergency stroke care in the English
National Health Service. Based on published estimates, we compare these to the prices
set by the English Department of Health. We find that actual tariffs were lower than
optimal, relied on an implausibly high level of altruism, or implied a lower social value
of health gains than previously used.
Keywords: Pay For Performance; provider behaviour; optimal price-setting.
JEL: D82, I11, I18, L51

2
1 Introduction
Pay for performance (P4P) schemes link provider payments to performance indicators of
quality. They receive much attention from both policy makers and scholars. The empirical
evidence on the effectiveness of P4P is mixed. However, there is an emerging consensus that the
key to effective P4P schemes is in their design elements (Epstein, 2012; Maynard, 2012; Roland,
2012). These design elements include who to pay, what to pay for, the criteria for bonuses or
penalties and how much to pay for each unit of increase in quality (Ryan, 2009).
The size of the performance payments (i.e. the price, or the ‘power’ of the incentive scheme) is
obviously critical, but has received surprisingly little attention in the applied literature. It has
been treated mainly as an empirical question in ex-post evaluations of implemented schemes
rather than as a key parameter that could be set optimally on the basis of economic theory. In an
early review of the effects of P4P, Petersen et al. (2006, p. 269) stated that the "[s]ize of the
bonus is probably also important [our emphasis]" and suggested that "the lack of effect or small
effect in some studies may include the small size of the bonus [our emphasis]".
Normative statements about the size of incentive payments in the literature on design choices
have been extremely vague. For example, Conrad and Perry (2009 p. 361) suggested that the
optimal incentive size should "follow the Goldilocks principle: not too little, but not too much",
while Eijkenaar (2013 p. 124) stated that "[a]ll else equal, the higher the revenue potential for
providers, the larger their response and the impact on performance, up to a certain point".
Empirically, the size of incentive payments is often measured as a percentage of provider
income. For example, the largest hospital P4P scheme in the US (the Premier Hospital Quality
Incentives Demonstration (HQID) program) set bonuses and penalties as percentages (1-2%) of
Medicare revenue (Das and Anderson, 2007). Similarly, the English adaptation, Advancing
Quality, set bonuses of 2-4% of revenue for the associated activities (Sutton et al., 2012), and
the Commissioning for Quality and Innovation framework determined that 0.5% in the first year
rising to 2.5% of provider income be tied to performance on locally selected performance
indicators (Kristensen et al., 2013). In their review of the literature, Conrad and Perry (2009)
found that incentive sizes in the US varied between 2-9% of provider income.
Setting incentive payments relative to revenue is not necessarily meaningful from an incentive
perspective. Rather, as we emphasize in this paper, a regulator should focus on the expected
health gains of improved performance and the costs of these performance improvements when
setting payments for performance. An extensive theoretical regulation literature has
investigated how to set optimal prices when health care is verifiable (Chalkley and Malcomson,

3
1998a, 1998b; Ellis and McGuire, 1986; Holmstrom and Milgrom, 1991; Kaarboe and Siciliani,
2011; Laffont and Tirole, 1993). The key insight is that price should be set equal to the marginal
benefit of health care (discounted downwards for the opportunity cost of public funds and for
altruistic motives of the provider; Ellis and McGuire, 1986; Chalkley and Malcomson, 1998a and
1998b). Given the large increase in availability of indicators of quality, the assumption that
many dimensions of quality are verifiable is not unreasonable in many areas of care (Eggleston,
2005; Goddard et al., 2000; Kaarboe and Siciliani, 2011). If quality is verifiable, it is still the case
that the optimal price should be basically set equal to the (adjusted) marginal benefit of the
verifiable quality (Kaarboe and Siciliani, 2011).
The literature on optimal price-setting is however purely theoretical, and no attempt has been
made to compare the derived optimal price solutions with incentive schemes implemented in
practice. This may explain why the optimal price-setting literature appears to have been
neglected by the practical P4P literature.
The aim of this paper is to bridge the gap between the theory and the applied literature. We
provide a theory model of price-setting for P4P schemes, and compare it with the actual
implementation of such a scheme. Our example of actual price-setting behaviour is the Best
Practice Tariffs (BPT) scheme for emergency stroke—a national P4P scheme introduced in the
English NHS from 2010/11. This is now the main vehicle for supplementing activity-based
tariffs with performance related payments in the English NHS. We therefore build a theoretical
model whose key assumptions match this scheme closely. The main feature of our model is that
optimal prices should reflect the marginal benefit of the health gain associated with the
incentivised dimensions of care. For our implementation, we searched the published literature
for estimates of the QALY gains associated with the incentivised dimensions of care (treatment
in an acute stroke unit, rapid brain imaging, and thrombolysis with alteplase). Using a monetary
social value of a QALY of £50,000 (previously used by the English Department of Health), we
show how the optimal prices depend on the assumed level of provider altruism and the
opportunity cost of public funds.
The key insight is that the optimal price predicted by the theory is generally significantly higher
than the actual one. For the price adopted by the scheme to be optimal the degree of altruism
would have to be implausibly high or the opportunity cost of public funds implausibly high.
Alternatively, the marginal evaluation of the health benefits of quality would have to be
implausibly low, at least lower than previously used by the English Department of Health. The
framework presented here bridges the gap between theory and the actual implementation of

4
P4P schemes and can be used to improve scholars’ and policymakers’ thinking about price-
setting for quality.
The paper is organised as follows. In Section 2 we describe the context and background for our
model. In Section 3 we provide a theory model for optimal tariff setting in a context similar to
BPT, i.e. aimed at incentivising processes of health care for emergency stroke treatment. In
Section 4 we simulate the theoretical model numerically and compare the result with the actual
price set in the BPT incentive scheme. We end the paper with a discussion of our key results.
2 Background
In this section we review the information needed to setup a model that matches the key
assumptions of the English BPT scheme including the financial incentives for quality before and
after the scheme (section 2.1), the verifiability of emergency stroke care quality (Section 2.2),
the details of the BPT scheme (section 2.3) and provider performance on the incentivised
dimensions of care before the BPT scheme (Section 2.4).
2.1 Financial incentives for quality in the English NHS
Secondary care in the English National Health Service (NHS) is provided through an internal
market in which 211 Clinical Commissioning Groups (CCGs) have the responsibility of
commissioning health care for their populations from 160 Acute NHS trusts (henceforth termed
“providers”).
The Payment by Results (PbR) framework links hospital reimbursement to activity through a
fixed tariff per admission. Hospital activity is classified into a manageable number of
homogenous, clinically-meaningful healthcare resource groups (HRGs) – the English equivalent
of diagnosis related groups (DRGs). The tariff or price paid per HRG is usually set equal to the
national average cost of treating patients in a given HRG. The Best Practice Tariffs analysed in
this paper represent a deviation from this rule (Department of Health, 2012a).
Reimbursing hospitals on the basis of the average costs has been theoretically shown to provide
incentives for efficiency through cost reductions (Shleifer, 1985). If patient demand does not
reflect quality it has been argued that these cost containment incentives may adversely affect
the level of quality provided (Chalkley and Malcomson, 1998a). If quality is verifiable, however,
a regulator can achieve the desired level of quality through contracting.
The Best Practice Tariffs (BPT) analysed in this paper can be seen as an attempt to include
verifiable dimensions of quality into the agreements between commissioners and providers.
BPTs were first introduced in the English NHS from April 2010 for four conditions. This was

5
extended in the following years, and from 2013/14 BPTs cover more than 50 care procedures
(Department of Health, 2013). BPTs are tariffs that have been "structured and priced to
adequately reimburse and incentivise care that is high quality and cost effective" (Department
of Health, 2013, p. 61). This aim is pursued using a number of different pricing regimes, of
which we will focus on the payment regime known as Paying For Best Practice. This regime is
similar to the most common type of P4P today, in which health care providers are paid on the
basis of their performance on process measures of quality that are assumed to be linked to
better outcomes.
In the financial year (FY) 2013-14 the Paying for Best Practice model was used for four different
conditions: emergency stroke care; diabetic ketoacidosis and hypoglycaemia; fragility hip
fracture; and transient ischaemic attack (TIA/mini-stroke1). This pricing model consists of a
base payment for all admissions, plus one or more additional payments conditional on
performance. In this paper we focus on the performance indicators for emergency stroke care.
2.2 The verifiability of emergency stroke care quality
Stroke is the second most common cause of death in the world, causing 10-12% of deaths in the
western world (Donnan et al., 2008). The estimated total societal costs of stroke in the UK is £9
billion per year, including approximately £4 billion direct treatment costs, meaning that stroke
treatment costs make up 5% of total UK NHS costs (Saka et al., 2009). Townsend et al. (2012)
estimated that there were a total of 125,945 stroke incidences in England in 2009, while NHS
England (2013), using a narrower definition of stroke, estimated that the median provider
admitted about 400 stroke patients in 2012-13.
Stroke has been described as a “brain attack” and is caused by a disturbance in the blood supply
to the brain. The most common type of stroke is ischaemic stroke (representing approximately
80% of emergency strokes). Ischaemic strokes are caused by a blood clot narrowing or blocking
the blood supply to the brain leading to the death of brain cells due to lack of oxygen. The less
common haemorrhagic stroke is caused by a bursting of blood vessels leading to damaging
bleeding into the brain (Department of Health, 2007a).
Untreated stroke typically leads to a loss of 1.9 million neurons (brain cells) per minute, so
stroke treatment should be initiated as early as possible (Department of Health, 2007a). The
appropriate treatment of stroke depends on whether the stroke is ischaemic or haemorrhagic,
which can be determined by an experienced health care professional on the basis of either a
computed tomography (CT) scan or magnetic resonance imaging (MRI). If the stroke is
ischaemic, within 4.5 hours from the stroke, an attempt can be made to dissolve the blood clot
medically in a procedure known as thrombolysis with alteplase. It is of key importance that

6
alteplase is not administered to patients with an haemorrhagic stroke, in which case the
treatment could be fatal.
There is good clinical consensus on what constitutes high quality care for emergency stroke
patients. In England, National Clinical Guidelines for Stroke were first published in 2000 and
have recently been published in their fourth edition (Intercollegiate Stroke Working Party,
2012). The Department of Health published a National Stroke Strategy in 2007 (Department of
Health, 2007a). The National Institute for Health and Care Excellence published a guideline for
interventions in the acute stage of stroke and transient ischaemic attack (TIA) in 2008 based on
clinical and economic evidence and expert consensus (National Collaborating Centre for Chronic
Conditions, 2008) This was backed up by publication of a quality standard in 2010 (NICE, 2010)
and a NICE pathway—a visual representation of the NICE guidelines and quality statements in
the form of online interactive topic-based diagrams.
In addition, the verifiability of stroke care quality is high and increasing. Until recently, biennial
(The National Sentinel Stroke Audit (NSSA) published from 1998 to 2010), and quarterly (The
Stroke Improvement National Audit Programme (SINAP) from 2010 to 2012) reports
monitored the quality of stroke on a range of key indicators for samples of patients. The
Sentinel Stroke National Audit Programme (SSNAP), for which data collection started in 2012,
will provide a minimum dataset with process and outcome data for all stroke patients in
England, Wales and Northern Ireland which include the indicators on the NICE quality standard
and the NHS Outcomes Framework.
The detailed coverage of all patients means that emergency stroke care can now reasonably be
assumed to be fully verifiable in some key quality dimensions which, in principle, allows for
very detailed contracts to be written. Notably, the National Clinical Guideline for stroke contains
recommendations for Clinical Commissioning Groups (CCGs) on how to commission stroke care.
2.3 Best practice tariffs for emergency stroke
The BPT for stroke uses the high verifiability of stroke care quality to include quality in the
contract arrangements between purchasers and providers. The BPTs for stroke are designed
with the intention of supporting the key components of clinical best practice in the acute phase
of the stroke following the recommendations of the NICE clinical guidelines and the National
Stroke Strategy. Specifically the tariffs incentivise the treatment of patients in an acute stroke
unit, rapid performance of brain imaging and administration of thrombolysis, if appropriate.
The tariffs are designed as a base tariff paid for all stroke patients irrespective of performance,
and extra performance payments for a) rapid brain imaging, b) treating the patient in an acute
7
stroke unit, and 3) alteplase (see table A.1 for a full description of the indicators). Alteplase was
already paid for separately on top of the stroke tariff from 2008/09 and was not formally
considered a part of the BPT scheme in the first two years of the programme. From 2012/13 the
level of the separate alteplase payment was kept the same but considered a part of the BPT for
emergency stroke.
2.4 Provider performance on the incentivised dimensions of stroke care quality
There is no set of indicators available that exactly match hospitals’ performance on the
indicators incentivised in the BPT scheme before and after its implementation. In the following,
we describe performance on some indicators related to the incentivised dimensions of care. We
do not attempt to evaluate whether improvements in performance after the introduction of BPT
are attributable to the introduction of the P4P scheme. An earlier evaluation did not find this to
be the case (McDonald et al., 2012).
2.4.1 Stroke care delivered in an acute stroke unit
In 2008, 59% of English patients spend at least 90% of their time on a stroke unit according to
the NSSA (Royal College of Physicians, 2011, 2009). The number increased to 62% in 2010.
Column 2 of Table 1 shows that this increase continued steadily over time. There is however,
sign of a stabilisation around 85% towards the end of the period, which possibly reflects
capacity constrains with the current level of acute stroke units. Note that the definition of stroke
unit used for these data is broader than what is required to satisfy the requirement for the BPT
(the BPT incentivises admission to acute stroke unit as defined in Table A.1).
2.4.2 Rapid Brain Imaging
According to the NSSA (Royal College of Physicians, 2011, 2009, 2007), the percentage of
patients who had a brain scan carried out within 24 hours from arrival at hospital increased
from 42% in 2006 to 59% in 2008 and to 70% in 2010. The percentage of patients who had a
brain scan carried out within 3 hours increased from 9% in 2007 to 21% in 2008 and 25% in
2010. Columns 3—5 of Table 1 show some continued improvement in scanning times, but again,
especially for a scan within 24 hours of arrival, performance seems to stagnate at around 90%
of patients scanned within this time. Note however, that these numbers do not provide
information as to whether all patients eligible according to the brain imaging guide incentivised
by the BPT were scanned as quickly as possible.
2.4.3 Thrombolysis by alteplase
Column 6 of Table 1 shows an increase in the proportion of patients eligible for thrombolysis
who are thrombolysed, although the increase was most rapid in the first three quarters. Due to

8
the non-mandatory participation in SINAP, the estimates could be biased by selection into the
SINAP audit on which these numbers are based.
Table 1: Hospital performance on indicators close to the quality dimensions incentivised by Best Practice tariffs
Financial year and quarter
% of patients
that spend at least 90% of
time on a stroke unita
% of patients who receive a
brain scan within Median time (minutes) between
arrival and first brain
scan
% of patients eligible for
thrombolysis who are
thrombolised
1 hour 24 hours
2011-12 Q1 80 25 82 218 44 2011-12 Q2 84 28 86 237 49 2011-12 Q3 85 31 90 208 60 2011-12 Q4 83 31 91 196 58 2012-13 Q1 86 34 91 157 64 2012-13 Q2 87 36 92 135 63 2012-13 Q3 86 37 92 129 65 Source: The Intercollegiate Stroke Working Party (2013) and NHS England (2013) Note: a) These data relate to the broad definition of stroke units, not the narrower definition of acute stroke units (See table A.2 for definitions)
3 A model for optimal price-setting for verifiable quality
In this section we present a model of optimal price-setting in a context similar to the BPT for
emergency stroke. That is, we focus on price-setting for verifiable process indicators of quality
for emergency care.
3.1 The provider
We assume that each provider receives a basic tariff p0 for every patient admitted with a stroke.
The number of patients admitted with a stroke is assumed to be exogenous since strokes
require emergency treatment.
Providers provide four different dimensions of services to stroke patients where the type of
care is denoted with i=0,1,2,3. We assume that three out of four are incentivised (when i=1,2,3).
Type 0 can be interpreted as the basic care which is provided to all patients. The provider
receives three additional payments p1, p2 and p3 for three incentivised dimensions of care: rapid
brain imaging (type 1), thrombolysis with alteplase (type 2) and delivery in an acute stroke unit
(type 3). The number of services provided in each dimension of quality is Ni ≤ N0 (note that this

9
may differ from the number of patients since a patient may receive more than one service; see
below). The revenues of the hospitals are therefore
∑
.
The cost function of each service i is ( ) with >0, ( ) , ( ) .
is a fixed cost (for example the fixed cost of setting up a stroke unit or the fixed cost
associated to an MRI machine). is a constant marginal-cost component (for example the unit
cost of administering alteplase or unit cost of a CT scan). ( ) includes monetary and non-
monetary costs of providing the service. The increasing marginal cost assumption is justified by
capacity constraints on beds and the fixed number of personnel of the hospital.
We assume that the total cost is additively separable. The total cost function is
∑ ( )
,
and the financial surplus is equal to π=R-C.
Patient benefits depend on the services received. There are potentially 8 possible combinations
of types of care that a patient could receive: basic services (type 0), basic services and rapid
brain imaging (type 1), basic and thrombolysis with alteplase (type 2), basic and delivery in an
acute stroke unit (type 3), basic services, rapid brain imaging and thrombolysis with alteplase
(denoted with type 12), basic services, rapid brain imaging and delivery in stroke unit (denoted
with type 13), basic services, thrombolysis with alteplase and delivery in an acute stroke unit
(denoted with type 23), basic services, rapid brain imaging, thrombolysis with alteplase and
delivery in an acute stroke unit (denoted with type 123).
Alteplase administered to patients with an haemorrhagic stroke could be fatal. Hence, the drug
should not be given without conducting rapid brain imaging first. We therefore ignore types 2
and 23. We assume that patients’ benefit from basic care is and that the additional benefit
(on top of the benefit from basic care) from each of the five residual combinations of services is
with i = 1, 3, 12, 13, 123. Moreover, we assume that the additional benefit from delivery in an
acute stroke unit is separable so that and .
Define as the number of patients for each of the six possible combinations of services (with i
= 0, 1, 3, 12, 13, 123). The total benefit for patients, denoted with B, is
,

10
which can be re-written more succinctly in terms of number of services provided :
where
In words, every patient receives the basic care. patients receive brain imaging,
patients benefit from delivery in a stroke unit. patients receive both brain imaging and
alteplase.
Providers are assumed to be altruistic and care about patients’ benefit. We capture altruism
with the parameter α. We assume that the provider’s utility is separable and additive in profits
and the altruistic component:
U = α B + π,
which is in line with previous literature (Ellis and McGuire, 1986; Chalkley and Malcomson,
1998a).
The provider chooses the amount of services for each type of care to maximise providers’
utility U. Note that the provider does not chose because this is exogenous (the number of
emergency patients admitted as stroke) but can chose to give the additional services (rapid
brain imaging, alteplase and admission to acute stroke unit).
The optimality (first-order) conditions for the three incentivised services are:
(1)
(2)
(3)
The marginal benefit from the altruistic component and price is equated to the marginal cost.
The second order conditions are given by ( ) A higher price or more altruism
increase the number services provided. Note that the variable cost of alteplase ( ) also
includes the cost of imaging.
3.2 The regulator
We assume that the regulator is utilitarian. It maximises the sum of patients’ benefit net of
transfers to the provider and the utility of the provider, B-(1+ λ) R+U, where λ>0 accounts for
the opportunity cost of public funds.

11
Substituting for U, we obtain B(1+ α) - C - λ R. It has been argued (e.g. Chalkley and Malcomson
(1998a); Hammond (1987)) that this specification leads to double-counting of the benefits,
which is due to altruistic motives. Following this suggestion, we eliminate double-counting and
assume that welfare is given by W = B - C - λR. This expression is intuitive. It gives the difference
between patients’ benefits and provider costs minus the cost associated with raising public
funds.
We assume that the purchaser designs the optimal contract subject to (i) a participation
constraint of the provider, U≥0; and (ii) a profit constraint, π≥0. Since the provider is altruistic,
the first constraint is always satisfied when the profit constraint is satisfied. Since leaving a
profit to the provider is costly for welfare (due to the assumption of positive opportunity costs
of public funds), it is optimal to set π=0 and R=C. The welfare function reduces to W = B – (1+ λ)
C.
The optimality (first-order) condition for is from the purchaser’s perspective such that:
( ) i=1…3, (4)
where f denotes first best. This suggests that the optimal number of services is such that
patients’ benefits equate to marginal costs.
3.3 Implementation
In the following we assume that the regulator sets prices only on the three incentivised services.
We take the number of incentivised dimensions of quality as exogenous. Notice that since costs
and benefits of different services are separable, the optimal price for each incentivised service
can be investigated in isolation.
Comparing the optimality conditions for the provider and the purchaser, we derive the optimal
prices:
( ) (5)
[ ( )] (6)
( ) (7)
The optimal price is equal to patients’ benefits discounted by altruism. When altruism is higher,
the regulator needs to incentivise the provider less. A higher opportunity cost of public funds
implies a lower optimal price.

12
Moreover, from the profit constraint which has to be satisfied with strict equality, we can
compute the basic tariff
{∑ ( )
∑
} . (8)
This condition simply states that the basic tariff is equal to the average cost net of other
transfers to the provider.
4 Comparing actual and optimal price-setting in BPT for emergency stroke
In this section we describe the implementation of our proposed (optimal) price-setting scheme,
and the actual one adopted by the Department of Health. We then compare the actual tariff with
the optimal tariff.
4.1 Optimal price-setting for Best Practice Tariffs for emergency stroke
4.1.1 Information requirements
Equations (5-7) show that setting the optimal tariff requires knowledge of the marginal benefit
of the incentivised dimension of care, the providers’ level of altruism, the opportunity cost of
public funds, and the cost of the incentivised process of care. We illustrate our results for a
range of levels of altruism and opportunity costs of public funds. In the following we focus on
obtaining plausible estimates for the marginal benefits of the three processes incentivised in the
three BPTs for emergency stroke. For assessing the marginal benefit of the interventions
incentivised by the BPT we use Quality Adjusted Life Years (QALYs). As the BPT performance
indicators for stroke are all based on clinical evidence, we searched the medical literature
behind the national clinical guidelines and NICE guidance to find estimates of the per-patient
QALY gains associated with the incentivised interventions.
We focus on studies that present estimates of per-patient QALY gains as close as possible to the
counterfactual treatment, i.e. the type of care an NHS patient would have received without the
incentivized process of care. Where possible, we sought studies with a lifetime perspective on
the benefits associated with the incentivised dimensions of care. We adopt the monetary social
value of a QALY most often used by the Department of Health in its policy Impact Assessments
of £50,0002 (Shah et al., 2012).
4.1.2 Marginal benefit of treatment delivered in an acute stroke unit
Saka et al. (2009b) used data from the South London Stroke Register and Markov modelling to
assess the 10-year cost-effectiveness of emergency stroke care in a general medical ward
compared to stroke unit care3. The study found an incremental QALY gain per patient of 0.472
13
QALYs associated with care in a stroke unit. As the time horizon of the study was restricted to
10 years and the average age of patients was 64 years, the QALY gain of treating patients in a
stroke unit rather than in a general ward is potentially larger.
4.1.3 Marginal benefit of rapid brain Imaging
Wardlaw et al. (2004) used a decision tree and a deterministic model to compare the cost
effectiveness of 12 different CT-scanning strategies.4 Usual care at the time of the study was to
scan all patients within 48 hours. The strategy included in the study that was most similar to the
strategy incentivized by the BPT was to “scan patients on anticoagulants, in life-threatening
condition, or candidates for thrombolysis immediately, and scan all remaining patients within
24 hours”. This strategy was associated with a gain of just 0.1 QALYs per 1,000 patients over a
five-year period compared to usual care. Wardlaw et al. (2004) justified the seemingly low
QALY gain by the high proportion of haemorrhagic stroke patients (85%) in the study
population, for whom the main treatment strategy is aspirin which only needs to be given
within 48 hours. The study assumed that just 4% of patients would reach the hospital in time to
be considered for thrombolysis, and suggested that the cost effectiveness of scanning all
patients immediately would be higher if the proportion of potentially-eligible patients was
higher.
4.1.4 Marginal benefit of thrombolysis with alteplase if clinically indicated
A deterministic cost-effectiveness analysis based on a Markov modelling simulation study of
patients with emergency ischaemic stroke receiving alteplase within 4.5 hours of onset of
symptoms (NICE, 2012) found an incremental per-patient gain of 0.333 QALYs from alteplase
treatment.5 The probabilistic cost-effectiveness analysis from the same study suggested an
estimated 0.29 QALY gain. The study considered lifetime effects of treatment, assuming no
change in health status after 12 months (other than death).
4.1.5 Marginal costs of incentivised processes
Ideally, we would use estimates of marginal costs, which according to our model depend on the
provider’s level of performance. For feasibility, we use instead average cost estimates from the
literature, which we assume to reflect the marginal cost at the average level of performance.
For admission to a stroke unit we use the per-patient per-diem costs reported by Saka et al.
(2009). Multiplying the difference in costs between the stroke unit (£164.80 per day) and the
general ward (£114.80 per day) by the average length of stay (34.4 days) yields a per-patient
marginal cost of treatment in an stroke unit of £1,720. Note that this price may be an
underestimate, since the BPT for emergency stroke requires patients to be admitted to an acute

14
stroke unit, which requires more potentially costly characteristics to be fulfilled (summarised in
Table A.1 and A.2).
We assume that the direct costs to providers of achieving the stroke BPT to scan patients within
24 hours are the additional costs relative to scanning all patients within 48 hours. Wardlaw et al
(2004) reported that the mean costs of a CT scan at 2000 prices were £43 in normal working
hours and £79 after hours. Their model suggested that the cost of CT scanning patients was £47
if required within 48 hours for all and was £71 if all patients were required to be scanned
immediately. We take the mid-point of these estimates as the per-patient cost of achieving a
scan within 24 hours for all patients (£59), and therefore the additional costs to the provider
per patient of achieving 24 hours compared to 48 hours is £12 (£59 minus £47).6 For
thrombolysis with alteplase we rely on the cost estimate from Saka et al. (2009) which reflects
the additional cost of administering alteplase including the cost of the drug.
4.2 Optimal price-setting in Best Practice tariffs for emergency stroke
In Figures 1-3 we present our implementation of the optimal best practice tariffs for emergency
stroke as described by Equations (5-7). The monetary values are provided in Tables A3-A5 in
the Appendix. In all three cases, the optimal price is highest when hospitals are purely profit-
maximising (altruism=0), and there is no opportunity cost of public funds ( =0). In this case, the
price should be set exactly equal to the marginal benefit associated with the incentivised
intervention. For example, the maximum optimal price for care in an emergency stroke unit is
£23,600, assuming a social value of a QALY of £50,000 and a per-patient gain of 0.472 QALYs.
The optimal price decreases as the level of altruism and the opportunity costs of public funds
increases. The results for altruism are intuitive. A higher level of altruism implies a lower
optimal tariff, as altruistic providers derive utility from patients’ benefit and therefore need less
of a financial incentive for performance. For treatment in an acute stroke unit and alteplase,
altruism matters relatively more, because the marginal benefit is substantially higher than the
cost of carrying out the intervention, while the opposite is the case for rapid brain imaging. A
fully-altruistic hospital takes into account the whole patients’ benefit, and therefore does not
need to be additionally incentivised for carrying out the intervention.
As shown in section 2.4, hospitals provided brain imaging, treatment in acute stroke units and
alteplase to some extent before the direct performance incentive was introduced, and it seems
reasonable to assume some level of altruism. Moreover, since not all patients received the three
services, it is reasonable that is strictly less than one. Also, the fact that the Department of
Health introduced the incentive scheme implies that the purchaser thought that the provider
was not sufficiently motivated (again a level of less than one).

15
Assuming a social value of a QALY of £50,000, and considering and , the
optimal price for treatment in an acute stroke unit lies in the interval [£640, £21,240]; the
optimal price for rapid brain imaging lies in the interval [£-11.5, £4.5]; and the optimal price for
alteplase lies in the interval [£915, £14,985].
Figure 1: Optimal performance payment (£) for treatment in an Acute Stroke Unit at different levels of altruism and opportunity cost of public funds

16
Figure 2: Optimal performance payment (£) for rapid brain imaging at different levels of altruism and opportunity cost of public funds
Figure 3: Optimal performance payment (£) for thrombolysis with alteplase at different levels of altruism and opportunity cost of public funds
4.3 Actual price-setting in Best Practice Tariffs for emergency stroke
When it introduced the BPT in the financial year 2010/11, the English Department of Health
explained that it wished to set prices “not just at the national average but instead to better
reflect the costs of delivering best practice,” with a built-in financial incentive “to encourage
uptake of best practice in the early stages.” The financial incentive was expected to be removed
in the future and “align[ed] … with the actual cost of best practice” (Department of Health,
2010a).

17
The tariffs and their development over time are described in Table 2. Initially there was two
base tariffs— AA22Z Non-Transient Stroke or Cerebrovascular Accident, nervous system infections
or encephalopathy and AA23ZZ Haemorrhagic Cerebrovascular Disorders. From 2013/14 new
groups were introduced for patients with and without complications and co-morbidities. Co-
morbidities are defined as “additional conditions that the patient might come into hospital with
that increase the complexity of the primary intervention” and complications as “events during
treatment that […] increase complexity” (Department of Health, 2012a, p. 22). The tariffs for
rapid brain imaging and treatment in an acute stroke unit doubled from year 1 to year 2 and
tripled from year 1 to year 3. At the same time, the base tariff was lowered. While the initial BPT
prices were calculated close to the costs of providing the service, the subsequent adjustments
were justified by a desire to increase the incentive for delivering best practice (Department of
Health, 2012b).
Table 2: Actual prices (£) for emergency stroke care and incentivised dimensions of quality 2009/10-2013/14
Component 2009/10 2010/11 2011/12 2012/13 2013/14 Base tariff
AA22Z 4,348 4,095 3,712 3,005 N/A AA22A N/A N/A N/A N/A 2,764 AA22B N/A N/A N/A N/A 2,851 AA23Z 4,411 4,158 3,579 2,987 N/A AA23A N/A N/A N/A N/A 1,764 AA23B N/A N/A N/A N/A 1,377 Additional BPTs
Rapid brain imaging
0 133 266 399 399
Treatment delivered in an acute stroke unit
0 342 684 1,026 1,026
Alteplase 828 828* 828* 828 828 Notes: AA22Z: Non-Transient Stroke or Cerebrovascular Accident, Nervous System Infections or Encephalopathy. AA23Z: Haemorrhagic Cerebrovascular Disorders. *A: with Co-morbidities and Complications (CC), *B: without CC Source: Payment by Result guidance for 2009/10-2013/14
4.4 Comparison of actual and optimal price-setting
The Department of Health description of the scheme suggests that BPT tariffs are mainly set as a
function of costs in combination with an added incentive that appears to be arbitrarily set.7
Compared to the optimal prices, the BPT tariffs set by the Department of Health for treatment in

18
an acute stroke unit and for alteplase appear to be (i) lower than optimal, or (ii) based on high
levels of altruism, or (iii) a reflection of a very high opportunity cost of public funds.
The current performance payment for treatment at an acute stroke unit is £1,026. This is
consistent with and which seems to imply very high levels of altruism and
opportunity cost of public funds.
For alteplase, at a QALY value of £50,000, the tariff of £828 is consistent with and .
Again rather high assumed levels of altruism and opportunity costs of public funds are required
to explain the current pricing level.
The performance payment for rapid brain imaging set by the Department of Health has tripled
from £133 when BPT was first introduced to £399 in 2013/14. This price is not consistent with
any positive levels of or in our framework which suggests low or even negative optimal
prices. This is because the major benefit of rapid brain imaging only arises for patients with an
ischaemic stroke who can subsequently be treated with alteplase, which has a high benefit for
these patients. Due to the high prevalence of ischaemic strokes (about 80%) and the high
expected benefit for ischaemic patients, the incentive payment for brain imaging need not be
very high.
Using experimental data from medical students acting as physicians, Godager and Wiesen
(2013) found considerable heterogeneity in physician altruism. The estimated mean altruism
was , which is still considerably lower compared to the level implied by the prices set by
the Department of Health. Although unincentivised performance levels imply some degree of
altruism, it seems unlikely that providers are as altruistic as the level of the BPTs implies.
Alternatively, the opportunity costs of public funds may be considerably higher than the [0,1]
range used in our calculations. Recently, Claxton et al. (2013) estimated that the marginal cost
of producing a QALY in the English NHS was £18,317. If the marginal benefit of a QALY is
£50,000, this implies an opportunity cost of public funds of 2.7. Even in that case, the stroke
unit price of £1,026 and the alteplase price of £399 are consistent with , which still
seems high given that the Department of Health found it necessary to introduce the BPT to
improve performance and compared to the empirical estimates from Godager and Wiesen
(2013).
Aside from brain-imaging, our results suggest that the current price-setting in the BPTs for
emergency stroke appear relatively low compared to the optimal price, and higher prices could
be welfare-improving.
19
5 Discussion and concluding remarks
This paper aims at bridging the gap between the theory and the practice of pay-for-performance
incentive schemes. Price-setting has been treated informally in practice with an emphasis of
incentive payments related to total revenue.
We have presented a model of optimal price-setting of process measures of performance for
stroke patients. We have compared the derived optimal price with the actual price set in the
English NHS as part of the Best Practice Tariffs scheme from 2010/11. The main features of our
model are that optimal prices should reflect the marginal benefit of the health gain associated
with the incentivised dimensions of care, the level of provider altruism and the opportunity cost
of public funds. In our implementation we have searched the medical literature for estimates of
QALY gains of the incentivised dimensions of care. Using a monetary social value of a QALY of
£50,000 (previously used by the Department of Health), we have described the optimal prices
for treatment in an acute stroke unit, rapid brain imaging, and thrombolysis with alteplase in
intervals depending on the assumed level of provider altruism and opportunity cost of public
funds. Overall, the model provides a framework for scholars and policymakers for thinking
about price-setting for quality from an incentive point of view.
Our key finding is that the tariff set by the Department of Health for the incentivised dimensions
of care are either lower than optimal or correspond to very high assumed levels of altruism or
opportunity cost of public funds.
We briefly discuss some limitations and avenues for further research. We have not considered
the potential multitasking problem with respect to unmonitored or unverifiable aspects of
quality of care. Although this cannot be excluded, the BTP incentive scheme covered all the key
quality dimensions, leaving little as unmonitored. Therefore, we do not think that allowing for
the minor dimensions of unmonitored quality would alter our key results. If minor unmonitored
aspects of quality were complements, then we would expect the optimal prices to be marginally
higher. Moreover, setting prices that take account of multitasking would require considerably
more information (in addition to the heavy information requirements already included in this
study), including the responsiveness of unmonitored quality to changes in prices for monitored
quality and the benefits and costs of changes in unmonitored quality.
We have focused on setting prices for process indicators. This is reasonable insofar as the vast
majority of performance indicators in current P4P programs measure processes with an
assumed relationship to outcomes. For example, this is true for the large hospital P4P scheme in

20
the US, the Premier Hospital Quality Incentives Demonstration (Jha et al., 2012; Lindenauer et
al., 2007) and the corresponding English Advancing Quality program (Sutton et al., 2012).
Even so, payers are frequently expressing a wish to move to more outcome based payment, and
our work could be extended to this setting as well. In this case, providers are free to choose
process of care, but are paid for improvements in outcomes only, which entails a transfer of
financial risk from the payer to the provider. In addition, the cost of an improvement in outcome
is unknown to the payer and cannot be used when setting the optimal price.
There is also a strong policy interest in introducing pay for performance schemes for drugs.
From 2014 the English NHS will implement so called Value-Based Pricing of pharmaceuticals
with the intention of linking drug prices to their cost effectiveness (Claxton et al., 2011;
Department of Health, 2011). Our model could be adapted for incentive schemes that involve
the pharmaceutical sector.
References
Chalkley, M., Malcomson, J.M., 1998a. Contracting for health services when patient demand does not reflect quality. Journal of Health Economics 17, 1–19.
Chalkley, M., Malcomson, J.M., 1998b. Contracting for Health Services with Unmonitored Quality. The Economic Journal 108, 1093–1110.
Claxton, K., Martin, S., Soares, M., Rice, N., Spackman, E., Hinde, S., Devlin, N., Smith, P.C., Schulper, M., 2013. Methods for the Estimation of the NICE Cost Effectiveness Threshold, CHE Research Paper 81. University of York - Centre for Health Economics, York.
Claxton, K., Sculpher, M., Carroll, S., 2011. Value-based pricing for pharmaceuticals: Its role, specification and prospects in a newly devolved NHS (Working Paper No. 060cherp). Centre for Health Economics, University of York.
Conrad, D.A., Perry, L., 2009. Quality-Based Financial Incentives in Health Care: Can We Improve Quality by Paying for It? Annu. Rev. Public. Health. 30, 357–371.
Das, K., Anderson, G., 2007. Premier Hospital Quality Incentive Demonstration. Health Policy Monitor.
Davis, S., Holmes, M., Simpson, E., Sutton, A., 2012. Alteplase for the treatment of acute ischaemic stroke (review of technology appraisal 122). School of Health and Related Research (ScHARR), The University of Sheffield, Sheffield.
Department of Health, 2007a. National Stroke Strategy. Department of Health, 2007b. Impact Assessment: National Stroke Strategy. London. Department of Health, 2008a. Impact Assessment: End of Life Care. London. Department of Health, 2008b. Implementing the National Stroke Strategy – an imaging guide.
London. Department of Health, 2010a. Payment by Results Guidance for 2010-11. Leeds. Department of Health, 2010b. Step-by-Step Guide: Calculating the 2010/11 National Tariff. Department of Health, 2011. A new value-based approach to the pricing of branded medicines:
Government response to consultation. London. Department of Health, 2012a. A simple guide to Payment by Results. Department of Health
Payment by Results team, London. Department of Health, 2012b. Payment by Results Guidance for 2012-13. Leeds. Department of Health, 2013. Payment by Results Guidance for 2013-14.
21
Donnan, G.A., Fisher, M., Macleod, M., Davis, S.M., 2008. Stroke. Lancet 371, 1612–1623. Eggleston, K., 2005. Multitasking and mixed systems for provider payment. Journal of Health
Economics 24, 211–223. Eijkenaar, F., 2013. Key issues in the design of pay for performance programs. Eur J Health Econ
14, 117–131. Ellis, R.P., McGuire, T.G., 1986. Provider behavior under prospective reimbursement : Cost
sharing and supply. Journal of Health Economics 5, 129–151. Epstein, A.M., 2012. Will Pay for Performance Improve Quality of Care? The Answer Is in the
Details. New England Journal of Medicine 367, 1852–1853. Godager, G., Wiesen, D., 2013. Profit or patients’ health benefit? Exploring the heterogeneity in
physician altruism. Journal of Health Economics 32, 1105–1116. Goddard, M., Mannion, R., Smith, P., 2000. Enhancing performance in health care: a theoretical
perspective on agency and the role of information. Health Economics 9, 95–107. Hammond, P., 1987. Altruism. The New Palgrave: A Dictionary of Economics. Macmillan, London
85–87. Holmstrom, B., Milgrom, P., 1991. Multitask Principal-Agent Analyses: Incentive Contracts, Asset
Ownership, and Job Design. Journal of Law, Economics, and Organization 7, 24. Intercollegiate Stroke Working Party, 2012. National clinical guideline for stroke. Royal College
of Physicians of London. Jha, A.K., Joynt, K.E., Orav, E.J., Epstein, A.M., 2012. The Long-Term Effect of Premier Pay for
Performance on Patient Outcomes. N Engl J Med. Kaarboe, O., Siciliani, L., 2011. Multitasking, quality and pay for performance. Health Economics,
Health Economics 20, 225–238. Kristensen, S.R., Mcdonald, R., Sutton, M., 2013. Should pay-for-performance schemes be locally
designed? Evidence from the commissioning for quality and innovation (CQUIN) framework. Journal of Health Services Research & Policy Forthcomming.
Laffont, J.J., Tirole, J., 1993. A theory of incentives in procurement and regulation. the MIT Press. Lindenauer, P.K., Remus, D., Roman, S., Rothberg, M.B., Benjamin, E.M., Ma, A., Bratzler, D.W.,
2007. Public reporting and pay for performance in hospital quality improvement. N Engl J Med 356, 486.
Maynard, A., 2012. The powers and pitfalls of payment for performance. Health Economics 21, 3–12.
McDonald, R., Zaidi, S., Todd, S., Konteh, F., Hussain, K., Roe, J., Allen, T., Fichera, E., Sutton, M., 2012. A Qualitative and Quantitative Evaluation of the Introduction of Best Practice Tariffs.
National Collaborating Centre for Chronic Conditions, 2008. Stroke: national clinical guideline for diagnosis and initial management of acute stroke and transient ischaemic attack (TIA). Royal College of Physicians, London.
NHS England, 2013. Integrated Performance Measures Monitoring. NICE, 2010. Stroke quality standard (QS2). NICE, 2012. Alteplase for treating acute ischaemic stroke (review of technology appraisal
guidance 122) (NICE technology appraisal guidance No. 264). Manchester. Petersen, L.A., Woodard, L.D., Urech, T., Daw, C., Sookanan, S., 2006. Does Pay-for-Performance
Improve the Quality of Health Care? Annals of Internal Medicine 145, 265–W71. Roland, M., 2012. Pay-for-Performance: Not a Magic Bullet. Ann Intern Med 157, 912–913. Royal College of Physicians, 2007. National Sentinel Stroke Audit Phase I (organisational audit)
2006 Phase II (clinical audit) 2006: Prepared on behalf of the Intercollegiate Working Party.
Royal College of Physicians, 2009. National Sentinel Stroke Audit Phase II (clinical audit) 2008: Prepared on behalf of the Intercollegiate Working Party.
Royal College of Physicians, 2011. National Sentinel Stroke Clinical Audit 2010 Round 7. Ryan, A., 2009. Hospital-based pay-for-performance in the United States. Health Economics 18,
1109–1113.

22
Saka, Ö., McGuire, A., Wolfe, C., 2009. Cost of stroke in the United Kingdom. Age Ageing 38, 27–32.
Shah, K., Praet, C., Devlin, N., Sussex, J., Appleby, J., Parkin, D., 2012. Is the aim of the English health care system to maximize QALYs? J Health Serv Res Policy 17, 157–163.
Shleifer, A., 1985. A theory of yardstick competition. RAND Journal of Economics 16, 319–327. Sutton, M., Nikolova, S., Boaden, R., Lester, H., McDonald, R., Roland, M., 2012. Reduced Mortality
with Hospital Pay for Performance in England. N Engl J Med 367, 1821–1828. The Intercollegiate Stroke Working Party, 2013. SINAP ‐ Combined Quarterly Public Report
(Quarters 1‐7). Wardlaw, J.M., Seymour, J., Cairns, J., Keir, S., Lewis, S., Sandercock, P., 2004. Immediate
Computed Tomography Scanning of Acute Stroke Is Cost-Effective and Improves Quality of Life. Stroke 35, 2477–2483.

23
Appendix
Table A.1: Best practice tariff for emergency stroke
BPT component Description
Stroke care
delivered within
an acute stroke
unit
Patients are admitted directly (intending to be within 4 hours of arrival in
hospital) to an acute stroke unit (Or similar facility where the patient can
expect to receive the service set out in quality marker 9 of the National
Stroke Strategy8) either by the ambulance service, from A&E or via brain
imaging. Patients should not be directly admitted to a Medical Assessment
Unit. Patients should then also spend the majority (Defined as greater than
or equal to 90% of the patient’s stay within the spell that groups to either
AA22Z or AA23Z) of their stay in the acute stroke unit.
Urgent brain
imaging for all
suitable patients
Initial brain imaging is delivered in accordance with best practice guidelines
as set out in Implementing the National Stroke Strategy – An Imaging Guide
(Department of Health, 2008b) . The scan should not only be done in these
timescales but immediately interpreted and acted upon by a suitably
experienced physician or radiologist. A CT scan should be undertaken
urgently if (a) indication for thrombolysis/anticoagulation (b) On
anticoagulants and/or known bleeding tendency (c) Depressed level of
consciousness (GCS<13) (d) Unexplained fluctuating or progressive
symptoms (e) Severe headache at onset (e) Papilloedema, neck stiffness,
fever. Otherwise a CT scan should be performed within 24 hours. An MRI
scan should be performed if (a) Diagnostic uncertainty after CT (e.g.
suspected non stroke pathology but unsure) (b) Atypical clinical
presentation including: (b.1) “Young” stroke (<50 years) (b.1) Strong
clinical suspicion of vessel dissection (c) Delayed clinical presentation (>7
days after symptom onset)
Alteplase Patients are assessed for thrombolysis, receiving it if clinically indicated in
accordance with the NICE technology appraisal guidance on alteplase.
Alteplase is a drug that can dissolve the blood clot. It must be administered
within 4.5 hours from the onset of symptoms and should not be given to
patients if brain imaging has indicated that the patient has a bleeding in the
brain.
Source: Department of Health (2012b) and Department of Health (2008b)
24
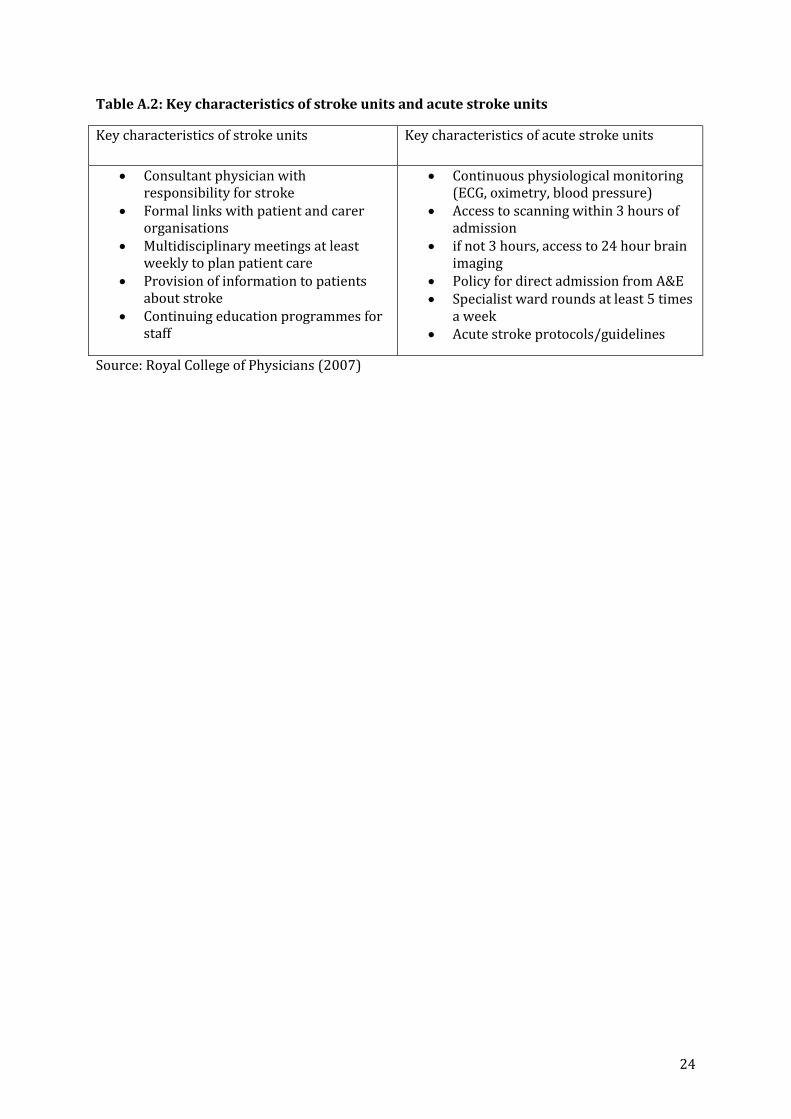
Table A.2: Key characteristics of stroke units and acute stroke units
Key characteristics of stroke units Key characteristics of acute stroke units
Consultant physician with responsibility for stroke
Formal links with patient and carer organisations
Multidisciplinary meetings at least weekly to plan patient care
Provision of information to patients about stroke
Continuing education programmes for staff
Continuous physiological monitoring (ECG, oximetry, blood pressure)
Access to scanning within 3 hours of admission
if not 3 hours, access to 24 hour brain imaging
Policy for direct admission from A&E Specialist ward rounds at least 5 times
a week Acute stroke protocols/guidelines
Source: Royal College of Physicians (2007)

25
Table A.3: Optimal performance payment (£) for treatment in an Acute Stroke Unit at different levels of altruism and opportunity cost of public funds
Opportunity costs of public funds
0 0.1 0.2 0.3 0.4 0.5 0.6 0.7 0.8 0.9 1
Altruism
0 23600 23428 23256 23084 22912 22740 22568 22396 22224 22052 21880
0.1 21240 21068 20896 20724 20552 20380 20208 20036 19864 19692 19520
0.2 18880 18708 18536 18364 18192 18020 17848 17676 17504 17332 17160
0.3 16520 16348 16176 16004 15832 15660 15488 15316 15144 14972 14800
0.4 14160 13988 13816 13644 13472 13300 13128 12956 12784 12612 12440
0.5 11800 11628 11456 11284 11112 10940 10768 10596 10424 10252 10080
0.6 9440 9268 9096 8924 8752 8580 8408 8236 8064 7892 7720
0.7 7080 6908 6736 6564 6392 6220 6048 5876 5704 5532 5360
0.8 4720 4548 4376 4204 4032 3860 3688 3516 3344 3172 3000
0.9 2360 2188 2016 1844 1672 1500 1328 1156 984 812 640
1 0 -172 -344 -516 -688 -860 -1032 -1204 -1376 -1548 -1720
Note: Assuming per person MB of treatment in Acute Stroke Unit=0.479 QALYs, Social value of a QALY =50,000, MC of treatment in an acute stroke unit =£1720
Table A.4: Optimal performance payment (£) for rapid brain imaging at different levels of altruism and opportunity cost of public funds
Opportunity costs of public funds
0 0.1 0.2 0.3 0.4 0.5 0.6 0.7 0.8 0.9 1
Altruism 0 5 3.8 2.6 1.4 0.2 -1 -2.2 -3.4 -4.6 -5.8 -7
0.1 4.5 3.3 2.1 0.9 -0.3 -1.5 -2.7 -3.9 -5.1 -6.3 -7.5
0.2 4 2.8 1.6 0.4 -0.8 -2 -3.2 -4.4 -5.6 -6.8 -8
0.3 3.5 2.3 1.1 -0.1 -1.3 -2.5 -3.7 -4.9 -6.1 -7.3 -8.5
0.4 3 1.8 0.6 -0.6 -1.8 -3 -4.2 -5.4 -6.6 -7.8 -9
0.5 2.5 1.3 0.1 -1.1 -2.3 -3.5 -4.7 -5.9 -7.1 -8.3 -9.5
0.6 2 0.8 -0.4 -1.6 -2.8 -4 -5.2 -6.4 -7.6 -8.8 -10
0.7 1.5 0.3 -0.9 -2.1 -3.3 -4.5 -5.7 -6.9 -8.1 -9.3 -10.5
0.8 1 -0.2 -1.4 -2.6 -3.8 -5 -6.2 -7.4 -8.6 -9.8 -11
0.9 0.5 -0.7 -1.9 -3.1 -4.3 -5.5 -6.7 -7.9 -9.1 -10.3 -11.5
1 0 -1.2 -2.4 -3.6 -4.8 -6 -7.2 -8.4 -9.6 -10.8 -12

26
Note: Assuming per person MB of rapid brain imaging=0.0001 QALYs, Social value of a QALY =50,000, MC of rapid brain imaging = £12
Table A.5: Optimal performance payment (£) for thrombolysis with alteplase at different levels of altruism and opportunity cost of public funds
Opportunity costs of public funds
0 0.1 0.2 0.3 0.4 0.5 0.6 0.7 0.8 0.9 1
Altruism 0 16650 16575 16500 16425 16350 16275 16200 16125 16050 15975 15900
0.1 14985 14910 14835 14760 14685 14610 14535 14460 14385 14310 14235
0.2 13320 13245 13170 13095 13020 12945 12870 12795 12720 12645 12570
0.3 11655 11580 11505 11430 11355 11280 11205 11130 11055 10980 10905
0.4 9990 9915 9840 9765 9690 9615 9540 9465 9390 9315 9240
0.5 8325 8250 8175 8100 8025 7950 7875 7800 7725 7650 7575
0.6 6660 6585 6510 6435 6360 6285 6210 6135 6060 5985 5910
0.7 4995 4920 4845 4770 4695 4620 4545 4470 4395 4320 4245
0.8 3330 3255 3180 3105 3030 2955 2880 2805 2730 2655 2580
0.9 1665 1590 1515 1440 1365 1290 1215 1140 1065 990 915
1 0 -75 -150 -225 -300 -375 -450 -525 -600 -675 -750
Note: Assuming per person MB of alteplase =0.333 QALYs, Social value of a QALY =50,000, MC of administering alteplase = £750

27
1 A TIA is a temporary disruption of the blood flow to the brain and cause similar symptoms as emergency
stroke, but the symptoms resolve within 24 hours. 2 The Impact Assessment of End of Life Care (Department of Health, 2008a) explained that the £50,000
figure was based on a projection of a 2004 estimate of willingness to pay for an additional life year of
£29,000 by the Department for Environment, Food and Rural Affairs. The increase to £50,000 was
justified by a wish to reflect price changes from 2004 to 2006, the older age and poorer life quality of the
likely target group of DH interventions, and an upward rounding due to concern that the figure might be
an under-estimate of the social value of a QALY.
3 The Stroke unit studied in the paper admitted only stroke patients and was a mixed unit with 4 acute
beds and 23 rehabilitation beds. The paper defined stroke units as units fulfilling at least 4 of the criteria
set out for stroke units by the Royal College of Physicians (see the left hand side of Table A.2), but was not
explicit about the configuration of the stroke unit from which the data was collected. It is unlikely that the
unit fulfilled the stricter criteria of an acute stroke unit (see the right hand side of Table A.2) and the
similar definition given by the DH (see Table A.1). Although this might suggest that the estimated QALY
gain is in the lower end of what is being incentivised, it should be noted that the Cochrane review carried
out by the Stroke Units Trialist’s Collaboration did not find a statistically significant difference in the odds
of death, or death or requiring institutional care or death or dependency3 when comparing acute
monitoring with acute non-intensive units. 4 The analysis was carried out for a cohort of 1000 patients (age 70-74) and repeated for 1000 60-64 year
and 80-84 year old patients in teaching urban and rural general hospitals using data from a range of
sources. 5 The estimate was submitted by the manufacturer of alteplase (Boehringer Ingelheim), but reviewed by
Davis et al (2012). The review noted that manufacturer failed to model the correlation between the risks
of death and death or dependency but that this was unlikely to affect the incremental cost effectiveness
ratio (ICER) of administering alteplase. In addition, Davis et al. (2012) commented that the utility values
for patients in dependent and independent health states stays fixed over the lifetime not allowing for
deterioration of health related quality of life over time. Davis et al. (2012) suggest that this may
potentially favour alteplase over standard care, but also note that the model is not very sensitive to the
utility values applied and so consider the effect likely to be small. 6 Note that we assume that the price is set on the basis of the additional direct costs of increasing the
rapidity of the brain scan. Wardlaw et al (2004) note that more rapid scans may reduce costs overall since
“[a]lthough the costs of CT scanning are highest … because of more scanning occurring after hours, these
higher costs are offset by savings in the length of inpatient stay because many management decisions and
better outcomes depend on accurate early diagnosis of stroke.” (Wardlaw et al, 2004, p.2481).
7 Specifically for stroke, the PbR guidance explains that the cost of the initial CT scan was originally paid
for by the conventional tariff, but that the costs relating to the scan has now been removed “so that
providers will only be reimbursed for scans that are in line with best practice.” The Step-by-step guide to
calculating the national tariff (Department of Health, 2010b) further specified that reduction in the
conventional tariff relating to delivering a CT scan was £133 and that the tariff was reduced by an
additional £120 to reflect the current compliance to the delivery of care on an acute stroke unit
estimated using data from the National Sentinel Stroke Audit 2008 and Vital Signs 14.
The tariff for treating patients in an acute stroke unit was derived on the basis of the cost estimate of
implementing the National Stroke Strategy from the Stroke Strategy Impact Assessment (Department of
Health, 2007b) using the fraction of strategy implementation costs relating to delivering care in an acute
stroke unit. The impact assessment based its cost estimates on the assumption that an additional 37%
acute beds were required to ensure that all stroke units would have sufficient bed capacity to be run at an

28
85% bed occupancy rate which was assumed to be enough to allow 95% of all stroke patients to be
admitted to an Acute stroke unit
8 (a) all stroke patients have prompt access to an acute stroke unit and spend the majority of their time at
hospital in a stroke unit with high-quality stroke specialist care (b) hyper-acute stroke services provide,
as a minimum, 24-hour access to brain imaging, expert interpretation and the opinion of a consultant
stroke specialist, and thrombolysis is given to those who can benefit (c) specialist neuro-intensivist care
including interventional neuroradiology or neurosurgery expertise is rapidly available (d) specialist
nursing is available for monitoring of patients (e) appropriately qualified clinicians are available to
address respiratory, swallowing, dietary and communication issues. (Department of Health, 2007a)