diss 200309 matasci - research collection41649/... · (di origine naturale, rinnovabili ed ottenuti...
TRANSCRIPT

Research Collection
Doctoral Thesis
An examination of the effects of grapevine cultivar mixtures andorganic fungicide treatments on the epidemiology and populationstructure of the grapevine downy mildew Plasmopara viticola
Author(s): Matasci, Caterina L.
Publication Date: 2008
Permanent Link: https://doi.org/10.3929/ethz-a-005782949
Rights / License: In Copyright - Non-Commercial Use Permitted
This page was generated automatically upon download from the ETH Zurich Research Collection. For moreinformation please consult the Terms of use.
ETH Library

Diss. ETH Nr. 18059
AN EXAMINATION OF THE EFFECTS OF GRAPEVINE
CULTIVAR MIXTURES AND ORGANIC FUNGICIDE
TREATMENTS ON THE EPIDEMIOLOGY AND
POPULATION STRUCTURE OF THE GRAPEVINE DOWNY
MILDEW PLASMOPARA VITICOLA
A dissertation submitted to the
SWISS FEDERAL INSTITUTE OF TECHNOLOGY ETH ZURICH
for the degree of
DOCTOR OF SCIENCES
Presented by
CATERINA L. MATASCI
Dipl. Ing. Agr. ETH
born 24 December 1977
Sonogno TI, Switzerland
accepted on the recommendation of
Prof. Dr. Cesare Gessler, examiner
Prof. Dr. Bruce A. McDonald, co-examiner
Dr. Hanns-Heinz Kassemeyer, co-examiner
2008


TABLE OF CONTENTS
ABSTRACT 1
RIASSUNTO 3
CHAPTER 1 5
General introduction
CHAPTER 2 13
Selection for fungicide resistance throughout a growing season in populations of
Plasmopara viticola
CHAPTER 3 23
Early detection of selection for resistance in Plasmopara viticola populations treated with
organically based fungicides
CHAPTER 4 35
Effects of grapevine cultivar mixtures onto Plasmopara viticola – Epidemiology
CHAPTER 5 57
Effects of grapevine cultivar mixtures onto Plasmopara viticola - Population genetics
CHAPTER 6 91
Population structure of Plasmopara viticola at single vine scale
CHAPTER 7 115
Going deeper - Population structure of Plasmopara viticola at small scale: From single
vine to leaf
CHAPTER 8 135
General discussion
AKNOWLEDGEMENTS 145
PUBLICATIONS 147
CURRICULUM VITAE 149


1
ABSTRACT
Grapevine downy mildew caused by the oomycete Plasmopara viticola, is the most important
grapevine (Vitis vinifera) disease in temperate climates and grapevines are the first fruit
worldwide in terms of harvested surface and the second in terms of yield.
Disease management usually consists of chemical control with fungicides often with
application timing based on warning systems. The use of resistant cultivars, where ever
possible, may contribute to lessen the disease pressure. Cultural practices play a minor role.
In organic viticulture, protection strongly depends from copper. Owing to the
deleterious effects on living organisms in soil, copper amounts are limited.
The European Project REPCO aimed to contribute to the replacement of copper
fungicides in European organic agriculture by studying and developing new organically based
fungicides and potentiators of resistance, new biocontrol agents and new integrated
management systems (grapevine cultivars mixture) for disease control of P. viticola in organic
grapevine and Venturia inaequalis in organically grown apple. In both approaches (organically
based fungicides and grapevine cultivars mixture) the effectiveness in pathogen control should
be durable.
A method based on neutral specific SSR markers to detect the potential threat of
selection for resistance to fungicides with very diverse and partially or totally unknown modes
of action was developed and applied to test the most promising products developed by the
REPCO partners. No one of the products (with a possible exception, Tecnobiol) exerted
selection pressure on P. viticola populations, neither by the application as combination with
other products or integrated in a treatment strategy. The experimental methodology showed
that selection pressure could not be completely excluded for Aliette (Fosetyl-Al) used as
control product.
In a vineyard consisting of V. vinifera cultivars (Müller-Thurgau, Gamaret and Merlot)
and hybrids (Isabella, Regent, Bianca, Solaris and Chambourcin) arranged in four within-row
mixture blocks, a reduction of downy mildew disease was observed on susceptible cultivars
exclusively in the first year of observations. No significant difference in P. viticola population
structure was observed when comparing within-row mixture blocks with the one-cultivar-by-
row block.
2
Intense samplings on single vines showed that at vine scale primary infections represent
the most important contribution to the epidemics, that only a reduced number of genotypes
undergoes secondary cycles re-infecting the vines on which they first appeared and that an
important contribution to the epidemics at vines scale is represented by asexually derived
genotypes coming from neighbouring vines.

3
RIASSUNTO
La peronospora della vite, causata dall’oomycete Plasmopara viticola, è la più importante
patologia della vite europea (Vitis vinifera) nei climi temperati. La coltivazione di uva riveste
grande importanza su scala mondiale, in quanto questa coltura è il frutto che occupa il primo
posto in termini di superficie coltivata ed il secondo in termini di produzione.
Attualmente il controllo della peronospora è basato sull’uso di fungicidi, applicati
abitualmente in base ad indicazioni fornite da modelli previsionali. L’uso di varietà resistenti,
dove autorizzato, può contribuire alla diminuzione della pressione della malattia, mentre le
pratiche colturali forniscono un contributo limitato.
In viticoltura biologica, il controllo della patologia dipende fortemente dall’uso di
fungicidi a base rameica, ma a causa degli effetti collaterali sulla microflora e microfauna del
suolo, il quantitativo di rame applicabile è limitato.
Scopo del progetto europeo REPCO era di contribuire alla sostituzione dei prodotti a
base rameica attraverso lo studio e lo sviluppo di nuovi fungicidi e potenziatori della resistenza
(di origine naturale, rinnovabili ed ottenuti con un processo sostenibile), di nuovi agenti di
biocontrollo, e di strategie innovative (misture varietali di vite) per il controllo della
peronospora e della ticchiolatura (Venturia inaequalis) nell’agricoltura biologica europea.
In entrambi gli approcci (fungicidi/potenziatori della resistenza e misture varietali di
vite) l’efficacia nel controllo della patologia deve essere duratura nel tempo.
Un metodo basato su marcatori molecolari (microsatelliti) è stato sviluppato per
determinare precocemente un potenziale rischio di selezione di resistenza del patogeno nei
confronti di fungicidi con meccanismi d’azione diversi e parzialmente o totalmente sconosciuti
ed applicato per testare i fungicidi più promettenti sviluppati dai partner REPCO. Ad eccezione
del fungicida Tecnobiol, nessun fungicida (applicato singolarmente, in combinazione con altri
o integrato in una strategia) ha dato indicazioni di un potenziale rischio di selezione di
resistenza. Rischio che però non può venir completamente escluso per il prodotto Aliette
(Fosetyl-Al) utilizzato come fungicida di controllo.

4
In un vigneto caratterizzato da piante appartenenti alla specie V. vinifera (Müller-
Thurgau, Gamaret e Merlot) ed ad ibridi (Isabella, Regent, Bianca, Solaris e Chambourcin),
disposte in quattro blocchi di misture intra-linea, una riduzione della patologia è stata osservata
su piante appartenenti alle varietà suscettibili, ciò esclusivamente il primo anno di
osservazioni. Nessuna differenza nella struttura delle popolazioni di P. viticola è stata
osservata confrontando popolazioni raccolte nei blocchi di misture intra-linea con popolazioni
raccolte nel blocco in cui piante di un'unica varietà erano disposte su di un’unica linea.
Campionature intensive su singole piante hanno indicato che le infezioni primarie
hanno, a livello di pianta, un ruolo principale nell’epidemia, che un numero ridotto di genotipi
si moltiplica re-infettando la pianta su qui è apparso inizialmente e che un importante
contributo all’epidemia, sempre a livello di pianta, è dato da genotipi moltiplicatisi in modo
assessuato su piante vicine.

5
CHAPTER 1
General introduction

CHAPTER 1
6
GENERAL INTRODUCTION
Downy mildew, caused by the diploid, obligate biotroph, heterothallic (Wong et al. 2001)
Oomycete Plasmopara viticola (Berk. and Curt.) Berl. and de Toni, is the most important
grape (Vitis vinifera) disease in temperate climates. P. viticola affects leaves and fruits of grape
plants. Losses are caused through killing of leaf tissues and defoliation, through production of
low quality or entirely destroyed grapes, and through weakening, dwarfing and killing of
young shoots. In European areas with high humidity, the disease destroys a crop without
protection.
Grapevines are the first fruit worldwide in terms of harvested surface (7’501’872 ha),
and the second in terms of yield (66’271’676 tons). In Europe, Spain (1’200’000 ha, 6’013’000
tons), France (830’000 ha, 6’500’000 tons) and Italy (770’000 ha, 8’519’418 tons) are the
countries with the largest harvested surface and yield (data 2007, FAO 2008).
Organic viticulture in Europe covers 95’102 ha and represents 2.3% of the European
vineyards. Italy (37’693 ha, 5.2% of the vineyards), France (18’808 ha, 2.2%), Spain (16’832
ha, 1.7%), Turkey (5’485 ha, 1.0%), and Greece (4’603 ha, 4.3%) are the European countries
with the largest surface of organic vineyards. In Switzerland 388 ha are covered with organic
vineyards, representing 3.0% of the surface (data 31.12.2006, FiBL Survey 2008 reported in
Willer 2008).
North America is considered to be the centre of origin of the pathogen and it is assumed
that P. viticola was introduced to Europe carried by American rootstocks resistant to
Phylloxera (Daktulosphaira vitifoliae). First symptoms were observed in 1878 in the Bordeaux
area; subsequently the disease spread overall Europe. In 1879, it was reported to be “all over
France and Italy”, the year after in Germany (Mosel region, Müller and Sleumer 1934), and in
1881 in Greece (Messinia region, Gennadios 1889). The first really disastrous epidemic
occurred in 1900 when, in a short time, the two-thirds of the expected yield were destroyed
(Müller and Sleumer 1934, Sarejanni 1951). Results of a study of Gobbin et al. 2006,
conducted on samples collected in 32 vineyards in France, Switzerland, Italy, Germany and
Greece suggests that several P. viticola genotypes were introduced into Europe, and perhaps
the introduction also occurred multiple times.

CHAPTER 1
7
Oospores are formed after the fusion of gametes in autumn by temperatures lower than
12°C (Schruft and Kassemeyer 1999). During May to late October, depending on the region
(Gobbin et al. 2003, Rumbou and Gessler 2006) oospores germinate and produce
macrosporangia which contain zoospores that can be splash-dispersed to cause primary
infections. Oospores can take 5-10 days to germinate depending on the climatic conditions
(Vercesi et al. 1999). Symptoms on leaves appear as yellowish round spots. Sporangia
produced on primary lesions are wind and splash-dispersed and under the presence of leaf
wetness, zoospores are released and start secondary infections. The number of secondary
cycles may vary between years or regions depending on rain events and on the presence of dew
(Blaeser and Weltzien 1979, Lafon and Clerjeau 1988, Schruft and Kassemeyer 1999).
Gobbin et al. (2005) showed that secondary infections were spatially localized in most
cases (at leaf, branch or vine level), with most genotypes having a limited ability to spread
asexually (Gobbin et al. 2003, Rumbou and Gessler 2004, 2006). In one asexual cycle, the
clones’ dispersal usually did not cover an area wider than a few vines around the site where the
oosporic infection was first identified. Migration distances were less than 20 m per asexual
cycle but larger distances could not be excluded. With an increasing number of asexual cycles,
the clones spread throughout the plot following a stepwise migration pattern (Gobbin et al.
2005, Rumbou and Gessler 2004).
In the past, it was assumed that epidemics start following a very small number of
primary infections occurring within a relatively small time-window (Lafon and Clerjeau 1988).
It was presumed that after the rapid exhaustion of the infective capability of oospores,
generally in May-June (Cortesi and Zerbetto 1994), secondary infections would continue and
lead to the explosive increase of the epidemic until leaf fall in autumn. Primary lesions were
supposed to contribute extremely little to the disease severity, while secondary lesions were
consequently given the major responsibility of it. It was assumed that sporangia may spread
over long distances in a short time (Zachos 1959, Lafon and Clerjeau 1988, Blaise et al. 1999).
Disease management usually consists of different cultural practices, warning systems,
resistant cultivars and chemical control with fungicides (Gisi 2002, Aziz et al. 2006).
Resistance is derived from North American Vitis species (V. riparia, V. rupestris, V.
lincecumii, V. labrusca, V. rotundifolia, V. yenshanensis, V. aestivalis, V. cinerea, V.
berlandieri). Interspecific hybrids are generally considered to have inferior fruit quality

CHAPTER 1
8
compared to V. vinifera cultivars (Riaz et al. 2007). Acceptance is therefore reduced and in
many viticultural areas the cultivation of disease-resistant cultivars is still prohibited (Basler
and Pfenninger 2003).
P. viticola is included in the list of plant pathogens showing a high risk of development
of resistance to fungicides (EPPO/OEPP 1999). Resistance has evolved to several classes of
fungicides namely phenylamides (Staub and Sozzi 1981, Bosshard and Schuepp 1983, Leroux
and Clerjeau 1985), strobilurines (Heaney et al. 2000), cyanoacetamide oximes (Gullino et al.
1997), and phosphonates (Khilare et al. 2003).
In organic viticulture, grapevine protection strongly depends from copper. Copper is
known as one of the trace elements with the most deleterious effects on living organisms in soil
(Renella et al. 2002). Harmful and irreversible effects on the biological functioning and quality
of the soil could educe from significant accumulations of this element in surface soils (Ranjard
et al. 2006). In Swiss organic viticulture (Ordinanza del DFE sull’agricoltura biologica.
Modifica del 2 novembre 2006) and in the European Union (Council Regulation (EEC) No
2092/91, Appendix II) copper amounts are limited. In traditional calendar based applications
these limits are difficult to observe and may lead to insufficient protection and therefore to
damages in years with high disease pressure.
In November 2003 the project REPCO 501452-Replacement of Copper Fungicides in
Organic Production of Grapevine and Apple in Europe, was started. “The object of the project
was to contribute to the replacement of copper fungicides in European organic agriculture by
studying and developing new organically based fungicides and potentiators of resistance, new
biocontrol agents and new integrated management systems for disease control of Plasmopara
viticola (Pv) in organic grapevine and Venturia inaequalis (Vi) in organically grown apple.
The new disease control measures will be inline with Council Regulation (EEC) No 2092/91
defining products for plant protection in organic agriculture and requiring the replacement of
the use of copper in organic agriculture.”
The partners involved in the project were: Plant Research International (PRI,
Wageningen, NL), BioFruitAdvies (Zoelmond, NL), Applied Plant Research (PPO, Randwijk,
NL), Staatliches Weinbauinstitut (WBI-Department of Plant Protection and Phytopathology,
Freiburg im Breisgau, D), Bundesverband Ökologischer Weinbau (ECOVIN, Heitersheim, D),
Prophyta Biologischer Pflanzenschutz GmbH (Prophyta, Malchow/Poel, D), Istituto Agrario di

CHAPTER 1
9
San Michele all’Adige (IASMA, S. Michele all’Adige, I), Groupe de Recherche en Agriculture
Biologique (GRAB, Avignon, F), University of Copenhagen (former KVL, Frederiksberg C,
DK), Aarhus University (former DIAS, Aarslev, DK), Research Institute of Organic
Agriculture (FiBL, Frick, CH) and ETHZ (IBZ, Plant Pathology, Zürich, CH).
Our tasks in the project were 1) to “Quantify selection pressure of potentiators of
resistance and organically based fungicides and forced evolution on P. viticola under
controlled conditions - Forced evolution of P. viticola population will be studied under
controlled conditions in the greenhouse. Grape plants grown in pots are treated with
potentiators of resistance or organically based fungicides so that their resistance toward P.
viticola is changed compared to the untreated or original cultivar. Isolates originating from
different cultivars and sites, easy distinguishable in mixture through unique microsatellite
allele pattern, will be inoculated in mixture on the plants. From the resulting lesions, spores
will be collected and reapplied to new plants of the same type. This procedure will be repeated
for several cycles. Frequency of the single genotypes will be quantified with the system
currently under development (Quantitative PCR). As control of the methodology single spore
cultures on leaf disks will be made in sufficient number and tested for genotype frequency. The
selection pressure on P. viticola caused by control strategies using potentiators of resistance,
organically based fungicides and possible combination or alternation of such treatments will be
estimated. These data will be crucial to identify sustainable control measures, which cannot be
overcome by quick evolution of P. viticola”, 2) to “Quantify selection pressure of potentiators
of resistance and organically based fungicides and forced evolution on P. viticola under field
conditions - Forced evolution of P. viticola by plants treated with potentiators of resistance or
organically based fungicides will be tested in field trials of IASMA. Part of the P. viticola
lesions will be collected and analyzed as described for task 1. The collection and analysis will
extend over all treatments and several time points in a single season. The number of samples to
be analyzed is estimated to be ca. 500 per treatment with a total of 48 different treatments
inclusive of repetitions and controls”, and 3) to “Quantify selection pressure of grapevine
cultivars and hybrids planted in mixtures and forced evolution on P. viticola under field
conditions - In collaboration with RAC-Cadenazzo (Southern Switzerland) an experimental
plot with ca. 1000 grape plants will be used with a planting pattern consisting of mixtures and
monoblocks. Mixtures will include mixtures of Vitis vinifera cultivars, of new hybrids, and of

CHAPTER 1
10
hybrids and V. vinifera. Plasmopara epidemics will be followed as described in task 2.
Cadenazzo has been chosen as site because it is a site with over 2000 mm of rain per year,
usually well distributed over the year. This has led in the past to regular epidemics which
uncontrolled always reach full destruction of the foliage by autumn and in the majority of the
years also to full destruction of the harvest. This guaranties us to obtain results in year two and
three.”
This dissertation was conducted in order to accomplish the three tasks of the REPCO
Project. In detail we developed a method, based on neutral specific SSR markers, to detect the
potential threat of selection for resistance to fungicides with very diverse and partially or
totally unknown modes of action (CHAPTER 2), we applied the developed high throughput
method to test the most promising products developed by the REPCO partners during the
project (CHAPTER 3). We established a vineyard consisting of eight Vitis vinifera and hybrids
cultivars differing in resistance to P. viticola arranged in four within-row mixture blocks and in
one one-cultivar-by-row block, to test if cultivar mixtures were effective in reducing P. viticola
disease severity and incidence (CHAPTER 4) and if there is a difference in genetic structure of
P. viticola populations depending i) on the spatial plant aggregation (MIX and MONO) and ii)
on different grapevine cultivars (CHAPTER 5). We performed an intense, where possible
complete, sampling on vines of five grapevine cultivars with the aim to investigate the genetic
structure of P. viticola at single vine scale (CHAPTER 6) and at sector and leaf scale (CHAPTER
7).

CHAPTER 1
11
L ITERATURE CITED
Aziz, A., Trotel-Aziz, P., Dhuicq, L., Jeandet, P., Couderchet, M., Vernet., G. 2006. Chitosan oligomers and
copper sulfate induce grapevine defense reactions and resistance to gray mold and downy mildew.
Phytopathology, 96: 1188-1194.
Basler, P., Pfenninger, H. 2003. Disease-resistant cultivars as a solution for organic viticulture. Proceedings of the
8th International Conference on Grape Genetics and Breeding, 603 (1 and 2): 681-685.
Blaeser, M., Weltzien, H. C. 1979. Epidemiologische Studien an Plasmopara viticola zur Verbesserung der
Spritzterminbestimmung. Zeitschrift für Pflanzenkrankheiten und Pflanzenschutz, 86: 489-498.
Blaise, P., Gessler, C. 1994. Cultivar mixtures in apple orchards as a mean to control apple scab. Norwegian
Journal of Agricultural Sciences, 17: 105-112.
Bosshard, E., Schuepp, H. 1983. Variability of selected strains of Plasmopara viticola with respect to their
Metalaxyl sensitivity under field conditions. Zeitschrift für Pflanzenkrankheiten und Pflanzenschutz-
Journal of plant diseases and protection, 90(5): 449-459.
Cortesi, P., Zerbetto, F. 1994. Dynamics of oospore maturation of Plasmopara viticola in northern Italy.
Proceedings of the 1st Int. Workshop on Grapevine Downy Mildew Modeling, Geneva, NY, USA, 26-30
August 1991, Gadoury, D. M., Seem, R. C. (eds.), NY Agric. Exp. Stn. Special Rep., 68: 55-73.
EPPO/OEPP. 1999. EPPO Standard PP 1/213(1) Resistance Risk Analysis, EPPO Bulletin, 29: 325-347.
FAOSTAT. 2008. http://faostat.fao.org/
Gennadios, P. G. 1889. About the downy mildew of the grapevine. Greek Agriculture, 8: 297-307.
Gisi, U., Sierotzki, H., Cook, A., McCaffery, A. 2002. Mechanisms influencing the evolution of resistance to Qo
inhibitor fungicides. Pest Management Science, 58: 859-867.
Gobbin, D., Pertot, I., Gessler, C. 2003. Genetic structure of a Plasmopara viticola population in an isolated
Italian mountain vineyard. Journal of Phytopathology, 151: 636-646.
Gobbin, D., Jermini, M., Loskill, B., Pertot, I., Raynal, M., Gessler, C. 2005. Importance of secondary inoculum
of Plasmopara viticola to epidemics of grapevine downy mildew. Plant Pathology, 54: 522-534.
Gobbin, D., Rumbou, A., Linde, C., Gessler, C. 2006. Population genetic structure of Plasmopara viticola after
125 years of colonization in European vineyards. Molecular Plant Pathology, 6: 519-531.
Gullino, M. L., Mescalchin, E., Mezzalana, M. 1997. Sensitivity to cymoxanil in populations of Plasmopara
viticola in northern Italy. Plant Pathology, 46: 729-736.
Heaney, S. P., Hall, A. A., Davies, S. A., Olaya, G. 2000. Resistance to fungicides in the QoI-STAR cross-
resistance group: current perspectives. Proceedings of the Brighton Crop Protection Conference-Pests
and Diseases, 755-762.
Khilare, V. C., Deokate, A. S., Gangawane, L. V. 2003. Occurrence of aluminium phosethyle (allitte) resistance in
Plasmopara viticola causing downy mildew of grapevine in Maharashtra. Journal of Phytological
Research, 16(2): 239-241.

CHAPTER 1
12
Lafon, R., Clerjeau, M. 1988. Downy mildew. Pearson, R. C., Goheen, A. C. (eds.), Compendium of Grape
Diseases. APS Press, St. Paul, Minnesota, USA, 11-13.
Leroux, P., Clerjeau, M. 1985. Resistance of Botrytis cinerea and Plasmopara viticola (Berk and Curt) Berl and
de Toni to fungicides in French vineyards. Crop Protection, 4(2): 137-160.
Müller, K., Sleumer, H. 1934. Biologische Untersuchungen über die Peronosporakrankheit des Weinstockes mit
besonderer Berücksichtigung ihrer Bekämpfung nach der Inkubationskalendermethode.
Landwirtschaftliche Jahrbücher, 79: 509-576.
Ranjard, L., Echairi, A., Nowak, V., Lejon, D. P. H., Nouaïm, R., Chaussod, R. 2006. Field and microcosm
experiments to evaluate the effects of agricultural Cu treatment on the density and genetic structure of
microbial communities in two different soils. FEMS Microbiology Ecology, 58: 303-315.
Renella, G., Chaudri, A. M., Brookes, P. C. 2002. Fresh additions of heavy metals do not model long-term effects
on microbial biomass and activity. Soil Biology & Biochemistry, 34: 121-124.
Riaz, S., Doligez, A., Henry, R. J., Walker, M. A. 2007. Grape. Genome Mapping and Molecular Breeding in
Plants, Volume 4. Fruits and Nuts. Kole, C. (ed.), Springer-Verlag Berlin Heidelberg, 63-100.
Rumbou, A., Gessler, C. 2004. Genetic dissection of Plasmopara viticola population from a Greek vineyard in
two consecutive years. European Journal of Plant Pathology, 4: 379-392.
Rumbou, A., Gessler, C. 2006. Particular structure of Plasmopara viticola populations evolved under Greek
island conditions. Phytopathology, 96: 501-509.
Sarejanni, J. A. 1951. Quelques problèmes de l’épidémiologie du mildiou de la vigne en Grèce. Annales de
l’Institut Phytopathologique Benaki, 5: 53-64.
Schruft, G., Kassemeyer, H.-H. 1999. Rebenperonospora. Thomas Mann Verlag (ed.) Krankheiten und Schädlinge
der Weinrebe, Gelsenkirchen-Buer, Germany, 14-17.
Staub, T., Sozzi, D. 1981.1st practical experience with Metalaxyl resistance. Netherlands Journal of Plant
Pathology, 6: 245.
Vercesi, A., Tornaghi, R., Sant, S., Burruano, S., Faoro, F. 1999. A cytological and ultrastructural study on the
maturation and germination of oospores of Plasmopara viticola from overwintering vine leaves.
Mycological Research, 103(2): 193-202.
Willer, H. 2008. Organic Viticulture in Europe: Development and current statistics. Organic wine and viticulture
conference, Levizzano, Italy.
Wong, F. P., Burr, H. N., Wilcox, W. F. 2001. Heterothallism in Plasmopara viticola. Plant Pathology, 50: 427-
432.
Zachos, D. G. 1959. Recherches sur la biologie et l’épidémiologie du mildiou de la vigne en Grèce. Annales de l’
Institut Phytopathologique Benaki, 2: 193-335.

13
CHAPTER 2
Selection for fungicide resistance throughout a
growing season in populations of Plasmopara viticola

CHAPTER 2
14
ABSTRACT
A method for evaluating the potential threat of selection for resistance to organically based
fungicides in populations of Plasmopara viticola is needed to screen a large panel of
products alternative to copper in organic viticulture. Populations from an unexposed plot
were compared throughout one season with a population sprayed with azoxystrobin
(Quadris), reported as engendering selection pressure and resistance, and a population
sprayed with an organically based fungicide (Mycosan). The evolution of the three
populations was followed with neutral specific SSR markers and with the specific marker
for strobilurin resistance, as control of selection for resistant mutants. A reduction in
genetic diversity of the P. viticola population was observed in the population sprayed with
azoxystrobin, consistent with directional selection toward higher resistance, confirmed by
an enhanced frequency of resistant mutants with respect to the unexposed population. In
contrast, a higher diversity and a reduced frequency of resistant mutants were observed in
the population sprayed with the organically based fungicide. Assessing a reduction of
genotypic diversity allows detecting selection for resistance and constitutes a valid
instrument for screening a large panel of products with non-specific, different and possibly
indirect modes of action.
Matasci, C. L., Gobbin, D., Schärer, H.- J., Tamm, L., Gessler, C. 2008
Published in European Journal of Plant Pathology, 120: 79-83.

CHAPTER 2
15
INTRODUCTION
Plasmopara viticola (Berk. and Curt.) Berl. and de Toni, the causal agent of downy mildew
is considered one of the most important pathogens of grape. This diploid obligate biotroph
Oomycete affects leaves and fruits of grape plants and causes losses through killing of leaf
tissues and defoliation, through production of low quality or entirely destroyed grapes, and
through weakening, dwarfing and killing of young shoots. Control of the pathogen is
generally achieved with chemical fungicide and copper salt applications (Aziz et al. 2006);
organic agriculture depends strongly on the latter. Copper is known as one of the trace
elements with the most deleterious effects on living organisms in soil (Renella et al. 2002).
Harmful and irreversible effects on the biological functioning and quality of the soil could
educe from significant accumulation of this element in surface soils (Ranjard et al. 2006).
To avoid environmental risks the permitted amounts of copper are being reduced stepwise
in Switzerland and other parts of Europe. Repco (Replacement of Copper Fungicides in
Organic Production of Grapevine and Apple in Europe, REPCO 501452) aims to contribute
to the replacement of copper fungicides in organic agriculture by screening and evaluating
potentiators of resistance and organically based fungicides and developing new
management measures. New products or strategies will be acceptable only if their efficacy
is durable in time. P. viticola is included in the list of plant pathogens showing a high risk
of development of resistance to fungicides (EPPO/OEPP 1999). Therefore, a method to
detect the potential threat of selection for resistance to fungicides is needed for testing a
large panel of products with very diverse and partially or totally unknown modes of action
(REPCO 501452). This is needed, even for compounds with indirect modes of action, such
as plant resistance inducers, that should, at least theoretically, remain excluded from
resistance risk (Gullino et al. 2000).
In this study we implemented the method of Grünwald et al. (2006) owing to the
strong similarities between the Phytophthora infestans population in the Toluca valley and
P. viticola in Europe. Sexual reproduction, the presence of two mating types, high genetic
diversity and exposure to many fungicides characterize P. infestans in the Toluca valley
(Grünwald et al. 2006) as well as P. viticola populations in Europe, and should enhance the
chance of detecting selection for resistance within a field season (Grünwald and Flier
2005). As done by Grünwald et al. (2006), we tested the hypotheses that exposure to
fungicides would lead to (i) a shift in the sensitivity distribution (i.e., selection) and (ii) a

CHAPTER 2
16
lower genotypic diversity in the population. In our study we followed the evolution of three
populations throughout one season. One population was sprayed with azoxystrobin (Q-
pop), a compound belonging to the QoI fungicides, reported as engendering selection
pressure and resistance (Heaney et al. 2000, Zheng et al. 2000), a second population was
sprayed with the organically based fungicide Mycosan (M-pop), and a third population was
not sprayed (U-pop). We followed the changes in population structure of the three
populations with neutral specific SSR markers (Gobbin et al. 2003) and with the specific
marker for strobilurin resistance (Chen et al. 2004), as control for resistance selection.
MATERIALS AND METHODS , RESULTS AND
DISCUSSION
Samplings were performed as described by Gobbin et al. (2003) in the experimental
vineyard at Fibl in Frick (Switzerland). The plot consists of susceptible vines of Müller-
Thurgau and Chasselas planted alternately. The distance between rows was 2 meters;
distance within the row was 1.1 meters. Three subplots were designed, each composed of
16 vines planted in two rows (four vines of Müller-Thurgau and Chasselas each per row).
The distance between the subplots was 1.1 meters. Vines of the first subplot were not
treated with fungicides (U-pop, negative control), vines of the second subplot were treated
with Mycosan (50% acidified clay, 41% wettable sulfur, 1% Equisetum extracts, Andermatt
Biocontrol, Grossdietwil; M-pop) at 0.8% dosage. Vines of the third subplot were treated
with azoxystrobin (Quadris, 250 g litre-1, Syngenta Crop Protection, Basel, Switzerland; Q-
pop) at the 0.05% dosage. The employed amount corresponded to half of the recommended
rate. However, it largely exceeds the lethal dosage for P. viticola assessed by Genet et al.
(2006) in a whole plant bioassay, where disease control of more than 90% was achieved
with a fungicide concentration of 4 µg ml-1. Plants were treated 14 times from 19th May
until 10th August 2004 (19th, 27th May, 02nd, 04th, 09th, 15th, 21st, 28th June, 05th, 12th, 19th,
26th July, 02nd, 10th August). First observation of P. viticola was on 9th July in the U-pop.
The course of the season was characterized by two dry periods (25th July-05th August and
27th August-17th September) followed by rainy periods that favoured a strong disease
increase.
CHAPTER 2
17
A total of 481 lesions (U-pop: 241, M-pop: 88, and Q-pop: 152) was collected on
four sampling dates: 14th July (only in the U-pop), 27th July, 16th August and 21st
September. During the first and second samplings, samples from all detectable lesions were
collected, whereas by the third one, sample number per vine was limited to maximally nine
lesions. By the last date the disease showed a mosaic pattern and only well defined lesions
were sampled. Collected samples, consisting of half a sporulating lesion (about 1 cm2,
including some healthy leaf tissue) excised with a cutter, were assigned coordinates to
locate their exact position in the vineyard (Gobbin et al. 2003).
DNA extraction was performed as described in Gobbin et al. (2003). Frequency of
strobilurin-resistant genotypes was assessed by amplification of part of the cyt b gene
fragment and digestion of 5 µl PCR products with 0.3 U of Fnu 4HI (New England
Biolabs) for 6 h at 37°C. Amplification was performed in a volume of 15 µl consisting of
1x reaction buffer (Pharmacia Biotechnology, Inc.), 0.14 µM of both forward (COB_279F,
Chen et al. 2004) and reverse primers (StrobiR: 5’-CCA CTC AGG AAC AAT ATG TAA
AGG-3’, designed on sequence AX577569, Burbidge et al. 2002), 0.20 mM of each dNTP,
0.07 U/µl Taq polymerase (Pharmacia Biotechnology Inc.) and 5 µl of DNA (not
quantified). Amplifications were performed in a thermal cycler programmed for an initial
denaturation of 2 min 30 sec, followed by 40 cycles of amplification with the following
parameters: 30 sec at 94°C, 30 sec at 60°C, and 30 sec at 72°C, followed by 10 min at
72°C. Digested fragments were separated on 1.2% agarose gels.
The mutation conferring resistance to strobilurin was present in 56.9%, 36.5% and
93.8% of the samples collected in the U, M and Q-pop, respectively. The observed shift in
resistance frequency with respect to the unexposed population (U-pop) could indicate on
one side a selection toward resistance (Q-pop) or on the other side a selection of susceptible
wild-type genotypes (M-pop).
The selection of a resistant population and the subsequent reduction of efficacy of
the applied fungicide in the Quadris-treated plot are consistent with the field observations.
Indeed, severity in the Q-pop was only slightly lower than in the U-pop and at the end of
September vines of the two plots were almost completely defoliated. Disease in the
Mycosan-treated plot progressed more slowly and vines were slightly healthier at the end of
the season. The reduced frequency of strobilurin-resistant mutants in the Mycosan plot
compared to the untreated plot could be a consequence of a fitness cost in these individuals,
which are more frequently eliminated when exposed to the stress induced by the partial

CHAPTER 2
18
control of Mycosan, than the more fit wild-type strobilurin-susceptible individuals. This
would be in accord with the results of Genet et al. (2006), where a recovery of sensitivity of
the resistant P. viticola population after consecutive transfers on unsprayed plants was
observed, suggesting that the resistant phenotypes are less competitive than the sensitive
ones. A fitness penalty of strobilurin-resistant mutants in P. viticola even under optimal
growth conditions was observed also by Heaney et al. (2000).
The hypothesis formulated by Grünwald et al. (2006) that genotypic diversity would
decrease in a population exposed to fungicide compared with the unexposed population was
tested. PCR amplification of the four P. viticola-specific SSR loci ISA, CES, BER and
GOB and sequencer-based fragment analysis were performed according to the protocol
described by Gobbin et al. (2003). The complete genotyping (at least one allele per each
locus and sample) was successful for approx. 61% of the samples collected (293 out of
481). Sixty-five, 35 and 25 SSR genotypes were discriminated respectively among the 145
(U-pop), 55 (M-pop) and 93 (Q-pop) lesions genotyped at all four loci (Tab. 1). In all three
subplots the same genotype occurred at the highest frequency; it composed 46.2% (U-pop),
32.7% (M-pop) and 65.5% (Q-pop) of the respective populations throughout the season.
The highest proportion of genotypes detected only once throughout the epidemiological
season was shown by the M-pop, followed by the U-pop and Q-pop.
Table 1. Genotypic diversity of grapevine downy mildew (Plasmopara viticola) populations based on
analysis of four specific SSR loci ISA, CES, BER and GOB, and percentage of strobilurin resistant mutants.
Na gb g55c Hd E5e Rf
U-pop 145 65 26 2.87 0.2211 56.9 M-pop 55 35 35 2.98 0.4544 36.5
Q-pop 93 25 15 1.70*** 0.2951 93.8 a Individuals genotyped at all four SSR loci b Number of genotypes observed c Expected number of genotypes calculated for a sample size of N = 55 (the largest common sample size to be
compared) isolates per population estimated using the rarefaction method (Grünwald et al. 2003) d Shannon-Wiener diversity index (Grünwald et al. 2003, Shannon and Weaver 1949). The value followed by
*** indicates that H in this population was significantly different (P<0.001) from the H of the U-pop
according to pairwise Bonferroni-corrected t-tests e Evenness (Grünwald et al. 2003, Ludvig and Reynolds 1988) f Percentage of individuals carrying the mutation conferring resistance to strobilurin

CHAPTER 2
19
Multilocus genotypic diversity analyses were performed as described by Grünwald et al.
(2006). The highest genotypic diversity, estimated by Shannon-Wiener’s index H (Shannon
and Weaver 1949), was observed for the M-pop (H = 2.98), followed by the U-pop (H =
2.87) and by the Q-pop (H = 1.70) (Tab. 1). A t test (Magurran 1988) with a Bonferroni
correction for multiple comparisons was implemented to assess the significance of the
difference between genotypic diversities within the unexposed U-pop and the fungicide-
exposed Q-pop (Table 1). Evenness index E5 (Ludwig and Reynolds 1988) was calculated
and genotypic richness was estimated using rarefaction curves based on the sample size of
the smallest population (M-pop: N = 55) using the algorithm <Rarefac.c> (Grünwald et al.
2001, 2003). The Q-pop became the most clonal, had the lowest expected number of
genotypes and intermediate evenness E5 (Table 1), indicating a reduction in genetic
diversity of the P. viticola population, consistent with directional selection toward higher
resistance. The U-pop had an intermediate expected number of genotypes estimated by
rarefaction and the lowest E5 evenness. The M-pop was the least clonal and had the highest
expected number of genotypes estimated by rarefaction, and the highest E5 evenness.
All analyses consistently led to the conclusion that genetic diversity is reduced in
the P. viticola population exposed to selection pressure by strobilurin fungicides (Q-pop).
Therefore, the method implemented by Grünwald et al. (2006) is effective for detecting
selection in P. viticola populations genotyped by neutral specific SSR markers and
therefore could be a valid instrument for screening a large panel of products with non-
specific, different and possibly indirect modes of action. It is important to note that the fact
that selection is not detected in a season does not indicate that resistance could not evolve
(Grünwald et al. 2006).
ACKNOWLEDGEMENTS
The authors are grateful to Thomas Amsler for carrying out the field work, Felix Hug for
helping with the sampling and Niklaus Grünwald for performing the analysis with the
algorithm <Rarefac.c>. This work was funded by SBF 03.0485-1 (EU Project No. 501452
REPCO).

CHAPTER 2
20
L ITERATURE CITED
Aziz, A., Trotel-Aziz, P., Dhuicq, L., Jeandet, P., Couderchet, M., Vernet., G. 2006. Chitosan oligomers and
copper sulfate induce grapevine defence reactions and resistance to grey mold and downy mildew.
Phytopathology, 96: 1188-1194.
Burbidge, J. M., Cleere, S. M., Stanger, C. P., Windass, J. D. 2002. Method for the detection of cytochrome b
mutations in fungi. Patent WO 02081742-A 539, 17 Oct 2002.
Chen, W. J., Delmotte, F., Richart-Cervera, S., Douence, L., Caroli, R., Menaouli, S., Corio-Costet, M. F.
2004. Evolution of fungicide resistance in grapevine downy mildew populations. Poster presented at
the 8th Evolutionary Biology Meeting, Marseille.
EPPO/OEPP. 1999. EPPO Standard PP 1/213(1) Resistance Risk Analysis. EPPO Bulletin, 29: 325-347.
Genet, J.-L., Jaworska, G., Deparis, F. 2006. Effect of dose rate and mixtures of fungicides on selection for
QoI resistance in populations of Plasmopara viticola. Pest Management Sciences, 62: 188-194.
Gobbin, D., Pertot, I., Gessler, C. 2003. Identification of microsatellite markers for Plasmopara viticola and
establishment of high throughput method for SSR analysis. European Journal of Plant Pathology,
109: 153-164.
Grünwald, N. J., Flier, W. G., Sturbaum, A. K., Garay-Serrano, E., van den Bosch, T. B. M., Smart, C. D.,
Matuszak, J. M., Lozoya-Saldaña, H., Turkensteen, L. J., Fry, W. E. 2001. Population structure of
Phytophthora infestans in the Toluca Valley region of Central Mexico. Phytopathology, 91: 882-890.
Grünwald, N. J., Goodwin, S. B., Milgroom, M. G., Fry, W. E. 2003. Analysis of genotypic diversity data for
populations of microorganisms. Phytopathology, 93: 738-746.
Grünwald, N. J., Flier, W. G. 2005. The biology of Phytophthora infestans at its center of origin. Annual
Review of Phytopathology, 43: 171-190.
Grünwald, N. J., Sturbaum, A. K., Montes, G. R., Garay Serrano, E., Lozoya-Saldaña, H., Fry, W. E. 2006.
Selection for fungicide resistance within a growing season in field populations of Phytophthora
infestans at the center of origin. Phytopathology, 96: 1397-1403.
Gullino, M. L., Leroux, P., Smith, C. M. 2000. Uses and challenges of novel compounds for plant disease
control. Crop Protection, 19(1): 1-11.
Heaney, S. P., Hall, A. A., Davies, S. A., Olaya, G. 2000. Resistance to fungicides in the QoI-STAR cross-
resistance group: current perspectives. Proceedings of the Brighton Crop Protection Conference-
Pests and Diseases, 755-762.
Ludwig, J. A., Reynolds, J. F. 1988. Statistical Ecology: A primer on Methods and Computing. New York,
John Wiley, Sons.
Magurran, A. E. 1988. Ecological Diversity and Its Measurement. Princeton, Princeton University Press.
Ranjard, L., Echairi, A., Nowak, V., Lejon, D. P. H., Nouaïm, R., Chaussod, R. 2006. Field and microcosm
experiments to evaluate the effects of agricultural Cu treatment on the density and genetic structure
of microbial communities in two different soils. FEMS Microbiology Ecology, 58: 303-315.
Renella, G., Chaudri, A. M., Brookes, P. C. 2002. Fresh additions of heavy metals do not model long-term
effects on microbial biomass and activity. Soil Biology and Biochemistry, 34: 121-124.

CHAPTER 2
21
Shannon, C. E., Weaver, W. 1949. The Mathematical Theory of Communication. Urbana: University of
Illinois Press.
Zheng, D., Olaya, G., Köller, W. 2000. Characterisation of laboratory mutants of Venturia inaequalis resistant
to the strobilurin-related fungicide kresoxim-methyl. Current Genetics, 38: 148-155.

22

23
CHAPTER 3
Early detection of selection for resistance in
Plasmopara viticola populations treated with
organically based fungicides

CHAPTER 3
24
ABSTRACT
Plasmopara viticola is considered one of the most important grape pathogens worldwide
and shows a high risk of resistance development to fungicides. In organic viticulture copper
treatments represent nowadays the unique valid control measure against this pathogen.
However, the permitted amounts of copper allowed in agriculture are reduced stepwise in
Switzerland and Europe. The European project REPCO aims to contribute to the
replacement of copper fungicides in organic agriculture by studying and developing new
organically based fungicides. We applied a high throughput method, based on neutral
specific SSR markers, for early detection of selection toward resistance in P. viticola
natural populations treated with organically based fungicides. Treated and untreated
populations shared a comparable number of genotypes, a high percentage of single
genotypes, a low occurrence of clones derived from the most frequent genotype and high
genetic diversity. We concluded that selection pressure was not exerted on downy mildew
populations by Agat-25k, Chitoplant, Novosil, Sonata, Tri-40, Yukka Extract, Timorex,
Sonata/Chitoplant/KBV 99-01, Mycosin/Stulln-S/Kocide DF, and the control product
Kocide DF; but could not be completely excluded for the organically based fungicide
Tecnobiol and Aliette, the latter used in the experiment as control product.
Matasci, C. L., Gobbin, D., Schärer, H.-J., Stutz, Ch., Tamm, L., Gessler, C. 2008.
Published in IOBC/WPRS Bulletin, 36: 167-174.

CHAPTER 3
25
INTRODUCTION
Plasmopara viticola (Berk. and Curt.) Berl. and de Toni, the causal agent of downy
mildew, is one of the most important grape pathogens worldwide and is included in the list
of plants pathogens showing a high risk of development of resistance to fungicides (EPPO
1999). Control of the pathogen in organic agriculture strongly depends on copper. Due to
the deleterious effects on living organisms in soil, the permitted amounts of copper
implemented in agriculture are reduced stepwise in Switzerland and Europe and
alternatives are sought. The European project REPCO (Replacement of Copper Fungicides
in Organic Production of Grapevine and Apple in Europe) aims to contribute to the
replacement of copper fungicides in organic agriculture by studying and developing new
organically based fungicides and potentiators of resistance, new biocontrol agents and new
integrated management systems. New products or strategies have a chance only if their
efficacy is durable in time.
Monitoring methods for detecting resistance toward fungicides are traditionally
based on bioassay procedures. For P. viticola, tests are performed on detached leaves or in
microtiter plates, determining dose response curves for different fungicide classes. These
methods allow investigating of possible development of resistance, determining if and
when resistance develops, and consent to identify resistant isolates (FRAC 2005).
In a few cases where the mutation is known, molecular analysis may also reveal the
presence of resistant individuals (Hamamoto et al. 2001, Proffer et al. 2006). This method
is only applicable if a single, or a combination of few mutations, leads to resistance.
In Matasci et al. (2008) a high throughput method based on neutral specific SSR
markers for detecting selection in P. viticola populations is presented. The method is based
on the hypothesis formulated by Grünwald et al. (2006) stating that genotypic diversity
would progressively decrease in a pathogen population exposed to a fungicide imposing
selection pressure toward resistance.
In the present work the method was implemented for investigating if selection
pressure is exerted on P. viticola populations by a broad palette of fungicides with different
and unknown modes of action, which are already in use or are proposed to be used in
organic viticulture.

CHAPTER 3
26
MATERIAL AND METHODS
Vineyard and treatments
The screening-vineyard was established at Fibl in Frick (Switzerland) in 1997 and consists
of 576 vines of cultivars Müller-Thurgau and Chasselas planted alternately. The distance
between rows was 2 meters; distance within the rows was 1.1 meters. Treatments were
arranged in a „Randomized Block Design“, with four replicates, each consisting of six
vines per variety. The plants were treated on schedule (Tab. 1) with an air assisted
knapsack sprayer or a compressor assisted sprayer until near run-off. The experiments were
carried out following the EPPO-guidelines (EPPO).
Disease severity
Disease severity (proportion of diseased leaf area) per plant was calculated by counting the
number of leaves with disease from a subset of 20 to 50 leaves per plant and estimating the
mean disease severity on the leaves with disease (Schärer, personal communication).
Samplings
Collected samples, consisting of half a sporulating lesion (about 1 cm2, including some
healthy leaf tissue) were excised with a cutter. Coordinates were assigned to the samples to
locate their exact position in the vineyard (Gobbin et al. 2003). In 2005 maximally 10
lesions per vine per treatment were collected from six vines of cultivar Müller-Thurgau and
six vines of cultivar Chasselas after important infective events. In 2006 maximally 16
lesions per vine per treatment were collected from six vines of cultivar Müller-Thurgau at a
single sampling date.
Genotyping
Samples collected in 2005 were analyzed following the protocol of Gobbin et al. (2003). To
improve amplification efficiency samples collected in 2006 were analyzed using newly
designed primers (CHAPTER 5) targeting the four polymorphic P. viticola-specific SSR loci,
BER, CES, GOB and ISA. Fragments were analyzed as described in CHAPTER 5.

CHAPTER 3
27
Table 1. Product name, code, producer, active ingredient, and applied product concentration of the treatments
performed in 2005 and 2006 in the experimental field at FiBL in Frick (Switzerland) (Schärer, personal
communication).
Product name
Code Producer Active ingredient Applied product concentration (%)a
2005 Aliette ALI Aventis Crop Science, 69263 Lyon, F Fosetyl-Al 0.25-0.50
Chitoplant CHI CHIPRO GmbH, Fahrenheitstr. 1, 28359 Bremen, D
Chitin, Chitosan 0.10-1.00
Sonata Chitoplant
KBV 99-01
COMb AgraQuest, Inc., 1530 Drew Avenue, Davis, CA 95616, USA CHIPRO GmbH, Fahrenheitstr. 1, D-28359 Bremen, D Koppert Biological Systems BV, 2650 AD Berkel en Rodenrijs, NL
Bacillus pumilus Strain QST 2808 Chitin, Chitosan Lactoperoxidase
0.40
0.10-1.00
0.00-0.15
Kocide DF COP Griffin Corp. Valdosta, Georgia, USA Cu-Hydroxide 0.10 Sonata SON AgraQuest, Inc., 1530 Drew Avenue, Davis,
CA 95616, USA Bacillus pumilus Strain QST 2808
0.40
Mycosin Stulln-S
Kocide DF
STRc Andermatt Biocontrol, Grossdietwil, CH
Gebr. Schaette KG, 88332 Bad Waldsee, D Agrostulln, Werksweg 2, 92551 Stulln, D Griffin Corp. Valdosta, Georgia, USA
Acidified clay Sulfur
Cu-Hydroxide
0.00-0.80
0.00-0.50
0.00-0.10 Tri-40 TRI Trifolio-M GmbH, Sonnenstrasse 22,
35633 Lahnau, D Citrus-extract 0.25
Yukka Extract
YUK Deru Ned bv., Natuurlijke Gewasbescherming, Bleiswijk, Bestebreurtje, NL
Saponin 1.00
2006 Agat-25k AGA BIO BIZ Company, 107140 Moscow, RU Inactivated
Pseudomonas extracts
1.00
Kocide DF COP Griffin Corp. Valdosta, Georgia, USA Cu-Hydroxide 0.10 Novosil NOV Vorozhtsov Novosibirsk Institute of Organic
Chemistry SB RAS, 630090 Novosibirsk, RU Extract of Siberian pine tree
0.50
Tecnobiol TEC Tecnotrea srl, Crema, I Potassium salt of linoleic and oleic acid
1.00
Timorex TIM Biomor Israel Ltd, 16 Menachem Begin St. Gama House, Ramat Gan 52521, IL
Tea Tree Oil 1.00
a Concentrations of the products were changed during the season. Values indicate minimal and maximal
concentration applied b Treatments 1-6: Sonata+Chitoplant, treatments 7-17: Sonata+Chitoplant+KBV 99-01 c Treatments 1-5 and 11-15: Mycosin+Stulln-S, treatments 6-10 and 16-17: Kocide DF

CHAPTER 3
28
Multilocus genotypic diversity and population structure
Genotypic diversity indexes, including Shannon-Wiener’s index H, Shannon’s equitability
index EH, evenness index E5 and the genotypic richness were calculated. (Shannon and
Weaver 1949, Pielou 1966, Ludwig et al 1988, Grünwald et al. 2001, 2003, Gotelli and
Entsminger 2007, Gobbin et al. 2006, Matasci et al. 2008). The genotype occurring at the
highest frequency was defined dominant genotype (DGEN), while genotypes occurring
only once were defined as single genotypes (SGEN) (Gobbin et al. 2005). The
contributions of dominant and single genotypes to the total disease incidence (DI) were
calculated by dividing the number of lesions generated by DGEN and SGEN by the sample
size and were expressed as a percentage (DI%DGEN and DI%SGEN).
Population genetic structure was examined by testing the null hypothesis that the
allele distribution is not significantly different across populations collected on different host
cultivars and treated with different fungicides. Pair wise tests for allelic differentiation were
performed by using the overall loci G-statistic, and their significance was evaluated after
applying the sequential Bonferroni correction for multiple tests (Gobbin et al. 2006). The
degree of differentiation among the plots was quantified using Weir and Cockerham‘s
estimator (theta) of Wright‘s FST, as calculated in FSTAT (Weir and Cockerham 1984,
Goudet 1995).
RESULTS
In the season 2005 the first P. viticola symptoms were observed on 30/05/2005. In the
untreated plot (KON), median disease severity values by the last assessment date
(23/08/2005) reached 90.0% and 98.0% on Müller-Thurgau and Chasselas, respectively.
Values observed for the two control treatments COP and ALI and for the copper based
strategy (STR), were 7.0% and 8.0%, 15.0% and 7.0%, and 10.0% and 7.5%, for the tree
treatments and the two cultivars Müller-Thurgau and Chasselas, respectively. Median
severity for CHI, COM, YUK SON and TRI were between 47.5% and 90.0% for Müller-
Thurgau, and between 66.0% and 95.0% for Chasselas by the last assessment date.

CHAPTER 3
29
The first symptoms of downy mildew in 2006 were observed on 07/06. Median
disease severity values in the untreated control plot (KON) reached 8.6% on 28/06. In the
copper treated control plot (COP), the median disease severity values were 0.4% on the
28/06. The highest median disease severity values were observed for AGA (8.6%) and
NOV (7.8%). Median disease severity values observed for TEC and TIM reached 3.1% and
2.9% on 28/06 (Schärer, personal communication).
Data from the five samplings performed in 2005 were pooled. A total of 673 and
419 individuals were collected and genotyped in 2005 and 2006, respectively. A maximum
of 115 (KON, in 2005) and 90 (TIM, in 2006), and a minimum of 37 (COM, in 2005) and
36 (TEC, in 2006) individuals were considered per population (Tab. 2).
Table 2. Number of individuals completely genotyped in the seasons 2005 and 2006, samples collected at
five (17/06, 28/06, 04/07, 20/07 and 24/08/05) and one (29/06/06) sampling dates at FiBL in Frick
(Switzerland).
Code 17/06/05 28/06/05 04/07/05 20/07/05 24/08/05 Code 29/06/06 KON 2 31 5 49 28 KON 73 COP 5 32 52 COP 71 ALI 31 43
CHI 3 21 26 AGA 63 COM 11 26 NOV 86 SON 4 12 2 23 12 TEC 36 STR 2 1 17 62 TIM 90 TRI 1 28 5 10 22 YUK 11 51 4 17 24 Total 18 124 25 211 29 Total 41
Non significant different FST values (P<0.05) were obtained for P. viticola
populations collected on Müller-Thurgau and Chasselas, exposed to the same treatment
(year 2005, data not shown). Therefore individuals collected on the two cultivars and
exposed to the same treatment were pooled. The lowest diversity was observed in the ALI
and in the TEC-populations in 2005 and 2006, respectively.
The expected number of genotypes in a sample size of N=36 isolates
(corresponding to the largest common population size) ranged from 30 to 35. The lowest
g36 values were observed for the ALI (30) and the TEC (31) populations, the highest for
COM (35), CHI, SON and the control copper treated COP-population (all three 34).
The Shannon-Wieners’s index H was significantly different between the untreated
KON- and the ALI- and TEC- treated populations (Tab. 3). The lowest Shannon’s
equitability and evenness index values were observed in the ALI (EH = 0.89, E5 = 0.63) and
in the TEC- treated populations (EH = 0.92, E5 = 0.72) (Tab. 3). The proportion of disease

CHAPTER 3
30
incidence by the dominant genotype (DGEN) was more than 10% in the TEC- (16.67%),
ALI- (13.16%) and AGA- (11.11%) treated populations. The lowest values were observed
in the COP- (3.37%, in 2005), SON- (3.77%), NOV- (4.65%) and YUK- (4.67%) treated
populations. Disease incidence derived by single genotypes (SGEN) was equal or higher
than 90% in the COM- (94.59%) and CHI- (90.00%) treated populations (Tab. 3).
Table 3. Number of individuals genotyped at all four SSR loci, number of different genotypes, expected
number of genotypes calculated for the largest common sample size, dominant- and single genotype-derived
disease incidence, Shannon-Wiener’s index, Shannon’s equitability index and evenness calculated for P.
viticola populations collected in 2005 and 2006 at FiBL in Frick (Switzerland).
Code Na gb g36c DI%SGEN
d DI%DGENe Hf EH
g E5h
2005 KON 115 91 32 66.96 6.96 4.37 0.92 0.77 COP 89 81 34 83.15 3.37 4.36ns 0.97 0.95 ALI 76 59 30 69.74 13.16 3.86*** 0.89 0.63 CHI 50 47 34 90.00 6.00 3.82 ns 0.98 0.95 COM 37 36 35 94.59 5.41 3.57 ns 0.99 0.98 SON 53 49 34 84.91 3.77i 3.87 ns 0.97 0.96 STR 80 68 33 76.25 5.00 4.14 ns 0.94 0.88 TRI 66 53 31 68.18 7.58 3.86 ns 0.92 0.84 YUK 107 81 32 61.68 4.67j 4.26 ns 0.91 0.83 2006 KON 73 61 32 72.60 6.85 4.02 0.94 0.86 COP 71 60 32 76.06 7.04 4.00 ns 0.94 0.85 AGA 63 53 32 77.78 11.11 3.83 ns 0.92 0.74 NOV 86 74 33 76.74 4.651 4.23 ns 0.95 0.88 TEC 36 31 31 83.33 16.67 3.28*** 0.92 0.72 TIM 90 78 33 80.00 5.56 4.27 ns 0.95 0.85
a Individuals genotyped at all four SSR loci b Number of genotypes observed c Expected number of genotypes calculated for the largest common sample size (N=36) estimated using the
rarefaction method (Grünwald et al. 2003, Gotelli and Entsminger 2007) d Percentage refers to the SGEN-derived disease incidence [DI%SGEN = (NSGEN/N)] e Percentage refers to the DGEN-derived disease incidence [DI%DGEN = (NDGEN/N)] f Shannon-Wiener’s index (Shannon and Weaver 1949, Grünwald et al. 2003). The value followed by ***
indicates that H in this population was significantly different (P<0.001) from the H of the KON-population of
the same year; ns: not significant, negative variance component g Shannon’s equitability (Pielou 1966, Gobbin et al. 2006) h Evenness (Ludwig and Reynolds 1988, Grünwald et al. 2003) i Four different DGEN in the treated population j Two different DGEN in the treated population

CHAPTER 3
31
DISCUSSION
Both years were characterized by high disease pressure. The best protection from P.
viticola was obtained with Kocide DF (COP), with the copper based strategy (STR) and
with Aliette (ALI). The organically based fungicides Tecnobiol (TEC), Chitoplant (CHI),
Timorex (TIM), Yukka extract (YUK) and the combination of Sonata, Chitoplant and
KBV99-01 (COM) provided only limited protection against the disease. Agat-25k (AGA),
Novosil (NOV), Tri-40 (TRI) and Sonata alone (SON) totally failed to control P. viticola
(Schärer H. –J. personal communication).
The population diversity indexes H, EH and E5 calculated for untreated and CHI-,
COM-, SON-, STR-, TRI-, YUK-, COP-, AGA-, NOV-, TIM treated populations of P.
viticola were very similar. EH was close to 1 indicating a high proportion of genotypes
occurring only once (SGEN). Treated and untreated populations presented a comparable
number of genotypes (estimated by rarefaction), a high percentage of single genotypes and
a low occurrence of clones derived from the MFG. This picture is not expected in case of a
strong selection pressure toward resistance, where few selected highly frequent genotypes
are supposed to colonize the vines. Tecnobiol (TEC) and Aliette (ALI) engendered a
significant but very low reduction in diversity in the P. viticola populations. To our
knowledge no resistance to products based on potassium salts of linoleic and oleic acids
(active ingredients of Tecnobiol) are reported in literature. Instead, resistance to Fosetyl-Al
(active ingredient of Aliette) was reported for Pseudoperonospora cubensis in Israel and
potential risk for resistance development were observed also in the Czech Republic (Cohen
and Samoucha 1984, Urban and Lebeda 2007). Insensitivity to Fosetyl-Al was reported for
Bremia lactucae populations infecting Lactuca sativa in California and for Phytophthora
cinnamomi populations infecting the ornamental Chamaecyparis lawsoniana in France
(Brown et al. 2004, Vegh et al. 1985). Further tests are needed to determine if Fosetyl-Al
and Tecnobiol truly exert selection pressure on P. viticola.
We concluded that selection pressure was not exerted on downy mildew populations
by the tested organically based fungicides in accord with the general opinion that
fungicides with indirect mode of action and/or with multisite activity are unlikely to
engender resistance in the target pathogen’s population (Gullino et al. 2000, Urban and
Lebeda 2006).

CHAPTER 3
32
ACKNOWLEDGEMENTS
The authors are grateful to Rocchina Abbas-Pennella for the laboratory work, Thomas
Amsler for the maintaining work in the vineyard, Niklaus Grünwald for performing the
analysis with the algorithm <Rarefac.c>, Marcello Zala, Paolo Galli and Giovanni Broggini
for helpful discussion regarding improvement of PCR. This work was funded by SBF
03.0485-1 (EU Project 501542 REPCO).
L ITERATURE CITED
Brown, S., Koike, S. T., Ochoa, O. E., Laemmlen, F., Michelmore, R. W. 2004. Insensitivity to the fungicide
Fosetyl-aluminium in California isolates of the lettuce downy mildew pathogen, Bremia lactucae.
Plant Disease, 88: 502-508.
Cohen, Y., Samoucha, Y. 1984. Cross-resistance to four systemic fungicides in metalaxyl-resistant strains of
Phytophthora infestans and Pseudoperonospora cubensis. Plant Disease, 68: 137-139.
EPPO Guidelines PP 1/31 (3); PP 1/152 (2); PP 1/181 (2).
EPPO/OEPP. 1999: EPPO Standard PP 1/213(1) Resistance Risk Analysis, EPPO Bulletin. 29: 325-347.
FRAC. 2005. http://www.frac.info/frac/index.htm.
Gobbin, D., Pertot, I., Gessler, C. 2003. Identification of microsatellite markers for Plasmopara viticola and
establishment of high throughput method for SSR analysis. European Journal of Plant Pathology,
109: 153-164.
Gobbin, D., Jermini, M., Loskill, B., Pertot, I., Raynal, M., Gessler, C. 2005. Importance of secondary
inoculum of Plasmopara viticola to epidemics of grapevine downy mildew. Plant Pathology, 54:
522-534.
Gobbin, D., Rumbou, A., Linde, C., Gessler, C. 2006. Population genetic structure of Plasmopara viticola
after 125 years of colonization in European vineyards. Molecular Plant Pathology, 7: 519-531.
Gotelli, N. J., Entsminger, G. L. 2007. EcoSim: Null models software for ecology. Version 7. Acquired
Intelligence Inc. & Kesey-Bear. Jericho, VT 05465. http://www.garyentsminger.com.
Goudet, J. 1995. FSTAT (Version 1.2): A computer program to calculate F-statistics. Journal of Heredity, 86:
485-486.
Grünwald, N. J., Flier, W. G., Sturbaum, A. K., Garay-Serrano, E., van den Bosch, T. B. M., Smart, C. D.,
Matuszak, J. M., Lozoya-Saldaña, H., Turkensteen, L. J., Fry, W. E. 2001. Population structure of
Phytophthora infestans in the Toluca Valley region of Central Mexico. Phytopathology, 91: 882-890.
Grünwald, N. J., Goodwin, S. B., Milgroom, M. G., Fry, W. E. 2003. Analysis of genotypic diversity data for
populations of microorganisms. Phytopathology, 93: 738-746.

CHAPTER 3
33
Grünwald, N. J., Sturbaum, A. K., Romero Montes, G., Garay Serrano, E., Lozoya-Saldaña, H., Fry, W. E.
2006. Selection for fungicide resistance within a growing season in field populations of
Phytophthora infestans at the center of origin. Phytopathology, 96: 1397-1403.
Gullino, M. L., Leroux, P., Smith, C. M. 2000. Uses and challenges of novel compounds for plant disease
control. Crop Protection, 19: 1-11.
Hamamoto, H., Hasegawa, K., Nakaune, R., Lee, Y. J., Akutsu, K., Hibi, T. 2001. PCR-based detection of
sterol demethylation inhibitor-resistant strains of Penicillium digitatum. Pest Management Science,
57: 839-843.
Ludwig, J. A., Reynolds, J. F. 1988. Statistical Ecology: A primer on methods and computing, Wiley, J. and
Sons (eds.), New York.
Matasci. C. L., Gobbin, D., Schärer, H.-J., Tamm, L., Gessler, C. 2008. Selection for fungicide resistance
throughout a growing season in populations of Plasmopara viticola. European Journal of Plant
Pathology, 120: 79-83.
Pielou, E. C. 1966. Measurement of diversity in different types of biological collections. Journal of
Theoretical Biology, 13: 131-144.
Proffer, T. J., Berardi, R., Ma, Z., Nugent, J. E., Ehret, G. R., McManus, P. S., Jones A. L., Sundin, G. W.
2006. Occurrence, distribution, and polymerase chain reaction-based detection of resistance to sterol
demethylation inhibitor fungicides in populations of Blumeriella jaapii in Michigan.
Phytopathology, 96: 709-717.
Sundin, G. W. 2006. Occurrence, distribution, and polymerase chain reaction-based detection of resistance to
sterol demethylation inhibitor fungicides in populations of Blumeriella jaapii in Michigan.
Phytopathology, 96: 709-717.
Shannon, C. E., Weaver, W. 1949. The mathematical theory of communication, University of Illinois,
Urbana.
Urban, J., Lebeda, A. 2006. Fungicide resistance in cucurbit downy mildew-methodological, biological and
population aspects. Annals of Applied Biology, 149: 63-75.
Urban, J., Lebeda, A. 2007. Variation of fungicide resistance in Czech populations of Pseudoperonospora
cubensis. Journal of Phytopathology, 155: 143-151.
Vegh, I., Leroux, P., Le Berre, A., Lanen, C. 1985. Detection on Chamaecyparis lawsoniana ‘Ellwoodii’ of a
strain of Phytophthora cinnamomi resistant to Fosetyl-Al. P. H. M.-Revue Horticole, 262: 19-21.
Weir, B. S., Cockerham, C. C. 1984. Estimating F-statistics for the analysis of population structure.
Evolution, 38: 1358-1370.

34

35
CHAPTER 4
Effects of grapevine cultivar mixtures onto
Plasmopara viticola – Epidemiology

CHAPTER 4
36
ABSTRACT
Plasmopara viticola is one of the most important grape diseases worldwide, strong attacks
can result in complete plant defoliation and production of low quality or entirely destroyed
grapes. Control of the pathogen in organic agriculture is achieved almost exclusively with
copper treatments. Copper has deleterious effects on living organisms in soil and therefore
the permitted amounts are limited. The European project REPCO (Replacement of Copper
Fungicides in Organic Production of Grapevine and Apple in Europe) aims to contribute to
the replacement of copper fungicides in organic agriculture by studying and developing
new organically based fungicides and new integrated management systems. Positive effects
of a reduction of crop homogeneity in terms of crop mixtures or cultivar mixtures are
reported in literature for different crops. We established a vineyard consisting of eight Vitis
vinifera and hybrids cultivars differing in resistance to the pathogen arranged in four
within-row mixture blocks and in one one-cultivar-by-row block. Grapevine cultivar
mixtures were effective in reducing P. viticola disease on susceptible cultivars in a year
with low disease levels, while in the two following years, characterized by higher disease
levels, this positive effect was observed solely for one cultivar in each year. Epidemic
severity, so as a possible adaptation of P. viticola to one or more components of the
mixture, could be possible explanations for this decrease of efficacy. Results from the
genetic analysis will be presented in CHAPTER 5.

CHAPTER 4
37
INTRODUCTION
Downy mildew caused by the diploid heterothallic obligate biotroph Oomycete Plasmopara
viticola (Berk. & Curt.) Berl and de Toni, is one of the most important grape (Vitis vinifera)
diseases worldwide. The pathogen affects leaves and fruits of grape plants, causing plant
defoliation and production of low quality or entirely destroyed grapes. Oospores are formed
after the fusion of gametes in autumn by temperatures lower than 12°C (Schruft and
Kassemeyer 1999). During May to late October, depending on the region (Gobbin et al.
2003a, Rumbou and Gessler 2006) oospores germinate. Germinating oospores contain over
40 mitotic nuclei, which migrate from the oospora in the macrosporangium formed at the
apex of one or more germ tubes (until three, Burruano et al. 2006). Hill (personal
communication to Gobbin, Gobbin 2003) estimates that up to 60 zoospores are contained in
one macrosporangium. Rossi et al. (2006) in their model of dynamic simulation of
grapevine downy mildew primary infections, assume that zoospores swim in the film of
water covering the leaf litter. Subsequently they reach the grape leaves by splashes and
aerosols triggered by rainfall. Sporangia produced on primary lesions are wind and splash-
dispersed, and under the presence of leaf wetness, zoospores are released and start
secondary infections. The number of secondary cycles may vary between years or regions
depending on rain events and on the presence of dew (Lafon and Clerjeau 1988, Schruft
and Kassemeyer 1999).
In organic viticulture, grapevine protection strongly depends from copper. However
copper causes deleterious effects on living organisms in soil (Renella et al. 2002) and does
not completely fulfil the requirement of sustainability. In Swiss organic viticulture, copper
quantities are limited to 6 kg per hectare per year, and over a period of 5 consecutive years
to maximally 20 kg per hectare (Ordinanza del DFE sull’agricoltura biologica. Modifica del
2 novembre 2006). In the European Union (Council Regulation (EEC) No 2092/91,
Appendix II) starting from 1st January 2007, the maximum quantity which may be used
each year per hectare shall be calculated by subtracting the quantities actually used in the 4
preceding years from, respectively, 36, 34, 32 and 30 kg copper for the years 2007, 2008,
2009 and 2010 and following years.
In traditional calendar based applications these limits are difficult to observe and
may lead to insufficient protection and therefore to damages in years with high disease
pressure.

CHAPTER 4
38
The European project REPCO (Replacement of Copper Fungicides in Organic
Production of Grapevine and Apple in Europe) aimed to contribute to the replacement of
copper fungicides in organic agriculture by studying and developing new organically based
fungicides and potentiators of resistance, new biocontrol agents and new integrated
management systems, like cultivar mixtures.
Positive effects of a reduction of crop homogeneity in terms of crop mixtures or
cultivar mixtures are reported in literature for different crops (Mundt 2002). Already in the
eighteenth century a reduction of rust infection in mixtures of wheat and oats was observed
(Groenewegen and Zadoks 1979, reported in Wolfe 1985). A substantial disease severity
reduction of polycyclic, specialized, wind-dispersed foliar diseases, such as rusts, powdery
mildews, and rice blast was demonstrated for mixtures of small-grain cultivars (reviewed in
Cox et al. 2004). Mixtures of potato cultivars led to a reduction of the P. infestans
epidemic, indicating that cultivar mixtures are also effective in reducing polycyclic
epidemics in broadleaved plants attacked by pathogens causing rapidly expanding lesions
(Andrivon et al. 2003, Garrett and Mundt 2000, Garrett et al. 2001). Experiments indicated
that mixtures can delay or reduce the impact of disease also in perennial crops. Reduction
of coffee rust caused by Hemileia vastatrix in commercial mixed coffee tree plantations
(resumed in Finckh et al. 1999), of Venturia inaequalis in mixed apple orchards
(simulations by Blaise and Gessler 1994, Kellerhals et al. 2003, Didelot et al. 2007) and of
rust in mixed Salix plantations (resumed in McCracken and Dawson 2003) were observed.
The majority of the experiments concern pathosystems in which pathogenicity and
resistance vary qualitatively (Cowger and Mundt 2002). The effects of host genotype
mixtures on disease progression and pathogen evolution in pathosystems not characterized
by gene-for-gene interactions or specificity are not well understood until now (Cowger and
Mundt 2002). Besides race-specific qualitative resistance resulting in gene-for-gene
interactions, apple has race-nonspecific quantitative resistance, which is durable and
effective against all Venturia inaequalis races. It is postulated that in this system resistance
is determined by the additive effect of a variable number of quantitative trait loci that
condition a basically compatible interaction in which V. inaequalis produces a sporulating
stroma resulting in little noticeable damage to the host tissue (MacHardy et al. 2001).
The model for risk assessment developed by McDonald and Linde (2002) proposes
that pathogen populations exposed to weaker selection (hosts with quantitative resistance)
will evolve more slowly than pathogen populations exposed to strong (hosts with major
gene resistance), directional selection over many generations. Evolution of pathogen

CHAPTER 4
39
populations exposed to quantitative resistance will result in an “erosion” rather than a
breakdown of resistance (boom-and-bust cycle, McDonald and Linde 2002). Further
quantitative resistance is sensitive to environmental conditions, therefore distribution of
pathogenicity vary from year to year as result of genotype-by-environment interactions
(McDonald and Linde 2002).
Within the European project REPCO we established a vineyard consisting of eight
grapevine cultivars differing quantitatively in resistance toward P. viticola arranged in four
within-row mixture blocks and in one one-cultivar-by-row block.
The objective of the experiment presented in this first epidemiological part was to
assess if grapevine cultivar mixtures are effective in reducing severity and incidence of P.
viticola disease.
MATERIAL AND METHODS
Cultivars
Vitis vinifera and interspecific hybrid cultivars differing in relative resistance to P. viticola
were selected, namely Müller-Thurgau as highly susceptible, Gamaret as susceptible,
Merlot and Isabella as less susceptible, Regent and Bianca as resistant, and Solaris and
Chambourcin as highly resistant (Tab. 1).
Experimental plot design
The experimental plot was planted in May 2004 in Cugnasco (Ticino, Southern Part of
Switzerland). The planting system consisted in four within-row mixture blocks (MIX
blocks) and in one one-cultivar-by-row block (MONO block, Fig. 1). MIX blocks consisted
of 8 rows a 16 vines, with two vines of each cultivar planted nearby. The MONO block
consisted of 8 rows a 15 vines, with one single cultivar per row. Distance between vines
was 0.8 × 2.0 m, distance between blocks was 1.6 m. The planting density in the
experimental plot was 6250 vines/ha. Vines were trained in a Guyot system.

CHAPTER 4
40
Table 1. Parentage, country of origin, year of crossing and level of resistance, surface and percentage of the whole viticultural area in Ticino (Southern Part of Switzerland)
for the cultivars used in the experiment.
Cultivars Parentagea Country of origina Year of crossinga Level of resistanceb Surface (ha)c Müller-Thurgaud Riesling × Madeleine Royale D 1882 – – 2.47 (0.24%) Gamaretd Gamay × Reichensteiner CH 1970f – 18.49 (1.78%) Merlotd F –/ + 834.12 (80.37%) Isabellae V. labrusca × V. vinifera USA 1816 –/ + 1.32 (0.13%) Regente Diana × Chambourcin D 1967 + 1.61 (0.15%) Biancae Eger 2 × Bouvier HUN 1963 + 0.09 (0.01%) Solarise Merzling × (Saperavi severnyi × Muscat ottonel) D 1975 ++ 0.91 (0.09%) Chambourcine Seyve Villard 12-417 × Chancellor F ++ 2.31 (0.22%) a From VIVC 2007
b – – , highly susceptible cultivar – susceptible cultivar, –/ + less susceptible cultivar, +, resistant cultivar, ++, highly resistant cultivar (Jermini, personal communication) c From DFE 2007
d Vitis vinifera cultivar e Interspecific hybrid f From Basler and Pfenninger, 2002
Figure 1. Representation of planting arrangements of the eight V. vinifera and interspecific hybrid cultivars in the experimental plot. In the first four blocks grapevine
cultivars are arranged in a within-row mixture (MIX 1 to 4), in the fifth block vines of each cultivar are arranged in one one-cultivar-by-row system (MONO). Each square
represents one vine, letters from A to H represent the eight V. vinifera and interspecific hybrid cultivars (A: Regent, B: Merlot, C: Isabella, D: Müller-Thurgau, E: Solaris, F:
Bianca, G: Gamaret, H: Chambourcin), grey intensities represent levels of resistance (black, highly susceptible cultivar (– –); dark grey, susceptible cultivar (–); light grey,
less susceptible cultivar (–/+); lighter grey, resistant cultivar (++); white, highly resistant cultivar (+++), in brackets code used in Tab. 1).
CHAPTER 4
41
Crop management
Pruning, canopy management, fertilization and weeds control were conducted as in the
surrounding vine-growers’ vineyards. Every season vines were treated with Difenoconazol,
in order to protect them from powdery mildew. Moreover treatments to protect the young
plantlets were applied in 2004 (9th and 24th June, and 4th August: Cyrano® + Thiovit®; 9th
and 26th July: Cabrio® + Folpet®; 23rd August: Cyrano® + Slick®; 3rd September:
Cyrano® + Cuprofix®). And in 2007 copper hydroxide was applied on 12th and 28th June,
in order to reduce the disease impact and allow a longer period of epidemiological
observations. Treatments with Applaud®, against Scaphoideus titanus, had to be performed
in 2007 as prescribed by the authorities.
Meteorological data and number of possible infection events
Meteorological data (rain amount, average temperature, average relative humidity), were
recorded by means of a weather station placed near the experimental plot in Cugnasco
(Markasub-CR10x, data available at www.agrometeo.ch). The number of possible infection
events, subdivided in strong, middle and weak, was summed starting from the first
predicted event to the last disease assessment performed in the year (data available at
www.agrometeo.ch).
Disease assessment
In April one central shoot per vine was randomly chosen and labelled in order to follow P.
viticola course on the same shoot during the whole season. Disease was assessed visually
on leaves of the primary shoot (P) and on leaves of the secondary shoots (S, deriving from
this primary shoot) after completion of incubation time after important infective events
determined by rain and temperature (Tab. 2, Fig. 1).
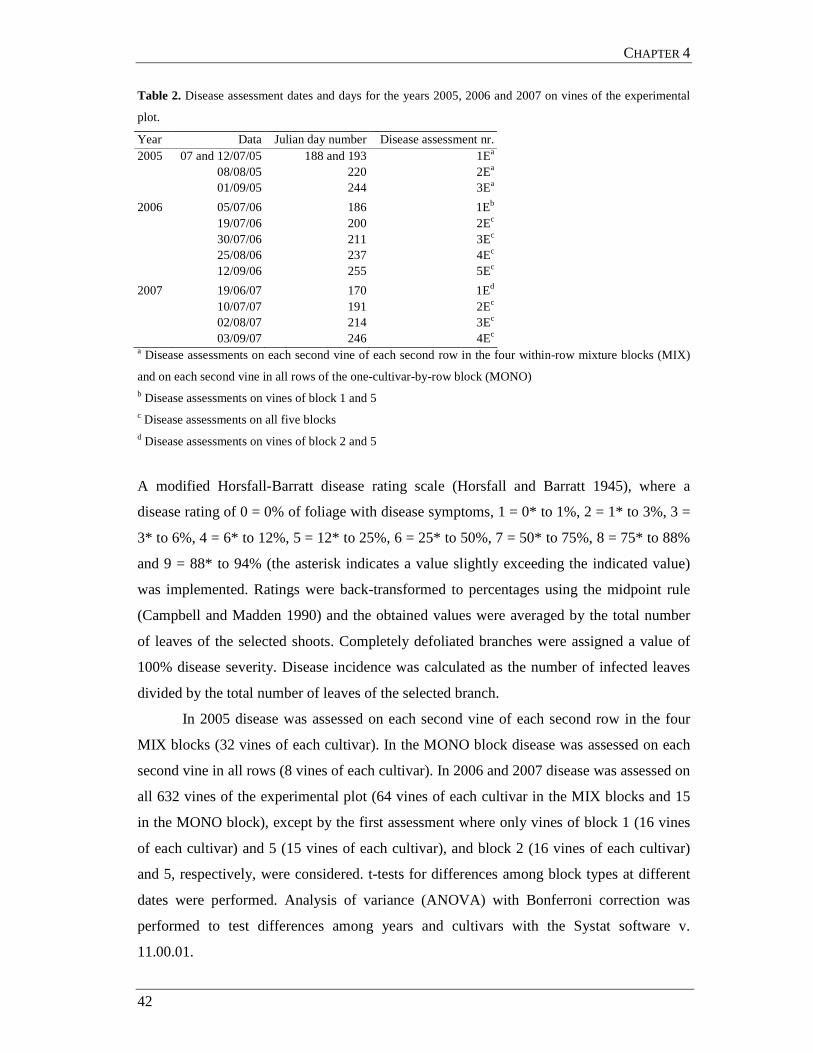
CHAPTER 4
42
Table 2. Disease assessment dates and days for the years 2005, 2006 and 2007 on vines of the experimental
plot.
Year Data Julian day number Disease assessment nr. 2005 07 and 12/07/05 188 and 193 1Ea 08/08/05 220 2Ea 01/09/05 244 3Ea 2006 05/07/06 186 1Eb 19/07/06 200 2Ec 30/07/06 211 3Ec 25/08/06 237 4Ec 12/09/06 255 5Ec 2007 19/06/07 170 1Ed 10/07/07 191 2Ec 02/08/07 214 3Ec 03/09/07 246 4Ec a Disease assessments on each second vine of each second row in the four within-row mixture blocks (MIX)
and on each second vine in all rows of the one-cultivar-by-row block (MONO) b Disease assessments on vines of block 1 and 5 c Disease assessments on all five blocks d Disease assessments on vines of block 2 and 5
A modified Horsfall-Barratt disease rating scale (Horsfall and Barratt 1945), where a
disease rating of 0 = 0% of foliage with disease symptoms, 1 = 0* to 1%, 2 = 1* to 3%, 3 =
3* to 6%, 4 = 6* to 12%, 5 = 12* to 25%, 6 = 25* to 50%, 7 = 50* to 75%, 8 = 75* to 88%
and 9 = 88* to 94% (the asterisk indicates a value slightly exceeding the indicated value)
was implemented. Ratings were back-transformed to percentages using the midpoint rule
(Campbell and Madden 1990) and the obtained values were averaged by the total number
of leaves of the selected shoots. Completely defoliated branches were assigned a value of
100% disease severity. Disease incidence was calculated as the number of infected leaves
divided by the total number of leaves of the selected branch.
In 2005 disease was assessed on each second vine of each second row in the four
MIX blocks (32 vines of each cultivar). In the MONO block disease was assessed on each
second vine in all rows (8 vines of each cultivar). In 2006 and 2007 disease was assessed on
all 632 vines of the experimental plot (64 vines of each cultivar in the MIX blocks and 15
in the MONO block), except by the first assessment where only vines of block 1 (16 vines
of each cultivar) and 5 (15 vines of each cultivar), and block 2 (16 vines of each cultivar)
and 5, respectively, were considered. t-tests for differences among block types at different
dates were performed. Analysis of variance (ANOVA) with Bonferroni correction was
performed to test differences among years and cultivars with the Systat software v.
11.00.01.

CHAPTER 4
43
Analysis
The area under disease progress curve (AUDPC) was calculated for disease severity and
incidence assessed on each primary and secondary shoots according to the trapezoidal
integration method (Campbell and Madden 1990) to summarize epidemic in each year,
block system and cultivar. Data of the four MIX blocks (64 vines per each cultivar, totally
512 vines) were pooled. For epidemics 2005 values of all three assessment dates were
considered (time span: 7th July-1st September), for 2006 and 2007 values form the first
assessment date were not considered (time span: 5th July-12th September 2006 and 10th
July-3rd September 2007). Analysis of variance (ANOVA) with Bonferroni correction was
performed on the AUDPCs to test differences among systems and cultivars with the Systat
software v. 11.00.01.
RESULTS
Meteorological conditions
Meteorological conditions in Cugnasco varied considerably in the years 2005, 2006 and
2007. During the period April-September 535.3 mm/m2, 686.6 mm/m2 and 1211.4 mm/m2
of rain fell the first, second and third year, respectively (norm values 1961-1990: 1104
mm/m2, meteorological station Magadino, data from Meteoswiss). Average temperatures
varied between 18.8°C (2007) and 19.6°C (2005), with 19.0°C measured in 2006 (norm
values 1961-1990: 16.6°C, meteorological station Magadino, data from Meteoswiss).
Compared to a regular season, 2005 was characterized by irregular temperatures in April,
reduced amount of rains in June, higher temperatures in July, low temperatures and few
precipitations in August and September (Fig. 2). Higher than average temperatures and
reduced precipitations in April, May and June (no precipitations with more than 0.1mm/m2
between 19th May and 2nd July), high temperatures and stormy rainfalls in July, low
temperatures and abundant rainfalls in August characterized season 2006 (Fig. 2). The
season 2007 was distinguished by high temperatures and frequent and abundant
precipitations; mostly in form of thunderstorms occurring in the afternoon and evening after
a dry and sunny morning (end of May and begin of June). The first third of the month of
July was rainy; the rest of the month was characterized by high temperatures and reduced
precipitations (Fig. 2).

CHAPTER 4
44
The warning model Agrometeo indicated 30 (10 strong, 11 middle and 9 weak), 41
(16 strong, 12 middle and 13 weak) and 60 (42 strong, 12 middle and 6 weak) possible
infection events for 2005, 2006 and 2007, respectively.
Figure 2. Rain amount (bars, mm), average temperature (black line, °C), and relative humidity (grey line, %)
recorded in Cugnasco during the period 01/04 to 30/09 for the years 2005, 2006 and 2007. Black rhombi
indicate the time point of the first lesion observation in the experimental plot, white rhombi indicate the time
points of epidemiological assessments (1E, 2E, … 5E = first, second, … fifth epidemiological assessment),
white circles indicate the time points of sample collection (1S, 2S, … 7S = first, second, … seventh sample
collection).

CHAPTER 4
45
Figure 3. Evolution of P. viticola severity in the MIX (black circle) and in the MONO block (white circle) assessed on primary shoots of vines of cultivars Müller-Thurgau,
Gamaret, Merlot, Isabella, Regent, Bianca, Solaris and Chambourcin in 2005 (first line), 2006 (second line) and 2007 (third line). Values on the y-axis indicate % disease
severity. Days indicate Julian days. Each point represents the mean of the severity assessed on the primary shoot of 64 (four MIX blocks) respectively 15 vines (one
monoblock). Exceptions: 2005: by the first assessment 32 vines in the MIX (four blocks) and 8 vines in the MONO, by the second and third assessment 16 vines in the MIX
(four blocks) and 8 in the MONO; 2006 and 2007 by the first assessment 16 vines in the MIX (one block) and 15 in the MONO. Asterisks indicate significant differences (P
≤0.05) between values assessed on vines in MIX and in the MONO block system.
160170180190200210220230240250260DAY
0
10
20
30
40
50
60
70
80
90
100
160 170 180 190 200 210 220 230 240 250 260DAY
0
10
20
30
40
50
60
70
80
90
100
160170180190200210220230240250260DAY
0
10
20
30
40
50
60
70
80
90
100
160 170 180 190 200 210 220 230 240 250 260DAY
0
10
20
30
40
50
60
70
80
90
100
160 170 180 190 200 210 220 230 240 250 260DAY
0
10
20
30
40
50
60
70
80
90
100
160 170 180190 200 210 220 230240 250 260DAY
0
10
20
30
40
50
60
70
80
90
100
160 170 180 190 200 210 220 230 240 250 260DAY
0
10
20
30
40
50
60
70
80
90
100
160 170 180 190 200 210 220 230 240 250 260DAY
0
10
20
30
40
50
60
70
80
90
100
160170180190200210220230240250260DAY
0
10
20
30
40
50
60
70
80
90
100
160170180190200210220230240250260DAY
0
10
20
30
40
50
60
70
80
90
100
160170180190200210220230240250260DAY
0
10
20
30
40
50
60
70
80
90
100
160170180190200210220230240250260DAY
0
10
20
30
40
50
60
70
80
90
100
160170180190200210220230240250260DAY
0
10
20
30
40
50
60
70
80
90
100
160170180190200210220230240250260DAY
0
10
20
30
40
50
60
70
80
90
100
160170180190200210220230240250260DAY
0
10
20
30
40
50
60
70
80
90
100
160170180190200210220230240250260DAY
0
10
20
30
40
50
60
70
80
90
100
160170180190200210220230240250260DAY
0
10
20
30
40
50
60
70
80
90
100
160170180190200210220230240250260DAY
0
10
20
30
40
50
60
70
80
90
100
160170180190200210220230240250260DAY
0
10
20
30
40
50
60
70
80
90
100
160170180190200210220230240250260DAY
0
10
20
30
40
50
60
70
80
90
100
160 170 180 190 200 210 220 230 240 250 260DAY
0
10
20
30
40
50
60
70
80
90
100
160 170 180 190 200 210 220 230 240 250 260DAY
0
10
20
30
40
50
60
70
80
90
100
160170180190 200210220230240250260DAY
0
10
20
30
40
50
60
70
80
90
100
Müller-Thurgau Gamaret Merlot Isabella Regent Bianca Solaris Chambourcin
*
*
* *
* * * *
*
* * * *
*
* * *
*
*
* *
*
*
* *
* 2005
2007
2006
160 170 180 190 200 210 220 230 240 250 260DAY
0
10
20
30
40
50
60
70
80
90
100
*

CHAPTER 4
46
Figure 4. Evolution of P. viticola incidence in the MIX (black circle) and in the MONO block (white circle) assessed on primary shoots of vines of cultivars Müller-Thurgau,
Gamaret, Merlot, Isabella, Regent, Bianca, Solaris and Chambourcin in 2005 (first line), 2006 (second line) and 2007 (third line). Values on the y-axis indicate % disease
incidence. Days indicate Julian days. Each point represents the mean of the incidence assessed on the primary shoot of 72 (four MIX blocks) respectively 15 vines (one
monoblock). Exceptions: 2005: by the first assessment 32 vines in the MIX (four blocks) and 8 vines in the MONO, by the second and third assessment 16 vines in the MIX
(four blocks) and 8 in the MONO; 2006 and 2007: by the first assessment 16 vines in the MIX (one block) and 15 in the MONO. Asterisks indicate significant differences (P
≤ 0.05) between values assessed on vines in MIX and in the MONO block system.
Müller-Thurgau Gamaret Merlot Isabella Regent Bianca Solaris Chambourcin
160 170 180 190 200 210 220 230 240 250 260DAY
0
10
20
30
40
50
60
70
80
90
100
160 170 180 190 200 210 220 230 240 250 260DAY
0
10
20
30
40
50
60
70
80
90
100
160170180190200210220230240250260DAY
0
10
20
30
40
50
60
70
80
90
100
160170180190200210220230240250260DAY
0
10
20
30
40
50
60
70
80
90
100
160170180190200210220230240250260DAY
0
10
20
30
40
50
60
70
80
90
100
160 170 180 190 200 210 220 230 240 250 260DAY
0
10
20
30
40
50
60
70
80
90
100
160 170 180 190 200 210 220 230 240 250 260DAY
0
10
20
30
40
50
60
70
80
90
100
160 170 180 190 200 210 220 230 240 250 260DAY
0
10
20
30
40
50
60
70
80
90
100
160 170 180 190 200 210 220 230 240 250 260DAY
0
10
20
30
40
50
60
70
80
90
100
160 170 180 190 200 210 220 230 240 250 260DAY
0
10
20
30
40
50
60
70
80
90
100
160170180190200210220230240250260DAY
0
10
20
30
40
50
60
70
80
90
100
160 170 180 190 200 210 220 230 240 250 260DAY
0
10
20
30
40
50
60
70
80
90
100
160170180190200210220230240250260DAY
0
10
20
30
40
50
60
70
80
90
100
160 170 180 190 200 210 220 230 240 250 260DAY
0
10
20
30
40
50
60
70
80
90
100
160 170 180 190 200 210 220 230 240 250 260DAY
0
10
20
30
40
50
60
70
80
90
100
160 170 180 190 200 210 220 230 240 250 260DAY
0
10
20
30
40
50
60
70
80
90
100
160 170 180 190 200 210 220 230 240 250 260DAY
0
10
20
30
40
50
60
70
80
90
100
160 170 180 190 200 210 220 230 240 250 260DAY
0
10
20
30
40
50
60
70
80
90
100
160 170 180 190 200 210 220 230 240 250 260DAY
0
10
20
30
40
50
60
70
80
90
100
160 170 180 190 200 210 220 230 240 250 260DAY
0
10
20
30
40
50
60
70
80
90
100
160170180190200210220 230240250260DAY
0
10
20
30
40
50
60
70
80
90
100
160 170 180 190 200 210 220 230 240 250 260DAY
0
10
20
30
40
50
60
70
80
90
100
160 170 180 190 200 210 220 230 240 250 260DAY
0
10
20
30
40
50
60
70
80
90
100
160 170 180 190 200 210 220 230 240 250 260DAY
0
10
20
30
40
50
60
70
80
90
100
*
* * *
*
*
*
* *
*
*
*
*
*
* *
*
2005
2007
2006

CHAPTER 4
47
Figure 5. Evolution of P. viticola severity in the MIX (black circle) and in the MONO block (white circle) assessed on secondary shoots of vines of cultivars Müller-Thurgau,
Gamaret, Merlot, Isabella, Regent, Bianca, Solaris and Chambourcin in 2005 (first line), 2006 (second line) and 2007 (third line). Values on the y-axis indicate % disease
severity. Days indicate Julian days. Each point represents the mean of the severity assessed on the secondary shoot of 72 (four MIX blocks) respectively 15 vines (one
monoblock). Exceptions: 2005: by the first assessment 32 vines in the MIX (four blocks) and 8 vines in the MONO, by the second and third assessment 16 vines in the MIX
(four blocks) and 8 in the MONO; 2006 and 2007: by the first assessment 16 vines in the MIX (one block) and 15 in the MONO. Asterisks indicate significant differences (P
≤ 0.05) between values assessed on vines in MIX and in the MONO block system.
Müller-Thurgau Gamaret Merlot Isabella Regent Bianca Solaris Chambourcin
160 170 180 190 200 210 220 230 240 250 260DAY
0
10
20
30
40
50
60
70
80
90
100
160 170 180 190 200 210 220 230 240 250 260DAY
0
10
20
30
40
50
60
70
80
90
100
160 170 180 190 200 210 220 230 240 250 260DAY
0
10
20
30
40
50
60
70
80
90
100
160 170 180 190 200 210 220 230 240 250 260DAY
0
10
20
30
40
50
60
70
80
90
100
160170180190200210220230240250260DAY
0
10
20
30
40
50
60
70
80
90
100
160 170 180 190 200 210 220 230 240 250 260DAY
0
10
20
30
40
50
60
70
80
90
100
160 170 180 190 200 210 220 230 240 250 260DAY
0
10
20
30
40
50
60
70
80
90
100
160 170 180 190 200 210 220 230 240 250 260DAY
0
10
20
30
40
50
60
70
80
90
100
160 170 180 190 200 210 220 230 240 250 260DAY
0
10
20
30
40
50
60
70
80
90
100
160 170 180 190 200 210 220 230 240 250 260DAY
0
10
20
30
40
50
60
70
80
90
100
160 170 180 190 200 210 220 230 240 250 260DAY
0
10
20
30
40
50
60
70
80
90
100
160 170 180 190 200 210 220 230 240 250 260DAY
0
10
20
30
40
50
60
70
80
90
100
160170180190200210220230240250260DAY
0
10
20
30
40
50
60
70
80
90
100
160 170 180 190 200 210 220 230 240 250 260DAY
0
10
20
30
40
50
60
70
80
90
100
160 170 180 190 200 210 220 230 240 250 260DAY
0
10
20
30
40
50
60
70
80
90
100
160 170 180 190 200 210 220 230 240 250 260DAY
0
10
20
30
40
50
60
70
80
90
100
*
* *
*
* * * *
*
*
2005
2007
2006

CHAPTER 4
48
Figure 6. Evolution of P. viticola incidence in the MIX (black circle) and in the MONO block (white circle) assessed on secondary shoots of vines of cultivars Müller-
Thurgau, Gamaret, Merlot, Isabella, Regent, Bianca, Solaris and Chambourcin in 2005 (first line), 2006 (second line) and 2007 (third line). Values on the y-axis indicate %
disease incidence. Days indicate Julian days. Each point represents the mean of the incidence assessed on the secondary shoot of 72 (four MIX blocks) respectively 15 vines
(one monoblock). Exceptions: 2005: by the first assessment 32 vines in the MIX (four blocks) and 8 vines in the MONO, by the second and third assessment 16 vines in the
MIX (four blocks) and 8 in the MONO; 2006 and 2007: by the first assessment 16 vines in the MIX (one block) and 15 in the MONO. Asterisks indicate significant
differences (P ≤ 0.05) between values assessed on vines in MIX and in the MONO block system.
Müller-Thurgau Gamaret Merlot Isabella Regent Bianca Solaris Chambourcin
160 170 180 190 200 210 220 230 240 250 260DAY
0
10
20
30
40
50
60
70
80
90
100
160 170 180 190 200 210 220 230 240 250 260DAY
0
10
20
30
40
50
60
70
80
90
100
160 170 180 190 200 210 220 230 240 250 260DAY
0
10
20
30
40
50
60
70
80
90
100
160 170 180 190 200 210 220 230 240 250 260DAY
0
10
20
30
40
50
60
70
80
90
100
160170180190200210220230240250260DAY
0
10
20
30
40
50
60
70
80
90
100
160 170 180 190 200 210 220 230 240 250 260DAY
0
10
20
30
40
50
60
70
80
90
100
160 170 180 190 200 210 220 230 240 250 260DAY
0
10
20
30
40
50
60
70
80
90
100
160 170 180 190 200 210 220 230 240 250 260DAY
0
10
20
30
40
50
60
70
80
90
100
160 170 180 190 200 210 220 230 240 250 260DAY
0
10
20
30
40
50
60
70
80
90
100
160 170 180 190 200 210 220 230 240 250 260DAY
0
10
20
30
40
50
60
70
80
90
100
160 170 180 190 200 210 220 230 240 250 260DAY
0
10
20
30
40
50
60
70
80
90
100
160 170 180 190 200 210 220 230 240 250 260DAY
0
10
20
30
40
50
60
70
80
90
100
160170180190200210220230240250260DAY
0
10
20
30
40
50
60
70
80
90
100
160 170 180 190 200 210 220 230 240 250 260DAY
0
10
20
30
40
50
60
70
80
90
100
160 170 180 190 200 210 220 230 240 250 260DAY
0
10
20
30
40
50
60
70
80
90
100
160 170 180 190 200 210 220 230 240 250 260DAY
0
10
20
30
40
50
60
70
80
90
100
160 170 180 190 200 210 220 230 240 250 260DAY
0
10
20
30
40
50
60
70
80
90
100
160 170 180 190 200 210 220 230 240 250 260DAY
0
10
20
30
40
50
60
70
80
90
100
160 170 180 190 200 210 220 230 240 250 260DAY
0
10
20
30
40
50
60
70
80
90
100
160 170 180 190 200 210 220 230 240 250 260DAY
0
10
20
30
40
50
60
70
80
90
100
160170180190200210220230240250260DAY
0
10
20
30
40
50
60
70
80
90
100
160 170 180 190 200 210 220 230 240 250 260DAY
0
10
20
30
40
50
60
70
80
90
100
160 170 180 190 200 210 220 230 240 250 260DAY
0
10
20
30
40
50
60
70
80
90
100
160 170 180 190 200 210 220 230 240 250 260DAY
0
10
20
30
40
50
60
70
80
90
100
* *
*
* *
* *
* *
*
2005
2007
2006

CHAPTER 4
49
Disease progress
Years
In 2006 significantly higher (P ≤ 0.001) disease severity and incidence values on primary so
as on secondary shoots were observed over all cultivars and block types, followed by 2007
and 2005 (Fig. 3 to 6). No significant differences (P = 0.018) in disease severity on
secondary shoots were observed between the years 2006 and 2007.
Cultivars
The expected behaviour of the eight cultivars concerning the resistance levels were mostly
confirmed by the observations made in 2005, 2006 and 2007 (Tab. 1, Fig. 3 to 6).
Significant differences (P ≤ 0.001) among cultivars were observed. A trend for significantly
higher (P ≤ 0.001) disease severity and incidence on primary and secondary shoots of the
susceptible cultivars Müller-Thurgau, Gamaret and Merlot compared to the resistant
Regent, Bianca and Chambourcin was observed in the three years over the two block types.
Values observed for Isabella and Solaris lay between the ones observed on susceptible and
resistant cultivars (Fig. 3 to 6).
The steepest disease severity increase on primary shoots was observed in 2005
between the 8th August and the 1st of September (Julian days 220-244) on all cultivars in
both block types, with the exception of Isabella in the MIX block where the steepest
increase was observed between the 12th July and the 8th August (Julian days 193-220, Fig.
3). In 2006 the steepest disease severity increase observed on primary shoots occurred on
vines of cultivars Gamaret (both block types) and Müller-Thurgau (in the MIX block)
between the 19th and the 30th July (Julian days 200-211), and between the 30th July and the
25th August (Julian days 211-237) on Merlot, Solaris, Bianca, Regent in both block types,
and on Müller-Thurgau and on Chambourcin in the MONO and in the MIX block,
respectively. On Isabella and Chambourcin (MONO block) the steepest disease severity
increase was observed between the 25th August and the 12th of September (Julian days 237-
255, Fig. 3).
In 2007 the steepest disease severity increase on primary shoots was observed for
Müller-Thurgau, Gamaret, Merlot and Isabella between the 19th June and the 10th of July
(Julian days 170-191), and between the 2nd August and the 3rd September (Julian days 214-
246, Fig. 3) on Regent, Bianca, Solaris and Chambourcin (Fig. 3). A similar trend was
observed on secondary shoots, however steep disease increase was observed earlier
(between the 7th of July and 12th August; Julian days 188-220) on secondary than on

CHAPTER 4
50
primary shoots on Müller-Thurgau (in the MONO block) and Gamaret (in the MIX block)
in 2005. In 2006 and 2007, a steep disease increase on secondary shoots of Solaris (in the
MONO block, 2006) and of Isabella (2007) was observed later than on primary shoots (Fig.
4).
On the susceptible cultivars Müller-Thurgau, Gamaret, Merlot and Isabella in all
three years, the steepest disease incidence on primary and secondary shoots was observed
between the first and second assessment (7th July-8th August 2005, 5th-19th July 2006 and
19th June-10th July 2007, Fig. 5 and 6). While on resistant cultivars Bianca and
Chambourcin the steepest disease incidence on primary and secondary shoots was observed
between the second-last and the last assessment in 2005 and 2007 (8th August -1st
September 2005, and 2nd August-3rd September 2007). In 2006 the steepest disease
incidence increase was observed between the third and second-last assessment (30th July-
25th August).
Observations made on Solaris and Regent differed in the years. On Solaris the
steepest disease incidence increase on primary and secondary shoots in 2005 occurred in
the same time as observed for the susceptible cultivars, while in 2007 it was like observed
for the resistant cultivars. In 2006 the steepest disease incidence increase occurred lather
than observed for the susceptible cultivars but earlier than observed for the resistant
cultivars (between 19th and 30th July, Julian days 200-211, Fig. 5 and 6). On Regent the
steepest disease incidence increase was observed, in 2005 and 2007, between the second-
last and the last assessment, like observed for the resistant cultivars. While in 2006 the
steepest disease incidence increase occurred on primary shoots in both block types and on
secondary shoots in the MIX block between 19th and 30th July (Julian days 200-211), and
between 2nd August and 3rd September (Julian days 214-246) on secondary shoots in the
MONO block (Fig. 5 and 6).
Planting system
Significant differences (P ≤ 0.05) in disease severity on primary shoots between MONO
and MIX blocks were observed in 2005 by the last assessment date (1st September, Julian
day 244) for all cultivars (Fig. 3). Values assessed on vines of the most susceptible cultivars
Müller-Thurgau, Gamaret, Merlot and Isabella in the MIX block were significantly lower
(P ≤ 0.05) than those assessed on vines in the MONO block. The opposite situation was
observed for the most resistant cultivars Chambourcin, Solaris, Bianca and Regent, where

CHAPTER 4
51
lower severity values were assessed on vines of the MONO block then on them in the MIX
block. This trend was observed again only for Müller-Thurgau and Chambourcin in 2006,
and Gamaret and Solaris in 2007 (Fig. 3).
Disease severity values assessed on secondary shoots of vines planted in the MONO
block were significantly higher (P ≤ 0.05) then them assessed in the MIX block for
Gamaret (2005 and 2007), Merlot (2005) and Bianca (2006). The opposite situation,
namely significantly higher disease severity values in the MIX block than in the MONO
block, were observed for Bianca and Solaris (2005), Müller-Thurgau, Gamaret and Isabella
(2006) and Chambourcin (2007) (Fig. 5).
Significant differences (P ≤ 0.05) between the two planting systems in terms of
disease incidence were observed at early stages of the epidemics (Fig. 4 and 6). On primary
shoots significantly lower (P ≤ 0.05) disease incidence values were observed in the MIX
block for the susceptible cultivars Müller-Thurgau (2005), Merlot (2006) and Isabella
(2005, 2006). Lower disease incidence values were observed in the MONO block for the
resistant cultivars Chambourcin (2005), Solaris (2005, 2006, 2007), Bianca (2006) and
Regent (2005, 2006), and for the susceptible cultivars Isabella (in 2007) and Gamaret
(2006) (Fig. 4 and 6).
On secondary shoots significantly lower (P ≤ 0.05) disease incidence values were
observed in the MIX block for the susceptible cultivars Müller-Thurgau (2005), Gamaret
(2007) and Merlot (2006) and for the resistant cultivar Regent (2007). Lower disease
incidence values were observed in the MONO block for the resistant cultivars Solaris
(2007), Bianca (2005) and Regent (in 2006,) and for the susceptible cultivar Isabella (2006)
(Fig. 4 and 6)
Areas under disease progress curves (AUDPC)
Area under the disease severity curve (AUDPCSeverity) assessed on primary shoots of
susceptible cultivars was significantly lower (P ≤ 0.05) in the MIX block in two (Müller-
Thurgau and Merlot) and one case (Müller-Thurgau) in 2005 and 2006, respectively.
Oppositely significantly higher (P ≤ 0.05) severity in the MIX block on resistant cultivars
was observed in 2 cases in 2005 (Bianca and Chambourcin) and in one case each in 2006
(Chambourcin) and 2007 (Solaris) (Fig. 7a).
On secondary shoots significantly lower (P ≤ 0.05) AUDPCSeverity in the MIX block
for the susceptible cultivars was observed once each year (2005: Isabella, 2006: Merlot,
2007: Gamaret), while significantly higher (P ≤ 0.05) AUDPCSeverity for resistant cultivar in

CHAPTER 4
52
the MIX block was observed twice in 2007 (Bianca and Chambourcin). Significantly higher
(P ≤ 0.05) AUDPCSeverity on secondary shoots in the MIX block was observed for the
susceptible cultivars Isabella and Merlot in 2006 and 2007, respectively. While lower
AUDPCSeverity on secondary shoots in MIX block was observed for Bianca in 2006 (Fig.
7b).
On primary shoots area under the disease incidence curve (AUDPCIncidence) values
were significantly lower (P ≤ 0.05) in the MIX block for the susceptible cultivars in one
case in 2006 (Müller-Thurgau), and on secondary shoots in one case in 2007 (Gamaret).
Significantly higher (P < 0.05) AUDPCIncidence values in MIX block for resistant cultivars
were observed once in 2005 (Chambourcin) and in 2007 (Solaris), twice on primary shoots
in 2006 (Regent and Solaris), and once on secondary shoots in 2005 (Bianca) and 2006
(Regent). Significantly higher (P ≤ 0.05) AUDPCIncidence on secondary shoots in the MIX
block was observed for the susceptible cultivars Merlot in 2007 (Fig. 7c and d).
Figure 7. Average area under the disease progress curves (AUDPC) of natural P. viticola epidemics assessed
in the MIX (black bars) and in the MONO block (white bars) of the experimental plot in 2005, 2006, 2007 for
severity (a, b) and incidence (c, d) on primary (a, c) and secondary (b, d) shoots, respectively of cultivars
Müller-Thurgau (D), Gamaret (G), Merlot (B), Isabella (C), Regent (A), Bianca (F), Solaris (E) and
Chambourcin (H). Asterisks indicate significant differences (P < 0.05) between values assessed in the MIX
and in the MONO block.
Secondary shoots
Secondary shoots
Primary shoots
Primary shoots

CHAPTER 4
53
DISCUSSION
The three years of epidemiological observations in the experimental plot differed
significantly. In the first year (2005), the lowest P. viticola disease severity and incidence
levels were assessed, in the second year (2006) the highest values were observed. While in
2007, year in which meteorological conditions were most disease conducive and two
fungicide applications were performed to slow down the epidemic, intermediate disease
levels were assessed.
Levels of P. viticola disease on the eight V. vinifera and interspecific hybrid
cultivars in the three years corresponded to the assumed ranking in respect to P. viticola
resistance (Jermini, personal communication). High disease severity and incidence were
observed on the highly susceptible Müller-Thurgau and the susceptible cultivars Gamaret
and Merlot. Moderate disease for the less susceptible Isabella, and low disease for the
resistant Regent and Bianca and the highly resistant cultivars Solaris and Chambourcin.
In the first year the planting system caused clear and significant differences: lower
disease severity and incidence was assessed in the MIX block for the susceptible cultivars
Müller-Thurgau, Gamaret, Merlot and Isabella, while lower disease severity and incidence
was assessed in the MONO block for the resistant cultivars Regent, Bianca and
Chambourcin. Disease reduction in mixtures operates in three principal ways: (i) dilution of
inoculum, (ii) physical barrier effect and (iii) induction of defence reactions in the host
(Burdon and Chilvers 1976, 1982, Burdon and Shattock 1980, Trenbath 1984, Wolfe 1985).
The first two mechanisms occur with high probability for the susceptible cultivars in our
plot, if also the third one contributes can not be determined by our data. Andrivon et al.
(2003) observed that potato cultivar mixtures decrease the P. infestans epidemic spread on
the susceptible cultivar without altering the behaviour of the partially resistant one(s). In
our experiment we observed an increase of disease on the more resistant cultivars in
mixture; this could depend from a higher disease pressure exerted by the presence of
susceptible vines interposed among the more resistant ones.
The trend for lower disease in the MIX block than in the MONO block for
susceptible cultivars was observed again exclusively on one cultivar in both years (Müller-
Thurgau in 2006 and Gamaret in 2007). This strong decrease in mixture efficacy in
reducing disease on susceptible cultivars could depend from the more conducive conditions
observed in 2006 and 2007. This would be in accord with Andrivon et al. (2003) who
CHAPTER 4
54
observed for the potato-Phytophthora infestans pathosystem that progress rates were
reduced and sometimes delayed in mixed plots compared to unmixed ones only for the
slowest epidemic. Oppositely Leonard (1969) indicates that disease reduction due to mixing
will increase with increasing generations of pathogen reproduction. Cowger and Mundt
(2002) observed that in a year with severe epidemic, mixtures of wheat cultivars were less
diseased than were their component pure stands. The following year the epidemic was mild,
mixtures did not reduce nor increase Mycosphaerella graminicola disease severity, the third
year the epidemic intensity was intermediate, and mixture plots were more diseased than
the mean of component pure stands. Mundt (2002) concluded that “if high disease
incidence in pure stands is due to a fast approach to carrying capacity or large amounts of
outside inoculum (either initially or on a continuing basis), then mixtures may be less
effective in severe than in less severe epidemics. If, on the other hand, high disease
incidence in pure stands is being driven by the number of pathogen generations, then
mixtures may be more effective in severe than in less severe epidemics”. P. viticola
epidemics are characterized by a continuous contribution of primary oosporic infections
throughout the season (May to late October, depending on the region), with most genotypes
having a limited ability to spread asexually (Gobbin et al. 2003, Rumbou and Gessler 2004,
2006), this could partially explain the decrease in mixture efficacy in reducing P. viticola
observed in 2006 and 2007 in our experiment. However this is probably not the only
explanation, in so far as in 2007 two copper treatments were applied the 12th and 28th of
June reducing disease and slowing down substantially the epidemic. An adaptation of P.
viticola to one or more components of the mixture could be an ulterior explanation. Results
from the genetic analysis will be presented in CHAPTER 5.
ACKNOWLEDGEMENTS
This work was supported by SBF 03.0485-1 (Project 501542 REPCO). The author
gratefully acknowledges Michele Gusberti and Natasha Rosselli for helping with samples
collection and disease assessment, Sheila Isepponi and Rocchina Abbas-Pennella for
helping with the transcription of the epidemiological data, Davide Gobbin, Mauro Jermini
and Cesare Gessler for supervising the research and the interesting discussions, and
Roberto Rigoni and Mirto Ferretti for the maintaining work in the vineyard.

CHAPTER 4
55
L ITERATURE CITED
Andrivon, D., Lucas, J.-M., Ellissèche, D. 2003. Development of natural late blight epidemics in pure and
mixed plots of potato cultivars with different levels of partial resistance. Plant Pathology, 52: 586-
594.
Basler, P., Pfenninger, H. 2002. Serie “Andere Rebsorte”: Gamaret. Schweizerische Zeitschrift für Obst- und
Weinbau, 4: 81.
Blaise, P., Gessler, C. 1994. Cultivar mixture in apple orchards as a mean to control apple scab. Norwegian
Journal of Agricultural Sciences, 17: 105-112.
Burdon J. J., Chilvers G. A. 1976. Controlled environment experiments on epidemics of barley mildew in
different density host stands. Oecologica, 26: 61-72.
Burdon J. J., Chilvers G. A. 1982. Host density as factor in plant disease ecology. Annual Review of
Phytopathology, 20: 143-166.
Burdon J. J., Shattock R. C. 1980. Disease in plant communities. Applied Biology, 5: 145-219.
Burruano, S., Conigliaro, G., Lo Piccolo, S., Alfonso, A., Torta, L. 2006. Plasmopara viticola: three decades
of observation in Sicily. Proceedings of the 5th International Workshop on Grapevine Downy and
Powdery Mildew. San Michele all’Adige, Italy, 58-59.
Campbell, C. L., Madden, L. V. 1990. Introduction to Plant Disease Epidemiology. John Wiley & Sons, New
York.
Cowger, C., Mundt, C. C. 2002. Effects of wheat cultivar mixtures on epidemic progression of Septoria tritici
blotch and pathogenicity of Mycosphaerella graminicola. Phytopathology, 92: 617-623.
Cox, C. M., Garrett, K. A., Bowden, R. L., Fritz, A. K., Dendy, S. P., Heer, W. F. 2004. Cultivar mixtures for
the simultaneous management of multiple diseases: Tan spot and leaf rust of wheat. Phytopathology,
94: 961-969.
Didelot, F., Brun, L., Parisi, L. 2007. Effects of cultivar mixtures on scab control in apple orchards. Plant
Pathology, 56: 1014-1022.
Dipartimento delle finanze e dell'economia (DFE). Sezione dell'agricoltura. 2007. Rapporto sulla vendemmia
2007.
Finckh, M. R., Gacek, E. S., Czembor, H. J., Wolfe, M. S. 1999. Host frequency and density effects on
powdery mildew and yield in mixtures of barley cultivars. Plant Pathology, 48: 807-816.
Garrett, K. A., Mundt, C. C. 2000. Host diversity can reduce potato late blight severity for focal and general
patterns of primary inoculum. Phytopathology, 90: 1307-1312.
Garrett, K. A., Nelson, R. J., Mundt, C. C., Chacón, G., Jaramillo, R. E., Forbes, G. A. 2001. The effects of
host diversity and other management components on epidemics of potato late blight in the humid
highland tropics. Phytopathology, 91: 993-1000.
Gobbin, D., Pertot, I., Gessler, C. 2003. Genetic structure of a Plasmopara viticola population in an isolated
Italian mountain vineyard. Journal of Phytopathology, 151: 636-646.

CHAPTER 4
56
Gobbin, D. 2003. Redefining Plasmopara viticola epidemiological cycle by molecular genetics. PhD Thesis
ETH-Zürich.
Groenewegen, L. J. M., Zadoks, J. C. 1979. Exploiting within-field diversity as a defense against cereal
diseases: A plea for ’poly-genotype’ varieties. Indian Journal of Genetics and Plant Breeding, 39: 81-
94.
Horsfall, J. G., Barratt, R. W. 1945. An improved grading system for measuring plant diseases.
Phytopathology, 35: 655.
Kellerhals, M., Mouron, P., Graf, B., Bousset, L., Gessler, C. 2003. Mischpflanzungen von Apfelsorten:
Einfluss auf Krankheiten, Schädlinge und Wirtschaftlichkeit. Schweizerische Zeitschrift für Obst-
und Weinbau, 13: 10-13.
Lafon, R., Clerjeau, M. 1988. Downy mildew. Pearson, R. C., Goheen, A. C. (eds.), Compendium of Grape
Diseases, APS Press, St. Paul, Minnesota, USA, 11-13.
Leonard, K. J. 1969. Factors affecting rates of stem rust increase in mixed plantings of susceptible and
resistant oat varieties. Phytopathology, 59: 1845-1850.
MacHardy, W. E., Gadoury, D. M., Gessler, C. 2001. Parasitic and biological fitness of Venturia inaequalis:
Relationship to disease management strategies. Plant Disease, 85: 1036-1051.
McCracken, A. R., Dawson, W. M. 2003. Rust disease (Melampsora epitea) of willow (Salix spp) grown as
short rotation coppice (SRC) in inter- and intra-species mixtures. Annals of Applied Biology, 143:
381-393.
McDonald, B. A., Linde, C. C. 2002. Pathogen population genetics, evolutionary potential, and durable
resistance. Annual Review of Phytopathology, 40: 349-379.
Mundt. C. C. 2002. Use of multiline cultivars and cultivar mixtures for disease management. Annual Review
of Phytopathology, 40: 381-410.
Renella, G., Chaudri, A. M., Brookes, P. C. 2002. Fresh additions of heavy metals do not model long-term
effects on microbial biomass and activity. Soil Biology and Biochemistry, 34: 121-124.
Rossi, V., Bugiani, R., Caffi, T., Giosuè, S. 2006. Dynamic simulation of grape downy mildew primary
infections. Proceedings of the 5th International Workshop on Grapevine Downy and Powdery
Mildew. San Michele all’Adige, Italy, 109-111.
Rumbou, A., Gessler, C. 2004. Genetic dissection of Plasmopara viticola population from a Greek vineyard
in two consecutive years. European Journal of Plant Pathology, 4: 379-392.
Rumbou, A., Gessler, C. 2006. Particular structure of Plasmopara viticola populations evolved under Greek
island conditions. Phytopathology, 96: 501-509.
Schruft, G., Kassemeyer, H.-H. 1999. Rebenperonospora. Thomas Mann Verlag (ed.), Krankheiten und
Schädlinge der Weinrebe Gelsenkirchen-Buer, Germany, 14-17.
Trenbath B. R. 1984. Gene introduction strategies for the control of crop diseases. Pest and Pathogen Control:
Strategic, Tactical and Policy Models, Conway, G. R. (ed.), Chichester, Wiley, 142-668.
Vitis International Variety Catalogue (VIVC) 2007. IRZ Institut für Rebenzüchtung Geilweilerhof.
http://www.vivc.bafz.de/.
Wolfe, M. S. 1985. The current status and prospects of multiline cultivars and variety mixtures for disease
resistance. Annual Review of Phytopathology, 33: 451-456.

57
CHAPTER 5
Effects of grapevine cultivar mixtures onto
Plasmopara viticola - Population genetics

CHAPTER 5
58
ABSTRACT
Plasmopara viticola lesions were collected in 2005 and 2006 in the mixed grapevine
cultivar plot composed from vines of eight cultivars differing in resistance to the pathogen,
described in CHAPTER 4. No difference in genetic structure of P. viticola populations
depending on different spatial aggregations of grapevines (MIX block or MONO block)
was observed in 2005 and 2006. In both years significantly lower genotypic diversity was
observed on populations collected on resistant cultivars, while higher diversity was
observed for the ones collected on susceptible vines. For 2006 pathogen adaptation leading
to erosion of partial resistance can be hypothesized occurring on the three related cultivars
Regent, Bianca and Chambourcin. Further adaptation to the dominant resource can have
occurred in the plot so as generally over years in the vineyards for the most frequent
cultivars Merlot, Gamaret and Isabella-like American red vines. Considering the low or
absent positive effect of mixtures in reducing P. viticola disease in the second and third
year of observations, so as the difficulties of planting, growing, harvesting and handling
that a mixed cultivar will imply, we can suppose that grapevine cultivars mixture are not an
effective method to reduce P. viticola disease in vineyards and therefore reduce the amount
of copper applications in viticulture.

CHAPTER 5
59
INTRODUCTION
Cultivar mixtures are described as effective way to reduce disease on small annual crops as
cereals (Mundt 2002, Puccinia striiformis-wheat, Akanda et al. 1996, Magnaporthe grisea-
rice, Zhu et al. 2005) up to bigger annual (Phytophthora infestans-potato, Garrett and
Mundt 2000, Garrett et al. 2001, Andrivon et al. 2003) or perennials plants (Venturia
inaequalis-apple, Blaise and Gessler 1994, Kellerhals et al. 2003, Didelot et al. 2007,
Hemileia vastatrix-coffe, resumed in Finckh et al. 1999, Melampsora epitea-Salix, resumed
in McCracken and Dawson 2003). Within the European project REPCO (Replacement of Copper Fungicides in
Organic Production of Grapevine and Apple in Europe) a mixed grapevine cultivars plot,
comprehending eight Vitis vinifera and interspecific hybrid cultivars differing in relative
resistance to the Oomycete Plasmopara viticola (Berk. and Curt.) Berl and de Toni, was
planted. The effect of mixtures in reducing disease varied in the three years of observation.
In 2005 a significant disease reduction in mixtures compared to monoculture was observed
on susceptible vines. In 2006 and 2007 effects of mixtures were less pronounced or absent
(CHAPTER 4).
Five key characteristics that predict host-diversity effects leading to reduced disease
are suggested by Garrett and Mundt (1999): (a) small genotype unit area (GUA), (b)
shallow dispersal gradient of pathogen spores, (c) small lesion size, (d) short pathogen
generation time and (e) strong host specialization.
Smaller the genotype unit area (GUA, defined as the area occupied by an
independent unit of host tissue of the same genotype, Mundt and Browning 1985) grater the
mixture efficacy (Xu and Ridout 2000). Garret and Mundt (1999) indicate that smaller host
diversity effects were observed for mixtures of large crop plants. This is due to
autoinfection (defined as infection of a target host individual by inoculum produced on the
same target host individual, Robinson 1976) leading to a considerable increase in inoculum
(Heybrook 1982). Distribution of initial inoculum (if initial inoculum is distributed in a
single focus, mixture efficacy is reduced, Mundt 2002), number of units (Mundt and
Brophy 1988) and their spatial arrangement play an important role, too. Simulations of the
spread of race-specific aerial fungal pathogens showed that components arranged in square
blocks were more effective in reducing disease than if components were planted in stripes
(Xu and Ridout 2000), while Andrivon et al. (2003) showed that alternated rows of

CHAPTER 5
60
susceptible and partially resistant potato cultivars were effective in reducing P. infestans.
Mundt et al. (1996) found that random mixtures of wheat provided better disease control of
P. striiformis on wheat than did alternating strips or alternating hills. The grapevine
architecture favours autoinfection, even though in CHAPTER 6 we showed that only few
genotypes reproduce asexually on the same vine. It was estimated that 33% of the
genotypes is coming from surrounding vines.
Shallow dispersal gradients increase inoculum exchange among host genotype units,
while steep dispersal gradients, provide smaller host-diversity effects and decrease
inoculum exchange (Mundt and Leonard 1986, Garrett and Mundt 1999). Wind-dispersed
pathogens are more effectively reduced in mixtures than those caused by splashed-
dispersed pathogens (Garrett and Mundt 1999). Gobbin et al. (2005) showed five dispersal
patterns of P. viticola genotypes:(i) clonal multiplication at distances shorter than 1 m from
the putative primary lesion (close to the source); (ii) clonal multiplication close to the
source followed by plot-scaled dispersion; (iii) multicluster plot-scaled dispersion without
previous clonal multiplication close to the source; (iv) random plot-scaled dispersion
without previous clonal multiplication close to the source; and (v) minor clonal
multiplication and dispersal. Movement rates of genotypes in plot areas were estimated as
at <1– 2 m2/day (Gobbin et al. 2005). Intensive and almost complete samplings performed
on single vines of cultivars Regent, Merlot, Isabella, Müller-Thurgau and Solaris in 2006
showed that an important input to the epidemics at vine scale is given by primary
infections, and a reduced amount is due to autoinfection at vine scale (CHAPTER 6).
Simulations comparing mixture composed by 1/3 susceptible and 2/3 resistant
plants with pure susceptible stands showed that lesion expansion (enlargement of lesions
within host tissue) results in negative effects on mixture efficacy, this depending on the
spore dispersal gradient, the multiplication rate and the host carrying capacity (Lannou et
al. 1994a). Controlled-environment experiments and computerized simulations were
performed with mixtures of wheat cultivars resistant and susceptible to P. striiformis and P.
recondita f. sp. tritici (P. triticina, Lannou et al. 1994b). The two pathogens cause lesions
having different sizes; the first is semi-systemic within the leaves and causes lesions about
200 times larger than the ones caused by the second pathogen. Mixtures controlled P.
recondita f. sp. tritici (P. triticina, small lesions) more effectively than P. striiformis (large
lesions, Lannou et al. 1994b). In our plot, grapevine cultivars differed in lesion size and
sporulation amount. Lesions on Müller-Thurgau, Gamaret and Merlot are big; lesions on
Isabella are small, but can cover leaves completely at the end of the season; while small
CHAPTER 5
61
lesions accompanied by necrotic spots are characteristic for Regent, Bianca, Solaris and
Chambourcin.
Models indicate that effects of host diversity are greater, the more pathogen
generations occur during an epidemic (Leonard 1969). The three year of epidemiological
observations in the experimental plot differed, the season 2005 was characterized by a
reduced number of infective events, which should roughly approximate the number of
pathogen generations) if compared to 2006 and 2007. Further in 2007 two copper spray
applications were performed on two dates at the beginning of the epidemics (12th and 28th
of June). In 2005 grapevine cultivar mixtures were effective in reducing P. viticola, while
the two following years the positive effect was observed only in few cases. The positive
effect of fungicide treatments as matter of mixture effect improvement, described by Pilet
et al. (2006) in the P. infestans-potato pathosystem was not observed.
Wolfe (1985) stated that mixtures have to be composed by hosts that differ in their
susceptibility to the pathogen. And the most effective mixtures are suggested to be the ones
composed by hosts possessing race-specific resistance (Xu and Ridout 2000). Even though
disease reduction in pathosystems not characterized by gene-for-gene interactions or
specificity is possible due to differential adaptation (Cowger and Mundt 2002) and was
described for various pathosystems (rewieved in Garrett and Mundt 1999). Host
specialization within P. viticola is suggested by inoculation studies and sequencing data
(Schilder et al. 2006). Isolates from cultivar Niagara (V. labrusca) may be specifically
adapted to Niagara vines or possibly to Concord (V. labrusca), as well (Schilder et al.
2006). In our experiment none of the eight grapevine cultivars (three V. vinifera cultivars
and five interspecific hybrids) is known to possess race specific resistance to P. viticola.
Cultivars differed in their level of resistance respectively susceptibility to P. viticola. Boso
and Kassemeyer (2008) defined susceptibility as the lacking or delayed resistance response
of the host plant, and indicated that in susceptible host genotypes the pathogen successfully
penetrates the host, forms parasitation structures, colonizes the host tissue and completes its
infection cycle. Unger et al. (2007) found delayed development of P. viticola in the
resistant V. rupestris compared to the susceptible Müller-Thurgau. In grapevine
susceptibility is quantitative and among European grapevine cultivars there is a continuum
from highly to little susceptible (Boso and Kassemeyer 2008).
In the present chapter we want to investigate if there is a difference in genetic
structure of P. viticola populations depending i) on the spatial plant aggregation (MIX and
MONO) and ii) on different grapevine cultivars.

CHAPTER 5
62
MATERIAL AND METHODS
Grapevine cultivar description, their arrangement in the experimental plot, the management
of the plot and the obtaining of the meteorological data are presented in CHAPTER 4.
Sample collection
Sampling in the experimental plot started when the first symptoms were observed;
subsequently samples were collected after completion of incubation time after important
infective events determined by rain and temperature until downy mildew generated a
mosaic pattern, which impeded the collection of well delimitated lesions (Tab. 1). Collected
lesions were assigned coordinates (row and plant number) to locate their exact position in
the vineyard and to retrace the cultivars (Gobbin et al. 2003a). Samples consisted of half a
sporulating lesion (about 1 cm2, including some healthy leaf tissue) excised with a cutter
(Gobbin et al. 2003a). By the first and second sampling date every lesion observed in the
experimental plot was collected, afterwards maximally 4 lesions per vine were collected
(maximally one lesion per leaf). In 2005 sample collection was performed on all five blocks
(4 MIX: blocks 1 to 4 and the MONO: block 5), in 2006 exclusively on one MIX block
(block 1) and in the MONO block (block 5).
Table 1. Sample collection dates for the years 2005 and 2006 on vines of the experimental plot.
Year Data Sample collection nr. a 2005 02/06/05 1Sb 17/06/05 2Sb 06/07/05 3S 11/07/05 4S 18/07/05 5S 04/08/05 6S 01/09/05 7S 2006 26/05/06 1Sb 09/06/06 2Sb 10/07/06 3S 19/07/06 4S 31/07/06 5S 23/08/06 6S a Collection of maximally four P. viticola lesions per vine b Collection of all P. viticola lesions present in the experimental plot

CHAPTER 5
63
Sample processing
DNA extraction was performed as described in Gobbin et al. (2003a). Samples were
analyzed using newly designed primers targeting the four polymorphic P. viticola-specific
SSR loci, ISA, CES, BER and GOB (Tab. 2). The new primers were designed on sequences
obtained from the cloned loci originally used by Gobbin et al. (2003a) using the software
PRIMER 3. Amplification was performed, using 1.05 U Taq Polymerase (Pharmacia
Biotechnology Inc.) and 1 µl of DNA (not quantified); annealing temperature was 56°C for
all primers. PCR products were combined using 1-3 µl of each PCR product and sterile
water to a final volume of 15 µl. Four microliters of the combined PCR products were
mixed with 9 µl of HiDi formamide and 0.2 µl of GeneScan 500 LIZ size standard (Applied
Biosystems, Foster City, CA). Samples were denaturated for 2 min at 94°C and cooled on
ice. Fragments were separated on an ABI PRISM 3730xl (samples collected in 2005), 3100
and 3130 (samples collected in 2006) sequencer following the manufacturers’ instructions.
Fragments were analyzed with the program Genemapper v 4.0. Data analyzed with the
different sequencers were calibrated to allow comparisons. P. viticola genotypes were
defined combining alleles of the four loci ISA, CES, BER and GOB as described in Gobbin
et al. (2003a).
Table 2. Sequences of five new designed primers of the four variable loci ISA, CES, BER and GOB (Gobbin
et al. 2003a) Annealing temperature is 56°C for all primers.
Locus Primer sequence (5' - 3')a ISA ISANewf: GGC ATG GAC GTT GAC TCA C CES CESNewr: CAT CAG AAT GTT TGT GTG TG BER BERNewf: CAA GCA ATG CAA TGG TCT TC BERNewr: GGC ATC ACT CTC TAC CTG CTC GOB GOBNewr: ATC GCA CAG CTT AAT GCA TAT C
a f: forward primer, r: reverse primer

CHAPTER 5
64
Genotypic and gene diversity
Genotypic diversity was estimated for each block, cultivar, and sampling date by
calculating the Shannon index H (Shannon and Weaver 1949, Hayek and Buzas 1996) and
the Simpson index (Simpson 1949, Hayek and Buzas 1996), using the total number of
individuals in the sample. Calculations of the index and their standard deviations were
performed with the software EstimateS v. 8.0.0 (Colwell 2004). The ratio Ngen/Nles was
calculated by dividing the number of genotypes detected by the number of lesions
genetically determined.
Gene diversity was studied separately for each block, cultivar, and sampling date
using clone-corrected data. For each locus, the number of alleles, gene diversity (Nei 1973)
and allele frequency were calculated using the software Contrib (Petit et al. 1998).
Rarefaction considering the maximal common population size was considered (Petit et al.
1998).
Differentiation among populations
Pairwise FST estimates (Wright 1969) applying the log-likelihood statistic G for diploid
populations were used to quantify the magnitude of differentiation in allele frequencies
among populations. Differences among populations in their genetic composition were
examined by testing heterogeneity in allele frequencies under the null hypothesis of no
difference among populations for pairwise and overall differences. Significance in pairwise
comparisons was evaluated with a sequential Bonferroni adjustment of critical
probabilities. Calculations were performed by the software FSTAT vers. 2.9.3.2 (Goudet
2001) as described in Gobbin et al. (2003b).
Shared genotypes
Chao’s abundance-based Jaccard index (Chao et al. 2005) and standard error were
calculated among cultivars in both years using the software EstimateS v. 8.0.0 (Colwell
2004). Significance was tested by calculating 95% confidence intervals.

CHAPTER 5
65
RESULTS
Genotypic and gene diversity
Thousand-four-hundred-thirty-two and 1267 of the samples collected in the experimental
plot in 2005 and 2006 respectively were successfully genotyped. Eighty-nine
(corresponding to 1273 samples, 2005) and 73% (corresponding to 930 samples, 2006) of
the samples were considered in the analysis. The remaining 11 and 27% of the data, for
2005 and 2006, respectively were excluded from the analysis because more than two alleles
were scored at one or more SSR loci.
In 2005 sampling was performed in the four MIX blocks (blocks 1 to 4) and in the
MONO block, while in 2006 samples were collected exclusively on one MIX block (block
1) and in the MONO block.
Among P. viticola populations collected in 2005 in the five blocks significant
genotypic diversity for all considered indexes was observed. Diversity in the four MIX
blocks was either higher or lower than in the MONO block, therefore no trend could be
individuated (Tab. 3). No significant gene diversity over all loci was observed among
populations collected in the five blocks in 2005 (Tab. 7). In 2006 significant higher
genotypic and lower gene diversity were indicated by all indexes for populations collected
in the MONO block (Tab. 3 and 4).
Genotypic diversity of populations in the blocks over time was significantly lower
by the last sampling in 2005 for all blocks, except block 4 (lowest diversity by sampling 6,
Tab. 5), while gene diversity over all loci was significantly lower by the last sampling for
populations collected in block 1, block 4 and block 5. Lower allelic richness (except for
locus BER) by the last sampling was observed for populations collected in all five blocks
(Tab. 6). In 2006 for populations collected in the MIX and the MONO block lowest
Ngen/Nles ratios, indicating lower diversity, were individuated for the last sampling, while
Shannon and Simpson index indicated significantly lower diversity by the third sampling
(Tab. 5). In 2006 significantly lower gene diversity was assessed for population collected in
the MONO block by the first and second sampling (Tab. 6). If these two first sampling are
not considered (as it is the case for genotypic analysis) non significant differences in gene
diversity were observed for the population collected in the MONO block during time (Tab.
6).

CHAPTER 5
66
P. viticola populations collected on resistant cultivars showed in both years
significantly lower genotypic diversity than the populations collected on susceptible
cultivars (Tab. 7). No significant differences in gene diversity were assessed among
populations collected on the eight grapevine cultivars in 2005 and 2006 (Tab. 8).
Populations collected over time on susceptible cultivars and on Chambourcin
showed lower genotypic diversity by the last samplings (6 and 7); while for the resistant,
differences where either not significant or diversity was lower in earlier samplings (4 and 5)
in 2005 (Tab. 9). The same trend (lower diversity by the last samplings) was observed for
gene diversity, for populations collected on the susceptible cultivars Müller-Thurgau,
Gamaret and Merlot. A lower allelic richness was observes for populations collected on
Müller-Thurgau, Gamaret, Isabella, Regent, Solaris and Chambourcin (Tab. 10). In 2006
lower genotypic diversity in early samplings (third or fourth) was observed for the
susceptible cultivars, while higher genotypic diversity was observed for the more resistant
cultivars Bianca, Solaris and Chambourcin by the last sampling (Tab. 9). No significant
differences in gene diversity were observed in 2006 (Tab. 10).
Table 3. Genotypic diversity of P. viticola populations collected in MIX and MONO blocks on vines of
cultivars Müller-Thurgau, Gamaret, Merlot, Isabella, Regent, Bianca, Solaris and Chambourcin in the
experimental plot in Cugnasco in 2005 and 2006. For each year data of the different cultivars and sampling
dates were pooled. Number of lesions genetically determined (Nles), number of genotypes (Ngen), number of
genotypes/number of lesions genetically determined (Ngen/Nles), number of lesions of the most frequent
genotype (Max freq), Shannon index (H), Simpson index and standard deviations standardized to maximal
population sizes (underlined values). Values followed by the same letter are not significantly (P < 0.05)
different based on t-tests.
Year Block Nlesa Ngen
b Ngen/Nlesc Max freqd He SDf Simpsone SDf
2005 MIX 1 261 179 0.69 12 4.86d 0.03 148.08b 12.27 2005 MIX 2 271 192 0.71 16 4.91a 0.03 144.23c 15.68 2005 MIX 3 263 179 0.68 10 4.87c 0.03 158.18a 12.13 2005 MIX 4 247 146 0.59 17 4.61e 0.02 83.72e 4.58 2005 MONO 231 169 0.73 12 4.88b 0.01 136.92d 2.21 2006 MIX 1 484 240 0.50 33 4.88b 0.02 68.11b 2.88 2006 MONO 446 265 0.59 13 5.28a 0.00 187.86a 1.14
a Number of lesions genetically determined b Number of genotypes c Number of genotypes/number of lesions genetically determined d Number of lesions of the most frequent genotype e Shannon (H, Shannon and Weaver 1949, Hayek and Buzas 1996) Simpson index (Simpson 1949, Hayek and
Buzas 1996) standardized to population sizes of N2005 = 230 and N2006 = 445 f Standard deviation based on 1000 randomizations

CHAPTER 5
67
Table 4. Gene diversity of P. viticola populations collected in MIX and MONO blocks on vines of cultivars Müller-Thurgau, Gamaret, Merlot, Isabella, Regent, Bianca,
Solaris and Chambourcin in the experimental plot in Cugnasco in 2005 and 2006. For each year, data of the different cultivars and sampling dates were pooled. Number of
clone corrected genotypes (CCNgen), number of alleles (kISA, kCES, kBER and kGOB), allelic richness and gene diversity at the four loci ISA, CES, BER and GOB based on the
maximal common genotype number (underlined values * 2-1). Values followed by the same letter are not significantly (P < 0.05) different based on 95% confidence intervals.
N.of alleles Allelic richnessb Gene diversityc Year Block CCNgen
a kISA kCES kBER kGOB ISA CES BER GOB ISA CES BER GOB All 2005 MIX 1 179 6 10 2 39 4.82 8.63 1.00 37.21 0.58a 0.72a 0.48a 0.88a 0.67a 2005 MIX 2 192 6 9 4 44 4.99 7.94 2.70 39.27 0.47a 0.72a 0.48a 0.88a 0.64a 2005 MIX 3 179 6 9 3 38 5.00 7.93 1.97 35.35 0.48a 0.73a 0.46a 0.87a 0.64a 2005 MIX 4 146 6 9 2 38 5.00 8.00 1.00 37.00 0.51a 0.71a 0.44a 0.84a 0.63a 2005 MONO 169 6 12 4 42 4.86 10.32 2.73 39.88 0.50a 0.71a 0.49a 0.85a 0.64a 2006 MIX 1 240 6 10 2 41 5.00 9.00 1.00 40.00 0.65a 0.74a 0.50a 0.90a 0.70a 2006 MONO 265 6 10 2 48 4.99 8.91 1.00 46.10 0.53b 0.66b 0.46b 0.91a 0.64b
a Number of clone corrected genotypes
b Allelic richness after rarefaction N2005 = 291, N2006 = 479 c Gene diversity (Nei 1973)

CHAPTER 5
68
Table 5. Genotypic diversity in time of P. viticola populations collected in MIX and MONO blocks on vines
of cultivars Müller-Thurgau, Gamaret, Merlot, Isabella, Regent, Bianca, Solaris and Chambourcin in the
experimental plot in Cugnasco in 2005 and 2006. For each year, data of the different cultivars were pooled.
Number of lesions genetically determined (Nles), number of genotypes (Ngen), number of genotypes/number of
lesions genetically determined (Ngen/Nles), number of lesions of the most frequent genotype (Max freq),
Shannon index (H), Simpson index and standard deviations standardized to maximal population sizes
(underlined values). Values followed by the same letter are not significantly (P < 0.05) different based on t-
tests.
Year Block Sampling Nlesa Ngen
b Ngen/Nlesc Max freqd He SDf Simpsone SDf
2005 MIX 1 3S 15 14 0.93 2 2005 MIX 1 4S 61 52 0.85 3 3.39a 0.06 2005 MIX 1 5S 80 61 0.76 5 3.31b 0.08 2005 MIX 1 6S 70 59 0.84 5 3.37a 0.07 2005 MIX 1 7S 35 22 0.63 8 2.77c 0.04 15.76 1.35
2005 MIX 2 3S 10 8 0.80 3 2005 MIX 2 4S 54 44 0.81 4 3.54b 0.05 109.9b 33.72 2005 MIX 2 5S 87 70 0.80 5 3.60a 0.07 180.7a 114.2 2005 MIX 2 6S 75 61 0.81 4 3.58a 0.06 149.2a 76.4 2005 MIX 2 7S 45 36 0.80 6 3.42c 0.02 50.37c 5.63
2005 MIX 3 3S 10 10 1.00 1 2005 MIX 3 4S 44 40 0.91 2 3.40a 0.04 2005 MIX 3 5S 77 66 0.86 3 3.39a 0.06 2005 MIX 3 6S 99 73 0.74 6 3.30b 0.08 2005 MIX 3 7S 33 26 0.79 4 3.16c 0.00 52.8
2005 MIX 4 3S 15 13 0.87 2 2005 MIX 4 4S 51 37 0.73 7 3.20d 0.09 41.70d 14.37 2005 MIX 4 5S 65 48 0.74 4 3.40b 0.07 112.50a 45.77 2005 MIX 4 6S 77 50 0.65 8 3.26c 0.09 59.34c 23.71 2005 MIX 4 7S 39 34 0.87 4 3.43a 0.02 94.58b 15.92
2005 MONO 3S 11 9 0.82 3 2005 MONO 4S 51 39 0.76 3 3.21c 0.08 87.76a 42.52 2005 MONO 5S 79 62 0.78 7 3.28b 0.09 2005 MONO 6S 57 50 0.88 4 3.35a 0.06 2005 MONO 7S 33 27 0.82 4 3.16d 0.03 53.45b 7.22

CHAPTER 5
69
Table 5. Continuation.
Year Block Sampling Nlesa Ngen
b Ngen/Nlesc Max freqd He SDf Simpsone SDf
2006 MIX 1 1S 1 1 1.00 2006 MIX 1 2S 18 17 0.94 2 2006 MIX 1 3S 44 32 0.73 7 3.26c 0.03 34.01b 3.13 2006 MIX 1 4S 113 77 0.68 16 3.38a 0.12 56.64a 45.53 2006 MIX 1 5S 178 107 0.60 16 3.38a 0.12 63.64a 40.82 2006 MIX 1 6S 130 69 0.53 10 3.31b 0.11 53.69a 19.40
2006 MONO 1S 1 1 1.00 2006 MONO 2S 9 8 0.89 2 2006 MONO 3S 50 39 0.78 3 3.57c 0.02 94.54c 5.55 2006 MONO 4S 119 93 0.78 5 3.72a 0.07 211.1a 133.3 2006 MONO 5S 119 88 0.74 6 3.67b 0.07 153.9b 96.49 2006 MONO 6S 148 105 0.71 8 3.65b 0.08
a Number of lesions genetically determined b Number of genotypes c Number of genotypes/number of lesions genetically determined d Number of lesions of the most frequent genotype e Shannon (H, Shannon and Weaver 1949, Hayek and Buzas 1996) Simpson index (Simpson 1949, Hayek and
Buzas 1996) standardized to population sizes of N2005MIX 1 = 34, N2005MIX 2 = 44, N2005MIX 3 = 32, N2005MIX 4 = 38,
N2005MONO = 32, N2006MIX 1 = 43 and N2006MONO = 49 f Standard deviation based on 1000 randomizations
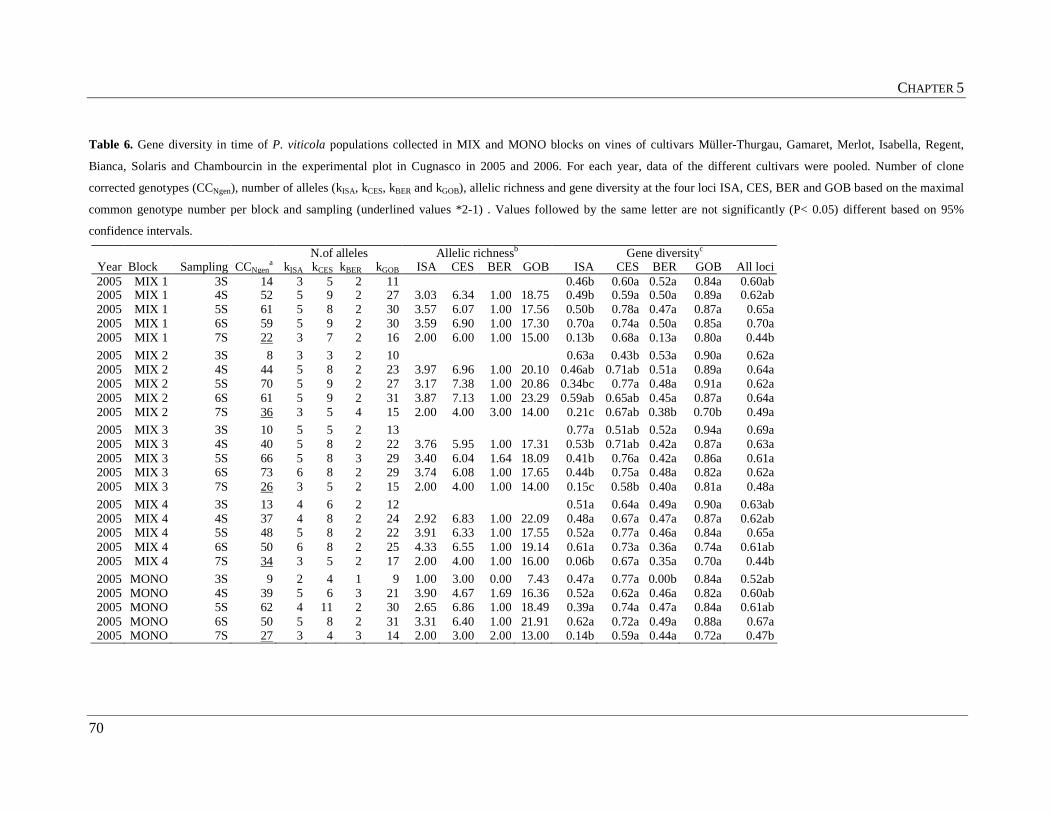
CHAPTER 5
70
Table 6. Gene diversity in time of P. viticola populations collected in MIX and MONO blocks on vines of cultivars Müller-Thurgau, Gamaret, Merlot, Isabella, Regent,
Bianca, Solaris and Chambourcin in the experimental plot in Cugnasco in 2005 and 2006. For each year, data of the different cultivars were pooled. Number of clone
corrected genotypes (CCNgen), number of alleles (kISA, kCES, kBER and kGOB), allelic richness and gene diversity at the four loci ISA, CES, BER and GOB based on the maximal
common genotype number per block and sampling (underlined values *2-1) . Values followed by the same letter are not significantly (P< 0.05) different based on 95%
confidence intervals.
N.of alleles Allelic richnessb Gene diversityc Year Block Sampling CCNgen
a kISA kCES kBER kGOB ISA CES BER GOB ISA CES BER GOB All loci 2005 MIX 1 3S 14 3 5 2 11 0.46b 0.60a 0.52a 0.84a 0.60ab 2005 MIX 1 4S 52 5 9 2 27 3.03 6.34 1.00 18.75 0.49b 0.59a 0.50a 0.89a 0.62ab 2005 MIX 1 5S 61 5 8 2 30 3.57 6.07 1.00 17.56 0.50b 0.78a 0.47a 0.87a 0.65a 2005 MIX 1 6S 59 5 9 2 30 3.59 6.90 1.00 17.30 0.70a 0.74a 0.50a 0.85a 0.70a 2005 MIX 1 7S 22 3 7 2 16 2.00 6.00 1.00 15.00 0.13b 0.68a 0.13a 0.80a 0.44b
2005 MIX 2 3S 8 3 3 2 10 0.63a 0.43b 0.53a 0.90a 0.62a 2005 MIX 2 4S 44 5 8 2 23 3.97 6.96 1.00 20.10 0.46ab 0.71ab 0.51a 0.89a 0.64a 2005 MIX 2 5S 70 5 9 2 27 3.17 7.38 1.00 20.86 0.34bc 0.77a 0.48a 0.91a 0.62a 2005 MIX 2 6S 61 5 9 2 31 3.87 7.13 1.00 23.29 0.59ab 0.65ab 0.45a 0.87a 0.64a 2005 MIX 2 7S 36 3 5 4 15 2.00 4.00 3.00 14.00 0.21c 0.67ab 0.38b 0.70b 0.49a
2005 MIX 3 3S 10 5 5 2 13 0.77a 0.51ab 0.52a 0.94a 0.69a 2005 MIX 3 4S 40 5 8 2 22 3.76 5.95 1.00 17.31 0.53b 0.71ab 0.42a 0.87a 0.63a 2005 MIX 3 5S 66 5 8 3 29 3.40 6.04 1.64 18.09 0.41b 0.76a 0.42a 0.86a 0.61a 2005 MIX 3 6S 73 6 8 2 29 3.74 6.08 1.00 17.65 0.44b 0.75a 0.48a 0.82a 0.62a 2005 MIX 3 7S 26 3 5 2 15 2.00 4.00 1.00 14.00 0.15c 0.58b 0.40a 0.81a 0.48a
2005 MIX 4 3S 13 4 6 2 12 0.51a 0.64a 0.49a 0.90a 0.63ab 2005 MIX 4 4S 37 4 8 2 24 2.92 6.83 1.00 22.09 0.48a 0.67a 0.47a 0.87a 0.62ab 2005 MIX 4 5S 48 5 8 2 22 3.91 6.33 1.00 17.55 0.52a 0.77a 0.46a 0.84a 0.65a 2005 MIX 4 6S 50 6 8 2 25 4.33 6.55 1.00 19.14 0.61a 0.73a 0.36a 0.74a 0.61ab 2005 MIX 4 7S 34 3 5 2 17 2.00 4.00 1.00 16.00 0.06b 0.67a 0.35a 0.70a 0.44b
2005 MONO 3S 9 2 4 1 9 1.00 3.00 0.00 7.43 0.47a 0.77a 0.00b 0.84a 0.52ab 2005 MONO 4S 39 5 6 3 21 3.90 4.67 1.69 16.36 0.52a 0.62a 0.46a 0.82a 0.60ab 2005 MONO 5S 62 4 11 2 30 2.65 6.86 1.00 18.49 0.39a 0.74a 0.47a 0.84a 0.61ab 2005 MONO 6S 50 5 8 2 31 3.31 6.40 1.00 21.91 0.62a 0.72a 0.49a 0.88a 0.67a 2005 MONO 7S 27 3 4 3 14 2.00 3.00 2.00 13.00 0.14b 0.59a 0.44a 0.72a 0.47b

CHAPTER 5
71
Table 6. Continuation.
N.of alleles Allelic richnessb Gene diversityc Year Block Sampling CCNgen
a kISA kCES kBER kGOB ISA CES BER GOB ISA CES BER GOB All loci 2006 MIX 1 1S 1 2 2 1 2 1.00a 1.00a 0.00b 1.00ab 0.75a 2006 MIX 1 2S 17 3 6 2 17 0.49a 0.56a 0.51a 0.93ab 0.62a 2006 MIX 1 3S 32 5 7 2 19 4.00 6.00 1.00 18.00 0.69a 0.64a 0.50a 0.93ab 0.69a 2006 MIX 1 4S 77 6 8 2 31 4.65 6.34 1.00 21.88 0.68a 0.77a 0.50a 0.94ab 0.72a 2006 MIX 1 5S 107 6 10 2 32 4.26 7.24 1.00 19.58 0.67a 0.78a 0.49a 0.90ab 0.71a 2006 MIX 1 6S 69 5 7 2 26 3.18 5.41 1.00 17.81 0.58a 0.69a 0.44a 0.85b 0.64a
2006 MONO 1S 1 1 1 1 2 0.00b 0.00b 0.00b 1.00a 0.25b 2006 MONO 2S 8 2 5 1 13 0.13b 0.72a 0.00b 0.98a 0.45b 2006 MONO 3S 39 4 9 2 25 3.00 8.00 1.00 24.00 0.52a 0.73a 0.42a 0.90a 0.64a 2006 MONO 4S 93 5 9 2 37 3.66 7.26 1.00 27.17 0.53a 0.70a 0.44a 0.94a 0.65a 2006 MONO 5S 88 5 10 2 34 3.69 7.45 1.00 24.57 0.63a 0.62a 0.45a 0.90a 0.65a 2006 MONO 6S 105 5 7 2 32 3.74 5.71 1.00 22.66 0.50a 0.59a 0.49a 0.89a 0.62a
a Number of clone corrected genotypes
b Allelic richness after rarefaction N2005MIX 1 = 43, N2005MIX 2 = 71, N2005MIX 3 = 51, N2005MIX 4 = 67, N2005MONO = 53, N2006MIX 1 = 63, and N2006MONO = 77 c Gene diversity (Nei 1973)

CHAPTER 5
72
Table 7. Genotypic diversity of P. viticola populations collected on vines of cultivars Müller-Thurgau,
Gamaret, Merlot, Isabella, Regent, Bianca, Solaris and Chambourcin in the experimental plot in Cugnasco in
2005 and 2006. For each year, data of the different blocks and samplings dates were pooled. Number of
lesions genetically determined (Nles), number of genotypes (Ngen), number of genotypes/number of lesions
genetically determined (Ngen/Nles), number of lesions of the most frequent genotype (Max freq), Shannon
index (H), Simpson index and standard deviations standardized to maximal population sizes (underlined
values). Values followed by the same letter are not significantly (P< 0.05) different based on t-tests.
Year Cultivar Nlesa Ngen
b Ngen/Nlesc Max freqd He SDf Simpsone SDf
2005 Müller-Thurgau 252 184 0.73 8 3.42ab 0.07 2005 Gamaret 308 217 0.70 10 3.43ab 0.07 2005 Merlot 228 169 0.74 10 3.42ab 0.07 2005 Isabella 243 177 0.73 16 3.37c 0.09 2005 Regent 61 50 0.82 3 3.38c 0.06 2005 Bianca 44 33 0.75 8 3.08e 0.09 32.04b 11.40 2005 Solaris 102 81 0.79 5 3.39bc 0.07 2005 Chambourcin 35 27 0.77 4 3.16d 0.03 50.10a 5.23
2006 Müller-Thurgau 128 101 0.79 6 3.90a 0.06 204.34a 108.21 2006 Gamaret 177 119 0.67 17 3.75b 0.09 89.00b 45.12 2006 Merlot 151 113 0.75 6 3.89a 0.07 199.35a 109.00 2006 Isabella 153 99 0.65 19 3.61c 0.11 51.62c 21.50 2006 Regent 87 50 0.57 14 3.35e 0.09 27.93e 5.99 2006 Bianca 86 48 0.56 10 3.40d 0.08 36.75d 7.14 2006 Solaris 87 65 0.75 6 3.76b 0.06 93.48b 27.07 2006 Chambourcin 61 32 0.52 13 3.03f 0.02 15.92f 0.68
a Number of lesions genetically determined b Number of genotypes c Number of genotypes/number of lesions genetically determined d Number of lesions of the most frequent genotype e Shannon (H, Shannon and Weaver 1949, Hayek and Buzas 1996) Simpson index (Simpson 1949, Hayek and
Buzas 1996) standardized to population sizes of N2005 = 34 and N2006 = 60 f Standard deviation based on 1000 randomizations

CHAPTER 5
73
Table 8. Gene diversity of P. viticola populations collected on vines of cultivars Müller-Thurgau, Gamaret, Merlot, Isabella, Regent, Bianca, Solaris and Chambourcin in the
experimental plot in Cugnasco in 2005 and 2006. For each year, data of the different blocks and samplings dates were pooled. Number of clone corrected genotypes (CCNgen),
number of alleles (kISA, kCES, kBER and kGOB), gene diversity and allelic richness at the four loci ISA, CES, BER and GOB based on the maximal common genotype number
per cultivar (underlined value *2-1). Values followed by the same letter are not significantly (P< 0.05) different based on 95% confidence intervals.
N.of alleles Allelic richnessb Gene diversityc Year Cultivar CCNgen
akISA kCES kBER kGOB ISA CES BER GOB ISA CES BER GOB All loci
2005 Müller-Thurgau 184 6 9 2 40 3.96 6.46 1.00 20.31 0.50a 0.70a 0.46a 0.89a 0.64a 2005 Gamaret 217 5 10 4 46 3.30 6.34 1.25 21.81 0.49ab 0.73a 0.46a 0.89a 0.64a 2005 Merlot 169 5 8 3 44 3.28 6.04 1.16 20.13 0.49ab 0.71a 0.46a 0.86ab 0.63a 2005 Isabella 177 6 12 3 42 3.91 6.91 1.28 20.31 0.53a 0.75a 0.49a 0.89a 0.66a 2005 Regent 50 4 8 2 28 2.52 6.68 1.00 20.13 0.31bc 0.69a 0.40a 0.86ab 0.56a 2005 Bianca 33 5 6 2 21 3.93 4.97 1.00 17.74 0.30bc 0.71a 0.44a 0.83ab 0.57a 2005 Solaris 81 6 7 3 31 3.69 5.25 1.33 17.57 0.54a 0.74a 0.45a 0.78b 0.63a 2005 Chambourcin 27 3 6 3 15 2.00 5.00 2.00 14.00 0.35ab
c 0.66a 0.42a 0.67b 0.52a
2006 Müller-Thurgau 101 5 10 2 33 3.85 7.27 1.00 22.11 0.58ab 0.76ab 0.49a 0.92a 0.69a 2006 Gamaret 119 6 9 2 40 4.19 7.07 1.00 23.47 0.64ab 0.72ab 0.45a 0.93a 0.68a 2006 Merlot 113 5 8 2 40 3.73 6.09 1.00 24.42 0.46c 0.68ab 0.47a 0.91a 0.63a 2006 Isabella 99 6 10 2 35 4.50 6.90 1.00 22.44 0.54bc 0.68ab 0.46a 0.91a 0.65a 2006 Regent 50 6 7 2 18 4.15 5.63 1.00 13.17 0.68ab 0.69ab 0.50a 0.84b 0.68a 2006 Bianca 48 5 8 2 22 3.66 6.66 1.00 16.74 0.67ab 0.76ab 0.47a 0.85ab 0.69a 2006 Solaris 65 6 7 2 32 4.73 5.62 1.00 24.08 0.53bc 0.62b 0.50a 0.93a 0.64a 2006 Chambourcin 32 5 5 2 10 4.00 4.00 1.00 9.00 0.62ab 0.63ab 0.40a 0.70c 0.59a
a Number of clone corrected genotypes b Allelic richness after rarefaction N2005 = 53, N2006 = 63 c Gene diversity (Nei 1973)
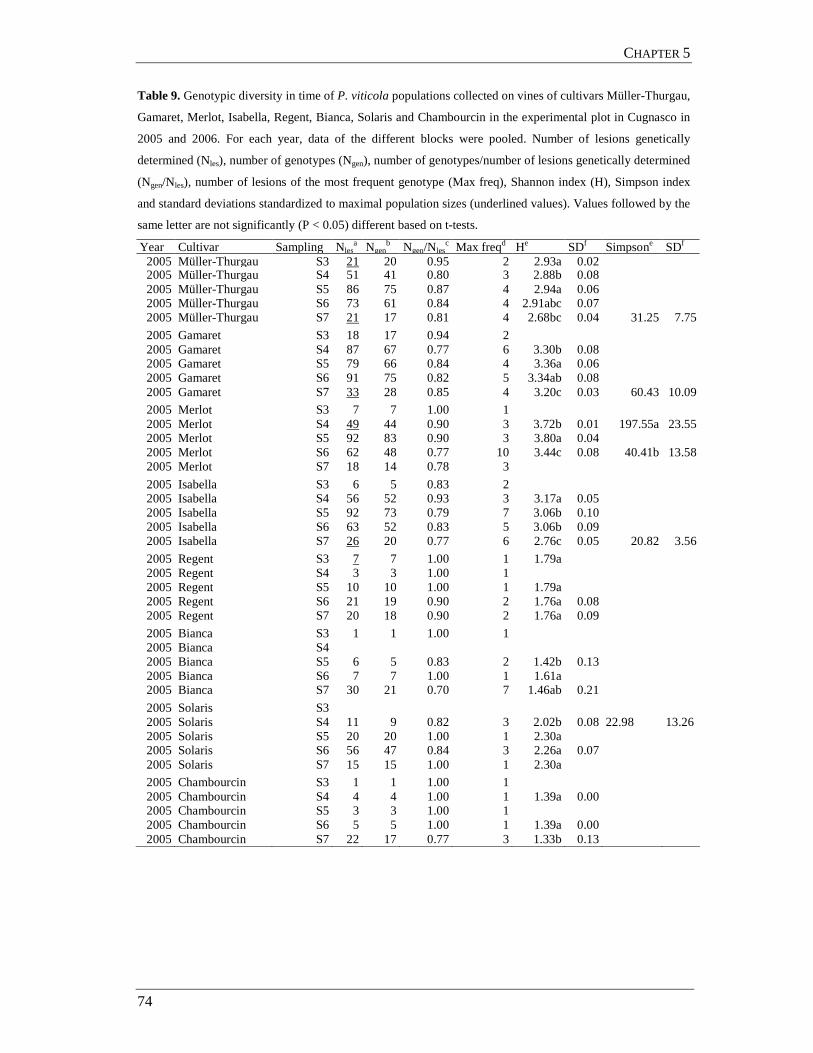
CHAPTER 5
74
Table 9. Genotypic diversity in time of P. viticola populations collected on vines of cultivars Müller-Thurgau,
Gamaret, Merlot, Isabella, Regent, Bianca, Solaris and Chambourcin in the experimental plot in Cugnasco in
2005 and 2006. For each year, data of the different blocks were pooled. Number of lesions genetically
determined (Nles), number of genotypes (Ngen), number of genotypes/number of lesions genetically determined
(Ngen/Nles), number of lesions of the most frequent genotype (Max freq), Shannon index (H), Simpson index
and standard deviations standardized to maximal population sizes (underlined values). Values followed by the
same letter are not significantly (P < 0.05) different based on t-tests.
Year Cultivar Sampling Nlesa Ngen
b Ngen/Nlesc Max freqd He SDf Simpsone SDf
2005 Müller-Thurgau S3 21 20 0.95 2 2.93a 0.02 2005 Müller-Thurgau S4 51 41 0.80 3 2.88b 0.08 2005 Müller-Thurgau S5 86 75 0.87 4 2.94a 0.06 2005 Müller-Thurgau S6 73 61 0.84 4 2.91abc 0.07 2005 Müller-Thurgau S7 21 17 0.81 4 2.68bc 0.04 31.25 7.75
2005 Gamaret S3 18 17 0.94 2 2005 Gamaret S4 87 67 0.77 6 3.30b 0.08 2005 Gamaret S5 79 66 0.84 4 3.36a 0.06 2005 Gamaret S6 91 75 0.82 5 3.34ab 0.08 2005 Gamaret S7 33 28 0.85 4 3.20c 0.03 60.43 10.09
2005 Merlot S3 7 7 1.00 1 2005 Merlot S4 49 44 0.90 3 3.72b 0.01 197.55a 23.55 2005 Merlot S5 92 83 0.90 3 3.80a 0.04 2005 Merlot S6 62 48 0.77 10 3.44c 0.08 40.41b 13.58 2005 Merlot S7 18 14 0.78 3
2005 Isabella S3 6 5 0.83 2 2005 Isabella S4 56 52 0.93 3 3.17a 0.05 2005 Isabella S5 92 73 0.79 7 3.06b 0.10 2005 Isabella S6 63 52 0.83 5 3.06b 0.09 2005 Isabella S7 26 20 0.77 6 2.76c 0.05 20.82 3.56
2005 Regent S3 7 7 1.00 1 1.79a 2005 Regent S4 3 3 1.00 1 2005 Regent S5 10 10 1.00 1 1.79a 2005 Regent S6 21 19 0.90 2 1.76a 0.08 2005 Regent S7 20 18 0.90 2 1.76a 0.09
2005 Bianca S3 1 1 1.00 1 2005 Bianca S4 2005 Bianca S5 6 5 0.83 2 1.42b 0.13 2005 Bianca S6 7 7 1.00 1 1.61a 2005 Bianca S7 30 21 0.70 7 1.46ab 0.21
2005 Solaris S3 2005 Solaris S4 11 9 0.82 3 2.02b 0.08 22.98 13.26 2005 Solaris S5 20 20 1.00 1 2.30a 2005 Solaris S6 56 47 0.84 3 2.26a 0.07 2005 Solaris S7 15 15 1.00 1 2.30a
2005 Chambourcin S3 1 1 1.00 1 2005 Chambourcin S4 4 4 1.00 1 1.39a 0.00 2005 Chambourcin S5 3 3 1.00 1 2005 Chambourcin S6 5 5 1.00 1 1.39a 0.00 2005 Chambourcin S7 22 17 0.77 3 1.33b 0.13

CHAPTER 5
75
Table 9. Continuation.
Year Cultivar Sampling Nlesa Ngen
b Ngen/Nlesc Max freqd He SDf Simpsone SDf
2006 Müller-Thurgau S2 2 2 1.00 1 2006 Müller-Thurgau S3 10 9 0.90 2 2006 Müller-Thurgau S4 41 35 0.85 3 3.18b 0.06 2006 Müller-Thurgau S5 46 40 0.87 3 3.21b 0.06 2006 Müller-Thurgau S6 29 28 0.97 2 3.29a 0.01
2006 Gamaret S2 5 4 0.80 2 2006 Gamaret S3 29 23 0.79 3 3.04b 0.03 58.73a 7.05 2006 Gamaret S4 56 44 0.79 9 3.03b 0.12 2006 Gamaret S5 49 39 0.80 5 3.11a 0.09 2006 Gamaret S6 38 30 0.79 4 3.06ab 0.07 66.95a 33.93
2006 Merlot S2 10 9 0.90 2 2006 Merlot S3 27 21 0.78 3 2.78c 0.07 56.24 25.36 2006 Merlot S4 48 39 0.81 5 2.86b 0.11 2006 Merlot S5 44 37 0.84 5 2.88b 0.10 2006 Merlot S6 22 21 0.95 2 2.98a 0.02
2006 Isabella S1 2 2 1.00 1 2006 Isabella S2 10 10 1.00 1 2006 Isabella S3 22 16 0.73 6 2.51c 0.06 14.81a 2.60 2006 Isabella S4 33 26 0.79 4 2.82b 0.09 2006 Isabella S5 42 27 0.64 9 2.48c 0.18 18.52a 11.18 2006 Isabella S6 44 40 0.91 3 2.98a 0.06
2006 Regent S2 2006 Regent S3 1 1 1.00 1 2006 Regent S4 11 9 0.82 2 2.08b 0.07 30.89 10.89 2006 Regent S5 50 28 0.56 11 1.97b 0.22 2006 Regent S6 25 20 0.80 2 2.20a 0.1
2006 Bianca S3 2006 Bianca S4 16 14 0.88 2 2.55a 0.04 65.21 22.50 2006 Bianca S5 35 25 0.71 4 2.51a 0.11 2006 Bianca S6 34 19 0.56 6 2.27b 0.16
2006 Solaris S3 4 4 1.00 1 2006 Solaris S4 26 23 0.88 2 2.83a 0.06 2006 Solaris S5 20 17 0.85 2 2.75b 0.03 65.41 13.00 2006 Solaris S6 37 28 0.76 5 2.68c 0.13
2006 Chambourcin S3 2006 Chambourcin S4 1 1 1.00 1 2006 Chambourcin S5 11 9 0.82 2 2.08a 0.07 31.05 10.93 2006 Chambourcin S6 49 25 0.51 12 1.92b 0.23
a Number of lesions genetically determined b Number of genotypes c Number of genotypes/number of lesions genetically determined d Number of lesions of the most frequent genotype e Shannon (H, Shannon and Weaver 1949, Hayek and Buzas 1996) Simpson index (Simpson 1949, Hayek and
Buzas 1996) standardized to population sizes of N2005Müller-Thurgau = 20, N2005Gamaret = 32, N2005Merlot = 48,
N2005Isabella = 25, N2005Regent = 6, N2005Bianca = 5, N2005Solaris = 10, N2005Chambourcin = 4, N2006Müller-Thurgau = 28,
N2006Gamare t= 28, N2006Merlot = 21, N2006Isabella = 21, N2006Regent = 10, N2006Bianca = 15, N2006Solaris = 19, N2006Chambourcin
= 10 f Standard deviation based on 1000 randomizations
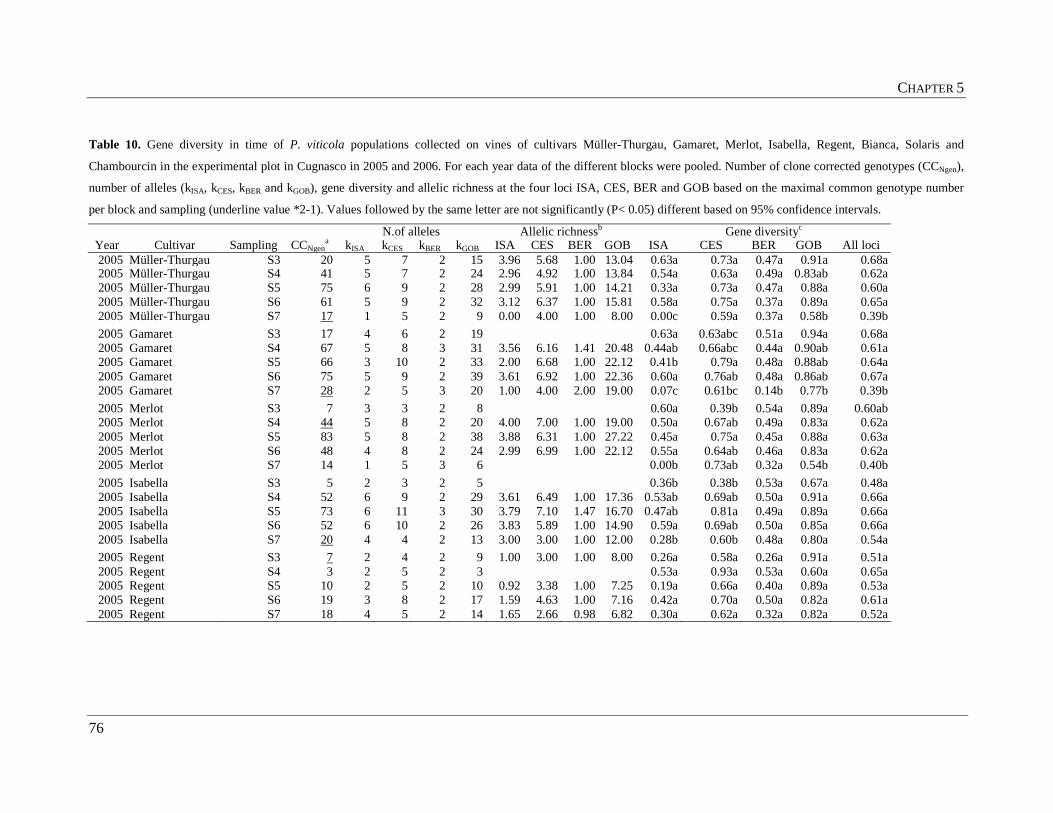
CHAPTER 5
76
Table 10. Gene diversity in time of P. viticola populations collected on vines of cultivars Müller-Thurgau, Gamaret, Merlot, Isabella, Regent, Bianca, Solaris and
Chambourcin in the experimental plot in Cugnasco in 2005 and 2006. For each year data of the different blocks were pooled. Number of clone corrected genotypes (CCNgen),
number of alleles (kISA, kCES, kBER and kGOB), gene diversity and allelic richness at the four loci ISA, CES, BER and GOB based on the maximal common genotype number
per block and sampling (underline value *2-1). Values followed by the same letter are not significantly (P< 0.05) different based on 95% confidence intervals.
N.of alleles Allelic richnessb Gene diversityc Year Cultivar Sampling CCNgen
a kISA kCES kBER kGOB ISA CES BER GOB ISA CES BER GOB All loci 2005 Müller-Thurgau S3 20 5 7 2 15 3.96 5.68 1.00 13.04 0.63a 0.73a 0.47a 0.91a 0.68a 2005 Müller-Thurgau S4 41 5 7 2 24 2.96 4.92 1.00 13.84 0.54a 0.63a 0.49a 0.83ab 0.62a 2005 Müller-Thurgau S5 75 6 9 2 28 2.99 5.91 1.00 14.21 0.33a 0.73a 0.47a 0.88a 0.60a 2005 Müller-Thurgau S6 61 5 9 2 32 3.12 6.37 1.00 15.81 0.58a 0.75a 0.37a 0.89a 0.65a 2005 Müller-Thurgau S7 17 1 5 2 9 0.00 4.00 1.00 8.00 0.00c 0.59a 0.37a 0.58b 0.39b
2005 Gamaret S3 17 4 6 2 19 0.63a 0.63abc 0.51a 0.94a 0.68a 2005 Gamaret S4 67 5 8 3 31 3.56 6.16 1.41 20.48 0.44ab 0.66abc 0.44a 0.90ab 0.61a 2005 Gamaret S5 66 3 10 2 33 2.00 6.68 1.00 22.12 0.41b 0.79a 0.48a 0.88ab 0.64a 2005 Gamaret S6 75 5 9 2 39 3.61 6.92 1.00 22.36 0.60a 0.76ab 0.48a 0.86ab 0.67a 2005 Gamaret S7 28 2 5 3 20 1.00 4.00 2.00 19.00 0.07c 0.61bc 0.14b 0.77b 0.39b
2005 Merlot S3 7 3 3 2 8 0.60a 0.39b 0.54a 0.89a 0.60ab 2005 Merlot S4 44 5 8 2 20 4.00 7.00 1.00 19.00 0.50a 0.67ab 0.49a 0.83a 0.62a 2005 Merlot S5 83 5 8 2 38 3.88 6.31 1.00 27.22 0.45a 0.75a 0.45a 0.88a 0.63a 2005 Merlot S6 48 4 8 2 24 2.99 6.99 1.00 22.12 0.55a 0.64ab 0.46a 0.83a 0.62a 2005 Merlot S7 14 1 5 3 6 0.00b 0.73ab 0.32a 0.54b 0.40b
2005 Isabella S3 5 2 3 2 5 0.36b 0.38b 0.53a 0.67a 0.48a 2005 Isabella S4 52 6 9 2 29 3.61 6.49 1.00 17.36 0.53ab 0.69ab 0.50a 0.91a 0.66a 2005 Isabella S5 73 6 11 3 30 3.79 7.10 1.47 16.70 0.47ab 0.81a 0.49a 0.89a 0.66a 2005 Isabella S6 52 6 10 2 26 3.83 5.89 1.00 14.90 0.59a 0.69ab 0.50a 0.85a 0.66a 2005 Isabella S7 20 4 4 2 13 3.00 3.00 1.00 12.00 0.28b 0.60b 0.48a 0.80a 0.54a
2005 Regent S3 7 2 4 2 9 1.00 3.00 1.00 8.00 0.26a 0.58a 0.26a 0.91a 0.51a 2005 Regent S4 3 2 5 2 3 0.53a 0.93a 0.53a 0.60a 0.65a 2005 Regent S5 10 2 5 2 10 0.92 3.38 1.00 7.25 0.19a 0.66a 0.40a 0.89a 0.53a 2005 Regent S6 19 3 8 2 17 1.59 4.63 1.00 7.16 0.42a 0.70a 0.50a 0.82a 0.61a 2005 Regent S7 18 4 5 2 14 1.65 2.66 0.98 6.82 0.30a 0.62a 0.32a 0.82a 0.52a

CHAPTER 5
77
Table 10. Continuation.
N.of alleles Allelic richnessb Gene diversityc Year Cultivar Sampling CCNgen
a kISA kCES kBER kGOB ISA CES BER GOB ISA CES BER GOB All loci 2005 Bianca S3 1 1 2 1 2 0.00b 1.00a 0.00b 1.00a 0.50ab 2005 Bianca S4 2005 Bianca S5 5 1 5 1 4 0.00 4.00 0.00 3.00 0.00b 0.84a 0.00b 0.53a 0.34b 2005 Bianca S6 7 4 5 2 11 2.65 3.35 1.00 7.35 0.69a 0.73a 0.53a 0.96a 0.73a 2005 Bianca S7 21 3 4 2 14 0.48 1.91 0.99 4.95 0.09b 0.60a 0.47a 0.82a 0.50ab
2005 Solaris S3 2005 Solaris S4 9 3 5 2 11 2.00 4.00 1.00 10.00 0.39ab 0.67a 0.37ab 0.82a 0.56a 2005 Solaris S5 20 3 6 2 16 1.44 4.53 1.00 8.88 0.34b 0.80a 0.41ab 0.85a 0.60a 2005 Solaris S6 47 6 7 2 22 2.80 4.23 1.00 6.88 0.64a 0.73a 0.50a 0.70a 0.64a 2005 Solaris S7 15 2 5 3 10 0.85 3.44 1.45 6.78 0.13b 0.66a 0.19b 0.77a 0.44a
2005 Chambourcin S3 1 1 1 2 1 0.00c 0.00b 1.00a 0.00b 0.25a 2005 Chambourcin S4 4 2 3 2 4 0.43ab 0.61a 0.43a 0.75a 0.55a 2005 Chambourcin S5 3 1 4 1 4 0.00c 0.87a 0.00b 0.80a 0.42a 2005 Chambourcin S6 5 2 4 2 5 1.00 3.00 1.00 4.00 0.53a 0.78a 0.47a 0.76a 0.63a 2005 Chambourcin S7 17 3 5 3 11 0.82 2.10 1.25 3.58 0.17b 0.62a 0.42a 0.62a 0.46a
2006 Müller-Thurgau S2 2 2 3 1 4 0.50ab 0.83a 0.00b 1.00a 0.58a 2006 Müller-Thurgau S3 9 5 4 2 13 0.77b 0.63a 0.50a 0.96a 0.72a 2006 Müller-Thurgau S4 35 4 9 2 27 2.96 7.72 1.00 23.16 0.50ab 0.80a 0.45a 0.94a 0.67a 2006 Müller-Thurgau S5 40 5 9 2 25 3.99 7.07 1.00 21.09 0.60ab 0.77a 0.43a 0.92a 0.68a 2006 Müller-Thurgau S6 28 3 7 2 18 2.00 6.00 1.00 17.00 0.50ab 0.70a 0.42a 0.86a 0.62a
2006 Gamaret S2 4 2 3 2 7 0.54ab 0.46a 0.43a 0.96a 0.60a 2006 Gamaret S3 23 4 8 2 17 3.00 7.00 1.00 16.00 0.68a 0.74a 0.35a 0.92a 0.67a 2006 Gamaret S4 44 5 9 2 32 3.89 7.19 1.00 21.88 0.67a 0.76a 0.46a 0.94a 0.71a 2006 Gamaret S5 39 6 9 2 24 4.58 6.98 1.00 18.86 0.66ab 0.76a 0.40a 0.94a 0.69a 2006 Gamaret S6 30 4 7 2 25 2.77 5.52 1.00 20.82 0.45b 0.67a 0.51a 0.93a 0.64a
2006 Merlot S2 9 3 5 2 14 0.39ab 0.72a 0.52a 0.97a 0.65a 2006 Merlot S3 21 4 7 2 19 3.00 6.00 1.00 18.00 0.56a 0.65a 0.48a 0.90ab 0.65a 2006 Merlot S4 39 4 7 2 30 2.91 5.69 1.00 20.96 0.47ab 0.73a 0.42a 0.93ab 0.64a 2006 Merlot S5 37 5 7 2 26 3.91 5.55 1.00 18.16 0.52a 0.68a 0.45a 0.89ab 0.64a 2006 Merlot S6 21 3 5 2 17 2.00 4.00 1.00 16.00 0.22b 0.53a 0.51a 0.77b 0.51a

CHAPTER 5
78
Table 10. Continuation.
N.of alleles Allelic richnessb Gene diversityc Year Cultivar Sampling CCNgen
a kISA kCES kBER kGOB ISA CES BER GOB ISA CES BER GOB All loci 2006 Isabella S1 2 2 2 1 4 0.50a 0.50a 0.00b 1.00a 0.50a
2006 Isabella S2 10 2 4 2 11 0.34a 0.55a 0.40a 0.92a 0.55a 2006 Isabella S3 16 4 8 2 11 3.00 7.00 1.00 10.00 0.49a 0.74a 0.48a 0.82a 0.63a 2006 Isabella S4 26 6 8 2 20 4.56 5.89 1.00 15.85 0.63a 0.64a 0.49a 0.95a 0.68a 2006 Isabella S5 27 5 7 2 24 3.79 4.77 1.00 17.02 0.58a 0.65a 0.43a 0.92a 0.65a 2006 Isabella S6 40 5 7 2 24 3.32 5.21 1.00 13.87 0.49a 0.64a 0.46a 0.88a 0.61a
2006 Regent S2 2006 Regent S3 1 2 2 2 2 1.00a 1.00a 1.00a 1.00a 1.00a 2006 Regent S4 9 4 7 2 7 3.00 6.00 1.00 6.00 0.74a 0.86a 0.37a 0.88a 0.71a 2006 Regent S5 28 4 6 2 12 2.24 3.94 1.00 5.95 0.59a 0.70a 0.51a 0.83a 0.66a 2006 Regent S6 20 5 6 2 9 2.90 4.17 1.00 5.42 0.72a 0.62a 0.51a 0.82a 0.67a
2006 Bianca S3 1 2 2 1 2 1.00a 1.00a 0.00b 1.00a 0.75a 2006 Bianca S4 14 5 5 2 18 4.00 4.00 1.00 17.00 0.56a 0.67a 0.52a 0.95a 0.67a 2006 Bianca S5 25 4 8 2 6 2.56 6.03 1.00 4.12 0.64a 0.80a 0.47a 0.77b 0.67a 2006 Bianca S6 19 3 7 2 7 2.00 5.64 1.00 5.21 0.64a 0.73a 0.37a 0.78b 0.63a
2006 Solaris S3 4 1 4 2 6 0.00b 0.75a 0.43a 0.93a 0.53a 2006 Solaris S4 23 5 5 2 23 3.97 3.99 1.00 18.39 0.60a 0.65a 0.46a 0.94a 0.66a 2006 Solaris S5 17 5 6 2 13 4.00 5.00 1.00 12.00 0.62a 0.60a 0.51a 0.89a 0.65a 2006 Solaris S6 28 5 6 2 25 3.44 4.80 1.00 17.99 0.40a 0.59a 0.40a 0.93a 0.58a
2006 Chambourcin S3 2006 Chambourcin S4 1 2 2 2 2 1.00a 1.00a 1.00a 1.00a 1.00a 2006 Chambourcin S5 9 4 4 2 4 3.00 3.00 1.00 3.00 0.68a 0.68a 0.50a 0.71a 0.64a 2006 Chambourcin S6 25 4 5 2 10 2.34 3.15 0.99 5.07 0.59a 0.61a 0.33a 0.70a 0.56a
a Number of clone corrected genotypes b Allelic richness after rarefaction N2005Müller-Thurgau = 33, N2005Gamaret = 55, N2005Merlot = 87, N2005Isabella = 39, N2005Regent = 13, N2005Bianca = 9, N2005Solaris = 17, N2005Chambourcin = 9,
N2006Müller-Thurgau = 55, N2006Gamaret = 45, N2006Merlot = 41, N2006Isabella = 31, N2006Regent = 17, N2006Bianca = 27, N2006Solaris = 33, N2006Chambourcin = 17
c Gene diversity (Nei 1973)

CHAPTER 5
79
Differentiation among populations
Significant differences at the 5% nominal level after 200 permutations (indicative adjusted
nominal level for multiple comparisons = 0.005) were indicated for all comparisons
excepted between BL3 and BL4 (non-adjusted P-value = 0.120) and between BL4 and BL
5 (non-adjusted P-value = 0.215) for all populations collected in the 5 blocks of the
experimental plot in 2005. Significant differences (non-adjusted P-value = 0.05), between
the populations collected in 2006 in BL1 and BL5 were indicated by pairwise test of
population differentiation after 20 permutations (indicative adjusted nominal level for
multiple comparisons = 0.050, data not shown).
Non significant differences, for populations collected in 2005 on the eight grapevine
cultivars were indicated by pairwise test of population differentiation after 560
permutations (data not shown).
Significant differences, were indicated after 560 permutations (indicative adjusted
nominal level for multiple comparisons = 0.00179), when comparing pairwise the P.
viticola populations collected in 2006 on cultivars Regent, Bianca and Chambourcin with
them collected on cultivars Merlot, Isabella, Müller-Thurgau, Solaris and Gamaret. Non
significant differences were indicated, when testing for pairwise differences between
populations collected on Regent, Bianca and Chambourcin (data not shown).
Shared genotypes
In 2005 the highest Chao’s abundance based Jaccard indexes (indicating higher overlap in
genotype composition between two populations and therefore higher similarity, Chao et al.
2005) was observed for the couples of populations Müller-Thurgau-Gamaret (DG), Merlot-
Müller-Thurgau (BD), Isabella-Gamaret (CG), and Müller-Thurgau-Solaris (DE). In 2006
higher similarity was indicated for the couples Regent-Chambourcin (AH), Bianca-
Chambourcin (FH) and Regent-Bianca (AF). In both years high similarity was observed for
Merlot-Gamaret (BG) and Isabella-Müller-Thurgau (CD) (Fig. 1).

CHAPTER 5
80
Figure. 1. Similarity among genotypes collected on different cultivars. Chao’s abundance-based Jaccard
indexes (Chao et al. 2005) calculated for shared genotypes among populations collected on the eight
grapevine cultivars Müller-Thurgau (D), Gamaret (G), Merlot (B), Isabella (C), Regent (A), Bianca (F),
Solaris (E) and Chambourcin (H) Letters indicate non significant differences based on 95% confidence
intervals.
In 2005 the first (77) and second highest number of lesions from one same genotype (73)
were shared among populations collected on vines of all eight cultivars except Bianca and
all eight cultivars, respectively. The highest number of combinations of cultivars sharing
same genotypes comprehended always Müller-Thurgau, Gamaret and Merlot (inferred from
values of Tab. 11). In 2006 the highest number of lesions from one same genotype (67) was
shared among populations collected on vines of cultivars Müller-Thurgau, Gamaret,
Merlot, Isabella and Solaris. While the second to the fifth highest number of lesions from
one same genotype, were shared principally among populations collected on vines of
cultivars Regent, Bianca and Chambourcin (inferred from values of Tab. 12).

CHAPTER 5
81
Table 11. Distribution of clonal P. viticola genotypes on vines of cultivars Müller-Thurgau, Gamaret, Merlot,
Isabella, Regent, Bianca, Solaris and Chambourcin in 2005 (minimum four samples having the same
genotype).
Müller-Thurgau Gamaret Merlot Isabella Regent Bianca Solaris Chambourcin Total 4 8 6 16 2 8 5 2 51 8 6 7 4 2 3 4 34 8 6 10 2 2 2 3 33 6 4 2 5 1 1 1 2 22 1 2 5 3 3 3 4 21 7 6 2 4 1 20 1 10 5 2 2 20 2 2 3 7 1 1 16 7 5 1 2 1 16 1 11 1 13 4 4 3 1 12 4 2 2 1 1 1 11 2 1 3 1 1 2 10 2 1 1 2 2 1 1 10 3 3 1 2 1 10 3 1 4 1 1 10 7 1 1 9 4 3 1 1 9 3 2 1 1 7 1 1 2 2 1 7 1 4 1 1 7 3 1 3 7 3 1 3 7 1 1 2 2 1 7 2 1 1 2 6 1 4 1 6 1 1 1 2 1 6 2 1 3 6 1 3 1 1 6 4 1 1 6 1 1 2 1 5 1 3 1 5 1 2 2 5 1 1 1 2 5 1 1 2 1 5 1 1 2 1 5 3 2 5 2 2 1 5 1 1 2 1 5 3 1 1 5 2 2 1 5 1 2 1 4 3 1 4 1 3 4 1 2 1 4 4 4 2 1 1 4 1 2 1 4 1 2 1 4 2 1 1 4

CHAPTER 5
82
Table 12. Distribution of clonal P. viticola genotypes on vines of cultivars Müller-Thurgau, Gamaret, Merlot,
Isabella, Regent, Bianca, Solaris and Chambourcin in 2006 (minimum four samples having the same
genotype).
Müller-Thurgau Gamaret Merlot Isabella Regent Bianca Solaris Chambourcin Total 3 17 2 11 2 35 6 1 3 19 3 32 3 1 1 14 7 4 30 6 4 13 23 1 4 10 1 16 1 6 3 6 16 1 3 4 6 14 6 1 1 6 14 1 3 4 5 13 1 3 5 1 10 1 5 1 2 1 10 1 2 1 2 3 9 4 3 1 8 1 1 4 1 7 1 6 7 1 1 1 1 3 7 4 1 1 6 1 5 6 1 5 6 1 2 1 1 1 6 1 2 2 1 6 6 6 3 1 1 5 4 1 5 2 1 2 5 1 3 1 5 2 1 2 5 1 1 1 2 5 1 1 1 1 4 1 2 1 4 1 1 2 4 1 2 1 4 2 2 4 1 1 2 4 1 1 1 1 4 2 2 4 2 2 4 1 1 2 4 1 3 4 1 3 4 4 4 4 4 2 1 1 4

CHAPTER 5
83
DISCUSSION
In the first year no trend in genotypic and gene diversity differentiation among the P.
viticola populations collected in the two block systems (MIX and MONO block) could be
identified, while in 2006 significantly higher genotypic and lower gene diversity were
observed for the population collected in the MONO block. Considering that in 2005
genotypic diversity among populations collected in the MIX blocks was not uniform and
that an effect in disease reduction was observed principally only in 2005, we can not make
any assumption about change in genetic structure of P. viticola populations depending on
spatial aggregations of grapevine cultivars. In the Melampsora larici-epitea- Salix viminalis
pathosystem neither significant disease reduction nor differences in genotypic diversity
were determined for populations in mixed stands of Salix viminalis cultivars (Samils et al.
2003).
Significantly lower genotypic and gene diversity were observed by the last sampling
(1st of September) in 2005, while in 2006 significantly lower genotypic diversity was
observed by the third samplings (10th of July). The season 2005 was characterized by a
period without precipitations occurring from 4th to 30th of August, even though the steepest
disease severity increase on primary and secondary shoots was observed in this time. It can
be hypothesized that infections occurred in the water layer present on leaves due to
morning dew, this would result in very narrow spread of genotypes and therefore in lower
diversity. This would be more probable than a reduction in diversity due to drift or
selection. In 2006 no precipitations occurred in Cugnasco between the 19th May and the 2nd
of July and by the first epidemiological observations after the rains of the 3rd of July low
levels of disease were observed (CHAPTER 4). Even though no rain felt on the plot in the
period, infections occurred, most probably in dew covering leaves, and two samplings
could be performed. The rain fell in Cugnasco between the 3rd and 8th of August will have
allowed strong sporulation of previous caused infections, this seems to be confirmed by the
fact that 7 of the 27 genotypes observed by the first or second sampling were found by the
third one. Besides these secondary infections, the rains will have allowed the spread
through splash and wind of oospore derived zoospores and enough time for incubation
elapsed between rains and sampling (Rafailă et al. 1968).
CHAPTER 5
84
A differentiation in population structure of P. viticola on different grapevine
cultivars was observed. In both years significantly low genotypic diversity was observed on
populations collected on resistant cultivars, while high diversity was observed for the ones
collected on susceptible vines. The only exception being the population collected in 2006
on Solaris vines. This could be explained by the fact that susceptible cultivars do not
possess any resistance mechanism against the pathogen; therefore all genotypes can infect
the vines. On the contrary resistant cultivars possess passive (including structural
characteristics of leaves and berries and preformed antifungal compounds) and active
defence mechanisms (such as accumulation of phytoalexins and PR-proteins or deposition
of lignin in the cell walls, Kortekamp 2006) and only the most aggressive genotypes can
infect the vines.
The reduction of mixture efficacy observed in the second and third year of the
experiment could have environmental causes (different meteorological conditions in the
years, causing differences in the number of possible infections) or be the result of
adaptation of P. viticola populations.
We can hypothesize that no pathogen population adaptation occurred in 2005. No
significant population differentiation, so as no pairwise differences among cultivars were
observed. And the highest number of shared genotypes was assessed between populations
collected on the susceptible cultivars Müller-Thurgau and Gamaret, Merlot and Gamaret,
Isabella and Gamaret and Müller-Thurgau and the non susceptible cultivar Solaris.
In 2006 pathogen adaptation can be hypothesized. Significant differences were
indicated when comparing pairwise the P. viticola populations collected on cultivars
Regent, Bianca and Chambourcin with them collected on cultivars Merlot, Isabella, Müller-
Thurgau, Solaris and Gamaret. While no significant differences between Regent and
Bianca, Regent and Chambourcin, Bianca and Chambourcin were observed. Cultivars
Regent, Chambourcin and Bianca are related. Regent is the result of the cross Diana ×
Chambourcin (VIVC 2007), while Chambourcin is the result of the cross Seyve Villard 12-
417 × Chancellor (VIVC 2007). Seyve Villard 12-417 is the result of the cross Seibel 6468
× Subereux, that represents also the parentage of Seyve Villard 12-375, which open
pollinated gave Eger 2, which crossed with Bouvier resulted in Bianca (VIVC 2007). Flier
et al. (2003) concluded that specificity plays a significant role in interactions between
isolates of P. infestans and potato cultivars and demonstrated that erosion of partial
resistance in potato cultivars occurs under field conditions. Andrivon et al. (2007)
suggested an adaptation for aggressiveness of P. infestans populations resulting in the

CHAPTER 5
85
progressive erosion of partial resistance. An adaptation for aggressiveness of P. viticola can
be hypothesized, this hypothesis could be strengthen by the fact that an increase in disease
severity both on primary as on secondary shoots was observed in 2006 and 2007 compared
to 2005 (CHAPTER 4).
In vineyards in Ticino a reduction in resistance to P. viticola is reported for Isabella
in the last 20 years (Jermini and Gessler, personal communication). In the past, few or no
treatments were necessary. In the years an increase in berries and in late season leaves
damages is observed, rendering spray applications necessary in wet springs. This too, could
be the result of adaptation for aggressiveness of P. viticola. A similar observation of losts
of resistance over years was reported by McCracken and Dawson (1998) and Pei et al.
(2000) where Salix clones lost their resistance to Melampsora spp after 8–10 years of
cultivation.
In both years a high number of genotypes were shared between Merlot and
Gamaret, and Isabella and Müller-Thurgau this could be related to a general adaptation of
P. viticola to the prevailing resource as indicated by Andrivon et al. (2007). Three possible
hypothesis for adaptations for P. infestans populations were described by Andrivon et al.
(2007): a) general adaptation, b) local adaptation to individual niches (different cultivars),
and c) maladaptation (higher pathogenicity on cultivars not present locally). Merlot is the
most frequent cultivar in Ticino, the introduction goes back to 1907, and Merlot vineyards
represent 80% (834.12 ha) of the viticultural surface in Ticino (DFE 2007). Red hybrids
related to Isabella represent the third most planted cultivars (3%, 30.45 ha), while Isabella
represents 0.13% (1.32 ha). Gamaret is the fourth most planted cultivar (1.78%, 18.49 ha,
DFE 2007). Montarry et al. (2006) indicated for P. infestans populations, that these will
adapt primarily to the locally most abundant cultivar. The same was observed with
aggressiveness measurements by Andrivon et al. (2007) for French and Moroccan P.
infestans populations which adapted to the locally dominant resources, irrespective of the
resistance characteristics of these cultivars
No difference in genetic structure of P. viticola populations depending on different
spatial aggregations of grapevines was observed. Differences, presumably depending on
different grapevine cultivars, were observed. Positive effect of grapevine mixtures were
observed for all susceptible cultivars only the first year of experiment, further a disease
increase was observed for the more resistant cultivars. Moreover in grapevine production
uniformity is very important for the ease of growing, harvesting and handling and cultivars
should be agronomically compatible, especially in maturity class (Phillips et al. 2005).

CHAPTER 5
86
Further, for a perennial crop, it is important that the positive effects of the mixed planting
system last for long time (Blaise and Gessler 1994).
We can therefore suppose that grapevine cultivars mixture are not an effective
method to reduce P. viticola disease in vineyards and here through reduce the amount of
copper applications in vineyard.
ACKNOWLEDGEMENTS
This work was supported by SBF 03.0485-1 (Project 501542 REPCO). The author
gratefully acknowledges Rocchina Abbas-Pennella for helping with the labour work,
Michele Gusberti and Natasha Rosselli for helping with collection of samples and disease
assessment, Pascal Zaffarano and Bruce McDonald for helping with part of the analysis,
Davide Gobbin, Mauro Jermini and Cesare Gessler for supervising the research and the
interesting discussions, and Roberto Rigoni and Mirto Ferretti for the maintaining work in
the vineyard.
L ITERATURE CITED
Akanda, S. I., Mundt, C. C. 1996. Effects of two-component wheat cultivar mixtures on stripe rust severity.
Phytopathology, 86: 347-353.
Andrivon, D., Lucas, J.-M., Ellissèche, D. 2003. Development of natural late blight epidemics in pure and
mixed plots of potato cultivars with different levels of partial resistance. Plant Pathology, 52: 586-
594.
Andrivon, D., Pilet, F., Montarry, J., Hafidi, M., Corbière, R., Achbani, E. H., Pellé, R., Ellissèche, D. 2007.
Adaptation of Phytophthora infestans to partial resistance in potato: Evidence from French and
Moroccan populations. Phytopathology, 97: 338-343.
Blaise, P., Gessler, C. 1994. Cultivar mixtures in apple orchards as a mean to control apple scab. Norwegian
Journal of Agricultural Sciences, 17: 105-112.
Boso, S., Kassemeyer, H.-H. 2008. Different susceptibility of European grapevine cultivars for downy
mildew. VITIS, 47(1): 39-49.
Chao, A., Chazdon, R. L., Colwell, R. K., Shen, T.-J. 2005. A new statistical approach for assessing similarity
of species composition with incidence and abundance data. Ecology Letters, 8: 148-159.

CHAPTER 5
87
Colwell, R. K. 2004. EstimateS, Version 7: Statistical Estimation of Species Richness and Shared Species
from Samples (Software and User's Guide). v. 8.0.0. http://viceroy.eeb.uconn.edu/EstimateS.
Cowger, C., Mundt, C. C. 2002. Effects of wheat cultivar mixtures on epidemic progression of Septoria tritici
blotch and pathogenicity of Mycosphaerella graminicola. Phytopathology, 92: 617-623.
Didelot, F., Brun, L., Parisi, L. 2007. Effects of cultivar mixtures on scab control in apple orchards. Plant
Pathology, 56: 1014-1022.
Dipartimento delle finanze e dell'economia (DFE). Sezione dell'agricoltura. 2007. Rapporto sulla vendemmia
2007.
Finckh, M. R., Gacek, E. S., Czembor, H. J., Wolfe, M. S. 1999. Host frequency and density effects on
powdery mildew and yield in mixtures of barley cultivars. Plant Pathology, 48: 807-816.
Flier, W. G., van den Bosch, G. B. M., Turkensteen, L. J. 2003. Stability of partial resistance in potato
cultivars exposed to aggressive strains of Phytophthora infestans Plant Pathology, 52: 326-337.
Garrett, K. A., Mundt, C. C. 1999. Epidemiology in mixed host populations. Phytopathology, 89: 984-990.
Garrett, K. A., Mundt, C. C. 2000. Host diversity can reduce potato late blight severity for focal and general
patterns of primary inoculum. Phytopathology, 90: 1307-1312.
Garrett, K. A., Nelson, R. J., Mundt, C. C., Chacón, G., Jaramillo, R. E., Forbes, G. A. 2001. The effects of
host diversity and other management components on epidemics of potato late blight in the humid
highland tropics. Phytopathology, 91: 993-1000.
Gobbin, D., Pertot, I., Gessler, C. 2003a. Identification of microsatellite markers for Plasmopara viticola and
establishment of high throughput method for SSR analysis. European Journal of Plant Pathology,
109: 153-164.
Gobbin, D., Pertot, I., Gessler, C. 2003b. Genetic structure of a Plasmopara viticola population in an isolated
Italian mountain vineyard. Journal of Phytopathology, 151: 636-646.
Gobbin, D., Jermini, M., Loskill, B., Pertot, I., Raynal, M., Gessler, C. 2005. Importance of secondary
inoculum of Plasmopara viticola to epidemics of grapevine downy mildew. Plant Pathology, 54:
522-534.
Goudet, J. 2001. FSTAT Version 1.2. A computer program to calculate F-statistics. Journal of Heredity, 86:
485-486.
Hayek, L. C., Buzas, M. A. 1996. Surveying natural populations. Columbia University Press, New York.
Heybrook H. M. 1982. Monoculture versus mixture: interactions between susceptible and resistant trees in a
mixed stand. Resistance to disease and pests in forest trees. Proceddings of the 3rd International
Workshop on the genetics of host parasite interactions in forestry, 342-360.
Kellerhals, M., Mouron, P., Graf, B., Bousset, L., Gessler, C. 2003. Mischpflanzungen von Apfelsorten:
Einfluss auf Krankheiten, Schädlinge und Wirtschaftlichkeit. Schweizerische Zeitschrift für Obst-
und Weinbau, 13: 10-13.
Kortekamp, A. 2006. Expression analysis of defence-related genes in grapevine leaves after inoculation with a
host and a non-host pathogen. Plant Physiology and Biochemistry, 44: 58-67.
Lannou, C., de Vallavieille-Pope, C., Goyeau, H. 1994a. Host mixture efficacy in disease control: Effects of
lesion growth analyzed through computer- simulated epidemics. Plant Pathology, 43: 651-662.

CHAPTER 5
88
Lannou, C., de Vallavieille-Pope, C., Biass, C., Goyeau, H. 1994b. The efficacy of mixtures of susceptible
and resistant hosts to two wheat rusts of different lesion size: Controlled condition experiments and
computerized simulations. Journal of Phytopathology, 140: 227-237.
Leonard, K. J. 1969. Factors affecting rates of stem rust increase in mixed plantings of susceptible and
resistant oat varieties. Phytopathology, 59: 1845-1850.
McCracken, A.R., Dawson, W. M. 1998. Short rotation coppice willow in Northern Ireland since 1973:
development of the use of mixtures in the control of foliar rust (Melampsora spp). European Journal
of Forest Pathology, 28: 241-250.
McCracken, A. R., Dawson, W. M. 2003. Rust disease (Melampsora epitea) of willow (Salix spp) grown as
short rotation coppice (SRC) in inter- and intra-species mixtures. Annals of Applied Biology, 143:
381-393.
Montarry, J., Corbiere, R., Lesueur, S., Glais, I., Andrivon, D. 2006. Does selection by resistant hosts trigger
local adaptation in plant–pathogen systems? Journal of Evolutionary Biology, 19: 522-531.
Mundt, C. C., Browning, J. A. 1985. Development of crown rust epidemics in genetically diverse oat
populations: Effect of genotype unit area. Phytopathology, 75: 607-610.
Mundt, C. C., Leonard, K. J. 1986. Analysis of factors affecting disease increase and spread in mixtures of
immune and susceptible plants in computer-simulated epidemics. Phytopathology, 76: 832-840.
Mundt, C. C., Brophy, L. S. 1988. Influence of number of host genotype units on the effectiveness of host
mixtures for disease control: A modeling approach. Phytopathology, 78: 1087-1094.
Mundt, C. C., Brophy, L. S., Kolar, S. C. 1996. Effect of genotype unit number and spatial arrangement on
severity of yellow rust in wheat cultivar mixtures. Plant Pathology, 45: 215-222.
Mundt, C. C. 2002. Use of multiline cultivars and cultivar mixtures for disease management. Annual Review
of Phytopathology, 40: 381-410.
Nei, M. 1973. Analysis of Gene Diversity in Subdivided Populations. Proceedings of the National Academy
of Sciences of the United States of America, 70(12) Part I: 3321-3323.
Pei, M. H, Yuan, Z. W., Hunter, T., Ruiz, C. 2000. Heterogeneous nature of a 'new' pathotype of Melampsora
rust on Salix revealed by AFLP. European Journal of Plant Pathology, 106(8): 771-779.
Petit, R. J., El Mousadik, A., Pons, O. 1998. Identifying populations for conservation on the basis of genetic
markers. Conservation Biology, 12: 844-855.
Phillips, S. L., Shaw, M. W., Wolfe, M. S. 2005. The effect of potato variety mixtures on epidemics of late
blight in relation to plot size and level of resistance. Annals of Applied Biology, 147(3): 245-252.
Pilet, F., Chacón, G., Forbes, G.A., Andrivon, D. 2006. Protection of susceptible potato cultivars against late
blight in mixtures increases with decreasing disease pressure. Phytopathology, 96(7): 777-783.
Rafailă, C., Sevcenco, V., David, Z. 1968. Contributions to the biology of Plasmopara viticola. Journal of
Phytopathology, 63(4): 328-336.
Robinson, R. A. 1976. Plant Pathosystems. Springer-Verlag, New York, 184.
Samils, B., McCracken, A. R., Dawson, W. M., Gullberg, U. 2003. Host specific genetic composition of
Melampsora larici-epitea populations on two Salix viminalis genotypes in a mixture trial. European
Journal of Plant Pathology, 109: 183-190.

CHAPTER 5
89
Schilder, A. C., Lehman, B. L., Jordan, S. A., Catal, M. 2006. Pathogenic and genetic variation among
Plasmopara viticola isolates from different Hosts. Proceedings of the 5th International Workshop on
Grapevine Downy and Powdery Mildew. San Michele all’Adige, Italy, 93-94.
Shannon, C. E., Weaver, W. 1949. The mathematical theory of communication, University of Illinois, Urbana.
Simpson, E. H. 1949. Measurement of diversity. Nature, 163: 688.
Unger, S., Büche, C., Boso, S., Kassemeyer, H.-H. 2007. The course of the colonization of two different Vitis
genotypes by Plasmopara viticola indicates compatible and incompatible host-pathogen interactions.
Phytopathology, 97: 780-786.
Vitis International Variety Catalogue (VIVC) 2007. IRZ Institut für Rebenzüchtung Geilweilerhof.
http://www.vivc.bafz.de/
Wolfe, M. S. 1985. The current status and prospects of multiline cultivars and variety mixtures for disease
resistance. Annual Review of Phytopathology, 33: 451-456.
Wright, S. 1969.Evolution and the Genetics of Populations, vol. 2. The Theory of Gene Frequencies.
University of Chicago Press, Chicago.
Xu, X.-M., Ridout, S. 2000. Stochastic simulation of the spread of race-specific and race-nonspecific aerial
fungal pathogens in cultivar mixtures. Plant Pathology, 49: 207-218.
Zhu, Y-Y., Fang, H., Wang, Y.-Y., Fan, J. X., Yang, S.-S., Mew, T. W., Mundt, C. C. 2005. Panicle blast and
canopy moisture in rice cultivar mixtures. Phytopathology, 95: 433-438.

90

91
CHAPTER 6
Population structure of Plasmopara viticola at
single vine scale
CHAPTER 6
92
ABSTRACT
The genetic structure of Plasmopara viticola populations was characterized on five
grapevine cultivars using four neutral specific polymorphic microsatellite markers.
Thousand one hundred eighty-four samples were collected on vines of cultivars Regent,
Merlot, Isabella, Müller-Thurgau and Solaris, at four dates in the period between the 10th of
July and the 23rd of August 2006. Samples were collected on 15 vines of each cultivar
planted on a row; on the central vine of each row an intense sampling was performed. The
majority of diversity was distributed, for each of the five grapevine cultivars, among the 14
vines of the cultivar row, lower diversity was observed at vine scale. On average over all
five cultivars 67% of the genotypes present on the single vines derived from primary
infections and caused 37% of the lesions genotyped. Fifty-three percent of these genotypes
occurred only once on the vine throughout the survey period, while 14% were able to
asexually reproduce on the selected single vine throughout the survey period, causing 23%
of the lesions. Thirty-three percent of the genotypes on the single vine derived from other
vines, 28% from vines of other cultivars on the other rows, and 5% from vines of the same
cultivar on the same row. New primaries appear all along the sampling dates. The
overwhelmingly quantitatively role of primary infections at vineyard scale was known,
however here we observed the phenomenon also at the single vine scale and observed the
reduced contribution of secondary lesions to the populations present on more resistant
cultivars compared to the susceptible cultivars. As the sampling was extended to almost
defoliation, the results are judged to be representative to a typical P. viticola epidemic.
CHAPTER 6
93
INTRODUCTION
Plasmopara viticola (Berk. and Curt.) Berl. and de Toni the causal agent of grapevine
downy mildew is considered one of the most important grapevine pathogens worldwide.
The diploid heterothallic (Wong et al. 2001) obligate biotroph Oomycete attacks leaves,
fruits and young shoots.
Recent population genetic studies have shown that primary oosporic infections
contribute to the epidemic throughout the season (May to late October, depending on the
region), with most genotypes having a limited ability to spread asexually (Gobbin et al.
2003a, Rumbou and Gessler 2004, 2006). Gobbin et al. (2005) individuated five possible
dispersal patterns of P. viticola genotypes: (i) clonal multiplication at distances shorter than
1 m from the putative primary lesion (close to the source), (ii) clonal multiplication close to
the source followed by plot-scaled dispersal, (iii) multicluster plot-scaled dispersal without
previous clonal multiplication close to the source, (iv) random plot-scaled dispersion
without previous clonal multiplication close to the source, and (v) minor clonal
multiplication and dispersal. The most frequent pattern (ii) is characterized by some
spatially localized clustered lesions derived from a single genotype (resulting from
secondary infections) and a random distribution of genetically different genotypes
(resulting from primary infections) (Gobbin et al. 2003a, 2005, Rumbou and Gessler 2004,
2006).
Starting from published data of European (Gobbin et al. 2003a, 2005, Rumbou and
Gessler, 2004, 2006), Australian (Hug 2005) and American P. viticola populations (Eugster
2003), Gessler (2006) focused on the few cases were data of samplings at small scale where
available and concluded that secondary infections were spatially localized in most cases (at
leaf, branch or vine scale) and that the average number of lesions formed by a single
genotype was higher compared to the plot scale indicating that under those conditions
secondary infections are the cause of damage.
Our objective was to quantify, at single vine plant scale, the amount of primary and
secondary infections and to determine the genetic structure of P. viticola populations along
one season, this performing an intense, where possible complete, sampling on vines of the
five grapevine cultivars with different levels of susceptibility to P. viticola.

CHAPTER 6
94
MATERIAL AND METHODS
Experimental plot
The plot considered in the following experiment is part of the experimental vineyard
described in CHAPTER 4. The experimental vineyard was planted in May 2004 in Cugnasco
(Southern Part of Switzerland). Vines of eight V. vinifera and interspecific hybrid cultivars
(Regent, Merlot, Isabella, Müller-Thurgau, Solaris, Bianca, Gamaret and Chambourcin)
with different levels of susceptibility to P. viticola were arranged in four within-row
mixture blocks (8 rows a 16 vines, with two vines of each cultivar planted nearby) and in
one one-cultivar-by-row block (15 vines, with one single cultivar per row). Distance
between vines was 0.8 × 2.0 m, distance between blocks was 1.6 m. The planting density in
the experimental plot was 6250 vines/ha. Vines were trained in a Guyot system. Pruning,
canopy management, fertilization and weeds control were conducted as in the surrounding
vine-growers’ vineyards. Treatments with Difenoconazol® against powdery mildew were
performed.
In the present study, the fifteen vines of the five cultivars Solaris, Regent, Isabella,
Merlot and Müller-Thurgau (ordered from the most resistant to the most susceptible) of the
one-cultivar-by-row block were considered (Fig. 1).
Figure 1. Representation of planting arrangements in the experimental plot, each square represents a vine. For
each of the five cultivars Solaris, Müller-Thurgau, Isabella, Merlot and Regent (represented by different grey
gradations) 15 vines are planted on a row. On 14 vines per cultivar, defined as cultivar row (CR) all lesion
observed on vines were collected by the first and second sampling date; afterwards maximally 4 lesions per
vine were collected. On one vine at the center of the row (P72) all well delimitated lesions (having a diameter
bigger then 0.8 cm) were collected at all sampling dates, limited to a maximum of 150 samples per date. The
totality of the 70 vines (14 vines x 5 cultivars) surrounding the central vine P72 was considered as plot (plot).

CHAPTER 6
95
Disease assessment
Disease severity and incidence were assessed on leaves of one randomly chosen shoot per
each of the 15 vines of the five cultivars Solaris, Regent, Isabella, Merlot and Müller-
Thurgau at five dates (5th, 19th and 30th of July, 25th of August and 12th of September 2006)
and analyzed as described in CHAPTER 4.
Sample collection and processing
Sampling was performed as described in CHAPTER 5 at six dates (26th of May, 9th of June,
10th, 19th and 30th of July and 23rd of August). Samples consisted of half a sporulating
lesion (about 1 cm2, including some healthy leaf tissue) excised with a cutter (Gobbin et al.,
2003b). On 14 vines per row of the five cultivars Solaris, Regent, Isabella, Merlot and
Müller-Thurgau, defined as cultivar row (CR, Fig. 1) all lesion observed on vines were
collected by the first and second sampling date; afterwards maximally 4 lesions per vine
were collected. On one vine in the central position of the row (P72, Fig. 1) all well
delimitated lesions, having a diameter bigger than 0.8 cm were collected at all sampling
dates, limited to a maximum of 150 samples per date. The totality of the 70 (14 vines x 5
cultivars, excluding P72) surrounding the five single selected vines was considered as plot
(plot). DNA extraction was performed as described in Gobbin et al. (2003b). Samples were
analyzed as described in CHAPTER 5.
Genotypic and gene diversity
Genotypic diversity was estimated for each population by the Shannon-Wiener’s index H
(Shannon and Weaver 1949) normalized for variable sample size by scaling the index by
the value of the natural logarithm of the sample size (Shannon equitability EH, takes into
account the number and the evenness of genotypes; higher the index, higher the number of
unique genotypes or higher the genotype evenness, Pielou 1966), Simpson index (takes into
account the number of genotypes present, as the relative abundance of each genotype;
higher the value, lower the number of genotypes, with some genotypes present at higher
frequency, Simpson 1949) and Evenness (Shannon-Wiener index H scaled by the natural
logarithm of the number of genotypes, quantifies how equal the populations are, Pielou
1966) using the total number of individuals in the sample. Calculations were performed
with the Shannon Entropy Calculator available online (http://www.changbioscience.com/
genetics/shannon.html).

CHAPTER 6
96
The ratio G/N was calculated for each population by dividing the number of
genotypes detected by the number of lesions analyzed.
Gene diversity was studied separately for each population using clone-corrected
data. For each locus the number of alleles (Na), the effective number of alleles (Ne, Brown
and Weir 1983; it enables the comparison of allelic diversity to be made across
populations), and the expected heterozygosity (He, Hartl and Clark 1997) were calculated
using the software GenAlex (Peakall and Smouse 2006).
Genotype distribution
Two groups of infections were defined: 1) Primary infections and 2) Secondary infections.
Primary infections comprehend 1a) Genotypes without secondary progeny on the same P72
(single genotype), 1ai) Genotypes found exclusively on vine P72, without secondary
progeny on the same P72, 1b) Genotypes with secondary progeny on the same P72 (clonal
genotype), 1bi) Genotype found exclusively on vine P72, with secondary progeny on the
same P72. Secondary infections comprehend: 2a) Genotypes originated on vines of a
specific cultivar and immigrating to the P72 of the same cultivar, 2b) Genotypes originated
on vines of a specific cultivar and immigrating to the P72 of another cultivar (Figure 3).

CHAPTER 6
97
RESULTS
Disease progress
Highest disease severity and incidence values were observed for Müller-Thurgau and
Merlot, lowest for Solaris and Regent, and intermediate for Isabella. The steepest disease
severity increase occurred on Müller-Thurgau between the 19th and the 30th of July (from 9
to 27%); between the 30th of July and the 25th of August on vines of the cultivars Merlot
(from 13 to 70%), Regent (from 6 to 24%) and Solaris (from 1 to 17%); and between the
25th of August and the 12th of September on Isabella (from 24 to 39%; Fig. 2).
Figure 2. P. viticola severity (a) and incidence (b) assessed on leaves of one randomly chosen shoot per each
of the 15 vines of the experimental plot of the five cultivars Regent (white circle), Merlot (black rhombus),
Isabella (grey triangle), Müller-Thurgau (black circle) and Solaris (white rhombus) throughout the period 5th
July – 13th September 2006 in Cugnasco.
A reduction in disease severity was observed on vines of cultivar Müller-Thurgau after the
25th of August (from 69 to 37%). Significantly different (P < 0.001) severity values were
observed among the two susceptible cultivars Müller-Thurgau and Merlot and the three
more resistant cultivars Regent, Solaris and Isabella at the 19th of July and 25th of August.
Disease incidence increased the fastest between the 5th and the 19th of July on vines of
cultivars Merlot (from 3 to 72%), Isabella (from 2 to 38%) and Müller-Thurgau (from 3 to
85%); and between the 30th of July and the 25th of August on vines of cultivars Regent
(from 21 to 100%) and Solaris (from 30 to 80%). A reduction of disease incidence was
observed on vines of cultivars Merlot and Müller-Thurgau after the 25th of August.
Significant differences (P < 0.001) in disease incidence were observed at the 19th and 30th
of July among the susceptible cultivars (Merlot and Müller-Thurgau), the intermediate

CHAPTER 6
98
(Isabella) and the two resistant cultivars (Regent and Solaris). By the 25th of August disease
incidence values assessed on Merlot, Müller-Thurgau and Regent significantly differed
from them assessed on Isabella and Solaris.
Genotypic and gene diversity
In the experimental plot 1184 of the collected samples were successfully genotyped, 72%
of them were considered in the analysis. The remaining 28% of the data were excluded
from the analysis because more than two alleles were scored at one or more SSR loci.
Genotypic and gene diversities at plot, cultivar row (CR) and vine scale (P72) were high
(Tab. 1 and 3).
The highest number of genotypes per number of lesions (G/N), Shannon equitability
(EH,) and evenness (E) were observed for all cultivars (except Isabella, for G/N) at CR
scale. The Simpson index (D) was either lower at CR scale (for Merlot, Isabella) or equal
than at vine scale (P72, Regent, Müller-Thurgau and Solaris) (Tab. 1).
The highest effective number of alleles (Ne) and expected heterozygosity (He) over
all loci) were observed at CR scale (Tab. 3). Considering each sampling data separately, the
same trend for higher genotypic and gene diversity (for all parameters) at CR scale than on
vine (P72) scale was observed for the majority of cultivars, SSR loci, and sampling data
(Tab. 2 and 4).
Table 1. Genotypic diversity of P. viticola considering all samples analyzed at plot, cultivar row and single
vine scale present on vines of cultivars Regent, Merlot, Isabella, Müller-Thurgau and Solaris for all sampling
dates pooled. Cultivar (CV), sum of CR of the five cultivars (All), CR of the five cultivars (plot), cultivar row
(CR) and vine scale (P72), number of samples (vines), number of genotypes (G), number of
genotypes/number of samples (G/N), Shannon equitability (EH), Simpson index (D), Evenness (E).
CV Scale Vines G N G/N EH D E All Plot 70 193 287 0.67 0.89 0.01 0.96 Regent CR 14 22 31 0.71 0.87 0.06 0.96 P72 1 52 134 0.39 0.69 0.06 0.85 Merlot CR 14 61 87 0.70 0.88 0.02 0.96 P72 1 70 156 0.45 0.72 0.05 0.85 Isabella CR 14 47 59 0.80 0.92 0.03 0.97 P72 1 15 18 0.83 0.89 0.09 0.95 Müller-Thurgau CR 14 46 59 0.78 0.91 0.03 0.97 P72 1 74 134 0.55 0.82 0.03 0.93 Solaris CR 14 41 51 0.80 0.91 0.03 0.97 P72 1 75 128 0.59 0.82 0.03 0.92

CHAPTER 6
99
Table 2. Genotypic diversity of P. viticola considering all samples analyzed at plot, cultivar row and single
vine scale on vines of cultivars Regent, Merlot, Isabella, Müller-Thurgau and Solaris for each sampling date.
Cultivar (CV), sum of CR of the five cultivars (All), CR of the five cultivars (plot), cultivar row (CR) and
vine scale (P72), sampling number (SA), number of lesions on each single selected vine P72 (L), number of
samples (N), number of genotypes (G), number of genotypes/number of samples (G/N), Shannon equitability
(EH), Simpson index (D), Evenness (E).
CV Scale SA L G N G/N EH D E All Plot 1 1 1 1.00 1.00 2 6 6 1.00 1.00 0.17 1.00 3 24 31 0.77 0.90 0.05 0.98 4 60 79 0.76 0.91 0.02 0.97 5 65 84 0.77 0.92 0.02 0.97 6 71 86 0.83 0.93 0.02 0.97 Regent CR 3 1 1 1.00 1.00 5 15 22 0.68 0.83 0.09 0.95 6 6 8 0.75 0.83 0.19 0.97 Regent P72 5 193 41 92 0.45 0.69 0.09 0.84 6 >200a 23 42 0.55 0.77 0.07 0.91 Merlot CR 2 3 3 1.00 1.00 0.33 1.00 3 15 18 0.83 0.92 0.07 0.98 4 24 33 0.73 0.86 0.06 0.94 5 20 25 0.80 0.88 0.08 0.95 6 8 8 1.00 1.00 0.13 1.00 Merlot P72 3 6 1 5 0.20 0.00 1.00 4 108 41 70 0.59 0.81 0.04 0.93 5 >200b 15 27 0.56 0.70 0.15 0.86 6 >200a 24 54 0.44 0.65 0.14 0.81 Isabella CR 1 1 1 1.00 1.00 2 1 1 1.00 1.00 3 6 7 0.86 0.90 0.18 0.98 4 10 11 0.91 0.95 0.11 0.99 5 13 13 1.00 1.00 0.08 1.00 6 24 26 0.92 0.96 0.05 0.99 Isabella P72 3 6 3 3 1.00 1.00 0.33 1.00 5 >200b 5 5 1.00 1.00 0.20 1.00 6 >200c 8 10 0.80 0.86 0.16 0.95 Müller-Thurgau CR 2 2 2 1.00 1.00 0.50 1.00 3 3 4 0.75 0.75 0.38 0.95 4 17 21 0.81 0.91 0.07 0.97 5 13 14 0.93 0.96 0.08 0.99 6 18 18 1.00 1.00 0.06 1.00 Müller-Thurgau P72 3 9 2 9 0.22 0.29 0.56 0.92 4 >200c 51 79 0.65 0.85 0.03 0.95 5 >200c 24 29 0.83 0.92 0.05 0.98 6 >200c 9 17 0.53 0.73 0.14 0.94 Solaris CR 3 1 1 1.00 1.00 4 13 14 0.93 0.96 0.08 0.99 5 9 10 0.90 0.94 0.12 0.98 Solaris P72 4 183 67 114 0.59 0.81 0.04 0.91 5 >200a 9 10 0.90 0.94 0.12 0.98 6 >200a 4 4 1.00 1.00 0.25 1.00
a Small lesions b Merging lesions c Lesions covering whole leaf
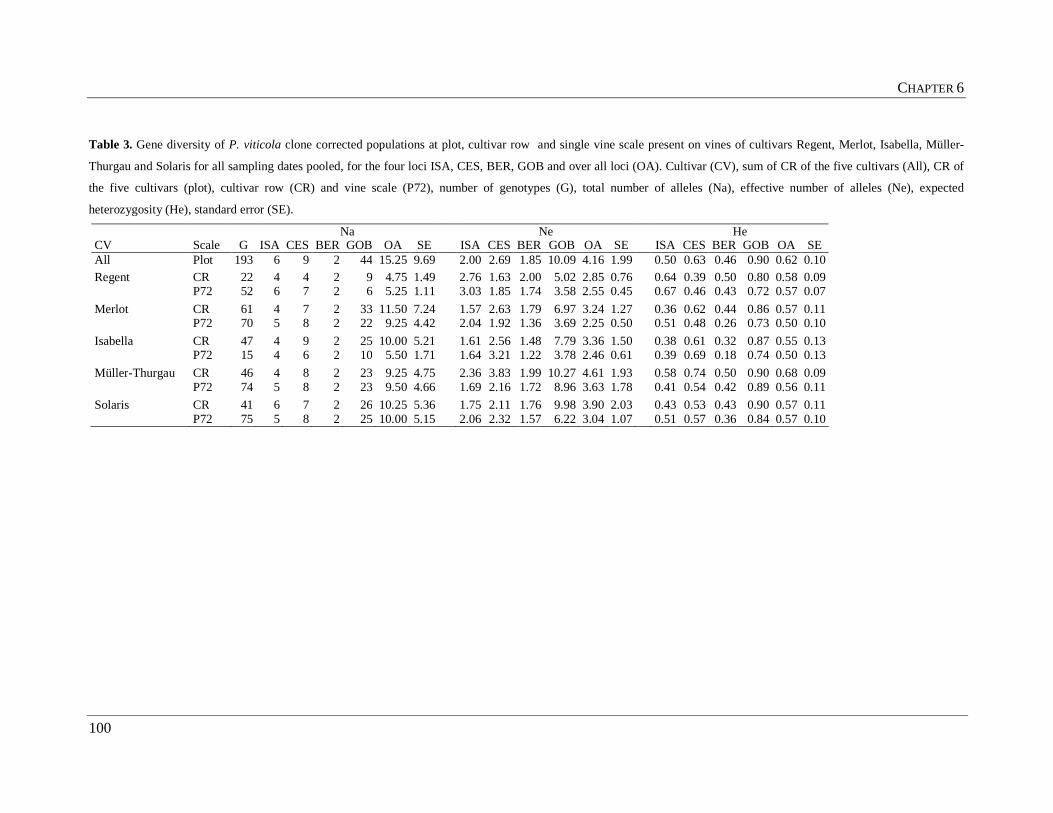
CHAPTER 6
100
Table 3. Gene diversity of P. viticola clone corrected populations at plot, cultivar row and single vine scale present on vines of cultivars Regent, Merlot, Isabella, Müller-
Thurgau and Solaris for all sampling dates pooled, for the four loci ISA, CES, BER, GOB and over all loci (OA). Cultivar (CV), sum of CR of the five cultivars (All), CR of
the five cultivars (plot), cultivar row (CR) and vine scale (P72), number of genotypes (G), total number of alleles (Na), effective number of alleles (Ne), expected
heterozygosity (He), standard error (SE).
Na Ne He CV Scale G ISA CES BER GOB OA SE ISA CES BER GOB OA SE ISA CES BER GOB OA SE All Plot 193 6 9 2 44 15.25 9.69 2.00 2.69 1.85 10.09 4.16 1.99 0.50 0.63 0.46 0.90 0.62 0.10 Regent CR 22 4 4 2 9 4.75 1.49 2.76 1.63 2.00 5.02 2.85 0.76 0.64 0.39 0.50 0.80 0.58 0.09 P72 52 6 7 2 6 5.25 1.11 3.03 1.85 1.74 3.58 2.55 0.45 0.67 0.46 0.43 0.72 0.57 0.07 Merlot CR 61 4 7 2 33 11.50 7.24 1.57 2.63 1.79 6.97 3.24 1.27 0.36 0.62 0.44 0.86 0.57 0.11 P72 70 5 8 2 22 9.25 4.42 2.04 1.92 1.36 3.69 2.25 0.50 0.51 0.48 0.26 0.73 0.50 0.10 Isabella CR 47 4 9 2 25 10.00 5.21 1.61 2.56 1.48 7.79 3.36 1.50 0.38 0.61 0.32 0.87 0.55 0.13 P72 15 4 6 2 10 5.50 1.71 1.64 3.21 1.22 3.78 2.46 0.61 0.39 0.69 0.18 0.74 0.50 0.13 Müller-Thurgau CR 46 4 8 2 23 9.25 4.75 2.36 3.83 1.99 10.27 4.61 1.93 0.58 0.74 0.50 0.90 0.68 0.09 P72 74 5 8 2 23 9.50 4.66 1.69 2.16 1.72 8.96 3.63 1.78 0.41 0.54 0.42 0.89 0.56 0.11 Solaris CR 41 6 7 2 26 10.25 5.36 1.75 2.11 1.76 9.98 3.90 2.03 0.43 0.53 0.43 0.90 0.57 0.11 P72 75 5 8 2 25 10.00 5.15 2.06 2.32 1.57 6.22 3.04 1.07 0.51 0.57 0.36 0.84 0.57 0.10

CHAPTER 6
101
Table 4. Gene diversity of P. viticola clone corrected populations at plot, cultivar row and single vine scale present on vines of cultivars Regent, Merlot, Isabella, Müller-
Thurgau and Solaris for each sampling date, for the four loci ISA, CES, BER, GOB and over all loci (OA). Cultivar (CV), sum of CR of the five cultivars (All), CR of the five
cultivars (plot), cultivar row (CR) and vine scale (P72), sampling date (SA), number of genotypes (G), total number of alleles (Na), effective number of alleles (Ne), expected
heterozygosity (He), standard error (SE).
Na Ne He CV Scale SA G ISA CES BER GOB OA SE ISA CES BER GOB OA SE ISA CES BER GOB OA SE All Plot 1 1 2 6 2 5 1 10 4.50 2.02 1.18 3.13 1.00 9.00 3.58 1.87 0.15 0.68 0.00 0.89 0.43 0.21 3 24 4 8 2 21 8.75 4.27 1.96 3.16 1.92 7.84 3.72 1.40 0.49 0.68 0.48 0.87 0.63 0.09 4 60 5 8 2 33 12.00 7.11 1.88 3.19 1.87 12.79 4.93 2.64 0.47 0.69 0.46 0.92 0.64 0.11 5 65 5 9 2 29 11.25 6.09 2.61 2.35 1.83 7.61 3.60 1.35 0.62 0.57 0.45 0.87 0.63 0.09 6 71 5 7 2 29 10.75 6.17 1.55 2.33 1.78 8.43 3.52 1.64 0.35 0.57 0.44 0.88 0.56 0.12 Regent CR 5 15 4 4 2 7 4.25 1.03 2.26 1.91 1.97 4.89 2.76 0.72 0.56 0.48 0.49 0.80 0.58 0.07 P72 5 41 4 7 2 5 4.50 1.04 2.71 2.09 1.79 3.43 2.50 0.36 0.63 0.52 0.44 0.71 0.58 0.06 Regent CR 6 6 3 1 2 6 3.00 1.08 2.57 1.00 1.80 5.14 2.63 0.90 0.61 0.00 0.44 0.81 0.47 0.17 P72 6 23 6 3 2 6 4.25 1.03 3.10 1.25 1.68 3.69 2.43 0.58 0.68 0.20 0.41 0.73 0.50 0.12 Merlot CR 3 15 4 6 2 16 7.00 3.11 1.90 3.88 1.99 7.38 3.79 1.28 0.47 0.74 0.50 0.86 0.64 0.10 Merlot CR 4 24 4 6 2 23 8.75 4.82 1.48 2.38 1.75 7.48 3.27 1.41 0.32 0.58 0.43 0.87 0.55 0.12 P72 4 41 5 6 2 19 8.00 3.76 1.97 1.56 1.46 4.58 2.39 0.74 0.49 0.36 0.31 0.78 0.49 0.11 Merlot CR 5 20 4 6 2 17 7.25 3.35 1.78 2.35 1.66 6.50 3.08 1.15 0.44 0.58 0.40 0.85 0.56 0.10 P72 5 15 2 7 2 12 5.75 2.39 1.07 1.67 1.38 5.63 2.44 1.07 0.06 0.40 0.28 0.82 0.39 0.16 Merlot CR 6 8 1 3 2 6 3.00 1.08 1.00 1.66 1.88 2.03 1.64 0.23 0.00 0.40 0.47 0.51 0.34 0.12 P72 6 24 5 5 2 7 4.75 1.03 2.18 2.49 1.09 1.66 1.85 0.31 0.54 0.60 0.08 0.40 0.40 0.12 Isabella CR 3 6 3 6 1 4 3.50 1.04 1.41 2.67 1.00 2.06 1.78 0.37 0.29 0.63 0.00 0.51 0.36 0.14 Isabella CR 4 10 3 5 2 11 5.25 2.02 1.68 2.17 1.22 9.52 3.65 1.97 0.41 0.54 0.18 0.90 0.51 0.15 Isabella CR 5 13 4 7 2 14 6.75 2.63 2.27 2.96 1.83 5.54 3.15 0.83 0.56 0.66 0.45 0.82 0.62 0.08 P72 5 5 3 6 2 5 4.00 0.91 2.17 5.00 1.22 2.50 2.72 0.81 0.54 0.80 0.18 0.60 0.53 0.13 Isabella CR 6 24 3 5 2 18 7.00 3.72 1.48 2.08 1.38 8.35 3.32 1.68 0.32 0.52 0.28 0.88 0.50 0.14 P72 6 8 1 4 2 7 3.50 1.32 1.00 1.97 1.13 5.12 2.31 0.96 0.00 0.49 0.12 0.80 0.35 0.18
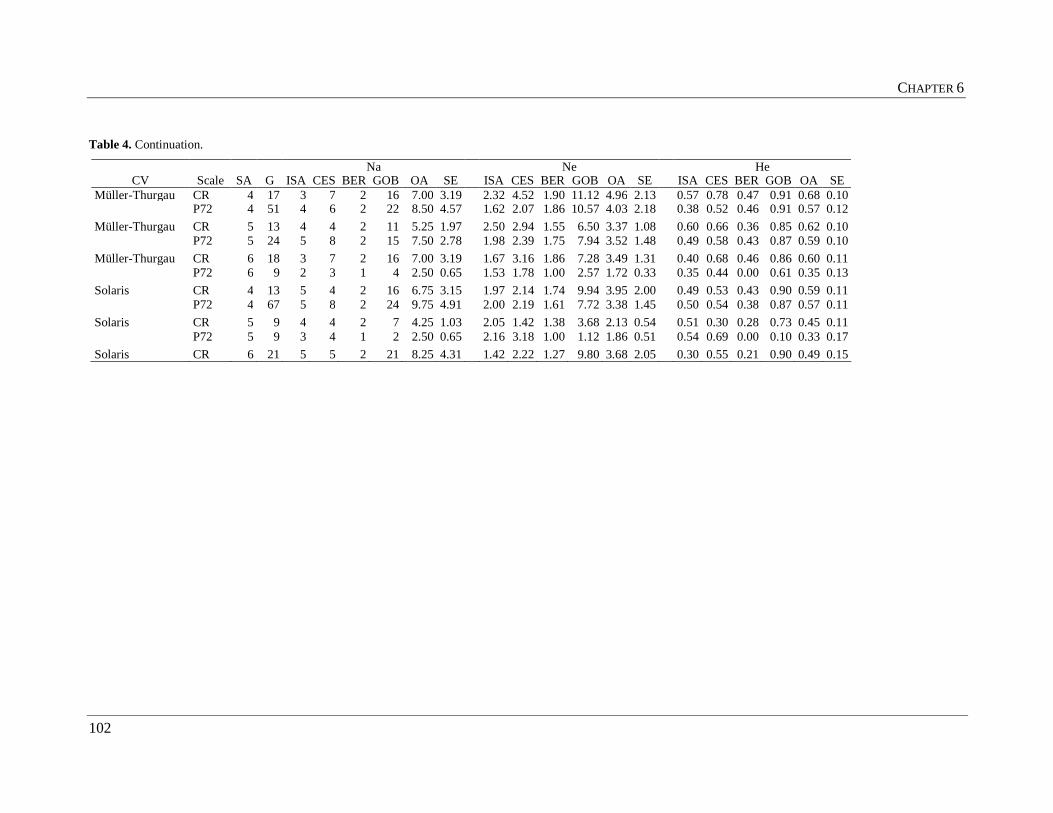
CHAPTER 6
102
Table 4. Continuation.
Na Ne He CV Scale SA G ISA CES BER GOB OA SE ISA CES BER GOB OA SE ISA CES BER GOB OA SE
Müller-Thurgau CR 4 17 3 7 2 16 7.00 3.19 2.32 4.52 1.90 11.12 4.96 2.13 0.57 0.78 0.47 0.91 0.68 0.10 P72 4 51 4 6 2 22 8.50 4.57 1.62 2.07 1.86 10.57 4.03 2.18 0.38 0.52 0.46 0.91 0.57 0.12 Müller-Thurgau CR 5 13 4 4 2 11 5.25 1.97 2.50 2.94 1.55 6.50 3.37 1.08 0.60 0.66 0.36 0.85 0.62 0.10 P72 5 24 5 8 2 15 7.50 2.78 1.98 2.39 1.75 7.94 3.52 1.48 0.49 0.58 0.43 0.87 0.59 0.10 Müller-Thurgau CR 6 18 3 7 2 16 7.00 3.19 1.67 3.16 1.86 7.28 3.49 1.31 0.40 0.68 0.46 0.86 0.60 0.11 P72 6 9 2 3 1 4 2.50 0.65 1.53 1.78 1.00 2.57 1.72 0.33 0.35 0.44 0.00 0.61 0.35 0.13 Solaris CR 4 13 5 4 2 16 6.75 3.15 1.97 2.14 1.74 9.94 3.95 2.00 0.49 0.53 0.43 0.90 0.59 0.11 P72 4 67 5 8 2 24 9.75 4.91 2.00 2.19 1.61 7.72 3.38 1.45 0.50 0.54 0.38 0.87 0.57 0.11 Solaris CR 5 9 4 4 2 7 4.25 1.03 2.05 1.42 1.38 3.68 2.13 0.54 0.51 0.30 0.28 0.73 0.45 0.11 P72 5 9 3 4 1 2 2.50 0.65 2.16 3.18 1.00 1.12 1.86 0.51 0.54 0.69 0.00 0.10 0.33 0.17 Solaris CR 6 21 5 5 2 21 8.25 4.31 1.42 2.22 1.27 9.80 3.68 2.05 0.30 0.55 0.21 0.90 0.49 0.15

CHAPTER 6
103
Genotype distribution
On average over all five cultivars 67% of the genotypes present on the single vines P72
derived from primary infections on that vine (1), Fig. 3); on average they caused 37% of the
lesions genotyped. Fifty-three percent of these genotypes occurred only once on the vine
(P72) throughout the survey period (1a) single genotypes, Fig. 3), while 14% were able to
asexually reproduce on the selected single vine throughout the survey period (1b) clonal
genotypes, Fig. 3), causing 23% of the lesions. Thirty-three percent of the genotypes on the
single vine P72 derived from other vines, 28% from vines of other cultivars on the other
rows (2b), Fig. 3), and 5% from vines of the same cultivar on the same row (2a), Fig. 3).
Considering vine P72 as isolated vine, excluding all sources of inoculum coming
from other vines, 51, 60, 100, 60 and 83% of the lesions present on vine P72 of cultivars
Regent, Merlot, Isabella, Müller-Thurgau and Solaris, respectively is from primary
infections, and 49, 40, 0, 40 and 17% is derived from asexually reproduction on the vine
(data not shown).
Forty-seven percent of the lesions observed on vine P72 of cultivar Isabella
belonged to genotypes observed previously on vines of other cultivars (2b), Fig. 3). The
two most frequent genotypes on Isabella caused 22 and 11% of the lesions, respectively
(Tab. 5). A low percentage of secondary re-infections (8%) and of lesions caused by
genotypes observed previously on vines of the same cultivar (2%) was observed for the
cultivar Solaris. Thirty-three percent of the lesions were caused by 56% of the genotypes
observed exclusively on the single selected vine (Fig. 3). The two most frequent genotypes
on vine P72 of cultivar Solaris caused 10 and 9% of the lesions, respectively. The first
genotype was the second most frequent genotype of the experimental plot (Tab. 5).

CHAPTER 6
104
Schematic representation Regent (134 lesions) Merlot (156 lesions)
Isabella (18 lesions) Müller-Thurgau (134 lesions) Solaris (128 lesions)
Figure 3. Percentual distribution of genotypes and lesions at vine scale for each single selected vine of cultivars Regent, Merlot, Isabella, Müller-Thurgau and Solaris. All
sampling dates were pooled. Percentage of lesions (%N), percentage of genotypes (%G). Two groups of infections were defined: 1) Primary infections and 2) Secondary
infections. Primary infections comprehend 1a) Genotypes without secondary progeny on the same P72 (single genotype), 1ai) Genotypes found exclusively on vine P72,
without secondary progeny on the same P72, 1b) Genotypes with secondary progeny on the same P72 (clonal genotype), 1bi) Genotype found exclusively on vine P72, with
secondary progeny on the same P72. Secondary infections comprehend: 2a) Genotypes originated on vines of a specific cultivar and immigrating to the P72 of the same
cultivar, 2b) Genotypes originated on vines of a specific cultivar and immigrating to the P72 of another cultivar.

CHAPTER 6
105
Table 5. Number and percent of genotypes observed on the single vine of cultivars Regent, Merlot, Isabella,
Müller-Thurgau and Solaris. Ranking and frequency (in brackets) of the genotype in the whole experimental
plot (number and letters if genotypes were present at the same frequency, Code), number of lesions caused by
the genotype on the single selected vine (N), percentage of lesions on the total number of lesions observed on
the single selected vine (N%), single genotypes (SG), total number of lesions observed on the single selected
vine (Total).
Regent Merlot Isabella Müller-Thurgau Solaris Code N N% Code N N% Code N N% Code N N% Code N N% 3(26) 25 19 2(45) 23 15 6(14) 4 22 1(54) 11 8 2(45) 13 10 1(54) 12 9 4(21) 16 10 15h(4) 2 11 2(45) 9 7 5(18) 11 9
9b(10) 10 7 1(54) 15 10 14f(5) 1 6 12c(7) 7 5 6(14) 6 5 10(9) 9 7 8a(11) 9 6 16t(3) 1 6 13f(6) 6 4 9a(10) 5 4
13e(6) 6 4 11b(8) 7 4 17ar(2) 1 6 14g(5) 5 4 1(54) 4 3 11a(8) 5 4 15b(4) 4 3 7(13) 1 6 15g(4) 4 3 13i(6) 4 3 13c(6) 3 2 15c(4) 4 3 8b(11) 1 6 16c(3) 3 2 16l(3) 3 2 14e(5) 3 2 7(13) 4 3 16s(3) 3 2 13g(6) 2 2 15d(4) 3 2 5(18) 3 2 16u(3) 3 2 14b(5) 2 2 15e(4) 3 2 12b(7) 2 1 16v(3) 3 2 14d(5) 2 2 16i(3) 3 2 14f(5) 2 1 5(18) 3 2 15a(4) 2 2 16h(3) 2 1 15a(4) 2 1 8b(11) 3 2 17a(2) 2 2 16o(3) 2 1 15h(4) 2 1 13d(6) 2 1 17ae(2) 2 2
17ad(2) 2 1 16n(3) 2 1 13g(6) 2 1 17av(2) 2 2 17am(2) 2 1 16r(3) 2 1 14a(5) 2 1 17c(2) 2 2 17ao(2) 2 1 17ag(2) 2 1 15j(4) 2 1 17e(2) 2 2 17at(2) 2 1 17j(2) 2 1 15m(4) 2 1 17o(2) 2 2 17g(2) 2 1 17p(2) 2 1 16b(3) 2 1 17z(2) 2 2 17m(2) 2 1 8b(11) 2 1 16f(3) 2 1 7(13) 2 2 17n(2) 2 1 13b(6) 1 1 17af(2) 2 1 8a(11) 2 2 7(13) 2 1 15e(4) 1 1 17ai(2) 2 1 8b(11) 2 2
8b(11) 2 1 15j(4) 1 1 17aq(2) 2 1 12a(7) 1 1 13g(6) 1 1 15l(4) 1 1 17as(2) 2 1 13b(6) 1 1 14f(5) 1 1 15m(4) 1 1 17h(2) 2 1 13d(6) 1 1 15h(4) 1 1 16a(3) 1 1 12a(7) 1 1 13h(6) 1 1 16d(3) 1 1 16m(3) 1 1 13h(6) 1 1 15m(4) 1 1 16j(3) 1 1 16t(3) 1 1 15h(4) 1 1 16a(3) 1 1
16m(3) 1 1 17ac(2) 1 1 15i(4) 1 1 17aa(2) 1 1 17r(2) 1 1 17aj(2) 1 1 15k(4) 1 1 17an(2) 1 1
17al(2) 1 1 17aa(2) 1 1 17k(2) 1 1 17au(2) 1 1 17ac(2) 1 1 17q(2) 1 1 17f(2) 1 1 17aj(2) 1 1 17x(2) 1 1 17k(2) 1 1 17q(2) 1 1 17y(2) 1 1 17v(2) 1 1 17r(2) 1 1 17v(2) 1 1 17x(2) 1 1 6(14) 1 1 7(13) 1 1
SG 23 17 SG 36 23 SG 7 39 SG 36 27 SG 42 33 Total 134 Total 156 Total 18 Total 134 Total 128
On Regent the highest value of lesions caused by genotypes found previously on vines of
the same cultivar (30% of the lesions, 2a) Fig. 3) was observed. Compared to the other
cultivars a low percentage of lesions (16%,) was caused by genotypes present previously on
vines of other cultivars (3b), Fig. 3). The first and third most frequent genotypes caused
19% and 7% of the lesions on vine P72; both were found exclusively on vines of cultivar

CHAPTER 6
106
Regent. The second most frequent genotype (most frequent genotype of the whole
experimental plot) caused 9% of the lesions (Tab. 5).
Müller-Thurgau and Merlot had high input from primary infections (40 and 31% of
the lesions, respectively, 1) Fig. 3), from re-infection (26 and 21% of the lesions) and from
lesions found previously on vines of other cultivars (31 and 46% of the lesions, 2b) Fig. 3).
Fifteen percent of the lesions on the single selected vine of cultivar Merlot were caused by
the second most frequent genotype of the experimental plot. The second and third most
frequent genotypes caused 10% of the lesions; they were the first and fourth most frequent
genotype of the experimental plot. The two most frequent genotypes of the experimental
plot were also the two most frequent genotypes observed on the single selected vine of
cultivar Müller-Thurgau; they caused 8 and 7% of the lesions (Tab. 5).
DISCUSSION
At vineyard scale high diversity was always observed (Gobbin et al. 2003a, 2005, Rumbou
and Gessler 2004, 2006), we expected that at row and further at vine scale, this diversity
will be lower. Indeed we observed lower gene and genotypic diversity at vine scale than at
cultivar row scale, but at lower extent than presumed.
Primary infections represent the most important contribution to the epidemics at
vine scale. Only a reduced number of genotypes, that varies depending from the resistance
level of the grapevine cultivar, undergo secondary cycles re-infecting the vines on which
they first appeared. An important contribution to the epidemics at single vines is
represented by asexually derived genotypes coming from neighboring vines; astonishing
most of them derive from vines of different cultivars.
Not any clonal genotype derived from primary infections on vine P72 of cultivar
Isabella could be detected, further 47% of the lesions observed belonged to genotypes
observed previously on vines of other cultivars. Isabella is an interspecific hybrid (V.
labrusca × V. vinifera, VIVC 2007) considered to be moderately resistant to P. viticola,
however in the last years an increase of damage due to the pathogen is observed in Ticino
(Jermini and Gessler, personal communication). The leaves of Isabella are covered with
hairs that repel water from the leaf surface preventing the penetration of the host via germ
tubes (Kortekamp and Zyprian 1999). Experiments performed by Kortekamp and Zyprian

CHAPTER 6
107
(1999) indicate the action of further defense mechanisms for V. labrusca, one parent of
Isabella (VIVC 2007). These defense mechanisms could be responsible of the delay in
strong infection of vines of cultivar Isabella (steepest disease severity increase between the
25th of August and the 12th of September).
A similar situation was observed for the highly resistant cultivar Solaris, few lesions
derived from asexually reproduction on vine P72 could be detected, but otherwise the
percentage of primary infections was high and similar to the one observed for the other
cultivars. The vine architecture of Solaris is similar to Isabella, and is characterized by a
large number of big leaves; nevertheless leaves of Solaris are hairless. On Solaris P.
viticola induces a hypersensitive response, resulting in necrotic spots with no
sporangiophores (Gindro et al. 2003, Pezet et al. 2004). In our experimental plot,
sporulations on Solaris leaves were observed, however to a reduced level. The high
percentage of lesions caused by the second most frequent genotype of the experimental
plot, so as by other frequent genotypes could indicate, as for Isabella, that surrounding
vines with high inoculum pressure represent the source of infection.
On Regent, the second most resistant cultivar used in the experiment, the highest
percentage of lesions derived from asexually reproduction on vine P72 were observed. A
large amount of lesions was caused by genotypes found exclusively on vines of the same
cultivar. As significant host-parasite interactions between P. viticola isolate and grapevine
cultivars have been observed by Kast et al. (2000), this could be interpreted as a specific
interaction of Regent adapted genotypes.
Müller-Thurgau and Merlot had high P. viticola input from primary infections,
asexually reproduction on vine P72, and from genotypes found previously on vines of other
cultivars. On both susceptible cultivars lesions were caused mostly by the most frequent
genotypes observed in the whole plot.
The results are in agreement with previous experiments (Eugster 2003, Hug 2005)
and with the statement that the most frequent pattern of P. viticola dispersal is characterized
by some spatially localized clustered lesions derived from a single genotype (resulting from
secondary infections) and a random distribution of genetically different genotypes
(resulting from primary infections) (Gobbin et al. 2003a, 2005, Rumbou and Gessler 2004,
2006).
The results support the hypothesis that at small scale secondary infections
contribute substantially to the damage, implying that generalized vineyard wide damaging
epidemics are most probably the results of a large number of randomly distributed primary

CHAPTER 6
108
infections followed by uncontrolled secondary multiplication at small scale (Gessler 2006).
Differences between cultivars were observed; epidemic on resistant cultivars was mostly
depending from inoculum coming from surrounding vines, whether on susceptible cultivars
asexually reproduction on vine P72 caused on average one fifth of the lesions.
These results point out 1) the importance of primary infections for the epidemics,
and therefore their reduction, through for instance, the removal of the leaves from the
vineyard in autumn, 2) the reduction of secondary infections, through early treatments, to
prevent the reproduction and subsequent spread at vine and plot scale of most fit genotypes
(Gobbin et al. 2003c, Jermini et al. 2003, 2006), and 3) the differences in epidemics
between resistant and susceptible cultivars.
ACKNOWLEDGEMENTS
This work was supported by SBF 03.0485-1 (EU Project 501542 REPCO). The authors
gratefully acknowledge Rocchina Abbas-Pennella for helping with the laboratory work,
Michele Gusberti and Natasha Rosselli for helping with collection of samples and disease
assessment, and Roberto Rigoni and Mirto Ferretti for the maintaining work in the
vineyard.
L ITERATURE CITED
Brown, A. H. D., Weir, B. S. 1983. Measuring genetic variability in plant populations. Isozymes in Plant
Genetics and Breeding, Tanksley, S. D., Orton, T. J. (eds.), Elsevier Science Publ. Amsterdam, Part
A, 219-239.
Eugster, C. 2003. Relative contribution of oosporic and sporangial inoculum to epidemics of grapevine downy
mildew and genetic structure of Plasmopara viticola in a New York vineyard assessed by
microsatellite technique. Diploma Thesis ETH-Zürich.
Gessler, C., Pertot, I., Gobbin, D. 2006. Genetic structure and epidemiology of Plasmopara viticola
populations. Proceedings of the 5th International workshop on grapevine downy and powdery
mildew. San Michele all’Adige, Italy, 75-77.
CHAPTER 6
109
Gindro, K., Pezet, R., Viret, O. 2003. Histological study of the responses of two Vitis vinifera cultivars
(resistant and susceptible) to Plasmopara viticola infections. Plant Physiology and Biochemistry, 41:
846-853.
Gobbin, D., Pertot, I., Gessler, C. 2003a. Genetic structure of a Plasmopara viticola population in an isolated
Italian mountain vineyard. Journal of Phytopathology, 151: 636-646.
Gobbin, D., Pertot, I., Gessler, C. 2003b. Identification of microsatellite markers for Plasmopara viticola and
establishment of high throughput method for SSR analysis. European Journal of Plant Pathology,
109: 153-164.
Gobbin, D., Jermini, M., Gessler, C. 2003c. The genetic underpinning of the minimal fungicide strategy.
Bulletin OILB/SROP, 26(8): 101-104.
Gobbin, D., Jermini, M., Loskill, B., Pertot, I., Raynal, M., Gessler, C. 2005. Importance of secondary
inoculum of Plasmopara viticola to epidemics of grapevine downy mildew. Plant Pathology, 54:
522-534.
Gobbin, D., Rumbou, A., Linde, C., Gessler, C. 2006. Population genetic structure of Plasmopara viticola
after 125 years of colonization in European vineyards. Molecular Plant Pathology, 6: 519-531.
Hartl, D. L., Clark, A. G .1997. Principles of Population Genetics 3rd ed., Sunderland, Sinauer Associates,
Massachusetts.
Hug, F. 2005. Genetic structure and epidemiology of Plasmopara viticola populations from Australian grape
growing regions. Diploma Thesis ETH-Zürich.
Jermini, M., Blaise, P., Gessler, C. 2003. Response of grapevine growth and yield quantity to the application
of a minimal fungicide strategy for the control of the downy mildew (Plasmopara viticola). Bulletin
OILB/SROP, 26(8): 25-29.
Jermini, M., Christen, D., Strasser, R., Gessler, C. 2006. Impact of four years application of the minimal
fungicide strategy for downy mildew control on the plant recovery capacities of Vitis vinifera cv
Merlot. Proceedings of the 5th International workshop on grapevine downy and powdery mildew. San
Michele all’Adige, Italy, 176-177.
Kast, W. K., Stark-Urnau, M., Seidel, M., Gemmrich, A. R. 2000. Inter-isolate variation of virulence of
Plasmopara viticola on resistant vine varieties. Mitteilungen Klosterneuburg Rebe und Wein,
Obstbau und Früchteverwertung, 50(1): 38-42.
Kortekamp, A., Zyprian, E. 1999. Leaf hairs as a basic protective barrier against downy mildew of grape.
Journal of Phytopathology, 147: 453-459.
Peakall, R., Smouse, P. E. 2006. GENALEX 6: genetic analysis in Excel. Population genetic software for
teaching and research. Molecular Ecology Notes, 6: 288-295.
Pezet, R., Gindro, K., Viret, O., Spring, J.-L. 2004. Glycosylation and oxidative dimerization of resveratrol
are respectively associated to sensitivity and resistance of grapevine cultivars to downy mildew.
Physiological and Molecular Plant Pathology, 65: 297-303.
Pielou, E. C. 1966. The measurement of diversity in different types of biological collections. Journal of
Theoretical Biology, 13: 131-144.
Rumbou, A., Gessler, C. 2004. Genetic dissection of Plasmopara viticola population from a Greek vineyard
in two consecutive years. European Journal of Plant Pathology, 4: 379-392.

CHAPTER 6
110
Rumbou, A., Gessler, C. 2006. Particular structure of Plasmopara viticola populations evolved under Greek
island conditions. Phytopathology, 96: 501-509.
Shannon, C. E., Weaver, W. 1949. The Mathematical Theory of Communication Urbana, University of
Illinois Press.
Simpson, E. H. 1949. Measurement of diversity. Nature, 163: 688.
Vitis International Variety Catalogue (VIVC) 2007. IRZ Institut für Rebenzüchtung Geilweilerhof.
http://www.vivc.bafz.de/.
Wong, F. P., Burr, H. N., Wilcox, W. F. 2001. Heterothallism in Plasmopara viticola. Plant Pathology, 50:
427–32.

CHAPTER 6
111
ANNEX. Spatiotemporal dispersion pattern and frequency of the P. viticola genotypes on vines of cultivars Regent, Merlot, Isabella, Müller-Thurgau and Solaris over the
total number of samples of the five cultivar rows (CR). Genotype (Gen), number of the sampling from 1 to 6 (Sampling 1 to 6), vine number (65-79). Total: frequency of the
genotype on all vines of the considered cultivar over the total number of samples. Names and frequencies of genotypes in bold indicate the most frequent genotype in the plot,
grey indicates genotypes present exclusively on vines of the cultivar.
Merlot
Regent
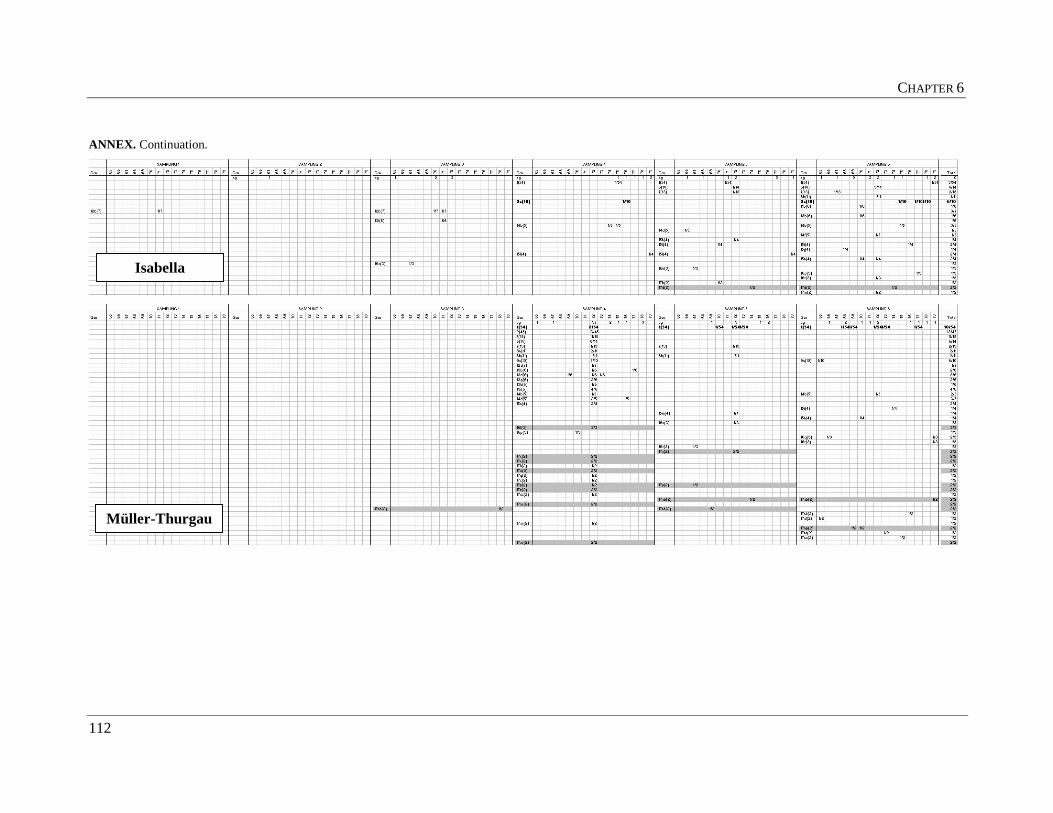
CHAPTER 6
112
ANNEX. Continuation.
Isabella
Müller-Thurgau

CHAPTER 6
113
ANNEX. Continuation.
Solaris

114

115
CHAPTER 7
Going deeper - Population structure of Plasmopara
viticola at small scale: From single vine to leaf

CHAPTER 7
116
ABSTRACT
High genetic diversity characterizes Plasmopara viticola populations at vineyard and single
vine scale. No comparisons were possible between sector and plot scale, between sector and
vine scale, nor within sectors, this due to the relative low number of lesions successfully
genotyped per sector. However, high genotype diversity at leaf scale was observed. Further
a trend for higher number of clonal genotypes shared among vertical, rather than horizontal
sectors was identified, indicating a possible spread of clones at vine level from the top of
the vine to the bottom in zoospore-loaded water drops. The results presented show that high
diversity of P. viticola is present even at very small spatial scale confirming the importance
of primary infections in epidemic.

CHAPTER 7
117
INTRODUCTION
In CHAPTER 6 we analyzed the genetic structure of P. viticola at vine scale on vines of
cultivars Regent, Merlot, Isabella, Müller-Thurgau and Solaris using four neutral specific
polymorphic microsatellite markers. On average over all five cultivars 67% of the
genotypes present on the single vines derived from primary infections and caused 37% of
the lesions genotyped. Fifty-three percent of these genotypes occurred only once on the
vine throughout the survey period, while 14% were able to asexually reproduce on the
selected single vine throughout the survey period, causing 23% of the lesions. Thirty-three
percent of the genotypes on the single vine derived from other vines, 28% from vines of
other cultivars on the other rows, and 5% from vines of the same cultivar on the same row.
Starting from published data of European (Gobbin et al. 2003a, 2005, Rumbou and
Gessler 2004, 2006), Australian (Hug 2005) and American P. viticola populations (Eugster
2003), Gessler (2006) focused on the few cases were data of samplings at small scale where
available and concluded that secondary infections were spatially localized in most cases (at
leaf, branch or vine scale) and that the average number of lesions formed by a single
genotype was higher compared to the plot scale, indicating that at small scale secondary
infections are the cause of damage.
In the present chapter we investigate the genetic structure at two ulterior small
scales: sector and leaf.

CHAPTER 7
118
MATERIAL AND METHODS
Origin of the data
Data for the analysis at sector and leaf scale presented in this chapter were previously
presented in CHAPTER 6 without differentiating sectors. Each of the five single vines P72
presented in CHAPTER 6 was subdivided in ten sectors (horizontally: B and S; vertically:
from the bottom to the top v, w, x, y and z, Fig. 1) delimitated horizontally by the post and
vertically by the wires. By the sampling on the single vines P72 each lesion was
characterized by a code comprehending information about sampling number, row, vine,
sector, leaf, lesion number (if more than one was collected per leaf) allowing to retrace
exactly those origin on the vine.
Figure 1. Subdivision in sectors of the selected vine on which intense and almost complete sampling was
performed. Five vertical sectors (v, w, x, y, z) and two horizontal sectors (B, S) were considered.
Genotypic diversity
Genotypic diversity was estimated for each population by the Shannon-Wiener’s index H
(Shannon and Weaver 1949) normalized for variable sample size by scaling the index by
the value of the natural logarithm of the sample size (Shannon equitability EH, Pielou 1966),
Simpson index (Simpson 1949) and Evenness (Shannon-Wiener index H scaled by the
natural logarithm of the number of genotypes, Pielou 1966) using the total number of
individuals in the sample. Calculations were performed with the Shannon Entropy
Calculator available online (http://www.changbioscience.com/genetics/shannon.html). The
ratio G/N was calculated for each population by dividing the number of genotypes (G) by
the total number of successfully genotyped lesions (N).

CHAPTER 7
119
Gene diversity
Gene diversity was studied separately for each population using clone-corrected
data. For each locus the number of alleles (Na), the effective number of alleles (Ne, Brown
and Weir 1983), that enables the comparison of allelic diversity to be made across
populations, and the expected heterozygosity (He, Hartl and Clark 1997) were calculated
using the software GenAlex (Peakall and Smouse 2006).
RESULTS
No trend in genotypic and gene diversity among the sectors could be identified neither for
all sampling dates nor for the single sampling dates (Tab. 1 to 4).
A higher percentage of genotypes shared among vertical sectors rather than between
horizontal sectors was observed for lesions collected on vines of cultivars Regent, Merlot,
Müller-Thurgau and Solaris by the same sampling, as well as comparing successive
samplings (Fig. 2, Tab. 5). None of these differences was significant (P ≤ 0.01).
In 10% of the cases where more than one lesion was collected per leaf all lesions
were caused by the same P. viticola genotype, while in 68% of the cases all lesions
collected on the same leaf were caused by different genotypes. In the remaining 22% of the
cases, lesions collected on the leaf were caused by one or more clonal genotypes, and by
genotypes occurring only once (inferred from Tab. 6). On two very intense sampled leaves,
13 and 8 genotypes were found causing 20 and 12 lesions, respectively (Tab. 6 and 7).
The number of genotypes shared among leaves within the same sector ranged from
a minimum of one genotype shared between two leaves, observed in 5 cases to a maximum
of one genotype shared among 6 leaves, observed in one case (Tab. 6 and 7).

CHAPTER 7
120
Table 1. Genotypic diversity of P. viticola at sector scale (bottom-top: v, w, x, y and z, left-right: B and S)
present on single selected vines of cultivars Regent, Merlot, Isabella, Müller-Thurgau and Solaris for all
sampling dates pooled. Cultivar (CV), sector (SC), number of samples (N), number of genotypes (G), number
of genotypes/number of samples (G/N), Shannon equitability (EH), Simpson index (D), Evenness (E).
CV SC G N G/N EH D E Regent vB 2 2 1.00 1.00 0.50 1.00 wB 2 4 0.50 0.41 0.63 0.81 xB 9 14 0.64 0.77 0.15 0.93 xS 5 5 1.00 1.00 0.20 1.00 yB 8 17 0.47 0.65 0.20 0.89 yS 5 5 1.00 1.00 0.20 1.00 zB 32 62 0.52 0.74 0.07 0.89 zS 20 25 0.80 0.89 0.07 0.96 All 52 134 0.39 0.69 0.06 0.85 Merlot vB 5 6 0.83 0.87 0.22 0.97 vS 8 9 0.89 0.93 0.14 0.98 wB 7 10 0.70 0.80 0.18 0.94 wS 3 3 1.00 1.00 0.33 1.00 xB 10 13 0.77 0.86 0.12 0.96 xS 10 16 0.63 0.76 0.16 0.91 yB 20 29 0.69 0.83 0.08 0.94 yS 14 15 0.93 0.97 0.08 0.99 zB 8 12 0.67 0.81 0.14 0.97 zS 24 43 0.56 0.79 0.06 0.94 All 70 156 0.45 0.72 0.05 0.85 Isabella wB 2 2 1.00 1.00 0.50 1.00 xB 4 4 1.00 1.00 0.25 1.00 yB 3 4 0.75 0.75 0.38 0.95 zB 1 1 1.00 1.00 zS 6 6 1.00 1.00 0.17 1.00 All 15 18 0.83 0.89 0.09 0.95 Müller-Thurgau vB 4 4 1.00 1.00 0.25 1.00 vS 5 7 0.71 0.80 0.22 0.96 wB 5 5 1.00 1.00 0.20 1.00 wS 7 10 0.70 0.80 0.18 0.94 xB 14 23 0.61 0.75 0.13 0.90 xS 16 20 0.80 0.91 0.07 0.98 yB 16 26 0.62 0.79 0.10 0.92 yS 15 16 0.94 0.97 0.07 0.99 zB 7 7 1.00 1.00 0.14 1.00 zS 14 16 0.88 0.93 0.09 0.97 All 74 134 0.55 0.82 0.03 0.93 Solaris vB 2 2 1.00 1.00 0.50 1.00 vS 4 4 1.00 1.00 0.25 1.00 wB 5 5 1.00 1.00 0.20 1.00 wS 2 2 1.00 1.00 0.50 1.00 xB 7 7 1.00 1.00 0.14 1.00 xS 3 3 1.00 1.00 0.33 1.00 yB 30 58 0.52 0.75 0.07 0.90 yS 8 9 0.89 0.93 0.14 0.98 zB 12 13 0.92 0.96 0.09 0.99 zS 22 25 0.88 0.95 0.05 0.99 All 75 128 0.59 0.82 0.03 0.92

CHAPTER 7
121
Table 2. Gene diversity of Plasmopara viticola clone corrected populations at sector scale (bottom-top: v, w, x, y and z, left-right: B and S) present on vines of cultivars
Regent, Merlot, Isabella, Müller-Thurgau and Solaris for all sampling dates pooled, for the four loci ISA, CES, BER, GOB and over all loci (OA). Cultivar (CV), sector (SC),
number of genotypes (G), total number of alleles (Na), effective number of alleles (Ne), expected heterozygosity (He), standard error (SE).
Na Ne He CV SC G ISA CES BER GOB OA SE ISA CES BER GOB OA SE ISA CES BER GOB OA SE Regent xB 9 2 3 2 5 3.00 0.71 1.25 1.26 1.38 3.12 1.75 0.46 0.20 0.20 0.28 0.68 0.34 0.11 xS 5 4 2 2 2 2.50 0.50 3.57 1.47 1.92 2.00 2.24 0.46 0.72 0.32 0.48 0.50 0.51 0.08 yB 8 4 1 2 3 2.50 0.65 2.72 1.00 1.13 2.91 1.94 0.51 0.63 0.00 0.12 0.66 0.35 0.17 yS 5 3 3 2 4 3.00 0.41 1.85 1.85 1.92 2.94 2.14 0.27 0.46 0.46 0.48 0.66 0.52 0.05 zB 32 6 6 2 6 5.00 1.00 3.12 2.06 1.82 3.12 2.53 0.34 0.68 0.51 0.45 0.68 0.58 0.06 zS 20 4 6 2 3 3.75 0.85 2.61 1.83 1.78 2.97 2.30 0.30 0.62 0.45 0.44 0.66 0.54 0.06 All 52 6 7 2 6 5.25 1.11 3.03 1.85 1.74 3.58 2.55 0.45 0.67 0.46 0.43 0.72 0.57 0.07 Merlot vB 5 2 3 1 4 2.50 0.65 1.47 1.52 1.00 2.38 1.59 0.29 0.32 0.34 0.00 0.58 0.31 0.12 vS 8 4 3 2 9 4.50 1.55 1.71 1.91 1.13 4.27 2.25 0.69 0.41 0.48 0.12 0.77 0.44 0.13 wB 7 3 5 1 5 3.50 0.96 1.56 2.23 1.00 1.88 1.67 0.26 0.36 0.55 0.00 0.47 0.34 0.12 xB 10 3 4 2 4 3.25 0.48 1.50 1.90 1.47 1.37 1.56 0.12 0.34 0.48 0.32 0.27 0.35 0.04 xS 10 4 5 2 8 4.75 1.25 1.87 2.17 1.22 2.94 2.05 0.36 0.47 0.54 0.18 0.66 0.46 0.10 yB 20 4 5 2 14 6.25 2.66 1.70 1.37 1.22 3.09 1.84 0.43 0.41 0.27 0.18 0.68 0.38 0.11 yS 14 1 5 2 9 4.25 1.80 1.00 2.02 1.69 3.11 1.96 0.44 0.00 0.51 0.41 0.68 0.40 0.14 zB 8 3 1 1 7 3.00 1.41 1.86 1.00 1.00 4.74 2.15 0.89 0.46 0.00 0.00 0.79 0.31 0.19 zS 24 5 5 2 14 6.50 2.60 2.03 1.42 1.23 4.41 2.27 0.73 0.51 0.30 0.19 0.77 0.44 0.13 All 70 5 8 2 22 9.25 4.42 2.04 1.92 1.36 3.69 2.25 0.50 0.51 0.48 0.26 0.73 0.50 0.10 Isabella zS 6 2 6 1 4 3.25 1.11 1.60 3.27 1.00 1.71 1.90 0.48 0.38 0.69 0.00 0.42 0.37 0.14 All 15 4 6 2 10 5.50 1.71 1.64 3.21 1.22 3.78 2.46 0.61 0.39 0.69 0.18 0.74 0.50 0.13 Müller-Thurgau vS 5 2 3 2 4 2.75 0.48 1.92 2.63 1.22 2.38 2.04 0.31 0.48 0.62 0.18 0.58 0.47 0.10 wB 5 2 3 1 3 2.25 0.48 1.47 2.27 1.00 1.85 1.65 0.27 0.32 0.56 0.00 0.46 0.34 0.12 wS 7 3 2 2 5 3.00 0.71 2.65 1.32 2.00 4.26 2.56 0.63 0.62 0.24 0.50 0.77 0.53 0.11 xB 14 4 6 2 11 5.75 1.93 1.35 2.93 1.91 6.13 3.08 1.07 0.26 0.66 0.48 0.84 0.56 0.12 xS 16 3 4 2 12 5.25 2.29 1.29 1.59 1.75 8.83 3.36 1.82 0.23 0.37 0.43 0.89 0.48 0.14 yB 16 4 5 2 12 5.75 2.17 2.08 1.71 1.82 7.64 3.31 1.44 0.52 0.42 0.45 0.87 0.56 0.10 yS 15 4 5 2 11 5.50 1.94 1.42 1.78 1.92 5.70 2.70 1.00 0.29 0.44 0.48 0.82 0.51 0.11 zB 7 1 2 2 8 3.25 1.60 1.00 1.51 1.51 4.26 2.07 0.74 0.00 0.34 0.34 0.77 0.36 0.16 zS 14 4 6 2 11 5.75 1.93 1.46 1.88 1.32 5.60 2.57 1.02 0.31 0.47 0.24 0.82 0.46 0.13 All 74 5 8 2 23 9.50 4.66 1.69 2.16 1.72 8.96 3.63 1.78 0.41 0.54 0.42 0.89 0.56 0.11

CHAPTER 7
122
Table 2. Continuation.
Na Ne He CV SC G ISA CES BER GOB OA SE ISA CES BER GOB OA SE ISA CES BER GOB OA SE Solaris wB 5 2 3 2 6 3.25 0.95 1.47 1.52 1.72 3.33 2.01 0.44 0.32 0.34 0.42 0.70 0.45 0.09 xB 7 1 4 2 7 3.50 1.32 1.00 1.85 1.85 2.80 1.87 0.37 0.00 0.46 0.46 0.64 0.39 0.14 yB 30 5 7 2 17 7.75 3.25 2.30 2.25 1.80 6.90 3.31 1.20 0.57 0.56 0.44 0.86 0.61 0.09 yS 8 4 4 2 7 4.25 1.03 1.49 1.71 1.28 2.84 1.83 0.35 0.33 0.41 0.22 0.65 0.40 0.09 zB 12 5 6 2 16 7.25 3.04 2.80 3.65 1.70 12.00 5.04 2.35 0.64 0.73 0.41 0.92 0.67 0.10 zS 22 5 5 2 13 6.25 2.36 1.80 1.91 1.10 4.94 2.44 0.85 0.45 0.48 0.09 0.80 0.45 0.15 All 75 5 8 2 25 10.00 5.15 2.06 2.32 1.57 6.22 3.04 1.07 0.51 0.57 0.36 0.84 0.57 0.10

CHAPTER 7
123
Table 3. Genotypic diversity of P. viticola at sector scale (bottom-top: v, w, x, y and z, left-right: B and S)
present on single selected vines of cultivars Regent, Merlot, Isabella, Müller-Thurgau and Solaris for each
sampling date. Cultivar (CV), sampling date (SA), sector (SC), number of samples (N), number of genotypes
(G), in brackets number of genotypes found by the previous sampling date on the whole vine, number of
genotypes/number of samples (G/N), Shannon equitability (EH), Simpson index (D), Evenness (E).
CV SA SC G N G/N EH D E Regent 5 vB 1 1 1.00 1.00 5 wB 1 3 0.33 0.00 1.00 5 xB 3 5 0.60 0.59 0.44 0.87 5 yB 2 7 0.29 0.21 0.76 0.59 5 yS 2 2 1.00 1.00 0.50 1.00 5 zB 29 56 0.52 0.73 0.08 0.88 5 zS 15 18 0.83 0.91 0.08 0.97 5 All 41 92 0.45 0.69 0.09 0.84 Regent 6 vB 1(1) 1 1.00 1.00 6 wB 1(1) 1 1.00 1.00 6 xB 7(5) 9 0.78 0.86 0.16 0.97 6 xS 5(2) 5 1.00 1.00 0.20 1.00 6 yB 6(5) 10 0.60 0.74 0.20 0.95 6 yS 3(1) 3 1.00 1.00 0.33 1.00 6 zB 5(2) 6 0.83 0.87 0.22 0.97 6 zS 6(3) 7 0.86 0.90 0.18 0.98 6 All 23 42 0.55 0.77 0.07 0.91 Merlot 3 vB 1 2 0.50 0.00 1.00 3 wB 1 1 1.00 1.00 3 yB 1 2 0.50 0.00 1.00 3 All 1 5 0.20 0.00 1.00 Merlot 4 vB 1(0) 1 1.00 1.00 4 vS 3(0) 3 1.00 1.00 0.33 1.00 4 wB 2(0) 2 1.00 1.00 0.50 1.00 4 wS 1(0) 1 1.00 1.00 4 xB 4(0) 4 1.00 1.00 0.25 1.00 4 xS 4(0) 4 1.00 1.00 0.25 1.00 4 yB 6(0) 6 1.00 1.00 0.17 1.00 4 yS 2(0) 2 1.00 1.00 0.50 1.00 4 zB 7(0) 10 0.70 0.82 0.16 0.97 4 zS 22(0) 37 0.59 0.81 0.07 0.94 4 All 41 70 0.59 0.81 0.04 0.93 Merlot 5 vB 1(0) 1 1.00 1.00 5 vS 2(0) 2 1.00 1.00 0.50 1.00 5 wB 2(2) 2 1.00 1.00 0.50 1.00 5 xB 1(1) 2 0.50 0.00 1.00 5 xS 2(1) 2 1.00 1.00 0.50 1.00 5 yB 4(2) 7 0.57 0.59 0.39 0.83 5 yS 6(4) 7 0.86 0.90 0.18 0.98 5 zB 1(1) 1 1.00 1.00 5 zS 3(2) 3 1.00 1.00 0.33 1.00 5 All 15 27 0.56 0.70 0.15 0.86

CHAPTER 7
124
Table 3. Continuation.
CV SA SC G N G/N EH D E Merlot 6 vB 2(1) 2 1.00 1.00 0.50 1.00 6 vS 3(1) 4 0.75 0.75 0.38 0.95 6 wB 4(2) 5 0.80 0.83 0.28 0.96 6 wS 2(2) 2 1.00 1.00 0.50 1.00 6 xB 5(2) 7 0.71 0.76 0.27 0.92 6 xS 5(3) 10 0.50 0.59 0.32 0.85 6 yB 11(2) 14 0.79 0.87 0.11 0.96 6 yS 6(2) 6 1.00 1.00 0.17 1.00 6 zB 1(1) 1 1.00 1.00 6 zS 2(2) 3 0.67 0.58 0.56 0.92 6 All 24 54 0.44 0.65 0.14 0.81 Isabella 3 wB 2 2 1.00 1.00 0.50 1.00 3 xB 1 1 1.00 1.00 3 All 3 3 1.00 1.00 0.33 1.00 Isabella 5 yB 1(0) 1 1.00 1.00 5 zB 1(0) 1 1.00 1.00 5 zS 2(0) 2 1.00 1.00 0.50 1.00 5 All 5 5 1.00 1.00 0.20 1.00 Isabella 6 xB 3(0) 3 1.00 1.00 0.33 1.00 6 yB 2(1) 3 0.67 0.58 0.56 0.92 6 zS 4(1) 4 1.00 1.00 0.25 1.00 6 All 8 10 0.80 0.86 0.16 0.95 Müller-Thurgau 3 vB 1 1 1.00 1.00 3 vS 1 2 0.50 0.00 1.00 3 wS 2 5 0.40 0.42 0.52 0.97 3 yB 1 1 1.00 1.00 3 All 2 9 0.22 0.29 0.56 0.92 Müller-Thurgau 4 vB 1(0) 1 1.00 1.00 4 vS 1(0) 1 1.00 1.00 4 wS 2(0) 2 1.00 1.00 0.50 1.00 4 xB 9(0) 17 0.53 0.66 0.22 0.85 4 xS 11(0) 13 0.85 0.92 0.10 0.98 4 yB 13(0) 18 0.72 0.82 0.12 0.92 4 yS 10(0) 11 0.91 0.95 0.11 0.99 4 zB 5(0) 5 1.00 1.00 0.20 1.00 4 zS 9(0) 11 0.82 0.88 0.14 0.96 4 All 51 79 0.65 0.85 0.03 0.95 Müller-Thurgau 5 vB 2(1) 2 1.00 1.00 0.50 1.00 5 vS 1(0) 1 1.00 1.00 5 wB 1(0) 1 1.00 1.00 5 wS 3(1) 3 1.00 1.00 0.33 1.00 5 xB 1(0) 1 1.00 1.00 5 xS 4(2) 4 1.00 1.00 0.25 1.00 5 yB 5(2) 7 0.71 0.80 0.22 0.96 5 yS 3(0) 3 1.00 1.00 0.33 1.00 5 zB 2(1) 2 1.00 1.00 0.50 1.00 5 zS 5(0) 5 1.00 1.00 0.20 1.00 5 All 24 29 0.83 0.92 0.05 0.98 Müller-Thurgau 6 vS 3(1) 3 1.00 1.00 0.33 1.00 6 wB 4(1) 4 1.00 1.00 0.25 1.00 6 xB 4(2) 5 0.80 0.83 0.28 0.96 6 xS 2(1) 3 0.67 0.58 0.56 0.92 6 yS 2(1) 2 1.00 1.00 0.50 1.00 6 All 9 17 0.53 0.73 0.14 0.94

CHAPTER 7
125
Table 3. Continuation.
CV SA SC G N G/N EH D E Solaris 4 vB 2 2 1.00 1.00 0.50 1.00 4 vS 1 1 1.00 1.00 4 wB 3 3 1.00 1.00 0.33 1.00 4 wS 1 1 1.00 1.00 4 xB 5 5 1.00 1.00 0.20 1.00 4 xS 3 3 1.00 1.00 0.33 1.00 4 yB 29 56 0.52 0.75 0.07 0.89 4 yS 7 8 0.88 0.92 0.16 0.98 4 zB 12 13 0.92 0.96 0.09 0.99 4 zS 20 22 0.91 0.96 0.05 0.99 4 All 67 114 0.59 0.81 0.04 0.91 Solaris 5 vS 3(2) 3 1.00 1.00 0.33 1.00 5 wS 1(0) 1 1.00 1.00 5 xB 1(1) 1 1.00 1.00 5 yB 1(0) 1 1.00 1.00 5 yS 1(0) 1 1.00 1.00 5 zS 2(0) 3 0.67 0.58 0.56 0.92 5 All 9 10 0.90 0.94 0.12 0.98 Solaris 6 wB 2(1) 2 1.00 1.00 0.50 1.00 6 xB 1(1) 1 1.00 1.00 6 yB 1(0) 1 1.00 1.00 6 All 4 4 1.00 1.00 0.25 1.00

CHAPTER 7
126
Table 4. Gene diversity of P. viticola clone corrected populations at sector scale (bottom-top: v, w, x, y and z, left-right: B and S) present on vines of cultivars Regent, Merlot,
Isabella, Müller-Thurgau and Solaris for each sampling date, for the four loci ISA, CES, BER, GOB and over all loci (OA). Cultivar (CV), sampling date (SA), sector (SC),
number of genotypes (G), total number of alleles (Na), effective number of alleles (Ne), expected heterozygosity (He), standard error (SE).
Na Ne He CV SA SE G ISA CES BER GOB OA SE ISA CES BER GOB OA SE ISA CES BER GOB OA SE
Regent 5 zB 29 4 6 2 5 4.25 0.85 2.96 2.23 1.86 3.31 2.59 0.33 0.66 0.55 0.46 0.70 0.59 0.05 5 zS 15 3 6 2 3 3.50 0.87 1.87 1.81 1.72 2.92 2.08 0.28 0.46 0.45 0.42 0.66 0.50 0.05 5 All 41 4 7 2 5 4.50 1.04 2.71 2.09 1.79 3.43 2.50 0.36 0.63 0.52 0.44 0.71 0.58 0.06 Regent 6 xB 7 2 1 2 5 2.50 0.87 1.32 1.00 1.32 3.50 1.79 0.58 0.24 0.00 0.24 0.71 0.30 0.15 6 xS 5 4 2 2 2 2.50 0.50 3.57 1.47 1.92 2.00 2.24 0.46 0.72 0.32 0.48 0.50 0.51 0.08 6 yB 6 3 1 2 3 2.25 0.48 2.00 1.00 1.18 3.00 1.80 0.46 0.50 0.00 0.15 0.67 0.33 0.15 6 zB 5 3 1 2 3 2.25 0.48 1.85 1.00 1.72 1.52 1.52 0.19 0.46 0.00 0.42 0.34 0.31 0.10 6 zS 6 3 2 2 2 2.25 0.25 2.18 1.80 1.95 2.00 1.98 0.08 0.54 0.44 0.49 0.50 0.49 0.02 6 All 23 6 3 2 6 4.25 1.03 3.10 1.25 1.68 3.69 2.43 0.58 0.68 0.20 0.41 0.73 0.50 0.12 Merlot 4 yB 6 2 1 2 7 3.00 1.35 1.60 1.00 1.38 4.24 2.05 0.74 0.38 0.00 0.28 0.76 0.35 0.16 4 zB 7 3 1 1 6 2.75 1.18 2.00 1.00 1.00 4.26 2.07 0.77 0.50 0.00 0.00 0.77 0.32 0.19 4 zS 22 5 5 2 11 5.75 1.89 2.14 1.40 1.25 4.03 2.21 0.64 0.53 0.29 0.20 0.75 0.44 0.12 4 All 41 5 6 2 19 8.00 3.76 1.97 1.56 1.46 4.58 2.39 0.74 0.49 0.36 0.31 0.78 0.49 0.11 Merlot 5 yS 6 1 3 2 6 3.00 1.08 1.00 1.41 1.60 2.67 1.67 0.36 0.00 0.29 0.38 0.63 0.32 0.13 5 All 15 2 7 2 12 5.75 2.39 1.07 1.67 1.38 5.63 2.44 1.07 0.06 0.40 0.28 0.82 0.39 0.16 Merlot 6 xB 5 3 4 1 2 2.50 0.65 2.17 2.38 1.00 1.22 1.69 0.34 0.54 0.58 0.00 0.18 0.33 0.14 6 xS 5 2 4 1 3 2.50 0.65 1.47 3.33 1.00 1.52 1.83 0.51 0.32 0.70 0.00 0.34 0.34 0.14 6 yB 11 4 4 2 5 3.75 0.63 1.92 1.61 1.20 1.81 1.63 0.16 0.48 0.38 0.17 0.45 0.37 0.07 6 yS 6 1 4 2 5 3.00 0.91 1.00 2.48 1.18 2.57 1.81 0.42 0.00 0.60 0.15 0.61 0.34 0.16 6 All 24 5 5 2 7 4.75 1.03 2.18 2.49 1.09 1.66 1.85 0.31 0.54 0.60 0.08 0.40 0.40 0.12

CHAPTER 7
127
Table 4. Continuation.
Na Ne He CV SA SE G ISA CES BER GOB OA SE ISA CES BER GOB OA SE ISA CES BER GOB OA SE
Müller-Thurgau 4 xB 9 4 4 2 11 5.25 1.97 1.42 3.60 1.91 7.36 3.57 1.35 0.30 0.72 0.48 0.86 0.59 0.13 4 xS 11 3 3 2 10 4.50 1.85 1.20 1.75 1.94 8.96 3.46 1.84 0.17 0.43 0.48 0.89 0.49 0.15 4 yB 13 4 4 2 10 5.00 1.73 2.10 1.77 1.83 7.19 3.22 1.33 0.52 0.43 0.45 0.86 0.57 0.10 4 yS 10 3 5 2 11 5.25 2.02 1.23 1.92 1.98 6.67 2.95 1.25 0.19 0.48 0.50 0.85 0.50 0.14 4 zB 5 1 2 2 7 3.00 1.35 1.00 1.47 1.22 4.55 2.06 0.83 0.00 0.32 0.18 0.78 0.32 0.17 4 zS 9 3 4 2 9 4.50 1.55 1.41 1.42 1.38 3.52 1.93 0.53 0.29 0.30 0.28 0.72 0.40 0.11 4 All 51 4 6 2 22 8.50 4.57 1.62 2.07 1.86 10.57 4.03 2.18 0.38 0.52 0.46 0.91 0.57 0.12 Müller-Thurgau 5 yB 5 3 4 2 7 4.00 1.08 1.52 1.92 1.92 6.25 2.90 1.12 0.34 0.48 0.48 0.84 0.54 0.11 5 zS 5 3 4 2 5 3.50 0.65 1.52 2.78 1.22 4.55 2.51 0.76 0.34 0.64 0.18 0.78 0.49 0.14 5 All 24 5 8 2 15 7.50 2.78 1.98 2.39 1.75 7.94 3.52 1.48 0.49 0.58 0.43 0.87 0.59 0.10 Solaris 4 xB 5 1 4 2 6 3.25 1.11 1.00 2.38 1.72 3.33 2.11 0.50 0.00 0.58 0.42 0.70 0.43 0.15 4 yB 29 5 7 2 17 7.75 3.25 2.27 2.12 1.82 7.48 3.42 1.35 0.56 0.53 0.45 0.87 0.60 0.09 4 yS 7 3 4 2 7 4.00 1.08 1.34 1.85 1.32 3.38 1.97 0.48 0.26 0.46 0.24 0.70 0.42 0.11 4 zB 12 5 6 2 16 7.25 3.04 2.80 3.65 1.70 12.00 5.04 2.35 0.64 0.73 0.41 0.92 0.67 0.10 4 zS 20 5 5 2 13 6.25 2.36 1.63 1.83 1.10 5.56 2.53 1.02 0.39 0.45 0.10 0.82 0.44 0.15 4 All 67 5 8 2 24 9.75 4.91 2.00 2.19 1.61 7.72 3.38 1.45 0.50 0.54 0.38 0.87 0.57 0.11
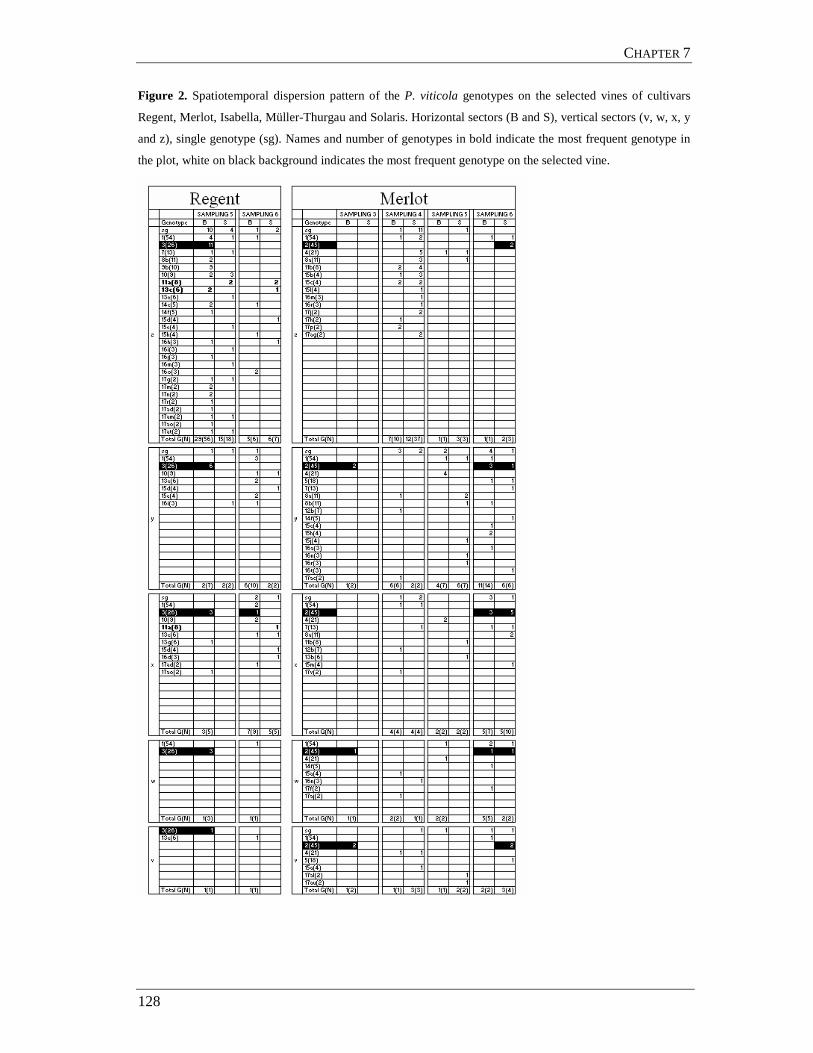
CHAPTER 7
128
Figure 2. Spatiotemporal dispersion pattern of the P. viticola genotypes on the selected vines of cultivars
Regent, Merlot, Isabella, Müller-Thurgau and Solaris. Horizontal sectors (B and S), vertical sectors (v, w, x, y
and z), single genotype (sg). Names and number of genotypes in bold indicate the most frequent genotype in
the plot, white on black background indicates the most frequent genotype on the selected vine.
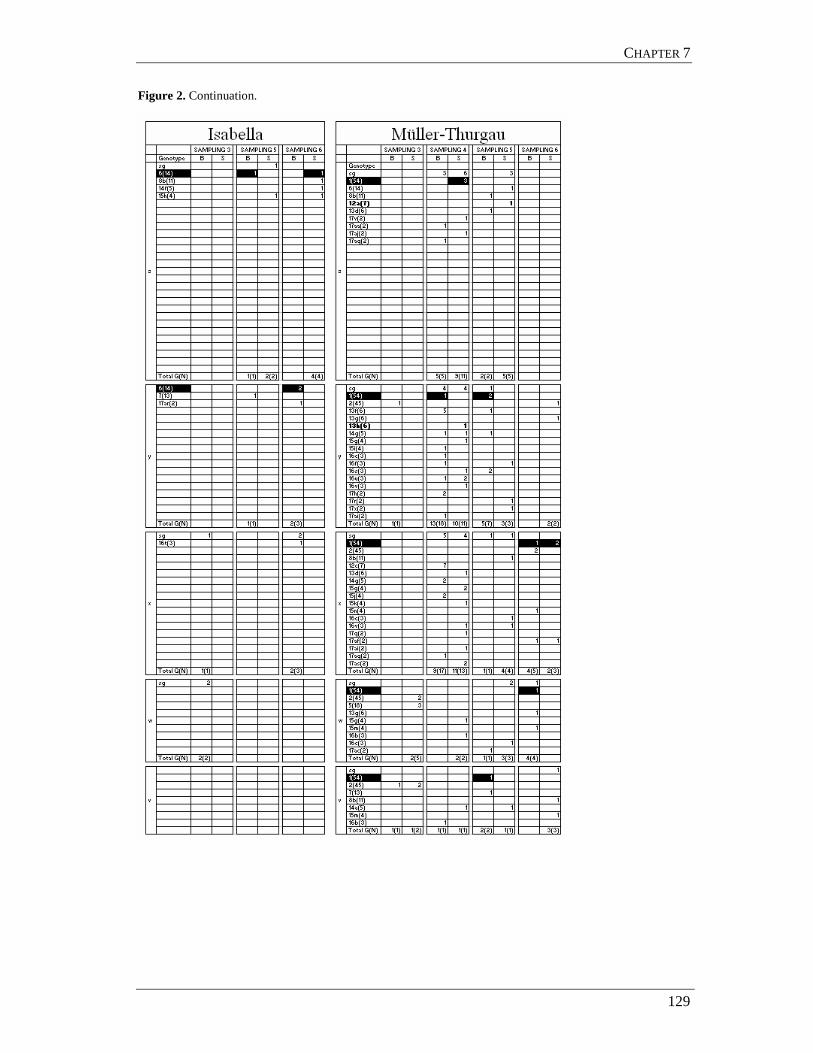
CHAPTER 7
129
Figure 2. Continuation.
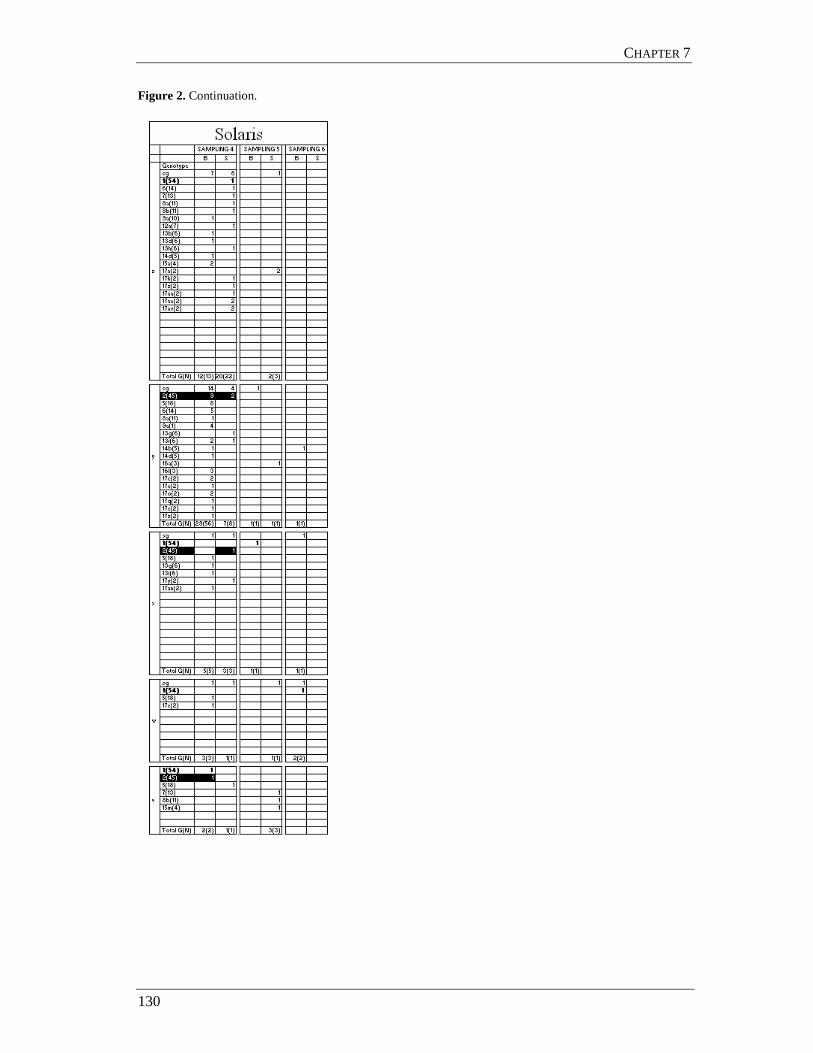
CHAPTER 7
130
Figure 2. Continuation.

CHAPTER 7
131
Table 5. Number of clonal P. viticola genotypes shared among vertical and between horizontal sectors by the
same sampling and by following sampling dates. See Fig. 2 for details on cultivars and genotypes.
Same sampling Following samplings All NHor % NVer % NHor % NVer % N Regent 23 17.16 43 32.09 10 7.46 14 10.45 134 Merlot 48 30.77 60 38.46 22 14.10 36 23.08 156 Isabella 0 0.00 0 0.00 2 11.11 2 11.11 18 Müller-Thurgau 13 9.70 24 17.91 10 7.46 14 10.45 134 Solaris 14 10.94 15 11.72 1 0.78 3 2.34 128
Table 6. P. viticola genotypes on leaves of the selected vines of cultivars Regent, Merlot, Isabella, Müller-
Thurgau and Solaris on which several lesions were collected. Cultivar (CV), sampling date (SA), sector (SC),
number of different genotypes with in brackets the total number of lesions collected on the selected leaf
(G(N)).
CV SA SC Genotypes G(N) 4* 3(26)+1(54) 2(5) 2* 9b(10)+14e(5) 2(3) 2* 9b(10)+10(9) 2(3) 2* 3(26) 1(2) 2* 17n(2) 1(2) 9b(10)+17ao(2)+sg 3(3) 16j(3)+17g(2)+sg 3(3) 3(26)+17m(2) 2(2) 3(26)+7(13) 2(2) 3(26)+8b(11) 2(2) 14e(5)+17am(2) 2(2) 3(26)+sg 2(2) 2* sg 2(2) 2* sg 2(2)
zb
2* sg 2(2) 1(54)+13e(6)+15e(4)+16m(3)+17am(2)+sg 6(6) 7(13)+10(9) 2(2) 10(9)+17g(2) 2(2) 11a(8)+17at(2) 2(2)
5
zs
2* sg 2(2) 11a(8)+13c(6) 2(2) zs 16h(3)+sg 2(2) 1(54)+15e(4) 2(2) yb 1(54)+3(26) 2(2) 10(9)+13e(6) 2(2)
xb
10(9)+sg 2(2)
Regent
6
xs 16d(3)+sg 2(2)
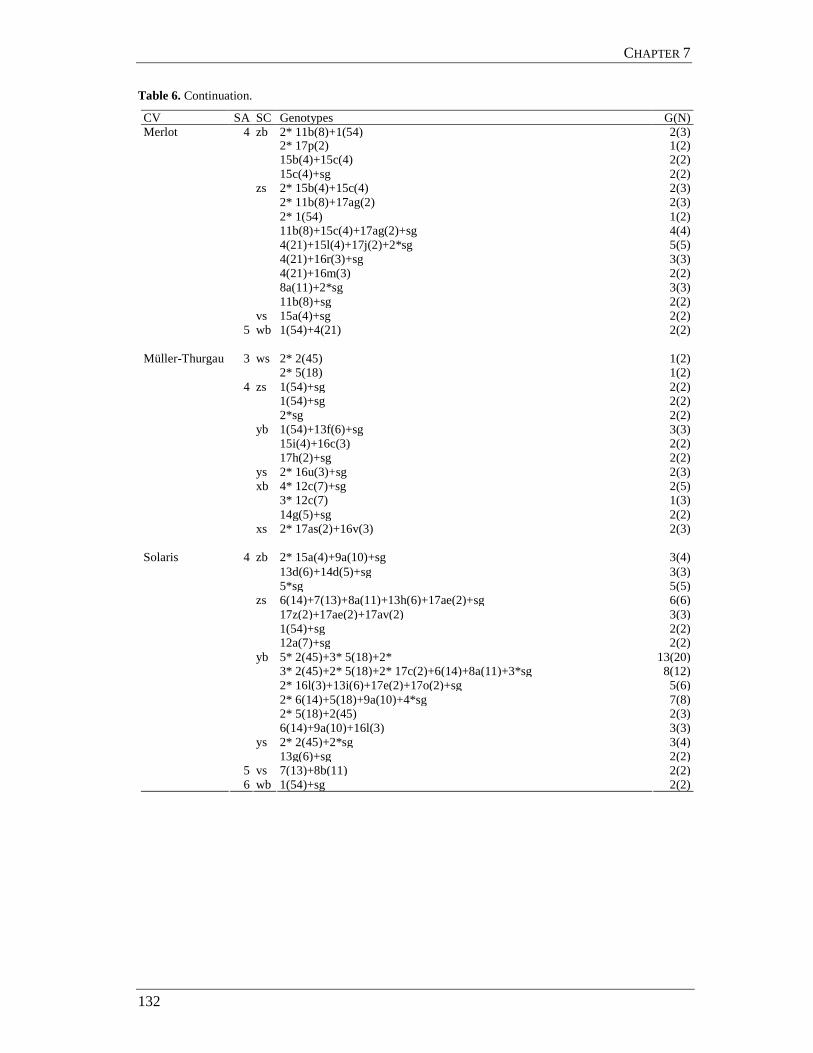
CHAPTER 7
132
Table 6. Continuation.
CV SA SC Genotypes G(N) 2* 11b(8)+1(54) 2(3) 2* 17p(2) 1(2) 15b(4)+15c(4) 2(2)
zb
15c(4)+sg 2(2) 2* 15b(4)+15c(4) 2(3) 2* 11b(8)+17ag(2) 2(3) 2* 1(54) 1(2) 11b(8)+15c(4)+17ag(2)+sg 4(4) 4(21)+15l(4)+17j(2)+2*sg 5(5) 4(21)+16r(3)+sg 3(3) 4(21)+16m(3) 2(2) 8a(11)+2*sg 3(3)
zs
11b(8)+sg 2(2)
4
vs 15a(4)+sg 2(2)
Merlot
5 wb 1(54)+4(21) 2(2)
2* 2(45) 1(2) 3 ws 2* 5(18) 1(2) 1(54)+sg 2(2) 1(54)+sg 2(2)
zs
2*sg 2(2) 1(54)+13f(6)+sg 3(3) 15i(4)+16c(3) 2(2)
yb
17h(2)+sg 2(2) ys 2* 16u(3)+sg 2(3)
4* 12c(7)+sg 2(5) 3* 12c(7) 1(3)
xb
14g(5)+sg 2(2)
Müller-Thurgau
4
xs 2* 17as(2)+16v(3) 2(3)
2* 15a(4)+9a(10)+sg 3(4) 13d(6)+14d(5)+sg 3(3)
zb
5*sg 5(5) 6(14)+7(13)+8a(11)+13h(6)+17ae(2)+sg 6(6) 17z(2)+17ae(2)+17av(2) 3(3) 1(54)+sg 2(2)
zs
12a(7)+sg 2(2) 5* 2(45)+3* 5(18)+2* 13(20) 3* 2(45)+2* 5(18)+2* 17c(2)+6(14)+8a(11)+3*sg 8(12) 2* 16l(3)+13i(6)+17e(2)+17o(2)+sg 5(6) 2* 6(14)+5(18)+9a(10)+4*sg 7(8) 2* 5(18)+2(45) 2(3)
yb
6(14)+9a(10)+16l(3) 3(3) 2* 2(45)+2*sg 3(4)
4
ys 13g(6)+sg 2(2)
5 vs 7(13)+8b(11) 2(2)
Solaris
6 wb 1(54)+sg 2(2)
CHAPTER 7
133
DISCUSSION
For all five cultivars Regent, Merlot, Isabella, Müller-Thurgau and Solaris the number of
lesions successfully genotyped per sector was to low to allow comparisons among plot,
vine and sector scale, so as comparisons within sectors. No trend in genotypic and gene
diversity among the sectors could be identified neither for the pooled samplings, nor for the
single samplings. However a trend for higher number of clonal genotypes shared among
vertical, rather than horizontal sectors was observed (at same sampling date so as in
successive samplings) but differences were not significant. This, so as the observation that
genotype present more than once on the vine where observed mostly in lower sectors by
successive samplings, could indicate a spread of clones at vine level from the top of the
vine to the bottom in zoospore-loaded water drops falling from the upper vine parts. This
could explain the stripe shaped lesions observed on some leaves.
A high diversity was observed at leaf scale, only in 10% of the cases all lesions
present on one leaf were caused by the same genotype. While in the majority of the cases
all lesions present on one leaf were caused by different genotypes.
The results presented here are in accord with the statement that the most frequent
pattern of P. viticola dispersal is characterized by some spatially localized clustered lesions
derived from a single genotype (resulting from secondary infections) and a random
distribution of genetically different genotypes (resulting from primary infections) (Gobbin
et al. 2003b, 2005, Rumbou and Gessler 2004, 2006). Further they show that high diversity
of P. viticola is present even at very small spatial scale confirming the importance of
primary oosporic infections in epidemic.
ACKNOWLEDGEMENTS
This work was supported by SBF 03.0485-1 (EU Project 501542 REPCO). The author
gratefully acknowledges Rocchina Abbas-Pennella for helping with the labour work,
Michele Gusberti for helping with collection of samples, Cesare Gessler, Davide Gobbin
and Mauro Jermini for supervising the research and for the interesting discussions, and
Roberto Rigoni and Mirto Ferretti for the maintaining work in the vineyard.

CHAPTER 7
134
L ITERATURE CITED
Brown, A. H. D., Weir, B. S. 1983. Measuring genetic variability in plant populations. Isozymes in Plant
Genetics and Breeding. Tanksley, S. D., Orton, T. J. (eds.), Elsevier Science Publ., Amsterdam, Part
A 219-239.
Simpson, E. H. 1949. Measurement of diversity. Nature, 163: 688.
Eugster, C. 2003. Relative contribution of oosporic and sporangial inoculum to epidemics of grapevine downy
mildew and genetic structure of Plasmopara viticola in a New York vineyard assessed by
microsatellite technique. Diploma Thesis ETH-Zürich.
Gessler, C., Pertot, I., Gobbin, D. 2006. Genetic structure and epidemiology of Plasmopara viticola
populations. Proceedings of the 5th International workshop on grapevine downy and powdery
mildew. San Michele all’Adige, Italy, 75-77.
Gobbin, D., Pertot, I., Gessler, C. 2003a. Genetic structure of a Plasmopara viticola population in an isolated
Italian mountain vineyard. Journal of Phytopathology, 151: 636-646.
Gobbin, D., Pertot, I., Gessler, C. 2003b. Identification of microsatellite markers for Plasmopara viticola and
establishment of high throughput method for SSR analysis. European Journal of Plant Pathology,
109: 153-164.
Gobbin, D., Jermini, M., Loskill, B., Pertot, I., Raynal, M., Gessler, C. 2005. Importance of secondary
inoculum of Plasmopara viticola to epidemics of grapevine downy mildew. Plant Pathology, 54:
522-534.
Hartl, D. L., Clark, A. G .1997. Principles of Population Genetics 3rd Edition, Sunderland, Massachusetts:,
Sinauer Associates, Inc.
Hug, F. 2005. Genetic structure and epidemiology of Plasmopara viticola populations from Australian grape
growing regions. Diploma Thesis ETH-Zürich.
Peakall, R., Smouse, P. E. 2006. GENALEX 6: genetic analysis in Excel. Population genetic software for
teaching and research. Molecular Ecology Notes, 6: 288-295.
Pielou, E.C. 1966. Measurement of diversity in different types of biological collections. Journal of Theoretical
Biology, 13: 131-144.
Rumbou, A., Gessler, C. 2004. Genetic dissection of Plasmopara viticola population from a Greek vineyard
in two consecutive years. European Journal of Plant Pathology, 4: 379-392.
Rumbou, A., Gessler, C. 2006. Particular structure of Plasmopara viticola populations evolved under Greek
island conditions. Phytopathology, 96: 501-509.
Shannon, C. E., Weaver, W. 1949. The Mathematical Theory of Communication, Urbana, University of
Illinois Press.

135
CHAPTER 8
General discussion

CHAPTER 8
136
GENERAL DISCUSSION
This research
Different aspects of P. viticola epidemiology and population genetics were investigated in
this dissertation. Effects of grapevine cultivar mixtures and treatment with fungicides
developed for organic viticulture on the pathogen populations, so as quantification of
primary and secondary infections at small scale were analyzed.
The research was performed within the European project REPCO, which aimed at
the “Replacement of Copper Fungicides in Organic Production of Grapevine and Apple in
Europe”. In organic viticulture, grapevine protection strongly depends from copper,
however copper is known as one of the trace elements with the most deleterious effects on
living organisms in soil (Renella et al. 2002), and therefore permitted amounts are reduced
in Switzerland so as in the European Union (Ordinanza del DFE sull’agricoltura biologica.
Modifica del 2 novembre 2006; Council Regulation (EEC) No 2092/91, Appendix II).
New organically based fungicides and potentiators of resistance and new biocontrol
agents were studied and developed by the REPCO partners, further, grapevine cultivar
mixtures were proposed as possible integrated management systems for P. viticola disease
control.
P. viticola is included in the list of plant pathogens showing a high risk of
development of resistance to fungicides (EPPO/OEPP 1999). In both approaches
(organically based fungicides and mixed grapevine cultivars) the effectiveness in pathogen
control, if present, should be durable, this because the developed fungicides, basing
principally on indirect mode of action and/or multisite activity are unlikely to engender
resistance in the target pathogen’s population (Gullino et al. 2000, Urban and Lebeda
2006), and the resistance of the grapevine cultivars planted in the mixture rely on
quantitative resistance. The model for risk assessment developed by McDonald and Linde
(2002) proposes that pathogen populations exposed to weaker selection (hosts with
quantitative resistance) will evolve more slowly than pathogen populations exposed to
strong (hosts with major gene resistance), directional selection over many generations.
A method, based on neutral specific SSR markers, to detect the potential threat of
selection for resistance to fungicides with very diverse and partially or totally unknown
modes of action was developed (CHAPTER 2). The method was implemented for
investigating if selection pressure is exerted on P. viticola populations by nine fungicides

CHAPTER 8
137
already in use or proposed to be used in organic viticulture, having different and unknown
modes of action. Treated and untreated populations shared a comparable number of
genotypes, a high percentage of single genotypes, a low occurrence of clones derived from
the most frequent genotype and high genetic diversity. We concluded that selection
pressure was not exerted on P. viticola populations by no one of the tested products
developed for organic viticulture (with a possible exception represented by Tecnobiol),
neither by their application as combination or integrated in a treatment strategy. The
experimental methodology showed that selection pressure could not be completely
excluded for Aliette (Fosetyl-Al) used as control product (CHAPTER 3).
Cultivar mixtures are described as effective way to reduce disease on small annual
crops as cereals (Mundt 2002, Puccinia striiformis-wheat, Akanda et al. 1996,
Magnaporthe grisea-rice, Zhu et al. 2005) up to bigger annual (Phytophthora infestans-
potato, Garrett and Mundt, 2000, Garrett et al. 2001, Andrivon et al. 2003) or perennials
plants (Venturia inaequalis-apples, Blaise and Gessler 1994, Kellerhals et al. 2003, Didelot
et al. 2007; Hemileia vastatrix-coffe, resumed in Finckh et al. 1999, Melampsora epitea-
Salix, resumed in McCracken and Dawson 2003). To test if mixtures are effective also in
the P. viticola-grapevine pathosystem we established a vineyard consisting of eight Vitis
vinifera (Müller-Thurgau, Gamaret, Merlot) and hybrids cultivars (Isabella, Regent, Bianca,
Solaris, Chambourcin) differing in resistance to the pathogen arranged in four within-row
mixture blocks (MIX blocks) and in one one-cultivar-by-row block (MONO block).
Grapevine cultivar mixtures were effective in reducing P. viticola disease on susceptible
cultivars exclusively in the first year of observations (2005), while in the following two
years (2006 and 2007) this effect was not observed anymore (CHAPTER 4). P. viticola
lesions were collected in 2005 and 2006 in the mixed grapevine cultivar plot. No
differences in genetic structure of P. viticola populations depending on different spatial
aggregations of grapevines (MIX block or MONO block) were observed.
In both years significantly lower genotypic diversity was observed on populations
collected on resistant cultivars, while higher diversity was observed for the ones collected
on susceptible vines. The reduction of mixture efficacy observed in the second and third
year of the experiment could have environmental causes (different meteorological
conditions in the years, causing differences in the number of possible infections) or be the
result of an adaptation of P. viticola populations (CHAPTER 5). Considering the low or
absent positive effect of mixtures in reducing P. viticola disease in the second and third
year of observations, so as the difficulties of planting, growing, harvesting and handling

CHAPTER 8
138
that a mixed cultivar will imply, we can conclude that grapevine cultivars mixture are not
an effective method to reduce P. viticola disease in vineyards and hereby reduce the
amount of copper applications in viticulture.
As at vineyard scale high P. viticola genetic diversity was always observed (Gobbin
et al. 2003, 2005, Rumbou and Gessler 2004, 2006), we expected that at row and further at
vine scale, this diversity will be lower. To test this, an intense, where possible complete,
sampling on one single vine of cultivars Regent, Merlot, Isabella, Müller-Thurgau and
Solaris was performed along season 2006. Lower gene and genotypic diversity at vine scale
than at row scale were observed, but at lower extent than presumed. At vine scale primary
infections represented the most important contribution to the epidemics. Only a reduced
number of genotypes, that varied depending from the resistance level of the grapevine
cultivar, underwent secondary cycles re-infecting the vines on which they first appeared.
An important contribution to the epidemics at vines scale was represented by asexually
derived genotypes coming from neighbouring vines (CHAPTER 6). Genetic structure of P.
viticola populations was investigated on the same vines considered in CHAPTER 6, at two
further smaller scales: sector and leaf. Vines were considered to be subdivided in ten
sectors (2 horizontal x 5 vertical sectors). High genotype diversity at leaf scale was
observed; further a trend for higher number of clonal genotypes shared among vertical,
rather than horizontal sectors was identified, indicating the spread of clones from the top of
the vine to the bottom in zoospore-loaded water drops (CHAPTER 7).
Research on P. viticola populations in the last years
Recent research found out the predominant role of oospore in epidemics (Gobbin et al.
2003, 2005, Eugster 2003, Rumbou and Gessler 2004, 2006, Kennelly et al. 2007,
Koopman et al. 2006). Oospores contribute to the epidemics during a prolonged period
from May to late October, depending on the region. (Gobbin et al. 2003, Rumbou and
Gessler 2004, 2006, Koopman et al. 2006). The quantitative contribution to the epidemics
decreases with the progress of time (Gobbin et al. 2005).
The most frequent pattern of P. viticola dispersal is characterized by some spatially
localized clustered lesions derived from a single genotype (resulting from secondary
infections) and a random distribution of genetically different genotypes (resulting from
primary infections). Migration distances are generally less than 20 m per asexual cycle
(Gobbin et al. 2003, 2005, Rumbou and Gessler 2004, 2006, Delmotte et al. 2006, this

CHAPTER 8
139
research CHAPTERS 5 and 6) but in a single case up to 130 m were estimated (Gobbin et al.
2007).
Results of a study of Gobbin et al. 2006, conducted on samples collected in 32
vineyards in France, Switzerland, Italy, Germany and Greece suggests that several P.
viticola genotypes were introduced into Europe, and perhaps the introduction also occurred
multiple times. An indication for a direct connection between populations collected in USA
(Geneva, Eugster 2003) and Australia (Hug 2007) with French populations was found.
Questions about aggressiveness of some few genotypes during one season
(dominant genotypes) and possible negative featuring penalizing their recombinants by the
overwintering still remain open.
Even though the predominant role of oospores in P. viticola epidemics is currently
recognized, a lack of knowledge regarding their development, dynamics and quantification
is present.
Research on P. viticola oospores in the last years
Burruano et al. (2006) followed the nuclear and cytological development of the gamic
structures in natural infected foliar tissues. Gametangial meiosis results in young
gametangia containing many small, probably haploid gametic nuclei. When a nucleus of the
antheridium migrates and approaches an oogonial nucleus, the oogonium fertilization starts,
resulting in a binucleate stage (oosphere). In the oosphere, single antheridial and oogonial
nuclei fuse, resulting in an oospore. This fusion seems to be the necessary condition for
physiological maturation. A correlation between the percentage of mononucleate spores in
autumn and in spring, and their germination efficiency, after natural overwintering
conditions was observed (Burruano et al. 2006). Germinating oospores contain over 40
mitotic nuclei, which migrate from the oospora in the macrosporangium formed at the apex
of one or more germ tubes (until 3, Burruano et al. 2006). Within the macrosporangium
mitotic divisions occurs, this is partially confirmed by the presence of groups of two nuclei
and by the total number of nuclei which is double of that found in the oospore just prior the
emergence of the germ tube. Mature macrosporangia releases mostly mononucleate
zoospores (Burruano et al. 2006). Hill (personal communication to Gobbin, Gobbin 2003)
estimates that up to 60 zoospores are contained in one macro sporangium. Rossi et al.
(2007) in their model of dynamic simulation of grapevine downy mildew primary
infections assume that zoospores swim in the film of water covering the leaf litter.
Subsequently they reach the grape leaves by splashes and aerosols triggered by rainfall.

CHAPTER 8
140
Oospore population entering in winter is not homogeneous and has an age-
physiological structure (Jermini et al. 2003). Substantial number of oospores may survive
for more than one growing season (Kennelly et al. 2007), Hill estimates oosporic survival
up to five years (Hill personal communication to Gobbin, Gobbin 2003). The main
ecological factors influencing the processes which trigger oospore germination are
temperature and water (Laviola et al. 1986, Burruano et al 1987, Rossi and Caffi 2007).
Oospores need water to break dormancy and germinate, therefore dry periods in spring
delay germination (Rossi et al. 2002), under field conditions the water content in the leaf
litter is frequently too low when there is no rainfall (Rossi and Caffi 2007).
Tests performed in deionized water or water agar indicated a P. viticola oospores
germination rate of 17% (Vercesi et al. 2000). To estimate P. viticola oospore germination
Dagostin et al. (2007) developed an experimental setup based on the quantification of
regulatory gene expression during oospore dormancy.
Given the predominantly role of oospore in the epidemics, measures to reduce them
and their impact should be searched. This could consist in the development of sanitation
practices to reduce primary inoculum as extensively studied in other pathosystems, e.g. for
Venturia inaequalis-apple (Sutton et al. 2000), or in the presence of cover crops in vine
rows. Berkelmann-Loehnertz et al. (2006) showed that cover crops should reduce splash
dispersal. This measure could also be counterproductive, causing increased water
availability on leaf litter favouring oospore germination. Another measure could be the
biological control of oospores. Hoch and Abawi (1979) and Martin and Loper (1999) report
a wide array of organisms parasitizing oospores in culture or field observed by several
authors. This includes soilborne fungi (Plasmodiophoromycetes, Chytridiomycetes,
Oomycetes, Deuteromycetes and Hyphomycetes) and bacteria (genus Actinoplanes). An
attempt to screen antagonists against P. viticola oospores was performed within the REPCO
project (by PRI Wageningen), but was abandoned do to lack of successful results.

CHAPTER 8
141
General conclusion
No valid fungicides to replace copper in organic viticulture were found in the REPCO
project. At present time copper can not be replaced in organic viticulture, therefore
instruments to reduce the applied amounts are essential (decision support systems like
Coptimizer, treatments based on warning systems like Vitimeteo). Grapevine cultivar
mixtures are not a valid tool to reduce P. viticola disease. Further, more attention should be
paid to primary infections; methods to reduce primary inoculum, like removal of leaves
carrying oospores in autumn, could represent a strategy to reduce disease. Moreover, early
treatments are essential to prevent the reproduction and subsequent spread at vine and plot
scale of most fit genotypes (Gobbin et al. 2003b, Jermini et al. 2003, 2006). Models predict
a potential increase of the impact of epidemics of P. viticola with climate change (Salinari
et al. 2006), difficult times, especially for organic but also for conventional viticulture, are
to expect.

CHAPTER 8
142
L ITERATURE CITED
Akanda, S. I., Mundt, C. C. 1996. Effects of two-component wheat cultivar mixtures on stripe rust severity.
Phytopathology, 86: 347-353.
Andrivon, D., Lucas, J.-M., Ellissèche, D. 2003. Development of natural late blight epidemics in pure and
mixed plots of potato cultivars with different levels of partial resistance. Plant Pathology, 52: 586-
594.
Berkelmann-Loehnertz, B., Loskill, B., Fruehauf, C., Gollmer, K.-U., Forster, M., Kuczera, A., Braden, H.,
Wittich, P. 2006. Downy mildew forecast regarding primary and further soil borne infections based
on a splash algorithm and a microclimate model. Proceedings of the 5th International Workshop on
Grapevine Downy and Powdery Mildew. San Michele all’Adige, Italy, 130.
Blaise, P., Gessler, C. 1994. Cultivar mixtures in apple orchards as a mean to control apple scab. Norwegian
Journal of Agricultural Sciences, 17: 105-112.
Burruano, S., Strazzeri, S., Laviola, C. 1987. Influenza dell’acqua sulla germinazione delle oospore di
Plasmopara viticola. Phytopathologia Mediterranea, 26: 19-22.
Burruano, S., Conigliaro, G., Lo Piccolo, S., Alfonso, A., Torta, L. 2006. Plasmopara viticola: three decades
of observation in Sicily. Proceedings of the 5th International Workshop on Grapevine Downy and
Powdery Mildew. San Michele all’Adige, Italy, 58-59.
Dagostin, S., Gobbin, D., Palmieri, L., Formolo, T., Gessler, C. 2007. Toward quantification of Plasmopara
viticola oospore germination. Advances in Downy Mildew Research, 3: 53-58.
Delmotte, F., Martinez, F., Némorin, A., Chen, W. -J., Richart-Cervera, S., Corio-Costet, M.-F. 2006. Spatial
genetic structure of grapevine downy mildew epidemic. Proceedings of the 5th International
Workshop on Grapevine Downy and Powdery Mildew. San Michele all’Adige, Italy, 63.
Didelot, F., Brun, L., Parisi, L. 2007. Effects of cultivar mixtures on scab control in apple orchards. Plant
Pathology, 56: 1014-1022.
EPPO/OEPP. 1999. EPPO Standard PP 1/213(1) Resistance Risk Analysis, EPPO Bulletin, 29: 325-347.
Eugster, C. 2003. Relative contribution of oosporic and sporangial inoculum to epidemics of grapevine downy
mildew and genetic structure of Plasmopara viticola in a New York vineyard assessed by
microsatellite technique. Diploma Thesis ETH-Zürich.
Finckh, M. R., Gacek, E. S., Czembor, H. J., Wolfe, M. S. 1999. Host frequency and density effects on
powdery mildew and yield in mixtures of barley cultivars. Plant Pathology, 48: 807-816.
Garrett, K. A., Mundt, C. C. 2000. Host diversity can reduce potato late blight severity for focal and general
patterns of primary inoculum. Phytopathology, 90: 1307-1312.
Garrett, K. A. Nelson, R. J., Mundt, C .C., Chacón, G., Jaramillo, R. E, Forbes, G. A. 2001. The effects of
host diversity and other management components on epidemics of potato late blight in the humid
highland tropics. Phytopathology, 91: 993-1000.
Gobbin, D. 2003 Redefining Plasmopara viticola epidemiological cycle by molecular genetics. PhD Thesis
ETH-Zürich.

CHAPTER 8
143
Gobbin, D., Pertot, I., Gessler, C. 2003a. Genetic structure of a Plasmopara viticola population in an isolated
Italian mountain vineyard. Journal of Phytopathology, 151: 636-646.
Gobbin, D., Jermini, M., Gessler, C. 2003b. The genetic underpinning of the minimal fungicide strategy.
Bulletin OILB/SROP 26(8): 101-104.
Gobbin, D., Jermini, M., Loskill, B., Pertot, I., Raynal, M., Gessler, C. 2005. Importance of secondary
inoculum of Plasmopara viticola to epidemics of grapevine downy mildew. Plant Pathology, 54:
522-534.
Gobbin, D., Bleyer, G., Keil, S., Kassemeyer, H.-H., Gessler, C. 2007. Evidence for sporangial dispersal
leading to a single infection event and a sudden high incidence of grapevine downy mildew. Plant
Pathology, 56: 843-847.
Gullino, M. L., Leroux, P., Smith, C. M. 2000. Uses and challenges of novel compounds for plant disease
control. Crop Protection, 19: 1-11.
Hoch, H. C., Abawi, G. S. 1979. Mycoparasitism of oospores of Pythium ultimum by Fusarium merismoides.
Mycologia, 71(3): 621-625.
Hug, F. 2005. Genetic structure and epidemiology of Plasmopara viticola populations from Australian grape
growing regions. Diploma Thesis ETH-Zürich.
Jermini, M., Gobbin, D., Blaise, P., Gessler, C. 2003a. Influence of the overwintering methods on the
germination dynamic of downy mildew (Plasmopara viticola) oospores. IOBC/WPRS Bulletin, 26:
37-42.
Jermini, M., Blaise, P., Gessler, C. 2003b. Response of grapevine growth and yield quantity to the application
of a minimal fungicide strategy for the control of the downy mildew (Plasmopara viticola). Bulletin
OILB/SROP, 26(8): 25-29.
Jermini, M., Christen, D., Strasser, R., Gessler, C. 2006. Impact of four years application of the Minimal
Fungicide Strategy for downy mildew control on the plant recovering capacities of Vitis vinifera cv
Merlot. Proceedings of the 5th International Workshop on Grapevine Downy and Powdery Mildew.
San Michele all’Adige, Italy, 176-177.
Kellerhals, M., Mouron, P., Graf, B., Bousset, L., Gessler, C. 2003. Mischpflanzungen von Apfelsorten:
Einfluss auf Krankheiten, Schädlinge und Wirtschaftlichkeit. Schweizerische Zeitschrift für Obst-
und Weinbau, 13: 10-13.
Kennelly, M. M., Gadoury, D. M., Wilcox, W. F., Magarey, P. A., Seem, R. C. 2007. Primary infection,
lesion productivity, and survival of sporangia in the grapevine downy mildew pathogen, Plasmopara
viticola. Phytopathology, 97: 512-522.
Koopman, T., Linde, C. C., Fourie, P., McLeod, A. 2006. The Role of Oosporic Infection in the
Epidemiology of Downy Mildew in South Africa. Proceedings of the 5th International Workshop on
Grapevine Downy and Powdery Mildew. San Michele all’Adige, Italy, 90-92.
Laviola, C., Burruano, S., Strazzeri, S. 1986. Influenza della temperatura sulla germinazione delle oospore di
Plasmopara viticola (Berk. et Curt.) Berl. et De Toni. Phytopathologia Mediterranea, 25: 80-84.
Martin, F. N., Loper, J. E. 1999. Soilborne Plant Diseases Caused by Pythium spp: Ecology, Epidemiology,
and Prospects for Biological Control. Critical Reviews in Plant Sciences, 18(2): 111-181.
CHAPTER 8
144
McCracken, A. R., Dawson, W. M. 2003. Rust disease (Melampsora epitea) of willow (Salix spp) grown as
short rotation coppice (SRC) in inter- and intra-species mixtures. Annals of Applied Biology, 143:
381-393.
McDonald, B. A., Linde, C. C. 2002. Pathogen population genetics, evolutionary potential, and durable
resistance. Annual Review of Phytopathology, 40: 349-379.
Mundt, C. C. 2002. Use of multiline cultivars and cultivar mixtures for disease management. Annual Review
of Phytopathology, 40: 381-410.
Renella, G., Chaudri, A. M., Brookes, P. C. 2002. Fresh additions of heavy metals do not model long-term
effects on microbial biomass and activity. Soil Biology & Biochemistry, 34: 121-124.
Rossi, V., Giosuè, S., Girometta, B., Bugiani, R. 2002. Influenza delle condizioni meteorologiche sulle
infezioni primarie di Plasmopara viticola in Emilia-Romagna. Brunelli, A., Canova, A. (eds.), Atti
Giornate Fitopatologiche, 2002. Bologna, Italy, 263-270.
Rossi, V., Caffi, T. 2007. Effect of water on germination of Plasmopara viticola oospores. Plant Pathology,
56: 957-966.
Rumbou, A., Gessler, C. 2004. Genetic dissection of Plasmopara viticola population from a Greek vineyard
in two consecutive years. European Journal of Plant Pathology, 4: 379-392.
Rumbou, A., Gessler, C. 2006. Particular structure of Plasmopara viticola populations evolved under Greek
island conditions. Phytopathology, 96: 501-509.
Salinari, F., Giosuè, S., Tubiello, F. N., Rettori, A., Rossi, V., Spanna, F., Rosenzweig, C., Gullino, M. L.
2006. Downy mildew (Plasmopara viticola) epidemics on grapevine under climate change. Global
Change Biology, 12: 1299-1307.
Sutton, D. K., MacHardy, W. E., Lord, W. G. 2000. Effects of shredding or treating apple leaf litter with urea
on ascospore dose of Venturia inaequalis and disease buildup. Plant Disease, 84: 1319-1326.
Urban, J., Lebeda, A. 2006. Fungicide resistance in cucurbit downy mildew-methodological, biological and
population aspects. Annals of Applied Biology, 149: 63-75.
Vercesi, A., Sirtori, C., Valvassori, A., Setti, E., Liberati, D. 2000. Estimating germinability of Plasmopara
viticola oospores by means of neural networks. Cellular Engineering, 38: 109-112.
Zhu, Y.-Y., Fang, H., Wang, Y.-Y., Fan, J. X., Yang, S.-S., Mew, T. W., Mundt, C. C. 2005. Panicle blast and
canopy moisture in rice cultivar mixtures. Phytopathology, 95: 433-438.

145
ACKNOWLEDGEMENTS
I miei ringraziamenti vanno a…
• Cesare Gessler per avermi dato la possibilità di svolgere questa tesi
• Davide Gobbin per la supervisione del lavoro
• Mauro Jermini per le risposte alle mille ed una domanda e per tutto l’aiuto
• Hanns-Heinz Kassemeyer and Bruce McDonald for being my co-examiners
• Rocchina Abbas-Pennella per il preziosissimo aiuto in laboratorio
• Michele Gusberti e Natasha Rosselli per il grandissimo aiuto in campo e per le lunghe e
belle giornate passate “nella REPCO”
• Marcello Zala, Giovanni Broggini, Thomas Paternoster e Paolo Galli per i consigli, il
sostegno, la motivazione e per avermi convinta a tenere duro!
• Aude Alaphilippe, Fabienne Di Gennaro, Gabriella Parravicini, Alice Balmelli ed Andrea
Patocchi per il sostegno, l’aiuto e la cioccolata…
• Genevieve Défago per i preziosissimi consigli
• Roberto Rigoni, Mirto Ferretti e Co. per essersi occupati del vigneto REPCO a Cugnasco
• Hans-Jakob Schärer, Lucius Tamm and Thomas Amsler (Fibl) for giving me the
possibility to collect samples in the experimental vineyard in Frick
• Pascal Zaffarano per l’aiuto con le analisi di genetica delle popolazioni
• Matthias Lutz for helping me with Systat
• My diploma and semester students Christian Stutz and Stéphanie Waldispühl for their
contribution to this research
• Felix Hug, Sheila Isepponi, Lisa Conza per l’aiuto in campo
• Jürgen Köhl, Carin Lombaers-van der Plas, Hanns-Heinz Kassemeyer, Carmen
Schweikert, Lucius Tamm, Hans-Jakob Schärer, Thomas Amsler, Ilaria Pertot, Silvia
Dagostin, Cyril Bertrand, Marc Chovelon, Bart Heijne, Peter Frans de Jong, John
Hockenhull, Marianne Bengtsson, Hanne Lindhard Pedersen, Marc Trapman and Ute
Eiben for the collaboration and the interesting REPCO meetings

146
• Awais Khan, Andreas von Felten, Patrice de Werra, Joana Bernardes de Assis, Megan
McDonald, Stefano Torriani, Thalïa Vanblaere, Pierre-Marie Leroux, Ulrike Rosenberger
and the whole Plant Pathology Group for the nice time
• Ciao Fabietto
• Nico, Tiz, Monica, Maurizio, Claudia, Sem, Chantal, Christian, Corrado, Silvano, Marco,
e Peter per gli stupendi week-end passati sulle cime o ad arrampicare
• Mes amies Laurence Duc, Marisa Kammermann, Joana Meyer, Cecilia Matasci et … le
Selvaggio Blu! Merci les filles!
• La mia famiglia ed i miei amici per il grandissimo sostegno

147
PUBLICATIONS
Peer reviewed journals
Matasci, C. L., Gobbin, D., Schärer, H.-J., Tamm, L., Gessler, C. 2008. Selection for
fungicide resistance throughout a growing season in populations of Plasmopara
viticola. European Journal of Plant Pathology, 120: 79-83.
Silfverberg-Dilworth, E., Matasci, C. L., Van de Weg, W. E., Van Kaauwen, M. P.
W.,Walser, M., Kodde, L. P., Soglio, V., Gianfranceschi, L., Durel, C. E., Costa, F.,
Yamamoto, T., Koller, B., Gessler, C., Patocchi, A. 2006. Microsatellite markers
spanning the apple (Malus x domestica Borkh) genome. Tree Genetics & Genomes,
2(4): 202-224.
IOBC Bulletin
Matasci, C. L., Gobbin, D., Schärer, H.-J., Stutz, Ch., Tamm, L., Gessler, C. 2008. Early
detection of selection for resistance in Plasmopara viticola populations treated with
organically based fungicides. IOBC/WPRS Bulletin, 36: 167-174.
Posters and scientific presentations
Matasci, C. L., Jermini, M., Gobbin, D., Gusberti, M., Rosselli, N., Gessler, C. 2007.
Plasmopara viticola disease severity in a mixed cultivar trial. Biological and
Integrated Control in a Modern Viticulture, Marsala (I), 25-27 October 2007.
Matasci, C. L., Gobbin, D., Jermini, M., Gusberti, M., Rosselli, N., Gessler, C. 2007.
Spatial patterns of Plasmopara viticola populations at single plant scale. Biological
and Integrated Control in a Modern Viticulture, Marsala (I), 25-27 October 2007.
Matasci, C. L., Gobbin, D., Jermini, M., Gusberti, M., Rosselli, N., Gessler, C. 2007. Effect
of grapevine cultivar mixtures onto downy mildew disease severity-a two years
survey. The Downy Mildews 2nd International Symposium, Olomouc (CZ), 02-06
July 2007.
Matasci, C. L., Jermini, M., Gobbin, D., Rosselli, N., Gessler, C. 2006. Influence of cultivar
mixtures on grapevine Downy mildew epidemic. 5th International Workshop on
Grapevine Downy and Powdery Mildew, San Michele all'Adige (I), 18-23 June
2006.
148
Matasci, C. L., Gobbin, D., Stutz, Ch., Gessler, C. 2006. Analysis of selection pressure
exerted on Plasmopara viticola by organically based fungicides. European Joint
Organic Congress-Organic Farming and European Rural Development, Odense
(DK), 30-31 May 2006.
Matasci, C. L. 2006. Nouvelles connaissances sur la biologie de Plasmopara viticola-
Conséquences sur les stratégies de traitement- Neue Erkenntnisse zur Biologie von
Plasmopara viticola-Auswirkungen auf die Bekämpfungsstrategie.
Biorebbautagung, Olten (CH), 08 March 2006.
Matasci, C. L., Jermini, M., Gobbin, D., Rosselli, N., Gessler, C. 2005. Downy mildew
susceptibility of grapevine cultivars in a mixed crop trial. Integrated Protection and
Production in Viticulture, IOBC, Darfo Boario Terme-Erbusco (I), 20-21 October
2005.

149
CURRICULUM VITAE
Caterina L. Matasci, born 24 December 1977, Sonogno TI, Switzerland
04. 2004 – 11. 2008 PhD study at the Plant Pathology Group, Institute of Integrative
Biology, Swiss Federal Institute of Technology, ETH Zurich,
supervised by Prof. Dr. Cesare Gessler and Dr. Davide Gobbin, ETH
Zurich
01. 2003 – 03. 2004 Research assistant working on the European Project HiDRAS (High-
quality Disease Resistant Apples for a Sustainable Agriculture) at the
Plant Pathology Group, Institute of Integrative Biology, Swiss
Federal Institute of Technology, ETH Zurich
10. 2002 Diploma in Agricultural Sciences, ETH Zurich: Dipl. Ing. Agr. ETH
02. – 06. 2002 Diploma thesis at the Plant Pathology Group, ETH Zurich:
“Identificazione di Tomato Spotted Wilt Virus (TSWV) in potenziali
piante ospiti e variabilità genetica degli isolati ticinesi”
10. 1997 – 10. 2002 Studies in Agricultural Sciences, ETH Zurich
06. 1997 Maturità Tipo C, Liceo Cantonale Locarno
09. 1993 – 06. 1997 Liceo Cantonale Locarno