dlds analytics : jfm report 2018 for jnpt -...
TRANSCRIPT
Report Components
DLDS ANALYTICS : JFM Report 2018 for JNPT
Logistics Redefined
Executive Summary
• DLDS commenced its operations across the Bharat Mumbai Container Terminal Private Limited(BMCTPL) at JNPT from 1st Apr 2018.
• LDB successfully commenced operations across the 4 Concor ICD’s at Tughlakabad, Dadri,Kanakpura, Mulund.
• Vessel Tracking Integration with JNPT has been completed and LDB portal now provides visibilityacross the sea for export bound container movement.
• Pan India launch of DMICDC’s Logistics Databank Operations was announced on 18th Dec 2017,this will enable in bringing Visibility & Transparency across the Indian Supply Chain and reducethe Container Transportationtime and the costs.
• LDB service went live across ICD Tughlakabad from 11th March 2018 which will provide visibilityof the EXIM container movement.
• Launch of LDB mobile App for android users, is enabling the stakeholders in tracking the EXIMContainers movement across the western corridor.
• Logistics Databank Project(LDB) as on date has provided visibility service for 7,676,212 EXIMContainers across the western corridor of India.
Performance Trend: Quarter on Quarter
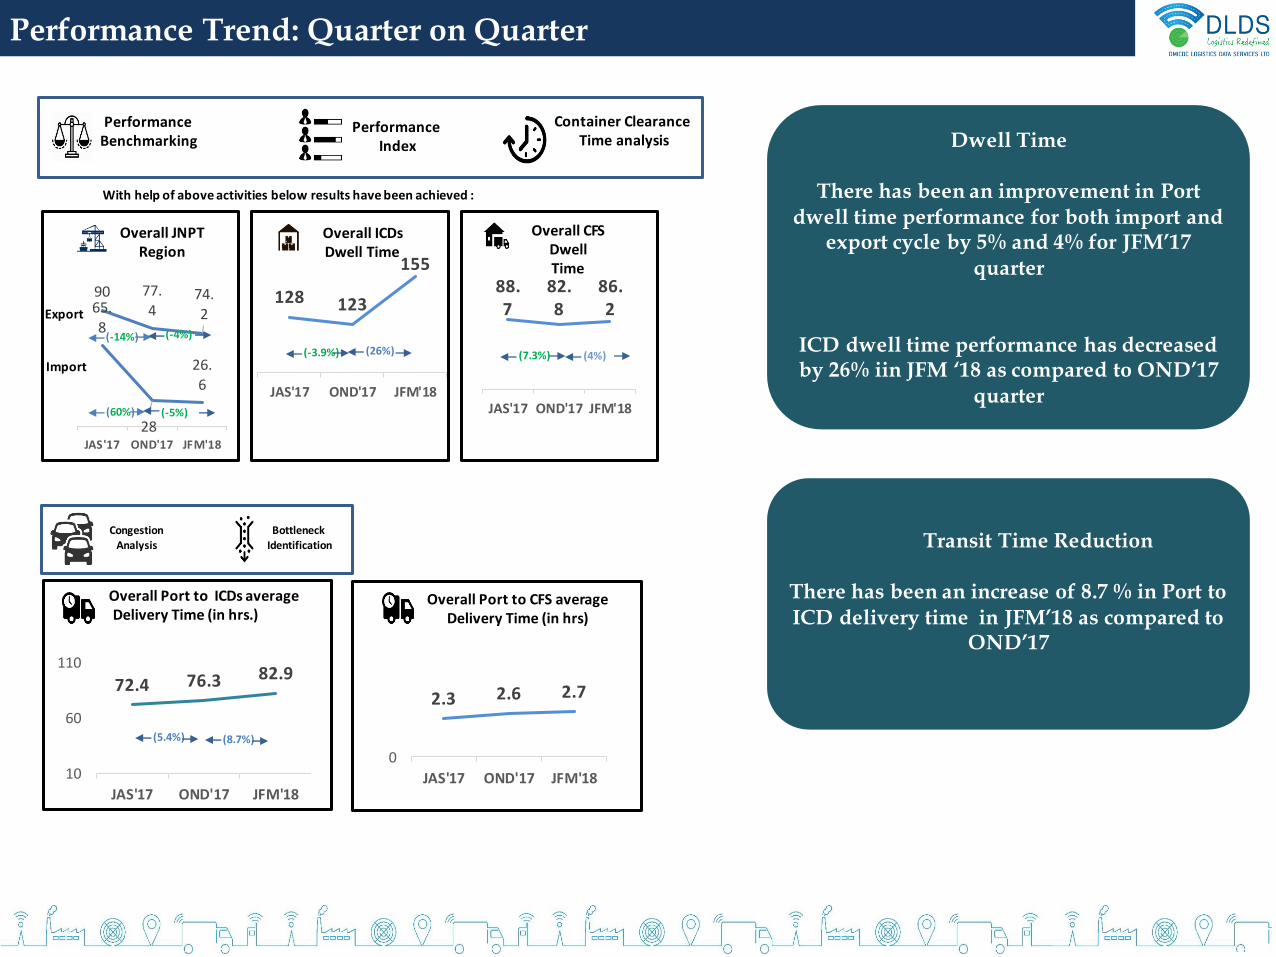
Dwell Time
There has been an improvement in Port dwell time performance for both import and
export cycle by 5% and 4% for JFM’17 quarter
ICD dwell time performance has decreased by 26% iin JFM ‘18 as compared to OND’17
quarter
Transit Time Reduction
There has been an increase of 8.7 % in Port to ICD delivery time in JFM’18 as compared to
OND’17
Overall JNPT Region
Overall ICDs Dwell Time
Overall CFS Dwell Time
Performance Benchmarking
Performance Index
Container Clearance Time analysis
With help of above activities below results have been achieved :
Import
Export
Congestion Analysis
Bottleneck Identification
Overall Port to ICDs averageDelivery Time (in hrs.)
Overall Port to CFS average Delivery Time (in hrs)
65.8
28
26.
6
90 77.4
74.2
JAS'17 OND'17 JFM'18
128 123
155
JAS'17 OND'17 JFM'18
88.7
82.8
86.2
JAS'17 OND'17 JFM'18
2.3 2.6 2.7
0
JAS'17 OND'17 JFM'18
72.4 76.3 82.9
10
60
110
JAS'17 OND'17 JFM'18
(-14%) (-4%)
(60%) (-5%)
(-3.9%) (26%) (7.3%) (4%)
(8.7%)(5.4%)
LDB Operations- Snapshot
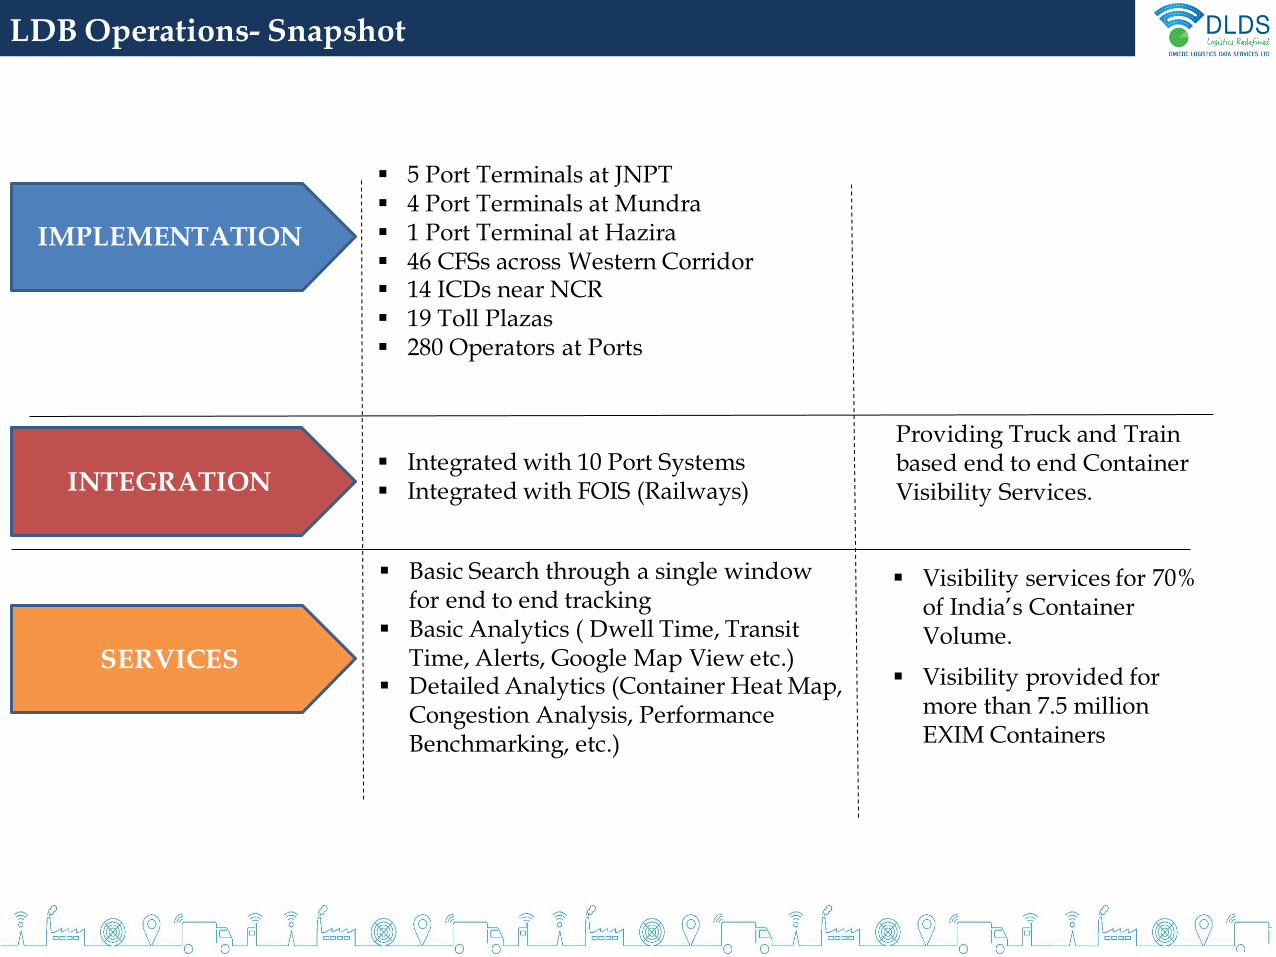
IMPLEMENTATION
INTEGRATION
SERVICES
5 Port Terminals at JNPT 4 Port Terminals at Mundra 1 Port Terminal at Hazira 46 CFSs across Western Corridor 14 ICDs near NCR 19 Toll Plazas 280 Operators at Ports
Integrated with 10 Port Systems Integrated with FOIS (Railways)
Providing Truck and Train based end to end Container Visibility Services.
Basic Search through a single window for end to end tracking
Basic Analytics ( Dwell Time, Transit Time, Alerts, Google Map View etc.)
Detailed Analytics (Container Heat Map, Congestion Analysis, Performance Benchmarking, etc.)
Visibility services for 70% of India’s Container Volume.
Visibility provided for more than 7.5 million EXIM Containers
LDB Analytics
Performance Benchmarking
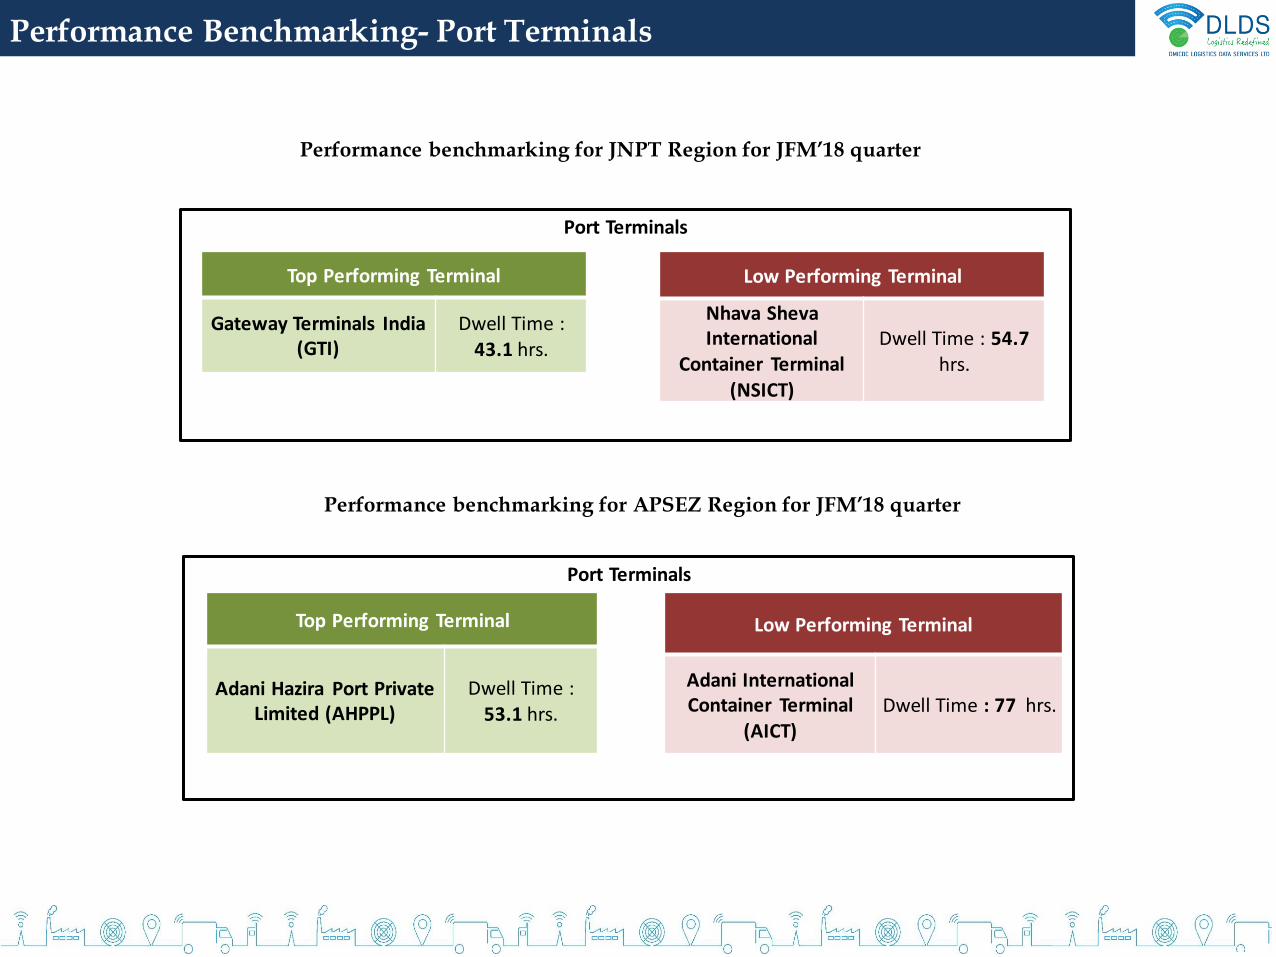
Top Performing Terminal
Gateway Terminals India (GTI)
Dwell Time : 43.1 hrs.
Low Performing Terminal
Nhava ShevaInternational
Container Terminal (NSICT)
Dwell Time : 54.7hrs.
Port Terminals
Performance benchmarking for JNPT Region for JFM’18 quarter
Top Performing Terminal
Adani Hazira Port Private Limited (AHPPL)
Dwell Time : 53.1 hrs.
Low Performing Terminal
Adani International Container Terminal
(AICT)Dwell Time : 77 hrs.
Port Terminals
Performance benchmarking for APSEZ Region for JFM’18 quarter
Performance Benchmarking- Port Terminals
Performance Benchmarking- CFS
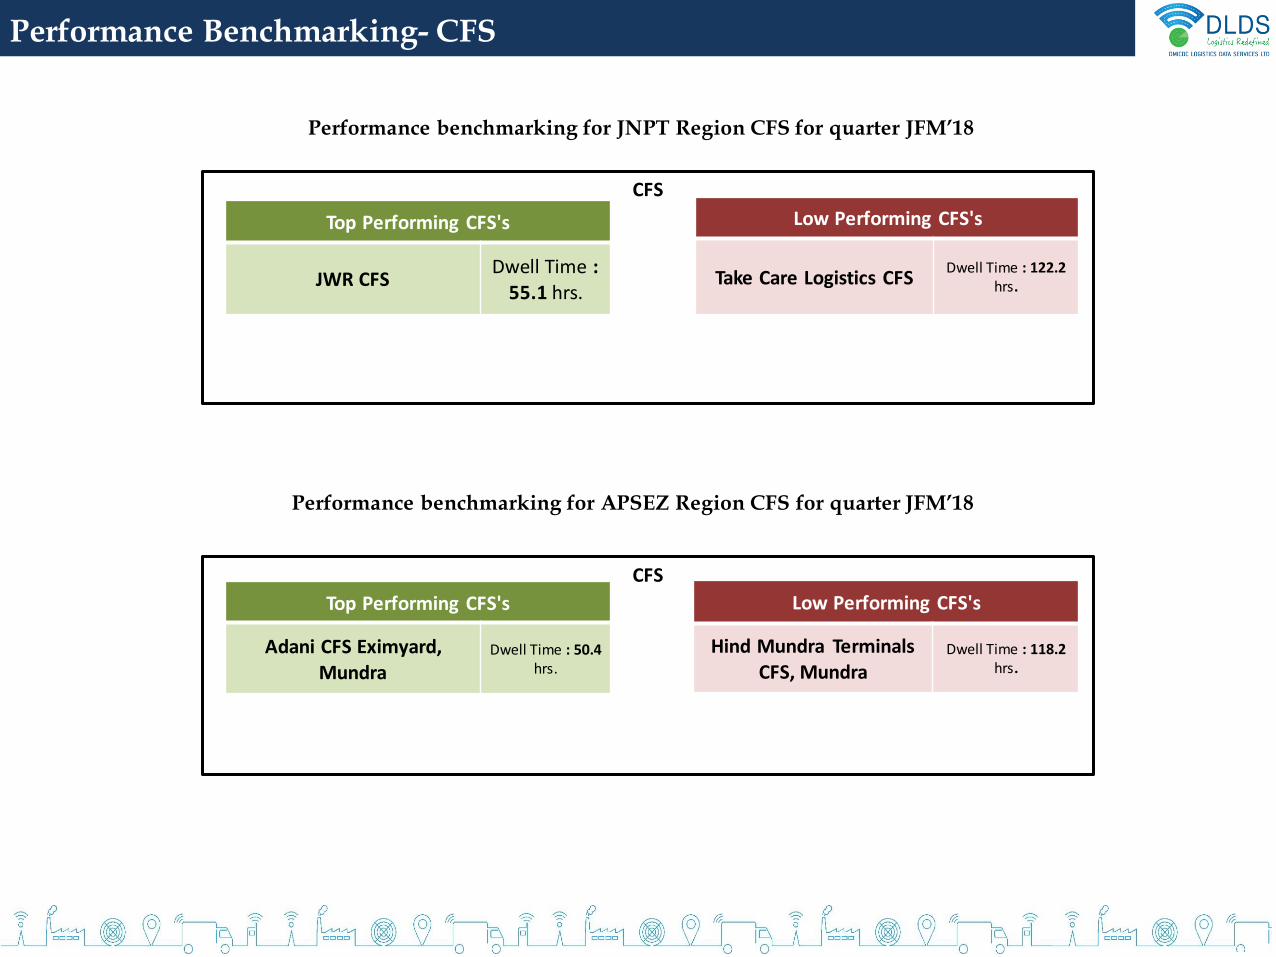
CFS
Top Performing CFS's
JWR CFSDwell Time :
55.1 hrs.
Low Performing CFS's
Take Care Logistics CFSDwell Time : 122.2
hrs.
Performance benchmarking for JNPT Region CFS for quarter JFM’18
CFS
Top Performing CFS's
Adani CFS Eximyard, Mundra
Dwell Time : 50.4 hrs.
Low Performing CFS's
Hind Mundra Terminals CFS, Mundra
Dwell Time : 118.2 hrs.
Performance benchmarking for APSEZ Region CFS for quarter JFM’18
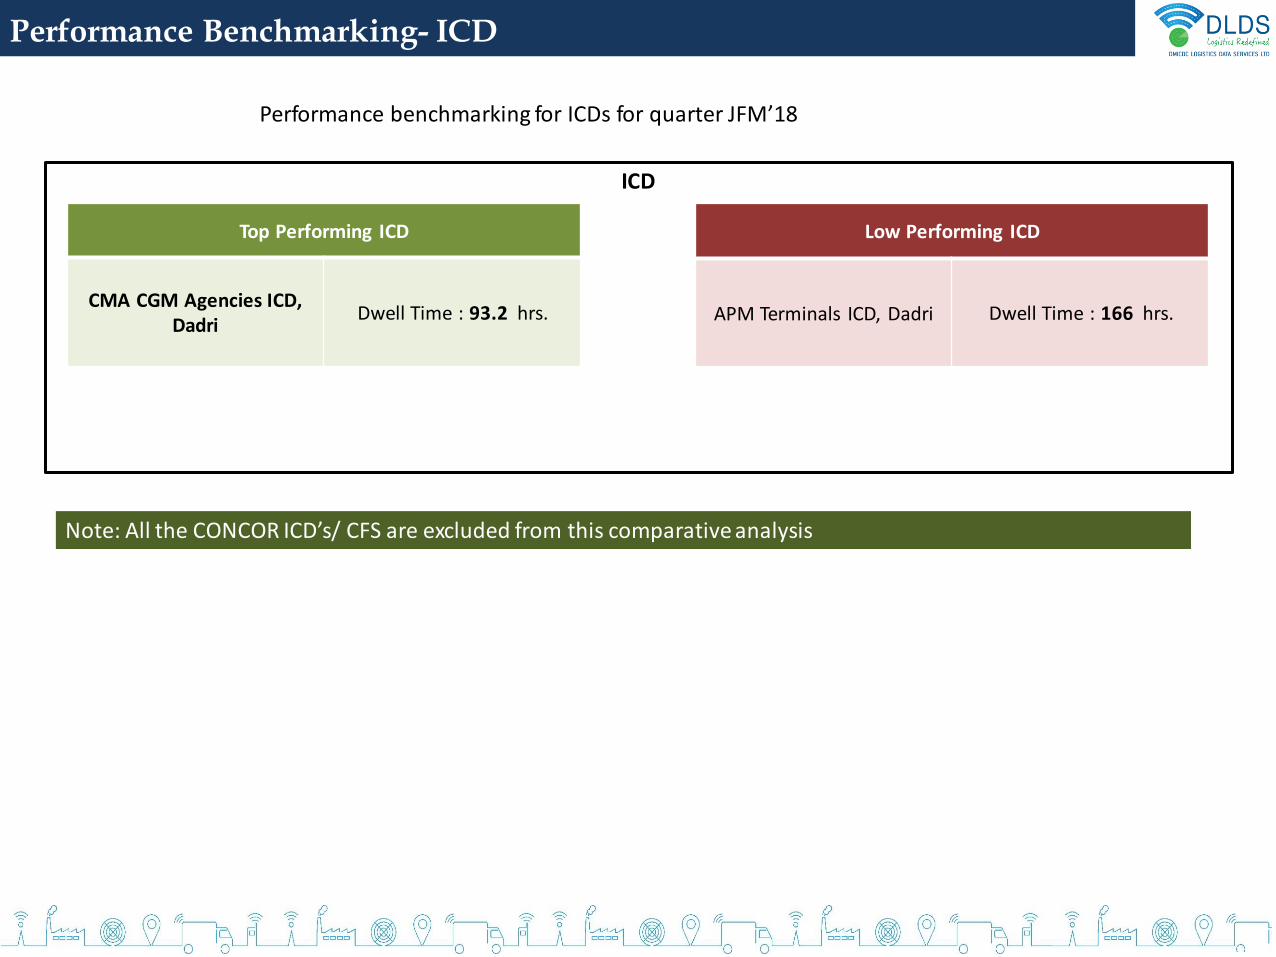
Performance Benchmarking- ICD
Performance benchmarking for ICDs for quarter JFM’18
Top Performing ICD
CMA CGM Agencies ICD, Dadri
Dwell Time : 93.2 hrs.
Low Performing ICD
APM Terminals ICD, Dadri Dwell Time : 166 hrs.
ICD
Note: All the CONCOR ICD’s/ CFS are excluded from this comparative analysis
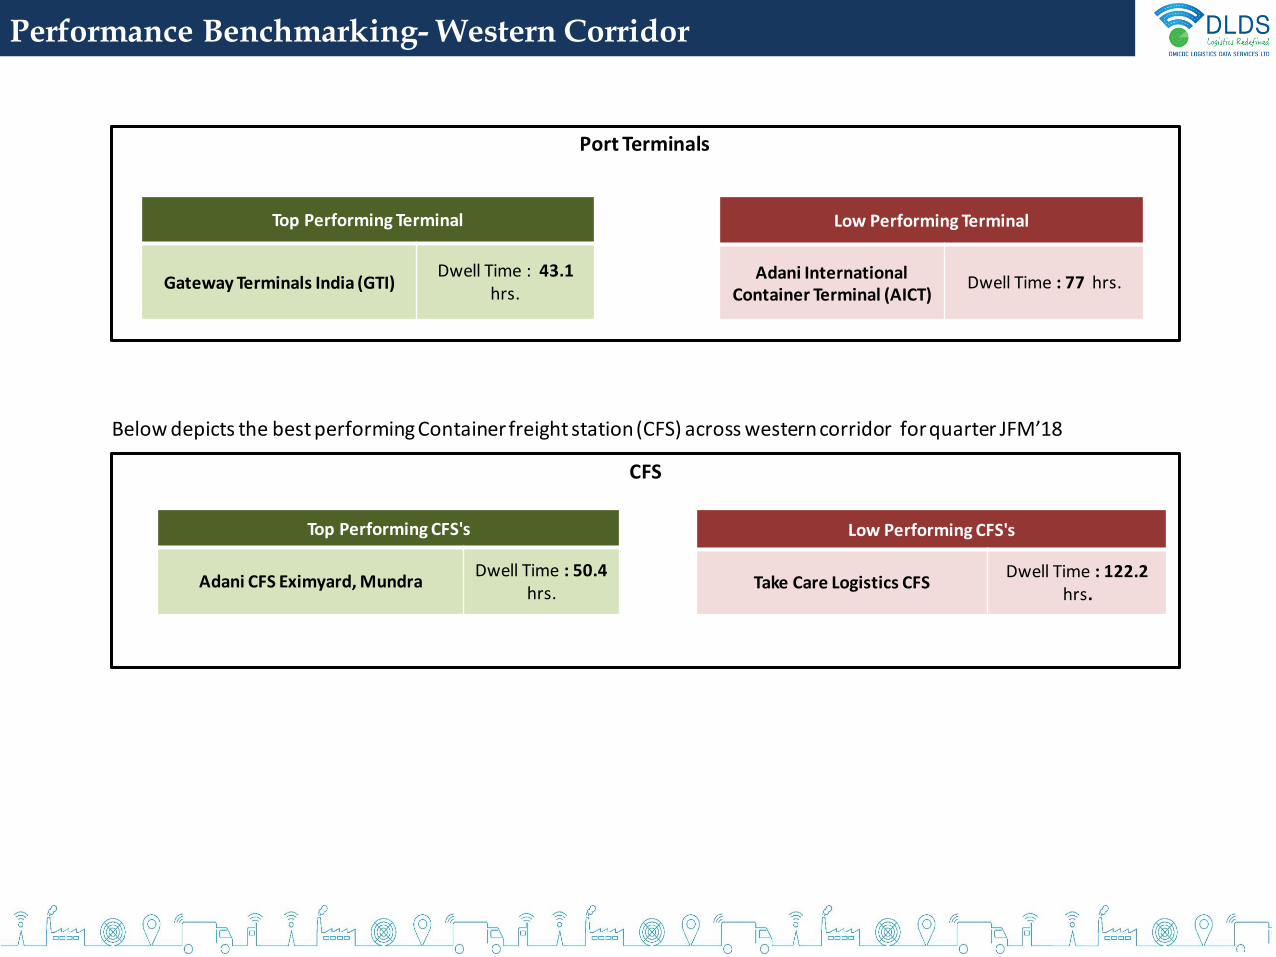
Performance Benchmarking- Western Corridor
Top Performing Terminal
Gateway Terminals India (GTI)Dwell Time : 43.1
hrs.
Port Terminals
Low Performing Terminal
Adani International Container Terminal (AICT)
Dwell Time : 77 hrs.
CFS
Top Performing CFS's
Adani CFS Eximyard, MundraDwell Time : 50.4
hrs.
Low Performing CFS's
Take Care Logistics CFSDwell Time : 122.2
hrs.
Below depicts the best performing Container freight station (CFS) across western corridor for quarter JFM’18
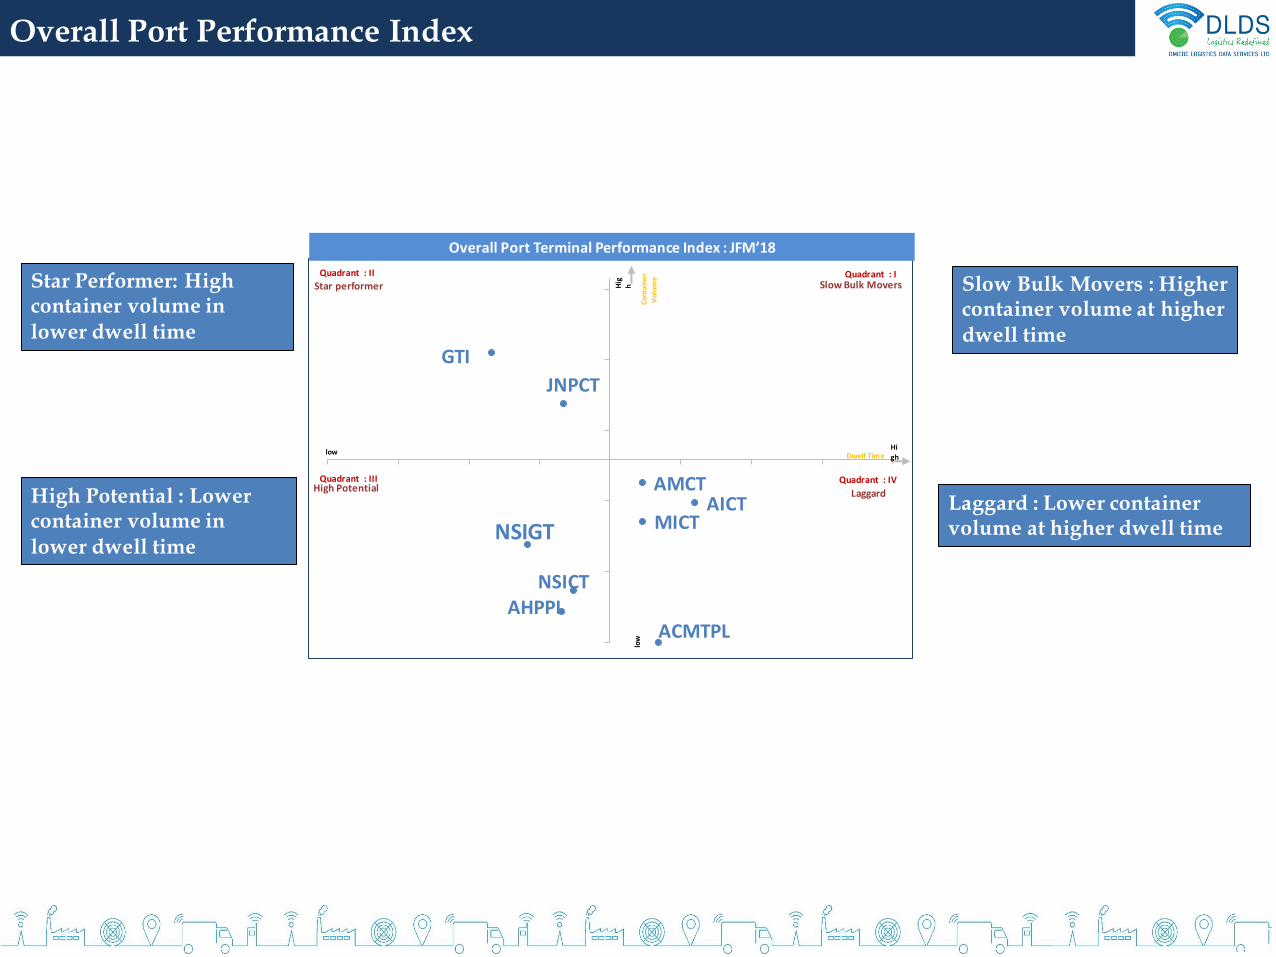
Overall Port Performance Index
JNPCT
NSICT
GTI
NSIGT
AHPPL
AMCTAICT
ACMTPL
MICT
Quadrant : IQuadrant : II
Quadrant : III Quadrant : IV
Overall Port Terminal Performance Index : JFM’18
Dwell Time
Con
tain
erV
olum
e
High
low
low
Hig
h Slow Bulk Movers : Higher container volume at higher dwell time
Star Performer: High container volume in lower dwell time
High Potential : Lower container volume in lower dwell time
Laggard : Lower container volume at higher dwell time
Star performer
Laggard
Slow Bulk Movers
High Potential
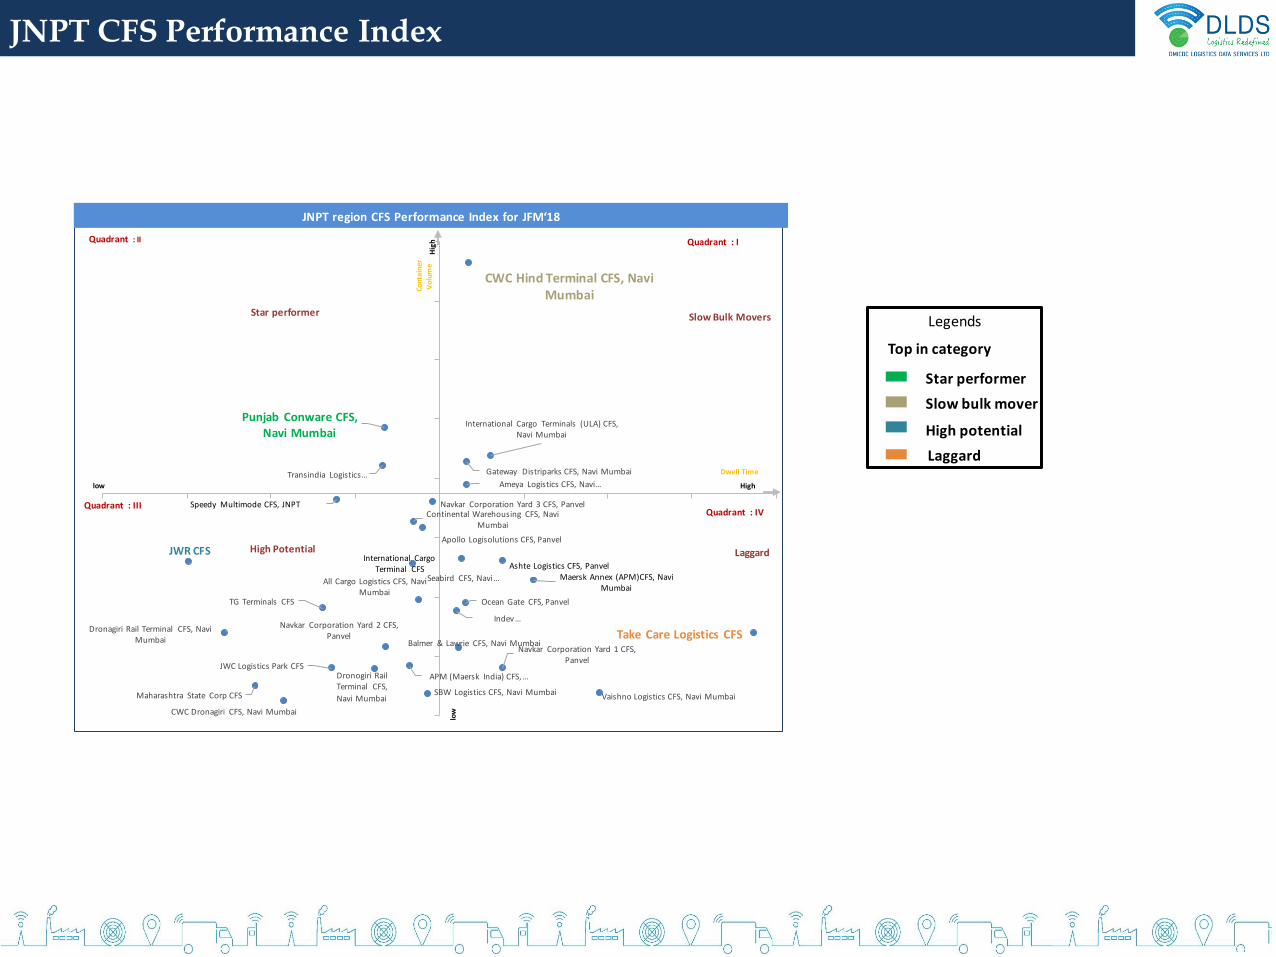
JNPT CFS Performance Index
Speedy Multimode CFS, JNPT
Balmer & Lawrie CFS, Navi Mumbai
Gateway Distriparks CFS, Navi Mumbai
APM (Maersk India) CFS, …
Continental Warehousing CFS, Navi Mumbai
Seabird CFS, Navi …
JWC Logistics Park CFS
Ameya Logistics CFS, Navi …
Ashte Logistics CFS, Panvel
Navkar Corporation Yard 1 CFS, Panvel
Apollo Logisolutions CFS, Panvel
Ocean Gate CFS, Panvel
Indev …
Transindia Logistics …
CWC Dronagiri CFS, Navi Mumbai
All Cargo Logistics CFS, Navi Mumbai
Vaishno Logistics CFS, Navi Mumbai
Navkar Corporation Yard 2 CFS, Panvel
JWR CFS
Punjab Conware CFS, Navi Mumbai
Dronogiri Rail Terminal CFS,
Navi MumbaiMaharashtra State Corp CFS
CWC Hind Terminal CFS, Navi Mumbai
Navkar Corporation Yard 3 CFS, Panvel
International Cargo Terminals (ULA) CFS, Navi Mumbai
Maersk Annex (APM)CFS, Navi Mumbai
TG Terminals CFS
SBW Logistics CFS, Navi Mumbai
International Cargo Terminal CFS
Take Care Logistics CFSDronagiri Rail Terminal CFS, Navi
Mumbai
Quadrant : IQuadrant : II
Quadrant : IIIQuadrant : IV
JNPT region CFS Performance Index for JFM‘18
Dwell Time
Cont
ain
erV
olum
e
Highlow
low
Hig
h
Star performer
Laggard
Slow Bulk Movers
High Potential
Top in category
Star performer
Slow bulk mover
High potential
Laggard
Legends
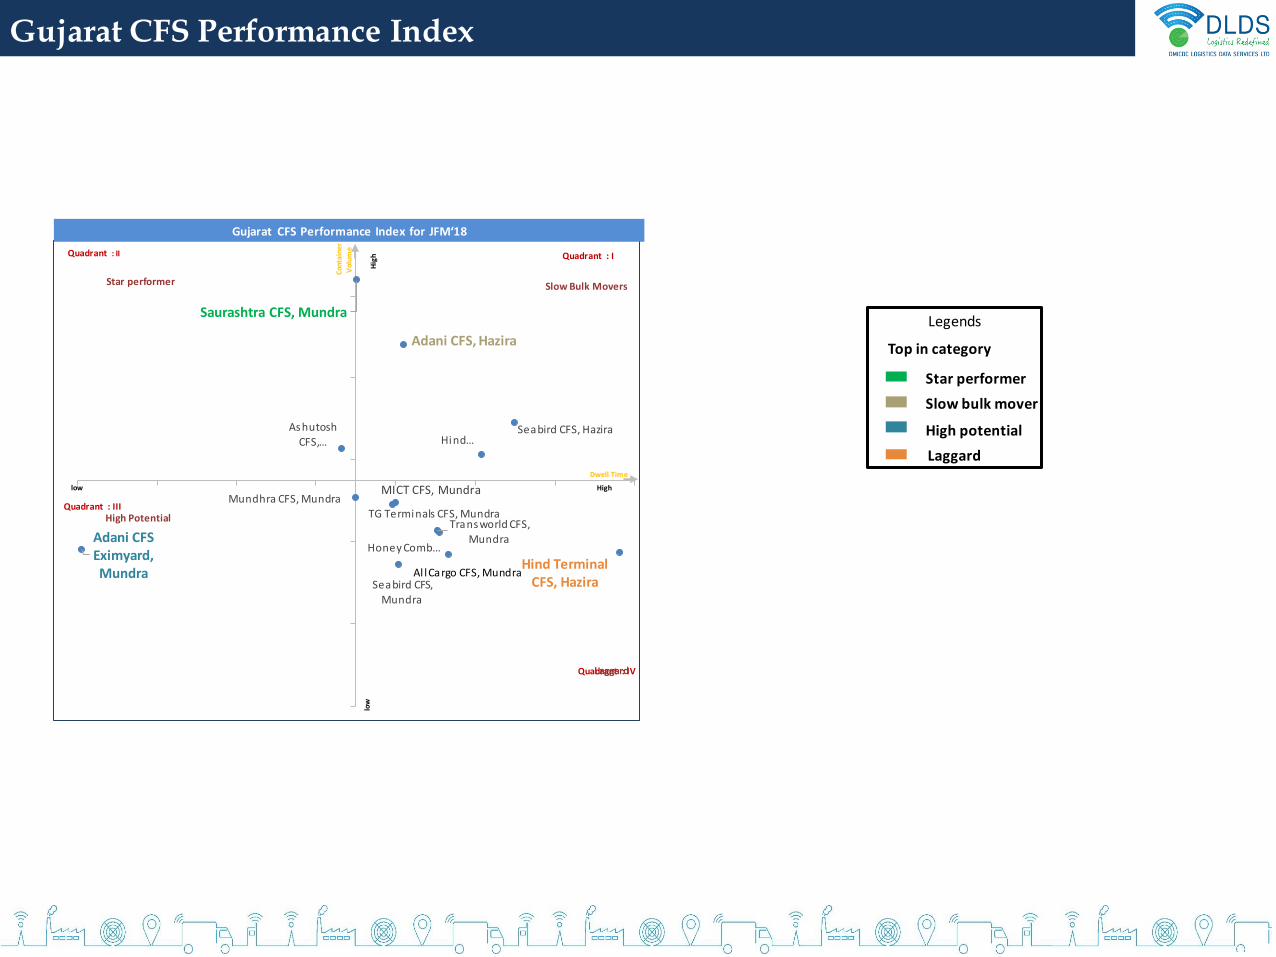
Gujarat CFS Performance Index
Top in category
Star performer
Slow bulk mover
High potential
Laggard
Legends
MICT CFS, MundraMundhra CFS, Mundra
Ashutosh CFS, …
Saurashtra CFS, Mundra
Transworld CFS, Mundra
Honey Comb …
Seabird CFS,
Mundra
TG Terminals CFS, Mundra
Hind …
Adani CFS Eximyard, Mundra
Adani CFS, Hazira
Seabird CFS, Hazira
Al lCargo CFS, MundraHind Terminal
CFS, Hazira
Quadrant : IQuadrant : II
Quadrant : III
Quadrant : IV
Gujarat CFS Performance Index for JFM‘18
Dwell Time
Cont
aine
rV
olum
e
Highlow
low
Hig
h
Star performer
Laggard
Slow Bulk Movers
High Potential
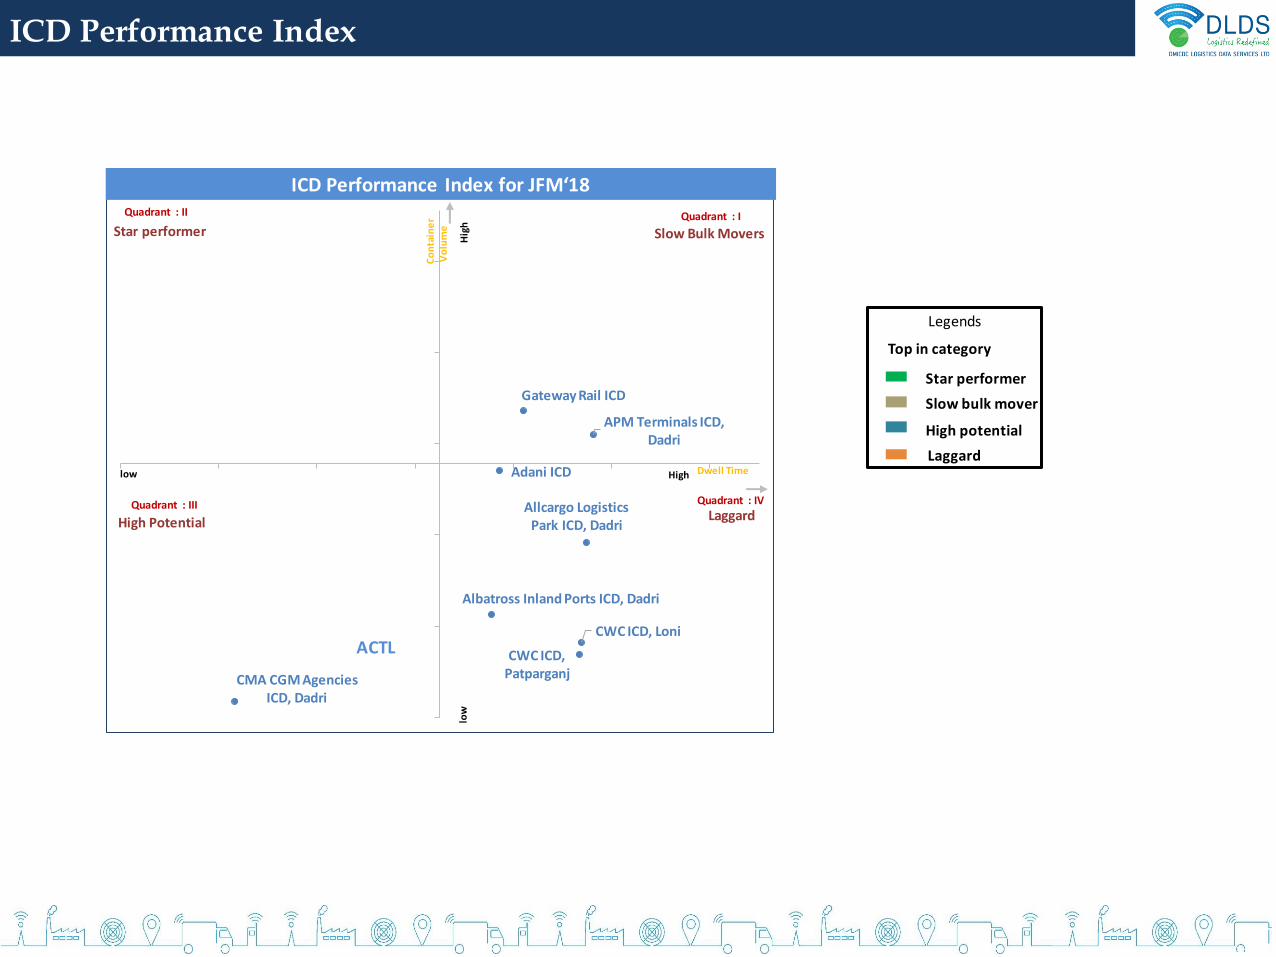
ICD Performance Index
Top in category
Star performer
Slow bulk mover
High potential
Laggard
Legends
Allcargo Logistics Park ICD, Dadri
CMA CGM Agencies ICD, Dadri
APM Terminals ICD, Dadri
CWC ICD, Patparganj
CWC ICD, Loni
Adani ICD
Gateway Rail ICD
Quadrant : IQuadrant : II
Quadrant : III Quadrant : IV
ICD Performance Index for JFM‘18
Dwell Time
Co
nta
ine
rV
olu
me
Highlowlo
wH
igh
Star performer
Laggard
Slow Bulk Movers
High Potential
ACTL
Albatross Inland Ports ICD, Dadri

Transit Time Analysis
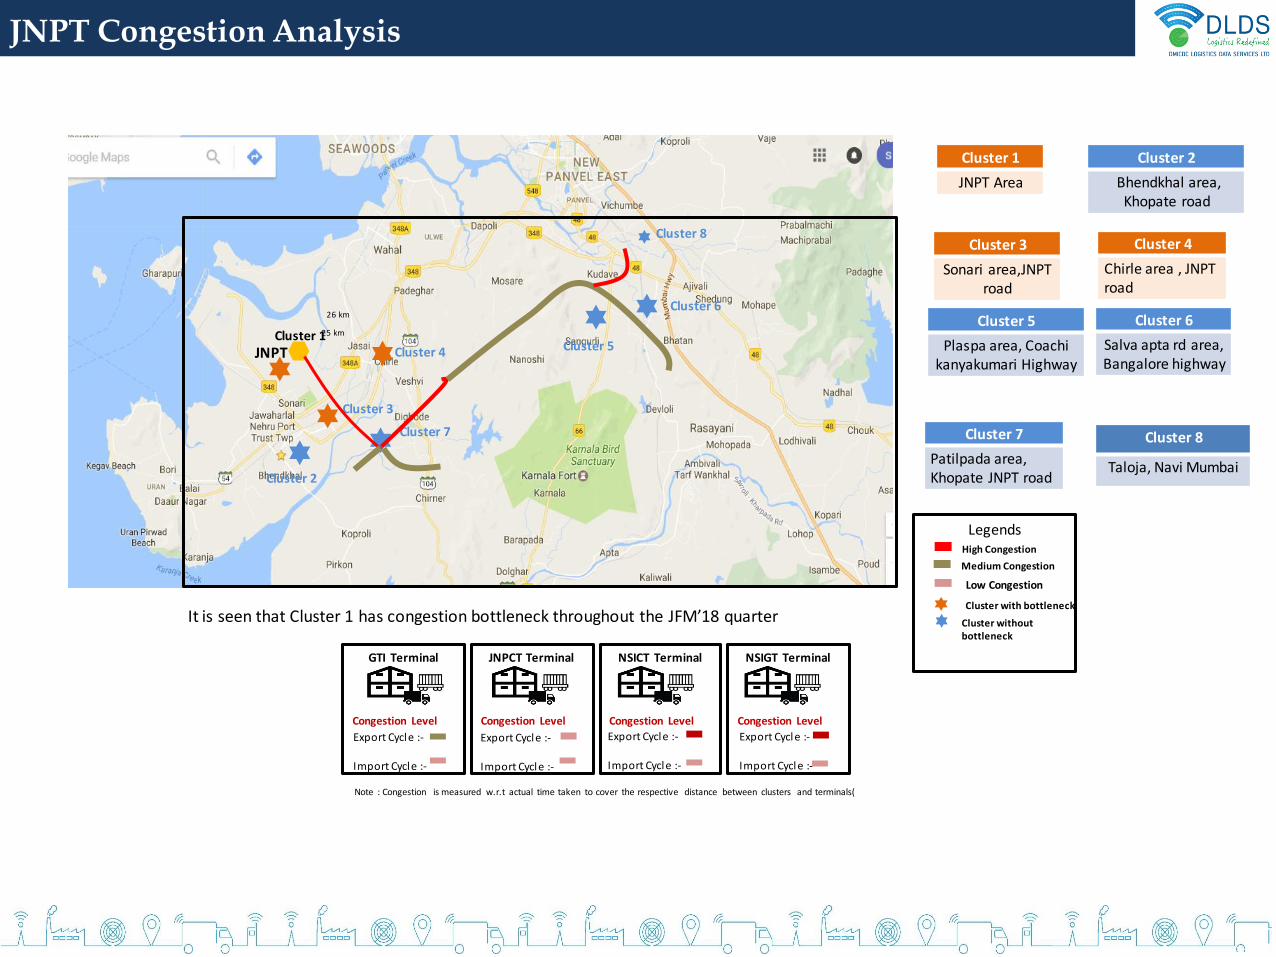
JNPT Congestion Analysis
Cluster 2
Cluster 5
Cluster 7
Cluster 4
Cluster 6
Cluster 3
Cluster 1
JNPT
25 km
26 km
High Congestion
Cluster without bottleneck
Cluster with bottleneck
Medium Congestion
Cluster 8
GTI Terminal
Congestion Level
JNPCT Terminal
Congestion Level
NSICT Terminal
Congestion Level
NSIGT Terminal
Congestion Level
Export Cycle :-
Import Cycle :-
Export Cycle :-
Import Cycle :-
Export Cycle :-
Import Cycle :-
Export Cycle :-
Import Cycle :-
Note : Congestion is measured w.r.t actual time taken to cover the respective distance between clusters and terminals(
Cluster 1
JNPT Area
Cluster 2
Bhendkhal area, Khopate road
Cluster 5
Plaspa area, Coachi kanyakumari Highway
Cluster 6
Salva apta rd area,Bangalore highway
Cluster 7
Patilpada area, Khopate JNPT road
Cluster 8
Taloja, Navi Mumbai
Low Congestion
Legends
It is seen that Cluster 1 has congestion bottleneck throughout the JFM’18 quarter
Cluster 4
Chirle area , JNPT road
Cluster 3
Sonari area,JNPTroad

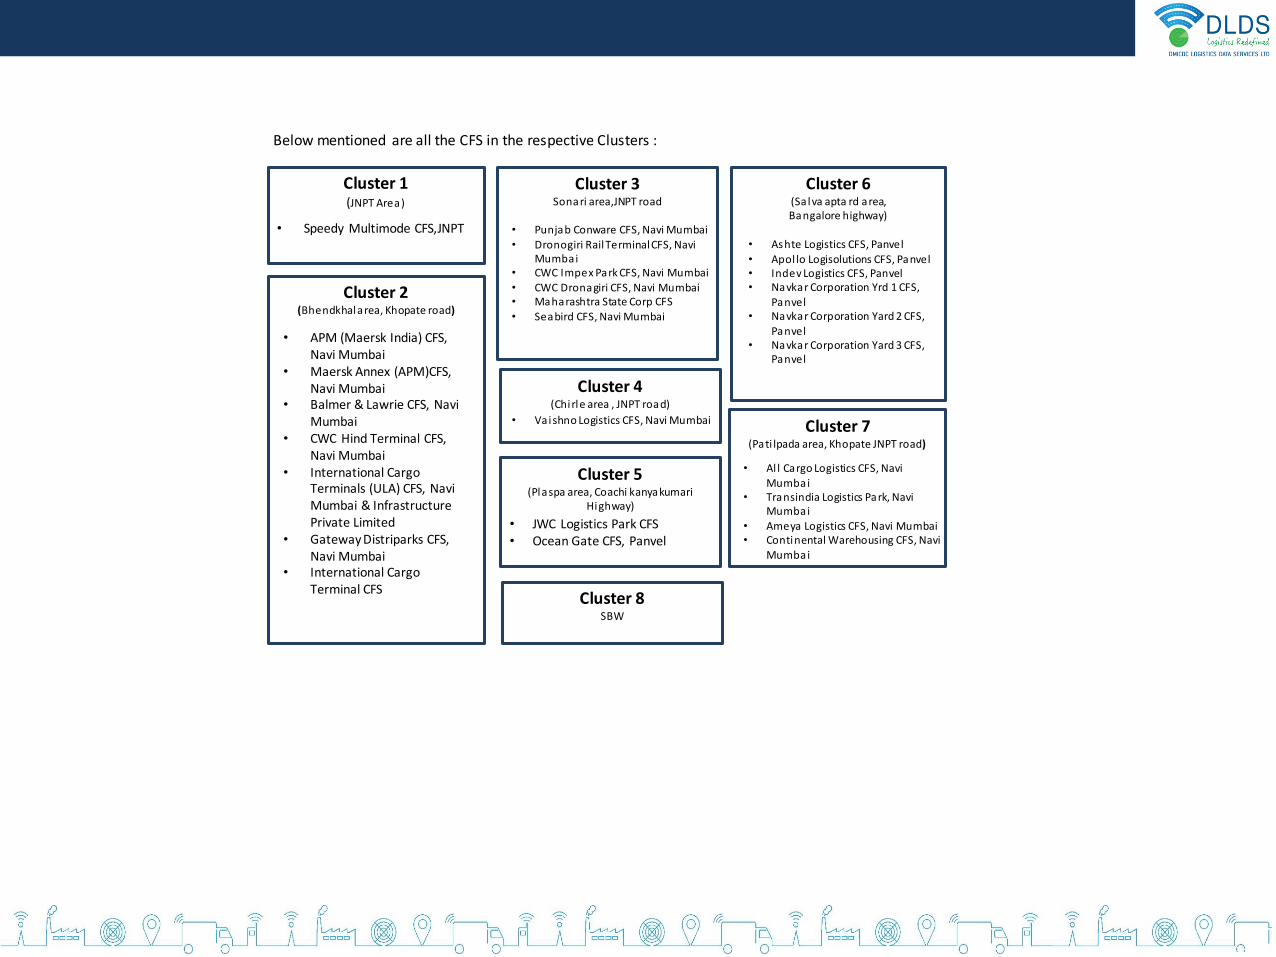
• APM (Maersk India) CFS, Navi Mumbai
• Maersk Annex (APM)CFS, Navi Mumbai
• Balmer & Lawrie CFS, Navi Mumbai
• CWC Hind Terminal CFS, Navi Mumbai
• International Cargo Terminals (ULA) CFS, Navi Mumbai & Infrastructure Private Limited
• Gateway Distriparks CFS, Navi Mumbai
• International Cargo Terminal CFS
Cluster 2 (Bhendkhal area, Khopate road)
Cluster 1 (JNPT Area)
• Speedy Multimode CFS,JNPT • Punjab Conware CFS, Navi Mumbai• Dronogiri Rail Terminal CFS, Navi
Mumbai• CWC Impex Park CFS, Navi Mumbai• CWC Dronagiri CFS, Navi Mumbai• Maharashtra State Corp CFS• Seabird CFS, Navi Mumbai
Cluster 3Sonari area,JNPT road
Cluster 4(Chirle area , JNPT road)
• Vaishno Logistics CFS, Navi Mumbai
Cluster 5(Plaspa area, Coachi kanyakumari
Highway)
• JWC Logistics Park CFS• Ocean Gate CFS, Panvel
• Ashte Logistics CFS, Panvel
• Apol lo Logisolutions CFS, Panvel• Indev Logistics CFS, Panvel• Navkar Corporation Yrd 1 CFS,
Panvel• Navkar Corporation Yard 2 CFS,
Panvel• Navkar Corporation Yard 3 CFS,
Panvel
Cluster 6(Sa lva apta rd area, Bangalore highway)
Cluster 7(Pati lpada area, Khopate JNPT road)
• Al l Cargo Logistics CFS, Navi Mumbai
• Transindia Logistics Park, Navi Mumbai
• Ameya Logistics CFS, Navi Mumbai• Continental Warehousing CFS, Navi
Mumbai
Below mentioned are all the CFS in the respective Clusters :
Cluster 8SBW
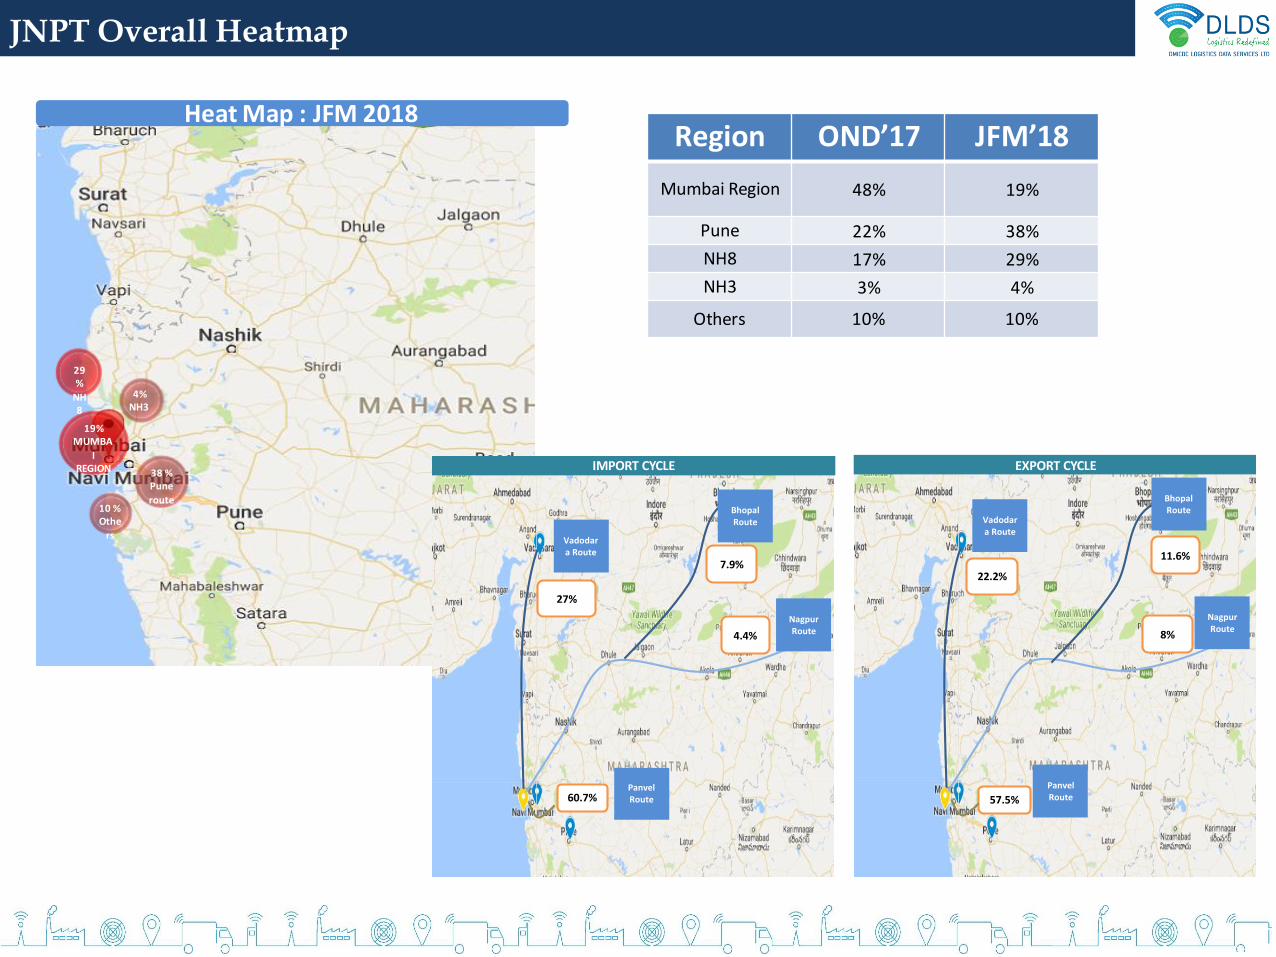
JNPT Overall Heatmap
19%MUMBA
I REGION
Heat Map : JFM 2018
4%NH3
38 %Pune
route10 %Othe
rs
Region OND’17 JFM’18
Mumbai Region 48% 19%
Pune 22% 38%
NH8 17% 29%
NH3 3% 4%
Others 10% 10%
29%
NH8
27%
4.4%
60.7%
IMPORT CYCLE
22.2%
8%
57.5%
EXPORT CYCLE
Nagpur Route
Vadodara Route
Panvel Route
Panvel Route
Nagpur Route
Vadodara Route
Bhopal Route
Bhopal Route
7.9%11.6%
APSEZ Overall Heatmap
Heat Map : March’18
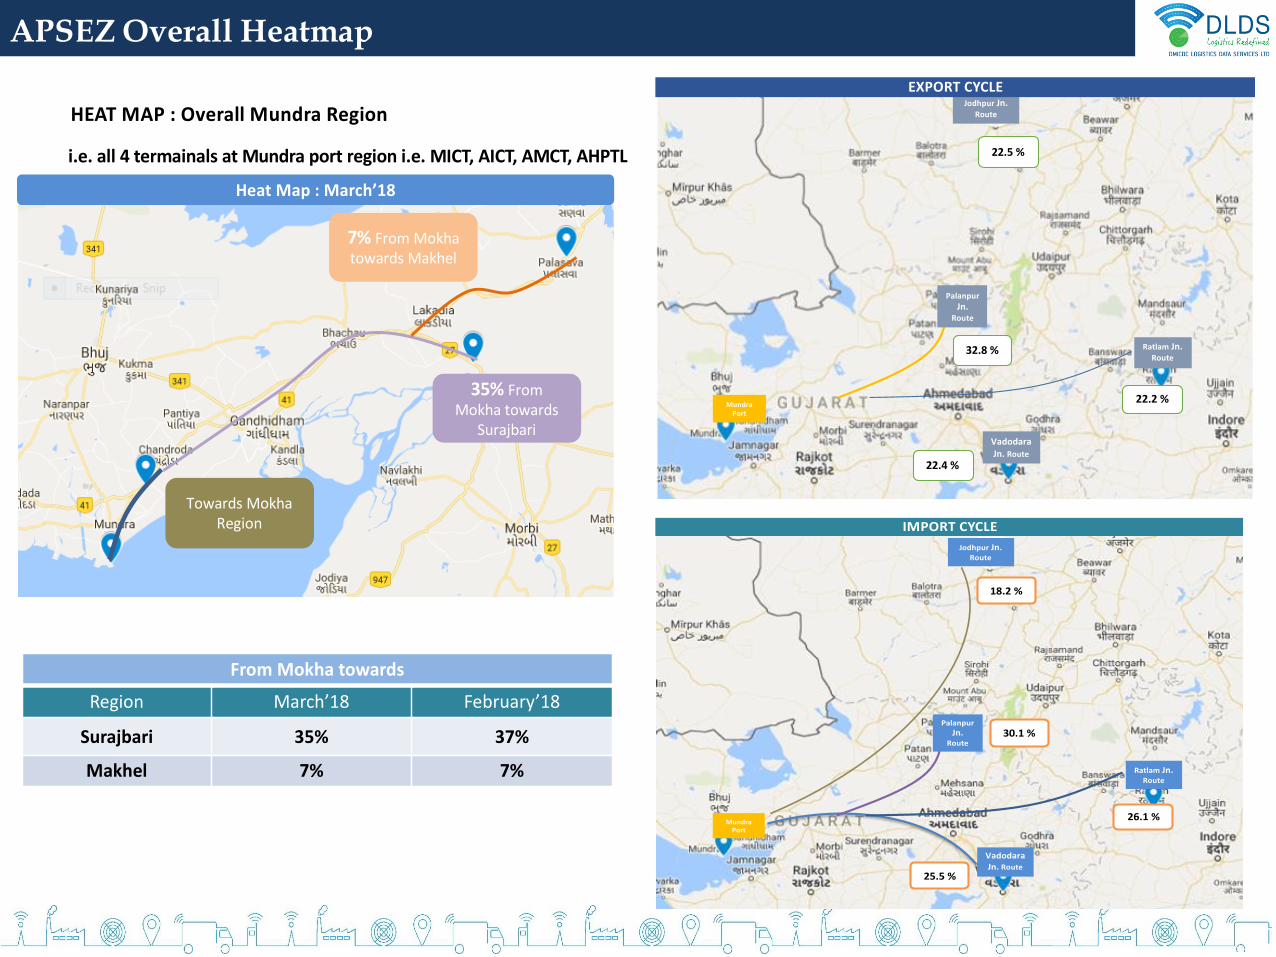
HEAT MAP : Overall Mundra Region
i.e. all 4 termainals at Mundra port region i.e. MICT, AICT, AMCT, AHPTL
Towards MokhaRegion
35% From Mokha towards
Surajbari
7% From Mokhatowards Makhel
From Mokha towards
Region March’18 February’18
Surajbari 35% 37%
Makhel 7% 7%
Mundra Port
Ratlam Jn. Route
Vadodara Jn. Route
Jodhpur Jn. Route
Palanpur
Jn. Route
22.5 %
22.2 %
32.8 %
22.4 %
EXPORT CYCLE
Mundra Port
Ratlam Jn. Route
Vadodara Jn. Route
Jodhpur Jn. Route
Palanpur
Jn. Route
18.2 %
26.1 %
30.1 %
25.5 %
IMPORT CYCLE
Toll Plaza Speed Analysis
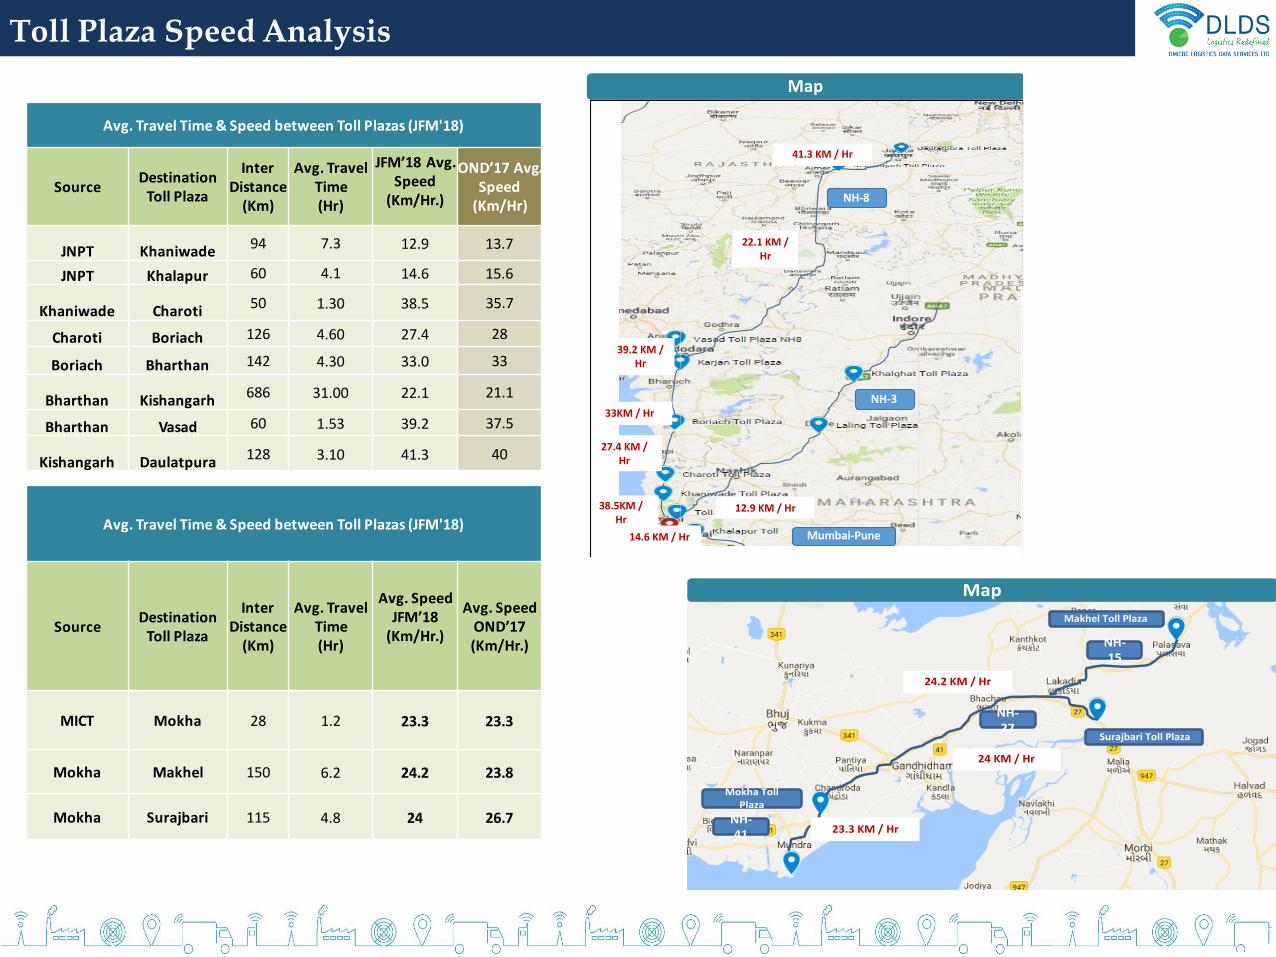
Avg. Travel Time & Speed between Toll Plazas (JFM'18)
Source Destination
Toll Plaza
Inter Distance
(Km)
Avg. Travel Time (Hr)
JFM’18 Avg.Speed
(Km/Hr.)
OND’17 Avg.Speed
(Km/Hr)
JNPT Khaniwade94 7.3 12.9 13.7
JNPT Khalapur 60 4.1 14.6 15.6
Khaniwade Charoti50 1.30 38.5 35.7
Charoti Boriach 126 4.60 27.4 28
Boriach Bharthan 142 4.30 33.0 33
Bharthan Kishangarh686 31.00 22.1 21.1
Bharthan Vasad 60 1.53 39.2 37.5
Kishangarh Daulatpura128 3.10 41.3 40
Mumbai-Pune
NH-3
NH-8
14.6 KM / Hr
12.9 KM / Hr38.5KM / Hr
27.4 KM / Hr
33KM / Hr
22.1 KM / Hr
39.2 KM / Hr
Map
41.3 KM / Hr
Avg. Travel Time & Speed between Toll Plazas (JFM'18)
Source Destination
Toll Plaza
Inter Distance
(Km)
Avg. Travel Time (Hr)
Avg. SpeedJFM’18
(Km/Hr.)
Avg. SpeedOND’17(Km/Hr.)
MICT Mokha 28 1.2 23.3 23.3
Mokha Makhel 150 6.2 24.2 23.8
Mokha Surajbari 115 4.8 24 26.7
Map
Mokha Toll Plaza
NH-41
Surajbari Toll Plaza
NH-27
Makhel Toll Plaza
NH-15
23.3 KM / Hr
24.2 KM / Hr
24 KM / Hr
PERFORMANCE TREND METRICS
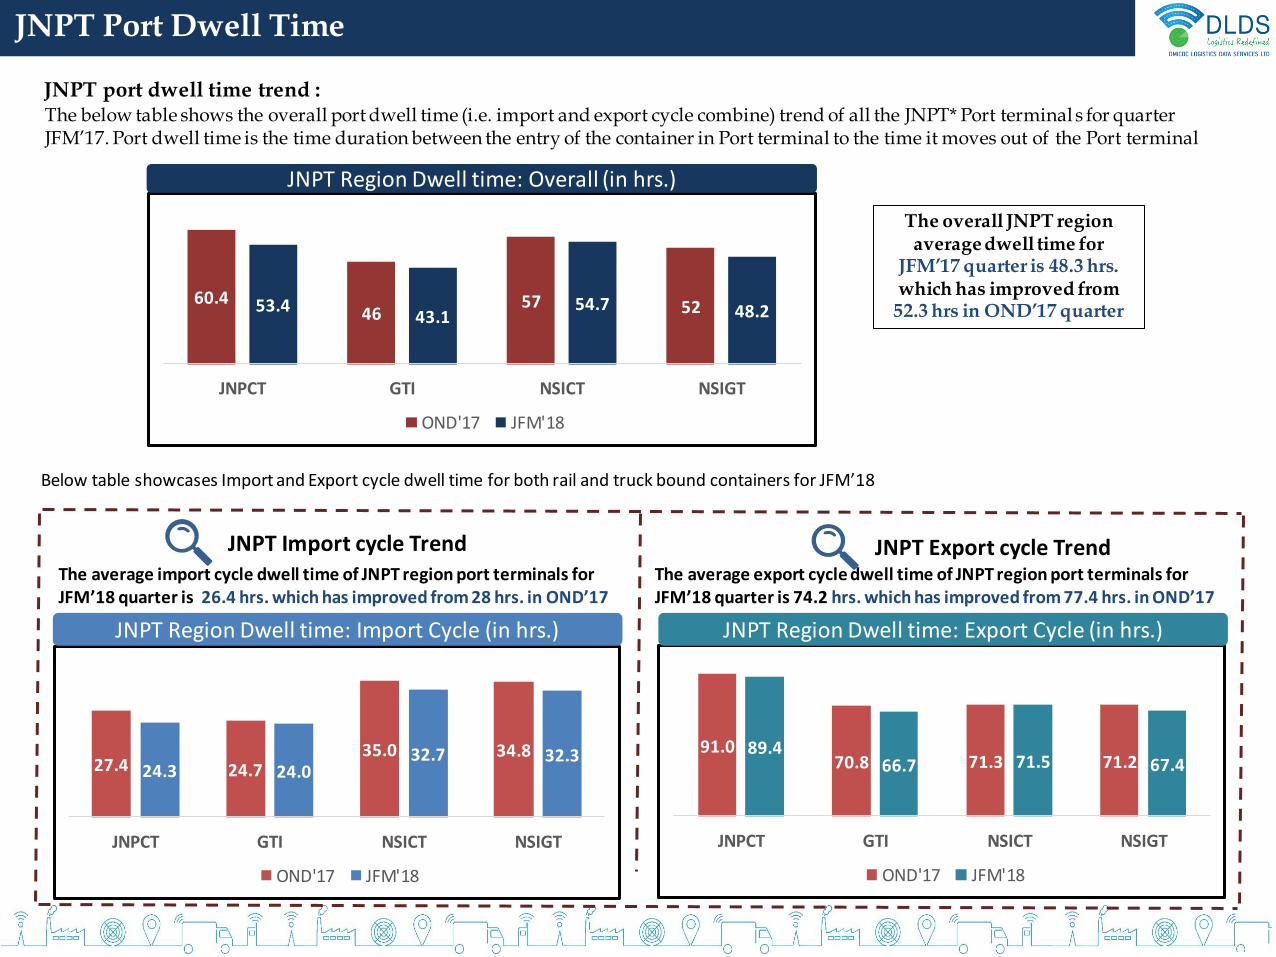
JNPT Port Dwell Time
60.446
57 5253.443.1
54.7 48.2
JNPCT GTI NSICT NSIGT
OND'17 JFM'18
JNPT Region Dwell time: Overall (in hrs.)
27.4 24.735.0 34.8
24.3 24.032.7 32.3
JNPCT GTI NSICT NSIGT
OND'17 JFM'18
The average import cycle dwell time of JNPT region port terminals for JFM’18 quarter is 26.4 hrs. which has improved from 28 hrs. in OND’17
JNPT Region Dwell time: Import Cycle (in hrs.)
91.070.8 71.3 71.2
89.466.7 71.5 67.4
JNPCT GTI NSICT NSIGT
OND'17 JFM'18
JNPT Region Dwell time: Export Cycle (in hrs.)
JNPT Import cycle Trend JNPT Export cycle Trend
JNPT port dwell time trend :The below table shows the overall port dwell time (i.e. import and export cycle combine) trend of all the JNPT* Port terminal s for quarter JFM’17. Port dwell time is the time duration between the entry of the container in Port terminal to the time it moves out of the Port terminal
Below table showcases Import and Export cycle dwell time for both rail and truck bound containers for JFM’18
The average export cycle dwell time of JNPT region port terminals for JFM’18 quarter is 74.2 hrs. which has improved from 77.4 hrs. in OND’17
The overall JNPT region average dwell time for
JFM’17 quarter is 48.3 hrs. which has improved from
52.3 hrs in OND’17 quarter
60.4
53.4
JNPCT
OND'17 JFM'18
JNPCT Terminal Dwell time: Overall (in hrs.)
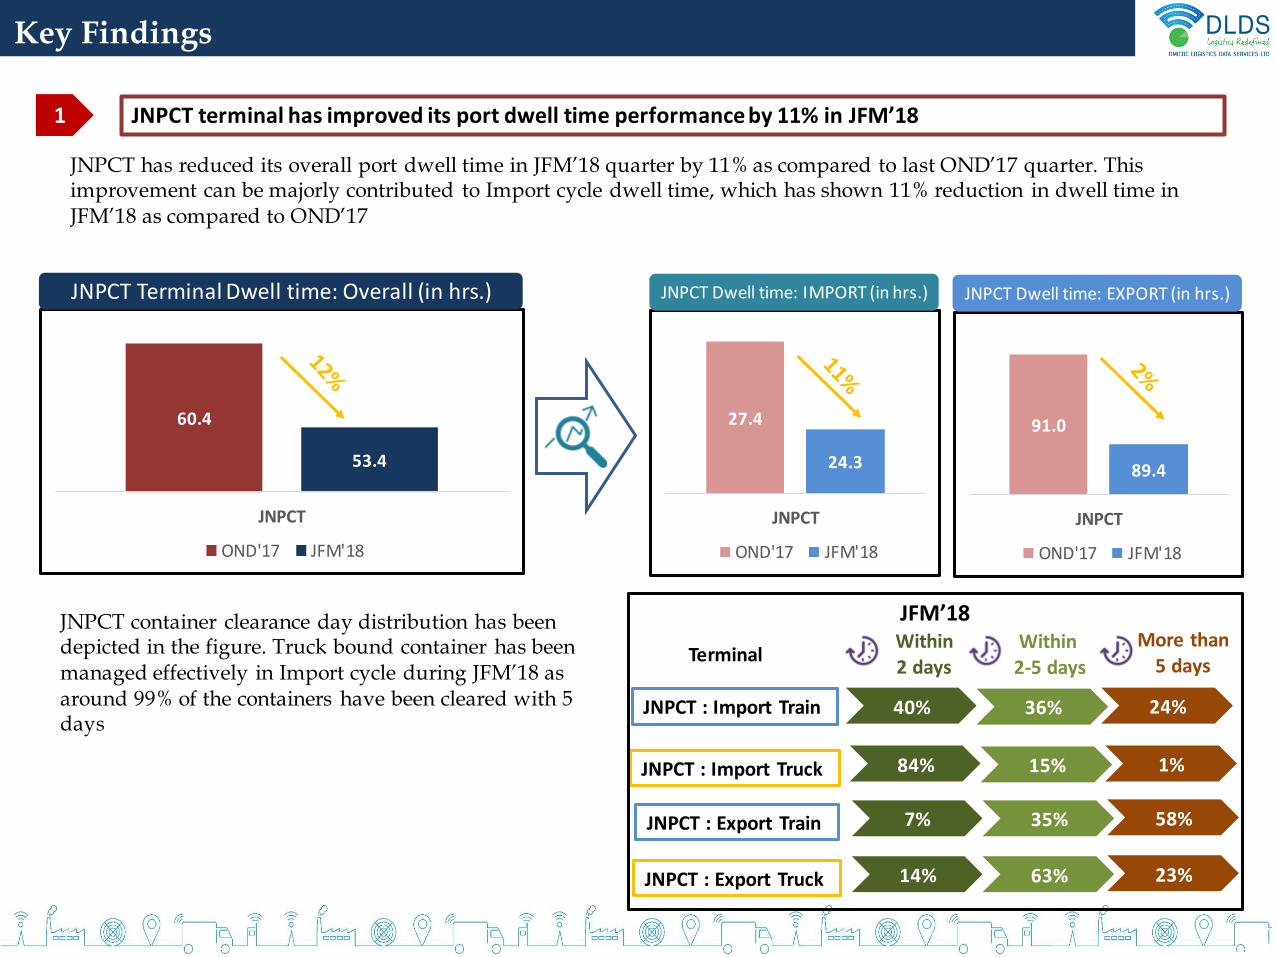
JNPCT terminal has improved its port dwell time performance by 11% in JFM’181
JNPCT has reduced its overall port dwell time in JFM’18 quarter by 11% as compared to last OND’17 quarter. This improvement can be majorly contributed to Import cycle dwell time, which has shown 11% reduction in dwell time in JFM’18 as compared to OND’17
40% 36% 24%JNPCT : Import Train
More than5 days
Within2-5 days
Within 2 days
JNPCT : Import Truck 84% 15% 1%
JNPCT : Export Train 7% 35% 58%
JNPCT : Export Truck 14% 63% 23%
JFM’18
Terminal
JNPCT container clearance day distribution has been depicted in the figure. Truck bound container has been managed effectively in Import cycle during JFM’18 as around 99% of the containers have been cleared with 5 days
Key Findings
27.4
24.3
JNPCT
OND'17 JFM'18
JNPCT Dwell time: IMPORT (in hrs.)
91.0
89.4
JNPCT
OND'17 JFM'18
JNPCT Dwell time: EXPORT (in hrs.)
Truck v/s Train traffic handled
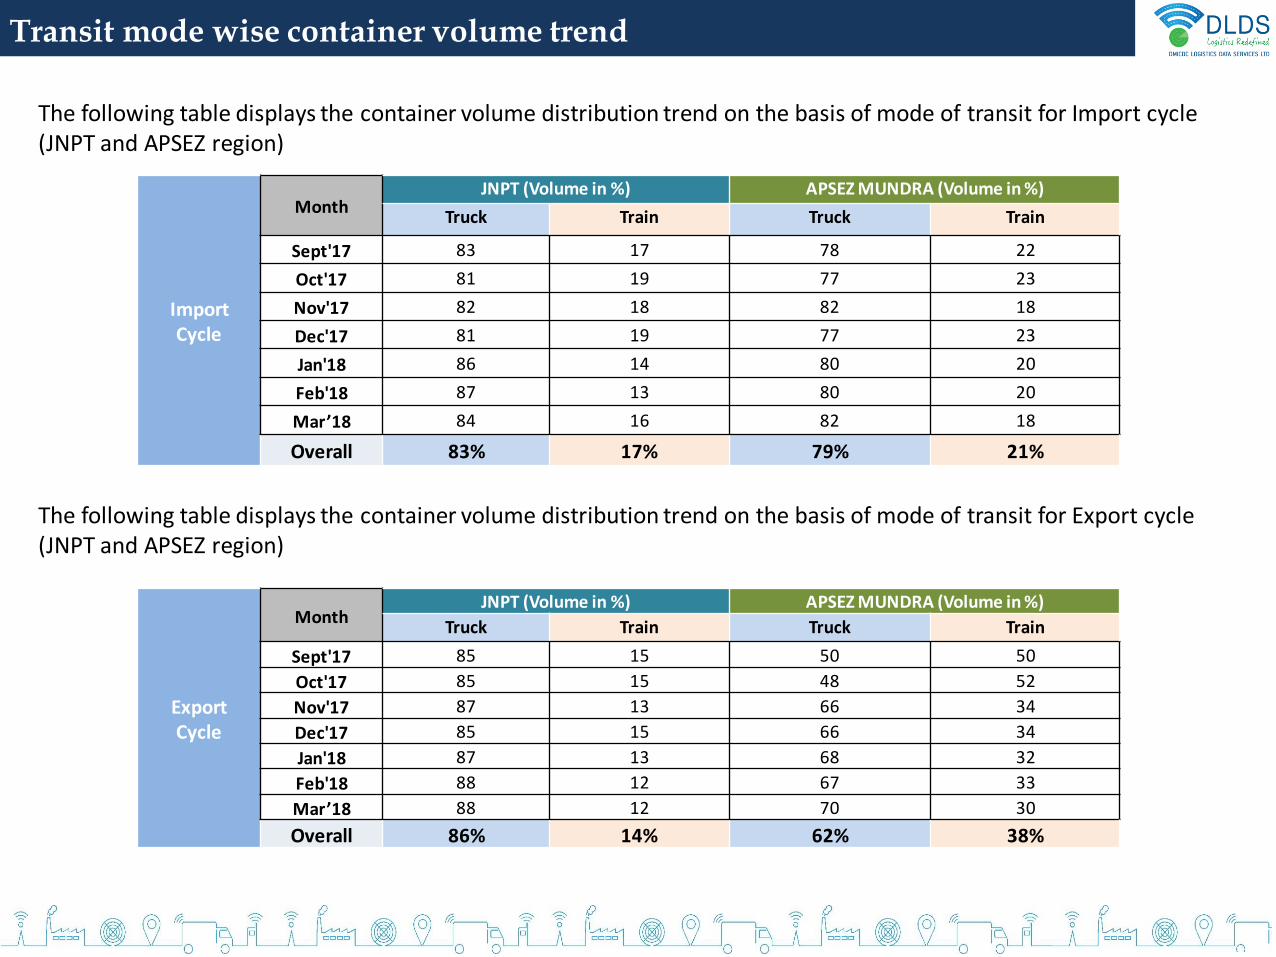
Transit mode wise container volume trend
The following table displays the container volume distribution trend on the basis of mode of transit for Import cycle (JNPT and APSEZ region)
The following table displays the container volume distribution trend on the basis of mode of transit for Export cycle (JNPT and APSEZ region)
ImportCycle
MonthJNPT (Volume in %) APSEZ MUNDRA (Volume in %)
Truck Train Truck Train
Sept'17 83 17 78 22
Oct'17 81 19 77 23
Nov'17 82 18 82 18
Dec'17 81 19 77 23
Jan'18 86 14 80 20
Feb'18 87 13 80 20
Mar’18 84 16 82 18
Overall 83% 17% 79% 21%
ExportCycle
MonthJNPT (Volume in %) APSEZ MUNDRA (Volume in %)
Truck Train Truck Train
Sept'17 85 15 50 50
Oct'17 85 15 48 52
Nov'17 87 13 66 34
Dec'17 85 15 66 34
Jan'18 87 13 68 32
Feb'18 88 12 67 33
Mar’18 88 12 70 30
Overall 86% 14% 62% 38%
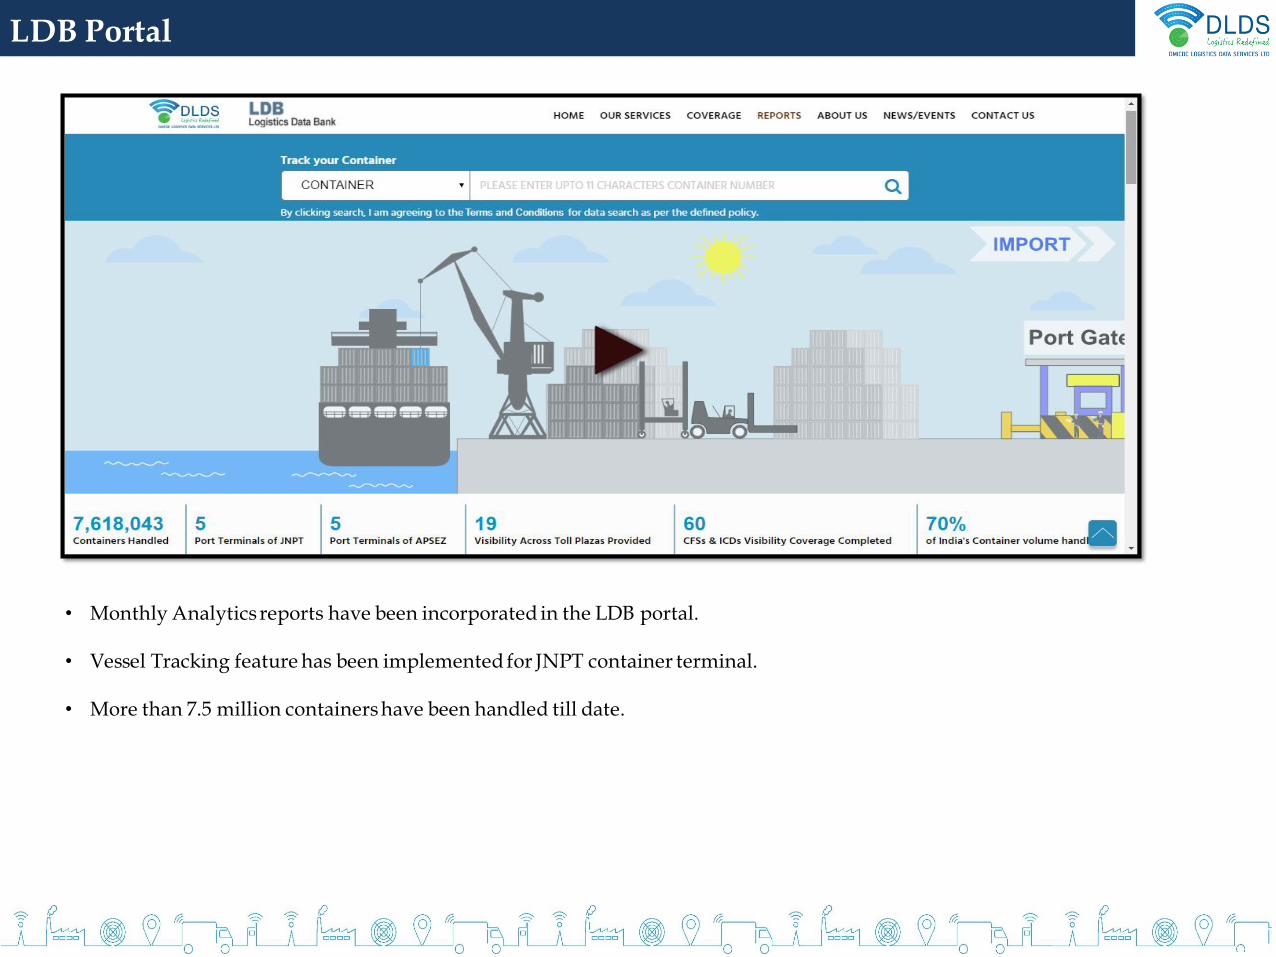
LDB Portal
• Monthly Analytics reports have been incorporated in the LDB portal.
• Vessel Tracking feature has been implemented for JNPT container terminal.
• More than 7.5 million containers have been handled till date.
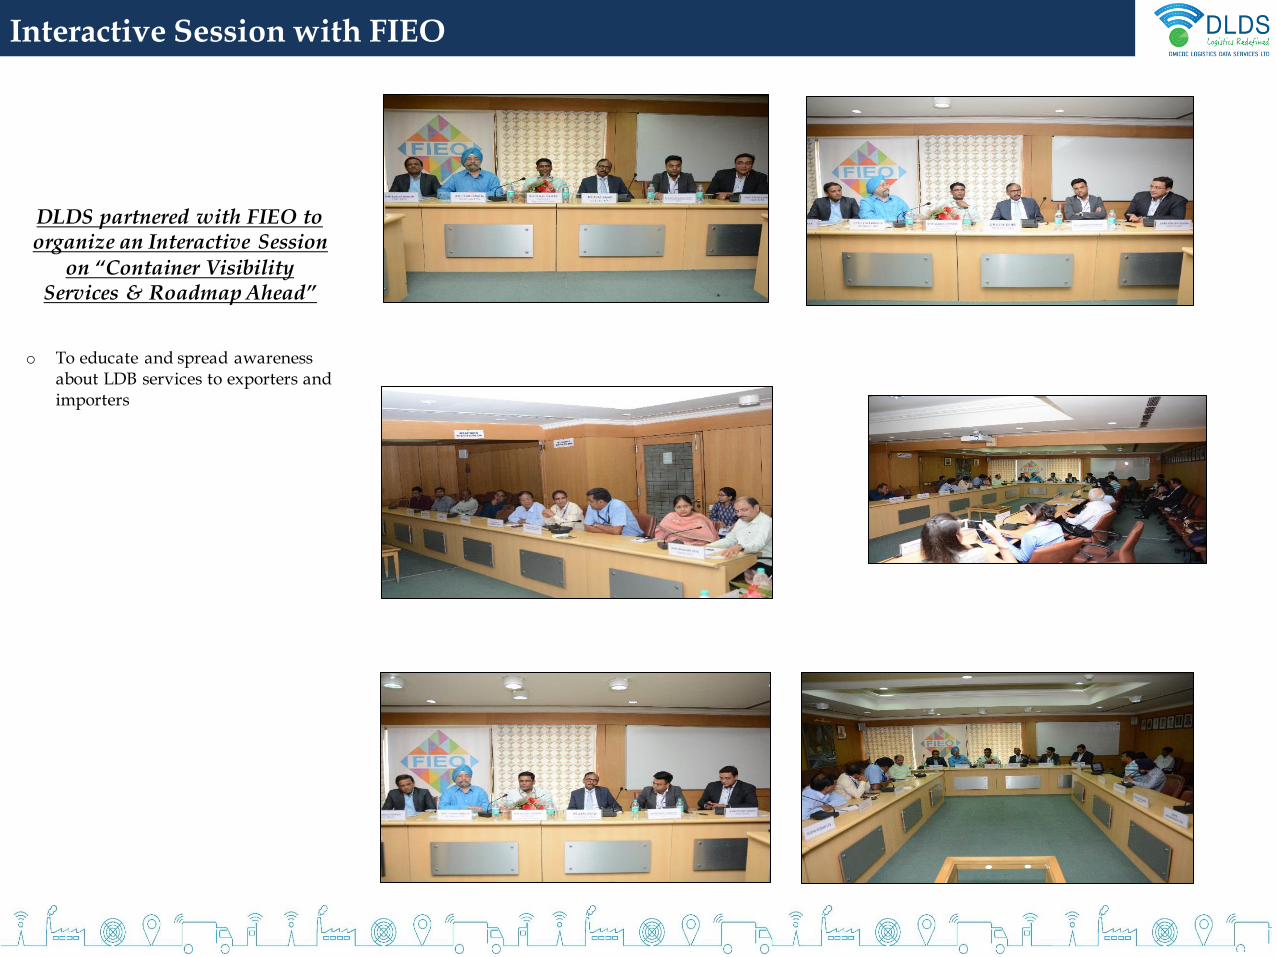
Interactive Session with FIEO
DLDS partnered with FIEO to organize an Interactive Session
on “Container Visibility Services & Roadmap Ahead”
o To educate and spread awareness about LDB services to exporters and importers
ANNEXURE
JNPT REGION :TRADE PERFORMANCE
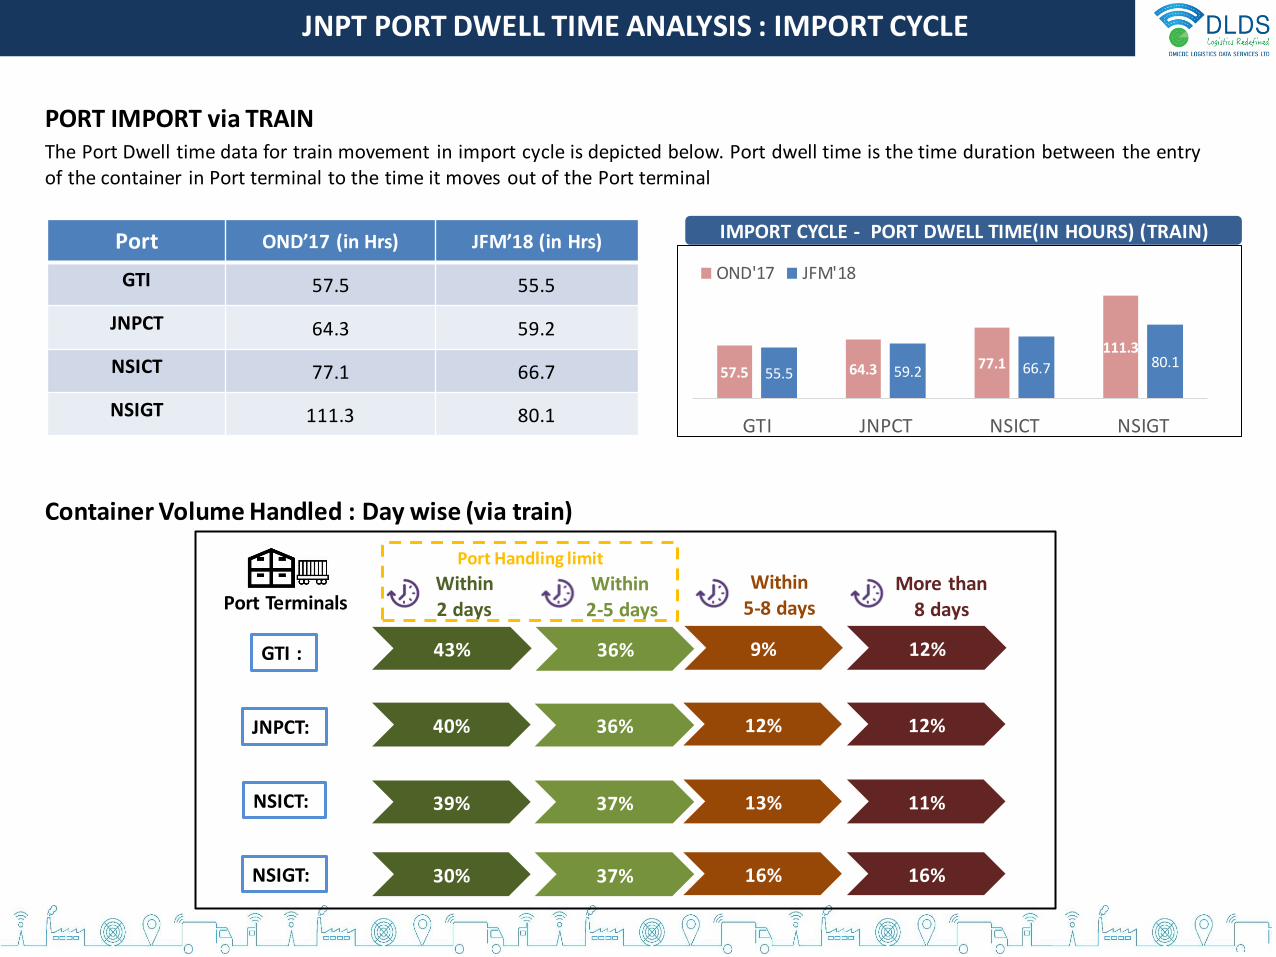
JNPT PORT DWELL TIME ANALYSIS : IMPORT CYCLE
The Port Dwell time data for train movement in import cycle is depicted below. Port dwell time is the time duration between the entry of the container in Port terminal to the time it moves out of the Port terminal
Port OND’17 (in Hrs) JFM’18 (in Hrs)
GTI 57.5 55.5
JNPCT 64.3 59.2
NSICT 77.1 66.7
NSIGT 111.3 80.1
PORT IMPORT via TRAIN
57.5 64.3 77.1111.3
55.5 59.2 66.7 80.1
GTI JNPCT NSICT NSIGT
OND'17 JFM'18
IMPORT CYCLE - PORT DWELL TIME(IN HOURS) (TRAIN)
Container Volume Handled : Day wise (via train)
43% 36% 9% 12%GTI :
JNPCT:
NSICT:
NSIGT:
More than 8 days
Within 5-8 days
Within2-5 days
Within 2 daysPort Terminals
Port Handling limit
40% 36% 12% 12%
39% 37% 13% 11%
30% 37% 16% 16%
JNPT PORT DWELL TIME ANALYSIS : IMPORT CYCLE
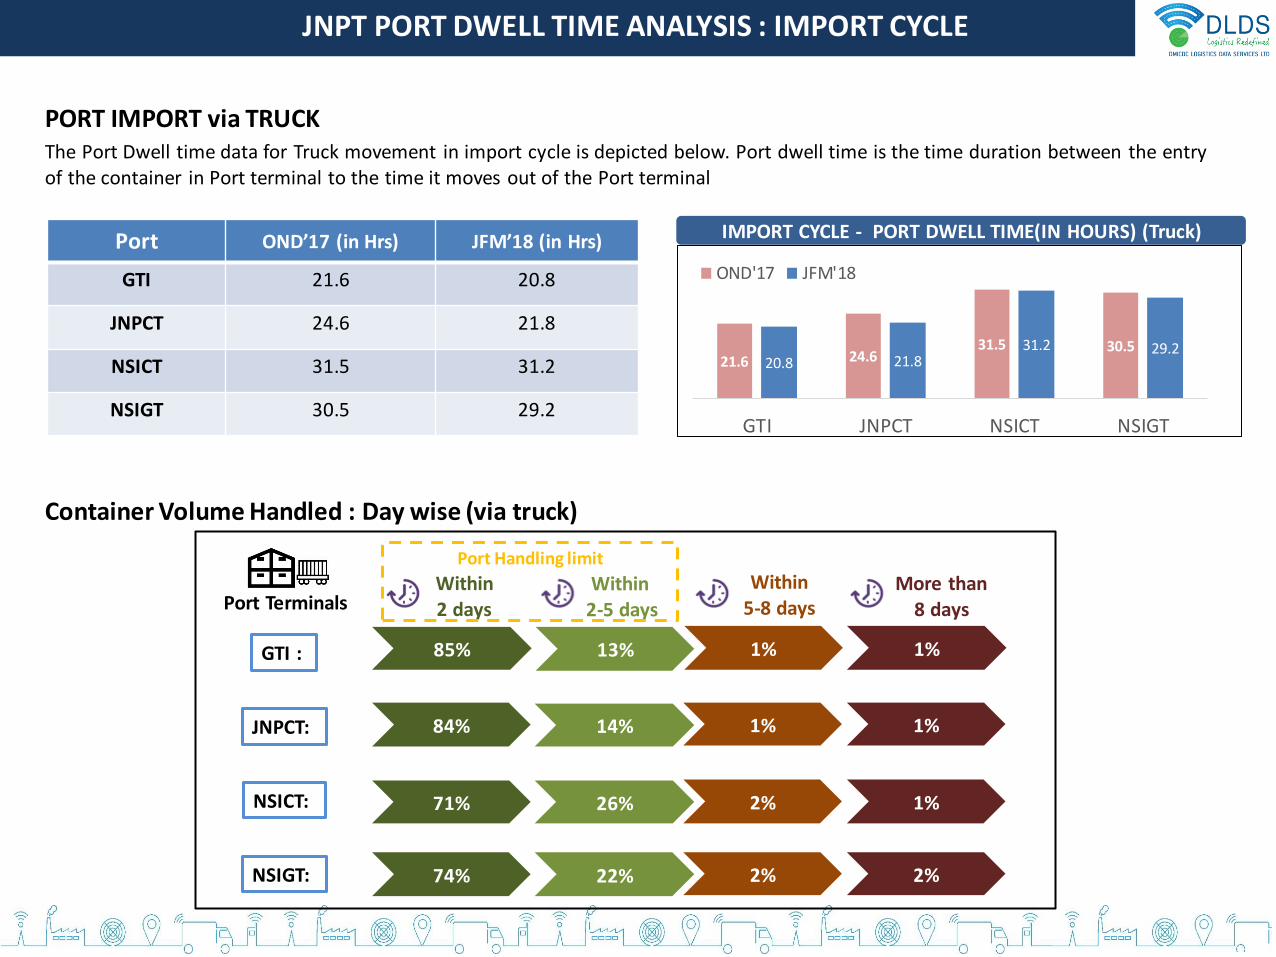
The Port Dwell time data for Truck movement in import cycle is depicted below. Port dwell time is the time duration between the entry of the container in Port terminal to the time it moves out of the Port terminal
PORT IMPORT via TRUCK
IMPORT CYCLE - PORT DWELL TIME(IN HOURS) (Truck)Port OND’17 (in Hrs) JFM’18 (in Hrs)
GTI 21.6 20.8
JNPCT 24.6 21.8
NSICT 31.5 31.2
NSIGT 30.5 29.2
Container Volume Handled : Day wise (via truck)
85% 13% 1% 1%GTI :
JNPCT:
NSICT:
NSIGT:
More than 8 days
Within 5-8 days
Within2-5 days
Within 2 daysPort Terminals
Port Handling limit
84% 14% 1% 1%
71% 26% 2% 1%
74% 22% 2% 2%
21.6 24.631.5 30.5
20.8 21.831.2 29.2
GTI JNPCT NSICT NSIGT
OND'17 JFM'18
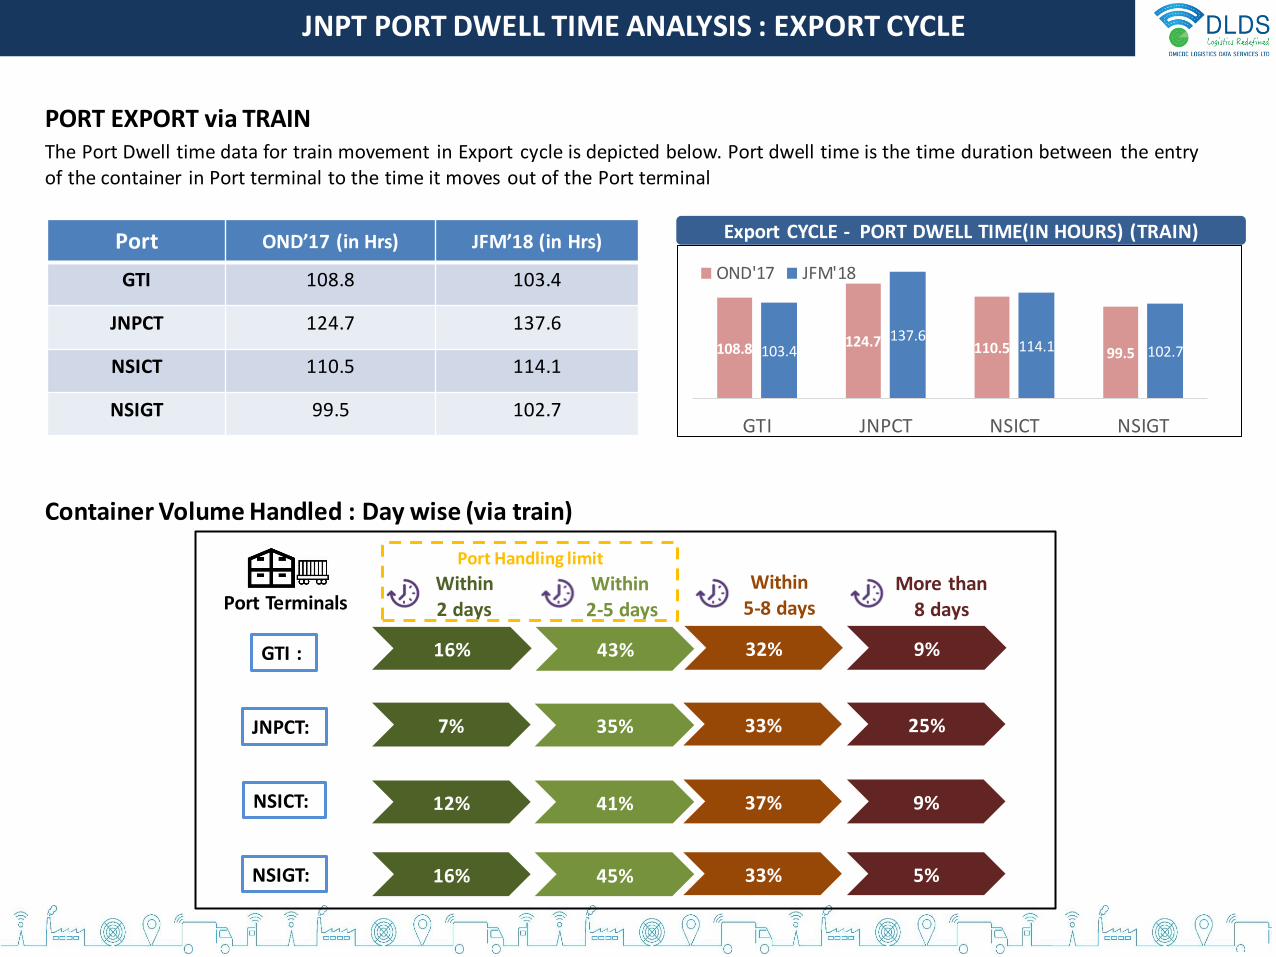
JNPT PORT DWELL TIME ANALYSIS : EXPORT CYCLE
The Port Dwell time data for train movement in Export cycle is depicted below. Port dwell time is the time duration between the entry of the container in Port terminal to the time it moves out of the Port terminal
PORT EXPORT via TRAIN
Export CYCLE - PORT DWELL TIME(IN HOURS) (TRAIN)Port OND’17 (in Hrs) JFM’18 (in Hrs)
GTI 108.8 103.4
JNPCT 124.7 137.6
NSICT 110.5 114.1
NSIGT 99.5 102.7
Container Volume Handled : Day wise (via train)
16% 43% 32% 9%GTI :
JNPCT:
NSICT:
NSIGT:
More than 8 days
Within 5-8 days
Within2-5 days
Within 2 daysPort Terminals
Port Handling limit
7% 35% 33% 25%
12% 41% 37% 9%
16% 45% 33% 5%
108.8 124.7 110.5 99.5103.4137.6
114.1 102.7
GTI JNPCT NSICT NSIGT
OND'17 JFM'18
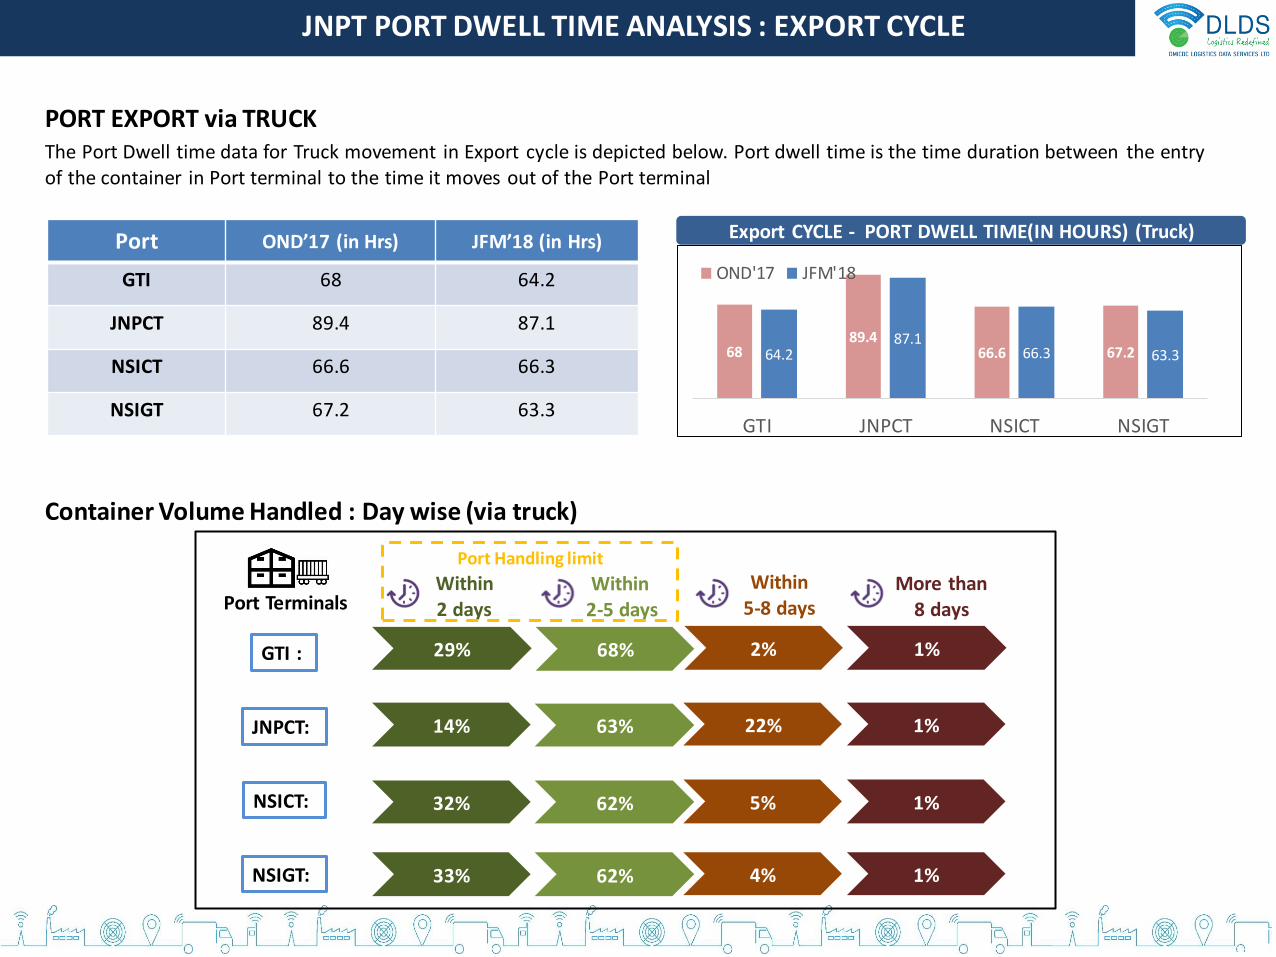
The Port Dwell time data for Truck movement in Export cycle is depicted below. Port dwell time is the time duration between the entry of the container in Port terminal to the time it moves out of the Port terminal
Export CYCLE - PORT DWELL TIME(IN HOURS) (Truck)
JNPT PORT DWELL TIME ANALYSIS : EXPORT CYCLE
PORT EXPORT via TRUCK
Port OND’17 (in Hrs) JFM’18 (in Hrs)
GTI 68 64.2
JNPCT 89.4 87.1
NSICT 66.6 66.3
NSIGT 67.2 63.3
Container Volume Handled : Day wise (via truck)
29% 68% 2% 1%GTI :
JNPCT:
NSICT:
NSIGT:
More than 8 days
Within 5-8 days
Within2-5 days
Within 2 daysPort Terminals
Port Handling limit
14% 63% 22% 1%
32% 62% 5% 1%
33% 62% 4% 1%
6889.4
66.6 67.264.287.1
66.3 63.3
GTI JNPCT NSICT NSIGT
OND'17 JFM'18
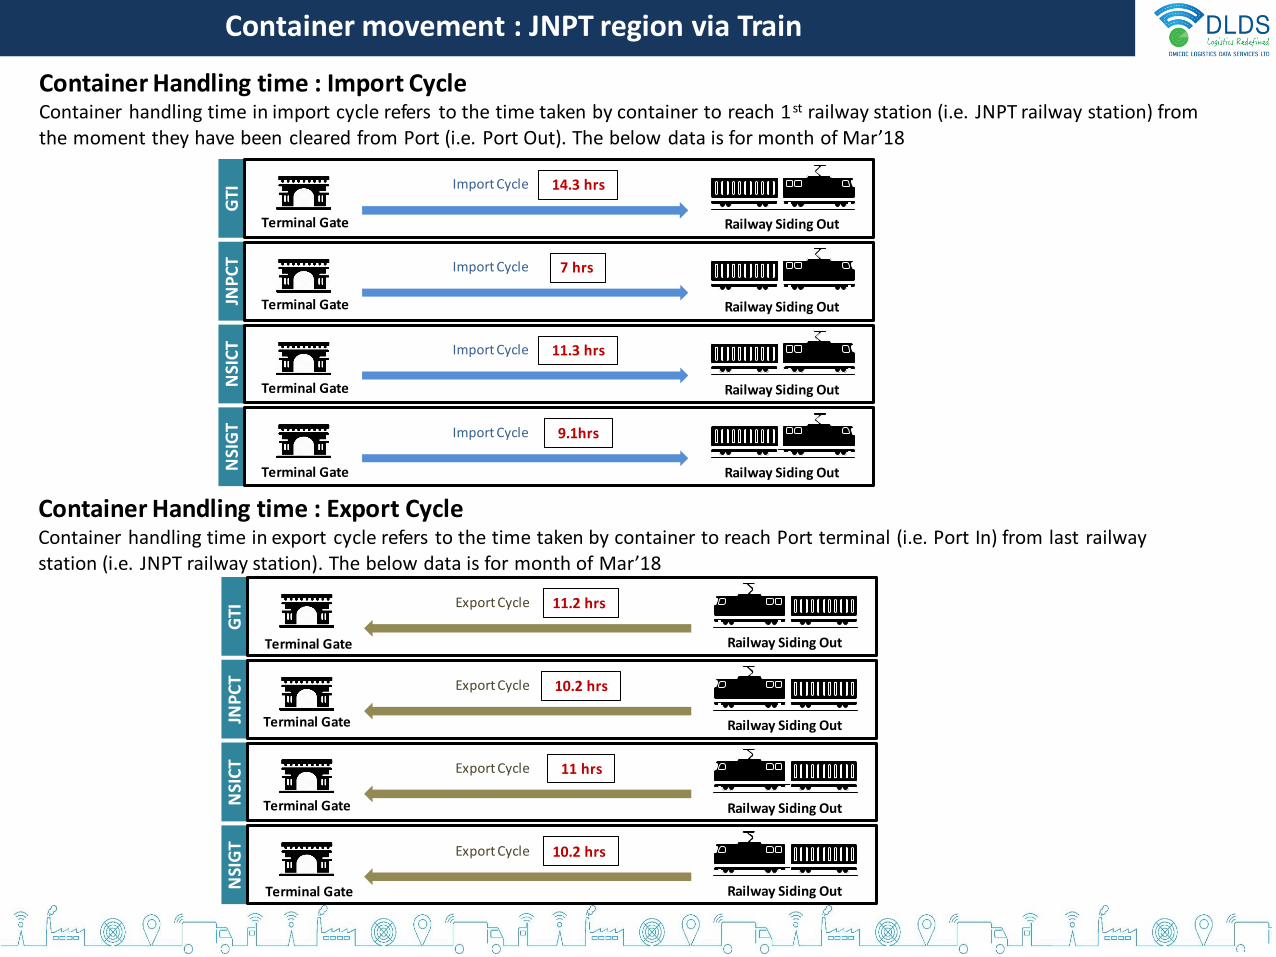
Container movement : JNPT region via Train
Container Handling time : Import Cycle Container handling time in import cycle refers to the time taken by container to reach 1st railway station (i.e. JNPT railway station) from the moment they have been cleared from Port (i.e. Port Out). The below data is for month of Mar’18
Terminal Gate Railway Siding OutG
TI
14.3 hrs Import Cycle
Railway Siding OutJNP
CT 7 hrs Import Cycle
Railway Siding OutNSI
CT 11.3 hrs Import Cycle
Railway Siding OutNSI
GT 9.1hrs Import Cycle
Railway Siding Out
GTI
11.2 hrs Export Cycle
Railway Siding OutJNP
CT 10.2 hrs Export Cycle
Railway Siding OutNSI
CT 11 hrs Export Cycle
Railway Siding OutNSI
GT 10.2 hrs Export Cycle
Terminal Gate
Terminal Gate
Terminal Gate
Terminal Gate
Terminal Gate
Terminal Gate
Terminal Gate
Container Handling time : Export Cycle Container handling time in export cycle refers to the time taken by container to reach Port terminal (i.e. Port In) from last railway station (i.e. JNPT railway station). The below data is for month of Mar’18
ICD ANALYSIS : DWELL TIME
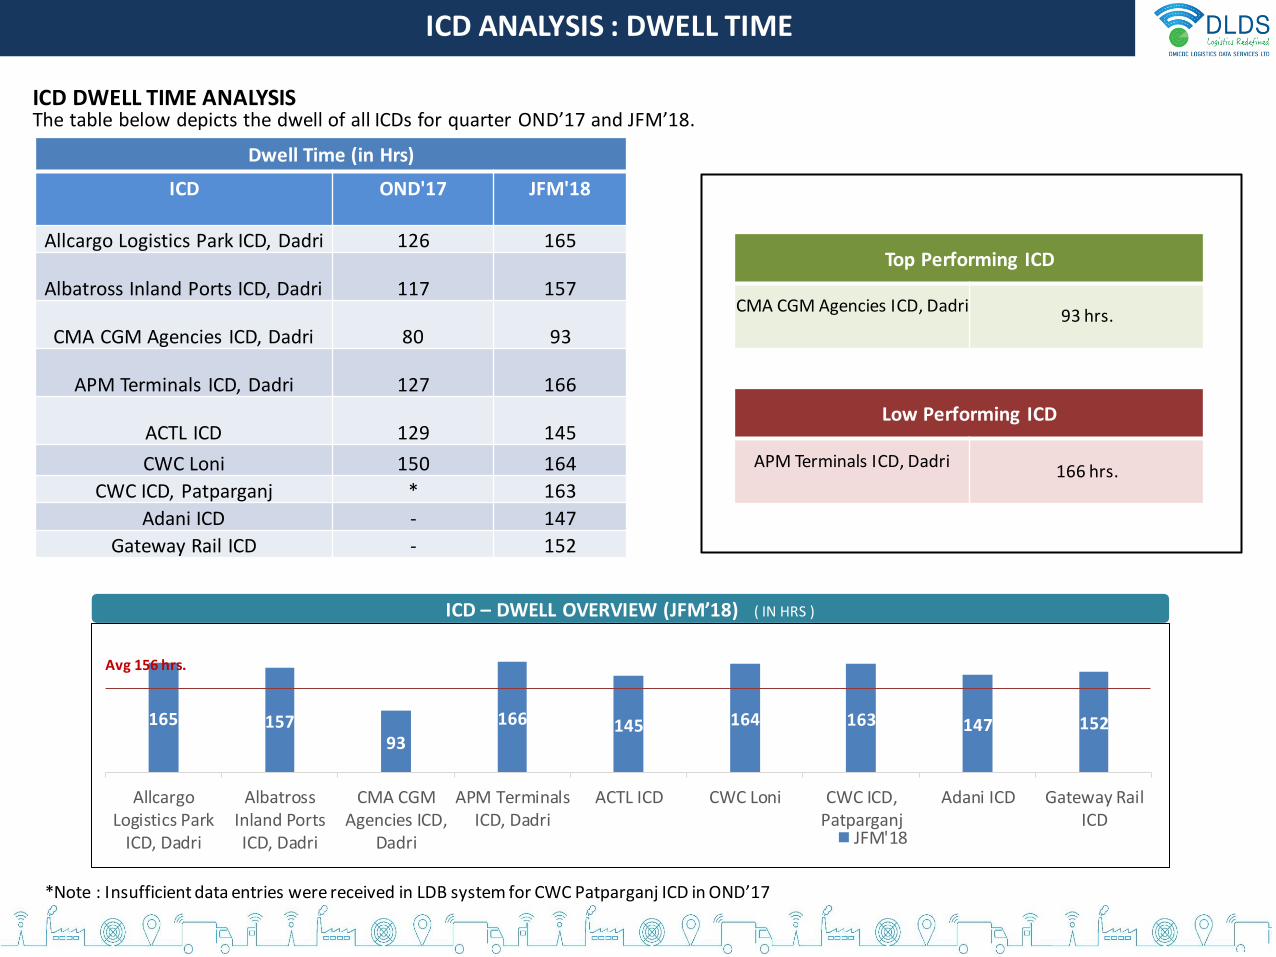
Dwell Time (in Hrs)
ICD OND'17 JFM'18
Allcargo Logistics Park ICD, Dadri 126 165
Albatross Inland Ports ICD, Dadri 117 157
CMA CGM Agencies ICD, Dadri 80 93
APM Terminals ICD, Dadri 127 166
ACTL ICD 129 145
CWC Loni 150 164
CWC ICD, Patparganj * 163
Adani ICD - 147
Gateway Rail ICD - 152
The table below depicts the dwell of all ICDs for quarter OND’17 and JFM’18.ICD DWELL TIME ANALYSIS
ICD – DWELL OVERVIEW (JFM’18) ( IN HRS )
165 15793
166 145 164 163 147 152
AllcargoLogistics Park
ICD, Dadri
AlbatrossInland PortsICD, Dadri
CMA CGMAgencies ICD,
Dadri
APM TerminalsICD, Dadri
ACTL ICD CWC Loni CWC ICD,Patparganj
Adani ICD Gateway RailICD
JFM'18
Avg 156 hrs.
Top Performing ICD
CMA CGM Agencies ICD, Dadri93 hrs.
Low Performing ICD
APM Terminals ICD, Dadri166 hrs.
*Note : Insufficient data entries were received in LDB system for CWC Patparganj ICD in OND’17
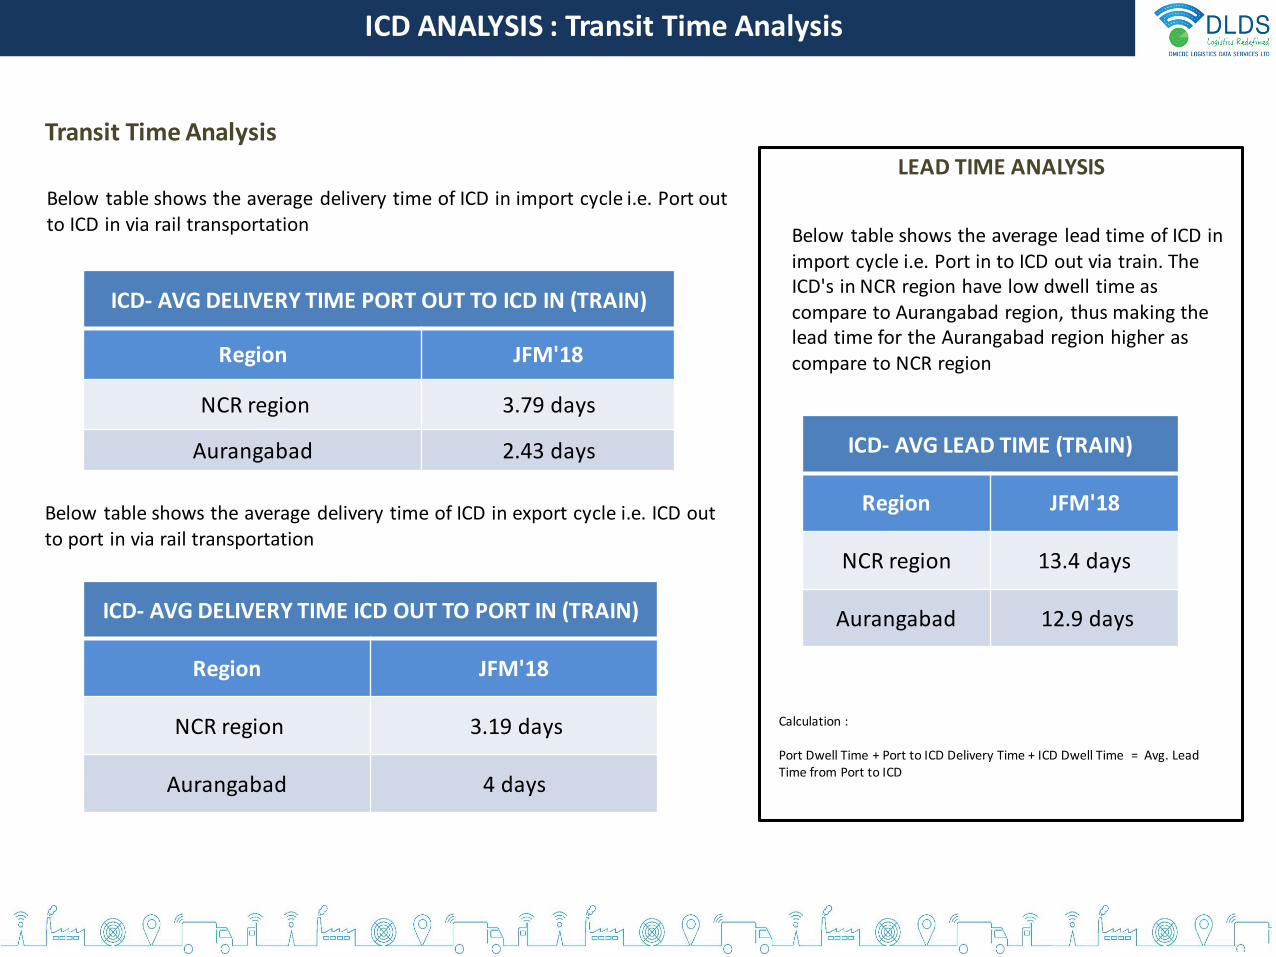
LEAD TIME ANALYSIS
ICD ANALYSIS : Transit Time Analysis
ICD- AVG DELIVERY TIME PORT OUT TO ICD IN (TRAIN)
Region JFM'18
NCR region 3.79 days
Aurangabad 2.43 days
ICD- AVG DELIVERY TIME ICD OUT TO PORT IN (TRAIN)
Region JFM'18
NCR region 3.19 days
Aurangabad 4 days
Below table shows the average delivery time of ICD in import cycle i.e. Port out to ICD in via rail transportation
Below table shows the average delivery time of ICD in export cycle i.e. ICD out to port in via rail transportation
Transit Time Analysis
ICD- AVG LEAD TIME (TRAIN)
Region JFM'18
NCR region 13.4 days
Aurangabad 12.9 days
Below table shows the average lead time of ICD in import cycle i.e. Port in to ICD out via train. The ICD's in NCR region have low dwell time as compare to Aurangabad region, thus making the lead time for the Aurangabad region higher as compare to NCR region
Calculation :
Port Dwell Time + Port to ICD Delivery Time + ICD Dwell Time = Avg. Lead Time from Port to ICD
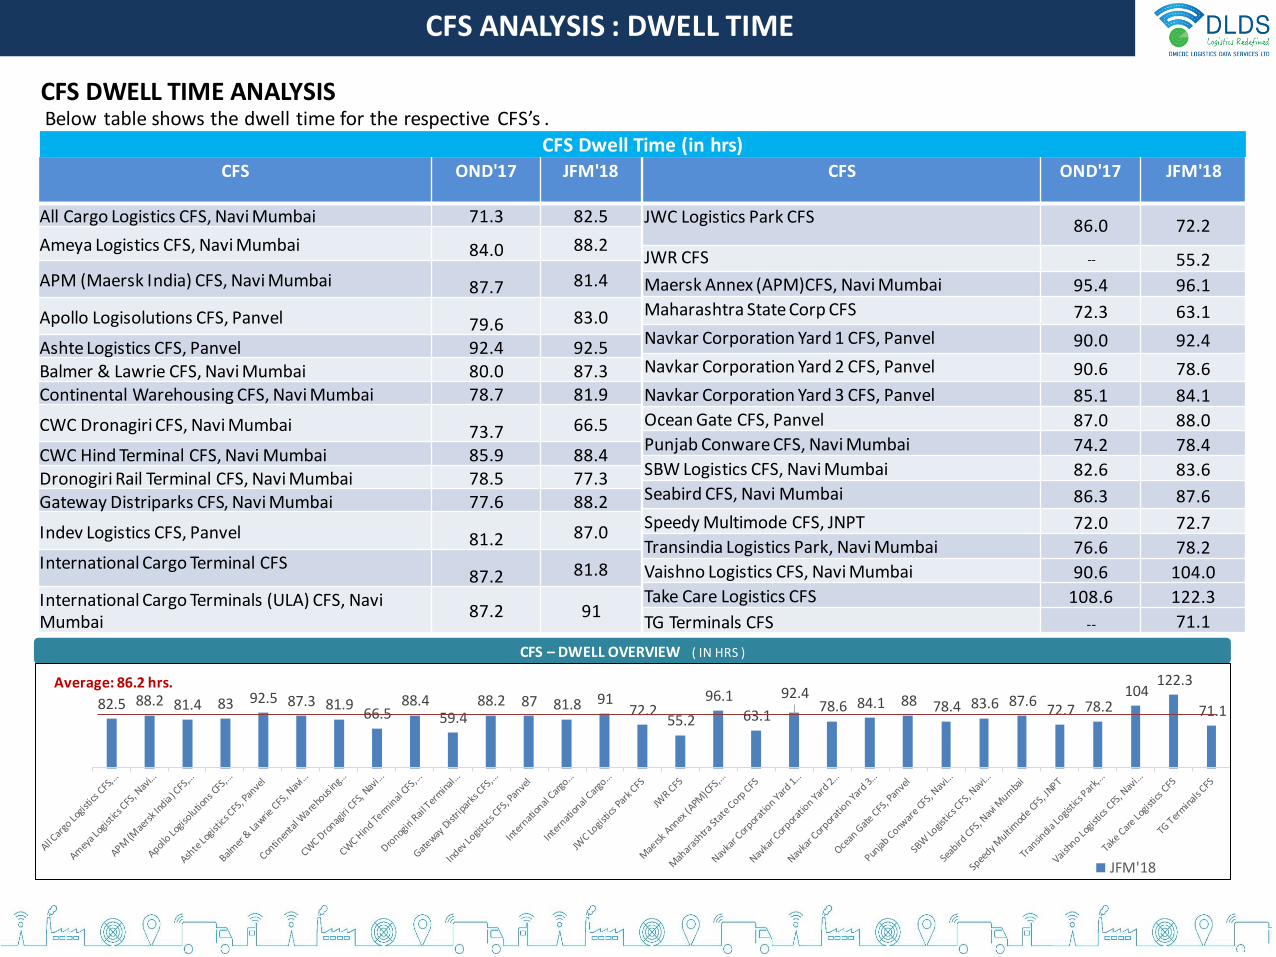
CFS ANALYSIS : DWELL TIME
CFS OND'17 JFM'18
All Cargo Logistics CFS, Navi Mumbai 71.3 82.5
Ameya Logistics CFS, Navi Mumbai 84.0 88.2
APM (Maersk India) CFS, Navi Mumbai 87.7 81.4
Apollo Logisolutions CFS, Panvel 79.6 83.0
Ashte Logistics CFS, Panvel 92.4 92.5Balmer & Lawrie CFS, Navi Mumbai 80.0 87.3Continental Warehousing CFS, Navi Mumbai 78.7 81.9
CWC Dronagiri CFS, Navi Mumbai 73.7 66.5
CWC Hind Terminal CFS, Navi Mumbai 85.9 88.4Dronogiri Rail Terminal CFS, Navi Mumbai 78.5 77.3Gateway Distriparks CFS, Navi Mumbai 77.6 88.2
Indev Logistics CFS, Panvel 81.2 87.0
International Cargo Terminal CFS87.2 81.8
International Cargo Terminals (ULA) CFS, NaviMumbai
87.2 91
Below table shows the dwell time for the respective CFS’s .
CFS OND'17 JFM'18
JWC Logistics Park CFS 86.0 72.2
JWR CFS -- 55.2
Maersk Annex (APM)CFS, Navi Mumbai 95.4 96.1
Maharashtra State Corp CFS 72.3 63.1
Navkar Corporation Yard 1 CFS, Panvel 90.0 92.4
Navkar Corporation Yard 2 CFS, Panvel 90.6 78.6
Navkar Corporation Yard 3 CFS, Panvel 85.1 84.1
Ocean Gate CFS, Panvel 87.0 88.0
Punjab Conware CFS, Navi Mumbai 74.2 78.4
SBW Logistics CFS, Navi Mumbai 82.6 83.6
Seabird CFS, Navi Mumbai 86.3 87.6
Speedy Multimode CFS, JNPT 72.0 72.7
Transindia Logistics Park, Navi Mumbai 76.6 78.2
Vaishno Logistics CFS, Navi Mumbai 90.6 104.0
Take Care Logistics CFS 108.6 122.3
TG Terminals CFS -- 71.1
CFS Dwell Time (in hrs)
CFS DWELL TIME ANALYSIS
CFS – DWELL OVERVIEW ( IN HRS )
82.5 88.2 81.4 83 92.5 87.3 81.966.5
88.459.4
88.2 87 81.8 9172.2
55.2
96.163.1
92.478.6 84.1 88 78.4 83.6 87.6
72.7 78.2104
122.3
71.1
JFM'18
Average: 86.2 hrs.
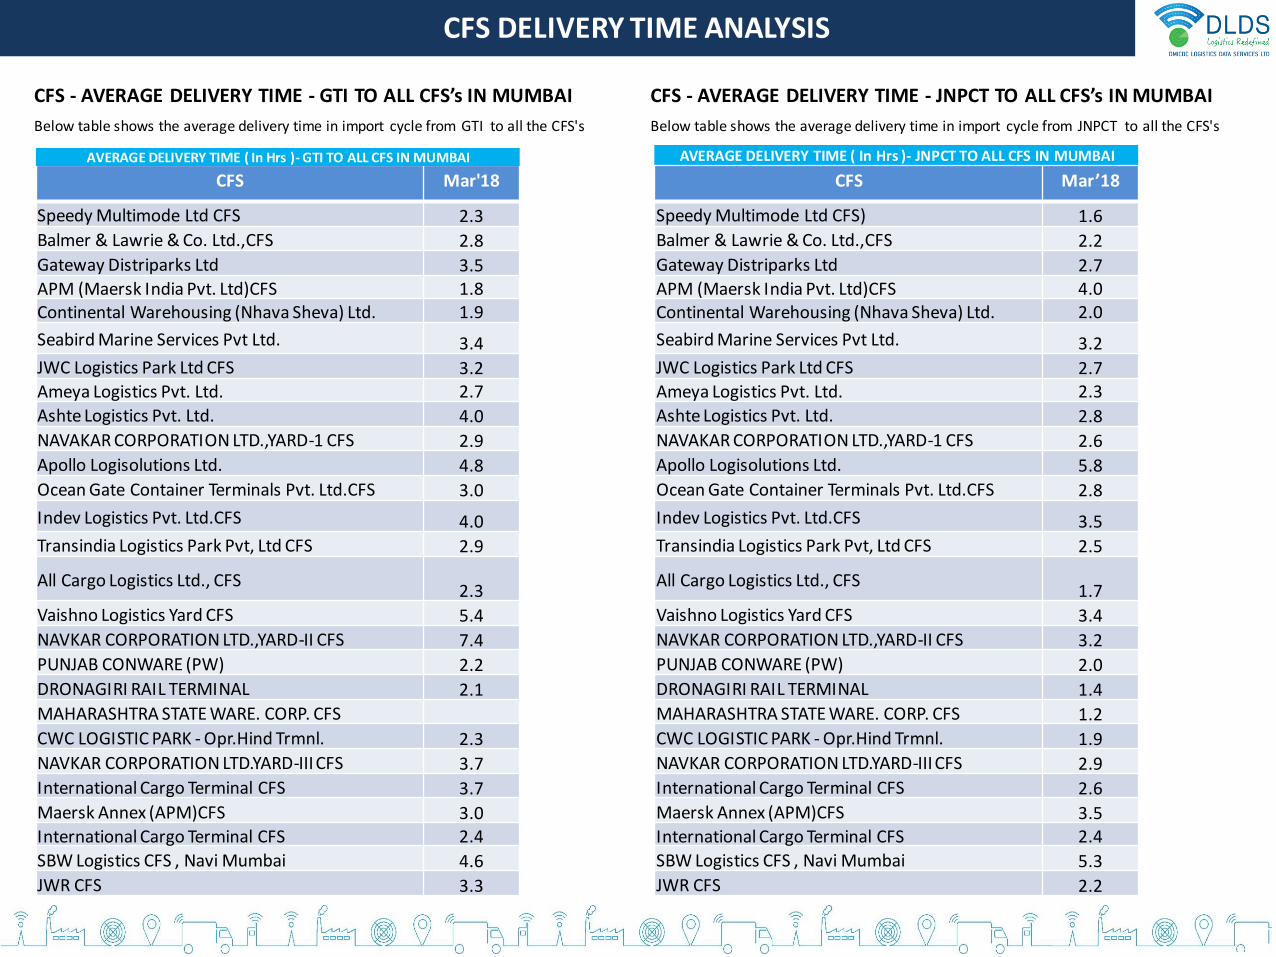
CFS DELIVERY TIME ANALYSIS
CFS - AVERAGE DELIVERY TIME - GTI TO ALL CFS’s IN MUMBAI
CFS Mar'18
Speedy Multimode Ltd CFS 2.3
Balmer & Lawrie & Co. Ltd.,CFS 2.8
Gateway Distriparks Ltd 3.5APM (Maersk India Pvt. Ltd)CFS 1.8Continental Warehousing (Nhava Sheva) Ltd. 1.9
Seabird Marine Services Pvt Ltd. 3.4
JWC Logistics Park Ltd CFS 3.2Ameya Logistics Pvt. Ltd. 2.7
Ashte Logistics Pvt. Ltd. 4.0
NAVAKAR CORPORATION LTD.,YARD-1 CFS 2.9
Apollo Logisolutions Ltd. 4.8
Ocean Gate Container Terminals Pvt. Ltd.CFS 3.0
Indev Logistics Pvt. Ltd.CFS 4.0
Transindia Logistics Park Pvt, Ltd CFS 2.9
All Cargo Logistics Ltd., CFS2.3
Vaishno Logistics Yard CFS 5.4
NAVKAR CORPORATION LTD.,YARD-II CFS 7.4
PUNJAB CONWARE (PW) 2.2
DRONAGIRI RAIL TERMINAL 2.1
MAHARASHTRA STATE WARE. CORP. CFS
CWC LOGISTIC PARK - Opr.Hind Trmnl. 2.3
NAVKAR CORPORATION LTD.YARD-III CFS 3.7
International Cargo Terminal CFS 3.7
Maersk Annex (APM)CFS 3.0International Cargo Terminal CFS 2.4
SBW Logistics CFS , Navi Mumbai 4.6
JWR CFS 3.3
AVERAGE DELIVERY TIME ( In Hrs )- GTI TO ALL CFS IN MUMBAI
Below table shows the average delivery time in import cycle from GTI to all the CFS's
AVERAGE DELIVERY TIME ( In Hrs )- JNPCT TO ALL CFS IN MUMBAI
CFS Mar’18
Speedy Multimode Ltd CFS) 1.6
Balmer & Lawrie & Co. Ltd.,CFS 2.2
Gateway Distriparks Ltd 2.7APM (Maersk India Pvt. Ltd)CFS 4.0Continental Warehousing (Nhava Sheva) Ltd. 2.0
Seabird Marine Services Pvt Ltd. 3.2
JWC Logistics Park Ltd CFS 2.7Ameya Logistics Pvt. Ltd. 2.3
Ashte Logistics Pvt. Ltd. 2.8
NAVAKAR CORPORATION LTD.,YARD-1 CFS 2.6
Apollo Logisolutions Ltd. 5.8
Ocean Gate Container Terminals Pvt. Ltd.CFS 2.8
Indev Logistics Pvt. Ltd.CFS 3.5
Transindia Logistics Park Pvt, Ltd CFS 2.5
All Cargo Logistics Ltd., CFS1.7
Vaishno Logistics Yard CFS 3.4
NAVKAR CORPORATION LTD.,YARD-II CFS 3.2
PUNJAB CONWARE (PW) 2.0
DRONAGIRI RAIL TERMINAL 1.4
MAHARASHTRA STATE WARE. CORP. CFS 1.2
CWC LOGISTIC PARK - Opr.Hind Trmnl. 1.9
NAVKAR CORPORATION LTD.YARD-III CFS 2.9
International Cargo Terminal CFS 2.6
Maersk Annex (APM)CFS 3.5International Cargo Terminal CFS 2.4
SBW Logistics CFS , Navi Mumbai 5.3
JWR CFS 2.2
CFS - AVERAGE DELIVERY TIME - JNPCT TO ALL CFS’s IN MUMBAI
Below table shows the average delivery time in import cycle from JNPCT to all the CFS's
CFS DELIVERY TIME ANALYSIS
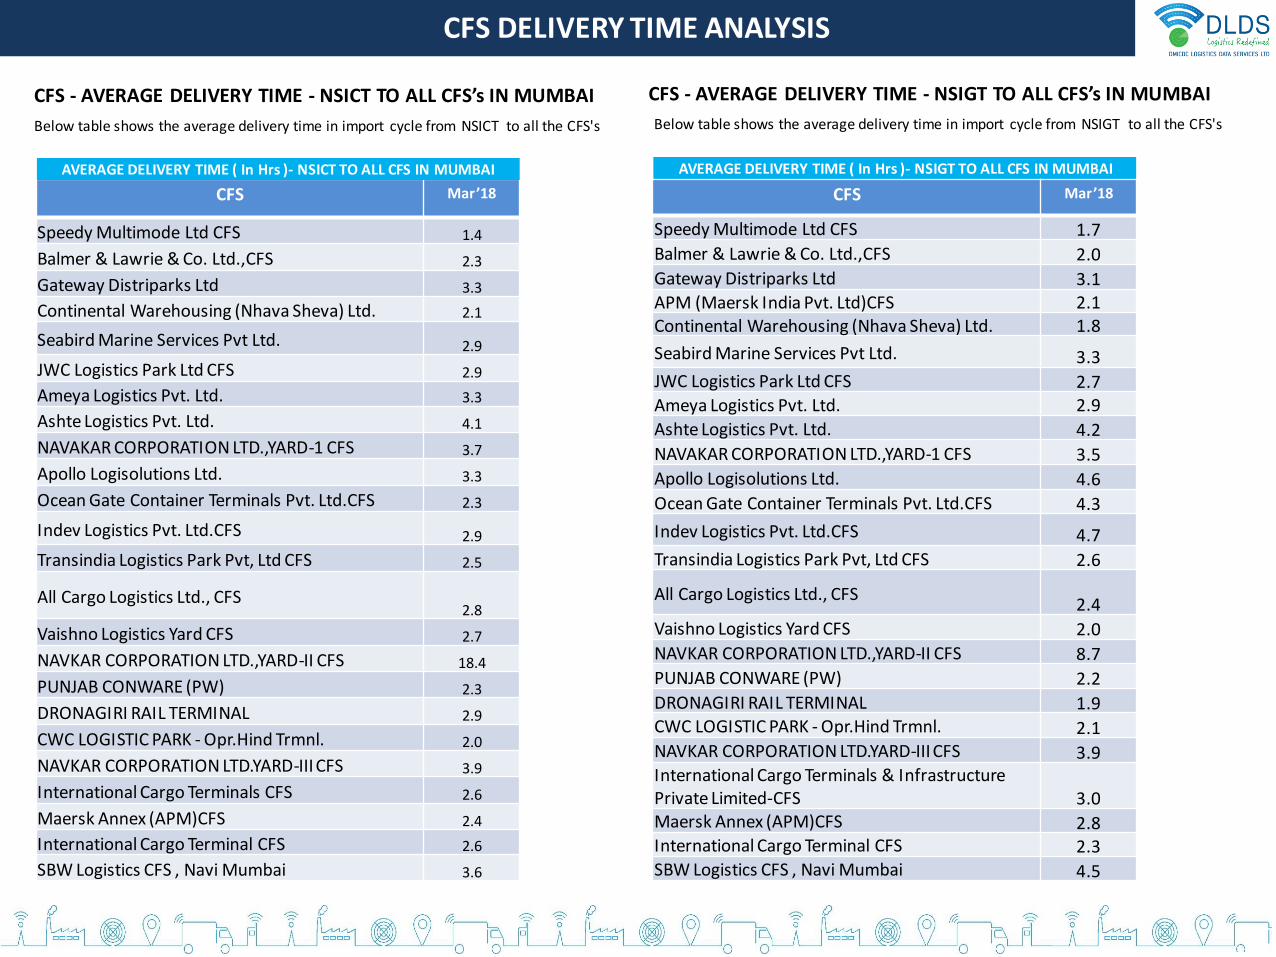
CFS - AVERAGE DELIVERY TIME - NSICT TO ALL CFS’s IN MUMBAI
CFS Mar’18
Speedy Multimode Ltd CFS 1.4
Balmer & Lawrie & Co. Ltd.,CFS 2.3
Gateway Distriparks Ltd 3.3
Continental Warehousing (Nhava Sheva) Ltd. 2.1
Seabird Marine Services Pvt Ltd. 2.9
JWC Logistics Park Ltd CFS 2.9
Ameya Logistics Pvt. Ltd. 3.3
Ashte Logistics Pvt. Ltd. 4.1
NAVAKAR CORPORATION LTD.,YARD-1 CFS 3.7
Apollo Logisolutions Ltd. 3.3
Ocean Gate Container Terminals Pvt. Ltd.CFS 2.3
Indev Logistics Pvt. Ltd.CFS 2.9
Transindia Logistics Park Pvt, Ltd CFS 2.5
All Cargo Logistics Ltd., CFS2.8
Vaishno Logistics Yard CFS 2.7
NAVKAR CORPORATION LTD.,YARD-II CFS 18.4
PUNJAB CONWARE (PW) 2.3
DRONAGIRI RAIL TERMINAL 2.9
CWC LOGISTIC PARK - Opr.Hind Trmnl. 2.0
NAVKAR CORPORATION LTD.YARD-III CFS 3.9
International Cargo Terminals CFS 2.6
Maersk Annex (APM)CFS 2.4
International Cargo Terminal CFS 2.6
SBW Logistics CFS , Navi Mumbai 3.6
AVERAGE DELIVERY TIME ( In Hrs )- NSICT TO ALL CFS IN MUMBAI
Below table shows the average delivery time in import cycle from NSICT to all the CFS's
AVERAGE DELIVERY TIME ( In Hrs )- NSIGT TO ALL CFS IN MUMBAI
CFS Mar’18
Speedy Multimode Ltd CFS 1.7
Balmer & Lawrie & Co. Ltd.,CFS 2.0
Gateway Distriparks Ltd 3.1APM (Maersk India Pvt. Ltd)CFS 2.1Continental Warehousing (Nhava Sheva) Ltd. 1.8
Seabird Marine Services Pvt Ltd. 3.3
JWC Logistics Park Ltd CFS 2.7Ameya Logistics Pvt. Ltd. 2.9
Ashte Logistics Pvt. Ltd. 4.2
NAVAKAR CORPORATION LTD.,YARD-1 CFS 3.5
Apollo Logisolutions Ltd. 4.6
Ocean Gate Container Terminals Pvt. Ltd.CFS 4.3
Indev Logistics Pvt. Ltd.CFS 4.7
Transindia Logistics Park Pvt, Ltd CFS 2.6
All Cargo Logistics Ltd., CFS2.4
Vaishno Logistics Yard CFS 2.0
NAVKAR CORPORATION LTD.,YARD-II CFS 8.7
PUNJAB CONWARE (PW) 2.2
DRONAGIRI RAIL TERMINAL 1.9CWC LOGISTIC PARK - Opr.Hind Trmnl. 2.1NAVKAR CORPORATION LTD.YARD-III CFS 3.9International Cargo Terminals & Infrastructure Private Limited-CFS 3.0Maersk Annex (APM)CFS 2.8International Cargo Terminal CFS 2.3SBW Logistics CFS , Navi Mumbai 4.5
CFS - AVERAGE DELIVERY TIME - NSIGT TO ALL CFS’s IN MUMBAI
Below table shows the average delivery time in import cycle from NSIGT to all the CFS's
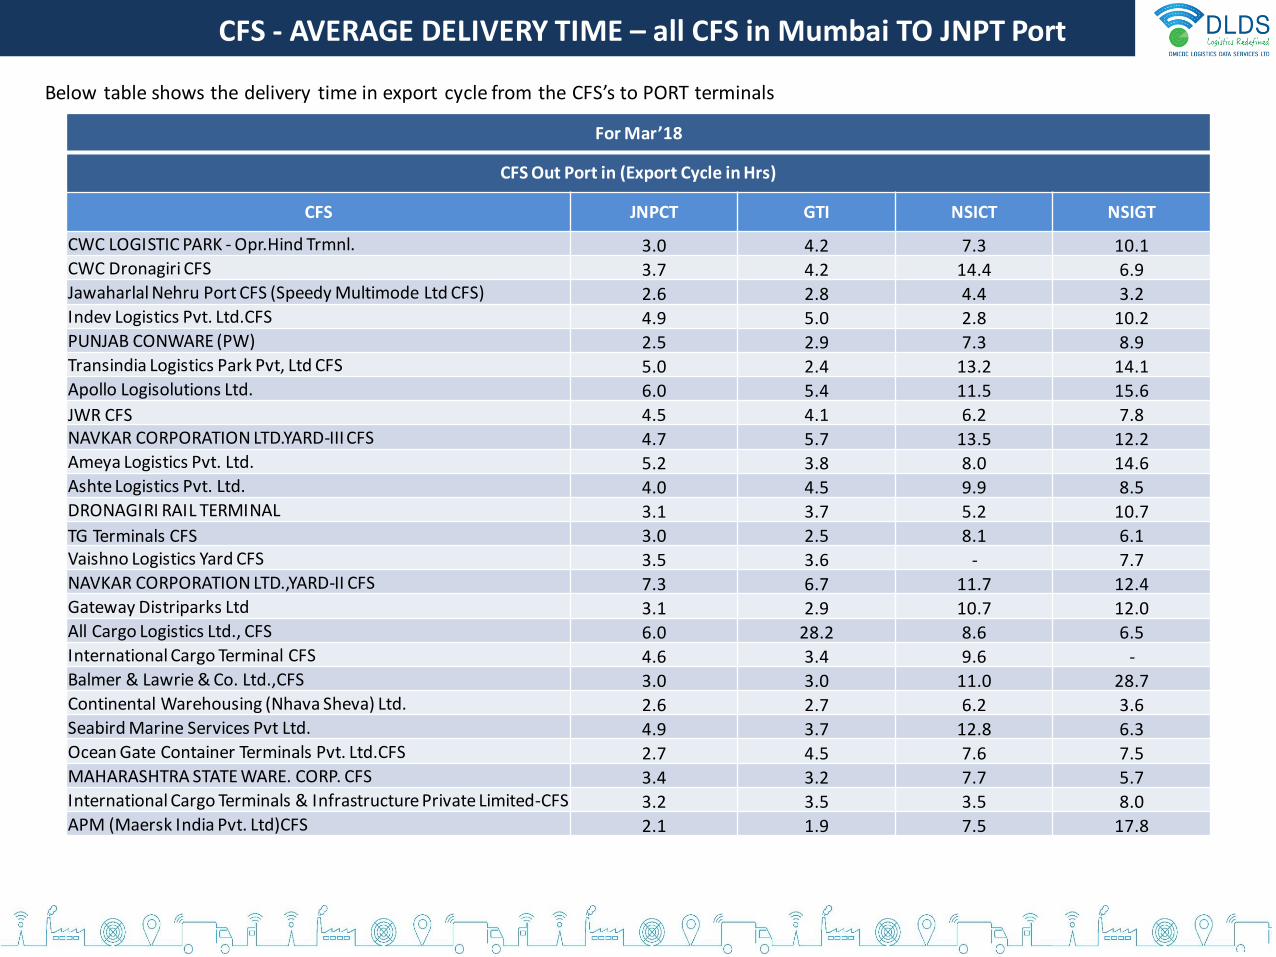
Below table shows the delivery time in export cycle from the CFS’s to PORT terminals
For Mar’18
CFS Out Port in (Export Cycle in Hrs)
CFS JNPCT GTI NSICT NSIGT
CWC LOGISTIC PARK - Opr.Hind Trmnl. 3.0 4.2 7.3 10.1CWC Dronagiri CFS 3.7 4.2 14.4 6.9Jawaharlal Nehru Port CFS (Speedy Multimode Ltd CFS) 2.6 2.8 4.4 3.2Indev Logistics Pvt. Ltd.CFS 4.9 5.0 2.8 10.2PUNJAB CONWARE (PW) 2.5 2.9 7.3 8.9Transindia Logistics Park Pvt, Ltd CFS 5.0 2.4 13.2 14.1Apollo Logisolutions Ltd. 6.0 5.4 11.5 15.6
JWR CFS 4.5 4.1 6.2 7.8NAVKAR CORPORATION LTD.YARD-III CFS 4.7 5.7 13.5 12.2Ameya Logistics Pvt. Ltd. 5.2 3.8 8.0 14.6Ashte Logistics Pvt. Ltd. 4.0 4.5 9.9 8.5DRONAGIRI RAIL TERMINAL 3.1 3.7 5.2 10.7
TG Terminals CFS 3.0 2.5 8.1 6.1Vaishno Logistics Yard CFS 3.5 3.6 - 7.7NAVKAR CORPORATION LTD.,YARD-II CFS 7.3 6.7 11.7 12.4Gateway Distriparks Ltd 3.1 2.9 10.7 12.0All Cargo Logistics Ltd., CFS 6.0 28.2 8.6 6.5International Cargo Terminal CFS 4.6 3.4 9.6 -Balmer & Lawrie & Co. Ltd.,CFS 3.0 3.0 11.0 28.7Continental Warehousing (Nhava Sheva) Ltd. 2.6 2.7 6.2 3.6Seabird Marine Services Pvt Ltd. 4.9 3.7 12.8 6.3Ocean Gate Container Terminals Pvt. Ltd.CFS 2.7 4.5 7.6 7.5MAHARASHTRA STATE WARE. CORP. CFS 3.4 3.2 7.7 5.7International Cargo Terminals & Infrastructure Private Limited-CFS 3.2 3.5 3.5 8.0APM (Maersk India Pvt. Ltd)CFS 2.1 1.9 7.5 17.8
CFS - AVERAGE DELIVERY TIME – all CFS in Mumbai TO JNPT Port
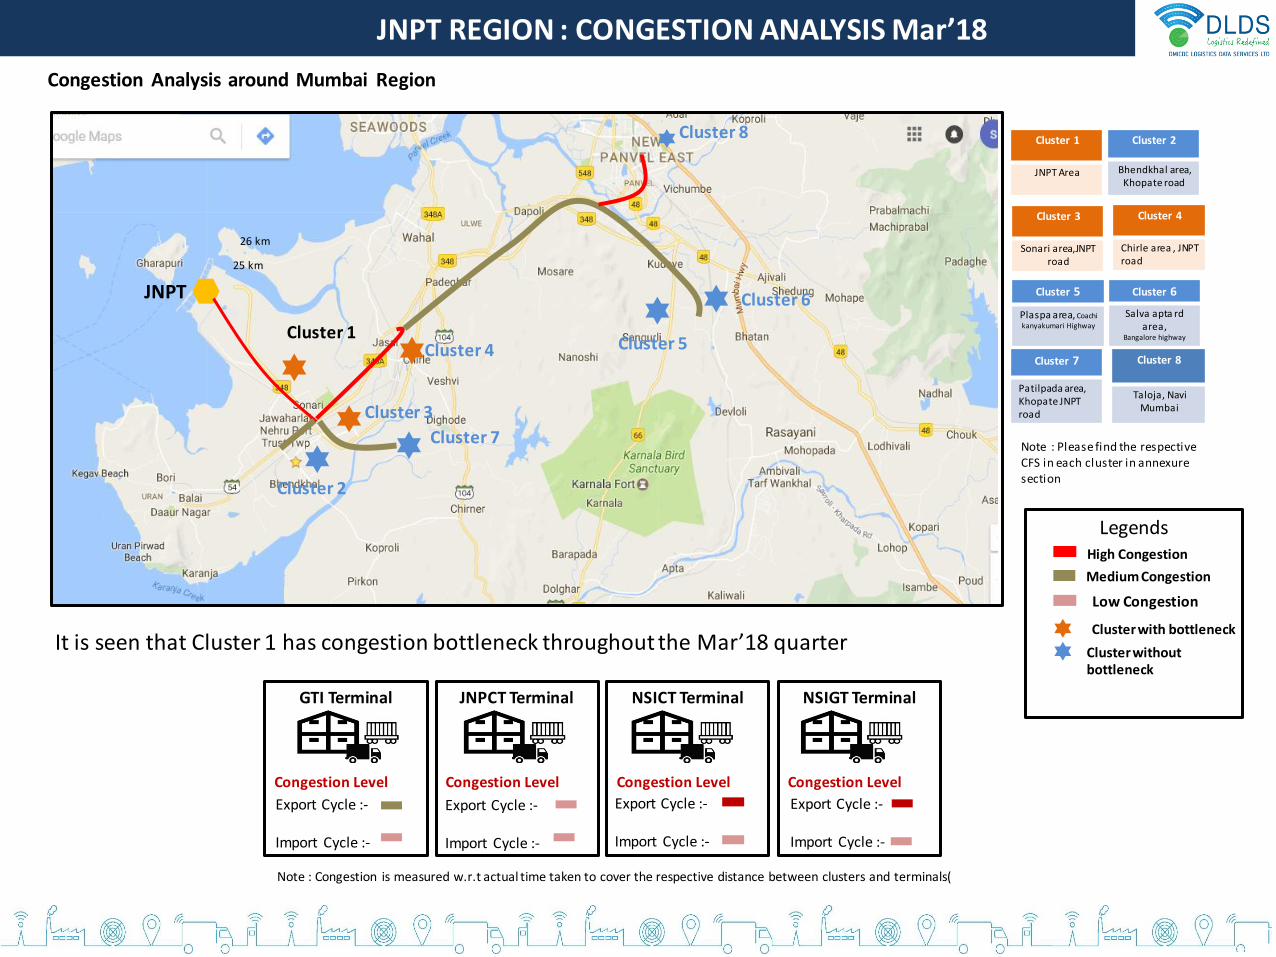
JNPT REGION : CONGESTION ANALYSIS Mar’18
Cluster 2
Cluster 5
Cluster 7
Cluster 4
Cluster 6
Cluster 3
Cluster 1
Congestion Analysis around Mumbai Region
JNPT
25 km
26 km
High Congestion
Cluster without bottleneck
Cluster with bottleneck
Medium Congestion
Cluster 8
GTI Terminal
Congestion Level
JNPCT Terminal
Congestion Level
NSICT Terminal
Congestion Level
NSIGT Terminal
Congestion Level
Export Cycle :-
Import Cycle :-
Export Cycle :-
Import Cycle :-
Export Cycle :-
Import Cycle :-
Export Cycle :-
Import Cycle :-
Note : Congestion is measured w.r.t actual time taken to cover the respective distance between clusters and terminals(
Cluster 1
JNPT Area
Cluster 2
Bhendkhal area, Khopate road
Cluster 5
Plaspa area, Coachi kanyakumari Highway
Cluster 6
Salva apta rd area,
Bangalore highway
Cluster 7
Patilpada area, Khopate JNPT road
Note : Please find the respective CFS in each cluster in annexure section
Cluster 8
Taloja, NaviMumbai
Low Congestion
Legends
It is seen that Cluster 1 has congestion bottleneck throughout the Mar’18 quarter
Cluster 4
Chirle area , JNPT road
Cluster 3
Sonari area,JNPTroad
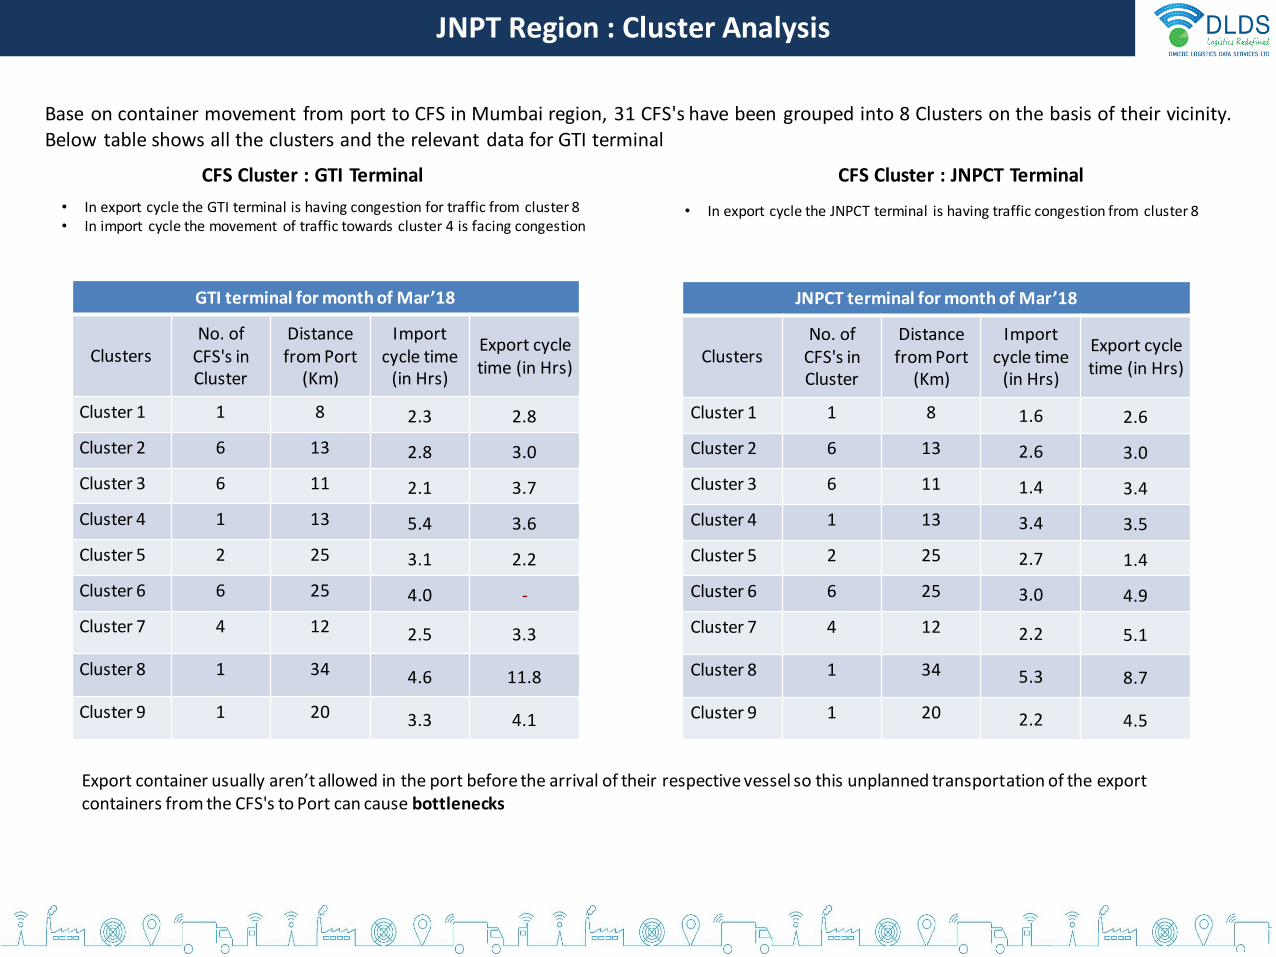
JNPT Region : Cluster Analysis
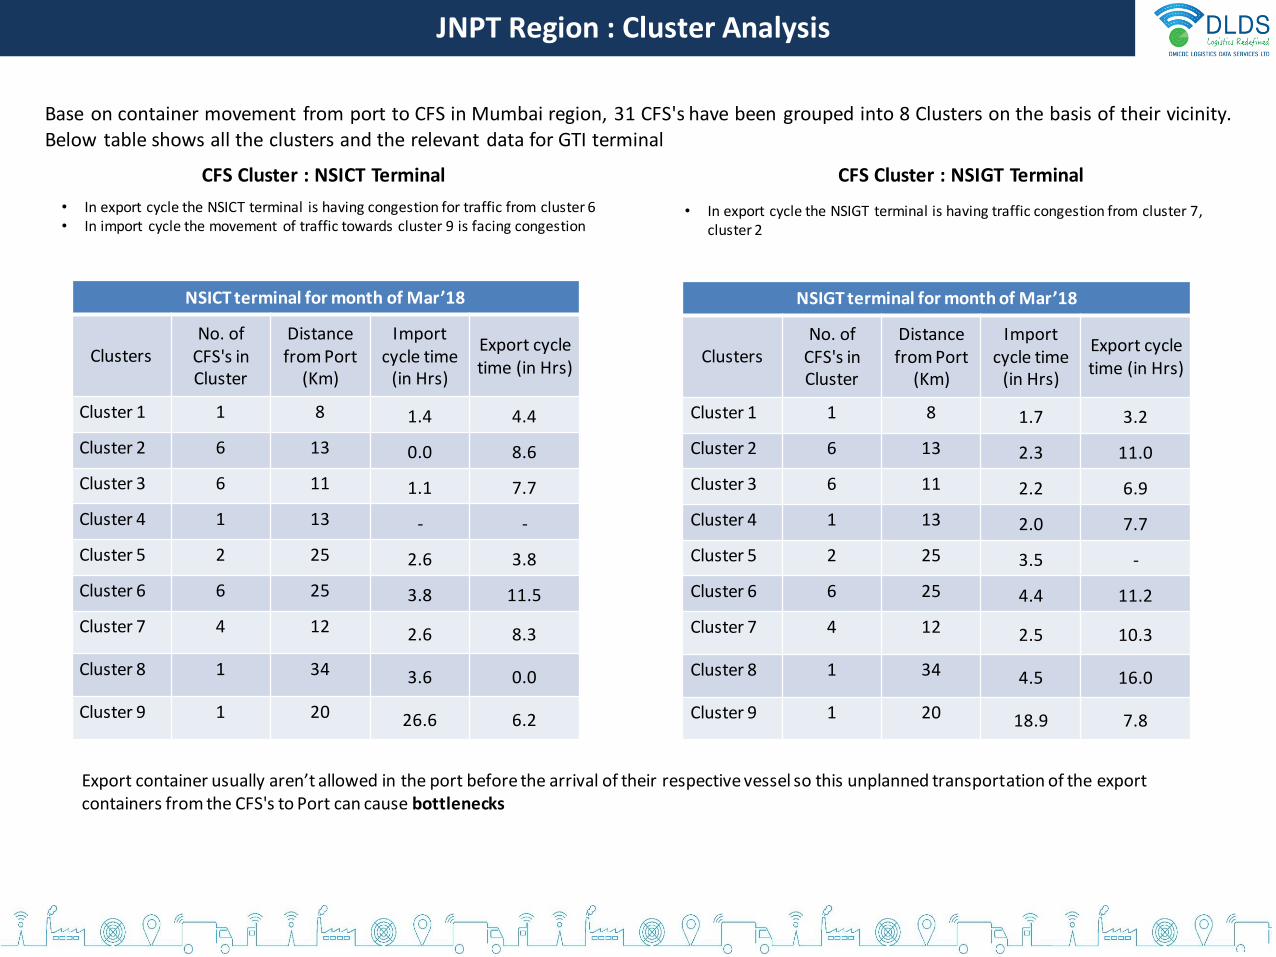
Base on container movement from port to CFS in Mumbai region, 31 CFS's have been grouped into 8 Clusters on the basis of their vicinity.Below table shows all the clusters and the relevant data for GTI terminal
• In export cycle the GTI terminal is having congestion for traffic from cluster 8• In import cycle the movement of traffic towards cluster 4 is facing congestion
CFS Cluster : GTI Terminal
Export container usually aren’t allowed in the port before the arrival of their respective vessel so this unplanned transportation of the export containers from the CFS's to Port can cause bottlenecks
CFS Cluster : JNPCT Terminal
• In export cycle the JNPCT terminal is having traffic congestion from cluster 8
GTI terminal for month of Mar’18
ClustersNo. of
CFS's in Cluster
Distancefrom Port
(Km)
Import cycle time
(in Hrs)
Export cycle time (in Hrs)
Cluster 1 1 8 2.3 2.8
Cluster 2 6 13 2.8 3.0
Cluster 3 6 11 2.1 3.7
Cluster 4 1 13 5.4 3.6
Cluster 5 2 25 3.1 2.2
Cluster 6 6 25 4.0 -
Cluster 7 4 12 2.5 3.3
Cluster 8 1 34 4.6 11.8
Cluster 9 1 20 3.3 4.1
JNPCT terminal for month of Mar’18
ClustersNo. of
CFS's in Cluster
Distancefrom Port
(Km)
Import cycle time
(in Hrs)
Export cycle time (in Hrs)
Cluster 1 1 8 1.6 2.6
Cluster 2 6 13 2.6 3.0
Cluster 3 6 11 1.4 3.4
Cluster 4 1 13 3.4 3.5
Cluster 5 2 25 2.7 1.4
Cluster 6 6 25 3.0 4.9
Cluster 7 4 12 2.2 5.1
Cluster 8 1 34 5.3 8.7
Cluster 9 1 20 2.2 4.5
JNPT Region : Cluster Analysis
Base on container movement from port to CFS in Mumbai region, 31 CFS's have been grouped into 8 Clusters on the basis of their vicinity.Below table shows all the clusters and the relevant data for GTI terminal
• In export cycle the NSICT terminal is having congestion for traffic from cluster 6• In import cycle the movement of traffic towards cluster 9 is facing congestion
CFS Cluster : NSICT Terminal
Export container usually aren’t allowed in the port before the arrival of their respective vessel so this unplanned transportation of the export containers from the CFS's to Port can cause bottlenecks
CFS Cluster : NSIGT Terminal
• In export cycle the NSIGT terminal is having traffic congestion from cluster 7, cluster 2
NSICT terminal for month of Mar’18
ClustersNo. of
CFS's in Cluster
Distancefrom Port
(Km)
Import cycle time
(in Hrs)
Export cycle time (in Hrs)
Cluster 1 1 8 1.4 4.4
Cluster 2 6 13 0.0 8.6
Cluster 3 6 11 1.1 7.7
Cluster 4 1 13 - -
Cluster 5 2 25 2.6 3.8
Cluster 6 6 25 3.8 11.5
Cluster 7 4 12 2.6 8.3
Cluster 8 1 34 3.6 0.0
Cluster 9 1 20 26.6 6.2
NSIGT terminal for month of Mar’18
ClustersNo. of
CFS's in Cluster
Distancefrom Port
(Km)
Import cycle time
(in Hrs)
Export cycle time (in Hrs)
Cluster 1 1 8 1.7 3.2
Cluster 2 6 13 2.3 11.0
Cluster 3 6 11 2.2 6.9
Cluster 4 1 13 2.0 7.7
Cluster 5 2 25 3.5 -
Cluster 6 6 25 4.4 11.2
Cluster 7 4 12 2.5 10.3
Cluster 8 1 34 4.5 16.0
Cluster 9 1 20 18.9 7.8
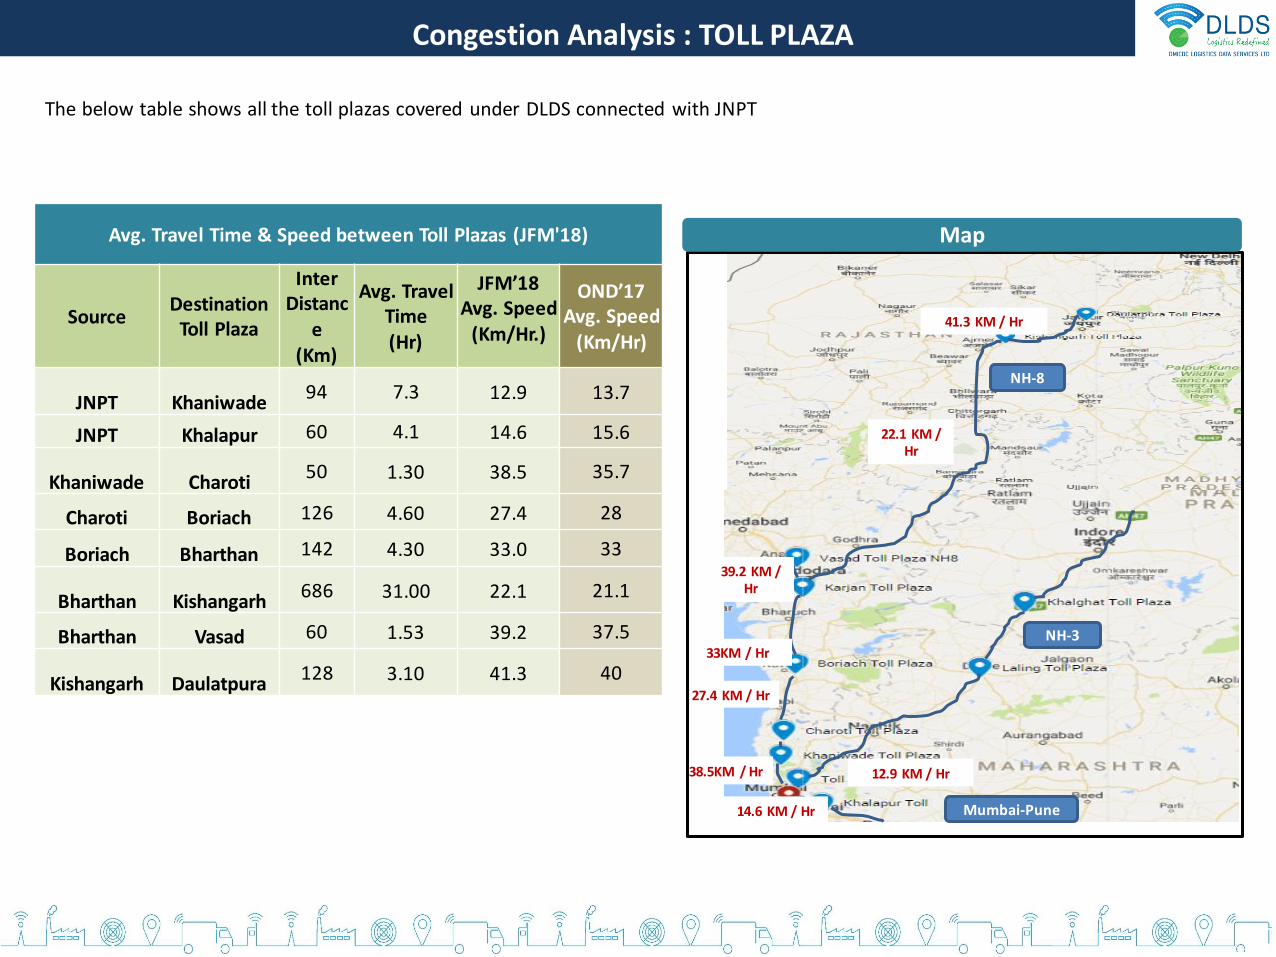
The below table shows all the toll plazas covered under DLDS connected with JNPT
Congestion Analysis : TOLL PLAZA
Avg. Travel Time & Speed between Toll Plazas (JFM'18)
Source Destination
Toll Plaza
Inter Distanc
e(Km)
Avg. Travel Time (Hr)
JFM’18Avg. Speed
(Km/Hr.)
OND’17Avg. Speed
(Km/Hr)
JNPT Khaniwade94 7.3 12.9 13.7
JNPT Khalapur 60 4.1 14.6 15.6
Khaniwade Charoti50 1.30 38.5 35.7
Charoti Boriach 126 4.60 27.4 28
Boriach Bharthan 142 4.30 33.0 33
Bharthan Kishangarh686 31.00 22.1 21.1
Bharthan Vasad 60 1.53 39.2 37.5
Kishangarh Daulatpura128 3.10 41.3 40
Mumbai-Pune
NH-3
NH-8
14.6 KM / Hr
12.9 KM / Hr38.5KM / Hr
27.4 KM / Hr
33KM / Hr
22.1 KM / Hr
39.2 KM / Hr
Map
41.3 KM / Hr
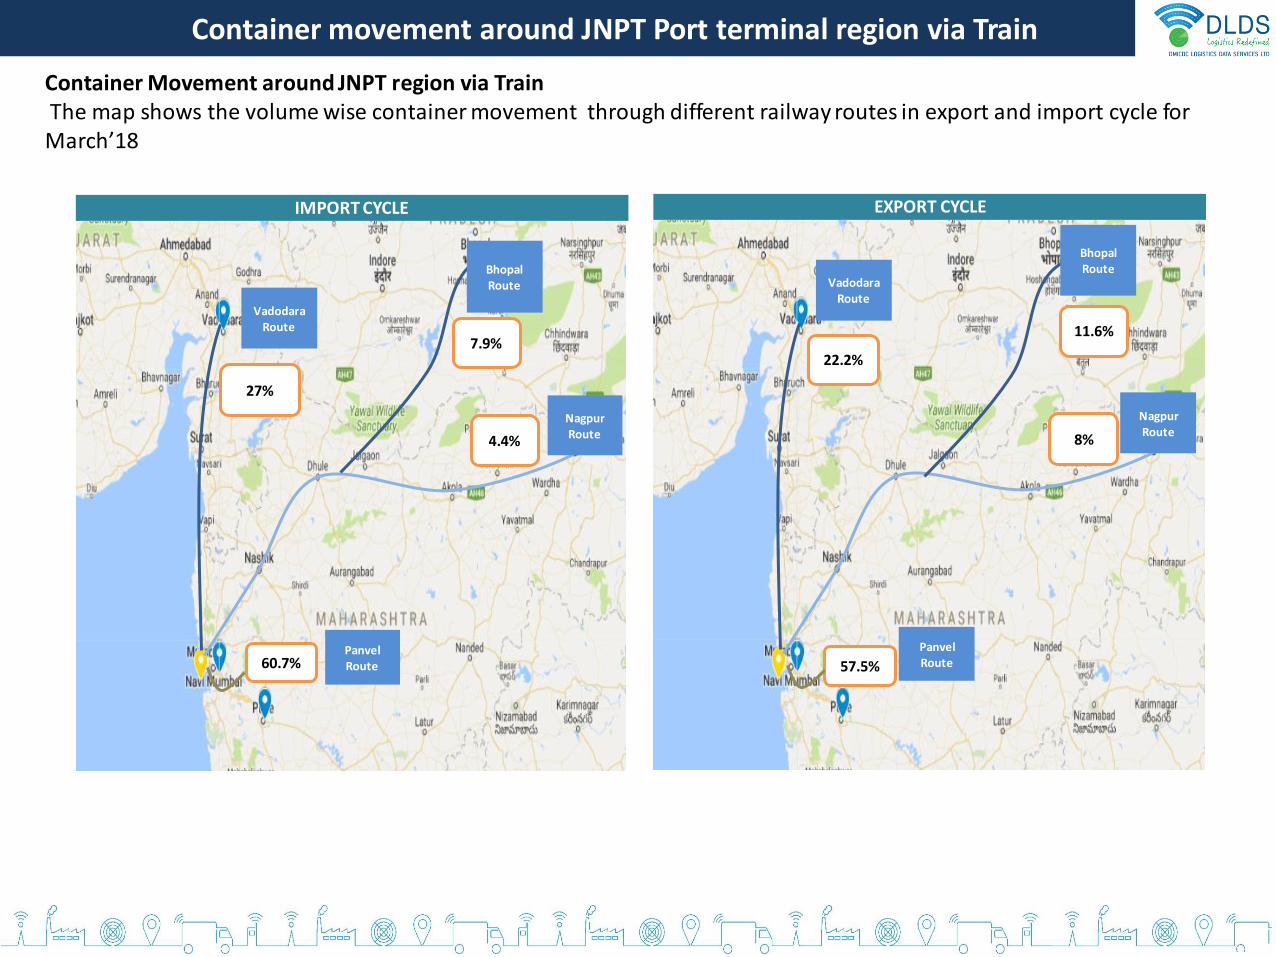
Container Movement around JNPT region via TrainThe map shows the volume wise container movement through different railway routes in export and import cycle for March’18
27%
4.4%
60.7%
IMPORT CYCLE
22.2%
8%
57.5%
EXPORT CYCLE
Nagpur Route
Vadodara Route
Panvel Route
Panvel Route
Nagpur Route
Vadodara Route
Container movement around JNPT Port terminal region via Train
Bhopal Route
Bhopal Route
7.9%11.6%
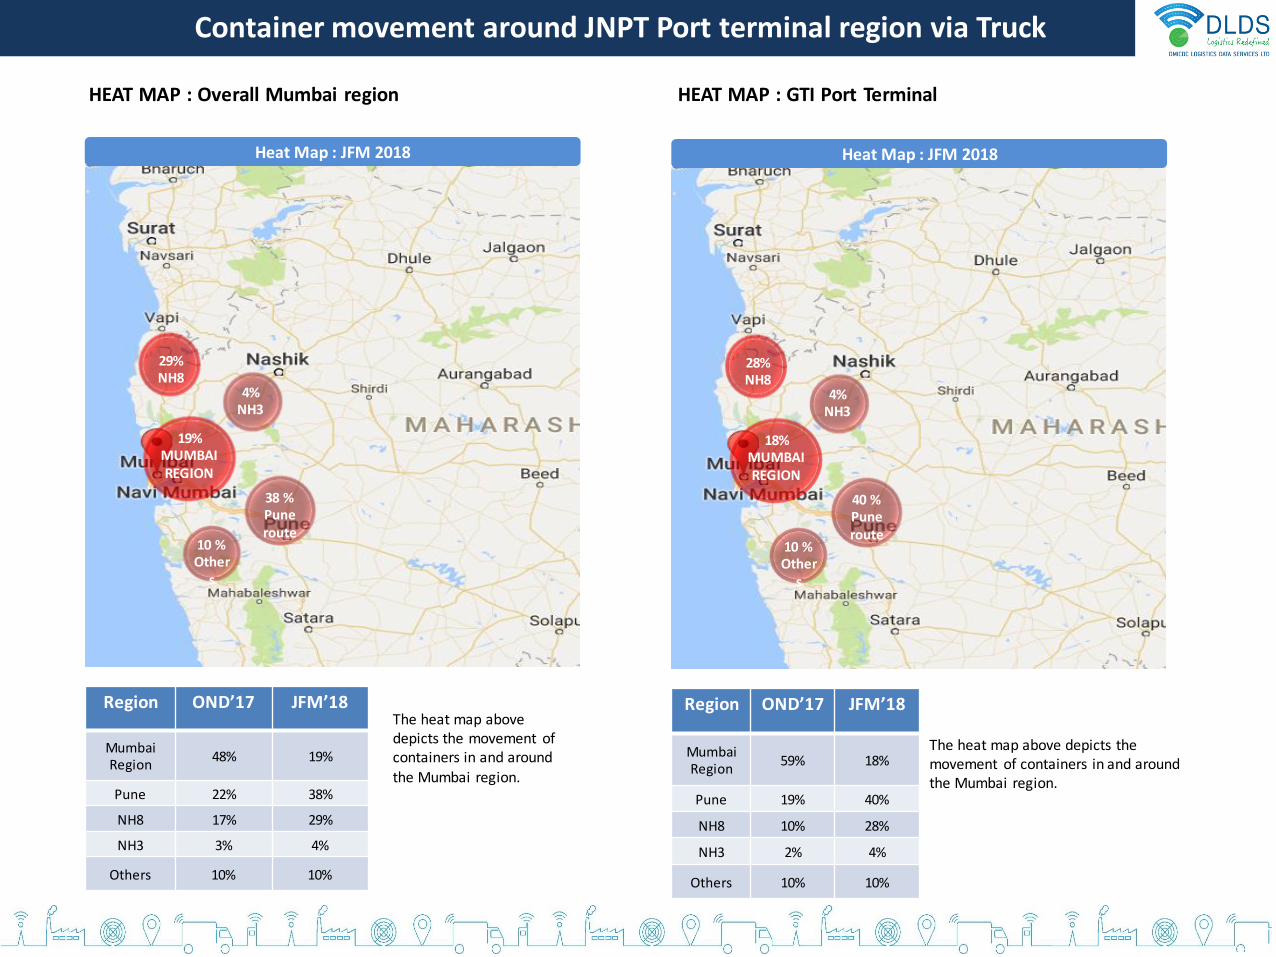
Container movement around JNPT Port terminal region via Truck
19%MUMBAI REGION
Heat Map : JFM 2018
The heat map above depicts the movement of containers in and around the Mumbai region.
4%NH3
38 %Pune route
10 %Other
s
Region OND’17 JFM’18
MumbaiRegion
48% 19%
Pune 22% 38%
NH8 17% 29%
NH3 3% 4%
Others 10% 10%
HEAT MAP : Overall Mumbai region
29%NH8
18%MUMBAI REGION
Heat Map : JFM 2018
The heat map above depicts the movement of containers in and around the Mumbai region.
4%NH3
40 %Pune route
10 %Other
s
Region OND’17 JFM’18
MumbaiRegion
59% 18%
Pune 19% 40%
NH8 10% 28%
NH3 2% 4%
Others 10% 10%
28%NH8
HEAT MAP : GTI Port Terminal
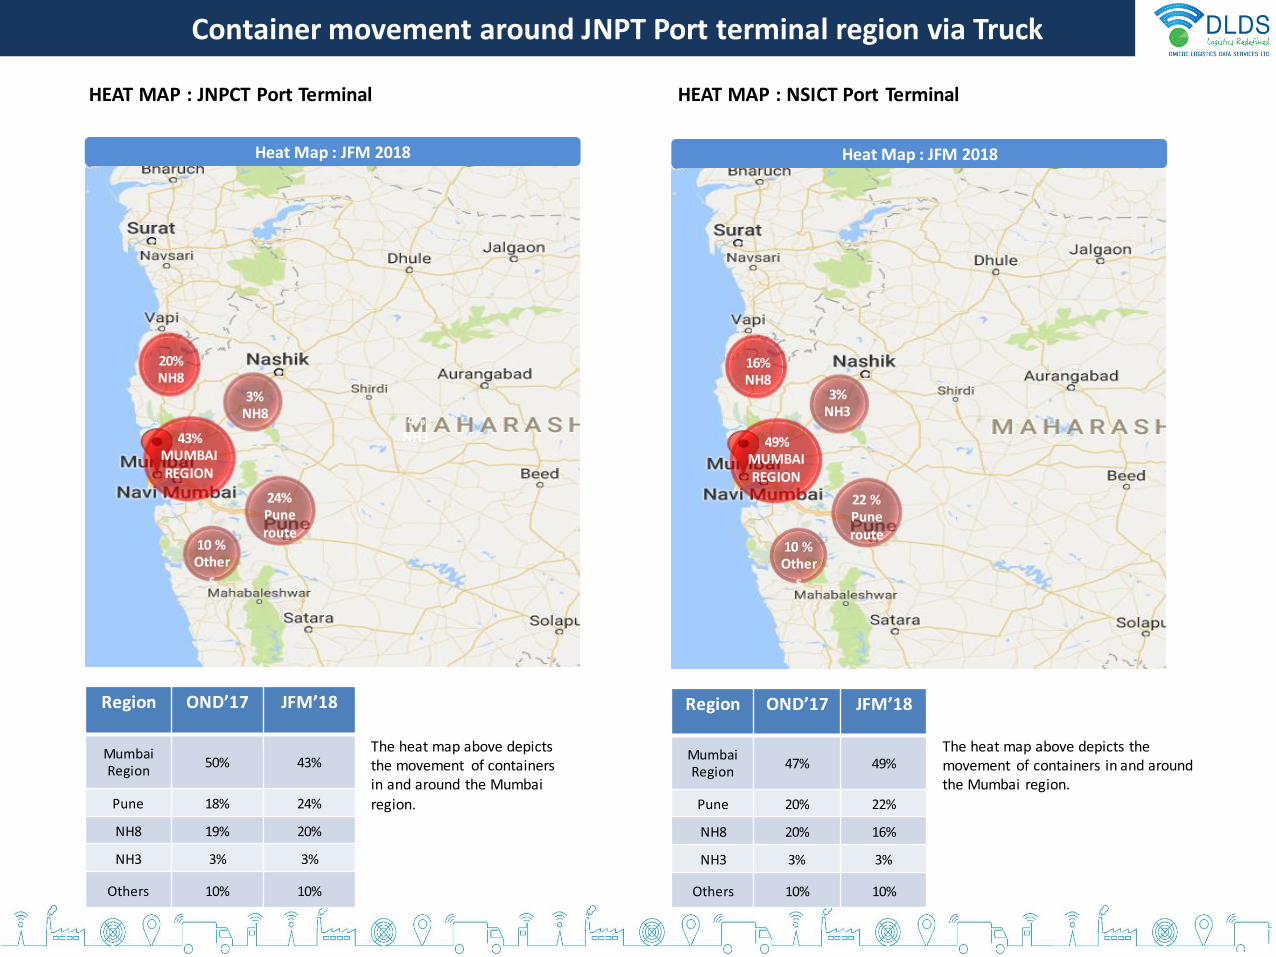
Container movement around JNPT Port terminal region via Truck
43%MUMBAI REGION
Heat Map : JFM 2018
The heat map above depicts the movement of containers in and around the Mumbai region.
4%NH3
24%Pune route
10 %Other
s
Region OND’17 JFM’18
MumbaiRegion
50% 43%
Pune 18% 24%
NH8 19% 20%
NH3 3% 3%
Others 10% 10%
HEAT MAP : JNPCT Port Terminal
20%NH8
49%MUMBAI REGION
Heat Map : JFM 2018
The heat map above depicts the movement of containers in and around the Mumbai region.
3%NH3
22 %Pune route
10 %Other
s
Region OND’17 JFM’18
MumbaiRegion
47% 49%
Pune 20% 22%
NH8 20% 16%
NH3 3% 3%
Others 10% 10%
16%NH8
HEAT MAP : NSICT Port Terminal
3%NH8
• APM (Maersk India) CFS, Navi Mumbai
• Maersk Annex (APM)CFS, Navi Mumbai
• Balmer & Lawrie CFS, Navi Mumbai
• CWC Hind Terminal CFS, Navi Mumbai
• International Cargo Terminals (ULA) CFS, Navi Mumbai & Infrastructure Private Limited
• Gateway Distriparks CFS, Navi Mumbai
• International Cargo Terminal CFS
Cluster 2 (Bhendkhal area, Khopate road)
Cluster 1 (JNPT Area)
• Speedy Multimode CFS,JNPT • Punjab Conware CFS, Navi Mumbai• Dronogiri Rail Terminal CFS, Navi
Mumbai• CWC Impex Park CFS, Navi Mumbai• CWC Dronagiri CFS, Navi Mumbai• Maharashtra State Corp CFS• Seabird CFS, Navi Mumbai
Cluster 3Sonari area,JNPT road
Cluster 4(Chirle area , JNPT road)
• Vaishno Logistics CFS, Navi Mumbai
Cluster 5(Plaspa area, Coachi kanyakumari
Highway)
• JWC Logistics Park CFS• Ocean Gate CFS, Panvel
• Ashte Logistics CFS, Panvel
• Apol lo Logisolutions CFS, Panvel• Indev Logistics CFS, Panvel• Navkar Corporation Yrd 1 CFS,
Panvel• Navkar Corporation Yard 2 CFS,
Panvel• Navkar Corporation Yard 3 CFS,
Panvel
Cluster 6(Sa lva apta rd area, Bangalore highway)
Cluster 7(Pati lpada area, Khopate JNPT road)
• Al l Cargo Logistics CFS, Navi Mumbai
• Transindia Logistics Park, Navi Mumbai
• Ameya Logistics CFS, Navi Mumbai• Continental Warehousing CFS, Navi
Mumbai
Below mentioned are all the CFS in the respective Clusters :
Cluster 8SBW
Thank You !!