ldb analytics : jnpt- november report 2017jnport.gov.in/writereaddata/data/downloads/dlds monthly...
TRANSCRIPT

Report Components
LDB ANALYTICS : JNPT- November Report 2017
Logistics Redefined
Executive Summary
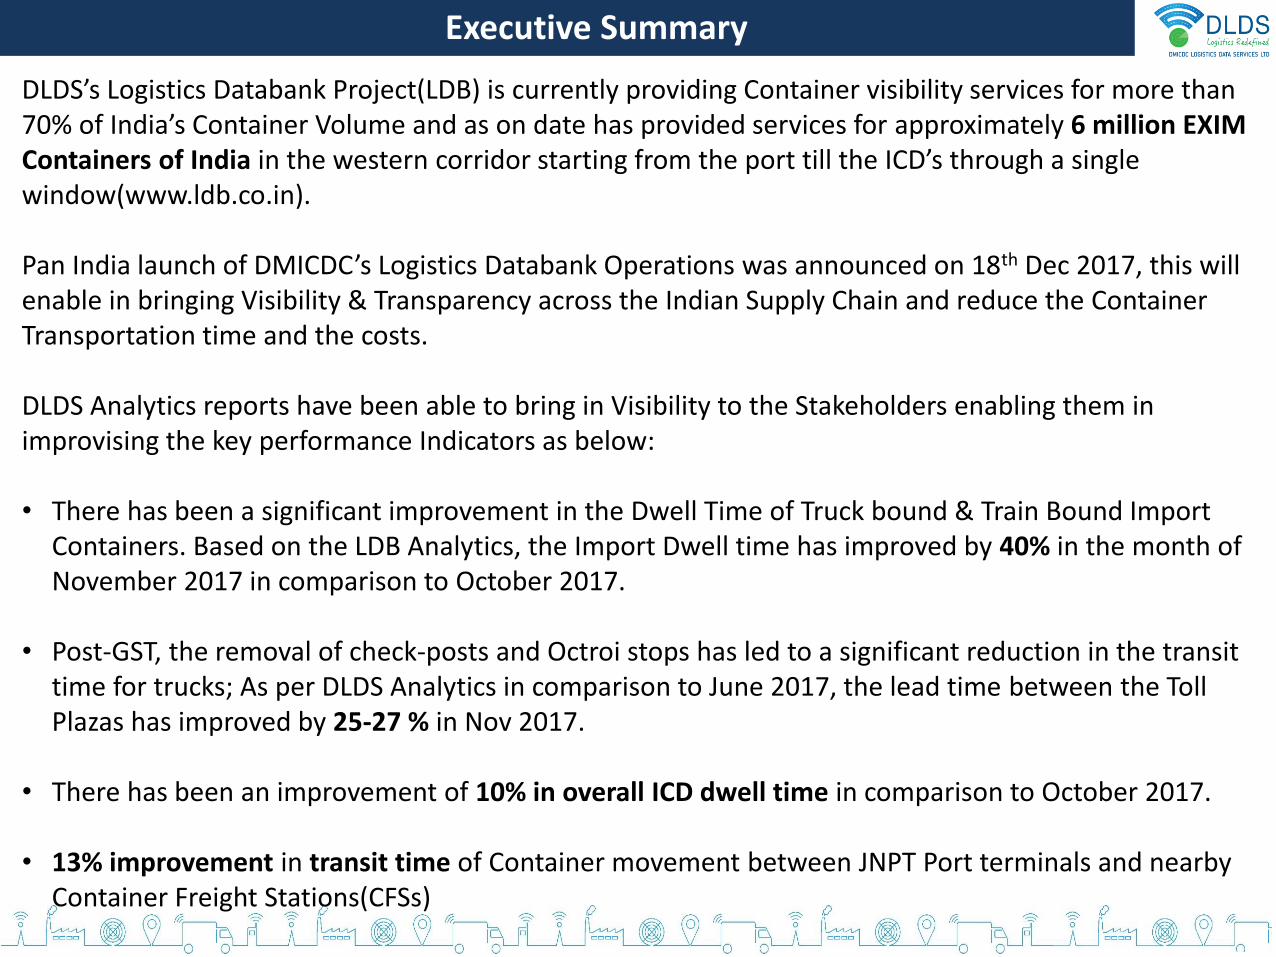
DLDS’s Logistics Databank Project(LDB) is currently providing Container visibility services for more than 70% of India’s Container Volume and as on date has provided services for approximately 6 million EXIM Containers of India in the western corridor starting from the port till the ICD’s through a single window(www.ldb.co.in).
Pan India launch of DMICDC’s Logistics Databank Operations was announced on 18th Dec 2017, this will enable in bringing Visibility & Transparency across the Indian Supply Chain and reduce the Container Transportation time and the costs.
DLDS Analytics reports have been able to bring in Visibility to the Stakeholders enabling them in improvising the key performance Indicators as below:
• There has been a significant improvement in the Dwell Time of Truck bound & Train Bound Import Containers. Based on the LDB Analytics, the Import Dwell time has improved by 40% in the month of November 2017 in comparison to October 2017.
• Post-GST, the removal of check-posts and Octroi stops has led to a significant reduction in the transit time for trucks; As per DLDS Analytics in comparison to June 2017, the lead time between the Toll Plazas has improved by 25-27 % in Nov 2017.
• There has been an improvement of 10% in overall ICD dwell time in comparison to October 2017.
• 13% improvement in transit time of Container movement between JNPT Port terminals and nearby Container Freight Stations(CFSs)

Executive Summary
• Performance Benchmarking reports are helping inculcate competition among the stakeholders in providing better Logistics Services.
• Based on the DLDS Analytics, best performing stakeholders across the supply chain were recognized for their efficiencies in handling the Containers for the financial year 2016-2017:
• JNPCT Port terminal was awarded with Best Performing Port Terminal Operator in Mumbai Region
• MICT Port terminal was awarded with Best Performing Port Terminal Operator in Gujarat Region
• All Cargo Logistics was awarded with Best Performing Container Freight Station in Mumbai Region
• Central Warehousing Corporation was awarded with Best Performing Container Freight Station in Gujarat Region
• CMA CGM Agencies ICD was awarded with Best Performing Inland Container Depot.

LDB Performance trend across JNPT Region
Overall JNPT Region
Overall ICDs Dwell Time
Overall CFS Dwell Time
Performance Benchmarking
Performance Index
Container Clearance Time analysis
With help of above activities below results have been achieved :
Import
Export
Congestion Analysis
Bottleneck Identification
Overall Port to ICDs averageDelivery Time (in hrs.)
Overall Port to CFS average Delivery Time (in hrs)
65.840
23.5
9077.8 73.8 128
110.799.7
88.7 82.6 81.3
2.3 2.86 2.5
JAS'17 October'17 November'17
72.4 73.2 78.6
10
30
50
70
90
JAS'17 October'17 November'17
Dwell Time Reduction• 40% improvement in JNPT region
Import cycle dwell time for November month as compared to the previous month
• 10% improvement in overall ICD dwell time as compared to the previous month
Transit Time Reduction13% improvement in transit time of container movement from JNPT Port
terminals and nearby Container Freight Stations(CFSs)

DMICDC Logistics Data Services : LDB Coverage
Ports where LDB service is Operational
Ports/Terminals to be extended with LDB Service
LDB coverage
9 Port Terminals
44 Container
Freight Stations
8In-land
container Depots
13 Toll Plazas

Performance Benchmarking

Top Performing Terminal
Gateway Terminals India (GTI)Dwell Time: 40.3
hrs.
Low Performing Terminal
Nhava Sheva India Gateway Terminal (NSIGT)
Dwell Time : 56.7 hrs.
JNPT Port Terminals
61 55.940.3
September October November
GTIJNPCT GTI
68 61 56.7
September October November
NSIGTGTI NSIGT
Performance Benchmarking : Port Terminals
Performance benchmarking for JNPT Region for month November’17

Top Performing CFS's
Dronogiri Rail Terminal CFS, Navi Mumbai
Dwell Time : 63 hrs.
Low Performing CFS's
Take Care Logistics CFSDwell Time : 105.3
hrs.
52 52 63
September October November
CWC DronagiriAll CargoDronogiri Rail Terminal CFS,
100
119105.3
September October November
Seabird CFS
Take care Logistics
Take care Logistics
Performance Benchmarking : Container Freight Station
Performance benchmarking for ‘JNPT Region CFS’ for month November’17

Performance Benchmarking : Inland Container Depot
Performance benchmarking for ICDs for month November’17
Top Performing ICD
CMA CGM Agencies ICD, Dadri
Dwell Time : 71 hrs.
Low Performing ICD
CONCOR ICD Dwell Time : 158 hrs.
76
72 71
September October November
CWC PatparganjCMA Loni
CMA CGM Agencies ICD, Dadri
225
177
158
September October November
CONCOR Aurangabad
CONCOR Aurangabad CONCOR Aurangabad

Performance Benchmarking : Western Corridor
Performance benchmarking of western corridor for month November’17
Top Performing Terminal
Gateway Terminals India (GTI)Dwell Time : 40.3
hrs.
Port Terminals
Low Performing Terminal
Adani International Container Terminal
(AICT)Dwell Time : 63 hrs.
CFS
Top Performing CFS's
Dronogiri Rail Terminal CFS, Navi Mumbai
Dwell Time : 63 hrs.
Low Performing CFS's
Hind Mundra Terminals CFS, Mundra
Dwell Time : 109 hrs.
Port terminal performance across western corridor
Container freight station (CFS) performance across western corridor

Key Findings

25
36.8
Toll Plazas routes: Avg. Travel Time & Speed
Source Destination Toll PlazaInter Distance
(Km)Avg. Travel Time
(Hr.)November’17 Avg. Speed
(Km/hr.)
October’17Avg. Speed(Km/Hr.)
June’17Avg. Speed
(Km/Hr.)
JNPT Khaniwade 94 5 14.2 13.4 11
JNPT Khalapur 60 2 18.2 15.2 22
Khaniwade Charoti 50 1.25 36.8 35.2 25
Charoti Boriach 126 4 28.3 27.7 25
Boriach Bharthan 142 4 33.3 33.0 36
Bharthan Kishangarh 686 29 20.5 21.7 24
Bharthan Vasad 60 1.25 38 38.7 30
Kishangarh Daulatpura 128 3 39.6 39.8 32
Dhule Khalghat 186 7 20 19.3 27
Time Saved
1.8 hrs
0.6 hrs
11
14.2
2528.3
JNPT to Khaniwade
Khaniwade to Charoti
June’17 Novemeber’17
27%
32%
Increase in Speed by
Bharthan to Vasad30
38
32
39.6
Kishangarh to Daulatpura
Increase in Speed by
24%
27%
Time Saved
0.4 hrs
0.76 hrs
Increase in Speed between Toll plaza (in Km/hr) Increase in Speed between Toll plaza (in Km/hr)
Improved Transit Time between Toll plaza Routes in comparison to June’17(Pre GST)
Toll Plaza Analysis : Impact of GST
Charoti to Boriach 12% 0.58 hrs
June’17 Novemeber’17

Co
nta
iner
vo
lum
e cl
eara
nce
Imp
ort
cyc
leJNPT region port dwell time has been improved in month of November’17 due to effective container clearance
Port Dwell Time Analysis
JNPT Region Port Dwell time: Overall* (in hrs.)6
0
55
.9
59
.1
61
52
.4
40
.3 56
.7
49
.8
JNPCT GTI NSICT NSIGT
October'17 November'17
GTI Train :
JNPCT Train:
NSICT Train:
NSIGT Train:
Within 2 days(Oct’17)
Within 2 days(Nov’17)
43%30%
39%
32%
33%
23%
16%
12%
In import cycle, there is an increase in the number of the containers being cleared within 2 days in comparison to Oct’17.This effective clearance of container has reduce the overall port dwell time of all terminals of JNPT region.
Further Analysis
Co
nta
iner
vo
lum
e cl
eara
nce
im
po
rt c
ycle
GTI Truck :
JNPCT Truck:
NSICT Truck:
NSIGT Truck:
Within 2 days(Oct’17)
Within 2 days(Nov’17)
87%74%
85%
81%
82%
63%
60%
62%
Dwell improvement in %
*Overall = import + export

74.1 73.3 72.1
29.8
30.635.6
September'17 October'17 November'17
76.5 83.1 84.7
18.920.8 17.8
September'17 October'17 November'17
66.353.4 56.1
30.1
22.923
150.6156.5 156.8
48.851.5 53.4
September'17 October'17 November'17
59.3
58.8
56
23.925.2
20.8
Gate Throughput
Gate Throughput(Containers per hour)
125.7112.2 112.1
54.147.5
42.7
JNPCT
GTI
NSIGT
NSICT
Gate Throughput(Import Cycle)
JNPCT
GTI
NSIGT
NSICT
Gate Throughput(Export Cycle)
JNPCT
GTI
NSIGT
NSICT
Gate throughput is defined as the number of containers passing through the port terminal gate per hour. The gate throughput has been calculated by taking the number of containers moving out of the port terminal in Import cycle plus the number of containers entering the port terminal during the export cycle
The overall gate throughput can be bifurcated on the basis of Import and Export cycle as shown below. The terminal wise segregation of gate throughput is represented for the months of September’17 , October’17 and November’17as follows
JNPCT
112.1containers per hr.
Gate throughput for Nov’17
GTI
156.8containers per hr.
Gate throughput for Nov’17
NSIGT
42.7containers per hr.
Gate throughput for Nov’17
NSICT
53.4containers per hr.
Gate throughput for Nov’17

Performance Index

JNPT region PORT Terminals : Performance Index
To assess the relative performance the relative dwell time as well as the volume of containers handled are depicted graphically in the form of an index to portray the performance of a particular organisation on the basis of these two combined factors.
Slow Bulk Movers : consist of Ports which have catered higher container volume at higher dwell time
Star Performer: consist of Ports which have catered relatively high container volume in lower dwell time
High Potential : consist of Ports which have catered relatively lower container volume in lower dwell time
Quadrant IV : consist of Ports which have catered relatively lower container volume at higher dwell time
JNPCT
NSICT
GTI
NSIGT
Quadrant : IQuadrant : II
Quadrant : III Quadrant : IV
Port Terminal Performance Index : November’17
Dwell Time
Co
nta
iner
Vo
lum
e
High
low
low
Hig
h
Star performer
Laggard
Slow Bulk Movers
High Potential

All Cargo Logistics CFS, …
Ameya Logistics CFS, Navi Mumbai
APM (Maersk India) CFS, Navi Mumbai
Apollo Logisolutions CFS, Panvel
Ashte Logistics CFS, Panvel
Balmer & …
Continental Warehousing CFS, Navi Mumbai
CWC Dronagiri CFS, Navi Mumbai
CWC Hind Terminal CFS, Navi Mumbai
Dronogiri Rail Terminal CFS, Navi …
Gateway Distriparks CFS, Navi Mumbai
Indev Logistics CFS, Panvel
International Cargo Terminal CFS
International Cargo Terminals (ULA) CFS, Navi Mumbai
JWC Logistics Park CFS
Maersk Annex (APM)CFS, Navi Mumbai
Maharashtra State Corp CFS
Navkar Corporation Yard 1 CFS, Panvel
Navkar Corporation Yard 2 CFS, Panvel
Navkar Corporation Yard 3 CFS, Panvel
Ocean Gate CFS, Panvel
Punjab Conware CFS, Navi Mumbai
SBW Logistics CFS, Navi Mumbai
Seabird CFS, Navi Mumbai
Speedy Multimode CFS, JNPT
Transindia Logistics Park, Navi Mumbai
Vaishno Logistics CFS, Navi Mumbai
Take Care Logistics CFS
Quadrant : IQuadrant : II
Quadrant : III Quadrant : IV
CFS Performance Index for November‘17
Dwell Time
Co
nta
iner
Vo
lum
e
Highlow
low
Hig
h
The below graph depicts the Performance Index for all CFS for month of November’17. The Quadrant II represent the best CFS with high frequency Index i.e. high container volume at lower dwell time
JNPT region CFS : Performance Index
Star performer
Laggard
Slow Bulk Movers
High Potential

The below graph depicts the Performance Index for all ICDs for month of November’17. The Quadrant II represent the best ICD with high frequency Index i.e. high container volume at lower dwell time
Allcargo Logistics Park ICD, Dadri
Albatross Inland Ports ICD, Dadri
CMA CGM Agencies ICD, Dadri
ACTL ICD
CWC Loni
CONCOR ICD
APM Terminals ICD, Dadri
Quadrant : IQuadrant : II
Quadrant : III Quadrant : IV
ICD Performance Index for November‘17
Dwell Time
Co
nta
iner
Vo
lum
e
Highlow
low
Hig
h
ICDs : Performance Index
Star performer
Laggard
Slow Bulk Movers
High Potential

JNPT PORT DWELL TIME TREND
52.440.3
56.7 49.8
JNPCT GTI NSICT NSIGT
November'17
Avg: 46.8 hrs.
JNPT Region Dwell time: Overall (in hrs.)
23.5 20.828.2 30.4
JNPCT GTI NSICT NSIGT
November'17
Avg: 23.5 hrs.
JNPT Region Dwell time: Import Cycle (in hrs.)
83.766.0 72.6 75.4
JNPCT GTI NSICT NSIGT
November'17
Avg: 73.8 hrs.
JNPT Region Dwell time: Export Cycle (in hrs.)
JNPT Import cycle Trend JNPT Export cycle Trend
JNPT port dwell time trend :The below table shows the overall port dwell time (i.e. import and export cycle combine) trend of all the JNPT Port terminals for month of November’17. Port dwell time is the time duration between the entry of the container in Port terminal to the time it moves out of the Port terminal
The Average line represent the JNPT region average dwell time with respect to the individual component (i.e. Overall Dwell time, Import and Export cycle) for the present month
The below tables showcase the Import and Export cycle dwell time for both rail and truck bound containers for month of November’17

JNPT REGION :CONGESTION ANALYSIS AND HEAT MAP

JNPT REGION : CONGESTION ANALYSIS
Cluster 2
Cluster 5
Cluster 7
Cluster 4
Cluster 6
Cluster 3
Cluster 1
Congestion Analysis around Mumbai Region
JNPT
25 km
26 km
High Congestion
Cluster
Cluster with bottleneck
Medium Congestion
Cluster 8
GTI Terminal
Congestion Level
JNPCT Terminal
Congestion Level
NSICT Terminal
Congestion Level
NSIGT Terminal
Congestion Level Export Cycle :-
Import Cycle :-
Export Cycle :-
Import Cycle :-
Export Cycle :-
Import Cycle :-
Export Cycle :-
Import Cycle :-
Note : Congestion is measured w.r.t actual time taken to cover the respective distance between clusters and terminals(Port to CFS)High Congestion Medium Congestion Low CongestionScale :
Cluster 1
JNPT Area
Cluster 2
Bhendkhal area, Khopate road
Cluster 3
Sonari area,JNPT road
Cluster 4
Chirle area , JNPT road
Cluster 5
Plaspa area, Coachi kanyakumari
Highway
Cluster 6
Salva apta rd area,Bangalore highway
Cluster 7
Patilpada area, Khopate JNPT road
Low Congestion
Congestions around Cluster 1 & Cluster 8 was on higher side in the month of November 2017
Cluster 8
Taloja, NaviMumbai

Container movement around JNPT region via Truck
48%MUMBAI REGION
Heat Map : November 2017
The heat map above depicts the movement of containers in and around the Mumbai region.
3%NH3
22 %Pune route
10 %Other
s
Region October'17
November’17
MumbaiRegion
47% 48%
Pune 19% 22%
NH8 22% 17%
NH3 2% 3%
Others 10% 10%
HEAT MAP : Overall Mumbai region
17%NH8
59%MUMBAI REGION
Heat Map : November 2017
The heat map above depicts the movement of containers in and around the Mumbai region.
2%NH3
19 %Pune route
10 %Other
s
Region October'17
November’17
MumbaiRegion
58% 59%
Pune 14% 19%
NH8 16% 10%
NH3 2% 2%
Others 10% 10%
10%NH8
HEAT MAP : GTI Port Terminal

Container movement around JNPT region via Truck
50%MUMBAI REGION
Heat Map : November 2017
The heat map above depicts the movement of containers in and around the Mumbai region.
4%NH3
18%Pune route
10 %Other
s
Region October'17
November’17
MumbaiRegion
51% 50%
Pune 15% 18%
NH8 22% 19%
NH3 2% 3%
Others 10% 10%
HEAT MAP : JNPCT Port Terminal
19%NH8
47%MUMBAI REGION
Heat Map : November 2017
The heat map above depicts the movement of containers in and around the Mumbai region.
3%NH3
20 %Pune route
10 %Other
s
Region October'17
November’17
MumbaiRegion
53% 47%
Pune 15% 20%
NH8 15% 20%
NH3 3% 3%
Others 10% 10%
20%NH8
HEAT MAP : NSICT Port Terminal
3%NH8

Heat Map: JNPT Region
Container Movement around JNPT region via TrainThe map shows the volume wise container movement through different railway routes in export and import cycle
78.3%
8.7%
13%
IMPORT CYCLE
68%
13.6%
18.4%
EXPORT CYCLE
Nagpur Route
Vadodara Route
Panvel Route
Panvel Route
Nagpur Route
Vadodara Route

The below table shows all the toll plazas covered under DLDS connected with JNPT , the average speed has marginally decreased between Bharthan and Kishangarh and Bharthan and Vasaad toll plaza.
Transit Time Analysis : TOLL PLAZA (1/2)
Avg. Travel Time & Speed between Toll Plazas (November'17)
Source Destination
Toll Plaza
Inter Distanc
e(Km)
Avg. Travel Time (Hr)
Avg. Speed(Km/Hr)
Previousmonth
Avg. speed (km/hr)
JNPT Khaniwade94 7.0 14.2 13.4
JNPT Khalapur 60 4.0 18.2 15.2
Khaniwade Charoti50 1.4 36.8 35.2
Charoti Boriach 126 4.6 28.3 27.7
Boriach Bharthan 142 4.3 33.3 33.0
Bharthan Kishangarh686 31.6 20.5 21.7
Bharthan Vasad 60 1.6 38.0 38.7
Kishangarh Daulatpura128 3.2 39.6 39.8
Dhule Khalghat 186 7 20 19.3
Mumbai-Pune
NH-3
NH-8
18.2 KM / Hr
14.2 KM / Hr36.8KM / Hr
28.3 KM / Hr
33.3KM / Hr
20.5 KM / Hr
20 KM / Hr
38 KM / Hr
Map
39.6 KM / Hr

The below table shows all the toll plazas covered under DLDS in Mundra region.
Transit Time Analysis : TOLL PLAZA (2/2)
Avg. Travel Time & Speed between Toll Plazas (November'17)
Source Destination
Toll Plaza
Inter Distance
(Km)
Avg. Travel Time (Hr)
Avg. SpeedNovember’
17(Km/Hr.)
Avg. SpeedOctober’17
(Km/Hr.)
MICT Mokha 28 1.2 23.3 22
Mokha Makhel 150 6.6 22.7 24.5
Mokha Surajbari 115 4.2 27.3 25.5
Map
Mokha Toll Plaza
NH-41
Surajbari Toll Plaza
NH-27
Makhel Toll Plaza
NH-15
23.3 KM / Hr
22.7 KM / Hr
27.3 KM / Hr
ANNEXURE

JNPT REGION :TRADE PERFORMANCE

JNPT PORT DWELL TIME TREND
52.440.3
56.7 49.8
JNPCT GTI NSICT NSIGT
November'17
Avg: 46.8 hrs.
JNPT Region Dwell time: Overall (in hrs.)
23.5 20.828.2 30.4
JNPCT GTI NSICT NSIGT
November'17
Avg: 23.5 hrs.
JNPT Region Dwell time: Import Cycle (in hrs.)
83.766.0 72.6 75.4
JNPCT GTI NSICT NSIGT
November'17
Avg: 73.8 hrs.
JNPT Region Dwell time: Export Cycle (in hrs.)
JNPT Import cycle Trend JNPT Export cycle Trend
JNPT port dwell time trend :The below table shows the overall port dwell time (i.e. import and export cycle combine) trend of all the JNPT* Port terminals for month of November’17. Port dwell time is the time duration between the entry of the container in Port terminal to the time it moves out of the Port terminal
The Average line represent the JNPT region average dwell time with respect to the individual component (i.e. Overall Dwell time, Import and Export cycle) for the present month
The below tables showcase the Import and Export cycle dwell time for both rail and truck bound containers for month of November’17

JNPT PORT DWELL TIME ANALYSIS : IMPORT CYCLE
The Port Dwell time data for train movement in import cycle is depicted below. Port dwell time is the time duration between the entry of the container in Port terminal to the time it moves out of the Port terminal
Port October’17 (in Hrs)November’17 (in
Hrs)
GTI 84 58.2
JNPCT 90 61.4
NSICT 123 78.9
NSIGT 185 81.4
PORT IMPORT via TRAIN
58.2 61.4 78.9 81.4
GTI JNPCT NSICT NSIGT
November'17
IMPORT CYCLE - PORT DWELL TIME(IN HOURS) (TRAIN)
Container Volume Handled : Day wise (via train)
43% 29% 15% 13%GTI :
JNPCT:
NSICT:
NSIGT:
More than 8 days
Within 5-8 days
Within2-5 days
Within 2 daysPort Terminals
Port Handling limit
39% 34% 15% 12%
32% 36% 19% 13%
33% 29% 17% 21%

JNPT PORT DWELL TIME ANALYSIS : IMPORT CYCLE
The Port Dwell time data for Truck movement in import cycle is depicted below. Port dwell time is the time duration between the entry of the container in Port terminal to the time it moves out of the Port terminal
PORT IMPORT via TRUCK
17.7 21.1 25.6 26.9
GTI JNPCT NSICT NSIGT
November'17
IMPORT CYCLE - PORT DWELL TIME(IN HOURS) (Truck)Port October’17 (in Hrs)
November’17 (in Hrs)
GTI 27 17.7
JNPCT 35 21.1
NSICT 40 25.6
NSIGT 37 26.9
Container Volume Handled : Day wise (via truck)
87% 11% 1% 1%GTI :
JNPCT:
NSICT:
NSIGT:
More than 8 days
Within 5-8 days
Within2-5 days
Within 2 daysPort Terminals
Port Handling limit
85% 13% 1% 1%
81% 17% 1% 1%
82% 16% 1% 1%

JNPT PORT DWELL TIME ANALYSIS : EXPORT CYCLE
The Port Dwell time data for train movement in Export cycle is depicted below. Port dwell time is the time duration between the entry of the container in Port terminal to the time it moves out of the Port terminal
PORT EXPORT via TRAIN
113.6 115.7 11695.8
GTI JNPCT NSICT NSIGT
November'17
Export CYCLE - PORT DWELL TIME(IN HOURS) (TRAIN)Port October’17 (in Hrs)
November’17 (in Hrs)
GTI 121 113.6
JNPCT 110 115.7
NSICT 108 116
NSIGT 103 95.8
Container Volume Handled : Day wise (via train)
15% 33% 38% 14%GTI :
JNPCT:
NSICT:
NSIGT:
More than 8 days
Within 5-8 days
Within2-5 days
Within 2 daysPort Terminals
Port Handling limit
11% 42% 32% 15%
14% 38% 35% 13%
18% 48% 29% 5%

The Port Dwell time data for Truck movement in Export cycle is depicted below. Port dwell time is the time duration between the entry of the container in Port terminal to the time it moves out of the Port terminal
6382.3 68.4 72
GTI JNPCT NSICT NSIGT
November '17
Export CYCLE - PORT DWELL TIME(IN HOURS) (Truck)
JNPT PORT DWELL TIME ANALYSIS : EXPORT CYCLE
PORT EXPORT via TRUCK
Port October’17 (in Hrs)November’17 (in
Hrs)
GTI 80 63
JNPCT 75 82.3
NSICT 62 68.4
NSIGT 58 72
Container Volume Handled : Day wise (via truck)
31% 66% 2% 1%GTI :
JNPCT:
NSICT:
NSIGT:
More than 8 days
Within 5-8 days
Within2-5 days
Within 2 daysPort Terminals
Port Handling limit
15% 65% 19% 1%
28% 64% 4% 4%
29% 60% 10% 1%

Container movement : JNPT region via Train
Container Handling time : Import Cycle Container handling time in import cycle refers to the time taken by container to reach 1st railway station (i.e. JNPT railway station) from the moment they have been cleared from Port (i.e. Port Out). The below data is for month of November’17
Terminal Gate Railway Siding OutG
TI
5.2 hrs Import Cycle
Railway Siding OutJNP
CT 3.4 hrs Import Cycle
Railway Siding OutNSI
CT 5.9 hrs Import Cycle
Railway Siding OutNSI
GT 6.2 hrs Import Cycle
Railway Siding Out
GTI
10.4 hrs Export Cycle
Railway Siding OutJNP
CT 9.6 hrs Export Cycle
Railway Siding OutNSI
CT 9.9 hrs Export Cycle
Railway Siding OutNSI
GT 9 hrs Export Cycle
Terminal Gate
Terminal Gate
Terminal Gate
Terminal Gate
Terminal Gate
Terminal Gate
Terminal Gate
Container Handling time : Export Cycle Container handling time in export cycle refers to the time taken by container to reach Port terminal (i.e. Port In) from last railway station (i.e. JNPT railway station). The below data is for month of November’17

ICD ANALYSIS : DWELL TIME
Dwell Time (in Hrs)
ICD October'17 November'17
ACTL ICD 87 114
Albatross Inland Ports Pvt. Ltd. 127 89
Allcargo Logistics Park ICD, Dadri 119 102
APM Terminals ICD, Dadri 118 116
CMA CGM Agencies ICD, Dadri 75 71
CONCOR ICD 177 158
CWC Loni 72 105
CWC Patparganj ICD 72 *
The table below depicts the dwell of all ICDs for month of October '17 and November17.ICD DWELL TIME ANALYSIS
ICD – DWELL OVERVIEW ( IN HRS )
114
89 102 116 71
158105
ACTL ICD Albatross InlandPorts Pvt. Ltd.
Allcargo LogisticsPark ICD, Dadri
APM TerminalsICD, Dadri
CMA CGMAgencies ICD,
Dadri
CONCOR ICD CWC Loni
November'17
Avrg.110 hrs.
Top Performing ICD
CMA CGM Agencies ICD, DadriDwell Time : 71 hrs.
Low Performing ICD
CONCOR ICD Dwell Time : 158 hrs.
*Note : Insufficient data entries were received in LDB system for CWC Patparganj ICD in November’17

LEAD TIME ANALYSIS
ICD ANALYSIS : Transit Time Analysis
ICD- AVG DELIVERY TIME PORT OUT TO ICD IN (TRAIN)
Region November'17
NCR region 3.3 days
Aurangabad 2.05 days
ICD- AVG DELIVERY TIME ICD OUT TO PORT IN (TRAIN)
Region November'17
NCR region 2.8 days
Aurangabad 2.3 days
Below table shows the average delivery time of ICD in import cycle i.e. Port out to ICD in via rail transportation
Below table shows the average delivery time of ICD in export cycle i.e. ICD out to port in via rail transportation
Transit Time Analysis
ICD- AVG LEAD TIME (TRAIN)
Region November'17
NCR region 10 days
Aurangabad 10.58 days
Below table shows the average lead time of ICD in import cycle i.e. Port in to ICD out via train. The ICD's in NCR region have low dwell time as compare to Aurangabad region, thus making the lead time for the Aurangabad region higher as compare to NCR region
Calculation :
Port Dwell Time + Port to ICD Delivery Time + ICD Dwell Time = Avg. Lead Time from Port to ICD

CFS ANALYSIS : DWELL TIME
CFS October'17 November'17
All Cargo Logistics CFS, Navi Mumbai 74 74
Ameya Logistics CFS, Navi Mumbai 84 89
APM (Maersk India) CFS, Navi Mumbai 81 86
Apollo Logisolutions CFS, Panvel 75 80Ashte Logistics CFS, Panvel 101 94
Balmer & Lawrie CFS, Navi Mumbai 77 78Continental Warehousing CFS, Navi Mumbai 84 77
CWC Dronagiri CFS, Navi Mumbai 52 71
CWC Hind Terminal CFS, Navi Mumbai 81 86
CWC Impex Park CFS, Navi Mumbai 55 *Dronogiri Rail Terminal CFS, Navi Mumbai 74 63
Gateway Distriparks CFS, Navi Mumbai 72 76
Indev Logistics CFS, Panvel 83 93
International Cargo Terminal CFS 90 92
Below table shows the dwell time for the respective CFS’s .
CFS October'17
November'17
International Cargo Terminals (ULA) CFS, NaviMumbai
9585
JWC Logistics Park CFS 89 87
Maersk Annex (APM)CFS, Navi Mumbai 102 93
Maharashtra State Corp CFS 72 63
Navkar Corporation Yard 1 CFS, Panvel 107 92
Navkar Corporation Yard 2 CFS, Panvel 89 87
Navkar Corporation Yard 3 CFS, Panvel 85 82
Ocean Gate CFS, Panvel 89 83
Punjab Conware CFS, Navi Mumbai 69 71
SBW Logistics CFS, Navi Mumbai 81 69
Seabird CFS, Navi Mumbai 88 91
Speedy Multimode CFS, JNPT 73 67
Transindia Logistics Park, Navi Mumbai 80 74
Vaishno Logistics CFS, Navi Mumbai 94 79
Take Care Logistics CFS 119 105
CFS Dwell Time (in hrs)
CFS DWELL TIME ANALYSIS
CFS – DWELL OVERVIEW ( IN HRS )
7489 86 80
9478 77 71
8663
7693 92 85 87 93
6392 87
82 83 71 6991
67 74 79105
November'17
Average: 81 hrs.
*Note : Insufficient data entries were received in LDB system for CWC Impex Park CFS, Navi Mumbai in November’17

Top Performing CFS's w.r.t Dwell time (November 2017)
Dronagiri Rail Terminal CFS, Navi MumbaiDwell Time : 63 Hrs
Maharashtra State Corp CFS Dwell Time : 63 Hrs
Below table shows the top performing CFS's
Below table shows the low performing CFS's
Low Performing CFS's w.r.t Dwell time (November 2017)
Take Care Logistics CFSDwell Time : 105 Hrs
Ashte Logistics CFS, Panvel Dwell Time : 94 Hrs
7.3.2 Top and Low Performing CFS's w.r.t Dwell Time for August 2017
Top and Low Performing CFS's w.r.t Dwell Time for November 2017

CFS DELIVERY TIME ANALYSIS
CFS - AVERAGE DELIVERY TIME - GTI TO ALL CFS’s IN MUMBAI
CFS November'17
Speedy Multimode Ltd CFS 1.6
Balmer & Lawrie & Co. Ltd.,CFS 1.8
Gateway Distriparks Ltd 2.5APM (Maersk India Pvt. Ltd)CFS 1.8Continental Warehousing (Nhava Sheva) Ltd. 1.4
Seabird Marine Services Pvt Ltd. 2.1
JWC Logistics Park Ltd CFS 3.1
Ameya Logistics Pvt. Ltd. 2.6
Ashte Logistics Pvt. Ltd. 3.0
NAVAKAR CORPORATION LTD.,YARD-1 CFS 3.1
Apollo Logisolutions Ltd. 4.5
Ocean Gate Container Terminals Pvt. Ltd.CFS 2.8
Indev Logistics Pvt. Ltd.CFS 3.4
Transindia Logistics Park Pvt, Ltd CFS 2.1
All Cargo Logistics Ltd., CFS1.7
Vaishno Logistics Yard CFS 2.2
NAVKAR CORPORATION LTD.,YARD-II CFS 3.0
PUNJAB CONWARE (PW) 1.8
DRONAGIRI RAIL TERMINAL 3.1
MAHARASHTRA STATE WARE. CORP. CFS 1.9
CWC LOGISTIC PARK - Opr.Hind Trmnl. 1.7
NAVKAR CORPORATION LTD.YARD-III CFS 2.9
International Cargo Terminal CFS 2.2
Maersk Annex (APM)CFS 2.3International Cargo Terminal CFS 2.1
SBW Logistics CFS , Navi Mumbai 2.9
AVERAGE DELIVERY TIME ( In Hrs )- GTI TO ALL CFS IN MUMBAI
Below table shows the average delivery time in import cycle from GTI to all the CFS's
AVERAGE DELIVERY TIME ( In Hrs )- JNPCT TO ALL CFS IN MUMBAI
CFS November'17
Speedy Multimode Ltd CFS) 1.6
Balmer & Lawrie & Co. Ltd.,CFS 2.5
Gateway Distriparks Ltd 2.8APM (Maersk India Pvt. Ltd)CFS 2.2Continental Warehousing (Nhava Sheva) Ltd. 1.8
Seabird Marine Services Pvt Ltd. 2.8
JWC Logistics Park Ltd CFS 3.2
Ameya Logistics Pvt. Ltd. 3.1
Ashte Logistics Pvt. Ltd. 3.2
NAVAKAR CORPORATION LTD.,YARD-1 CFS 3.2
Apollo Logisolutions Ltd. 5.8
Ocean Gate Container Terminals Pvt. Ltd.CFS 3.1
Indev Logistics Pvt. Ltd.CFS 3.8
Transindia Logistics Park Pvt, Ltd CFS 2.5
All Cargo Logistics Ltd., CFS1.9
Vaishno Logistics Yard CFS 1.8
NAVKAR CORPORATION LTD.,YARD-II CFS 3.1
PUNJAB CONWARE (PW) 1.8
DRONAGIRI RAIL TERMINAL 1.6
MAHARASHTRA STATE WARE. CORP. CFS 1.9
CWC LOGISTIC PARK - Opr.Hind Trmnl. 1.8
NAVKAR CORPORATION LTD.YARD-III CFS 3.3
International Cargo Terminal CFS 2.2
Maersk Annex (APM)CFS 2.5International Cargo Terminal CFS 2.3
SBW Logistics CFS , Navi Mumbai 3.7
CFS - AVERAGE DELIVERY TIME - JNPCT TO ALL CFS’s IN MUMBAI
Below table shows the average delivery time in import cycle from JNPCT to all the CFS's

CFS DELIVERY TIME ANALYSIS
CFS - AVERAGE DELIVERY TIME - NSICT TO ALL CFS’s IN MUMBAI
CFS November'17
Speedy Multimode Ltd CFS 1.4
Balmer & Lawrie & Co. Ltd.,CFS 1.8
Gateway Distriparks Ltd 3.0
APM (Maersk India Pvt. Ltd)CFS 1.8
Continental Warehousing (Nhava Sheva) Ltd. 1.4
Seabird Marine Services Pvt Ltd. 2.4
JWC Logistics Park Ltd CFS 2.7
Ameya Logistics Pvt. Ltd. 2.8
Ashte Logistics Pvt. Ltd. 3.2
NAVAKAR CORPORATION LTD.,YARD-1 CFS 3.0
Apollo Logisolutions Ltd. 4.2
Ocean Gate Container Terminals Pvt. Ltd.CFS 2.6
Indev Logistics Pvt. Ltd.CFS 4.7
Transindia Logistics Park Pvt, Ltd CFS 2.2
All Cargo Logistics Ltd., CFS1.4
Vaishno Logistics Yard CFS 1.6
NAVKAR CORPORATION LTD.,YARD-II CFS 3.1
PUNJAB CONWARE (PW) 1.8
DRONAGIRI RAIL TERMINAL 1.4
MAHARASHTRA STATE WARE. CORP. CFS 2.6
CWC LOGISTIC PARK - Opr.Hind Trmnl. 1.7
NAVKAR CORPORATION LTD.YARD-III CFS 3.8
International Cargo Terminals CFS 2.1
Maersk Annex (APM)CFS 2.2
International Cargo Terminal CFS 2.6
SBW Logistics CFS , Navi Mumbai 3.3
AVERAGE DELIVERY TIME ( In Hrs )- NSICT TO ALL CFS IN MUMBAI
Below table shows the average delivery time in import cycle from NSICT to all the CFS's
AVERAGE DELIVERY TIME ( In Hrs )- NSIGT TO ALL CFS IN MUMBAI
CFS November'17
Speedy Multimode Ltd CFS 1.8
Balmer & Lawrie & Co. Ltd.,CFS 1.7
Gateway Distriparks Ltd 2.7
APM (Maersk India Pvt. Ltd)CFS 2.2
Continental Warehousing (Nhava Sheva) Ltd. 1.8
Seabird Marine Services Pvt Ltd. 2.4
JWC Logistics Park Ltd CFS 3.5
Ameya Logistics Pvt. Ltd. 2.6
Ashte Logistics Pvt. Ltd. 3.4
NAVAKAR CORPORATION LTD.,YARD-1 CFS 4.2
Apollo Logisolutions Ltd. 3.5
Ocean Gate Container Terminals Pvt. Ltd.CFS 8.4
Indev Logistics Pvt. Ltd.CFS 3.5
Transindia Logistics Park Pvt, Ltd CFS 2.9
All Cargo Logistics Ltd., CFS2.3
Vaishno Logistics Yard CFS 2.0
NAVKAR CORPORATION LTD.,YARD-II CFS 3.2
PUNJAB CONWARE (PW) 1.6
DRONAGIRI RAIL TERMINAL 1.1
MAHARASHTRA STATE WARE. CORP. CFS 1.4
CWC LOGISTIC PARK - Opr.Hind Trmnl. 1.9
International Cargo Terminals CFS 2.0
Maersk Annex (APM)CFS 2.9
International Cargo Terminal CFS 2.3
SBW Logistics CFS , Navi Mumbai 3.2
CFS - AVERAGE DELIVERY TIME - NSIGT TO ALL CFS’s IN MUMBAI
Below table shows the average delivery time in import cycle from NSIGT to all the CFS's
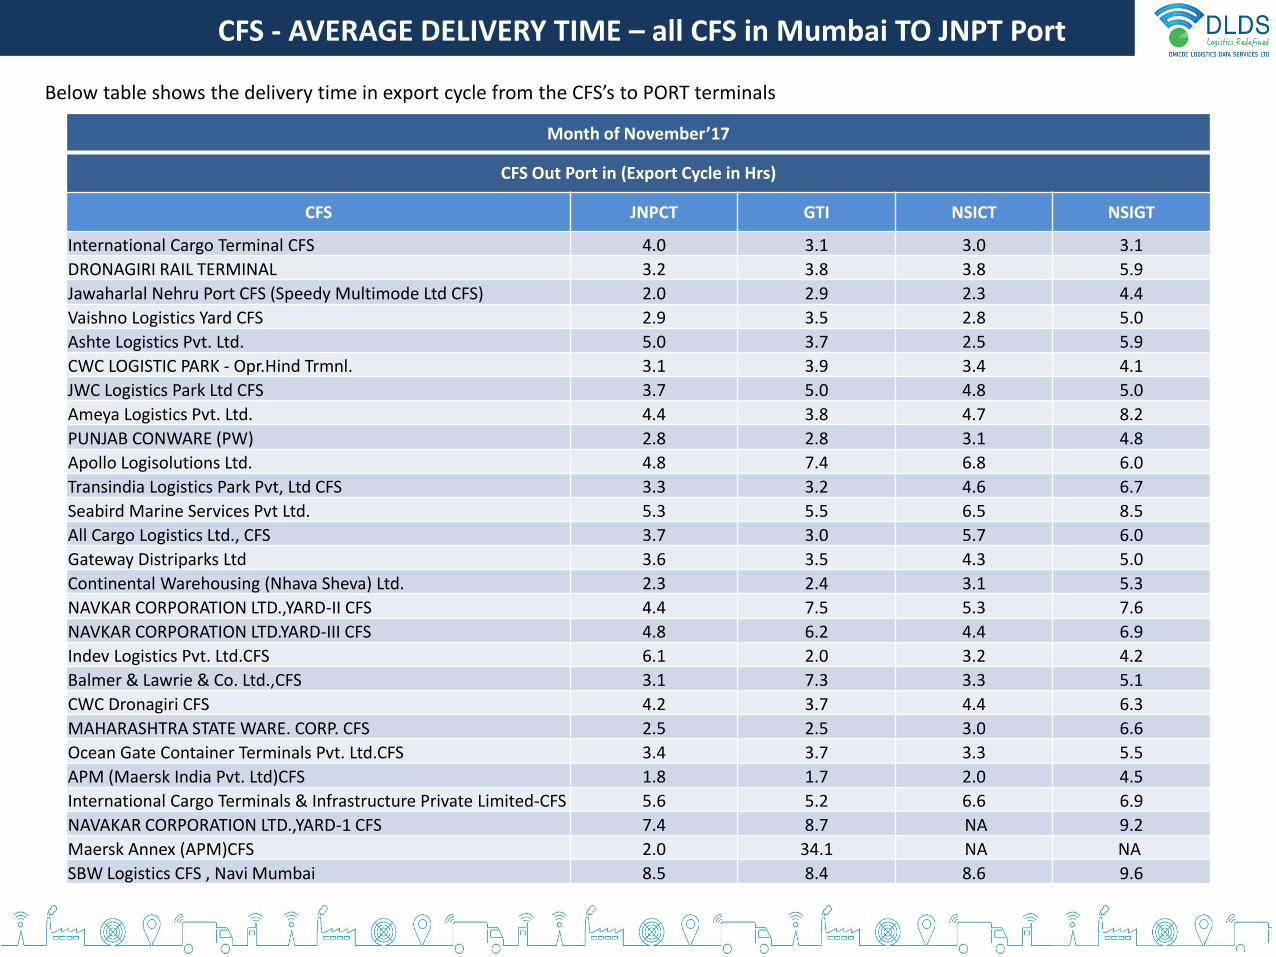
Below table shows the delivery time in export cycle from the CFS’s to PORT terminals
Month of November’17
CFS Out Port in (Export Cycle in Hrs)
CFS JNPCT GTI NSICT NSIGT
International Cargo Terminal CFS 4.0 3.1 3.0 3.1
DRONAGIRI RAIL TERMINAL 3.2 3.8 3.8 5.9
Jawaharlal Nehru Port CFS (Speedy Multimode Ltd CFS) 2.0 2.9 2.3 4.4
Vaishno Logistics Yard CFS 2.9 3.5 2.8 5.0
Ashte Logistics Pvt. Ltd. 5.0 3.7 2.5 5.9
CWC LOGISTIC PARK - Opr.Hind Trmnl. 3.1 3.9 3.4 4.1
JWC Logistics Park Ltd CFS 3.7 5.0 4.8 5.0
Ameya Logistics Pvt. Ltd. 4.4 3.8 4.7 8.2
PUNJAB CONWARE (PW) 2.8 2.8 3.1 4.8
Apollo Logisolutions Ltd. 4.8 7.4 6.8 6.0
Transindia Logistics Park Pvt, Ltd CFS 3.3 3.2 4.6 6.7
Seabird Marine Services Pvt Ltd. 5.3 5.5 6.5 8.5
All Cargo Logistics Ltd., CFS 3.7 3.0 5.7 6.0
Gateway Distriparks Ltd 3.6 3.5 4.3 5.0
Continental Warehousing (Nhava Sheva) Ltd. 2.3 2.4 3.1 5.3
NAVKAR CORPORATION LTD.,YARD-II CFS 4.4 7.5 5.3 7.6
NAVKAR CORPORATION LTD.YARD-III CFS 4.8 6.2 4.4 6.9
Indev Logistics Pvt. Ltd.CFS 6.1 2.0 3.2 4.2
Balmer & Lawrie & Co. Ltd.,CFS 3.1 7.3 3.3 5.1
CWC Dronagiri CFS 4.2 3.7 4.4 6.3
MAHARASHTRA STATE WARE. CORP. CFS 2.5 2.5 3.0 6.6
Ocean Gate Container Terminals Pvt. Ltd.CFS 3.4 3.7 3.3 5.5
APM (Maersk India Pvt. Ltd)CFS 1.8 1.7 2.0 4.5
International Cargo Terminals & Infrastructure Private Limited-CFS 5.6 5.2 6.6 6.9
NAVAKAR CORPORATION LTD.,YARD-1 CFS 7.4 8.7 NA 9.2
Maersk Annex (APM)CFS 2.0 34.1 NA NA
SBW Logistics CFS , Navi Mumbai 8.5 8.4 8.6 9.6
CFS - AVERAGE DELIVERY TIME – all CFS in Mumbai TO JNPT Port

JNPT REGION : CONGESTION ANALYSIS
Cluster 2
Cluster 5
Cluster 7
Cluster 4
Cluster 6
Cluster 3
Cluster 1
Congestion Analysis around Mumbai Region
JNPT
25 km
26 km
High Congestion
Cluster
Cluster with bottleneck
Medium Congestion
Cluster 8
GTI Terminal
Congestion Level
JNPCT Terminal
Congestion Level
NSICT Terminal
Congestion Level
NSIGT Terminal
Congestion Level
Export Cycle :-
Import Cycle :-
Export Cycle :-
Import Cycle :-
Export Cycle :-
Import Cycle :-
Export Cycle :-
Import Cycle :-
Note : Congestion is measured w.r.t actual time taken to cover the respective distance between clusters and terminals(Port to CFS)High Congestion Medium Congestion Low CongestionScale :
Cluster 1
JNPT Area
Cluster 2
Bhendkhal area, Khopate road
Cluster 3
Sonari area,JNPT road
Cluster 4
Chirle area , JNPT road
Cluster 5
Plaspa area, Coachi
kanyakumari Highway
Cluster 6
Salva apta rd area,
Bangalore highway
Cluster 7
Patilpada area, Khopate JNPT road
Note : Please find the respective CFS in each cluster in annexure section
Cluster 8
Taloja, NaviMumbai
Low Congestion

JNPT Region : Cluster Analysis
GTI terminal for month of November’17
ClustersNo. of
CFS's in Cluster
Distancefrom Port
(Km)
Import cycle time
(in Hrs)
Export cycle time (in Hrs)
Cluster 1 1 8 1.6 2.9
Cluster 2 6 13 2.1 3.9
Cluster 3 6 11 1.9 3.3
Cluster 4 1 13 2.2 3.5
Cluster 5 2 25 2.9 4.4
Cluster 6 6 25 3.1 6.8
Cluster 7 4 12 1.9 3.1
Cluster 8 1 34 2.9 8.4
Base on container movement from port to CFS in Mumbai region, 28 CFS's have been grouped into 8 Clusters on the basis of their vicinity.Below table shows all the clusters and the relevant data for GTI terminal
• In export cycle the GTI terminal is having congestion for traffic from cluster 8, cluster6
• In import cycle the movement of traffic towards cluster 6 is facing congestion
CFS Cluster : GTI Terminal
Export container usually aren’t allowed in the port before the arrival of their respective vessel so this unplanned transportation of the export containers from the CFS's to Port can cause bottlenecks
JNPCT terminal for month of November’17
ClustersNo. of
CFS's in Cluster
Distancefrom Port
(Km)
Import cycle time
(in Hrs)
Export cycle time (in Hrs)
Cluster 1 1 8 1.6 2.0
Cluster 2 6 13 2.3 3.1
Cluster 3 6 11 1.8 3.7
Cluster 4 1 13 1.8 2.9
Cluster 5 2 25 3.1 3.6
Cluster 6 6 25 3.2 4.8
Cluster 7 4 12 2.2 3.5
Cluster 8 1 34 3.7 8.5
CFS Cluster : JNPCT Terminal
• In export cycle the JNPCT terminal is having traffic congestion from cluster 8

JNPT Region : Cluster Analysis
NSICT terminal for month of November’17
ClustersNo. of
CFS's in Cluster
Distancefrom Port
(Km)
Import cycle time
(in Hrs)
Export cycle time (in Hrs)
Cluster 1 1 8 1.4 2.3
Cluster 2 6 13 2.1 3.3
Cluster 3 6 11 2.1 3.5
Cluster 4 1 13 1.6 2.8
Cluster 5 2 25 2.7 4.0
Cluster 6 6 25 3.5 4.4
Cluster 7 4 12 1.8 4.7
Cluster 8 1 34 3.3 8.6
Base on container movement from port to CFS in Mumbai region, 28 CFS's have been grouped into 8 Clusters on the basis of their vicinity.Below table shows all the clusters and the relevant data for GTI terminal
• In export cycle the NSICT terminal is having congestion for traffic from cluster 8 and cluster 6
• In import cycle the movement of traffic towards cluster 8, cluster 6 is facing congestion
CFS Cluster : NSICT Terminal
Export container usually aren’t allowed in the port before the arrival of their respective vessel so this unplanned transportation of the export containers from the CFS's to Port can cause bottlenecks
NSIGT terminal for month of November’17
ClustersNo. of
CFS's in Cluster
Distancefrom Port
(Km)
Import cycle time
(in Hrs)
Export cycle time (in Hrs)
Cluster 1 1 8 1.8 4.4
Cluster 2 6 13 2.2 4.7
Cluster 3 6 11 1.4 6.1
Cluster 4 1 13 2.0 5.0
Cluster 5 2 25 5.9 5.2
Cluster 6 6 25 3.5 6.5
Cluster 7 4 12 2.5 6.4
Cluster 8 1 34 3.2 18.6
CFS Cluster : NSIGT Terminal
• In export cycle the NSIGT terminal is having traffic congestion from cluster 7, cluster 8

• APM (Maersk India) CFS, Navi Mumbai
• Maersk Annex (APM)CFS, Navi Mumbai
• Balmer & Lawrie CFS, Navi Mumbai
• CWC Hind Terminal CFS, Navi Mumbai
• International Cargo Terminals (ULA) CFS, Navi Mumbai & Infrastructure Private Limited
• Gateway Distriparks CFS, Navi Mumbai
• International Cargo Terminal CFS
Cluster 2 (Bhendkhal area, Khopate road)
Cluster 1 (JNPT Area)
• Speedy Multimode CFS,JNPT • Punjab Conware CFS, Navi Mumbai• Dronogiri Rail Terminal CFS, Navi
Mumbai• CWC Impex Park CFS, Navi Mumbai• CWC Dronagiri CFS, Navi Mumbai• Maharashtra State Corp CFS• Seabird CFS, Navi Mumbai
Cluster 3Sonari area,JNPT road
Cluster 4(Chirle area , JNPT road)
• Vaishno Logistics CFS, Navi Mumbai
Cluster 5(Plaspa area, Coachi kanyakumari
Highway)
• JWC Logistics Park CFS• Ocean Gate CFS, Panvel
• Ashte Logistics CFS, Panvel• Apollo Logisolutions CFS, Panvel• Indev Logistics CFS, Panvel• Navkar Corporation Yrd 1 CFS,
Panvel• Navkar Corporation Yard 2 CFS,
Panvel• Navkar Corporation Yard 3 CFS,
Panvel
Cluster 6(Salva apta rd area, Bangalore highway)
Cluster 7(Patilpada area, Khopate JNPT road)
• All Cargo Logistics CFS, Navi Mumbai
• Transindia Logistics Park, Navi Mumbai
• Ameya Logistics CFS, Navi Mumbai• Continental Warehousing CFS, Navi
Mumbai
Below mentioned are all the CFS in the respective Clusters :
Cluster 8SBW

Thank You !!