dmu space analysis page 1 dmu space analysisbndtechsource.ucoz.com/v5_online_docs/digital... ·...
TRANSCRIPT
DMU Space Analysis
Preface
Using This Guide More Information Conventions
What's New?
Getting Started
Setting Up Your Session Measuring Minimum Distances Sectioning Detecting Clashes Measuring Between
User Tasks
Distance & Band Analysis About Distance & Band Analysis Measuring Minimum Distances & Distances Along X,Y,Z Running Band Analysis Exporting & Publishing Distance Results
Sectioning About Sectioning Creating Section Planes Creating Section Slices Creating Section Boxes More About the Section Viewer Creating 3D Section Cuts Manipulating Planes Directly Positioning Planes Using the Edit Position and Dimensions Command Positioning Planes On a Geometric Target Snapping Section Boxes to Planes Snapping Planes to Points and/or Lines Saving Section Results Managing the Update of Section Results More About the Contextual Menu
Interference Checking & Analysis About Interference Checking & Analysis Analyzing Part to Part Clashes Detecting Interferences Using the Clash Command Reading Clash Command Results Comparing Clash Command Results Making a Finer Analysis of Clash Command Results
1Page DMU Space Analysis Version 5 Release 13
Viewing Clash Command Results in a Dedicated Window Exporting Clash Command Resultsin Text or Model Format Publishing Clash Command Results Exporting Clash Results & Geometry in XML Format
Reading XML Clash Files Comparing Products Measure Tools
About Measure Tools Measuring Distance, Angle and Radius on 2D Documents Measuring Arc Sections Measuring Distances between Geometrical Entities Measuring Properties Measuring Thickness Measuring Inertia
Annotating Defining Groups Combining Space Analysis Commands
Sectioning in Interference & Distance Viewers Measuring Minimum Distance in the Section Viewer Sectioning & Visual Comparison
Batches and Macros for Interference Analysis Batch Processing CGR Files & Model Documents Batch Processing Existing CATProducts Using a Macro to Import Clash Results Saved in XML Format Using a Macro to Export Clash Results to an XML File
Using a Macro to Batch Process Product Comparison Knowledgeware Capabilities
Knowledgeware Rule-based Clash Space Analysis Functions in Knowledge Expert
Working with CGRs in DMU
DMU Space Analysis Interoperability
Working with ENOVIA LCA Optimal DMU PLM Usability for Space Analysis Interference Analysis / ENOVIA LCA Interoperability Retrieving Information from ENOVIA LCA
ENOVIA VPM / Interference Analysis Retrieving Information from ENOVIA VPM
Workbench Description
Menu Bar Toolbar Specification Tree
Customizing for DMU Space Analysis
DMU Clash DMU Clash - Detailed Computation DMU Clash - Penetration DMU Clash - Rule DMU Clash - Process DMU Sectioning
2Page DMU Space Analysis Version 5 Release 13

DMU Distance
Glossary
Index
3Page DMU Space Analysis Version 5 Release 13
PrefaceDMU Space Analysis is a CAD-independent product dedicated to interference analysis, sectioning, measurement and 3D comparison. It addresses the design review environment of digital mock-ups (DMU) and can handle a wide range of products from consumer goods to very large automotive or aerospace projects as well as plants, ships and heavy machinery.
DMU Space Analysis is a dedicated DMU Navigator workbench and is available on both UNIX and Windows environments.
This guide is organized as follows:
● Getting Started: steps you through a scenario to get you acquainted with the product.
● User Tasks: provides a step-by-step guide for using DMU Space Analysis. Useful tips are given for getting the most out of the product. Also includes information on knowledgeware capabilities and a task on batch interference analysis.
● Workbench Description: describes DMU Space Analysis-dedicated menu bar and workbench toolbar.
● Customizing: contains information allowing you to customize your personal environment.
● Glossary: defines terms that are specific to DMU Space Analysis.
Using This GuideMore Information
Conventions
4Page DMU Space Analysis Version 5 Release 13
Using This GuideThe user should be familiar with basic Infrastructure Version 5 concepts such as document windows, standard and view toolbars.
To get the most out of DMU Space Analysis, use the following user guide wizard. It will help you better locate information relevant to you as well as to the way you work.
User Guide WizardGo to:
I am a first time user The getting started tutorial. Once you have finished, you should move on to the user task section of this guide. This steps you through basic procedures.
I have used DMU Space Analysis before
Your DMU Version 5 session and start reviewing your own documents. If you need some help in understanding tools and commands, use the on-line help. You can also take a look at the user task section of this guide to locate information with which you are not already familiar.
I want to know more about Commands
Distance & Band Analysis: measures minimum distance, distance along x, y and z as well as minimum distance within a user-defined range.
Sectioning: offers a wide variety of sectioning tools including plane positioning, viewing and saving of results.
Clash: checks your document for clash, contact and clearance conflicts.
Compare Products: compares two products to detect differences between them.
Arc Through Three Points: measures the length, radius and angle of an arc drawn through three points.
Measure Between: measures distances and angles between geometrical entities or points.
Measure Item: measures properties associated to the selected item.
Measure Inertia: measures the inertia properties of an object.
2D Measure: measures distances, angles and radius on 2D documents of both pixel and vector type.
Group: defines groups of products.
5Page DMU Space Analysis Version 5 Release 13
Where to Find More InformationPrior to reading this book, we recommend that you read the DMU Navigator User's Guide.
You may also like to read the following complementary product guides, for which the appropriate license is required:
● DMU Fitting Simulator User's Guide
● DMU Kinematics Simulator User's Guide
● DMU Optimizer User's Guide
For information on automation capabilities, see Space Analysis on the Automation Documentation Home Page. You can write macro scripts for Clash, Distance & Band Analysis, Sectioning and Inertia interactive commands.
6Page DMU Space Analysis Version 5 Release 13
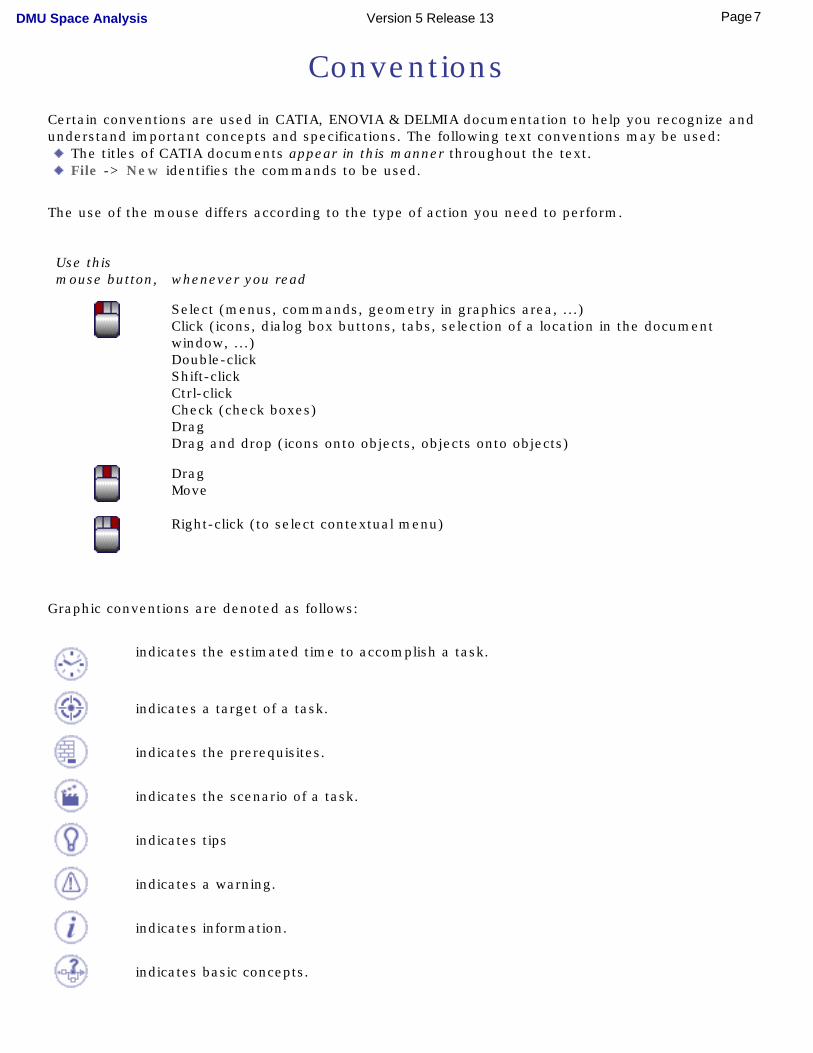
ConventionsCertain conventions are used in CATIA, ENOVIA & DELMIA documentation to help you recognize and understand important concepts and specifications. The following text conventions may be used: The titles of CATIA documents appear in this manner throughout the text. File -> New identifies the commands to be used.
The use of the mouse differs according to the type of action you need to perform.
Use thismouse button, whenever you read
Select (menus, commands, geometry in graphics area, ...)Click (icons, dialog box buttons, tabs, selection of a location in the document window, ...)Double-clickShift-clickCtrl-clickCheck (check boxes)DragDrag and drop (icons onto objects, objects onto objects)
DragMove
Right-click (to select contextual menu)
Graphic conventions are denoted as follows:
indicates the estimated time to accomplish a task.
indicates a target of a task.
indicates the prerequisites.
indicates the scenario of a task.
indicates tips
indicates a warning.
indicates information.
indicates basic concepts.
7Page DMU Space Analysis Version 5 Release 13
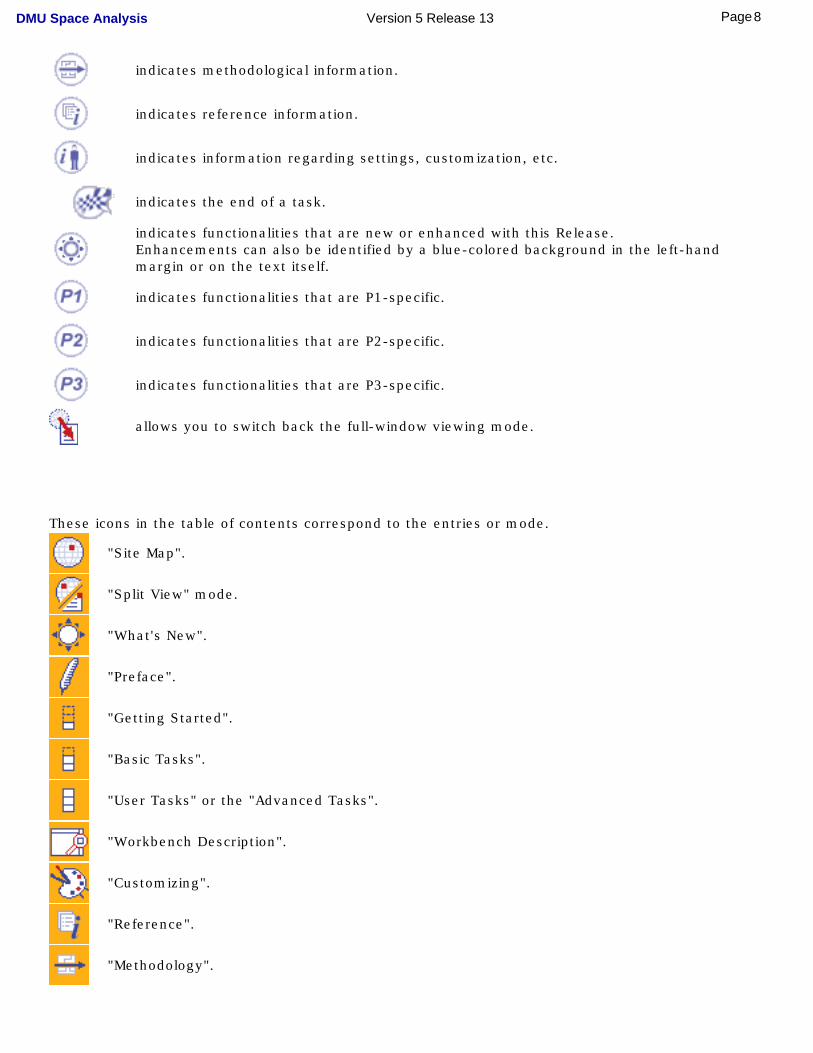
indicates methodological information.
indicates reference information.
indicates information regarding settings, customization, etc.
indicates the end of a task.
indicates functionalities that are new or enhanced with this Release.Enhancements can also be identified by a blue-colored background in the left-hand margin or on the text itself.
indicates functionalities that are P1-specific.
indicates functionalities that are P2-specific.
indicates functionalities that are P3-specific.
allows you to switch back the full-window viewing mode.
These icons in the table of contents correspond to the entries or mode.
"Site Map".
"Split View" mode.
"What's New".
"Preface".
"Getting Started".
"Basic Tasks".
"User Tasks" or the "Advanced Tasks".
"Workbench Description".
"Customizing".
"Reference".
"Methodology".
8Page DMU Space Analysis Version 5 Release 13

"Glossary".
"Index".
9Page DMU Space Analysis Version 5 Release 13
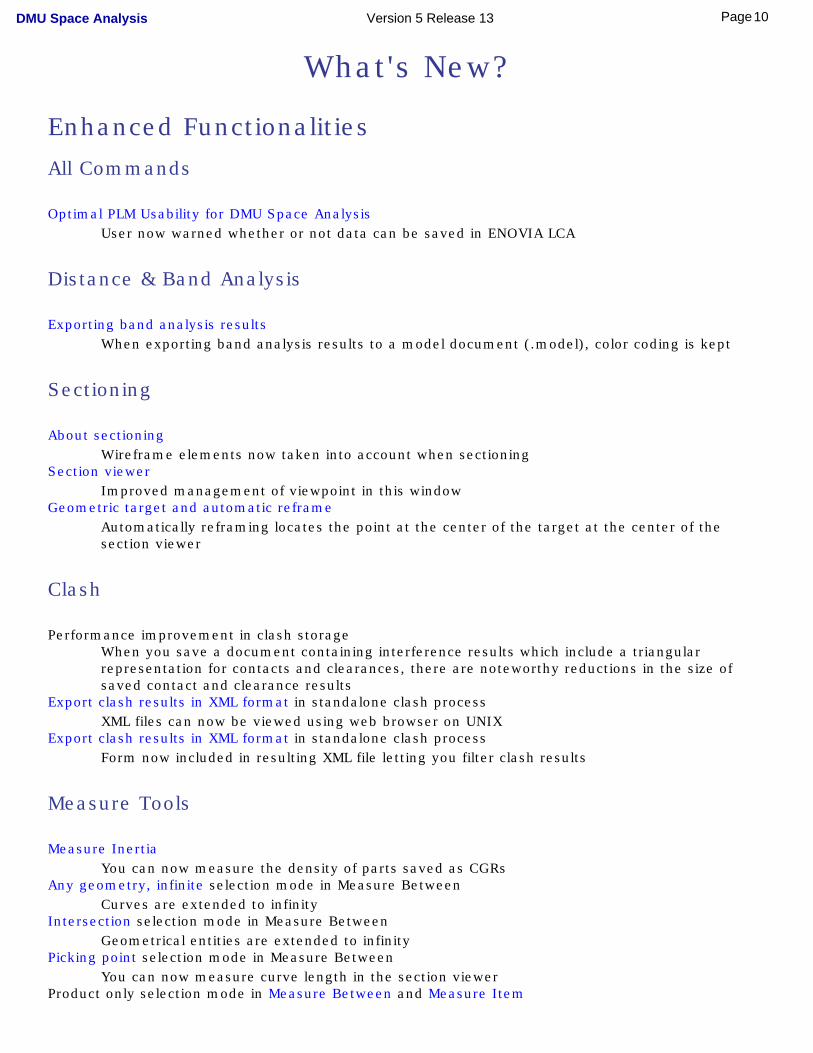
What's New?
Enhanced Functionalities
All Commands
Optimal PLM Usability for DMU Space AnalysisUser now warned whether or not data can be saved in ENOVIA LCA
Distance & Band Analysis
Exporting band analysis resultsWhen exporting band analysis results to a model document (.model), color coding is kept
Sectioning
About sectioningWireframe elements now taken into account when sectioning
Section viewerImproved management of viewpoint in this window
Geometric target and automatic reframeAutomatically reframing locates the point at the center of the target at the center of the section viewer
Clash
Performance improvement in clash storageWhen you save a document containing interference results which include a triangular representation for contacts and clearances, there are noteworthy reductions in the size of saved contact and clearance results
Export clash results in XML format in standalone clash processXML files can now be viewed using web browser on UNIX
Export clash results in XML format in standalone clash processForm now included in resulting XML file letting you filter clash results
Measure Tools
Measure InertiaYou can now measure the density of parts saved as CGRs
Any geometry, infinite selection mode in Measure BetweenCurves are extended to infinity
Intersection selection mode in Measure BetweenGeometrical entities are extended to infinity
Picking point selection mode in Measure BetweenYou can now measure curve length in the section viewer
Product only selection mode in Measure Between and Measure Item
10Page DMU Space Analysis Version 5 Release 13
New mode lets you select product geometry to specify the productUpdating measures
Improved management of measure update in Measure Between, Measure Item and Measure Inertia
Customizing Settings
DMU Sectioning tabNew checkbox to control the behavior of grid resizingNew option to manage wireframe elements
Measure Tools tabNew checkbox to save density in CGR files
11Page DMU Space Analysis Version 5 Release 13
Getting Started
This tutorial will guide you step-by-step through your first Space Analysis session, allowing you to get acquainted with the product.
You will need a DMU Navigator Version 5 session and should be familiar with basic concepts such as document windows, standard and view toolbars.
You should be able to complete this tutorial in about 15 minutes.
Setting Up Your SessionMeasuring Minimum Distances
SectioningDetecting Clashes
Measuring Between
12Page DMU Space Analysis Version 5 Release 13
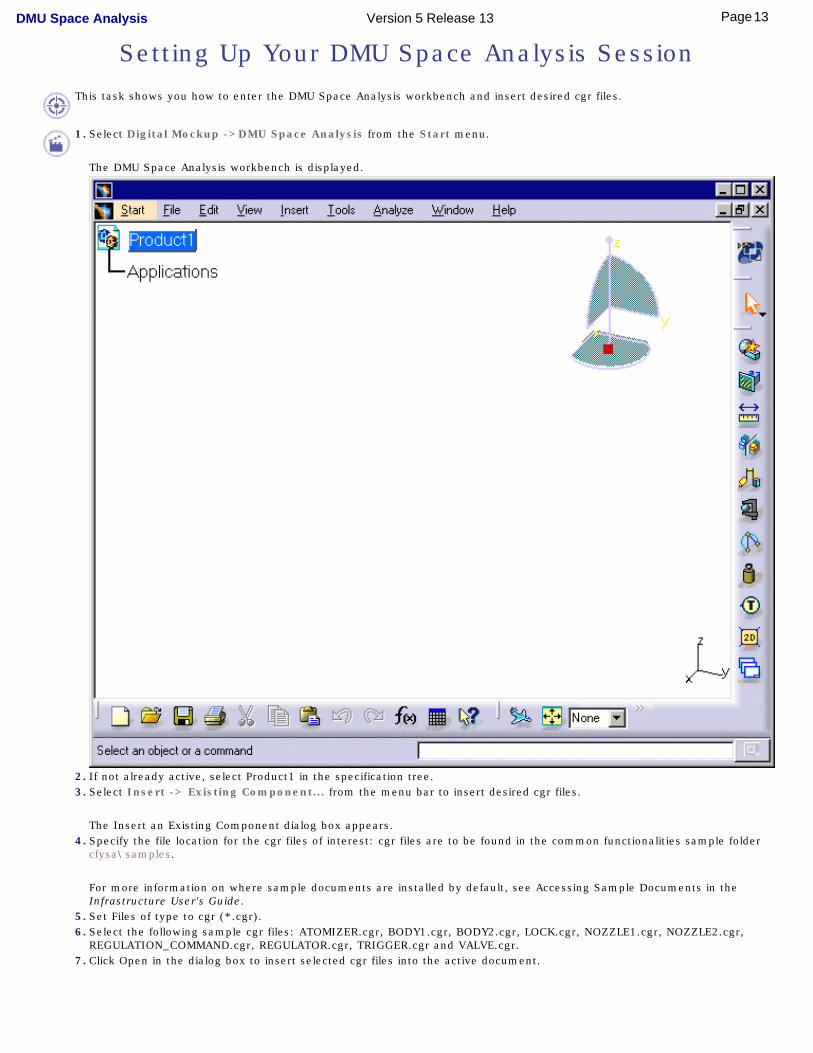
Setting Up Your DMU Space Analysis Session
This task shows you how to enter the DMU Space Analysis workbench and insert desired cgr files.
1. Select Digital Mockup ->DMU Space Analysis from the Start menu.
The DMU Space Analysis workbench is displayed.
2. If not already active, select Product1 in the specification tree.3. Select Insert -> Existing Component... from the menu bar to insert desired cgr files.
The Insert an Existing Component dialog box appears.4. Specify the file location for the cgr files of interest: cgr files are to be found in the common functionalities sample folder
cfysa\samples.
For more information on where sample documents are installed by default, see Accessing Sample Documents in the Infrastructure User's Guide.
5. Set Files of type to cgr (*.cgr).6. Select the following sample cgr files: ATOMIZER.cgr, BODY1.cgr, BODY2.cgr, LOCK.cgr, NOZZLE1.cgr, NOZZLE2.cgr,
REGULATION_COMMAND.cgr, REGULATOR.cgr, TRIGGER.cgr and VALVE.cgr. 7. Click Open in the dialog box to insert selected cgr files into the active document.
13Page DMU Space Analysis Version 5 Release 13
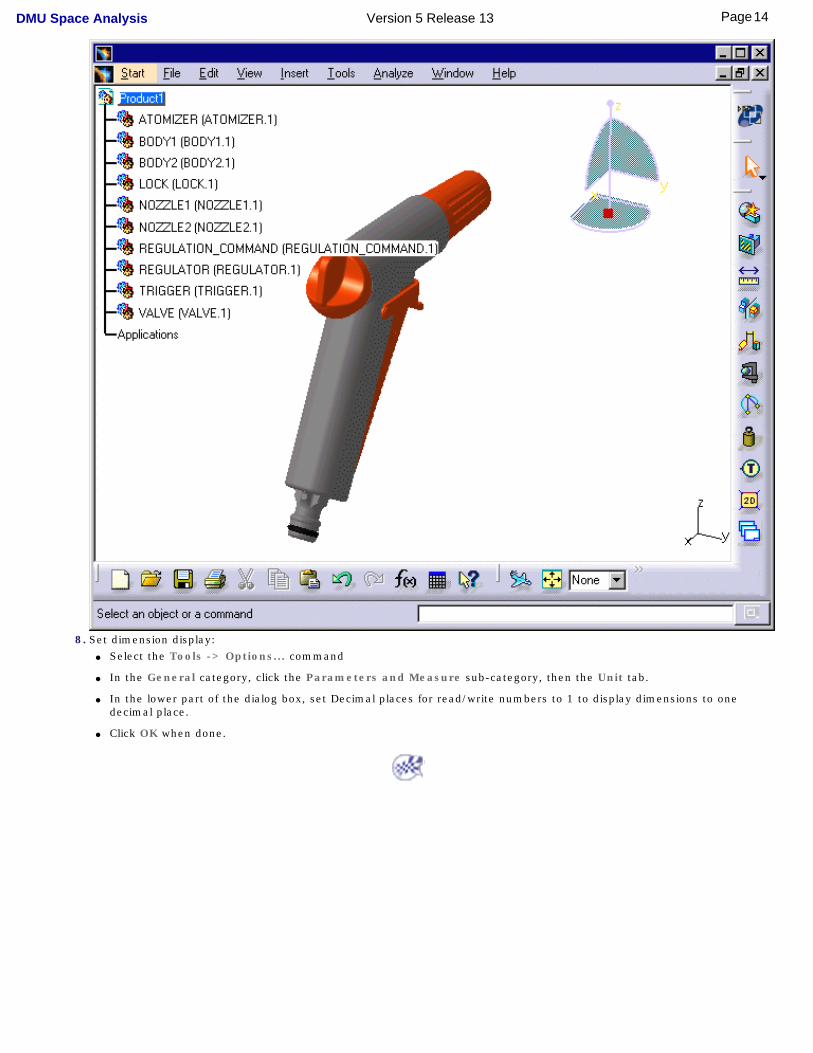
8. Set dimension display: ● Select the Tools -> Options... command
● In the General category, click the Parameters and Measure sub-category, then the Unit tab.
● In the lower part of the dialog box, set Decimal places for read/write numbers to 1 to display dimensions to one decimal place.
● Click OK when done.
14Page DMU Space Analysis Version 5 Release 13
Measuring Minimum Distances between Products
This task shows you how to measure minimum distances between products.
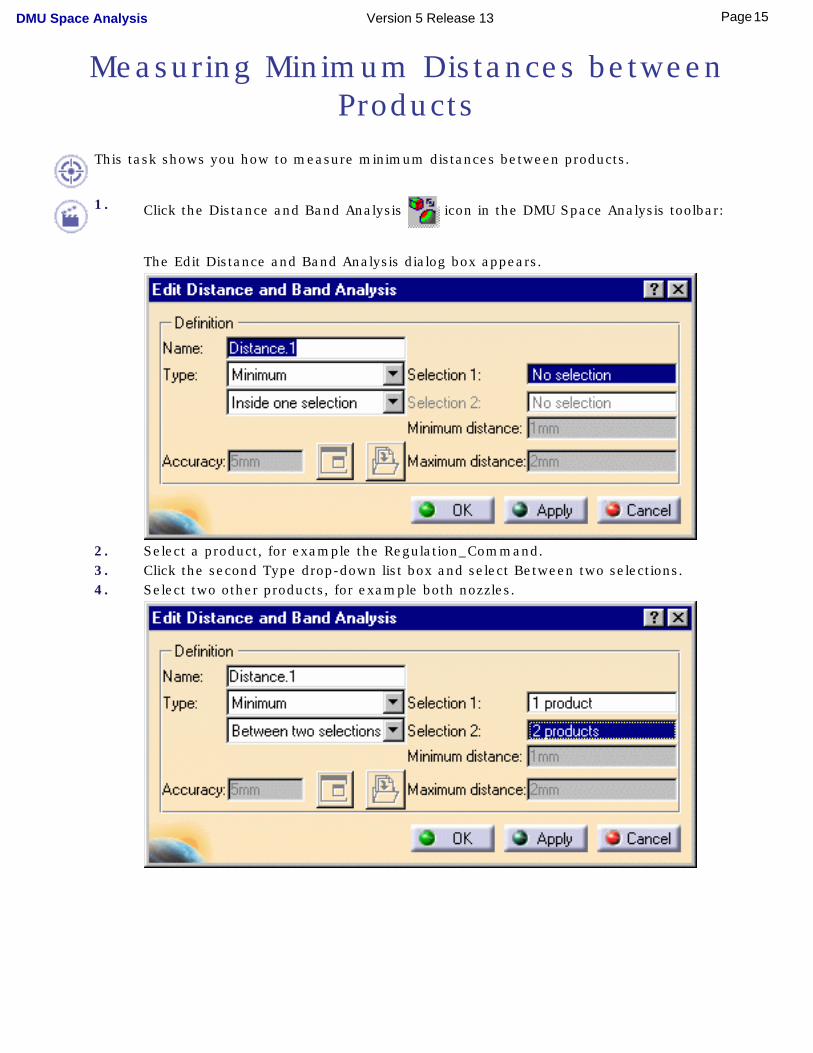
1. Click the Distance and Band Analysis icon in the DMU Space Analysis toolbar:
The Edit Distance and Band Analysis dialog box appears.
2. Select a product, for example the Regulation_Command.3. Click the second Type drop-down list box and select Between two selections.4. Select two other products, for example both nozzles.
15Page DMU Space Analysis Version 5 Release 13
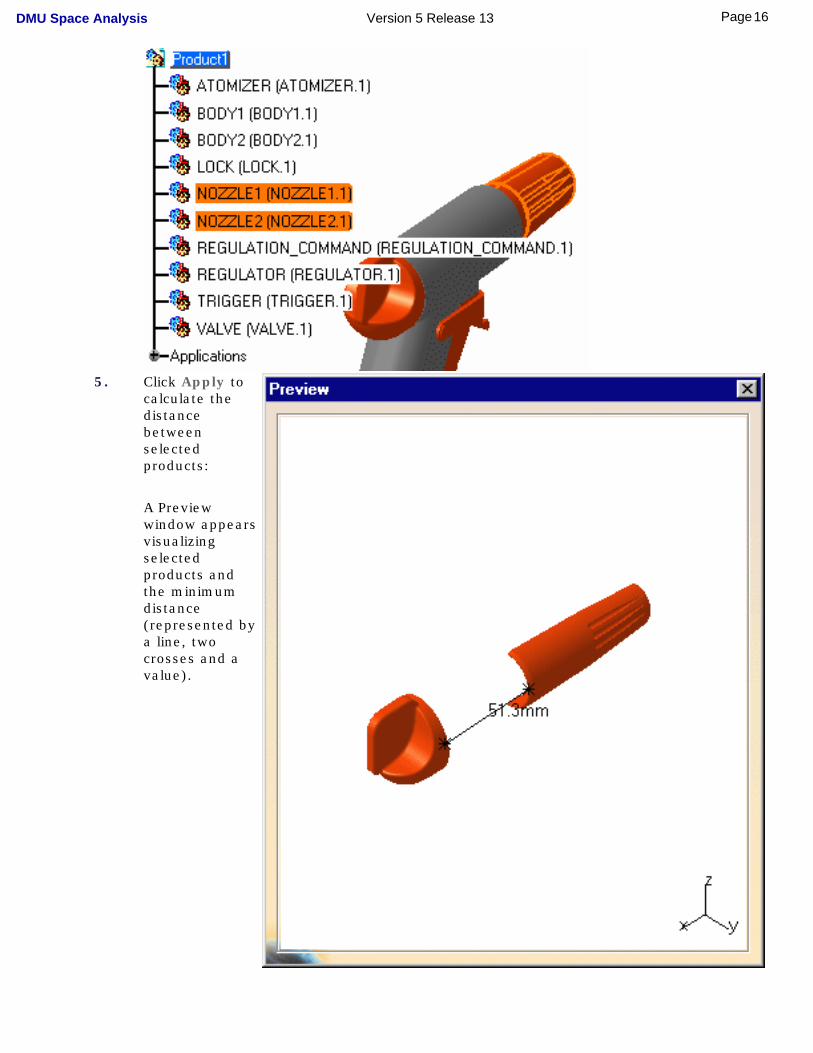
5. Click Apply to calculate the distance between selected products:
A Preview window appears visualizing selected products and the minimum distance (represented by a line, two crosses and a value).
16Page DMU Space Analysis Version 5 Release 13
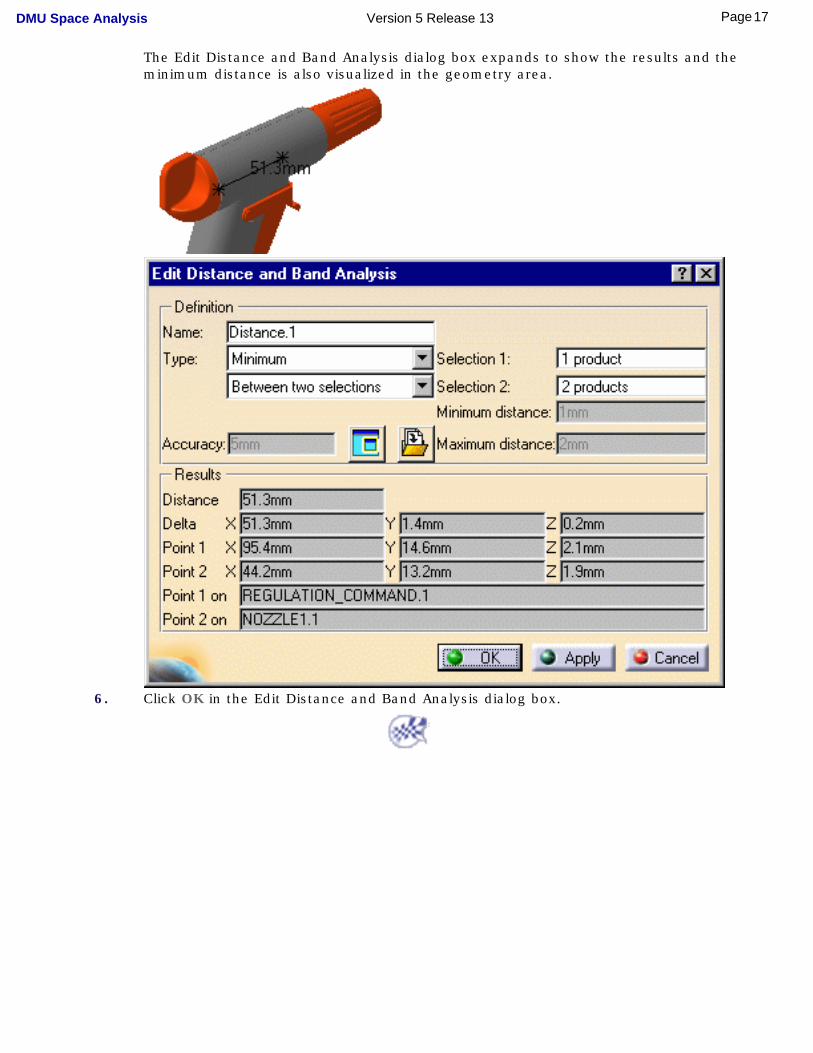
The Edit Distance and Band Analysis dialog box expands to show the results and the minimum distance is also visualized in the geometry area.
6. Click OK in the Edit Distance and Band Analysis dialog box.
17Page DMU Space Analysis Version 5 Release 13
Sectioning
This task shows you how to create a section plane on the minimum distance.
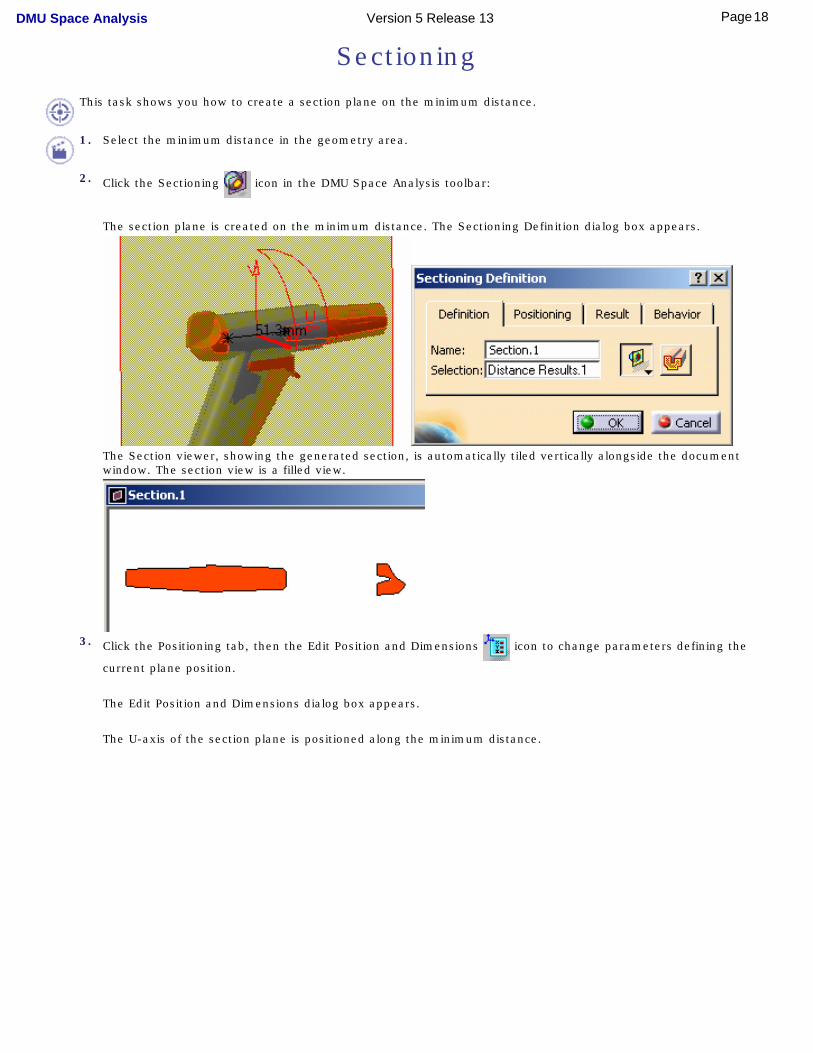
1. Select the minimum distance in the geometry area.
2. Click the Sectioning icon in the DMU Space Analysis toolbar:
The section plane is created on the minimum distance. The Sectioning Definition dialog box appears.
The Section viewer, showing the generated section, is automatically tiled vertically alongside the document window. The section view is a filled view.
3. Click the Positioning tab, then the Edit Position and Dimensions icon to change parameters defining the
current plane position.
The Edit Position and Dimensions dialog box appears.
The U-axis of the section plane is positioned along the minimum distance.
18Page DMU Space Analysis Version 5 Release 13
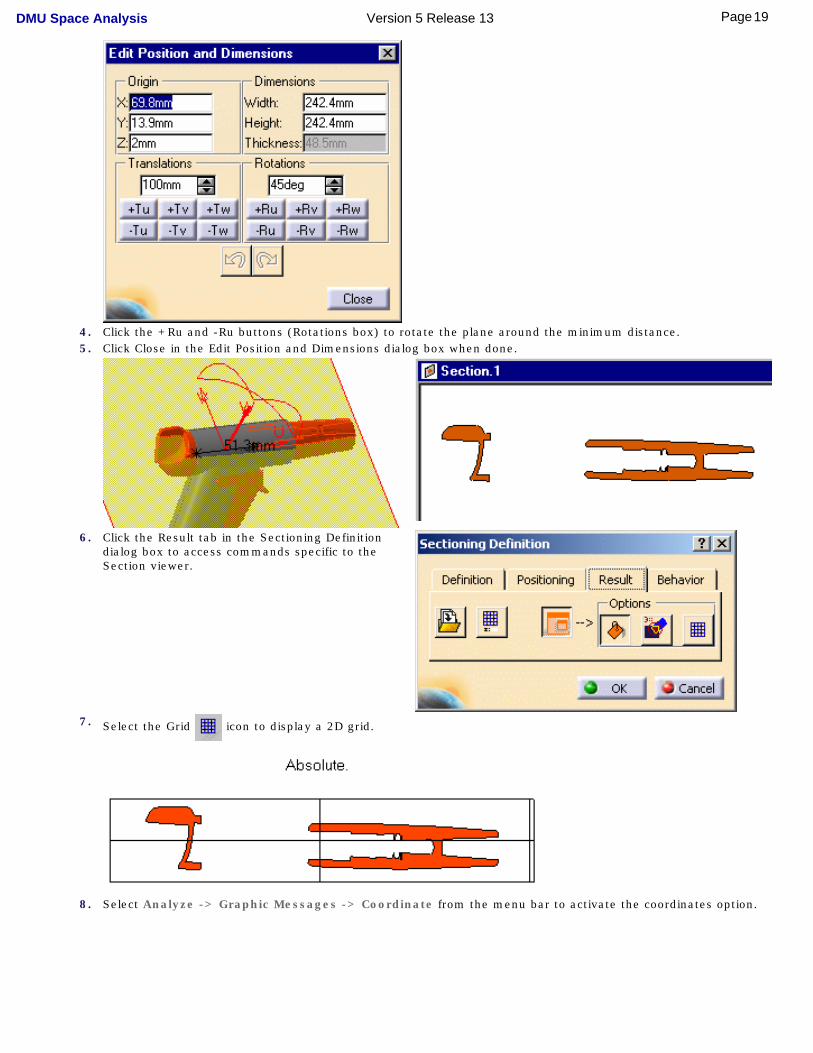
4. Click the +Ru and -Ru buttons (Rotations box) to rotate the plane around the minimum distance.5. Click Close in the Edit Position and Dimensions dialog box when done.
6. Click the Result tab in the Sectioning Definition dialog box to access commands specific to the Section viewer.
7. Select the Grid icon to display a 2D grid.
8. Select Analyze -> Graphic Messages -> Coordinate from the menu bar to activate the coordinates option.
19Page DMU Space Analysis Version 5 Release 13
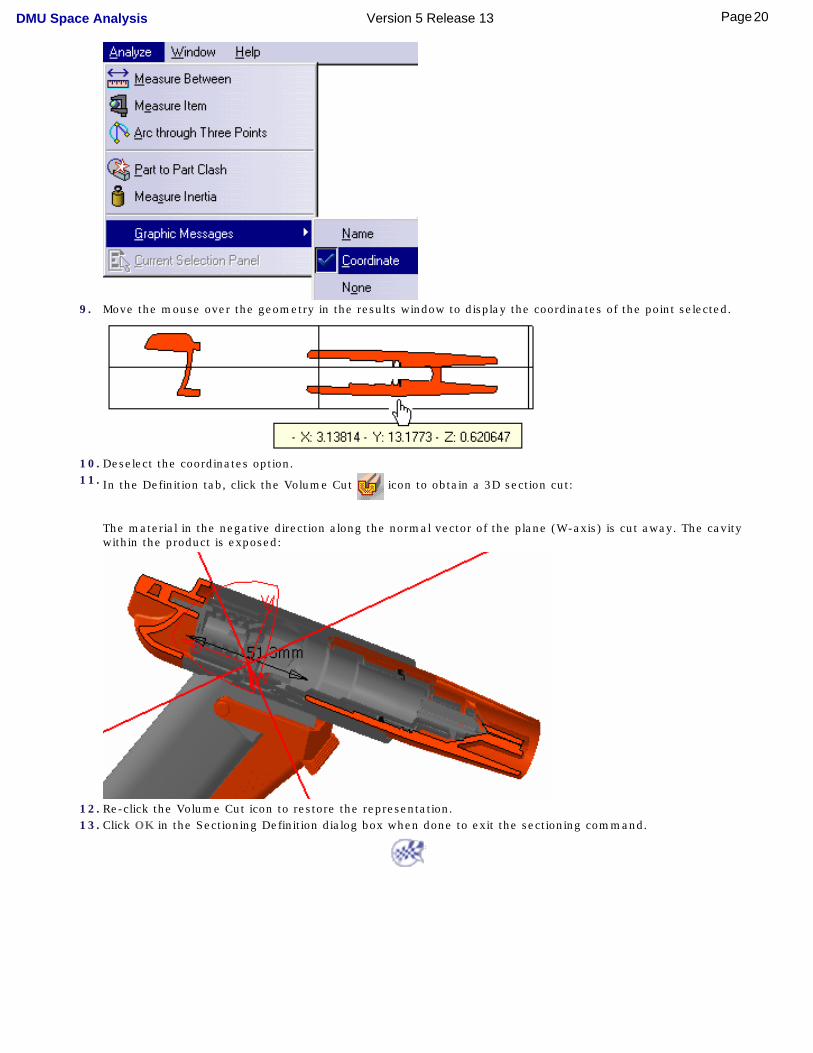
9. Move the mouse over the geometry in the results window to display the coordinates of the point selected.
10. Deselect the coordinates option.11. In the Definition tab, click the Volume Cut icon to obtain a 3D section cut:
The material in the negative direction along the normal vector of the plane (W-axis) is cut away. The cavity within the product is exposed:
12. Re-click the Volume Cut icon to restore the representation.13. Click OK in the Sectioning Definition dialog box when done to exit the sectioning command.
20Page DMU Space Analysis Version 5 Release 13
Detecting Clashes
This task shows you how to detect contacts and clashes between all the components in your document.
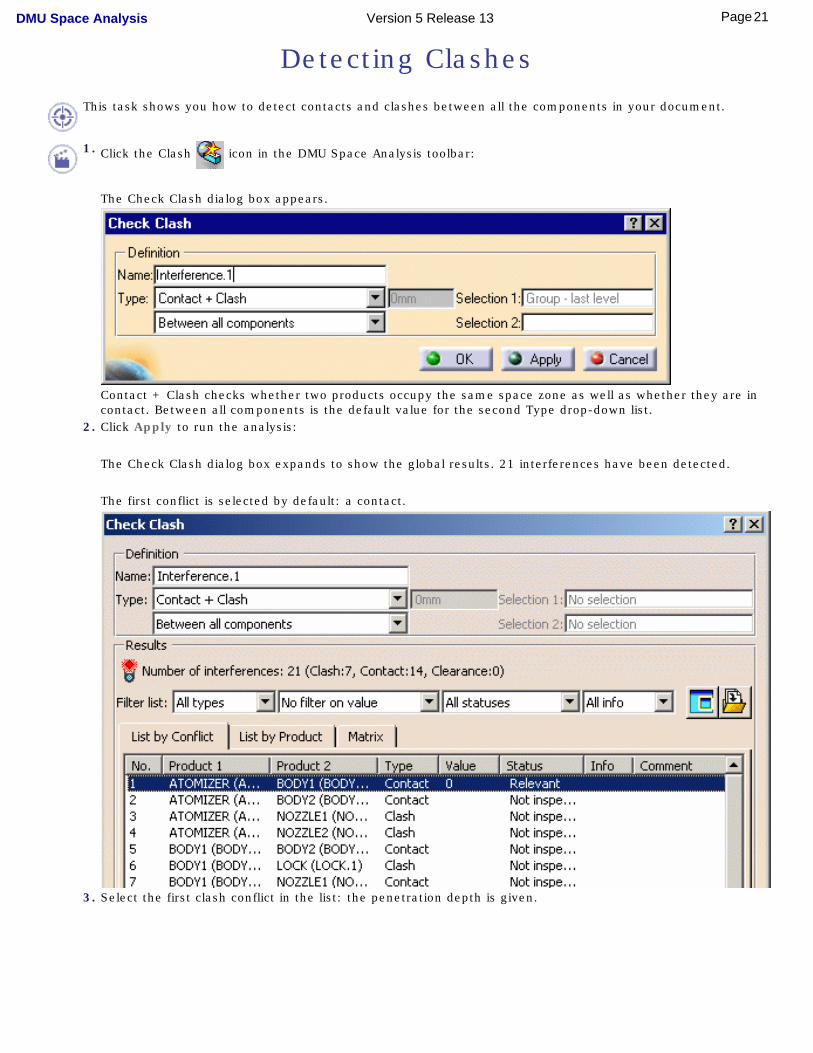
1. Click the Clash icon in the DMU Space Analysis toolbar:
The Check Clash dialog box appears.
Contact + Clash checks whether two products occupy the same space zone as well as whether they are in contact. Between all components is the default value for the second Type drop-down list.
2. Click Apply to run the analysis:
The Check Clash dialog box expands to show the global results. 21 interferences have been detected.
The first conflict is selected by default: a contact.
3. Select the first clash conflict in the list: the penetration depth is given.
21Page DMU Space Analysis Version 5 Release 13
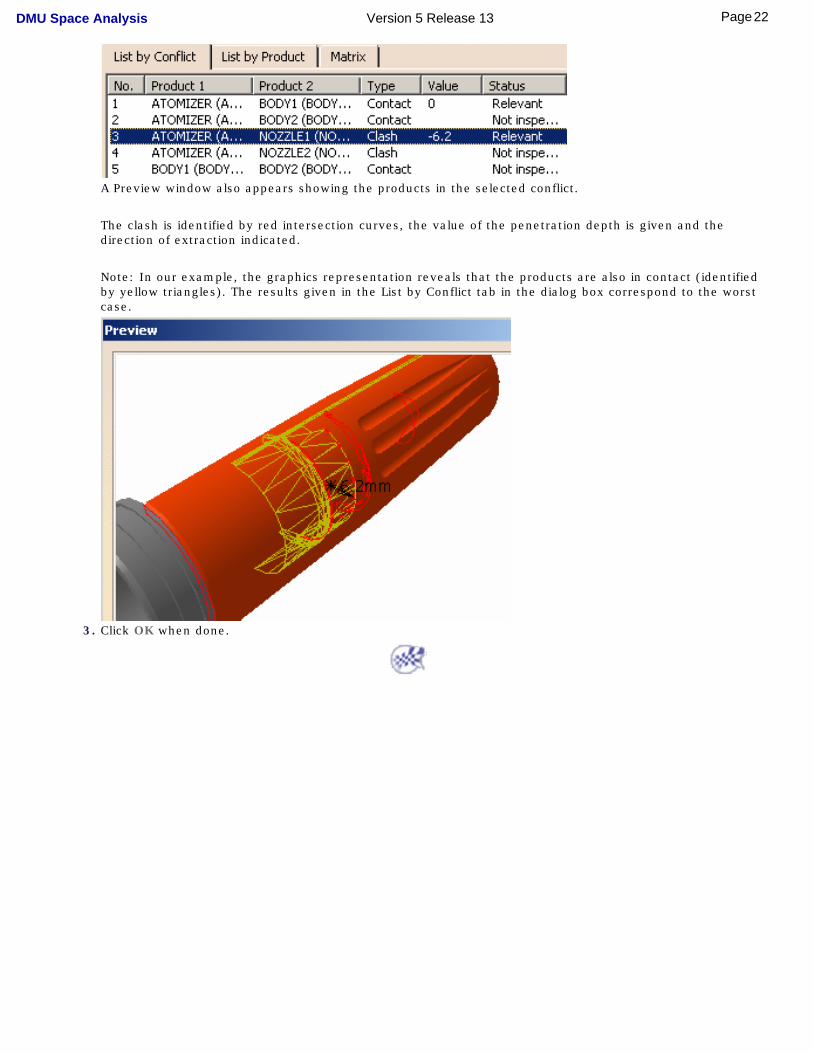
A Preview window also appears showing the products in the selected conflict.
The clash is identified by red intersection curves, the value of the penetration depth is given and the direction of extraction indicated.
Note: In our example, the graphics representation reveals that the products are also in contact (identified by yellow triangles). The results given in the List by Conflict tab in the dialog box correspond to the worst case.
3. Click OK when done.
22Page DMU Space Analysis Version 5 Release 13
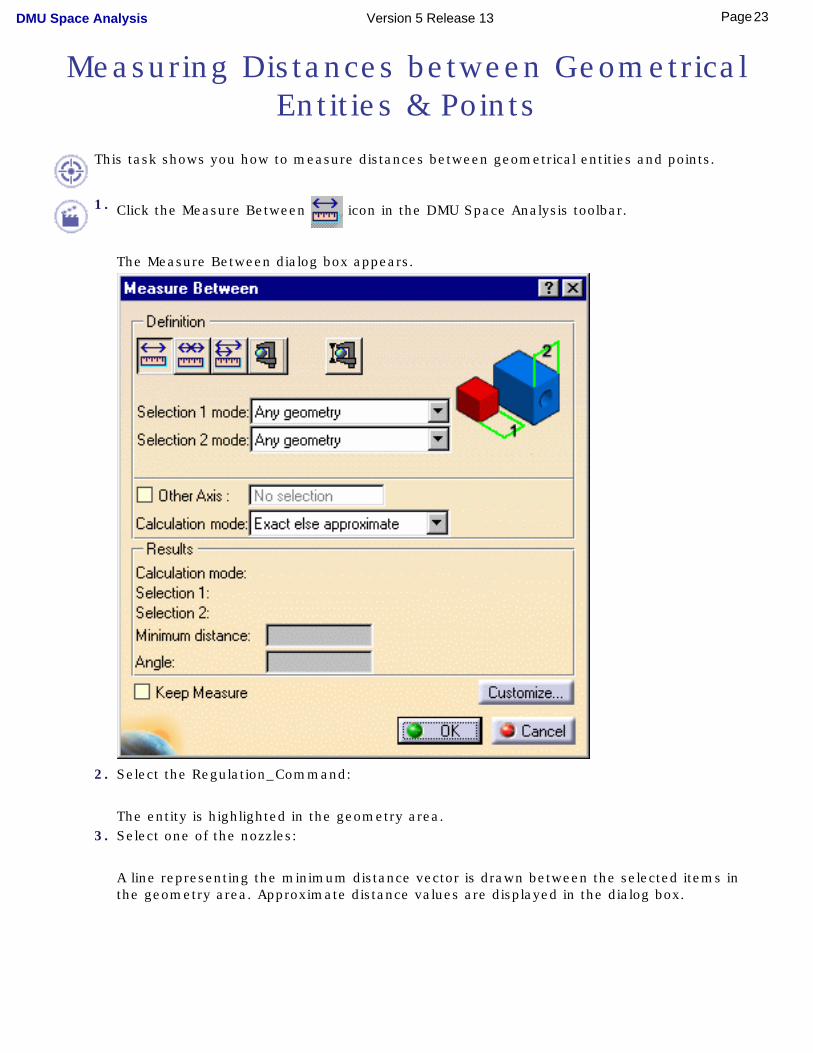
Measuring Distances between Geometrical Entities & Points
This task shows you how to measure distances between geometrical entities and points.
1. Click the Measure Between icon in the DMU Space Analysis toolbar.
The Measure Between dialog box appears.
2. Select the Regulation_Command:
The entity is highlighted in the geometry area.3. Select one of the nozzles:
A line representing the minimum distance vector is drawn between the selected items in the geometry area. Approximate distance values are displayed in the dialog box.
23Page DMU Space Analysis Version 5 Release 13
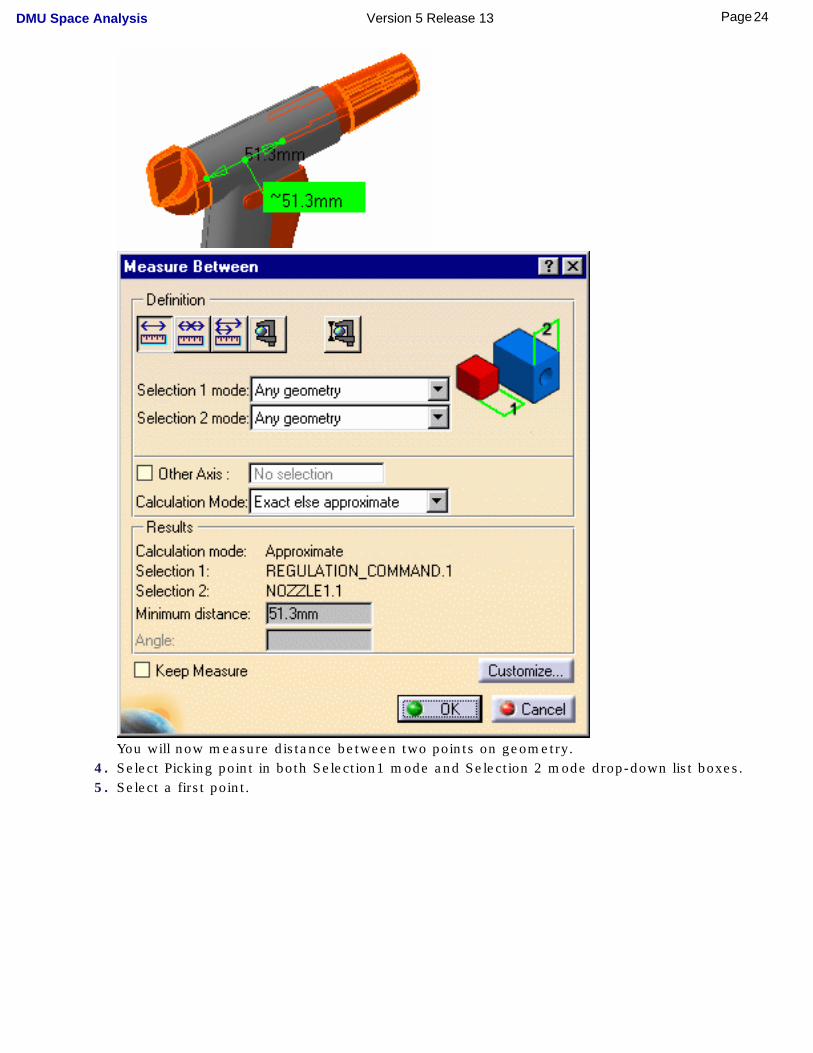
You will now measure distance between two points on geometry.4. Select Picking point in both Selection1 mode and Selection 2 mode drop-down list boxes.5. Select a first point.
24Page DMU Space Analysis Version 5 Release 13
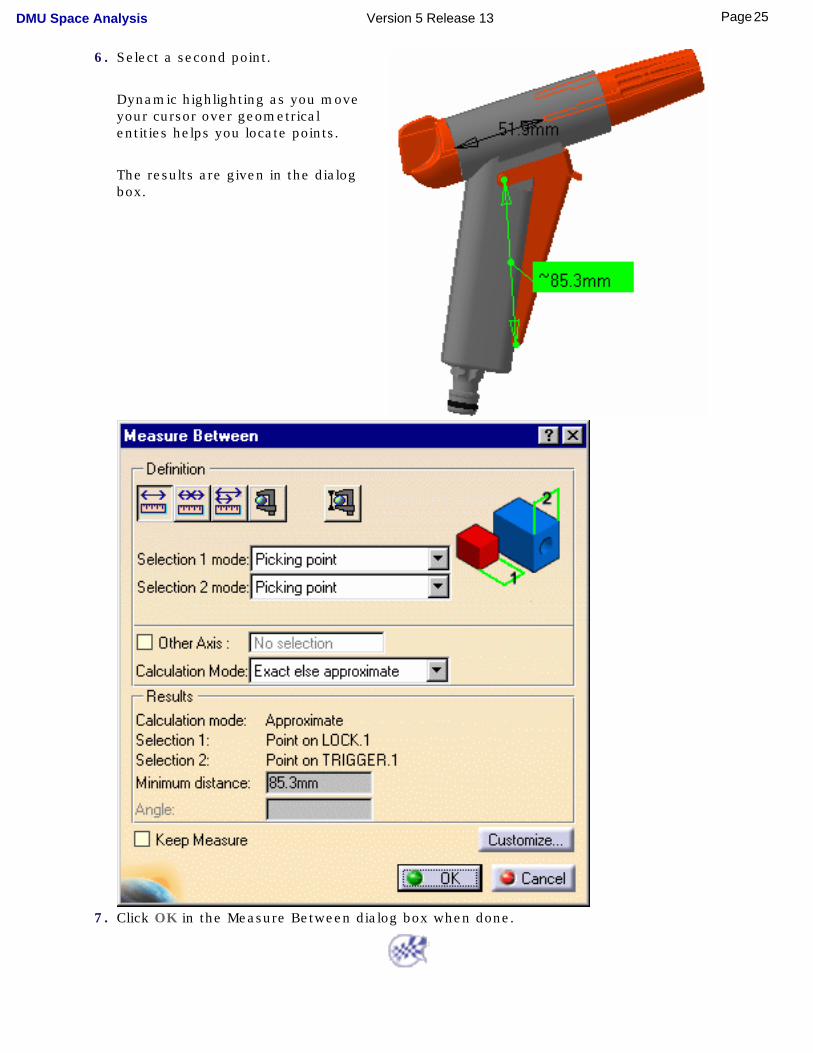
6. Select a second point.
Dynamic highlighting as you move your cursor over geometrical entities helps you locate points.
The results are given in the dialog box.
7. Click OK in the Measure Between dialog box when done.
25Page DMU Space Analysis Version 5 Release 13
User Tasks
The tasks you will perform in the DMU Space Analysis workbench involve interference analysis, sectioning, distance and band analysis, 3D geometric comparison, exact measurement, and mass and inertia computation.
More advanced tasks cover combining commands, batch processing and knowledgeware capabilities.
Distance & Band AnalysisSectioning
Interference Checking & AnalysisComparing Products
Measure ToolsAnnotating
Defining GroupsCombining Space Analysis Commands
Batches and Macros for Interference AnalysisUsing a Macro to Batch Process Product Comparison
Knowledgeware CapabilitiesWorking with CGRs in DMU
26Page DMU Space Analysis Version 5 Release 13
Distance & Band Analysis
About distance & band analysis: Gives general information on the Edit Distance and Band Analysis command.
Measure minimum distances and distances along X,Y,and Z: Click the Distance and Band Analysis icon, define the type in the Edit Distance and Band Analysis dialog box, then select products to measure and click Apply.
Run band analysis: Click the Distance and Band Analysis icon, measure the minimum distance then select Band Analysis in the Type box. Define the band and set the accuracy then click Apply.
Export & publish distance results: Click the Export As icon and select the desired format.
27Page DMU Space Analysis Version 5 Release 13
About Distance & Band Analysis
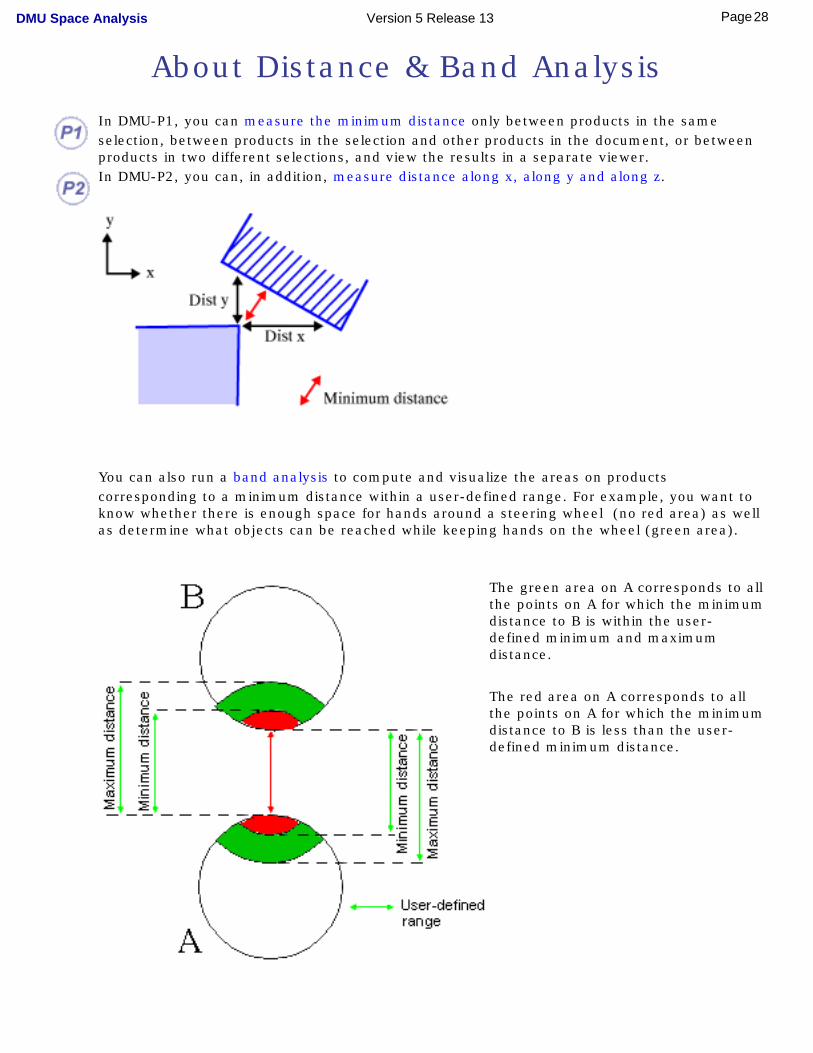
In DMU-P1, you can measure the minimum distance only between products in the same selection, between products in the selection and other products in the document, or between products in two different selections, and view the results in a separate viewer.In DMU-P2, you can, in addition, measure distance along x, along y and along z.
You can also run a band analysis to compute and visualize the areas on products corresponding to a minimum distance within a user-defined range. For example, you want to know whether there is enough space for hands around a steering wheel (no red area) as well as determine what objects can be reached while keeping hands on the wheel (green area).
The green area on A corresponds to all the points on A for which the minimum distance to B is within the user-defined minimum and maximum distance.
The red area on A corresponds to all the points on A for which the minimum distance to B is less than the user-defined minimum distance.
28Page DMU Space Analysis Version 5 Release 13
Distance and Band Analysis Results
Results differ depending on the sag value used.Note: sag is offset from the skin inwards.
Associativity
Distance measurements are associative in both DMU-P1 and P2. If you modify one of the products (for example, move it or change the contents of a group), just run the measurement again to obtain the updated results.
Creating Groups of Products
In DMU-P2, prior to running your distance analysis, you can create groups containing the
product(s) you want to analyze using the Group icon in the DMU Space Analysis toolbar or Insert -> Group... in the menu bar.
Groups created are identified in the specification tree and can be selected from there for the analysis. Only one group per selection can be defined.
29Page DMU Space Analysis Version 5 Release 13
Measuring Minimum Distances & Distances Along X,Y,Z
This task explains how to measure minimum distance and distance along X, along Y and along Z between products.
In this example, you will measure the minimum distance and the distance along z between products in two different selections.Measuring distances along a direction (X, Y or Z) is a P2 functionality.
Insert the following sample cgr files: ATOMIZER.cgr, BODY1.cgr, BODY2.cgr, LOCK.cgr, NOZZLE1.cgr, NOZZLE2.cgr, REGULATION_COMMAND.cgr, REGULATOR.cgr, TRIGGER.cgr and VALVE.cgr.
They are to be found in the online documentation filetree in the common functionalities sample folder cfysa\samples.
1. Click the Distance and Band Analysis icon in the DMU Space Analysis toolbar,
or select Insert -> Distance and Band Analysis from the menu bar to calculate distances:
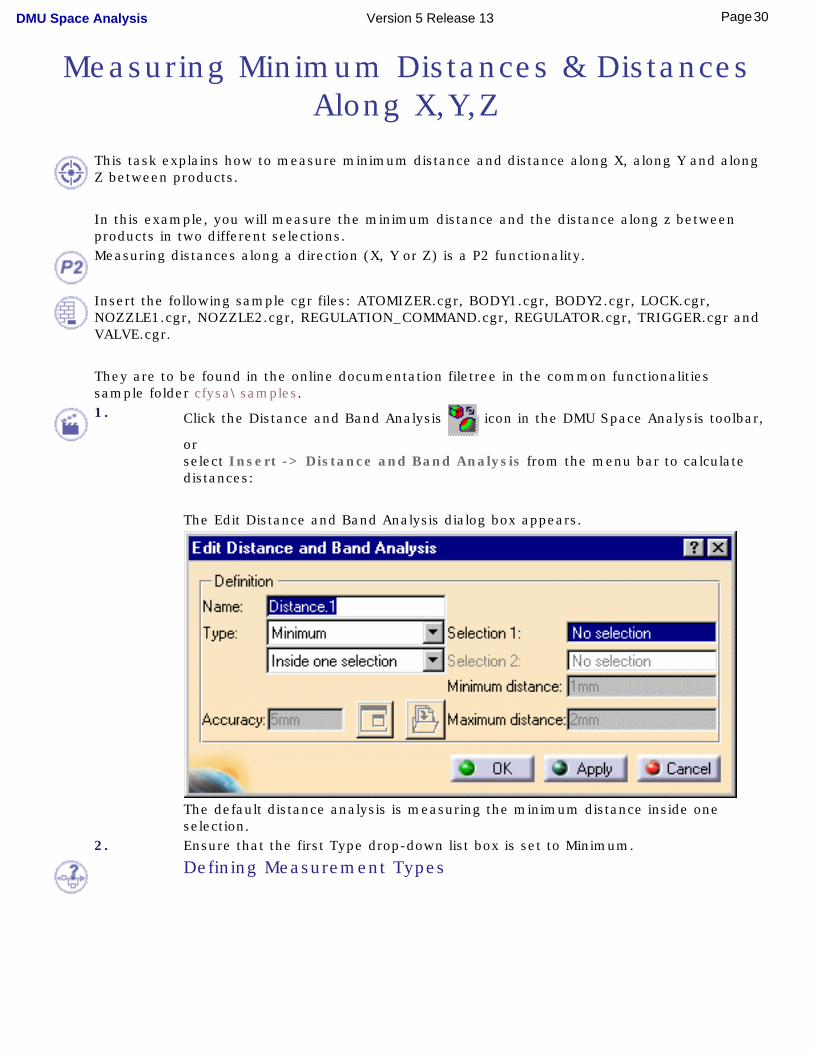
The Edit Distance and Band Analysis dialog box appears.
The default distance analysis is measuring the minimum distance inside one selection.
2. Ensure that the first Type drop-down list box is set to Minimum.
Defining Measurement Types
30Page DMU Space Analysis Version 5 Release 13
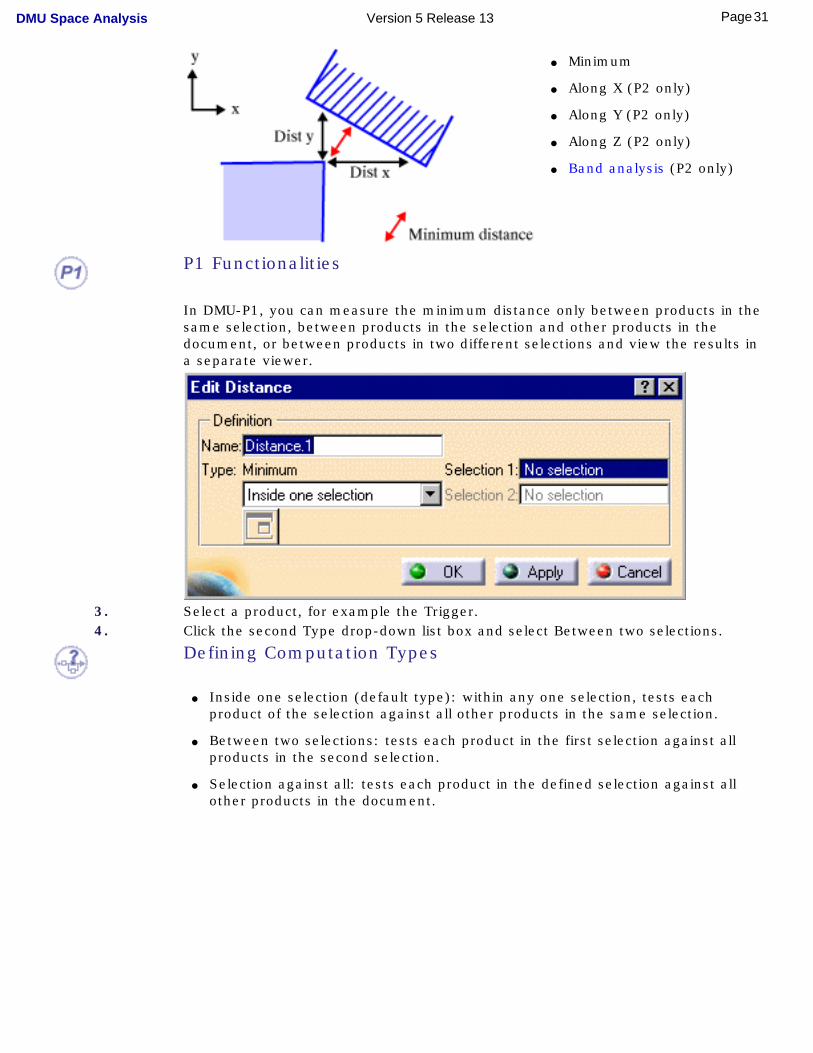
● Minimum
● Along X (P2 only)
● Along Y (P2 only)
● Along Z (P2 only)
● Band analysis (P2 only)
P1 Functionalities
In DMU-P1, you can measure the minimum distance only between products in the same selection, between products in the selection and other products in the document, or between products in two different selections and view the results in a separate viewer.
3. Select a product, for example the Trigger.4. Click the second Type drop-down list box and select Between two selections.
Defining Computation Types
● Inside one selection (default type): within any one selection, tests each product of the selection against all other products in the same selection.
● Between two selections: tests each product in the first selection against all products in the second selection.
● Selection against all: tests each product in the defined selection against all other products in the document.
31Page DMU Space Analysis Version 5 Release 13
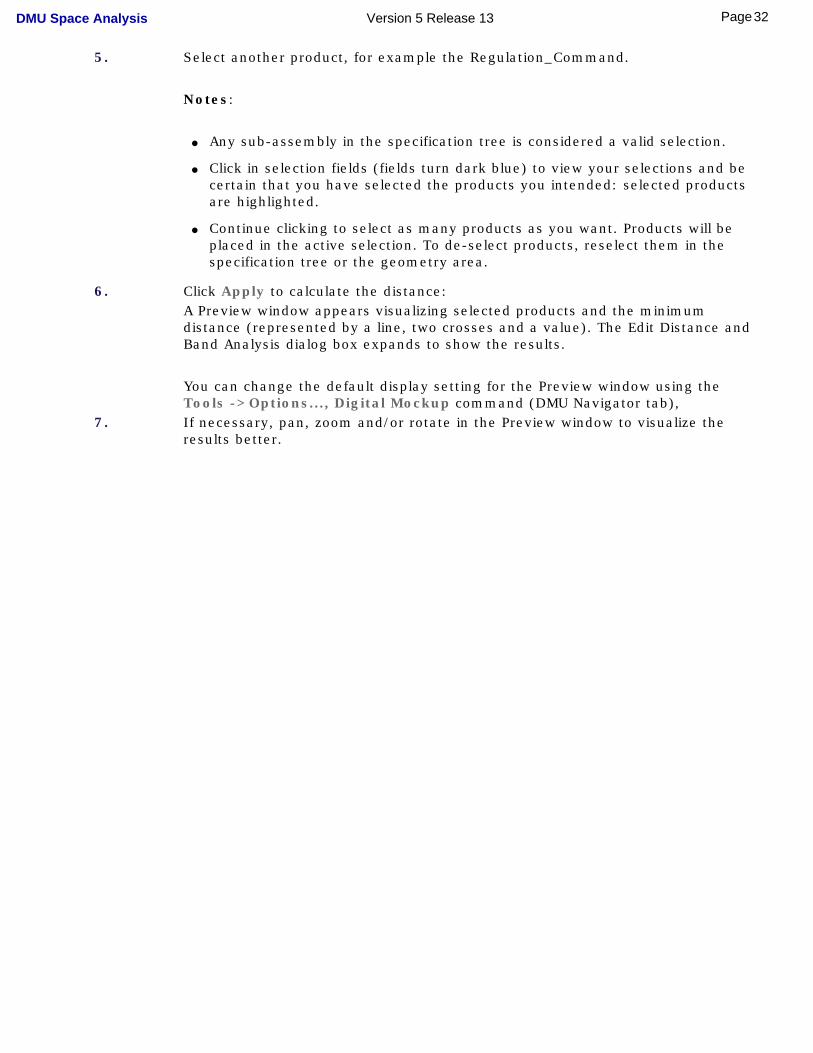
5. Select another product, for example the Regulation_Command.
Notes:
● Any sub-assembly in the specification tree is considered a valid selection.
● Click in selection fields (fields turn dark blue) to view your selections and be certain that you have selected the products you intended: selected products are highlighted.
● Continue clicking to select as many products as you want. Products will be placed in the active selection. To de-select products, reselect them in the specification tree or the geometry area.
6. Click Apply to calculate the distance:A Preview window appears visualizing selected products and the minimum distance (represented by a line, two crosses and a value). The Edit Distance and Band Analysis dialog box expands to show the results.
You can change the default display setting for the Preview window using the Tools ->Options..., Digital Mockup command (DMU Navigator tab),
7. If necessary, pan, zoom and/or rotate in the Preview window to visualize the results better.
32Page DMU Space Analysis Version 5 Release 13
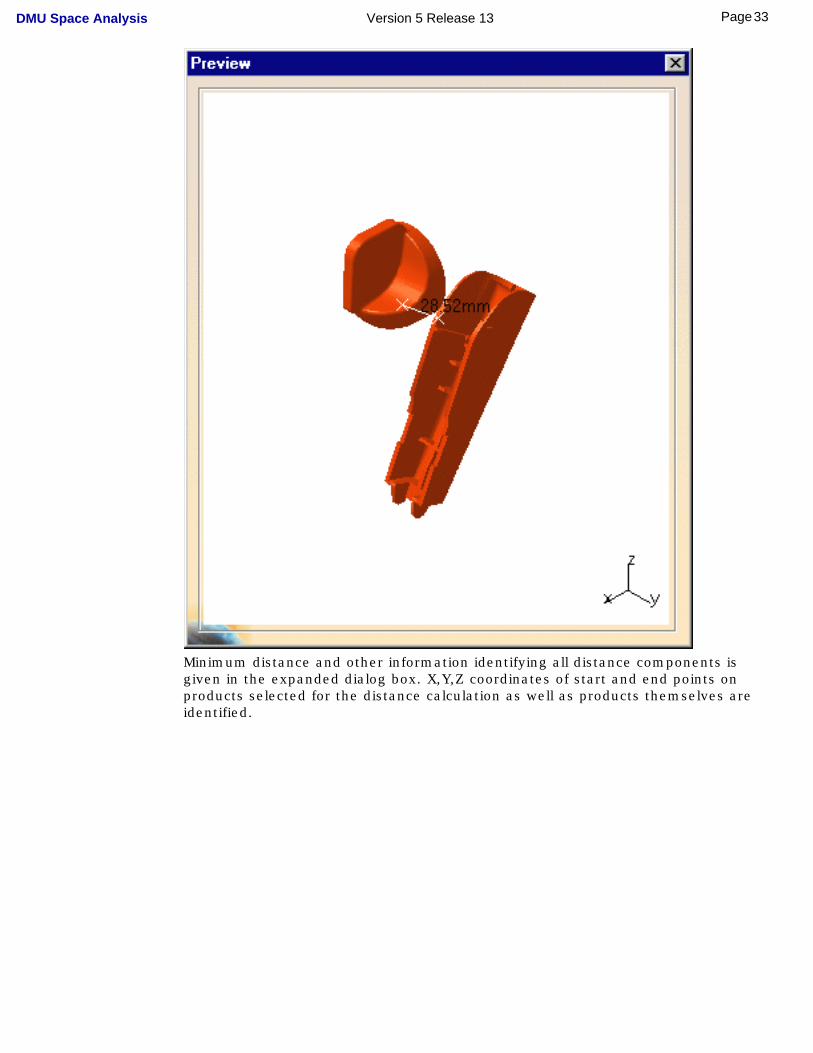
Minimum distance and other information identifying all distance components is given in the expanded dialog box. X,Y,Z coordinates of start and end points on products selected for the distance calculation as well as products themselves are identified.
33Page DMU Space Analysis Version 5 Release 13

You can also view the results in a separate viewer. To do so, click the Results
window icon in the Edit Distance and Band Analysis dialog box. Object viewing commands and commands in the Window menu are available in this window. For example, using the Windows menu, you can tile the results window and the original document window vertically or horizontally.
You can use other DMU Space Analysis Toolbar commands in the Results window to, for example, measure surfaces.
8. Click the Type drop-down list box and select Along Z.9. Click Apply.
Results are calculated and displayed in the dialog box and Preview window.
34Page DMU Space Analysis Version 5 Release 13
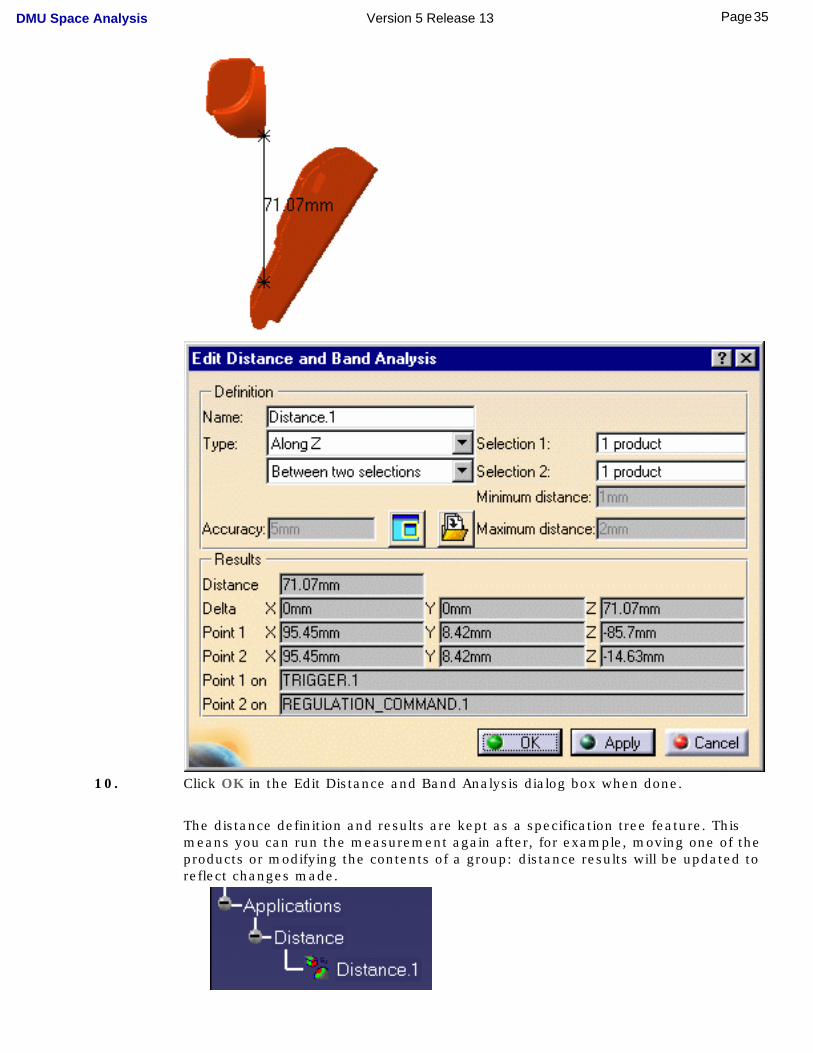
10. Click OK in the Edit Distance and Band Analysis dialog box when done.
The distance definition and results are kept as a specification tree feature. This means you can run the measurement again after, for example, moving one of the products or modifying the contents of a group: distance results will be updated to reflect changes made.
35Page DMU Space Analysis Version 5 Release 13
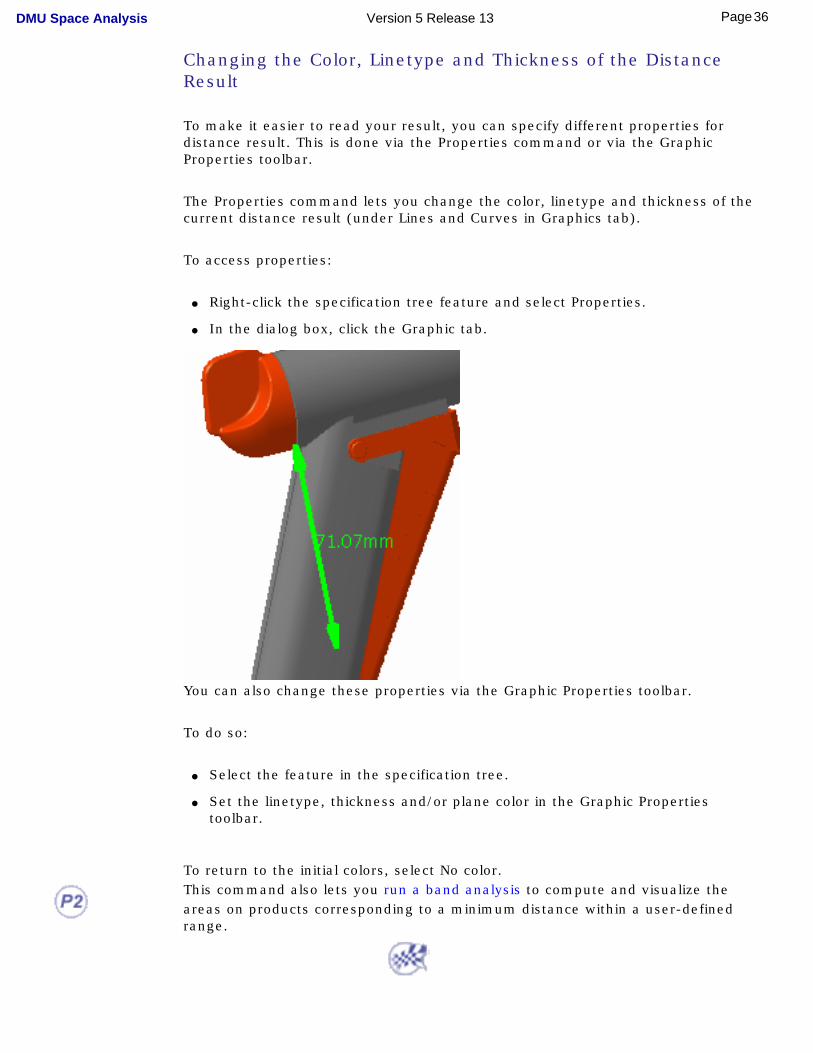
Changing the Color, Linetype and Thickness of the Distance Result
To make it easier to read your result, you can specify different properties for distance result. This is done via the Properties command or via the Graphic Properties toolbar.
The Properties command lets you change the color, linetype and thickness of the current distance result (under Lines and Curves in Graphics tab).
To access properties:
● Right-click the specification tree feature and select Properties.
● In the dialog box, click the Graphic tab.
You can also change these properties via the Graphic Properties toolbar.
To do so:
● Select the feature in the specification tree.
● Set the linetype, thickness and/or plane color in the Graphic Properties toolbar.
To return to the initial colors, select No color.This command also lets you run a band analysis to compute and visualize the areas on products corresponding to a minimum distance within a user-defined range.
36Page DMU Space Analysis Version 5 Release 13
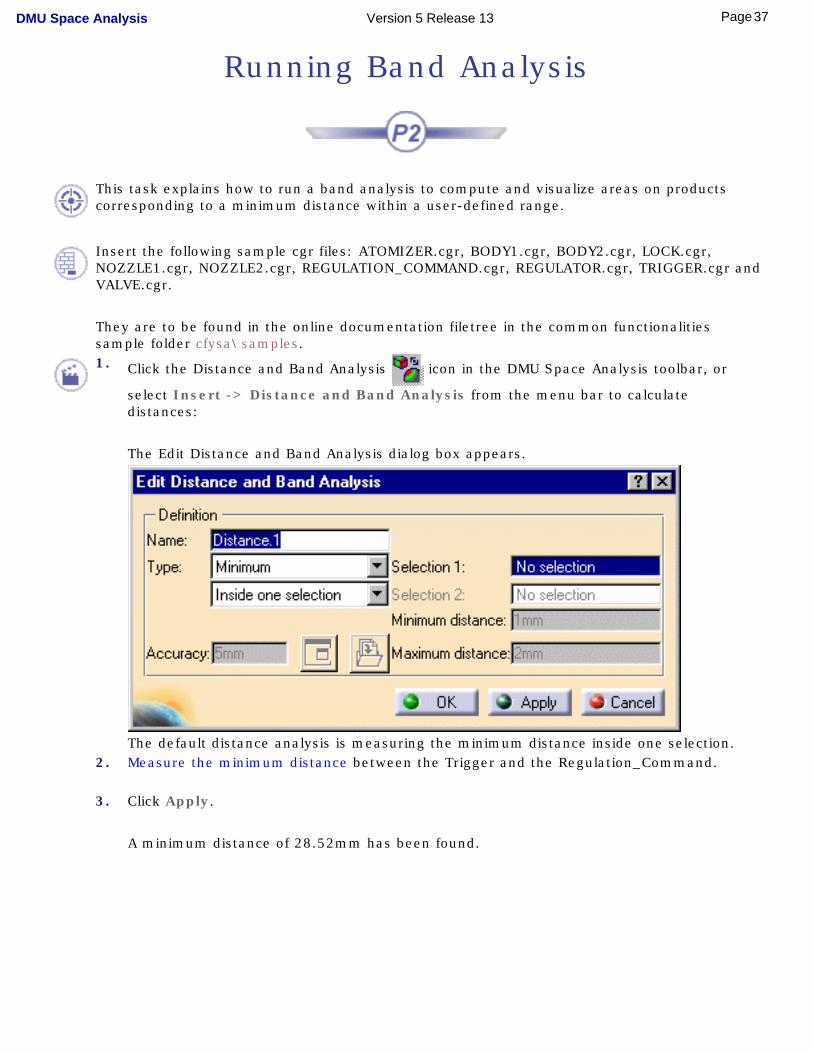
Running Band Analysis
This task explains how to run a band analysis to compute and visualize areas on products corresponding to a minimum distance within a user-defined range.
Insert the following sample cgr files: ATOMIZER.cgr, BODY1.cgr, BODY2.cgr, LOCK.cgr, NOZZLE1.cgr, NOZZLE2.cgr, REGULATION_COMMAND.cgr, REGULATOR.cgr, TRIGGER.cgr and VALVE.cgr.
They are to be found in the online documentation filetree in the common functionalities sample folder cfysa\samples.
1. Click the Distance and Band Analysis icon in the DMU Space Analysis toolbar, or
select Insert -> Distance and Band Analysis from the menu bar to calculate distances:
The Edit Distance and Band Analysis dialog box appears.
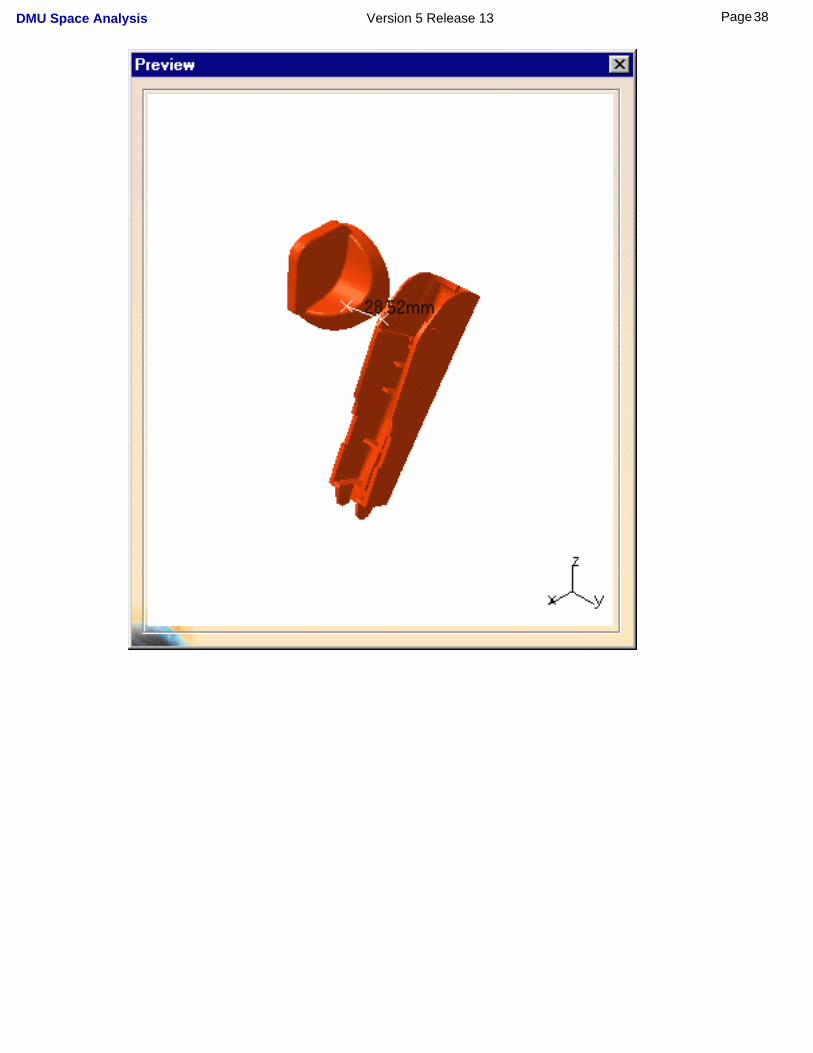
The default distance analysis is measuring the minimum distance inside one selection.2. Measure the minimum distance between the Trigger and the Regulation_Command.
3. Click Apply.
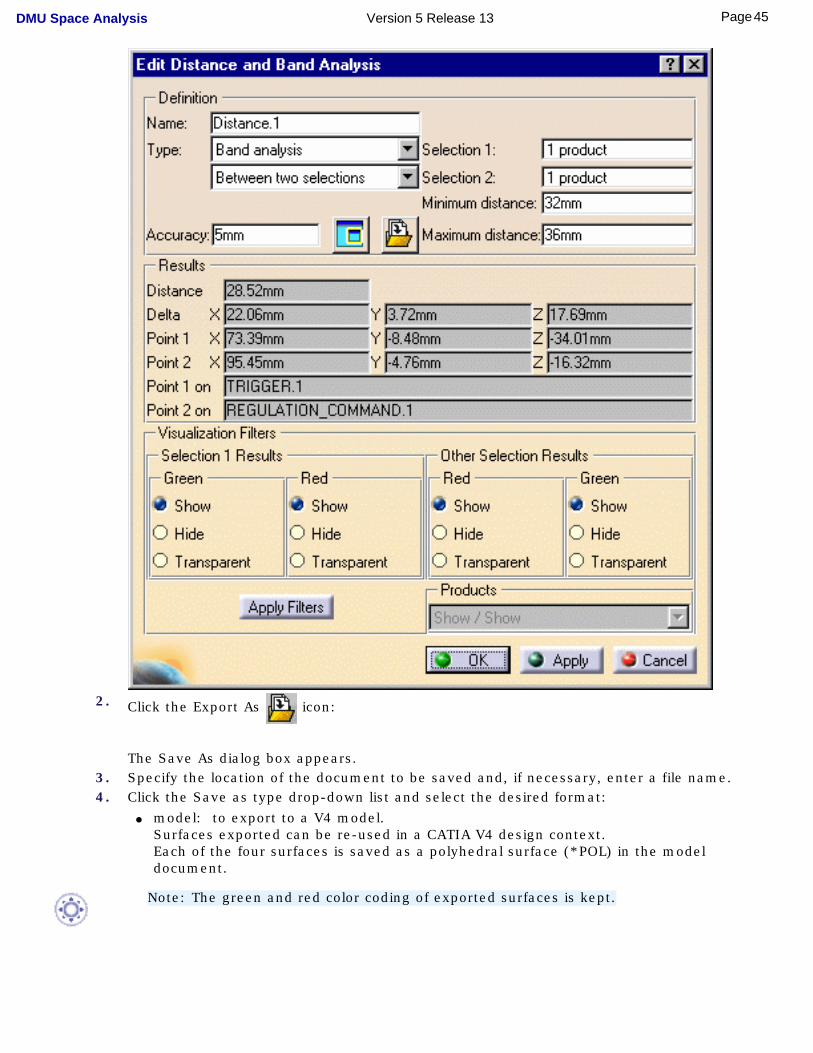
A minimum distance of 28.52mm has been found.
37Page DMU Space Analysis Version 5 Release 13
38Page DMU Space Analysis Version 5 Release 13
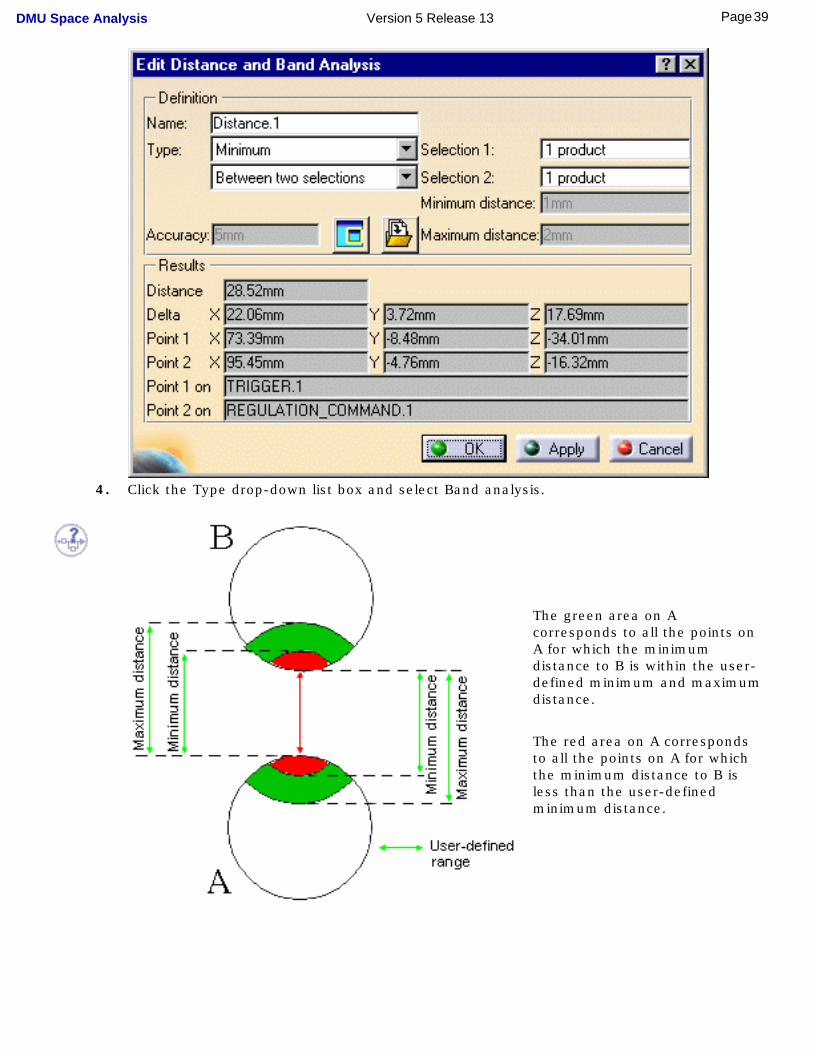
4. Click the Type drop-down list box and select Band analysis.
The green area on A corresponds to all the points on A for which the minimum distance to B is within the user-defined minimum and maximum distance.
The red area on A corresponds to all the points on A for which the minimum distance to B is less than the user-defined minimum distance.
39Page DMU Space Analysis Version 5 Release 13
5. Set the Minimum and Maximum distance to define the band width, to 32 and 36mm respectively for example.
Default values are 1 and 2mm respectively.
6. If necessary, set accuracy.
The default value is 5mm. A lower value will give you a more accurate result.
The value entered defines the maximum value for the length of the longest side of a triangular representation of the results. This representation is used to obtain the red and green surfaces.
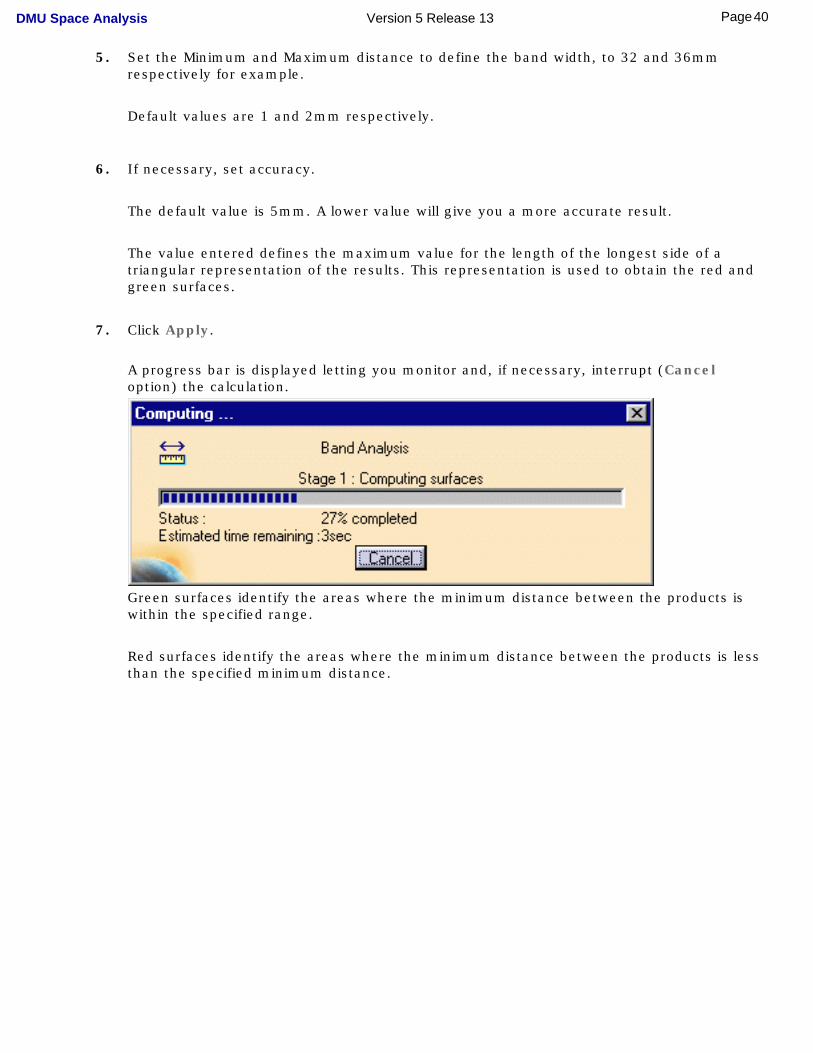
7. Click Apply.
A progress bar is displayed letting you monitor and, if necessary, interrupt (Cancel option) the calculation.
Green surfaces identify the areas where the minimum distance between the products is within the specified range.
Red surfaces identify the areas where the minimum distance between the products is less than the specified minimum distance.
40Page DMU Space Analysis Version 5 Release 13
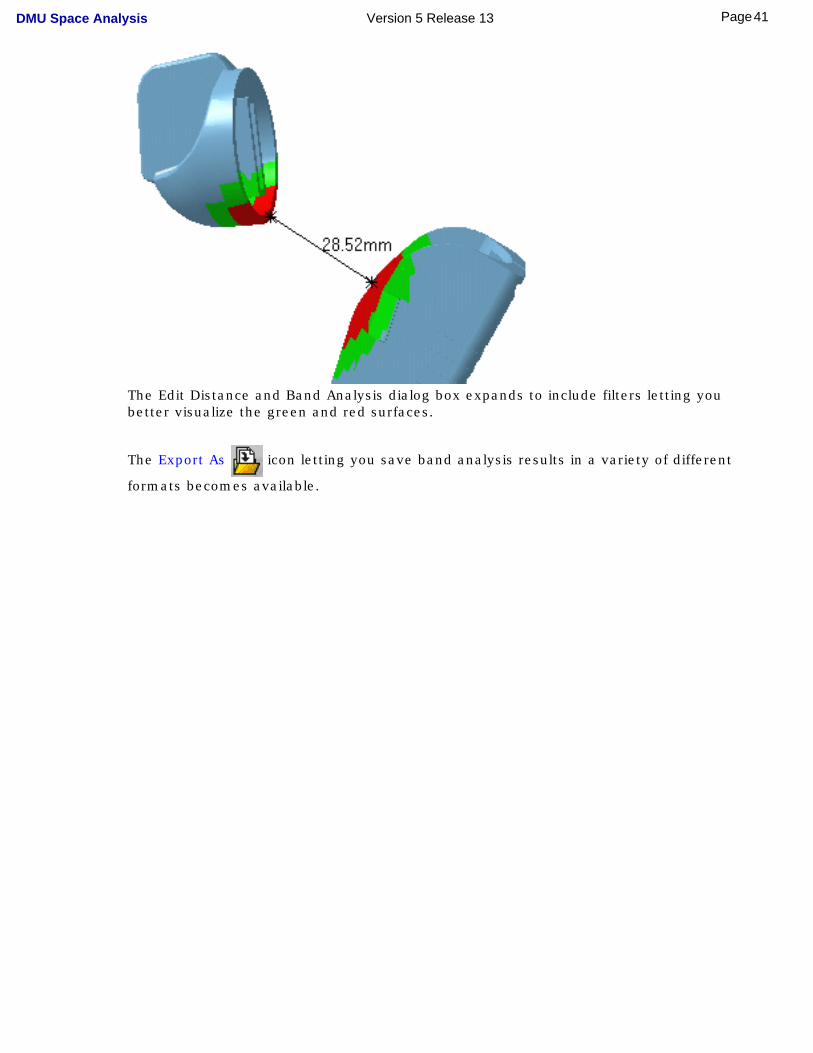
The Edit Distance and Band Analysis dialog box expands to include filters letting you better visualize the green and red surfaces.
The Export As icon letting you save band analysis results in a variety of different
formats becomes available.
41Page DMU Space Analysis Version 5 Release 13
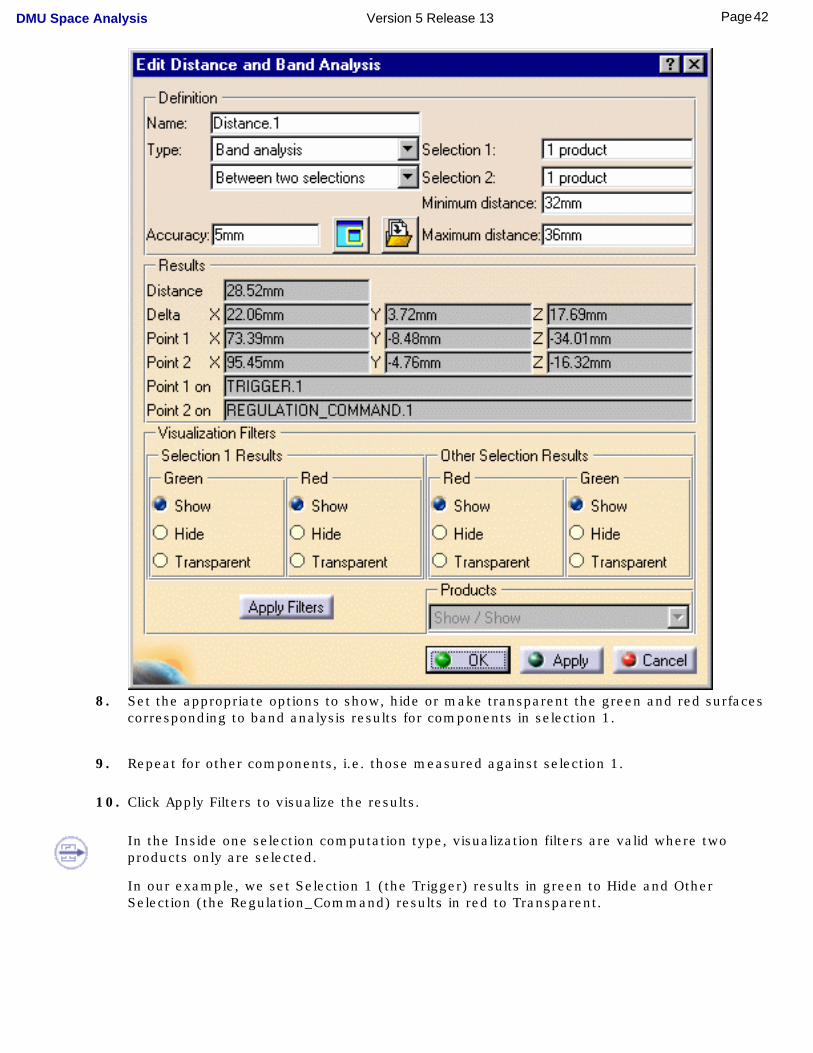
8. Set the appropriate options to show, hide or make transparent the green and red surfaces corresponding to band analysis results for components in selection 1.
9. Repeat for other components, i.e. those measured against selection 1.
10. Click Apply Filters to visualize the results.
In the Inside one selection computation type, visualization filters are valid where two products only are selected.
In our example, we set Selection 1 (the Trigger) results in green to Hide and Other Selection (the Regulation_Command) results in red to Transparent.
42Page DMU Space Analysis Version 5 Release 13
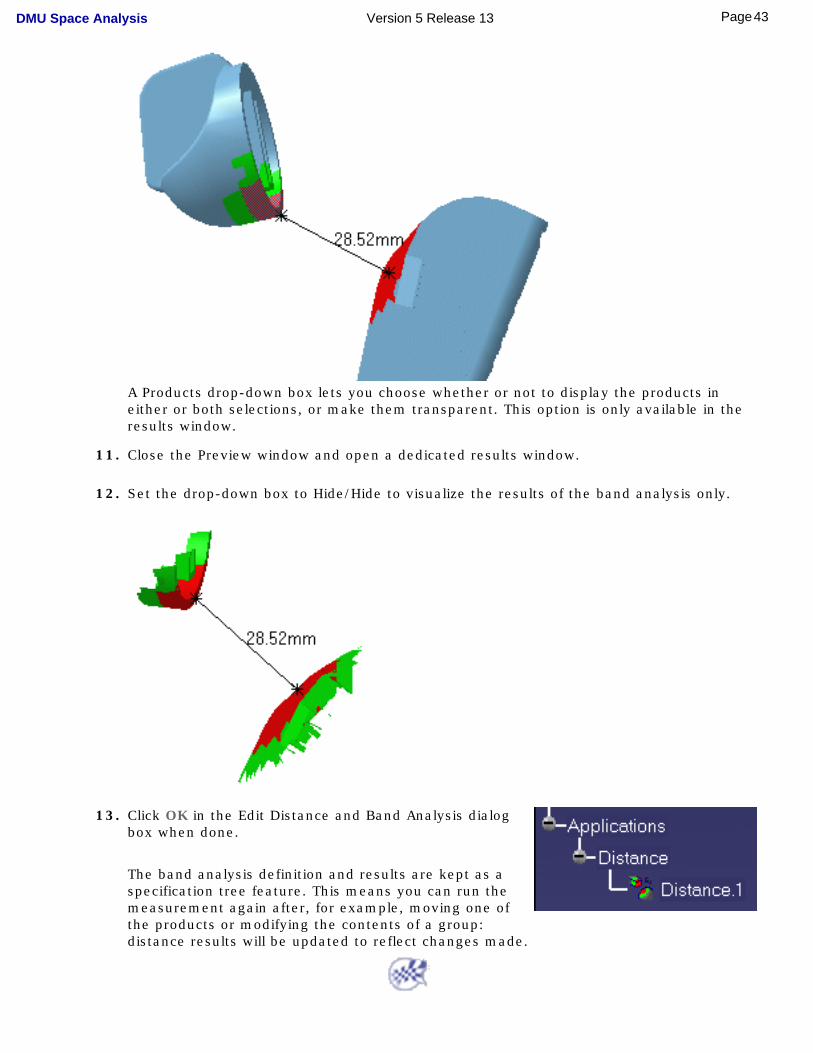
A Products drop-down box lets you choose whether or not to display the products in either or both selections, or make them transparent. This option is only available in the results window.
11. Close the Preview window and open a dedicated results window.
12. Set the drop-down box to Hide/Hide to visualize the results of the band analysis only.
13. Click OK in the Edit Distance and Band Analysis dialog box when done.
The band analysis definition and results are kept as a specification tree feature. This means you can run the measurement again after, for example, moving one of the products or modifying the contents of a group: distance results will be updated to reflect changes made.
43Page DMU Space Analysis Version 5 Release 13
Exporting & Publishing Distance Results
Using the Export As command, you can save band analysis results in a variety of different formats.
This task explains how to: ● Save surfaces as a model document for re-use in a CATIA V4 design context
● Export results in CGR and VRML (Virtual Reality Modeling Language) format
● Publish results to an XML file.
Insert the following sample cgr files: ATOMIZER.cgr, BODY1.cgr, BODY2.cgr, LOCK.cgr, NOZZLE1.cgr, NOZZLE2.cgr, REGULATION_COMMAND.cgr, REGULATOR.cgr, TRIGGER.cgr and VALVE.cgr.
They are to be found in the online documentation filetree in the common functionalities sample folder cfysa\samples.
1. Click the Distance and Band Analysis icon in the DMU Space Analysis toolbar, or
select Insert -> Distance and Band Analysis from the menu bar to run a band analysis.
The Edit Distance and Band Analysis dialog box expands.
The Export As icon letting you export and publish band analysis results becomes
available.
44Page DMU Space Analysis Version 5 Release 13
2. Click the Export As icon:
The Save As dialog box appears.3. Specify the location of the document to be saved and, if necessary, enter a file name.4. Click the Save as type drop-down list and select the desired format:
● model: to export to a V4 model.Surfaces exported can be re-used in a CATIA V4 design context.Each of the four surfaces is saved as a polyhedral surface (*POL) in the model document.
Note: The green and red color coding of exported surfaces is kept.
45Page DMU Space Analysis Version 5 Release 13
● cgr: to save results in a CGR file.
● wrl: to save results as a VRML document.
● xml: to publish results to an XML file.Each time you export results to an XML file, a folder containing all the necessary files and images is created.
5. Click Save to save the results in a file in the desired format.
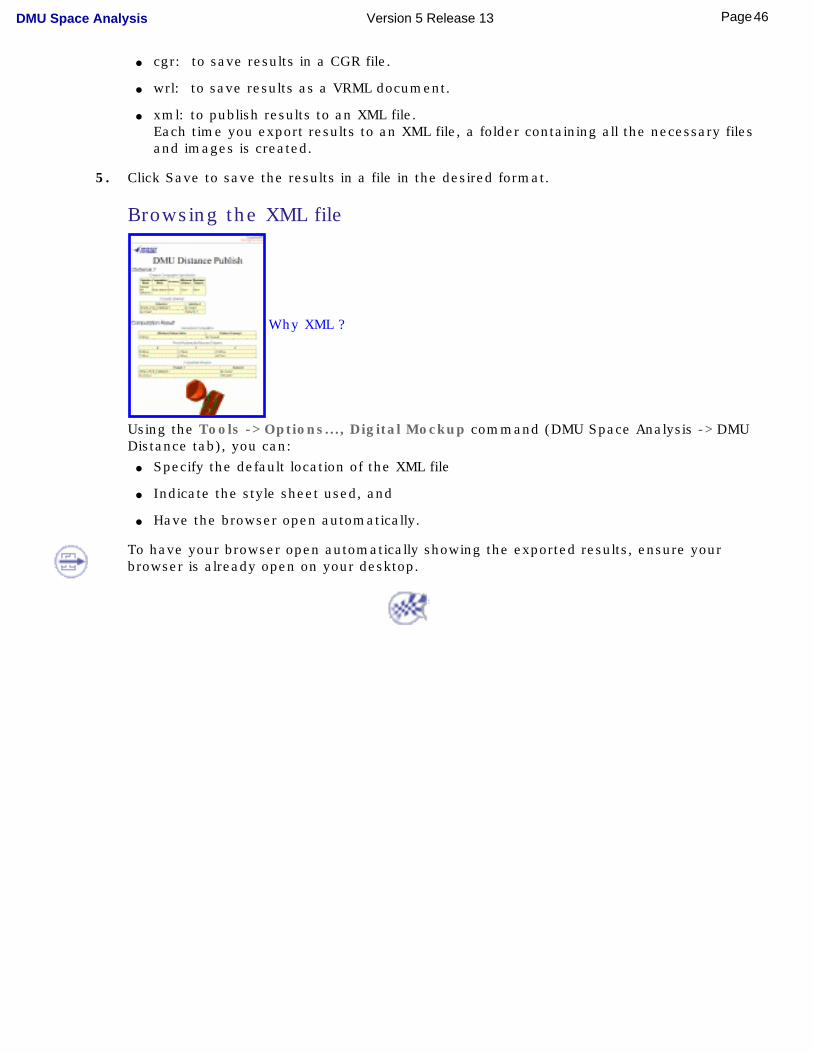
Browsing the XML file
Why XML ?
Using the Tools ->Options..., Digital Mockup command (DMU Space Analysis ->DMU Distance tab), you can:
● Specify the default location of the XML file
● Indicate the style sheet used, and
● Have the browser open automatically.
To have your browser open automatically showing the exported results, ensure your browser is already open on your desktop.
46Page DMU Space Analysis Version 5 Release 13
Sectioning
About sectioning: Gives general information about the Sectioning command.
Create section planes: Click the Sectioning icon.
Change section graphic properties: Gives information about changing line segment color, linetype, and thickness, as well as plane color.
Create section slices: Create a section plane then click the Section Slice icon in the Sectioning Definition dialog box.
Create section boxes: Create a section plane then click the Section Box icon in the Sectioning Definition dialog box.
More about the Section viewer: Create a section plane.
Create 3D section cuts: Create a section plane then click the Volume Cut icon.
Manipulate planes directly: Create a section plane, drag plane edges to re-dimension, drag plane to move it along the normal vector, press and hold left and middle mouse buttons down to move plane in U,V plane of local axis system or drag plane axis to rotate plane.
Position planes using the Edit Position and Dimensions command: Create a section plane, click the Edit Position icon and enter parameters defining the plane position in the dialog box.
Position planes on a geometric target: Create a section plane, click the Geometrical Target icon and point to the target of interest.
Snap boxes to planes: Create a section box, click the Geometrical Target icon and select two or three planes.
Snap planes to points and/or lines: Create a section plane, click the Positioning by 2/3 Selections icon and make your selections.
Save section results: Generate section results then click the Export As icon to export to a V4 model, V5 CATPart, IGES or VRML document.
Manage the update of section results: Generate section results, then select appropriate option in Behavior tab and exit command.
More about the contextual menu: Right-click the section feature or section in geometry area and select the command from the menu.
47Page DMU Space Analysis Version 5 Release 13
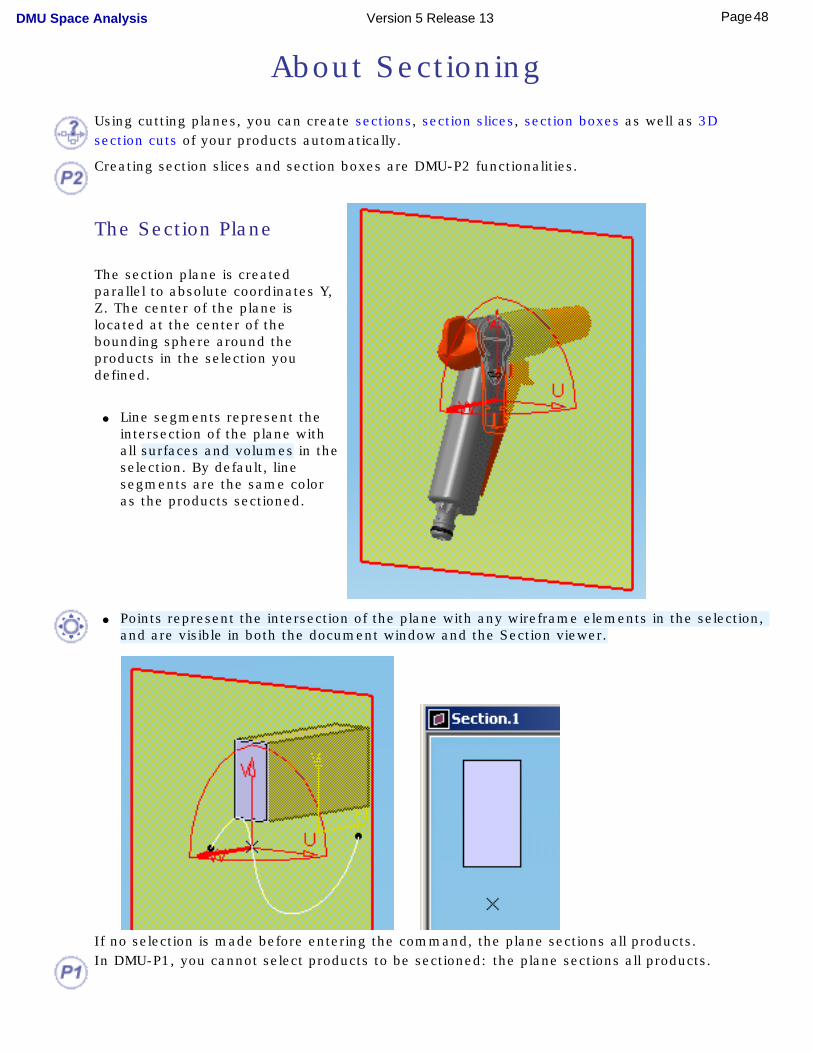
About Sectioning
Using cutting planes, you can create sections, section slices, section boxes as well as 3D section cuts of your products automatically.
Creating section slices and section boxes are DMU-P2 functionalities.
The Section Plane
The section plane is created parallel to absolute coordinates Y, Z. The center of the plane is located at the center of the bounding sphere around the products in the selection you defined.
● Line segments represent the intersection of the plane with all surfaces and volumes in the selection. By default, line segments are the same color as the products sectioned.
● Points represent the intersection of the plane with any wireframe elements in the selection, and are visible in both the document window and the Section viewer.
If no selection is made before entering the command, the plane sections all products.In DMU-P1, you cannot select products to be sectioned: the plane sections all products.
48Page DMU Space Analysis Version 5 Release 13
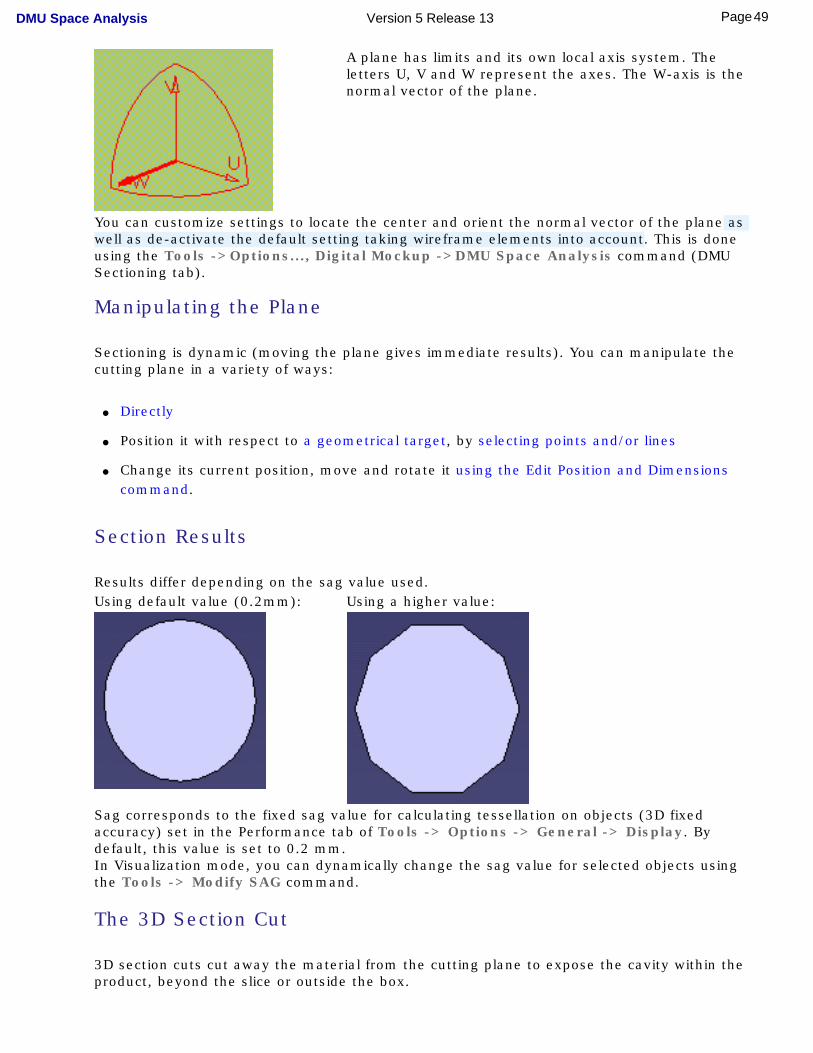
A plane has limits and its own local axis system. The letters U, V and W represent the axes. The W-axis is the normal vector of the plane.
You can customize settings to locate the center and orient the normal vector of the plane as well as de-activate the default setting taking wireframe elements into account. This is done using the Tools ->Options..., Digital Mockup ->DMU Space Analysis command (DMU Sectioning tab).
Manipulating the Plane
Sectioning is dynamic (moving the plane gives immediate results). You can manipulate the cutting plane in a variety of ways:
● Directly
● Position it with respect to a geometrical target, by selecting points and/or lines
● Change its current position, move and rotate it using the Edit Position and Dimensions command.
Section Results
Results differ depending on the sag value used. Using default value (0.2mm): Using a higher value:
Sag corresponds to the fixed sag value for calculating tessellation on objects (3D fixed accuracy) set in the Performance tab of Tools -> Options -> General -> Display. By default, this value is set to 0.2 mm.In Visualization mode, you can dynamically change the sag value for selected objects using the Tools -> Modify SAG command.
The 3D Section Cut
3D section cuts cut away the material from the cutting plane to expose the cavity within the product, beyond the slice or outside the box.
49Page DMU Space Analysis Version 5 Release 13

Creating Groups of Products
In DMU-P2, prior to creating your section plane, you can create a group containing the
product(s) of interest using the Group icon in the DMU Space Analysis toolbar or Insert -> Group... in the menu bar.
Groups created are identified in the specification tree and can be selected from there for sectioning. Only one group per selection can be defined.
50Page DMU Space Analysis Version 5 Release 13
Creating Section Planes
This task shows how to create section planes and orient the normal vector of the plane.
Insert the following cgr files: ATOMIZER.cgr, BODY1.cgr, BODY2.cgr, LOCK.cgr, NOZZLE1.cgr, NOZZLE2.cgr, REGULATION_COMMAND.cgr, REGULATOR.cgr, TRIGGER.cgr and VALVE.cgr.
They are to be found in the online documentation filetree in the common functionalities sample folder cfysa/samples.1. Select Insert -> Sectioning from the
menu bar, or click the Sectioning icon
in the DMU Space Analysis toolbar to generate a section plane.
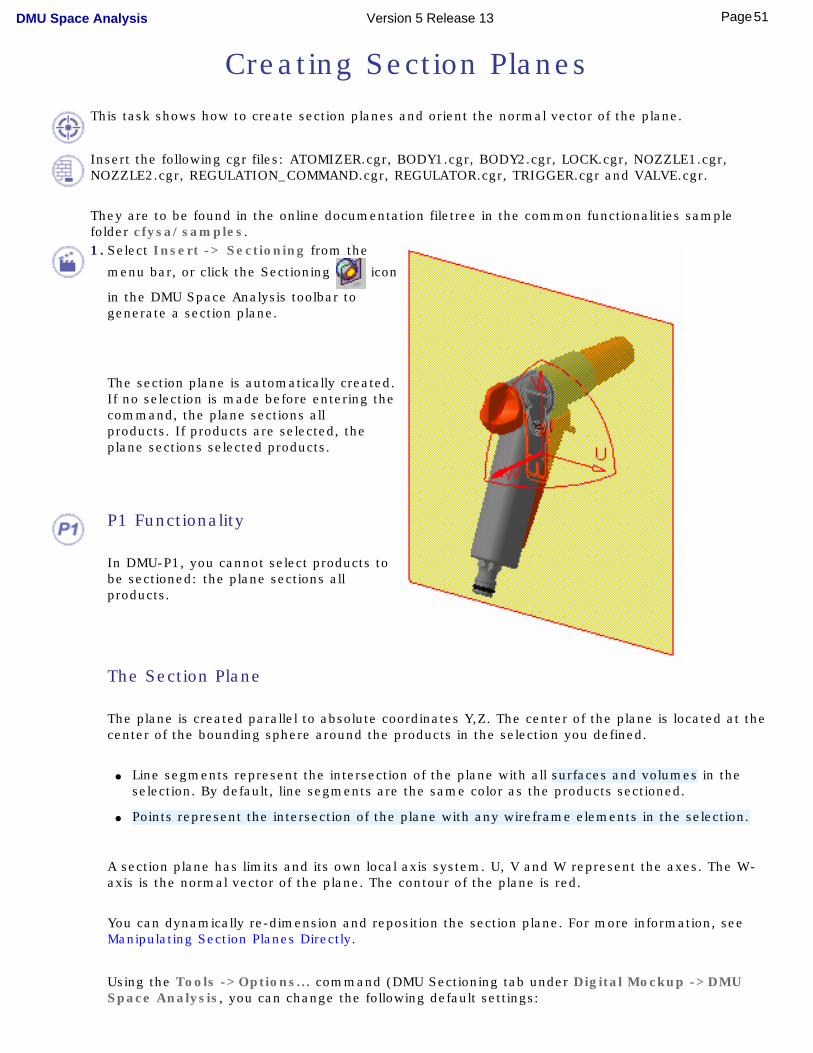
The section plane is automatically created. If no selection is made before entering the command, the plane sections all products. If products are selected, the plane sections selected products.
P1 Functionality
In DMU-P1, you cannot select products to be sectioned: the plane sections all products.
The Section Plane
The plane is created parallel to absolute coordinates Y,Z. The center of the plane is located at the center of the bounding sphere around the products in the selection you defined.
● Line segments represent the intersection of the plane with all surfaces and volumes in the selection. By default, line segments are the same color as the products sectioned.
● Points represent the intersection of the plane with any wireframe elements in the selection.
A section plane has limits and its own local axis system. U, V and W represent the axes. The W-axis is the normal vector of the plane. The contour of the plane is red.
You can dynamically re-dimension and reposition the section plane. For more information, see Manipulating Section Planes Directly.
Using the Tools ->Options... command (DMU Sectioning tab under Digital Mockup ->DMU Space Analysis, you can change the following default settings:
51Page DMU Space Analysis Version 5 Release 13
● Location of the center of the plane
● Orientation of the normal vector of the plane
● Sectioning of wireframe elements.
P2 Functionalities
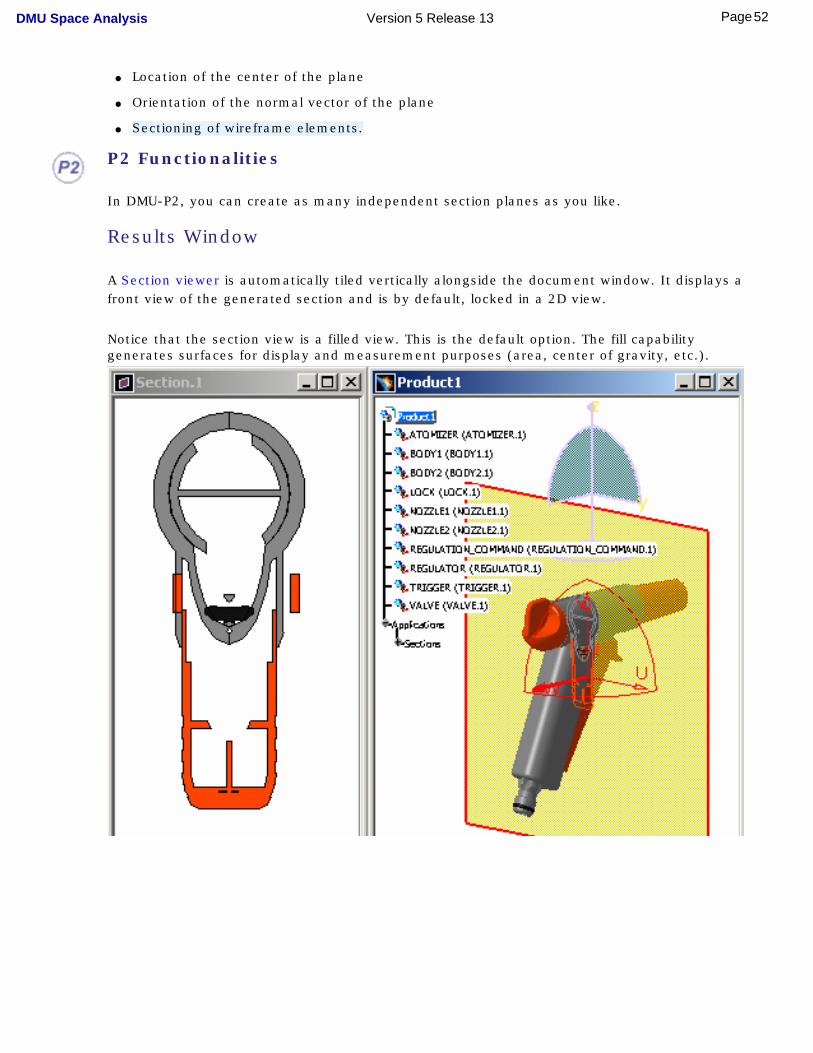
In DMU-P2, you can create as many independent section planes as you like.
Results Window
A Section viewer is automatically tiled vertically alongside the document window. It displays a front view of the generated section and is by default, locked in a 2D view.
Notice that the section view is a filled view. This is the default option. The fill capability generates surfaces for display and measurement purposes (area, center of gravity, etc.).
52Page DMU Space Analysis Version 5 Release 13
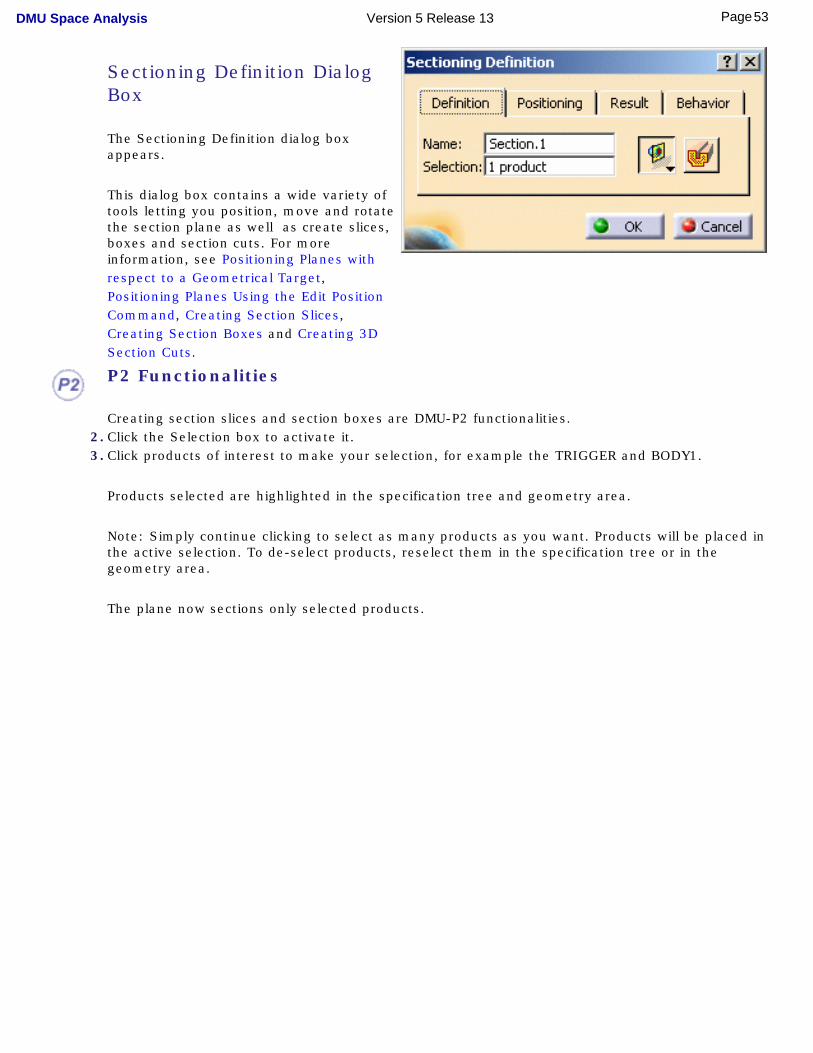
Sectioning Definition Dialog Box
The Sectioning Definition dialog box appears.
This dialog box contains a wide variety of tools letting you position, move and rotate the section plane as well as create slices, boxes and section cuts. For more information, see Positioning Planes with respect to a Geometrical Target, Positioning Planes Using the Edit Position Command, Creating Section Slices, Creating Section Boxes and Creating 3D Section Cuts.
P2 Functionalities
Creating section slices and section boxes are DMU-P2 functionalities. 2. Click the Selection box to activate it.
3. Click products of interest to make your selection, for example the TRIGGER and BODY1.
Products selected are highlighted in the specification tree and geometry area.
Note: Simply continue clicking to select as many products as you want. Products will be placed in the active selection. To de-select products, reselect them in the specification tree or in the geometry area.
The plane now sections only selected products.
53Page DMU Space Analysis Version 5 Release 13
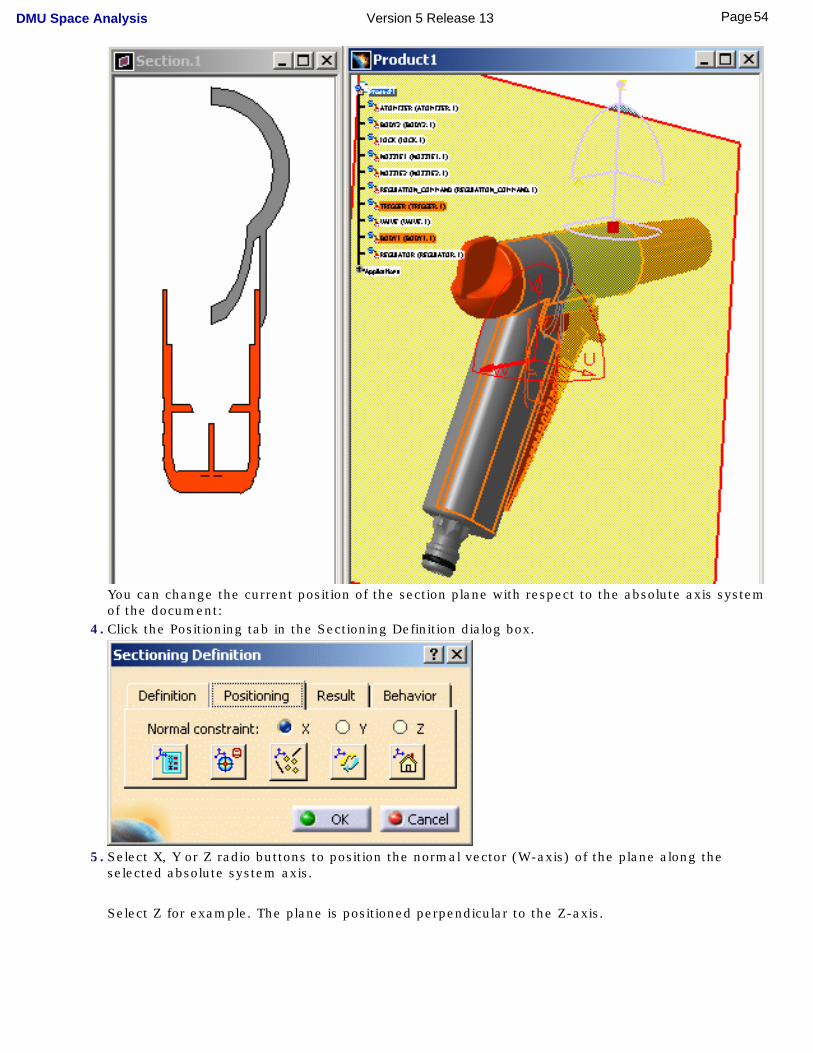
You can change the current position of the section plane with respect to the absolute axis system of the document:
4. Click the Positioning tab in the Sectioning Definition dialog box.
5. Select X, Y or Z radio buttons to position the normal vector (W-axis) of the plane along the selected absolute system axis.
Select Z for example. The plane is positioned perpendicular to the Z-axis.
54Page DMU Space Analysis Version 5 Release 13
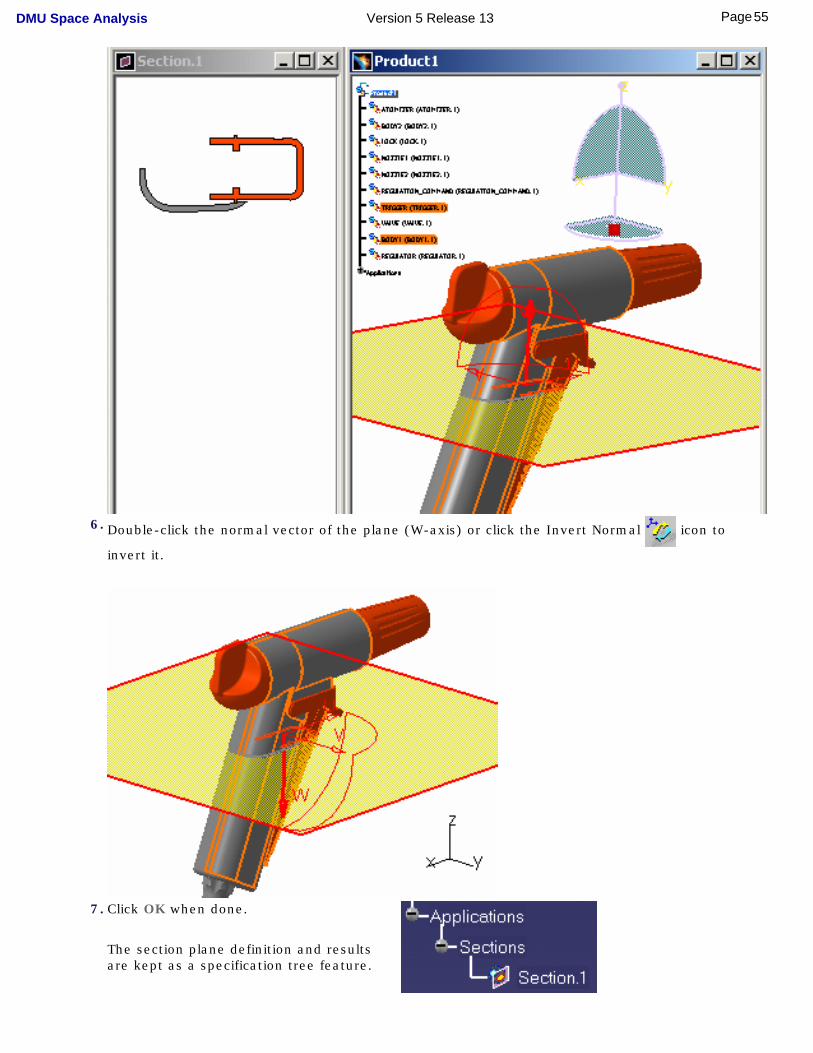
6. Double-click the normal vector of the plane (W-axis) or click the Invert Normal icon to
invert it.
7. Click OK when done.
The section plane definition and results are kept as a specification tree feature.
55Page DMU Space Analysis Version 5 Release 13

By default, the plane is hidden when exiting the command. Use the Tools->Options, Digital Mockup-> DMU Space Analysis command (DMU Sectioning tab) to change this setting.
To show and edit the plane again, double-click the specification tree feature or select Hide/Show the plane representation in the contextual menu.
56Page DMU Space Analysis Version 5 Release 13
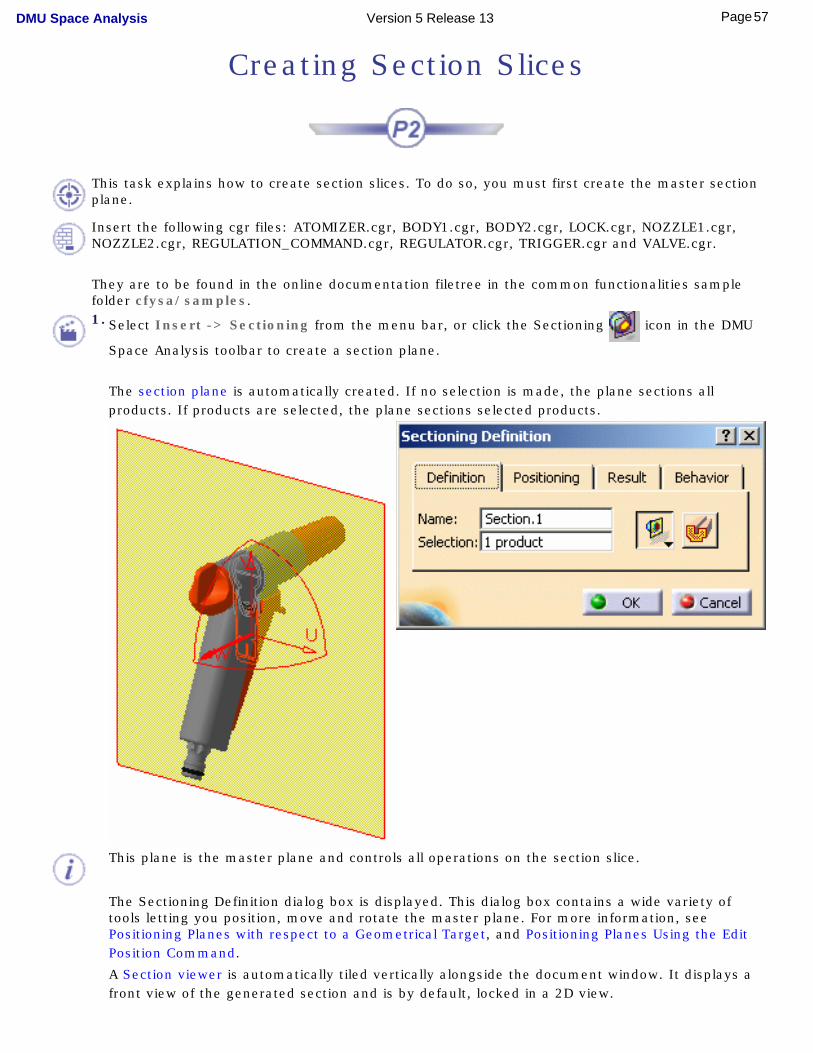
Creating Section Slices
This task explains how to create section slices. To do so, you must first create the master section plane.
Insert the following cgr files: ATOMIZER.cgr, BODY1.cgr, BODY2.cgr, LOCK.cgr, NOZZLE1.cgr, NOZZLE2.cgr, REGULATION_COMMAND.cgr, REGULATOR.cgr, TRIGGER.cgr and VALVE.cgr.
They are to be found in the online documentation filetree in the common functionalities sample folder cfysa/samples.1. Select Insert -> Sectioning from the menu bar, or click the Sectioning icon in the DMU
Space Analysis toolbar to create a section plane.
The section plane is automatically created. If no selection is made, the plane sections all products. If products are selected, the plane sections selected products.
This plane is the master plane and controls all operations on the section slice.
The Sectioning Definition dialog box is displayed. This dialog box contains a wide variety of tools letting you position, move and rotate the master plane. For more information, see Positioning Planes with respect to a Geometrical Target, and Positioning Planes Using the Edit Position Command.
A Section viewer is automatically tiled vertically alongside the document window. It displays a front view of the generated section and is by default, locked in a 2D view.
57Page DMU Space Analysis Version 5 Release 13
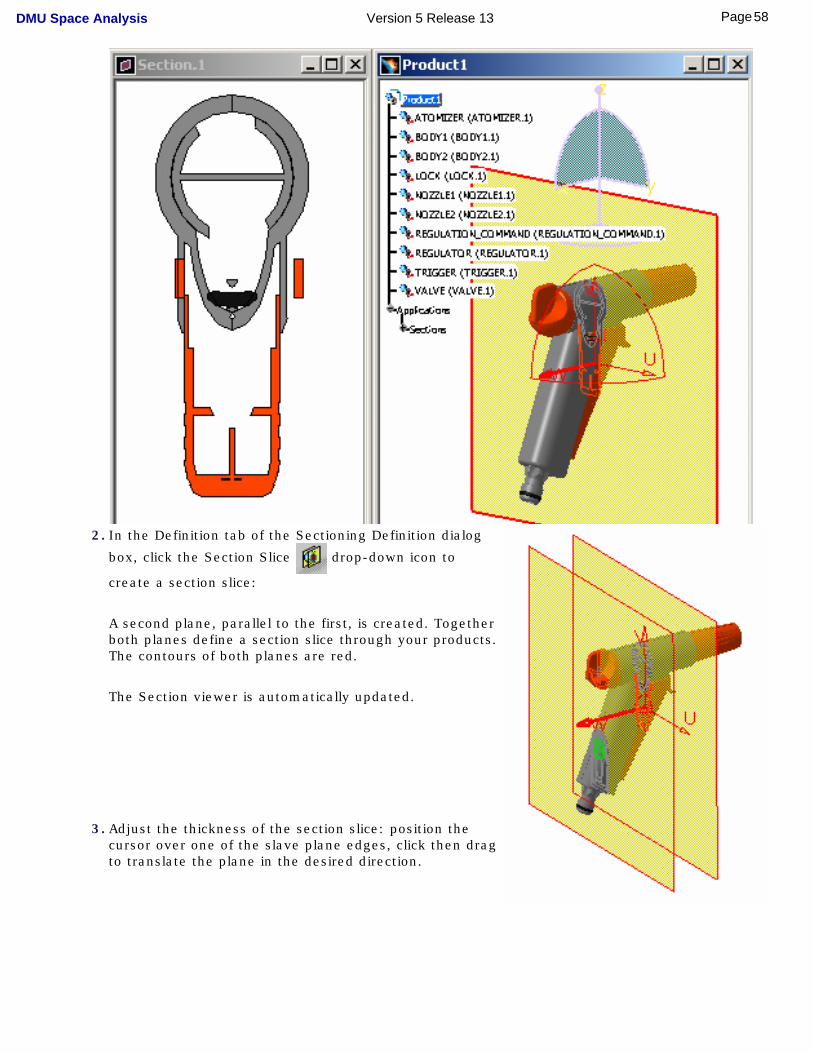
2. In the Definition tab of the Sectioning Definition dialog
box, click the Section Slice drop-down icon to
create a section slice:
A second plane, parallel to the first, is created. Together both planes define a section slice through your products. The contours of both planes are red.
The Section viewer is automatically updated.
3. Adjust the thickness of the section slice: position the cursor over one of the slave plane edges, click then drag to translate the plane in the desired direction.
58Page DMU Space Analysis Version 5 Release 13
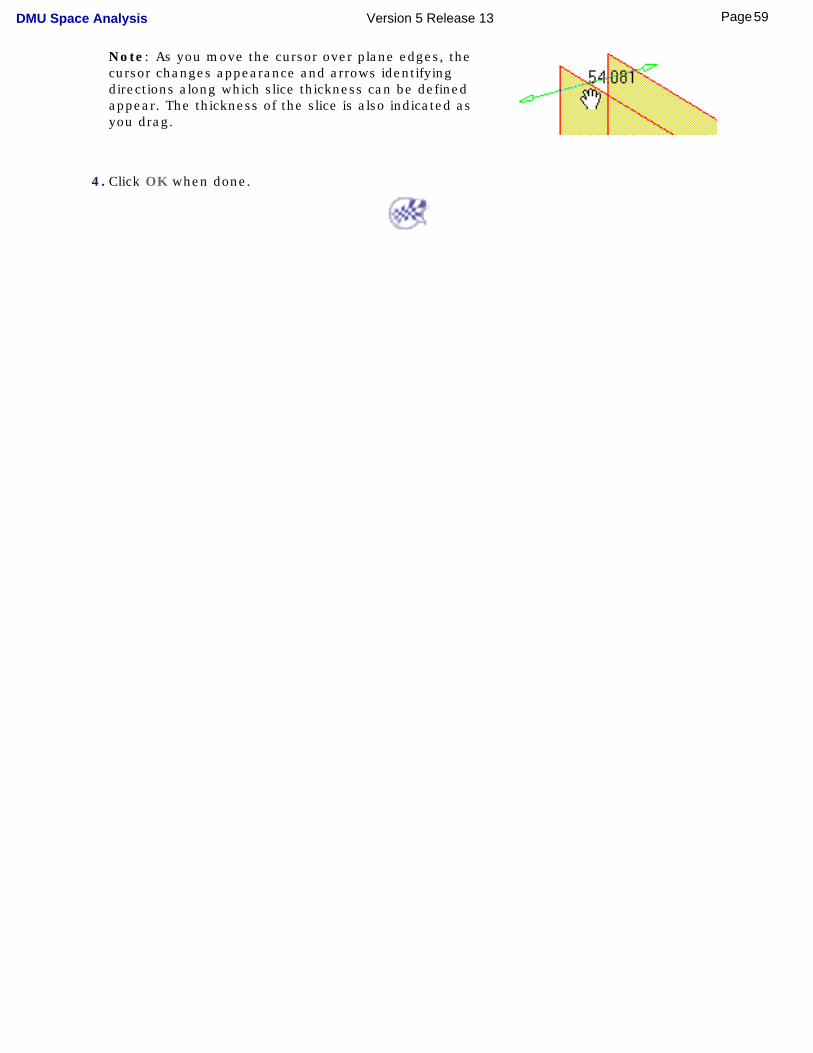
Note: As you move the cursor over plane edges, the cursor changes appearance and arrows identifying directions along which slice thickness can be defined appear. The thickness of the slice is also indicated as you drag.
4. Click OK when done.
59Page DMU Space Analysis Version 5 Release 13
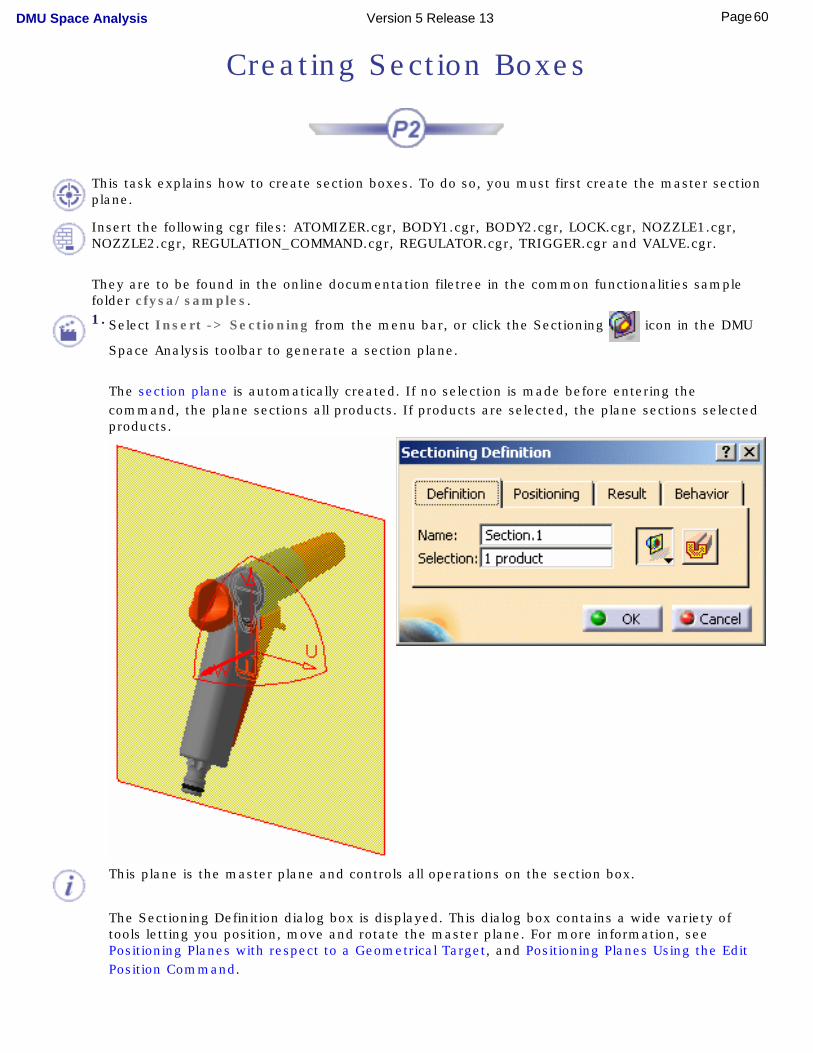
Creating Section Boxes
This task explains how to create section boxes. To do so, you must first create the master section plane.
Insert the following cgr files: ATOMIZER.cgr, BODY1.cgr, BODY2.cgr, LOCK.cgr, NOZZLE1.cgr, NOZZLE2.cgr, REGULATION_COMMAND.cgr, REGULATOR.cgr, TRIGGER.cgr and VALVE.cgr.
They are to be found in the online documentation filetree in the common functionalities sample folder cfysa/samples.
1. Select Insert -> Sectioning from the menu bar, or click the Sectioning icon in the DMU
Space Analysis toolbar to generate a section plane.
The section plane is automatically created. If no selection is made before entering the command, the plane sections all products. If products are selected, the plane sections selected products.
This plane is the master plane and controls all operations on the section box.
The Sectioning Definition dialog box is displayed. This dialog box contains a wide variety of tools letting you position, move and rotate the master plane. For more information, see Positioning Planes with respect to a Geometrical Target, and Positioning Planes Using the Edit Position Command.
60Page DMU Space Analysis Version 5 Release 13
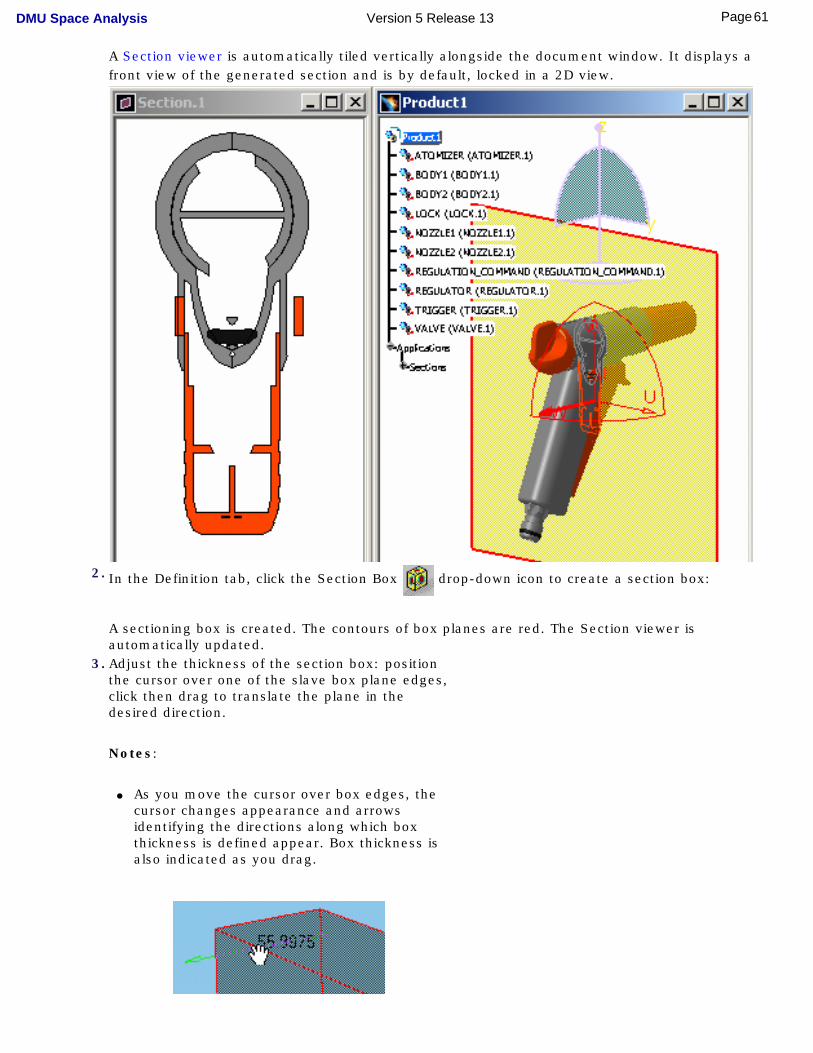
A Section viewer is automatically tiled vertically alongside the document window. It displays a front view of the generated section and is by default, locked in a 2D view.
2. In the Definition tab, click the Section Box drop-down icon to create a section box:
A sectioning box is created. The contours of box planes are red. The Section viewer is automatically updated.
3. Adjust the thickness of the section box: position the cursor over one of the slave box plane edges, click then drag to translate the plane in the desired direction.
Notes:
● As you move the cursor over box edges, the cursor changes appearance and arrows identifying the directions along which box thickness is defined appear. Box thickness is also indicated as you drag.
61Page DMU Space Analysis Version 5 Release 13
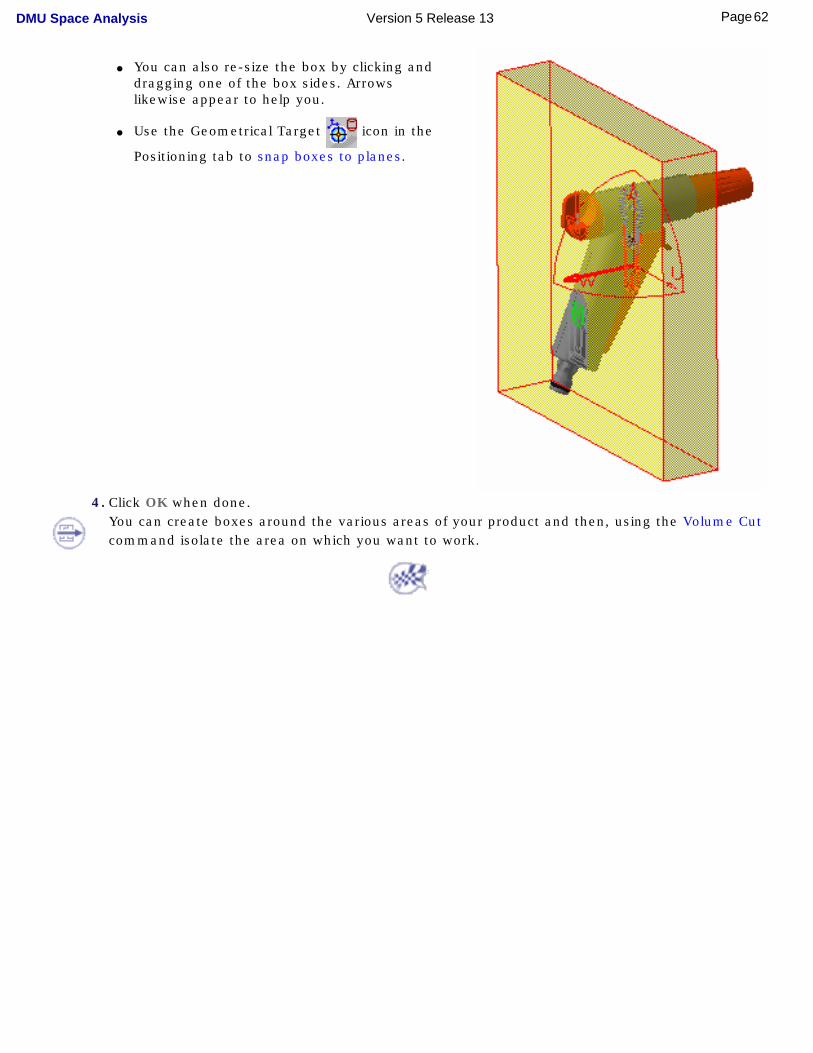
● You can also re-size the box by clicking and dragging one of the box sides. Arrows likewise appear to help you.
● Use the Geometrical Target icon in the
Positioning tab to snap boxes to planes.
4. Click OK when done.You can create boxes around the various areas of your product and then, using the Volume Cut command isolate the area on which you want to work.
62Page DMU Space Analysis Version 5 Release 13
More About the Section Viewer This task illustrates how to make the most of section viewer capabilities.
Orienting the sectionWorking with the 2D gridWorking with a 3D view
Detecting collisionsSaving section results
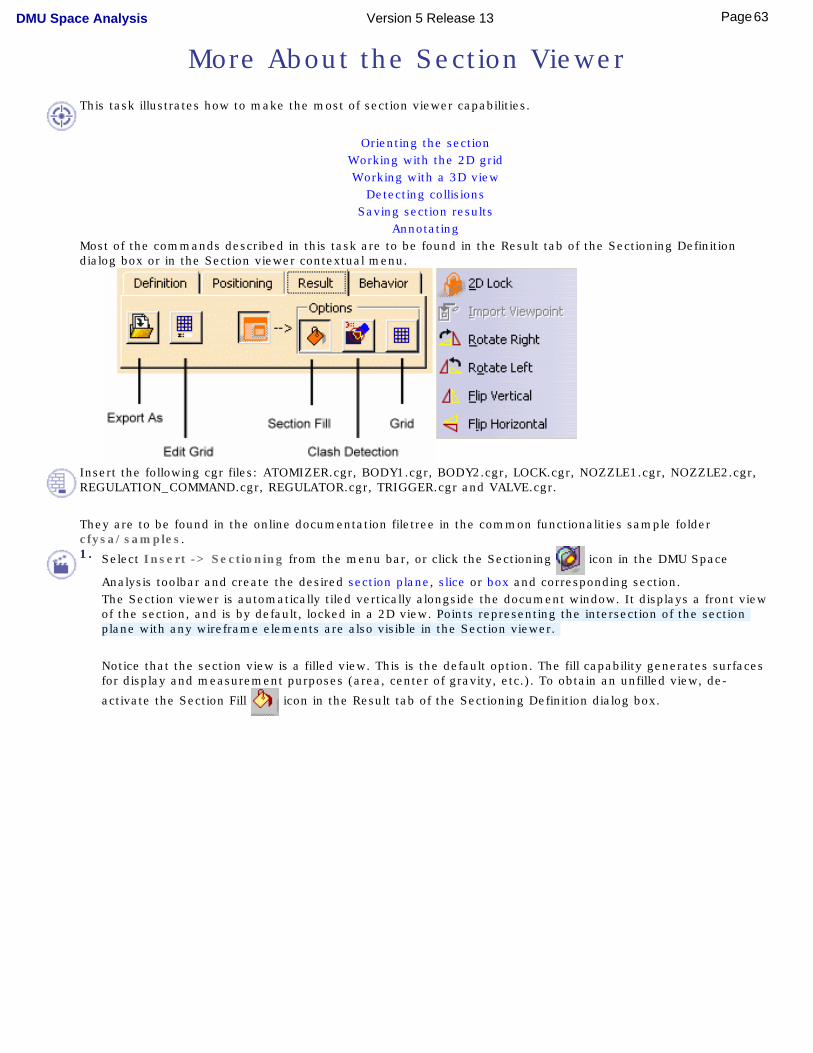
Annotating Most of the commands described in this task are to be found in the Result tab of the Sectioning Definition
dialog box or in the Section viewer contextual menu.
Insert the following cgr files: ATOMIZER.cgr, BODY1.cgr, BODY2.cgr, LOCK.cgr, NOZZLE1.cgr, NOZZLE2.cgr, REGULATION_COMMAND.cgr, REGULATOR.cgr, TRIGGER.cgr and VALVE.cgr.
They are to be found in the online documentation filetree in the common functionalities sample folder cfysa/samples.
1. Select Insert -> Sectioning from the menu bar, or click the Sectioning icon in the DMU Space
Analysis toolbar and create the desired section plane, slice or box and corresponding section. The Section viewer is automatically tiled vertically alongside the document window. It displays a front view
of the section, and is by default, locked in a 2D view. Points representing the intersection of the section plane with any wireframe elements are also visible in the Section viewer.
Notice that the section view is a filled view. This is the default option. The fill capability generates surfaces for display and measurement purposes (area, center of gravity, etc.). To obtain an unfilled view, de-
activate the Section Fill icon in the Result tab of the Sectioning Definition dialog box.
63Page DMU Space Analysis Version 5 Release 13
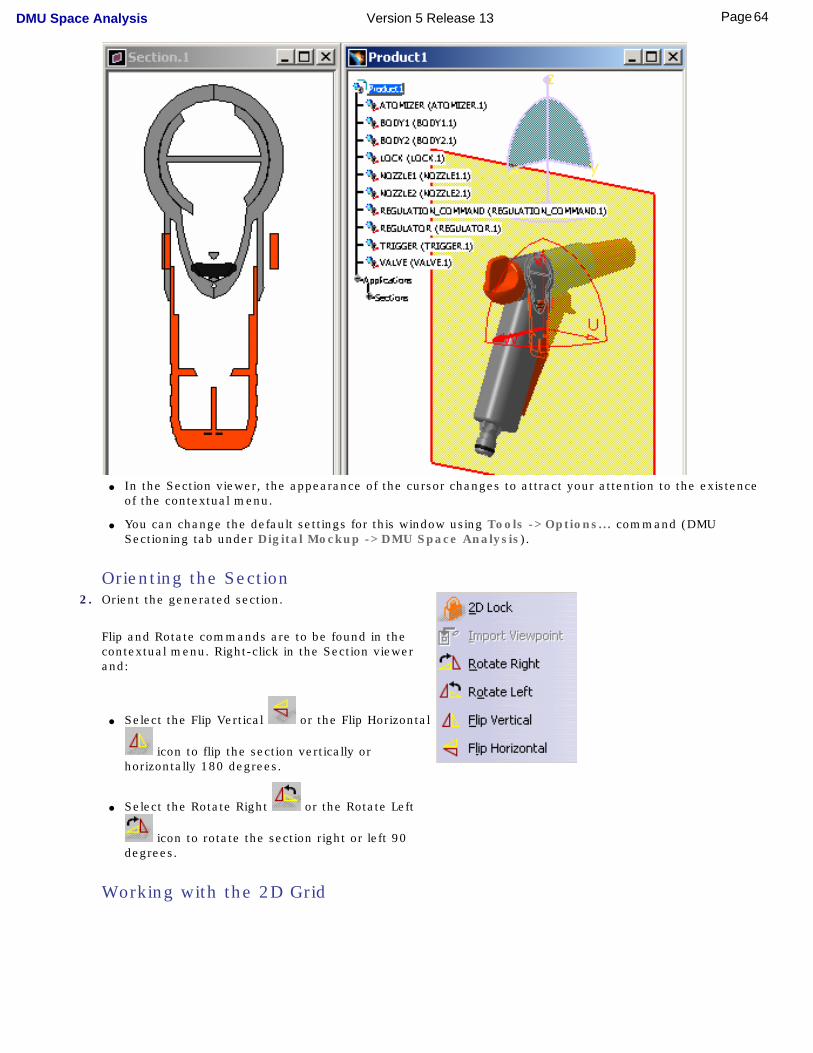
● In the Section viewer, the appearance of the cursor changes to attract your attention to the existence
of the contextual menu.
● You can change the default settings for this window using Tools ->Options... command (DMU Sectioning tab under Digital Mockup ->DMU Space Analysis).
Orienting the Section
2. Orient the generated section.
Flip and Rotate commands are to be found in the contextual menu. Right-click in the Section viewer and:
● Select the Flip Vertical or the Flip Horizontal
icon to flip the section vertically or horizontally 180 degrees.
● Select the Rotate Right or the Rotate Left
icon to rotate the section right or left 90 degrees.
Working with the 2D Grid
64Page DMU Space Analysis Version 5 Release 13
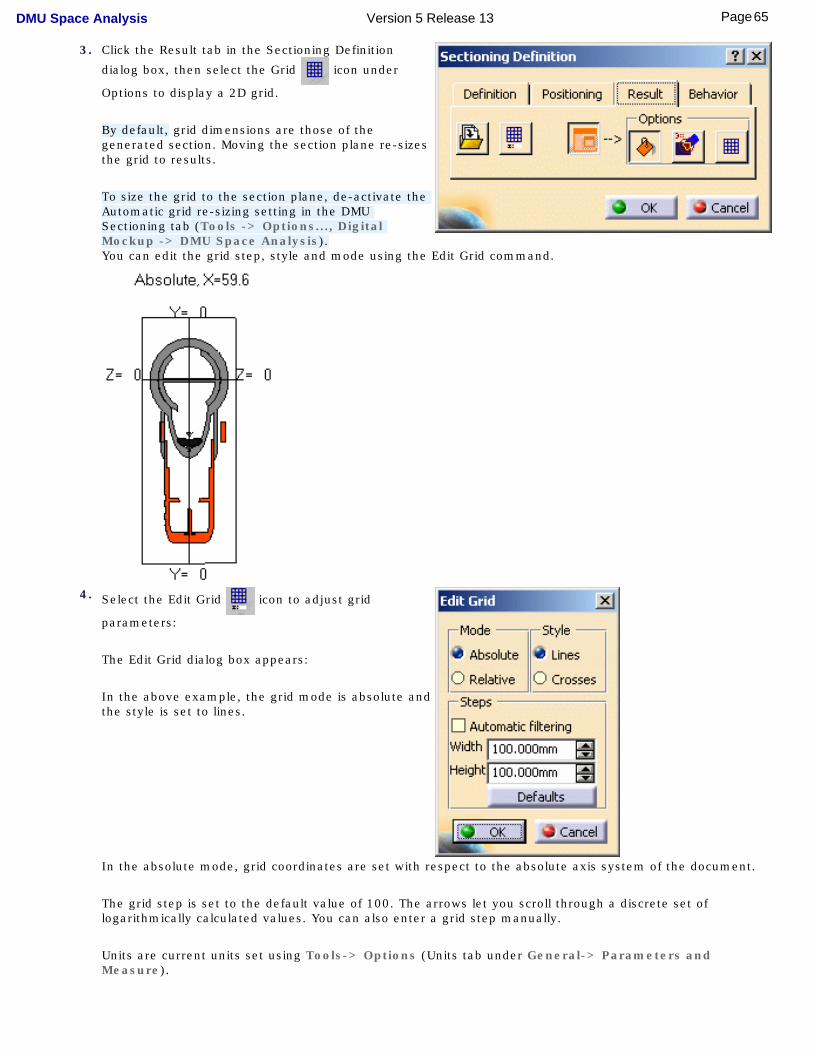
3. Click the Result tab in the Sectioning Definition
dialog box, then select the Grid icon under
Options to display a 2D grid.
By default, grid dimensions are those of the generated section. Moving the section plane re-sizes the grid to results.
To size the grid to the section plane, de-activate the Automatic grid re-sizing setting in the DMU Sectioning tab (Tools -> Options..., Digital Mockup -> DMU Space Analysis).You can edit the grid step, style and mode using the Edit Grid command.
4. Select the Edit Grid icon to adjust grid
parameters:
The Edit Grid dialog box appears:
In the above example, the grid mode is absolute and the style is set to lines.
In the absolute mode, grid coordinates are set with respect to the absolute axis system of the document.
The grid step is set to the default value of 100. The arrows let you scroll through a discrete set of logarithmically calculated values. You can also enter a grid step manually.
Units are current units set using Tools-> Options (Units tab under General-> Parameters and Measure).
65Page DMU Space Analysis Version 5 Release 13
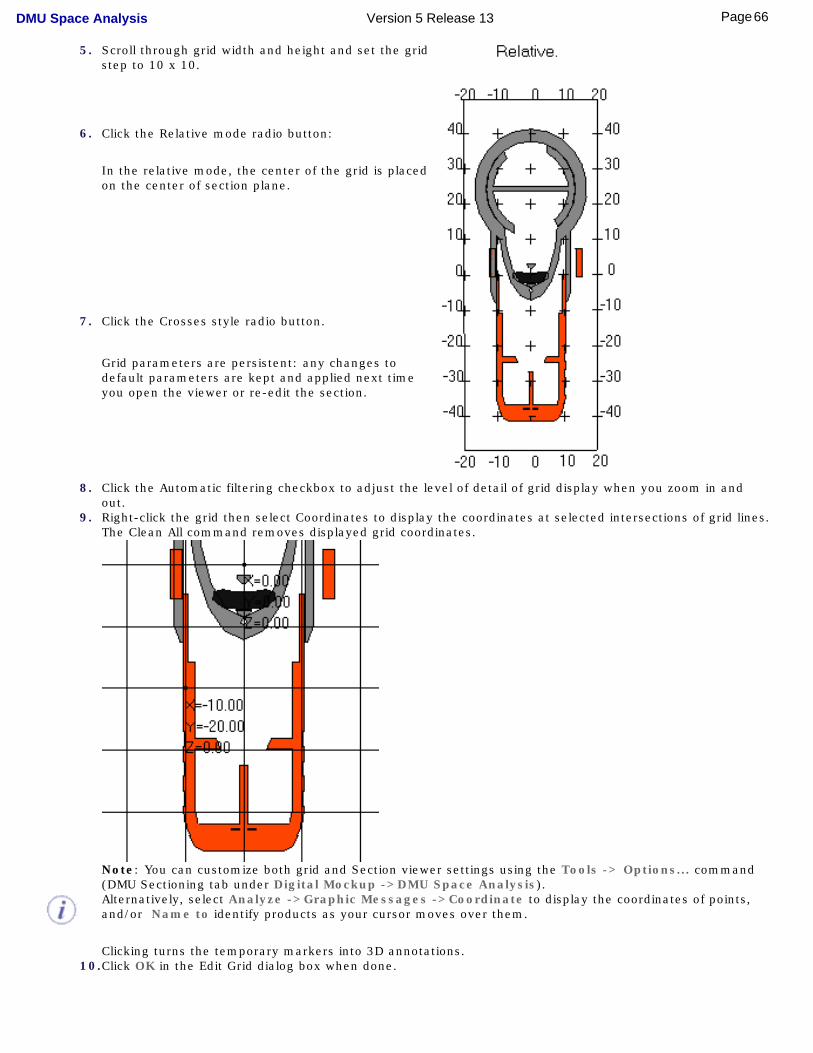
5. Scroll through grid width and height and set the grid step to 10 x 10.
6. Click the Relative mode radio button:
In the relative mode, the center of the grid is placed on the center of section plane.
7. Click the Crosses style radio button.
Grid parameters are persistent: any changes to default parameters are kept and applied next time you open the viewer or re-edit the section.
8. Click the Automatic filtering checkbox to adjust the level of detail of grid display when you zoom in and out.
9. Right-click the grid then select Coordinates to display the coordinates at selected intersections of grid lines. The Clean All command removes displayed grid coordinates.
Note: You can customize both grid and Section viewer settings using the Tools -> Options... command (DMU Sectioning tab under Digital Mockup ->DMU Space Analysis).
Alternatively, select Analyze ->Graphic Messages ->Coordinate to display the coordinates of points, and/or Name to identify products as your cursor moves over them.
Clicking turns the temporary markers into 3D annotations. 10.Click OK in the Edit Grid dialog box when done.
66Page DMU Space Analysis Version 5 Release 13
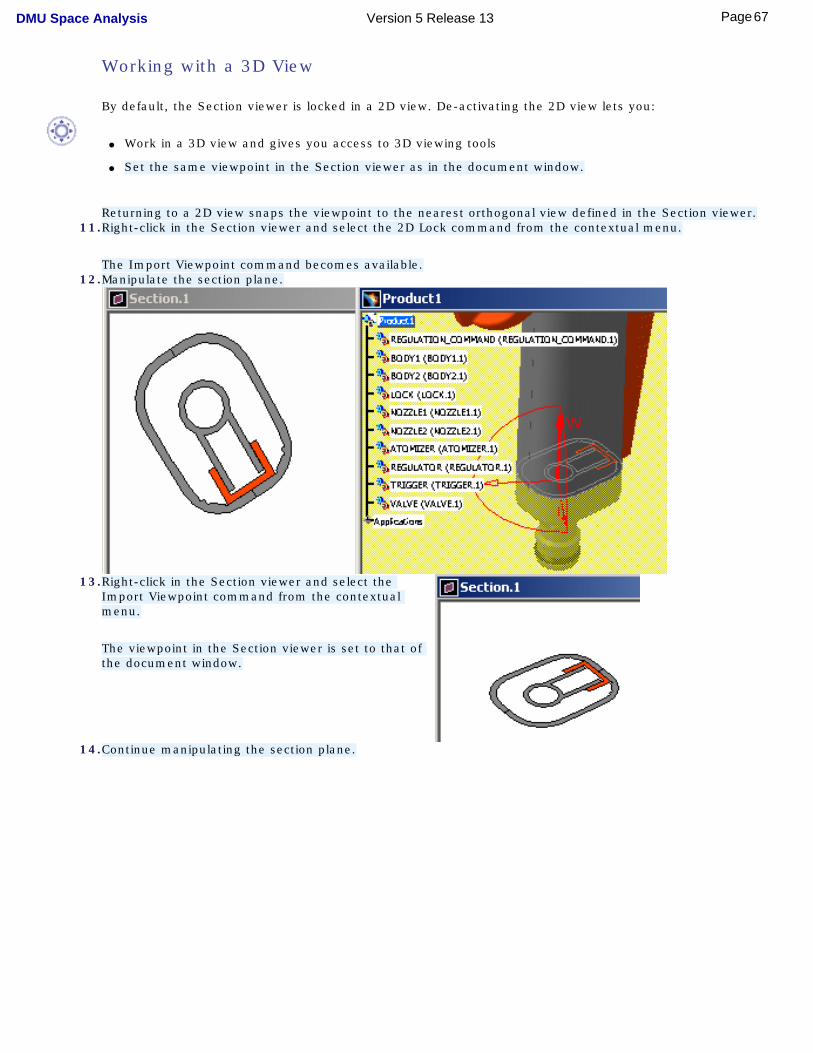
Working with a 3D View
By default, the Section viewer is locked in a 2D view. De-activating the 2D view lets you:
● Work in a 3D view and gives you access to 3D viewing tools
● Set the same viewpoint in the Section viewer as in the document window.
Returning to a 2D view snaps the viewpoint to the nearest orthogonal view defined in the Section viewer.
11.Right-click in the Section viewer and select the 2D Lock command from the contextual menu.
The Import Viewpoint command becomes available. 12.Manipulate the section plane.
13.Right-click in the Section viewer and select the Import Viewpoint command from the contextual menu.
The viewpoint in the Section viewer is set to that of the document window.
14.Continue manipulating the section plane.
67Page DMU Space Analysis Version 5 Release 13
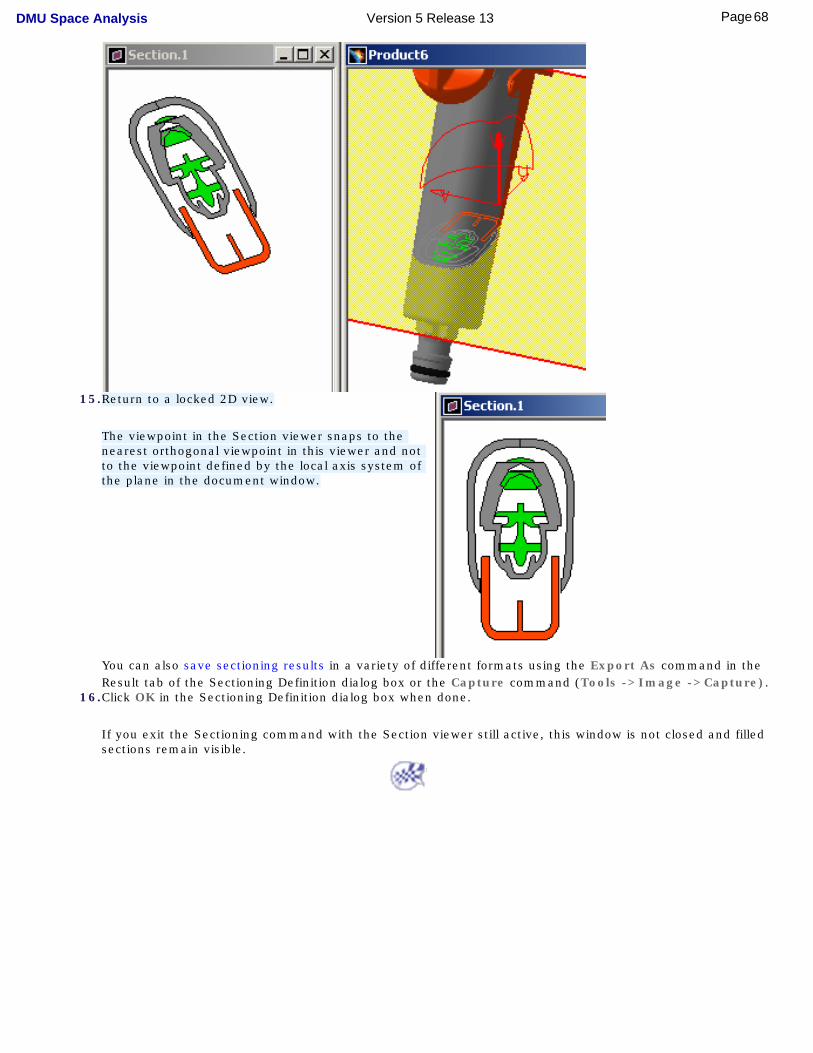
15.Return to a locked 2D view.
The viewpoint in the Section viewer snaps to the nearest orthogonal viewpoint in this viewer and not to the viewpoint defined by the local axis system of the plane in the document window.
You can also save sectioning results in a variety of different formats using the Export As command in the Result tab of the Sectioning Definition dialog box or the Capture command (Tools ->Image ->Capture).
16.Click OK in the Sectioning Definition dialog box when done.
If you exit the Sectioning command with the Section viewer still active, this window is not closed and filled sections remain visible.
68Page DMU Space Analysis Version 5 Release 13
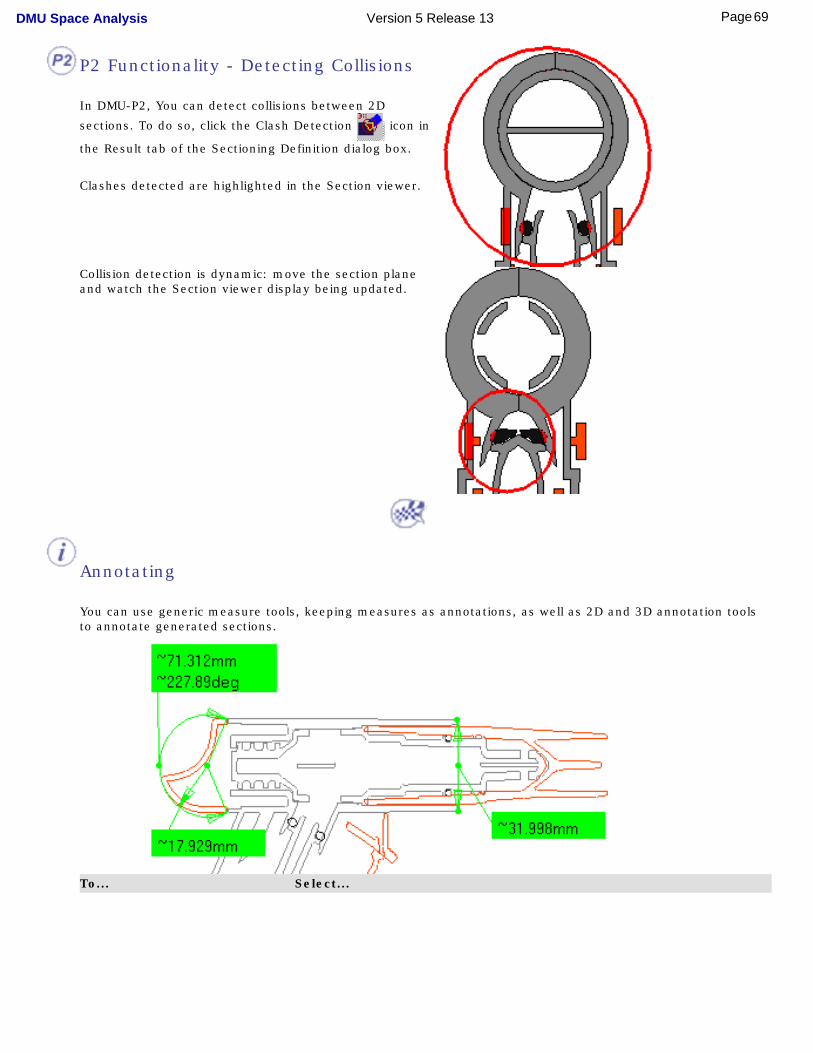
P2 Functionality - Detecting Collisions
In DMU-P2, You can detect collisions between 2D
sections. To do so, click the Clash Detection icon in
the Result tab of the Sectioning Definition dialog box.
Clashes detected are highlighted in the Section viewer.
Collision detection is dynamic: move the section plane and watch the Section viewer display being updated.
Annotating
You can use generic measure tools, keeping measures as annotations, as well as 2D and 3D annotation tools to annotate generated sections.
To... Select...
69Page DMU Space Analysis Version 5 Release 13
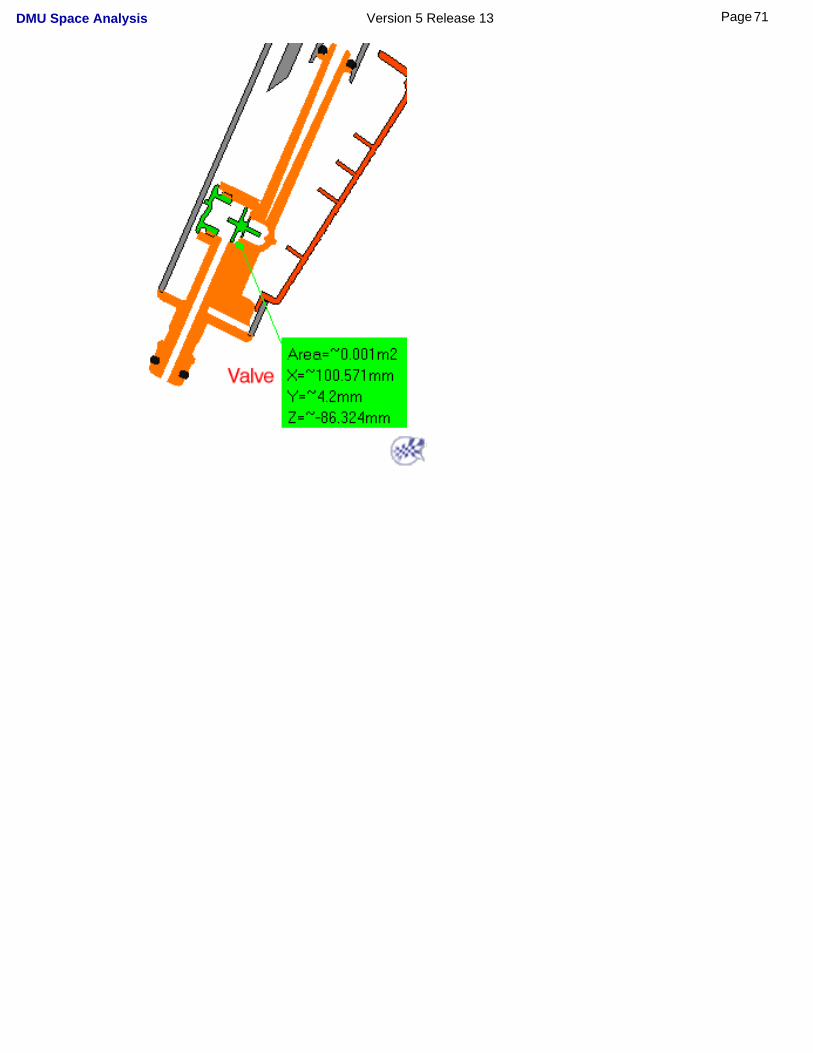
Measure distances at item level
Measure Between
You can measure minimum distances between edge primitives or between sections of elements (solid of a model, body of a CATPart). You can also measure distances between points representing the intersection of the plane with any wireframe elements present and other sectioned items, however, you cannot make measures with respect to grid elements.
Note: The Measure Between result is different depending on whether or not the section view is a filled view. If the section view is filled, the result obtained is the minimum distance between sections of selected elements. If the section view is unfilled, the result obtained is the minimum distance between edge primitives.
For more information, see Measuring distances and angles between geometrical elements, and, in the DMU Space Analysis User's Guide, Measuring minimum distance in the Section viewer.
Measure properties
Measure Item
You can measure properties on generated sections.
For more information, see Measuring properties.
Measure distances at product level
Distance and Band Analysis in DMU Space Analysis
You can measure minimum distance between the sections of selected products (model, CATPart, etc.).
For more information, see Measuring minimum distances and distances along X, Y, Z, and Measuring minimum distance in the Section viewer.
Add 3D text3D Annotation in DMU Space Analysis
For more information on 3D annotation, see the DMU Navigator User's Guide.
Create and annote 2D viewsCreating Annotated Views in DMU Space Analysis
The Creating Annotated Views command lets you create and annotate a 2D view of your section using the arrows, lines, text, etc. provided in the DMU 2D Marker toolbar. 2D views are identified in the specification tree and can
be recovered using the Managing Annotated Views icon.
For more information on 2D annotation, see the DMU Navigator User's Guide.
70Page DMU Space Analysis Version 5 Release 13
71Page DMU Space Analysis Version 5 Release 13
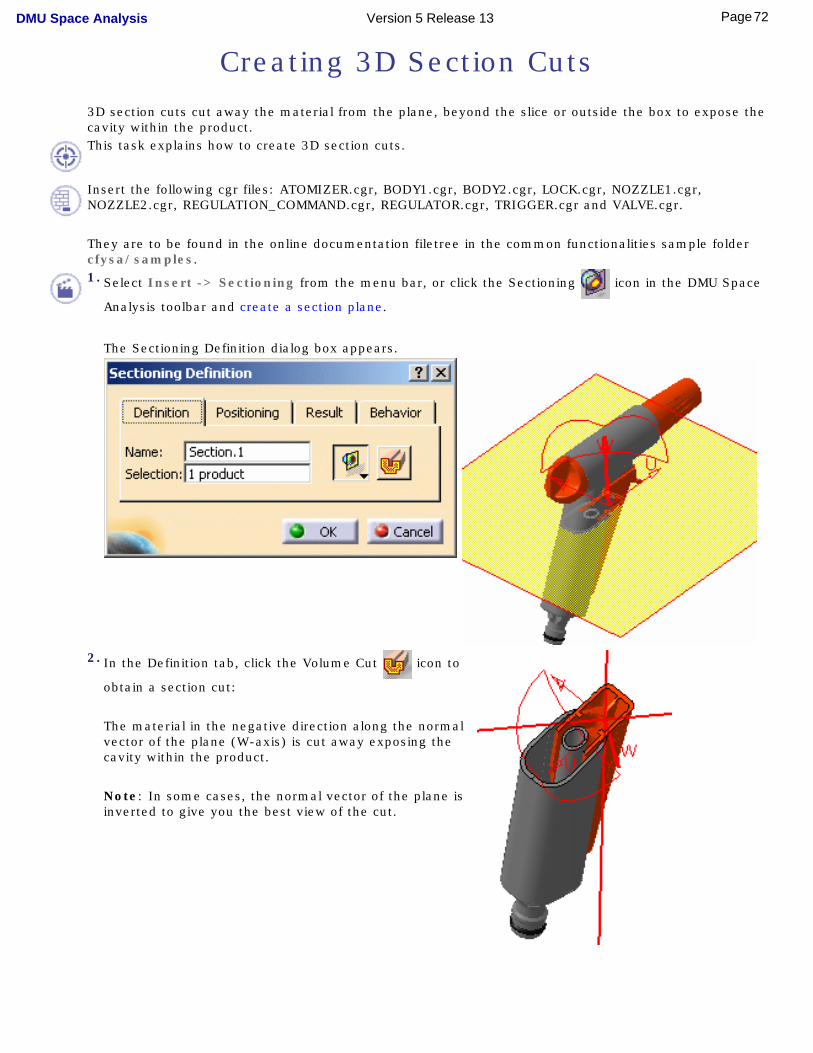
Creating 3D Section Cuts
3D section cuts cut away the material from the plane, beyond the slice or outside the box to expose the cavity within the product.
This task explains how to create 3D section cuts.
Insert the following cgr files: ATOMIZER.cgr, BODY1.cgr, BODY2.cgr, LOCK.cgr, NOZZLE1.cgr, NOZZLE2.cgr, REGULATION_COMMAND.cgr, REGULATOR.cgr, TRIGGER.cgr and VALVE.cgr.
They are to be found in the online documentation filetree in the common functionalities sample folder cfysa/samples.
1. Select Insert -> Sectioning from the menu bar, or click the Sectioning icon in the DMU Space
Analysis toolbar and create a section plane.
The Sectioning Definition dialog box appears.
2. In the Definition tab, click the Volume Cut icon to
obtain a section cut:
The material in the negative direction along the normal vector of the plane (W-axis) is cut away exposing the cavity within the product.
Note: In some cases, the normal vector of the plane is inverted to give you the best view of the cut.
72Page DMU Space Analysis Version 5 Release 13
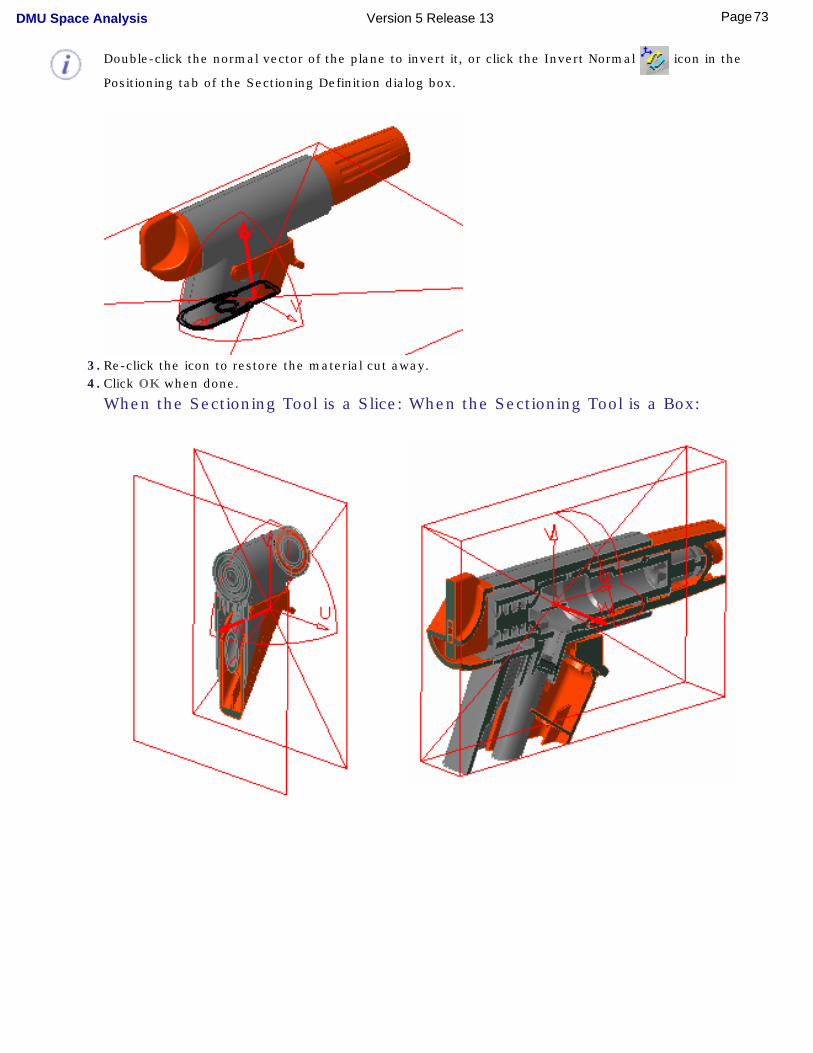
Double-click the normal vector of the plane to invert it, or click the Invert Normal icon in the
Positioning tab of the Sectioning Definition dialog box.
3. Re-click the icon to restore the material cut away.4. Click OK when done.
When the Sectioning Tool is a Slice: When the Sectioning Tool is a Box:
73Page DMU Space Analysis Version 5 Release 13
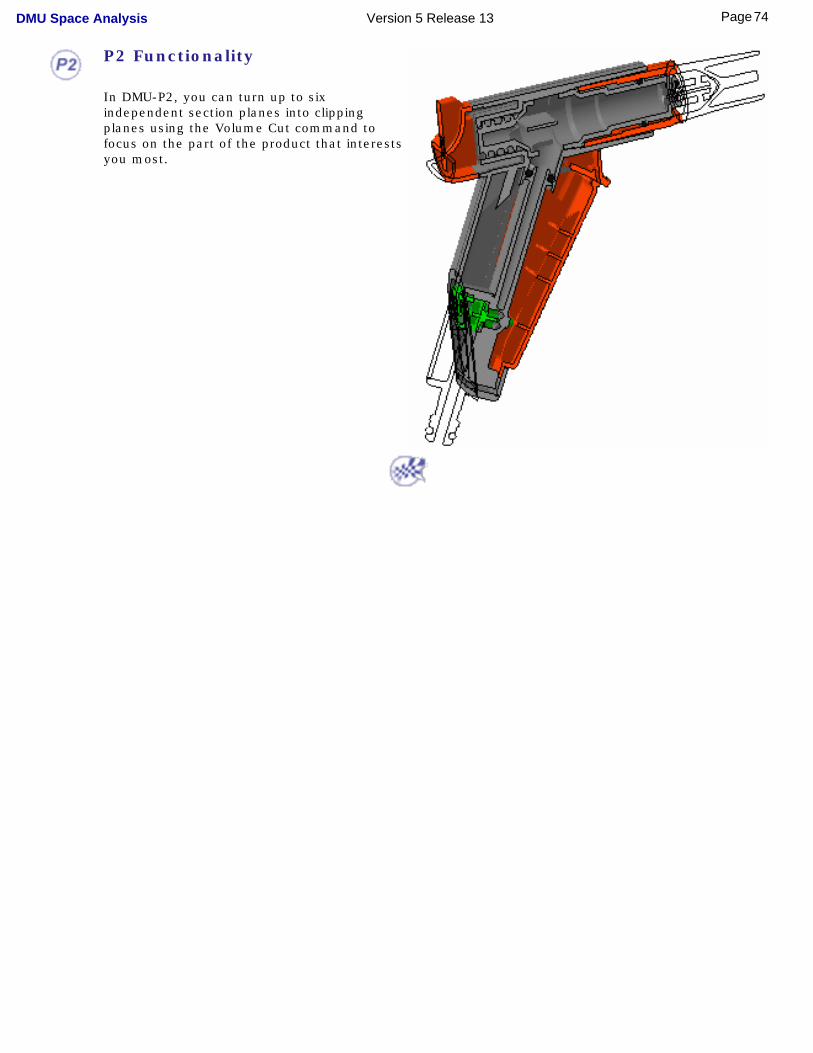
P2 Functionality
In DMU-P2, you can turn up to six independent section planes into clipping planes using the Volume Cut command to focus on the part of the product that interests you most.
74Page DMU Space Analysis Version 5 Release 13
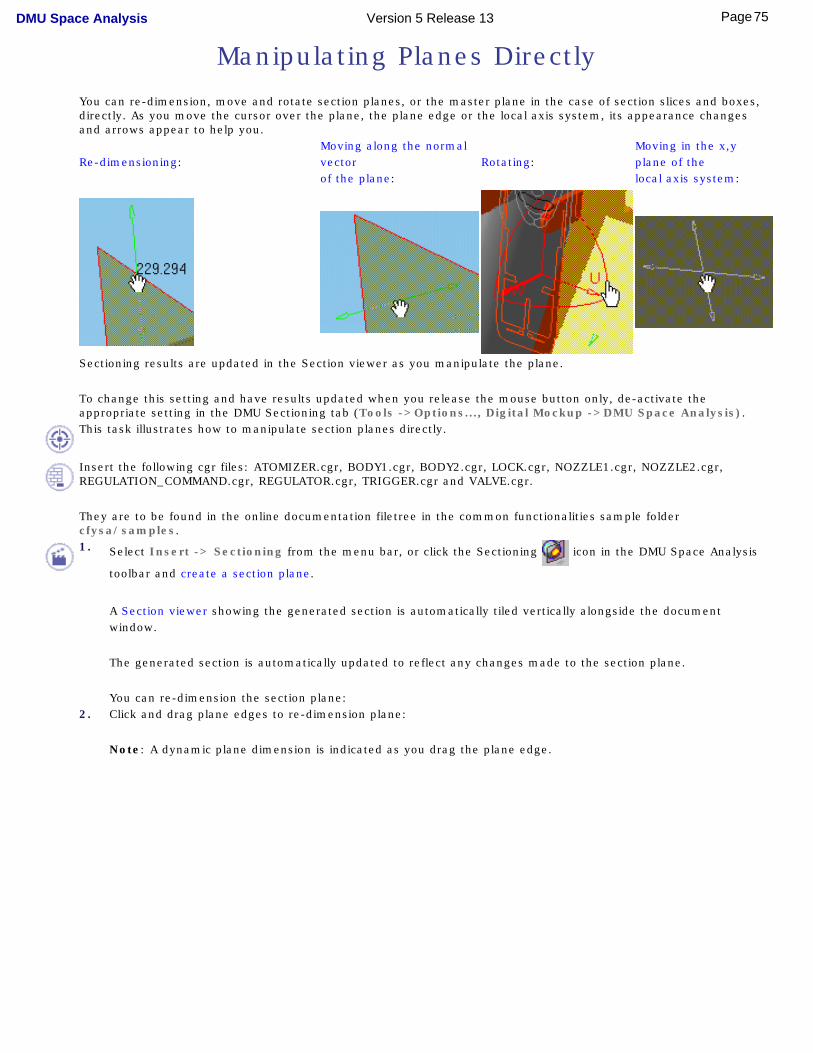
Manipulating Planes Directly
You can re-dimension, move and rotate section planes, or the master plane in the case of section slices and boxes, directly. As you move the cursor over the plane, the plane edge or the local axis system, its appearance changes and arrows appear to help you.
Re-dimensioning:Moving along the normal vectorof the plane:
Rotating:Moving in the x,y plane of thelocal axis system:
Sectioning results are updated in the Section viewer as you manipulate the plane.
To change this setting and have results updated when you release the mouse button only, de-activate the appropriate setting in the DMU Sectioning tab (Tools ->Options..., Digital Mockup ->DMU Space Analysis).This task illustrates how to manipulate section planes directly.
Insert the following cgr files: ATOMIZER.cgr, BODY1.cgr, BODY2.cgr, LOCK.cgr, NOZZLE1.cgr, NOZZLE2.cgr, REGULATION_COMMAND.cgr, REGULATOR.cgr, TRIGGER.cgr and VALVE.cgr.
They are to be found in the online documentation filetree in the common functionalities sample folder cfysa/samples.1. Select Insert -> Sectioning from the menu bar, or click the Sectioning icon in the DMU Space Analysis
toolbar and create a section plane.
A Section viewer showing the generated section is automatically tiled vertically alongside the document window.
The generated section is automatically updated to reflect any changes made to the section plane.
You can re-dimension the section plane:2. Click and drag plane edges to re-dimension plane:
Note: A dynamic plane dimension is indicated as you drag the plane edge.
75Page DMU Space Analysis Version 5 Release 13
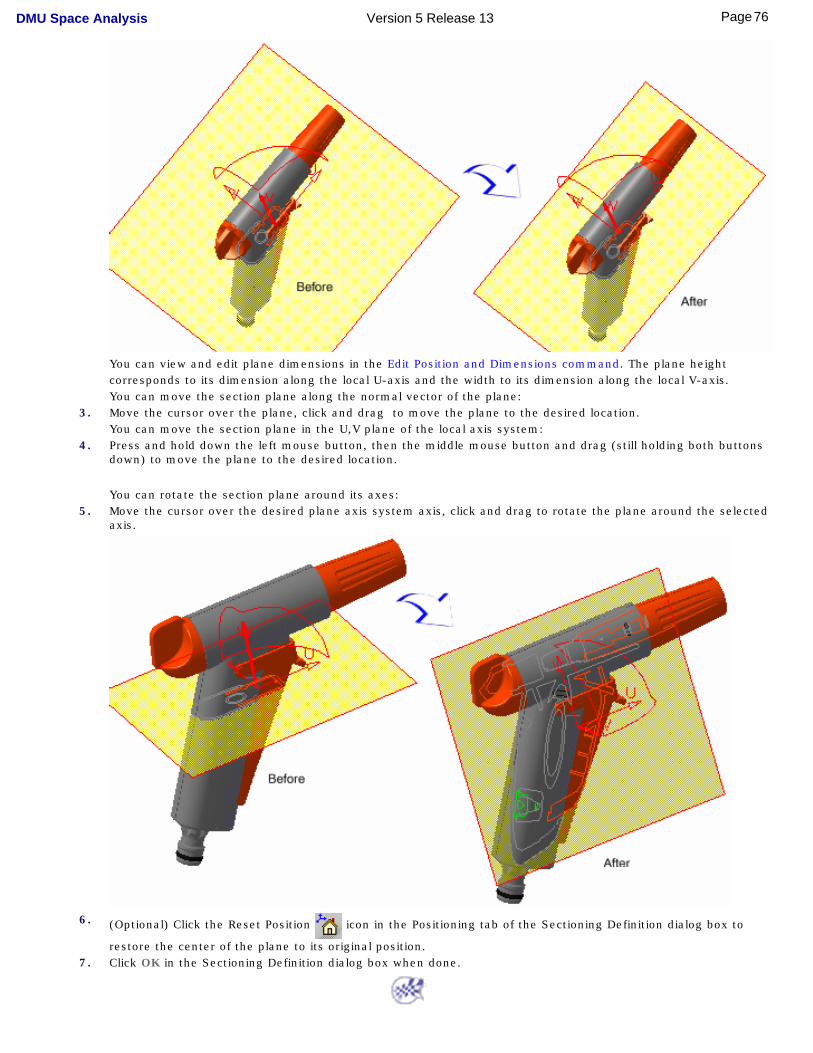
You can view and edit plane dimensions in the Edit Position and Dimensions command. The plane height corresponds to its dimension along the local U-axis and the width to its dimension along the local V-axis.You can move the section plane along the normal vector of the plane:
3. Move the cursor over the plane, click and drag to move the plane to the desired location.You can move the section plane in the U,V plane of the local axis system:
4. Press and hold down the left mouse button, then the middle mouse button and drag (still holding both buttons down) to move the plane to the desired location.
You can rotate the section plane around its axes: 5. Move the cursor over the desired plane axis system axis, click and drag to rotate the plane around the selected
axis.
6. (Optional) Click the Reset Position icon in the Positioning tab of the Sectioning Definition dialog box to
restore the center of the plane to its original position.7. Click OK in the Sectioning Definition dialog box when done.
76Page DMU Space Analysis Version 5 Release 13
Positioning Planes Using the Edit Position and Dimensions Command
In addition to manipulating the plane directly in the geometry area, you can position the section plane more precisely using the Edit Position and Dimensions command. You can move the plane to a new location as well as rotate the plane. You can also re-dimension the section plane.
In the case of section slices and boxes, it is the master plane that controls how the slice or box will be positioned.
This task illustrates how to position and re-dimension the section plane using the Edit Position and Dimensions command.
Insert the following cgr files: ATOMIZER.cgr, BODY1.cgr, BODY2.cgr, LOCK.cgr, NOZZLE1.cgr, NOZZLE2.cgr, REGULATION_COMMAND.cgr, REGULATOR.cgr, TRIGGER.cgr and VALVE.cgr.
They are to be found in the online documentation filetree in the common functionalities sample folder cfysa/samples.1. Select Insert -> Sectioning from the menu bar, or click the Sectioning icon in the DMU Space
Analysis toolbar and create a section plane.
A Section viewer showing the generated section is automatically tiled vertically alongside the document window. The generated section is automatically updated to reflect any changes made to the section plane.
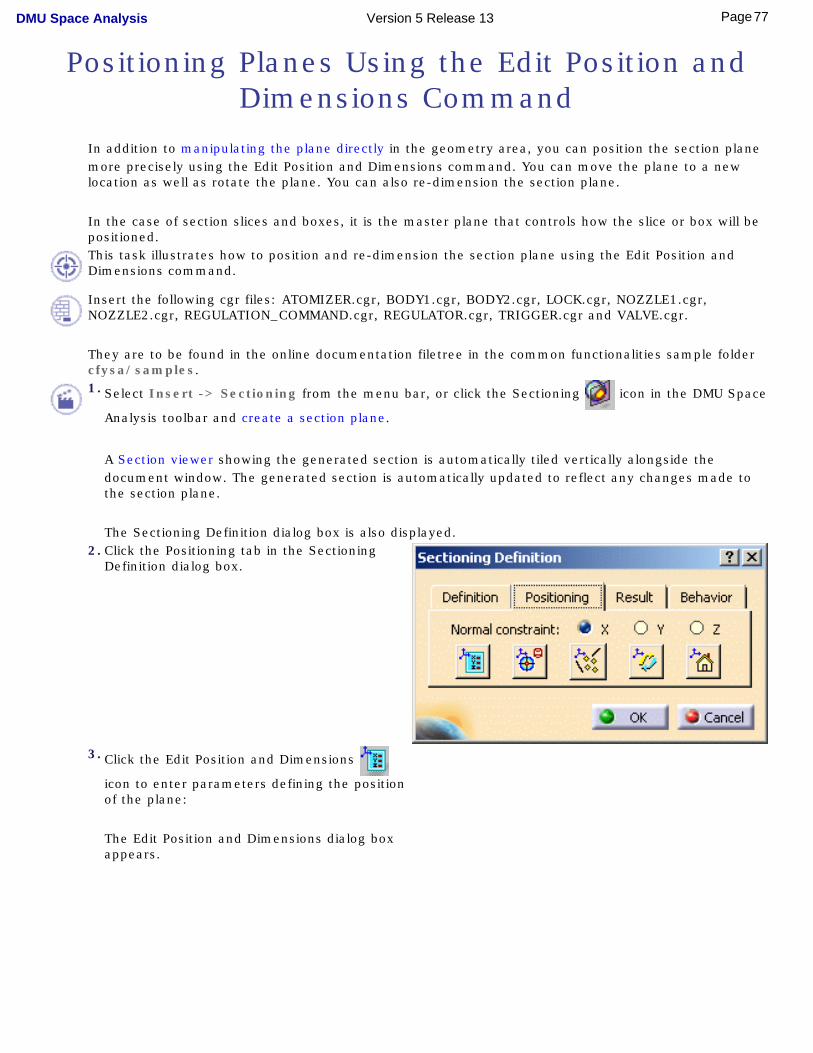
The Sectioning Definition dialog box is also displayed. 2. Click the Positioning tab in the Sectioning
Definition dialog box.
3. Click the Edit Position and Dimensions
icon to enter parameters defining the position of the plane:
The Edit Position and Dimensions dialog box appears.
77Page DMU Space Analysis Version 5 Release 13
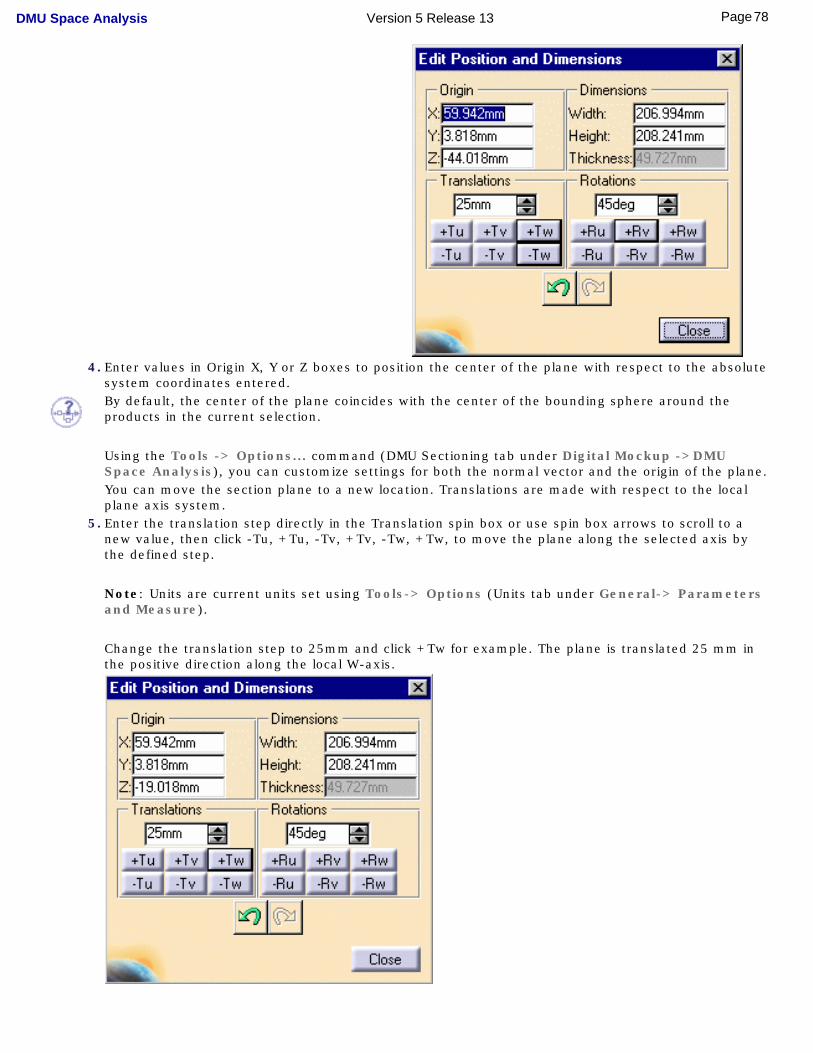
4. Enter values in Origin X, Y or Z boxes to position the center of the plane with respect to the absolute system coordinates entered.By default, the center of the plane coincides with the center of the bounding sphere around the products in the current selection.
Using the Tools -> Options... command (DMU Sectioning tab under Digital Mockup ->DMU Space Analysis), you can customize settings for both the normal vector and the origin of the plane.You can move the section plane to a new location. Translations are made with respect to the local plane axis system.
5. Enter the translation step directly in the Translation spin box or use spin box arrows to scroll to a new value, then click -Tu, +Tu, -Tv, +Tv, -Tw, +Tw, to move the plane along the selected axis by the defined step.
Note: Units are current units set using Tools-> Options (Units tab under General-> Parameters and Measure).
Change the translation step to 25mm and click +Tw for example. The plane is translated 25 mm in the positive direction along the local W-axis.
78Page DMU Space Analysis Version 5 Release 13
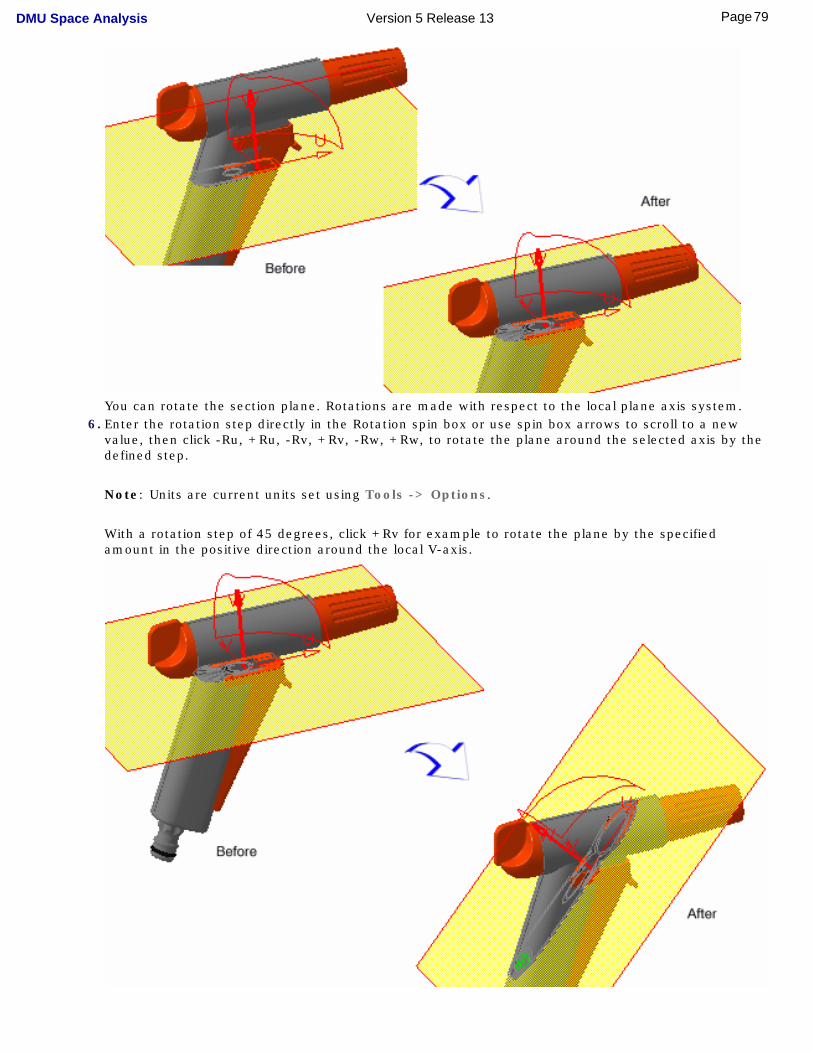
You can rotate the section plane. Rotations are made with respect to the local plane axis system.
6. Enter the rotation step directly in the Rotation spin box or use spin box arrows to scroll to a new value, then click -Ru, +Ru, -Rv, +Rv, -Rw, +Rw, to rotate the plane around the selected axis by the defined step.
Note: Units are current units set using Tools -> Options.
With a rotation step of 45 degrees, click +Rv for example to rotate the plane by the specified amount in the positive direction around the local V-axis.
79Page DMU Space Analysis Version 5 Release 13
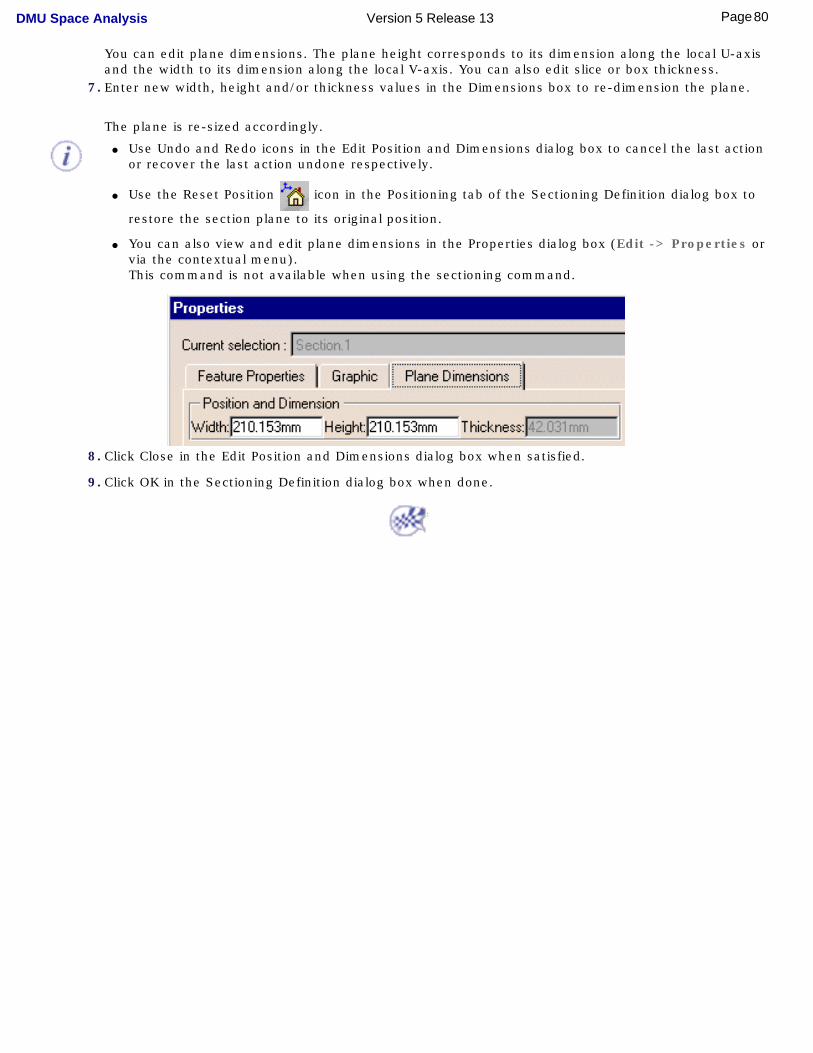
You can edit plane dimensions. The plane height corresponds to its dimension along the local U-axis and the width to its dimension along the local V-axis. You can also edit slice or box thickness.
7. Enter new width, height and/or thickness values in the Dimensions box to re-dimension the plane.
The plane is re-sized accordingly.
● Use Undo and Redo icons in the Edit Position and Dimensions dialog box to cancel the last action or recover the last action undone respectively.
● Use the Reset Position icon in the Positioning tab of the Sectioning Definition dialog box to
restore the section plane to its original position.
● You can also view and edit plane dimensions in the Properties dialog box (Edit -> Properties or via the contextual menu).This command is not available when using the sectioning command.
8. Click Close in the Edit Position and Dimensions dialog box when satisfied.
9. Click OK in the Sectioning Definition dialog box when done.
80Page DMU Space Analysis Version 5 Release 13
Positioning Planes On a Geometric Target
You can position section planes, section slices and section boxes with respect to a geometrical target (a face, edge, reference plane or cylinder axis). In the case of section slices and boxes, it is the master plane that controls how the slice or box will be positioned.
This task illustrates how to position a section plane with respect to a geometrical target.
Insert the following cgr files: ATOMIZER.cgr, BODY1.cgr, BODY2.cgr, LOCK.cgr, NOZZLE1.cgr, NOZZLE2.cgr, REGULATION_COMMAND.cgr, REGULATOR.cgr, TRIGGER.cgr and VALVE.cgr.
They are to be found in the online documentation filetree in the common functionalities sample folder cfysa/samples.
1. Select Insert -> Sectioning from the menu bar, or click the Sectioning icon in the DMU Space Analysis toolbar
and create a section plane.
The Sectioning Definition dialog box appears.
A Section viewer showing the generated section is automatically tiled vertically alongside the document window.
The generated section is automatically updated to reflect any changes made to the section plane.
2. Click the Positioning tab in the Sectioning Definition dialog box.
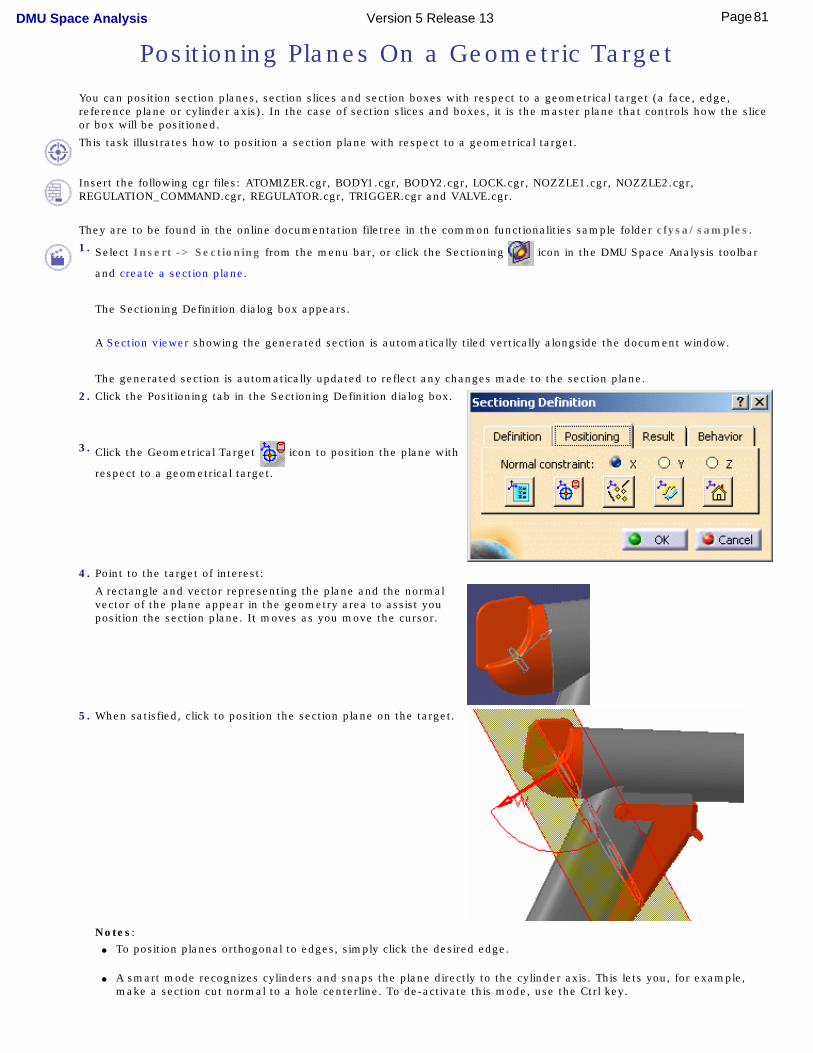
3. Click the Geometrical Target icon to position the plane with
respect to a geometrical target.
4. Point to the target of interest:
A rectangle and vector representing the plane and the normal vector of the plane appear in the geometry area to assist you position the section plane. It moves as you move the cursor.
5. When satisfied, click to position the section plane on the target.
Notes: ● To position planes orthogonal to edges, simply click the desired edge.
● A smart mode recognizes cylinders and snaps the plane directly to the cylinder axis. This lets you, for example, make a section cut normal to a hole centerline. To de-activate this mode, use the Ctrl key.
81Page DMU Space Analysis Version 5 Release 13

● Selecting the Automatically reframe option in the DMU Sectioning tab (Tools -> Options -> Digital Mockup ->
DMU Space Analysis), reframes the Section viewer and locates the point at the center of the target at the center of the Section viewer.
Zooming in lets you pinpoint the selected point.This is particularly useful when using snap capabilities in a complex DMU session containing a large number of objects.
P2 Functionality
In DMU-P2, you can move the plane along a curve, edge or surface:
● Point to the target of interest
● Press and hold down the Ctrl key
● Still holding down the Ctrl key, move the cursor along the target. The plane is positioned tangent to the small target plane. As you move the cursor, the plane moves along the curve or edge.
6. (Optional) Click the Reset Position icon to restore the center of the plane to its original position.
7. Click OK in the Sectioning Definition dialog box when done.
82Page DMU Space Analysis Version 5 Release 13
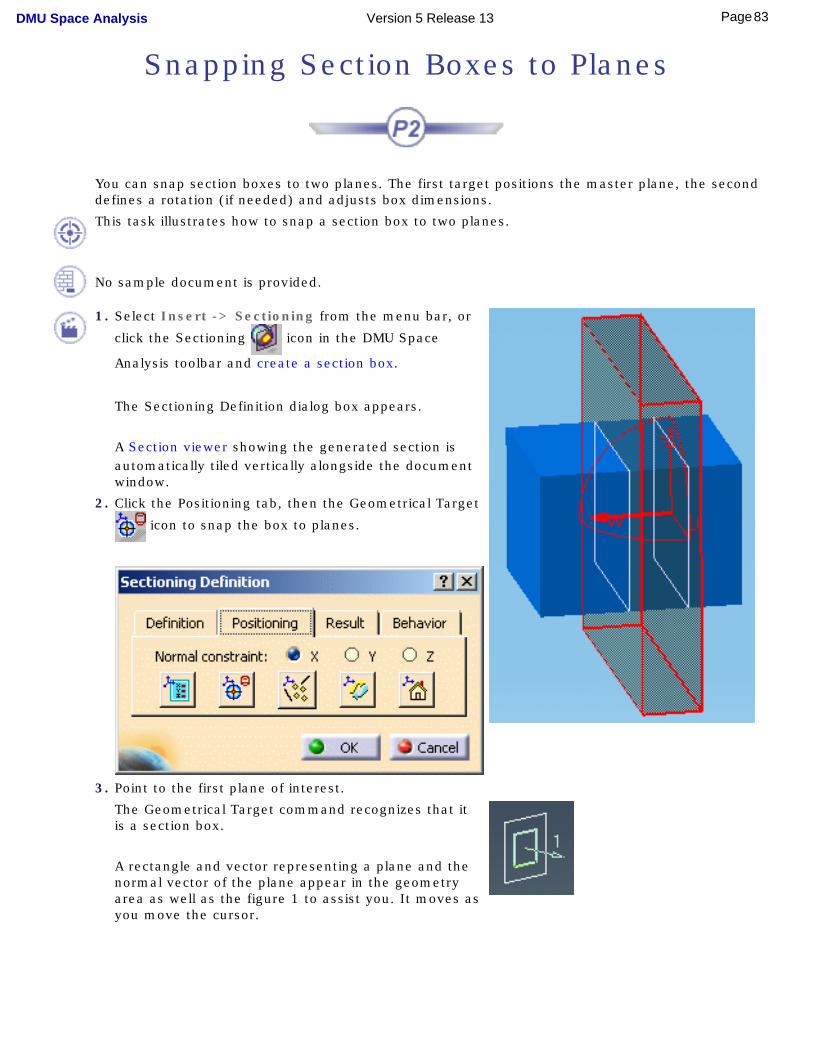
Snapping Section Boxes to Planes
You can snap section boxes to two planes. The first target positions the master plane, the second defines a rotation (if needed) and adjusts box dimensions.
This task illustrates how to snap a section box to two planes.
No sample document is provided.
1. Select Insert -> Sectioning from the menu bar, or
click the Sectioning icon in the DMU Space
Analysis toolbar and create a section box.
The Sectioning Definition dialog box appears.
A Section viewer showing the generated section is automatically tiled vertically alongside the document window.
2. Click the Positioning tab, then the Geometrical Target
icon to snap the box to planes.
3. Point to the first plane of interest.
The Geometrical Target command recognizes that it is a section box.
A rectangle and vector representing a plane and the normal vector of the plane appear in the geometry area as well as the figure 1 to assist you. It moves as you move the cursor.
83Page DMU Space Analysis Version 5 Release 13
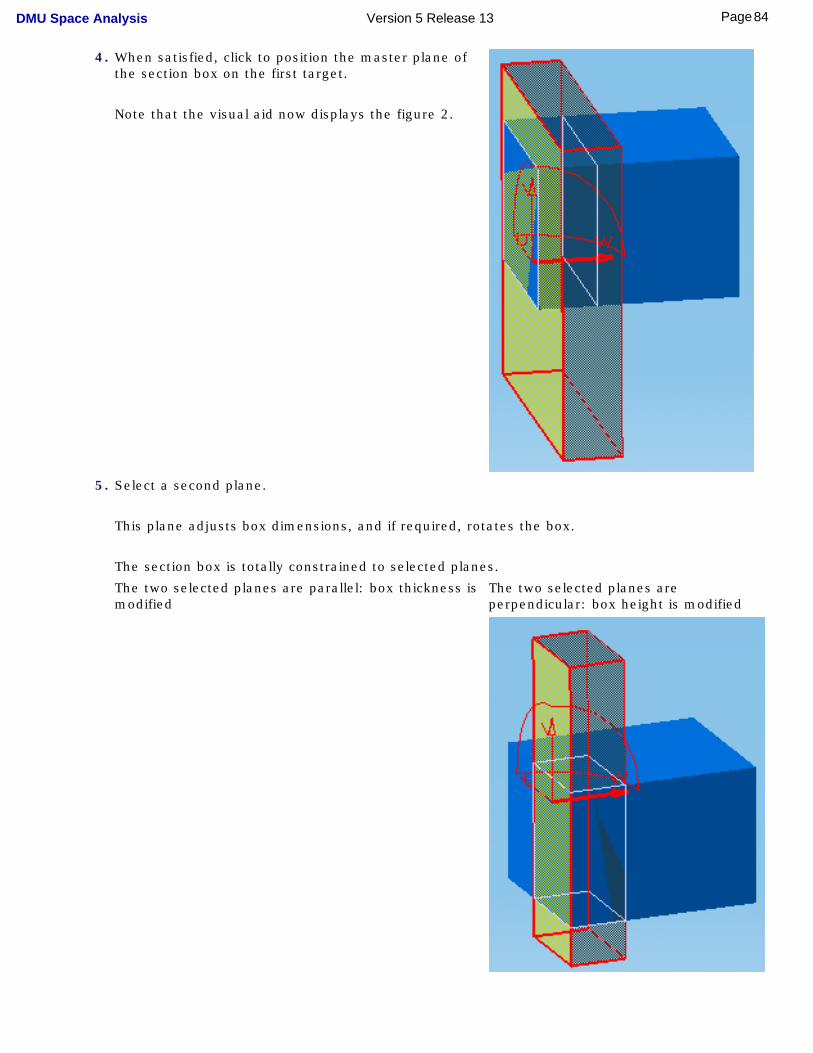
4. When satisfied, click to position the master plane of the section box on the first target.
Note that the visual aid now displays the figure 2.
5. Select a second plane.
This plane adjusts box dimensions, and if required, rotates the box.
The section box is totally constrained to selected planes.
The two selected planes are parallel: box thickness is modified
The two selected planes are perpendicular: box height is modified
84Page DMU Space Analysis Version 5 Release 13
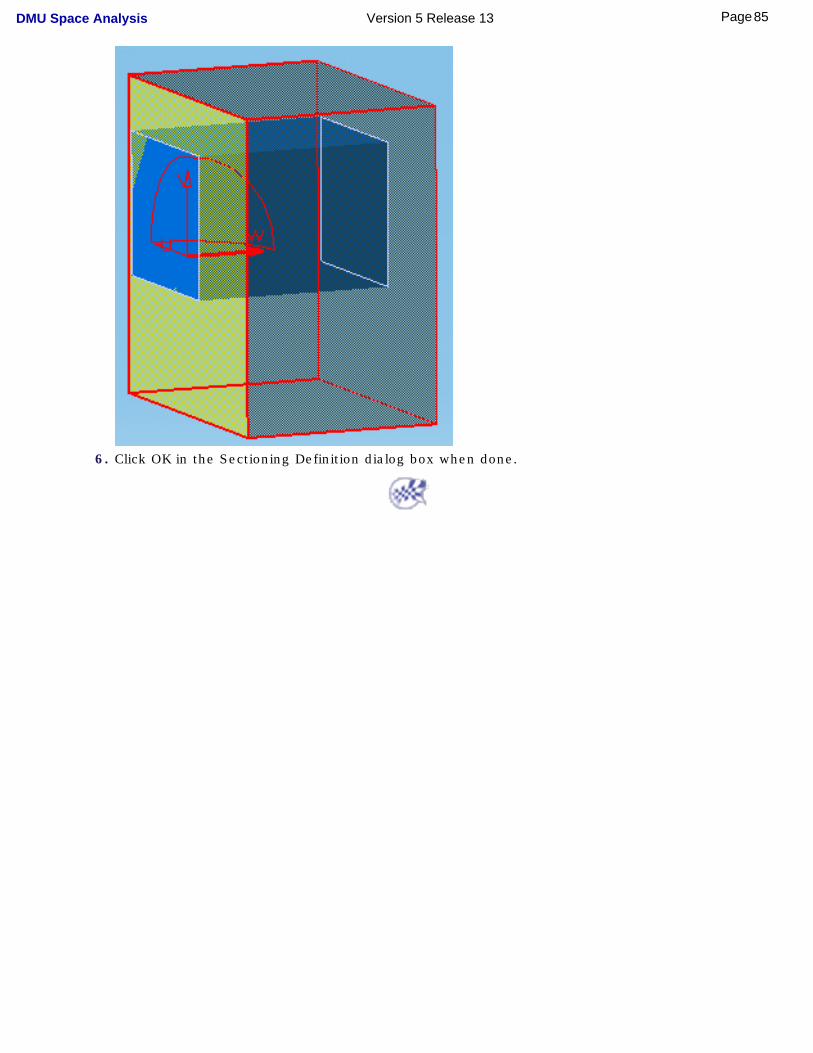
6. Click OK in the Sectioning Definition dialog box when done.
85Page DMU Space Analysis Version 5 Release 13
Snapping Planes to Points and/or Lines
You can position section planes by selecting three points, two lines, or combination of the two.
This task illustrates how to snap a section plane to a selection consisting of lines and/or points.
No sample document is provided.
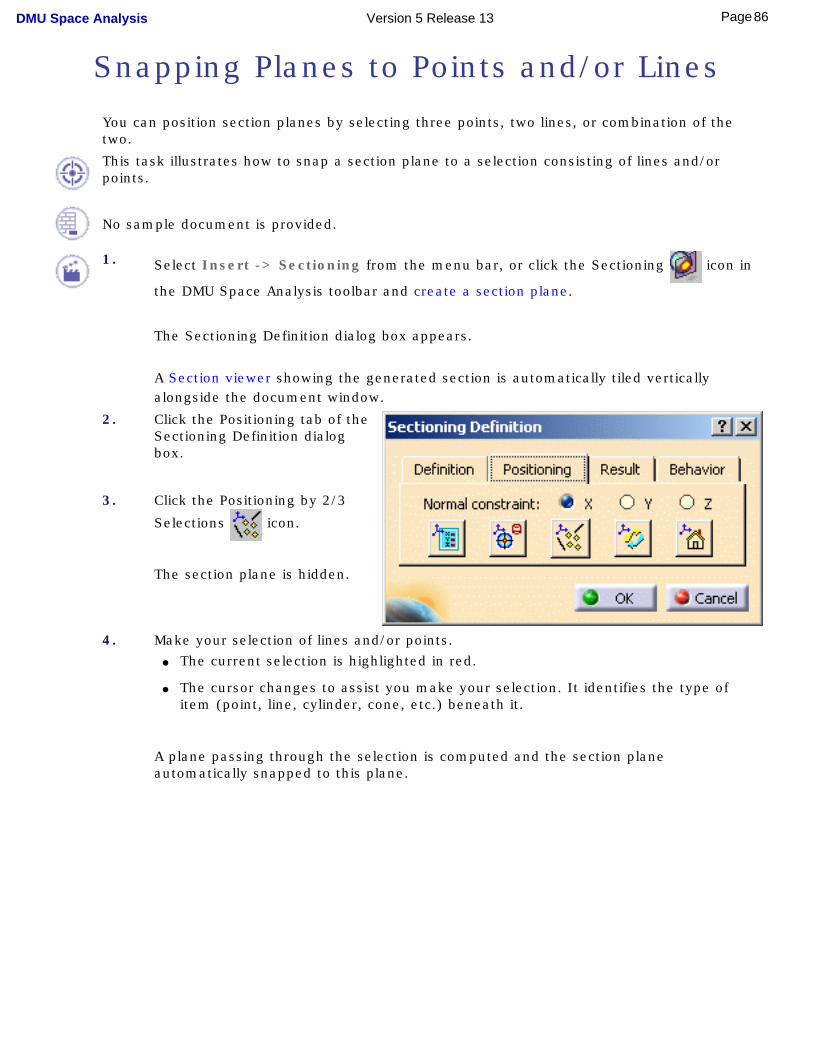
1. Select Insert -> Sectioning from the menu bar, or click the Sectioning icon in
the DMU Space Analysis toolbar and create a section plane.
The Sectioning Definition dialog box appears.
A Section viewer showing the generated section is automatically tiled vertically alongside the document window.
2. Click the Positioning tab of the Sectioning Definition dialog box.
3. Click the Positioning by 2/3
Selections icon.
The section plane is hidden.
4. Make your selection of lines and/or points.● The current selection is highlighted in red.
● The cursor changes to assist you make your selection. It identifies the type of item (point, line, cylinder, cone, etc.) beneath it.
A plane passing through the selection is computed and the section plane automatically snapped to this plane.
86Page DMU Space Analysis Version 5 Release 13
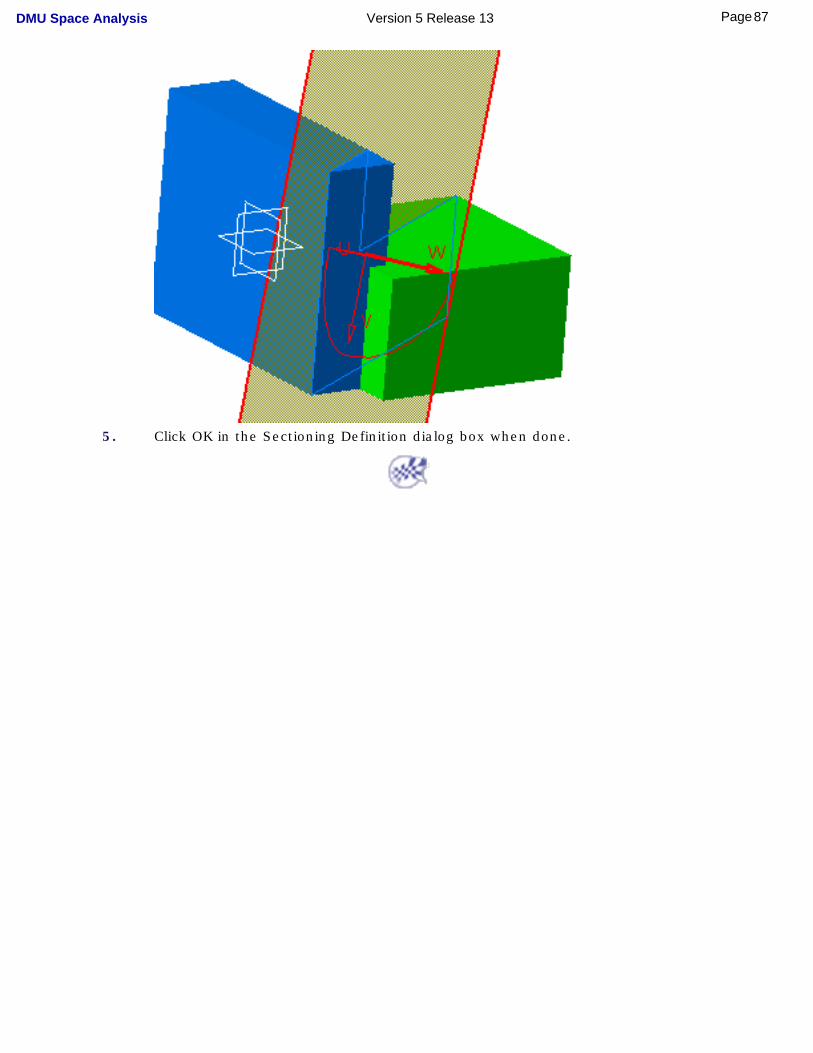
5. Click OK in the Sectioning Definition dialog box when done.
87Page DMU Space Analysis Version 5 Release 13

Saving Section Results
You can save section results in a variety of different formats using: ● The Export As command. This command is particularly useful for exporting results to CATIA
V4.
● The Capture command.
Using the Export As Command
This task illustrates how to export sectioning results in a number of different formats using the Export As command.
Insert the following cgr files: ATOMIZER.cgr, BODY1.cgr, BODY2.cgr, LOCK.cgr, NOZZLE1.cgr, NOZZLE2.cgr, REGULATION_COMMAND.cgr, REGULATOR.cgr, TRIGGER.cgr and VALVE.cgr.
They are to be found in the online documentation filetree in the common functionalities sample folder cfysa/samples.
1. Select Insert -> Sectioning from the menu bar, or click the Sectioning icon in the DMU
Space Analysis toolbar and create the desired section plane, slice or box and corresponding section.
2. Click the Result tab in the Sectioning Definition dialog box.
3. Click the Export As icon:
The Save As dialog box appears.
4. Specify the location of the document to be saved and, if necessary, enter a file name.
88Page DMU Space Analysis Version 5 Release 13
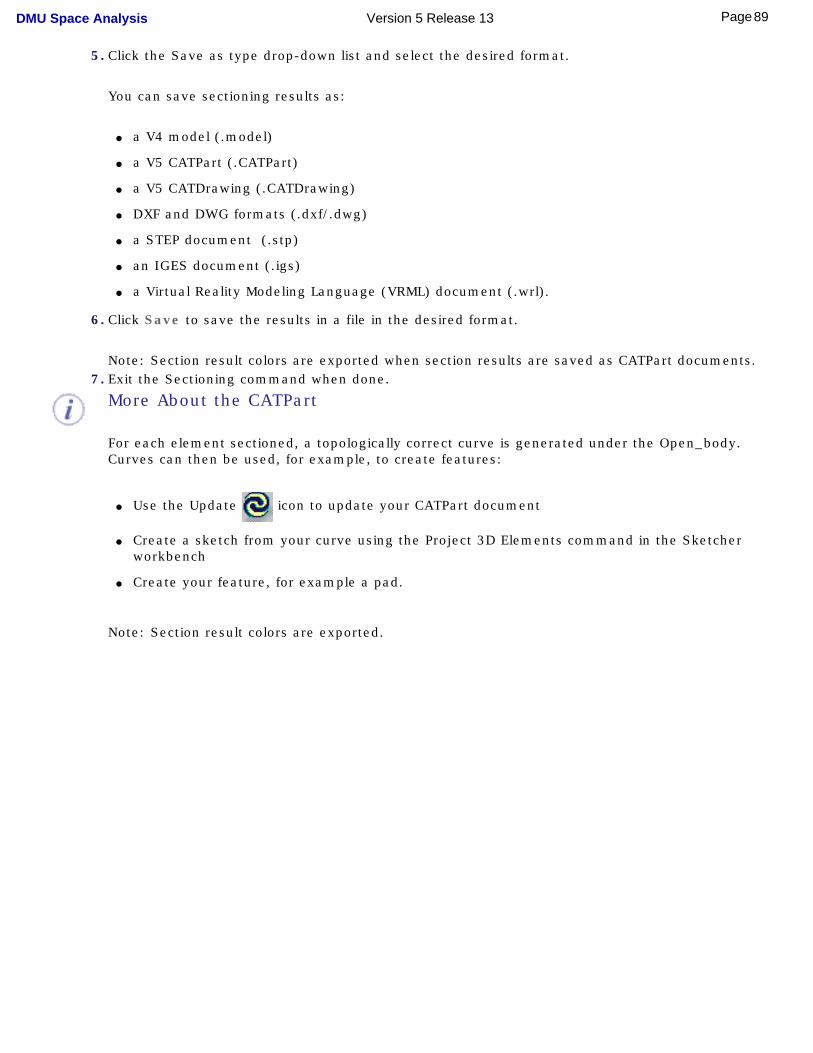
5. Click the Save as type drop-down list and select the desired format.
You can save sectioning results as:
● a V4 model (.model)
● a V5 CATPart (.CATPart)
● a V5 CATDrawing (.CATDrawing)
● DXF and DWG formats (.dxf/.dwg)
● a STEP document (.stp)
● an IGES document (.igs)
● a Virtual Reality Modeling Language (VRML) document (.wrl).
6. Click Save to save the results in a file in the desired format.
Note: Section result colors are exported when section results are saved as CATPart documents.7. Exit the Sectioning command when done.
More About the CATPart
For each element sectioned, a topologically correct curve is generated under the Open_body. Curves can then be used, for example, to create features:
● Use the Update icon to update your CATPart document
● Create a sketch from your curve using the Project 3D Elements command in the Sketcher workbench
● Create your feature, for example a pad.
Note: Section result colors are exported.
89Page DMU Space Analysis Version 5 Release 13
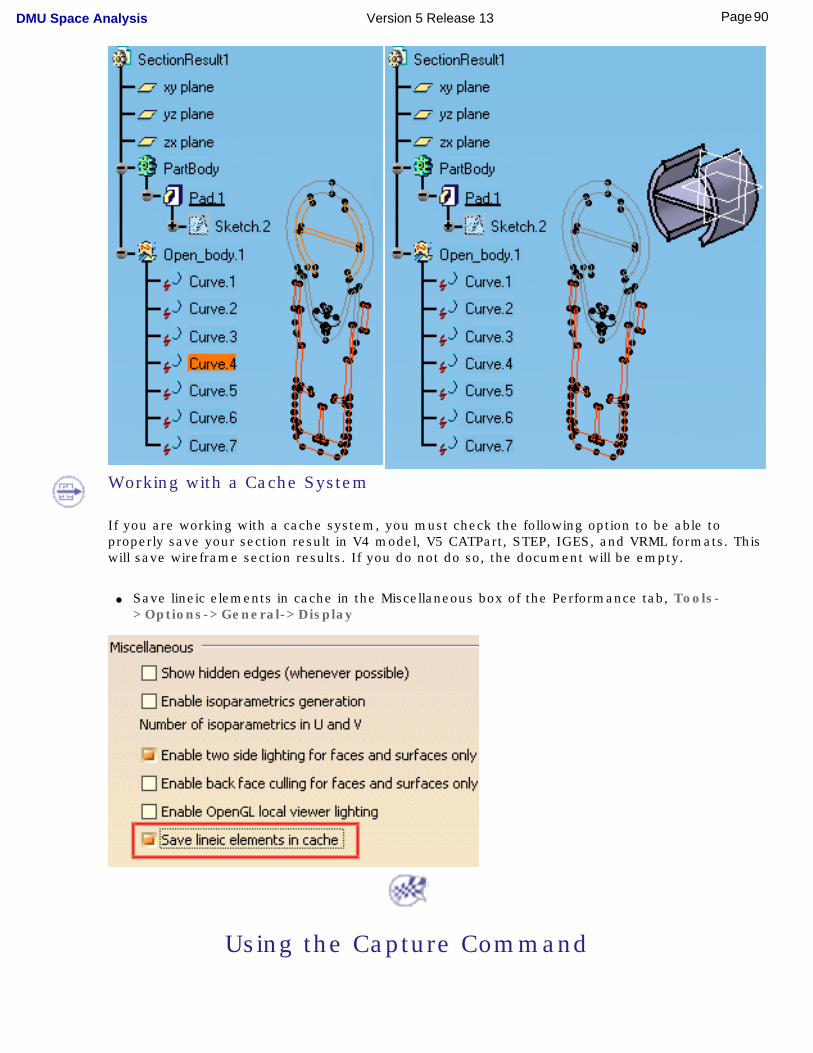
Working with a Cache System
If you are working with a cache system, you must check the following option to be able to properly save your section result in V4 model, V5 CATPart, STEP, IGES, and VRML formats. This will save wireframe section results. If you do not do so, the document will be empty.
● Save lineic elements in cache in the Miscellaneous box of the Performance tab, Tools->Options->General->Display
Using the Capture Command
90Page DMU Space Analysis Version 5 Release 13
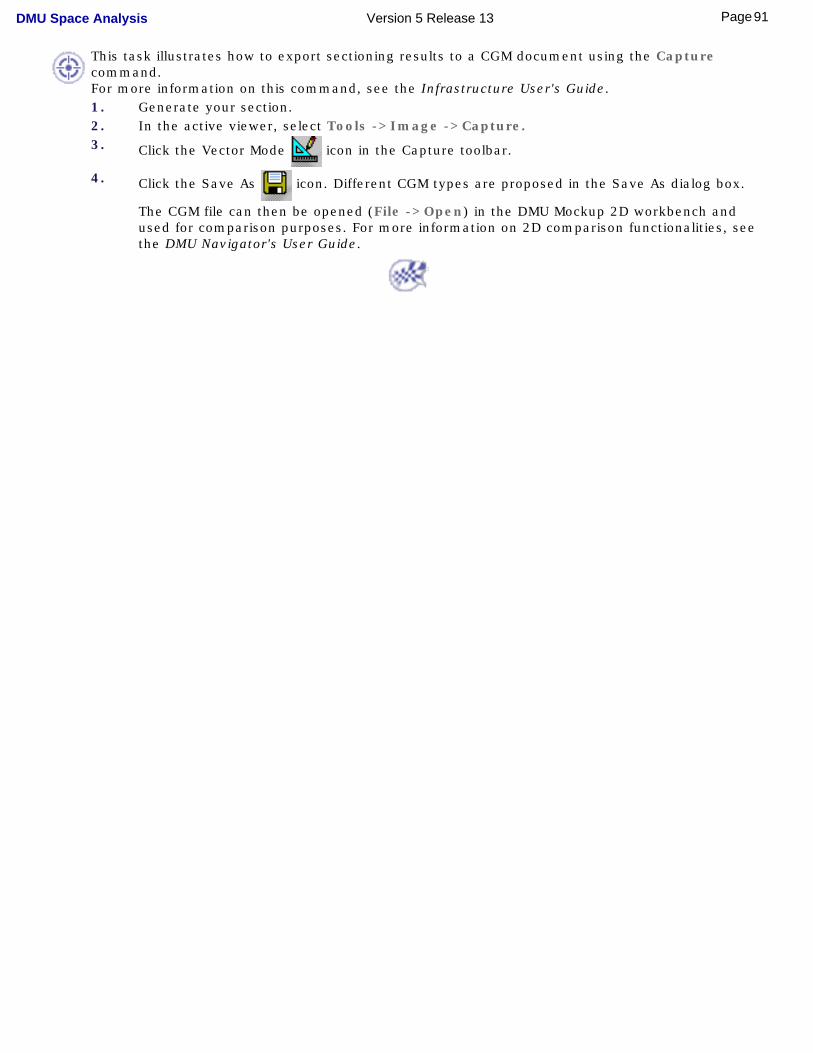
This task illustrates how to export sectioning results to a CGM document using the Capture command.For more information on this command, see the Infrastructure User's Guide.1. Generate your section.2. In the active viewer, select Tools ->Image ->Capture.3. Click the Vector Mode icon in the Capture toolbar.
4. Click the Save As icon. Different CGM types are proposed in the Save As dialog box.
The CGM file can then be opened (File ->Open) in the DMU Mockup 2D workbench and used for comparison purposes. For more information on 2D comparison functionalities, see the DMU Navigator's User Guide.
91Page DMU Space Analysis Version 5 Release 13
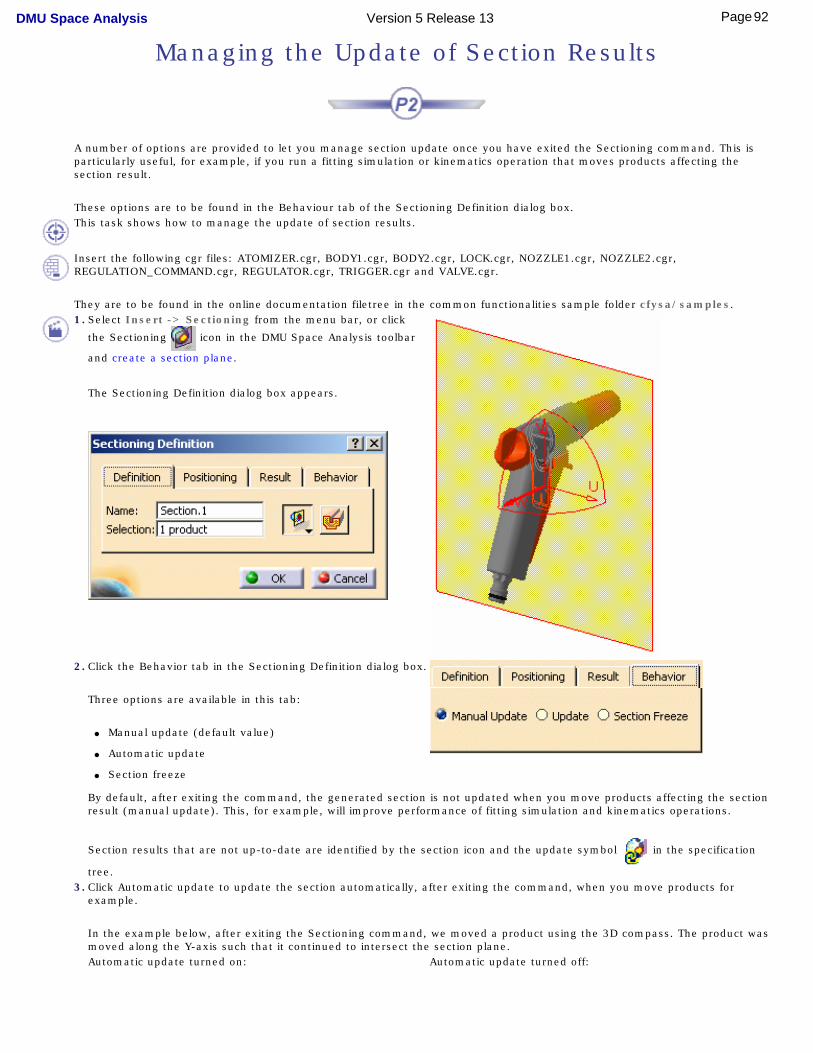
Managing the Update of Section Results
A number of options are provided to let you manage section update once you have exited the Sectioning command. This is particularly useful, for example, if you run a fitting simulation or kinematics operation that moves products affecting the section result.
These options are to be found in the Behaviour tab of the Sectioning Definition dialog box.This task shows how to manage the update of section results.
Insert the following cgr files: ATOMIZER.cgr, BODY1.cgr, BODY2.cgr, LOCK.cgr, NOZZLE1.cgr, NOZZLE2.cgr, REGULATION_COMMAND.cgr, REGULATOR.cgr, TRIGGER.cgr and VALVE.cgr.
They are to be found in the online documentation filetree in the common functionalities sample folder cfysa/samples.1. Select Insert -> Sectioning from the menu bar, or click
the Sectioning icon in the DMU Space Analysis toolbar
and create a section plane.
The Sectioning Definition dialog box appears.
2. Click the Behavior tab in the Sectioning Definition dialog box.
Three options are available in this tab:
● Manual update (default value)
● Automatic update
● Section freeze
By default, after exiting the command, the generated section is not updated when you move products affecting the section result (manual update). This, for example, will improve performance of fitting simulation and kinematics operations.
Section results that are not up-to-date are identified by the section icon and the update symbol in the specification
tree. 3. Click Automatic update to update the section automatically, after exiting the command, when you move products for
example.
In the example below, after exiting the Sectioning command, we moved a product using the 3D compass. The product was moved along the Y-axis such that it continued to intersect the section plane.
Automatic update turned on: Automatic update turned off:
92Page DMU Space Analysis Version 5 Release 13
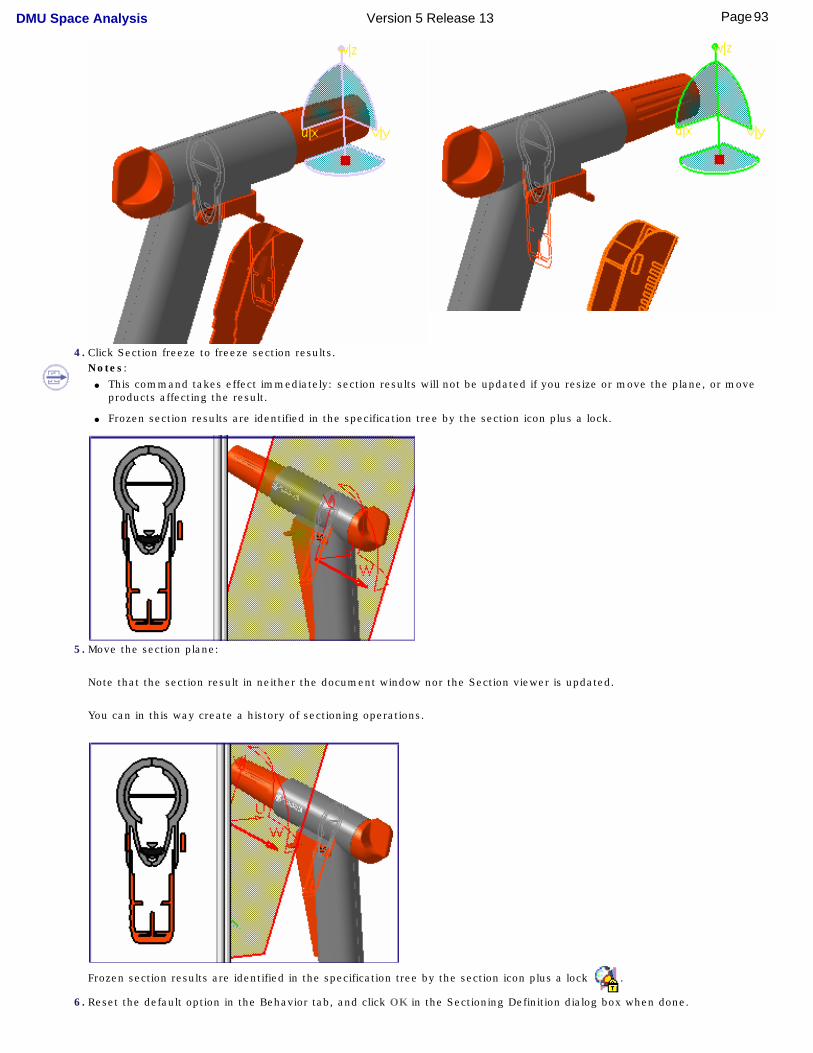
4. Click Section freeze to freeze section results. Notes:
● This command takes effect immediately: section results will not be updated if you resize or move the plane, or move products affecting the result.
● Frozen section results are identified in the specification tree by the section icon plus a lock.
5. Move the section plane:
Note that the section result in neither the document window nor the Section viewer is updated.
You can in this way create a history of sectioning operations.
Frozen section results are identified in the specification tree by the section icon plus a lock .
6. Reset the default option in the Behavior tab, and click OK in the Sectioning Definition dialog box when done.
93Page DMU Space Analysis Version 5 Release 13

Toggling on and off these commands can also to be done via the contextual menu.
94Page DMU Space Analysis Version 5 Release 13
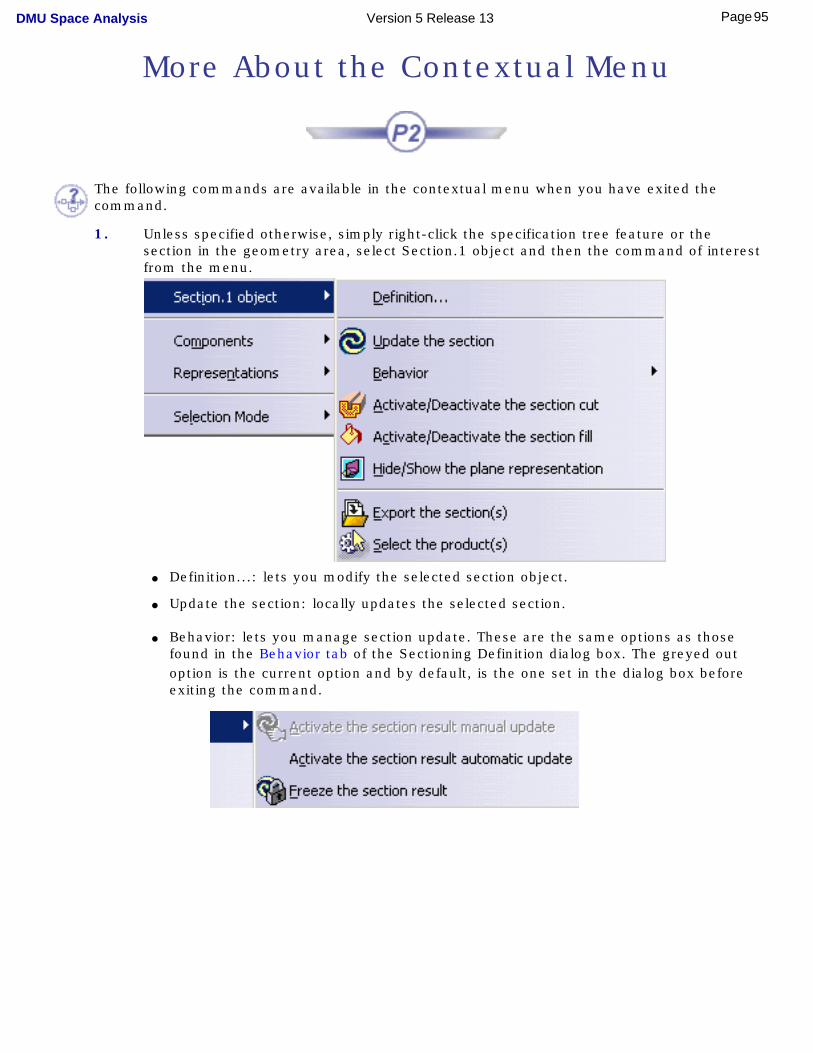
More About the Contextual Menu
The following commands are available in the contextual menu when you have exited the command.
1. Unless specified otherwise, simply right-click the specification tree feature or the section in the geometry area, select Section.1 object and then the command of interest from the menu.
● Definition...: lets you modify the selected section object.
● Update the section: locally updates the selected section.
● Behavior: lets you manage section update. These are the same options as those
found in the Behavior tab of the Sectioning Definition dialog box. The greyed out option is the current option and by default, is the one set in the dialog box before exiting the command.
95Page DMU Space Analysis Version 5 Release 13
- Activate the section result manual update: the generated section is not updated when you move products affecting the section result.
- Activate the section result automatic update: the generated section is automatically updated when you move products affecting the result.
- Freeze the section result: the generated section is not updated if you resize or move the plane, or move products affecting the result.
● Activate/Deactivate the section cut: turns the Volume Cut command on or off.
● Activate/Deactivate the section fill: turns the fill capability on or off.
● Hide/Show the plane representation: turns the section plane on or off.
● Export the section(s): lets you save section results in CATPart, IGES, model, STEP,
VRML formats.Note: If you want to save results as a CATDrawing, use the Export As command in the Sectioning Definition dialog box.
Note: Multiple selection tools are available for all these contextual menu commands. You can, for example, export a multiple selection of section results to a CATPart document.
● Select the product(s): highlights products in the specification tree associated with selected sections:
1. Select a section or Ctrl-click to select sections in the geometry area of the document window or in the Results window.
2. Right-click to access the contextual menu and choose Select the product(s).
Associated product(s) are highlighted in the specification tree.
96Page DMU Space Analysis Version 5 Release 13
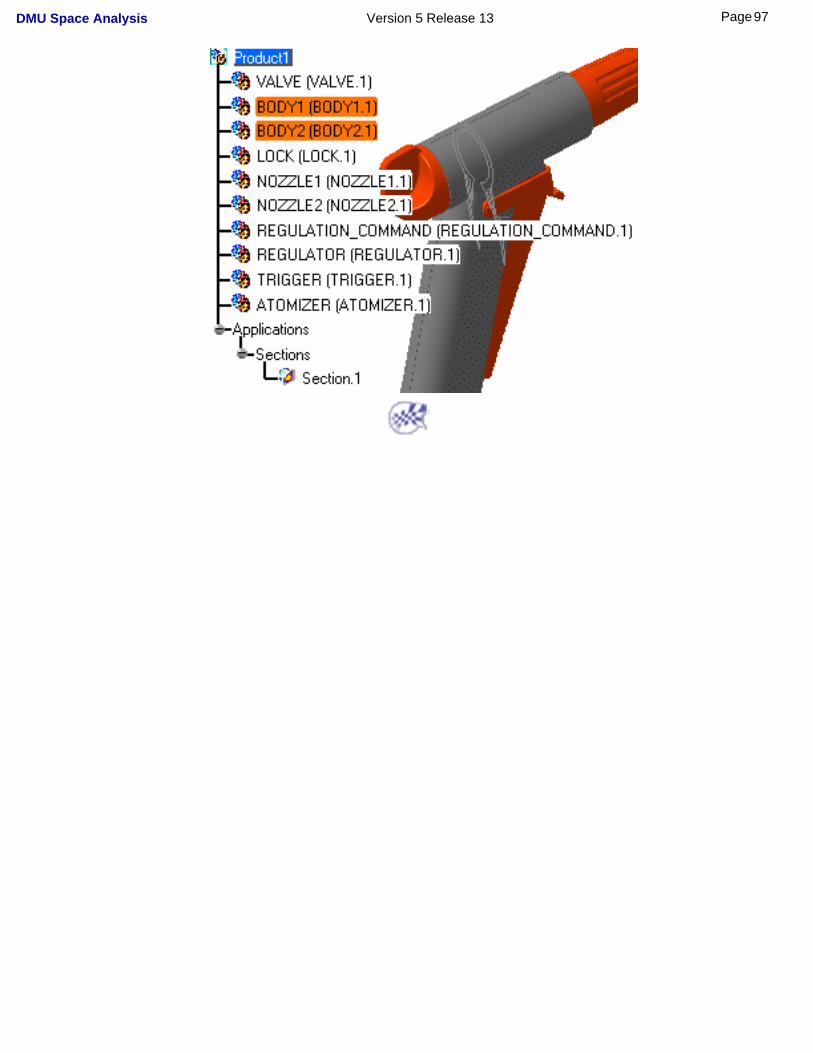
97Page DMU Space Analysis Version 5 Release 13
Interference Checking & Analysis
About interference checking & analysis: Gives general information.
Part-to-Part Clash CommandAnalyze part to part clashes: Select Analyze -> Part to Part Clash, define the type in the Clash Detection dialog box, then select parts and click Apply.
Clash Command
Detect interferences using the clash command: Click the Clash icon, define the type in the Check Clash dialog box, then select the product(s) and click Apply.
Read clash command results: Run a check for interferences and read the global results in the Check Clash dialog box and Preview window.
Compare clash command results: gives information on how to interpret Check Clash dialog box results when comparing results.
Make a finer analysis of results of clash command results: Run a check for interferences then click More in the Check Clash dialog box and apply visualization filters to make a finer analysis of results.
View clash command results in a dedicated window: Run a check for interferences then click the Results window icon.
Export clash command results in text or model format: Run a check for interferences, then click the Export As icon.
Publish clash command results: Switch to the DMU Navigator workbench and click the Start Publish icon.
Export clash results and geometry in XML format: Set the appropriate settings in the DMU Clash Process tab, run a check for interferences, then click the Export As icon.
Import clash results: Run a dedicated macro.
98Page DMU Space Analysis Version 5 Release 13
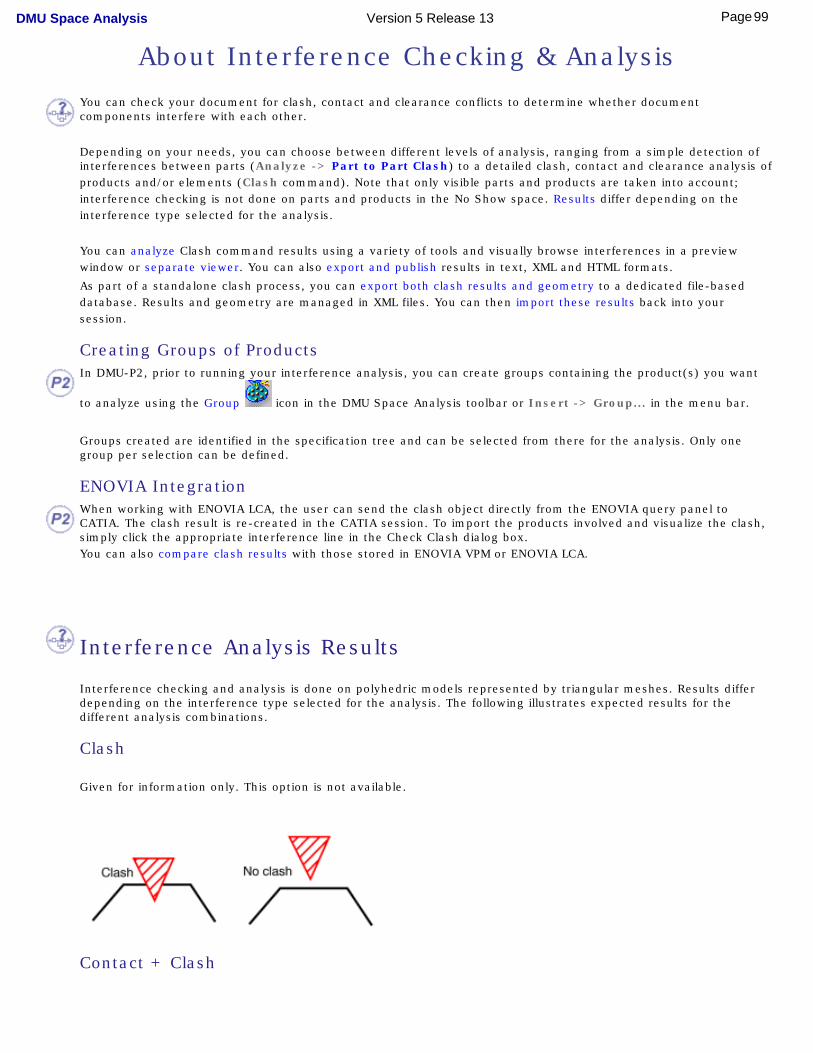
About Interference Checking & Analysis
You can check your document for clash, contact and clearance conflicts to determine whether document components interfere with each other.
Depending on your needs, you can choose between different levels of analysis, ranging from a simple detection of interferences between parts (Analyze -> Part to Part Clash) to a detailed clash, contact and clearance analysis of products and/or elements (Clash command). Note that only visible parts and products are taken into account; interference checking is not done on parts and products in the No Show space. Results differ depending on the interference type selected for the analysis.
You can analyze Clash command results using a variety of tools and visually browse interferences in a preview window or separate viewer. You can also export and publish results in text, XML and HTML formats.
As part of a standalone clash process, you can export both clash results and geometry to a dedicated file-based database. Results and geometry are managed in XML files. You can then import these results back into your session.
Creating Groups of Products
In DMU-P2, prior to running your interference analysis, you can create groups containing the product(s) you want
to analyze using the Group icon in the DMU Space Analysis toolbar or Insert -> Group... in the menu bar.
Groups created are identified in the specification tree and can be selected from there for the analysis. Only one group per selection can be defined.
ENOVIA IntegrationWhen working with ENOVIA LCA, the user can send the clash object directly from the ENOVIA query panel to CATIA. The clash result is re-created in the CATIA session. To import the products involved and visualize the clash, simply click the appropriate interference line in the Check Clash dialog box.You can also compare clash results with those stored in ENOVIA VPM or ENOVIA LCA.
Interference Analysis Results
Interference checking and analysis is done on polyhedric models represented by triangular meshes. Results differ depending on the interference type selected for the analysis. The following illustrates expected results for the different analysis combinations.
Clash
Given for information only. This option is not available.
Contact + Clash
99Page DMU Space Analysis Version 5 Release 13
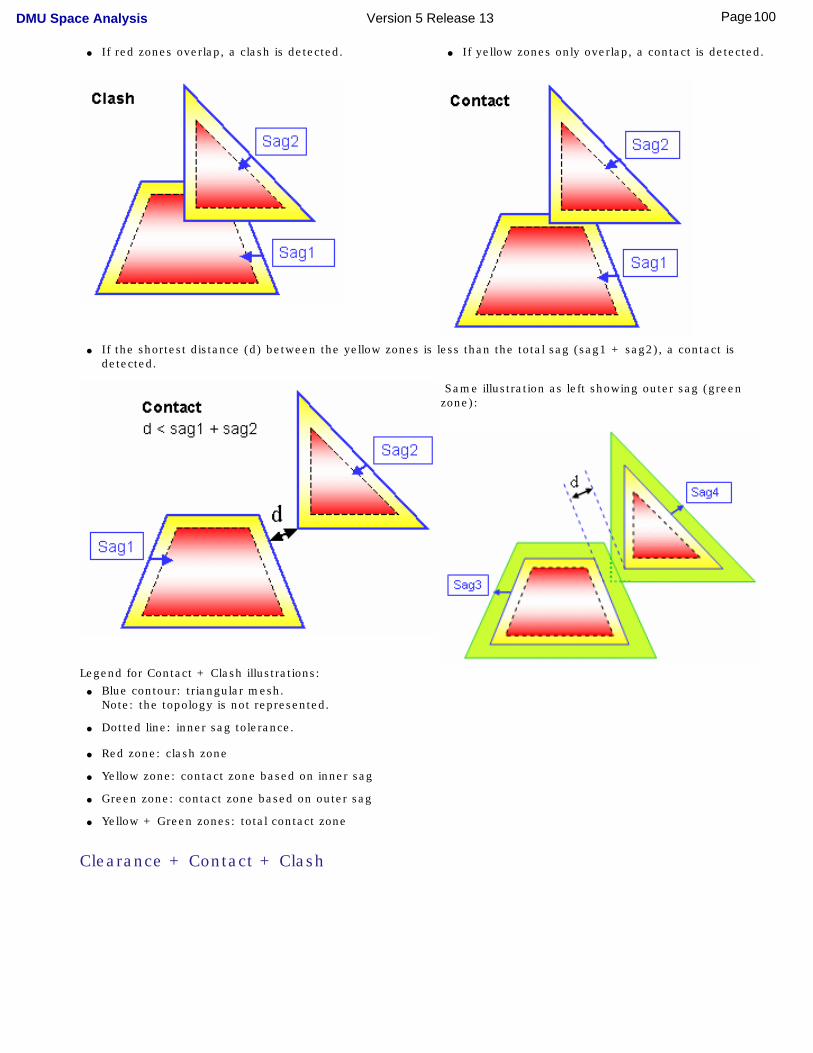
● If red zones overlap, a clash is detected. ● If yellow zones only overlap, a contact is detected.
● If the shortest distance (d) between the yellow zones is less than the total sag (sag1 + sag2), a contact is
detected.
Same illustration as left showing outer sag (green zone):
Legend for Contact + Clash illustrations:● Blue contour: triangular mesh.
Note: the topology is not represented.
● Dotted line: inner sag tolerance.
● Red zone: clash zone
● Yellow zone: contact zone based on inner sag
● Green zone: contact zone based on outer sag
● Yellow + Green zones: total contact zone
Clearance + Contact + Clash
100Page DMU Space Analysis Version 5 Release 13
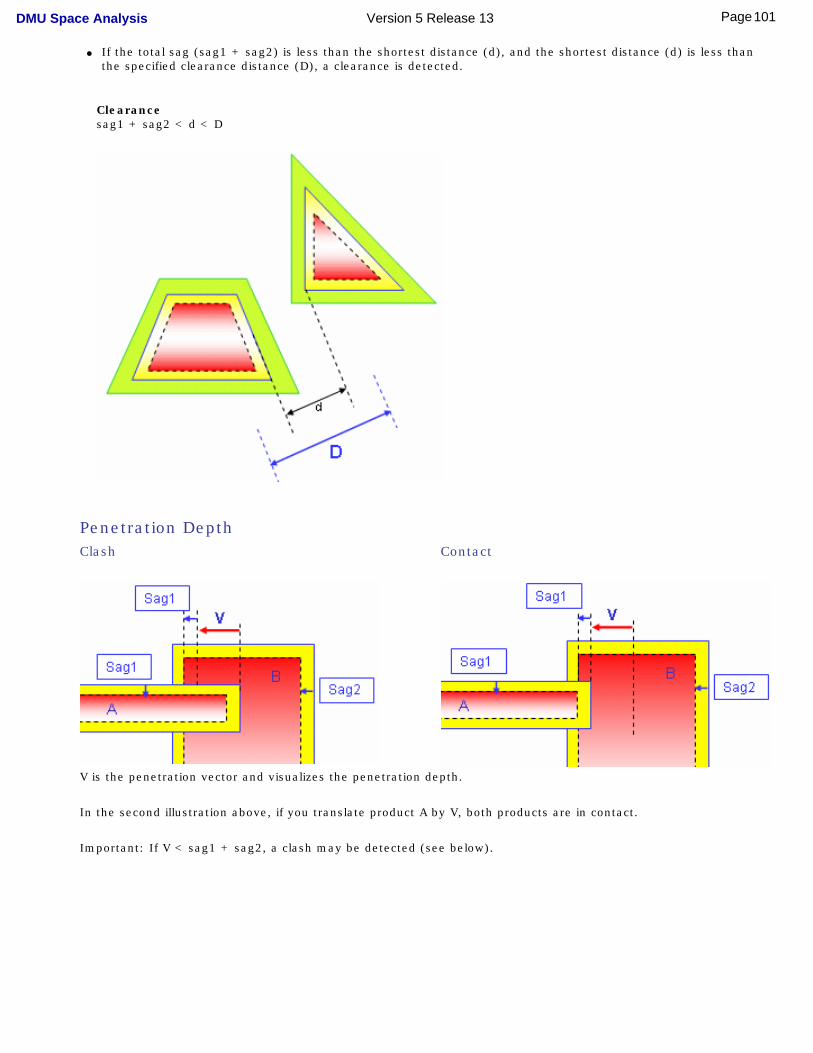
● If the total sag (sag1 + sag2) is less than the shortest distance (d), and the shortest distance (d) is less than the specified clearance distance (D), a clearance is detected.
Clearancesag1 + sag2 < d < D
Penetration Depth
Clash Contact
V is the penetration vector and visualizes the penetration depth.
In the second illustration above, if you translate product A by V, both products are in contact.
Important: If V < sag1 + sag2, a clash may be detected (see below).
101Page DMU Space Analysis Version 5 Release 13
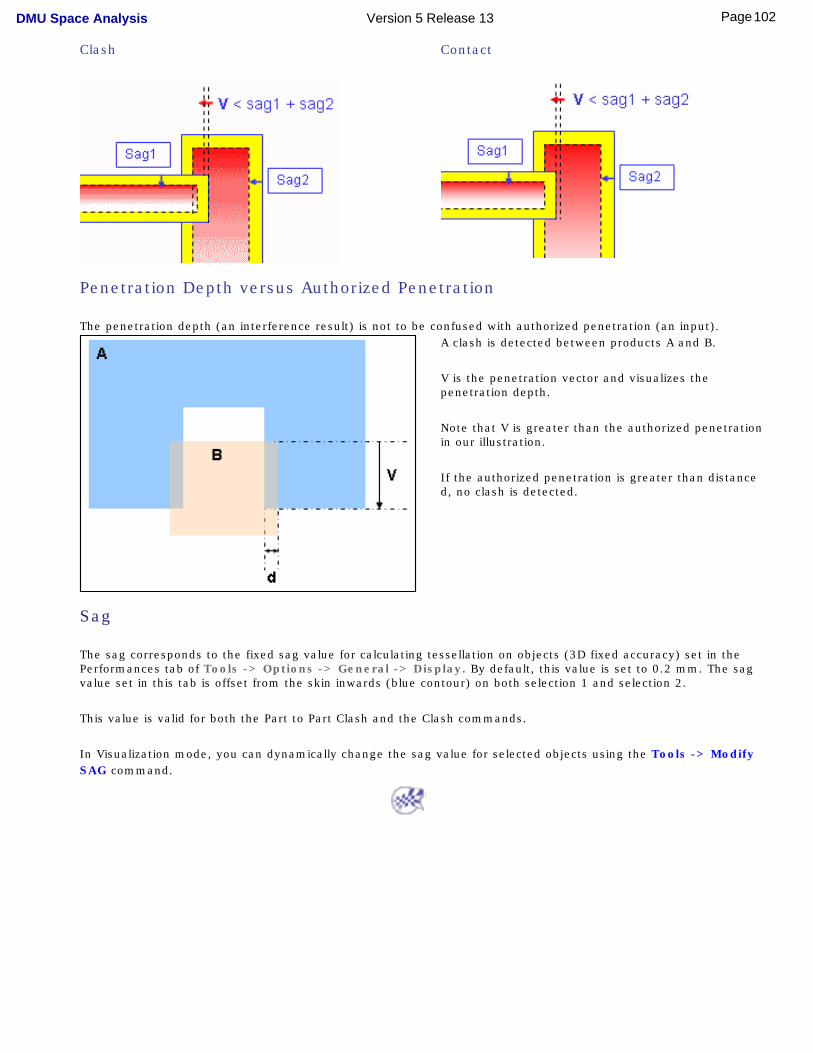
Clash Contact
Penetration Depth versus Authorized Penetration
The penetration depth (an interference result) is not to be confused with authorized penetration (an input). A clash is detected between products A and B.
V is the penetration vector and visualizes the penetration depth.
Note that V is greater than the authorized penetration in our illustration.
If the authorized penetration is greater than distance d, no clash is detected.
Sag
The sag corresponds to the fixed sag value for calculating tessellation on objects (3D fixed accuracy) set in the Performances tab of Tools -> Options -> General -> Display. By default, this value is set to 0.2 mm. The sag value set in this tab is offset from the skin inwards (blue contour) on both selection 1 and selection 2.
This value is valid for both the Part to Part Clash and the Clash commands.
In Visualization mode, you can dynamically change the sag value for selected objects using the Tools -> Modify SAG command.
102Page DMU Space Analysis Version 5 Release 13
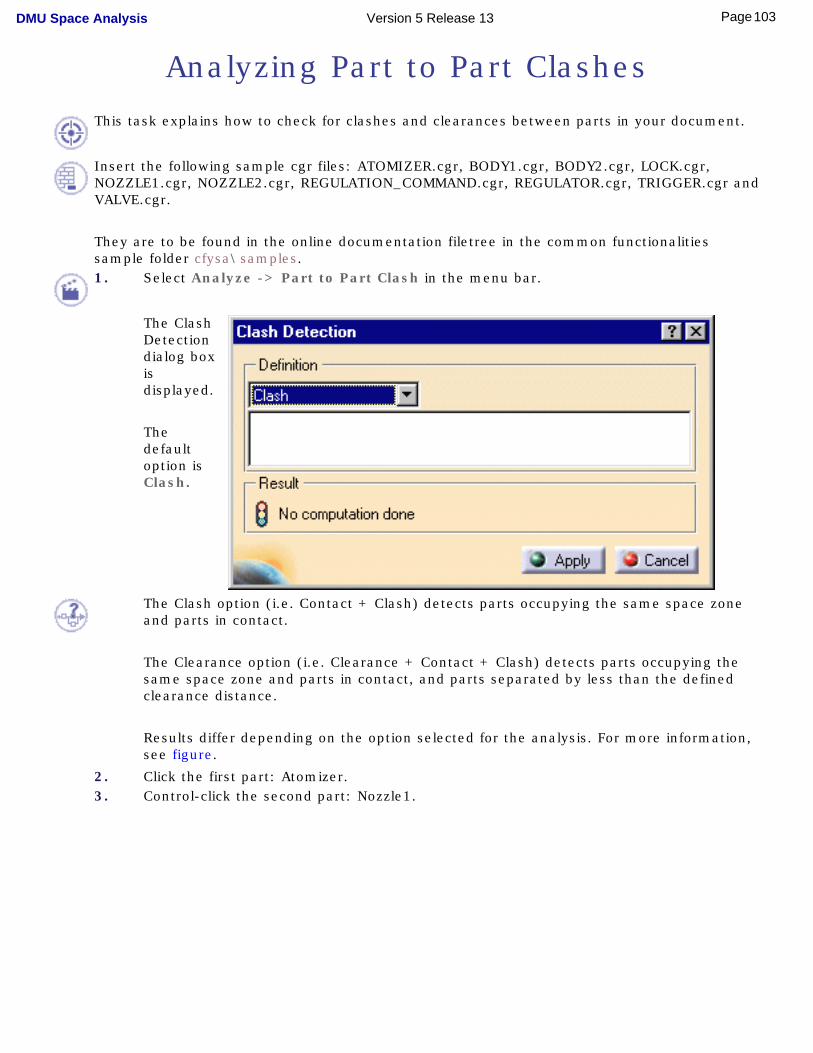
Analyzing Part to Part Clashes
This task explains how to check for clashes and clearances between parts in your document.
Insert the following sample cgr files: ATOMIZER.cgr, BODY1.cgr, BODY2.cgr, LOCK.cgr, NOZZLE1.cgr, NOZZLE2.cgr, REGULATION_COMMAND.cgr, REGULATOR.cgr, TRIGGER.cgr and VALVE.cgr.
They are to be found in the online documentation filetree in the common functionalities sample folder cfysa\samples.1. Select Analyze -> Part to Part Clash in the menu bar.
The Clash Detection dialog box is displayed.
The default option is Clash.
The Clash option (i.e. Contact + Clash) detects parts occupying the same space zone and parts in contact.
The Clearance option (i.e. Clearance + Contact + Clash) detects parts occupying the same space zone and parts in contact, and parts separated by less than the defined clearance distance.
Results differ depending on the option selected for the analysis. For more information, see figure.
2. Click the first part: Atomizer.3. Control-click the second part: Nozzle1.
103Page DMU Space Analysis Version 5 Release 13
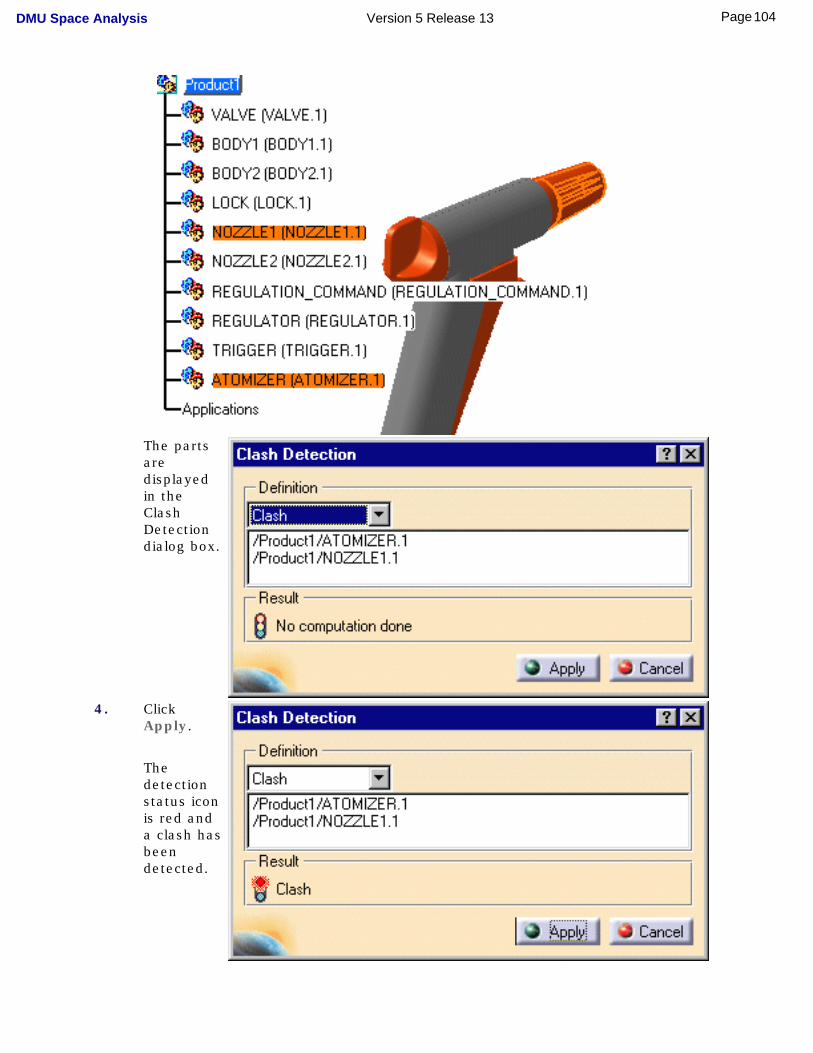
The parts are displayed in the Clash Detection dialog box.
4. Click Apply.
The detection status icon is red and a clash has been detected.
104Page DMU Space Analysis Version 5 Release 13
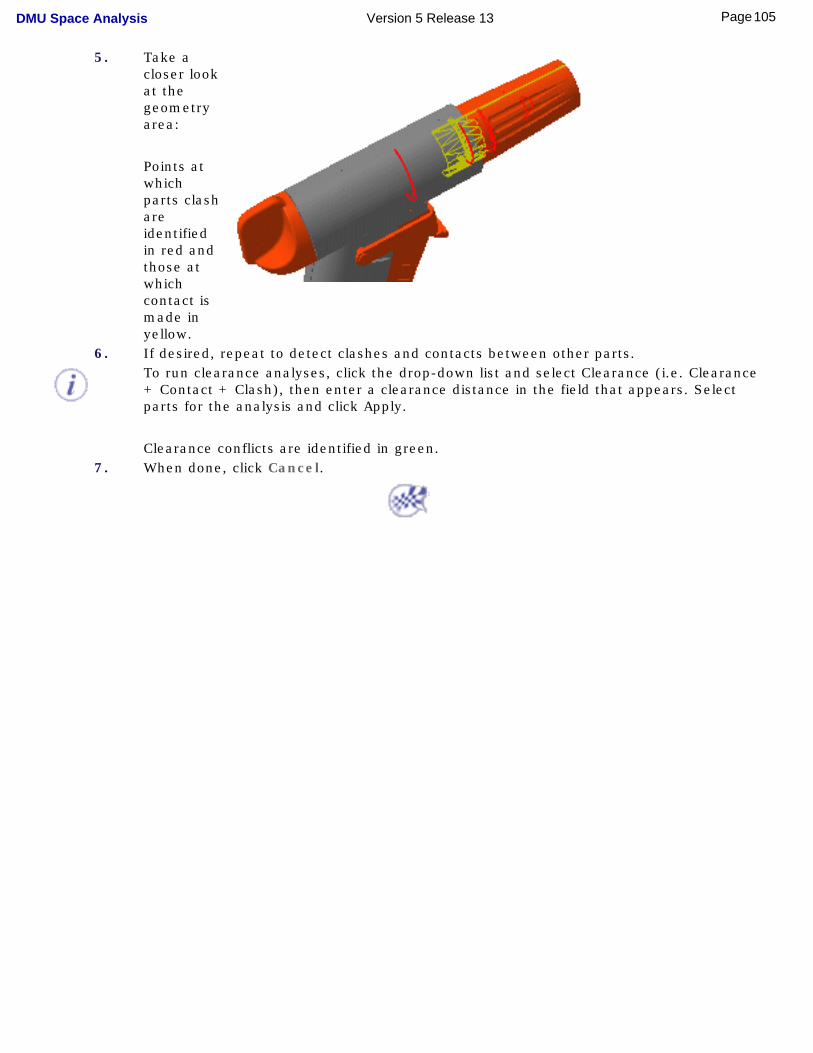
5. Take a closer look at the geometry area:
Points at which parts clash are identified in red and those at which contact is made in yellow.
6. If desired, repeat to detect clashes and contacts between other parts.
To run clearance analyses, click the drop-down list and select Clearance (i.e. Clearance + Contact + Clash), then enter a clearance distance in the field that appears. Select parts for the analysis and click Apply.
Clearance conflicts are identified in green.7. When done, click Cancel.
105Page DMU Space Analysis Version 5 Release 13
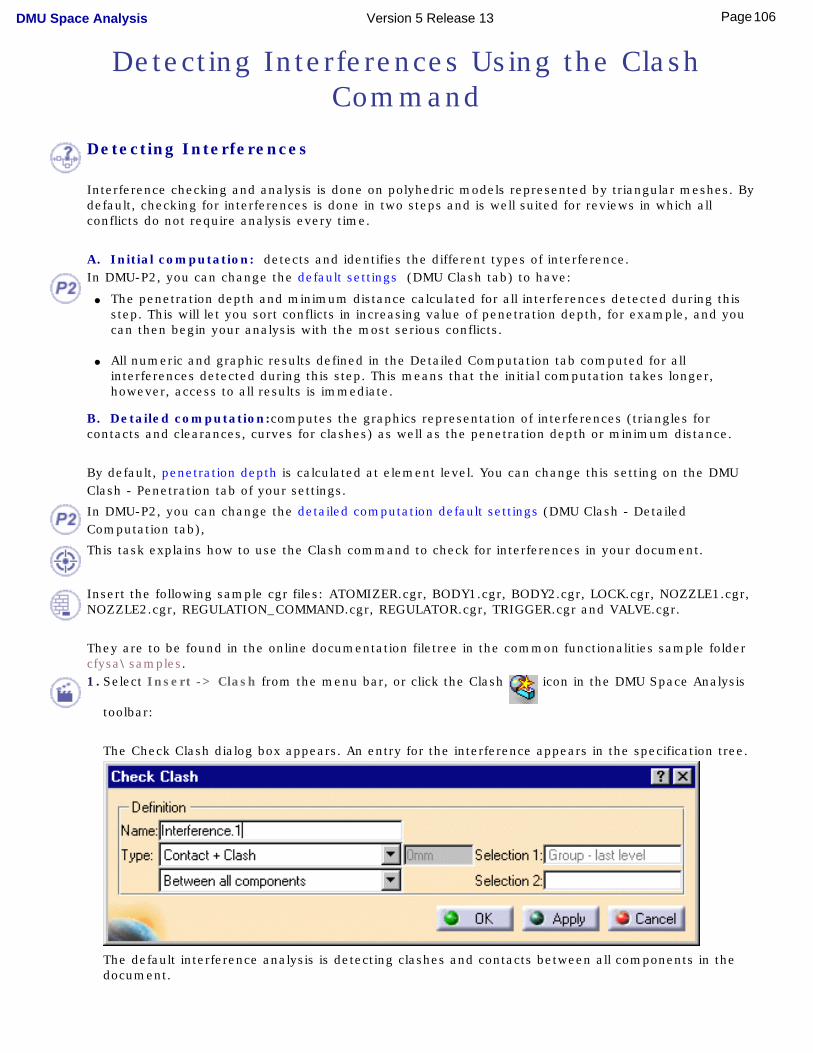
Detecting Interferences Using the Clash Command
Detecting Interferences
Interference checking and analysis is done on polyhedric models represented by triangular meshes. By default, checking for interferences is done in two steps and is well suited for reviews in which all conflicts do not require analysis every time.
A. Initial computation: detects and identifies the different types of interference.In DMU-P2, you can change the default settings (DMU Clash tab) to have:
● The penetration depth and minimum distance calculated for all interferences detected during this step. This will let you sort conflicts in increasing value of penetration depth, for example, and you can then begin your analysis with the most serious conflicts.
● All numeric and graphic results defined in the Detailed Computation tab computed for all interferences detected during this step. This means that the initial computation takes longer, however, access to all results is immediate.
B. Detailed computation:computes the graphics representation of interferences (triangles for contacts and clearances, curves for clashes) as well as the penetration depth or minimum distance.
By default, penetration depth is calculated at element level. You can change this setting on the DMU Clash - Penetration tab of your settings.
In DMU-P2, you can change the detailed computation default settings (DMU Clash - Detailed Computation tab),
This task explains how to use the Clash command to check for interferences in your document.
Insert the following sample cgr files: ATOMIZER.cgr, BODY1.cgr, BODY2.cgr, LOCK.cgr, NOZZLE1.cgr, NOZZLE2.cgr, REGULATION_COMMAND.cgr, REGULATOR.cgr, TRIGGER.cgr and VALVE.cgr.
They are to be found in the online documentation filetree in the common functionalities sample folder cfysa\samples.
1. Select Insert -> Clash from the menu bar, or click the Clash icon in the DMU Space Analysis
toolbar:
The Check Clash dialog box appears. An entry for the interference appears in the specification tree.
The default interference analysis is detecting clashes and contacts between all components in the document.
106Page DMU Space Analysis Version 5 Release 13
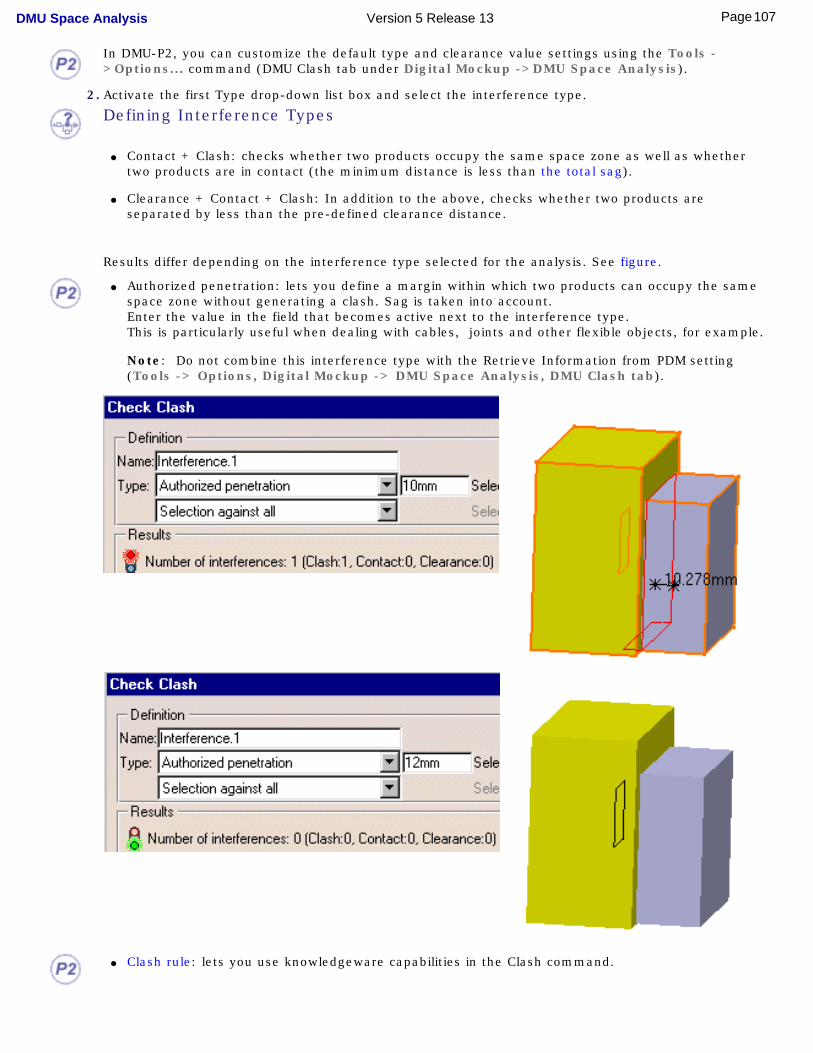
In DMU-P2, you can customize the default type and clearance value settings using the Tools ->Options... command (DMU Clash tab under Digital Mockup ->DMU Space Analysis).
2. Activate the first Type drop-down list box and select the interference type.
Defining Interference Types
● Contact + Clash: checks whether two products occupy the same space zone as well as whether two products are in contact (the minimum distance is less than the total sag).
● Clearance + Contact + Clash: In addition to the above, checks whether two products are separated by less than the pre-defined clearance distance.
Results differ depending on the interference type selected for the analysis. See figure.
● Authorized penetration: lets you define a margin within which two products can occupy the same space zone without generating a clash. Sag is taken into account.Enter the value in the field that becomes active next to the interference type.This is particularly useful when dealing with cables, joints and other flexible objects, for example.
Note: Do not combine this interference type with the Retrieve Information from PDM setting (Tools -> Options, Digital Mockup -> DMU Space Analysis, DMU Clash tab).
● Clash rule: lets you use knowledgeware capabilities in the Clash command.
107Page DMU Space Analysis Version 5 Release 13
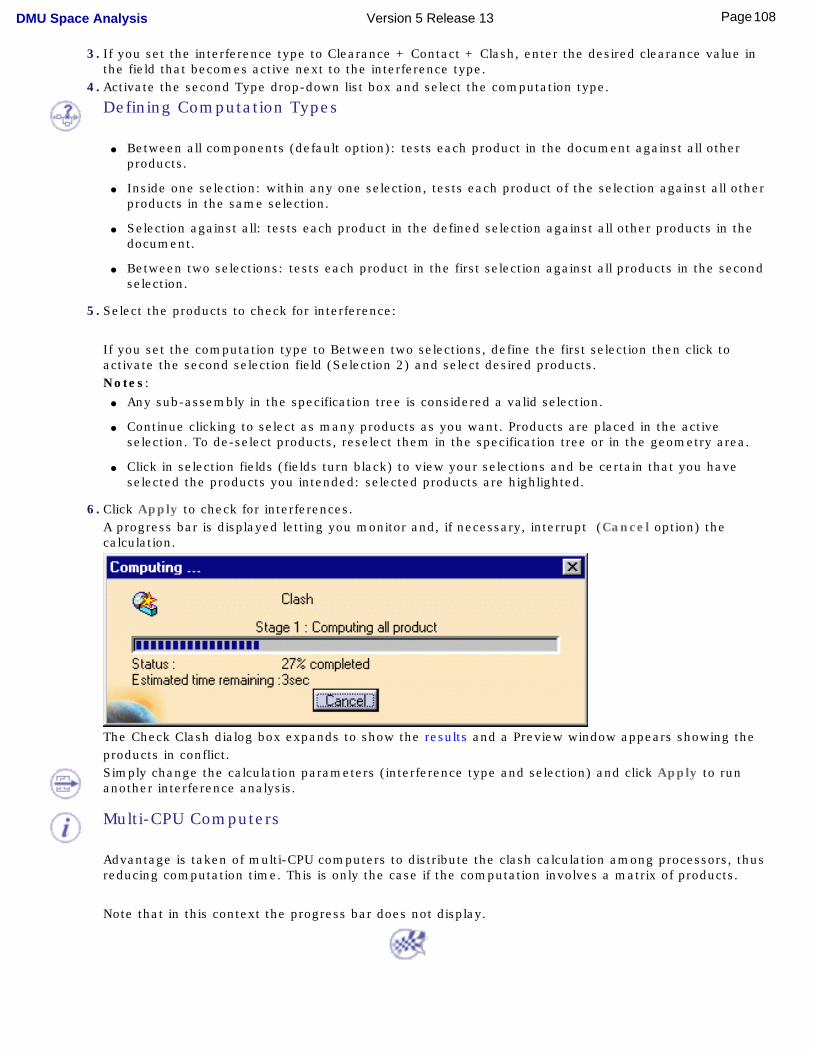
3. If you set the interference type to Clearance + Contact + Clash, enter the desired clearance value in the field that becomes active next to the interference type.
4. Activate the second Type drop-down list box and select the computation type.
Defining Computation Types
● Between all components (default option): tests each product in the document against all other products.
● Inside one selection: within any one selection, tests each product of the selection against all other products in the same selection.
● Selection against all: tests each product in the defined selection against all other products in the document.
● Between two selections: tests each product in the first selection against all products in the second selection.
5. Select the products to check for interference:
If you set the computation type to Between two selections, define the first selection then click to activate the second selection field (Selection 2) and select desired products.Notes:
● Any sub-assembly in the specification tree is considered a valid selection.
● Continue clicking to select as many products as you want. Products are placed in the active selection. To de-select products, reselect them in the specification tree or in the geometry area.
● Click in selection fields (fields turn black) to view your selections and be certain that you have selected the products you intended: selected products are highlighted.
6. Click Apply to check for interferences.A progress bar is displayed letting you monitor and, if necessary, interrupt (Cancel option) the calculation.
The Check Clash dialog box expands to show the results and a Preview window appears showing the products in conflict.
Simply change the calculation parameters (interference type and selection) and click Apply to run another interference analysis.
Multi-CPU Computers
Advantage is taken of multi-CPU computers to distribute the clash calculation among processors, thus reducing computation time. This is only the case if the computation involves a matrix of products.
Note that in this context the progress bar does not display.
108Page DMU Space Analysis Version 5 Release 13
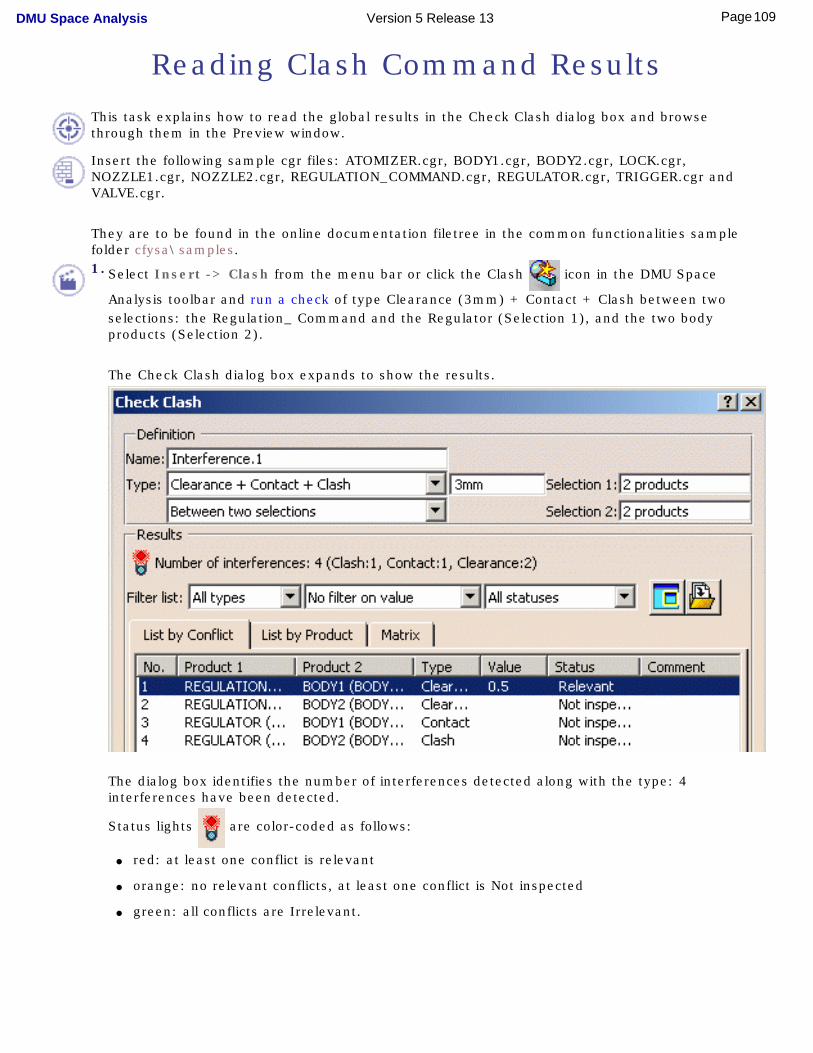
Reading Clash Command Results
This task explains how to read the global results in the Check Clash dialog box and browse through them in the Preview window.
Insert the following sample cgr files: ATOMIZER.cgr, BODY1.cgr, BODY2.cgr, LOCK.cgr, NOZZLE1.cgr, NOZZLE2.cgr, REGULATION_COMMAND.cgr, REGULATOR.cgr, TRIGGER.cgr and VALVE.cgr.
They are to be found in the online documentation filetree in the common functionalities sample folder cfysa\samples.1. Select Insert -> Clash from the menu bar or click the Clash icon in the DMU Space
Analysis toolbar and run a check of type Clearance (3mm) + Contact + Clash between two selections: the Regulation_ Command and the Regulator (Selection 1), and the two body products (Selection 2).
The Check Clash dialog box expands to show the results.
The dialog box identifies the number of interferences detected along with the type: 4 interferences have been detected.
Status lights are color-coded as follows:
● red: at least one conflict is relevant
● orange: no relevant conflicts, at least one conflict is Not inspected
● green: all conflicts are Irrelevant.
109Page DMU Space Analysis Version 5 Release 13
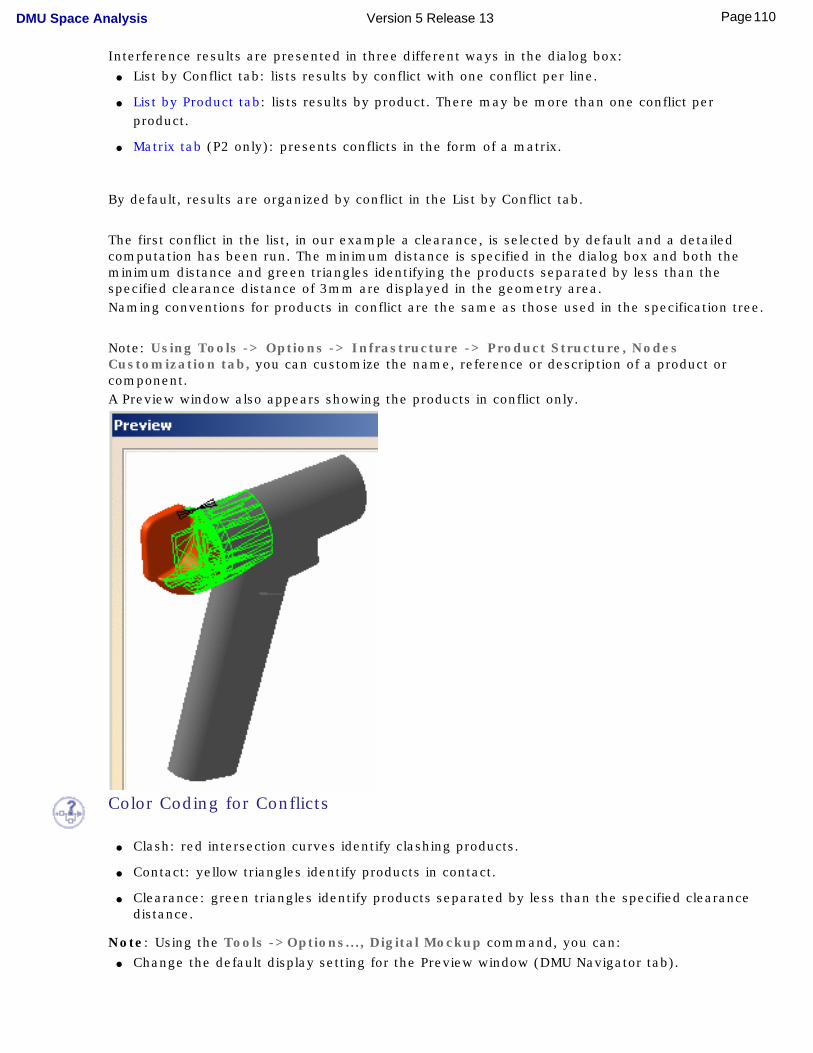
Interference results are presented in three different ways in the dialog box:● List by Conflict tab: lists results by conflict with one conflict per line.
● List by Product tab: lists results by product. There may be more than one conflict per product.
● Matrix tab (P2 only): presents conflicts in the form of a matrix.
By default, results are organized by conflict in the List by Conflict tab.
The first conflict in the list, in our example a clearance, is selected by default and a detailed computation has been run. The minimum distance is specified in the dialog box and both the minimum distance and green triangles identifying the products separated by less than the specified clearance distance of 3mm are displayed in the geometry area.Naming conventions for products in conflict are the same as those used in the specification tree.
Note: Using Tools -> Options -> Infrastructure -> Product Structure, Nodes Customization tab, you can customize the name, reference or description of a product or component.A Preview window also appears showing the products in conflict only.
Color Coding for Conflicts
● Clash: red intersection curves identify clashing products.
● Contact: yellow triangles identify products in contact.
● Clearance: green triangles identify products separated by less than the specified clearance distance.
Note: Using the Tools ->Options..., Digital Mockup command, you can: ● Change the default display setting for the Preview window (DMU Navigator tab).
110Page DMU Space Analysis Version 5 Release 13
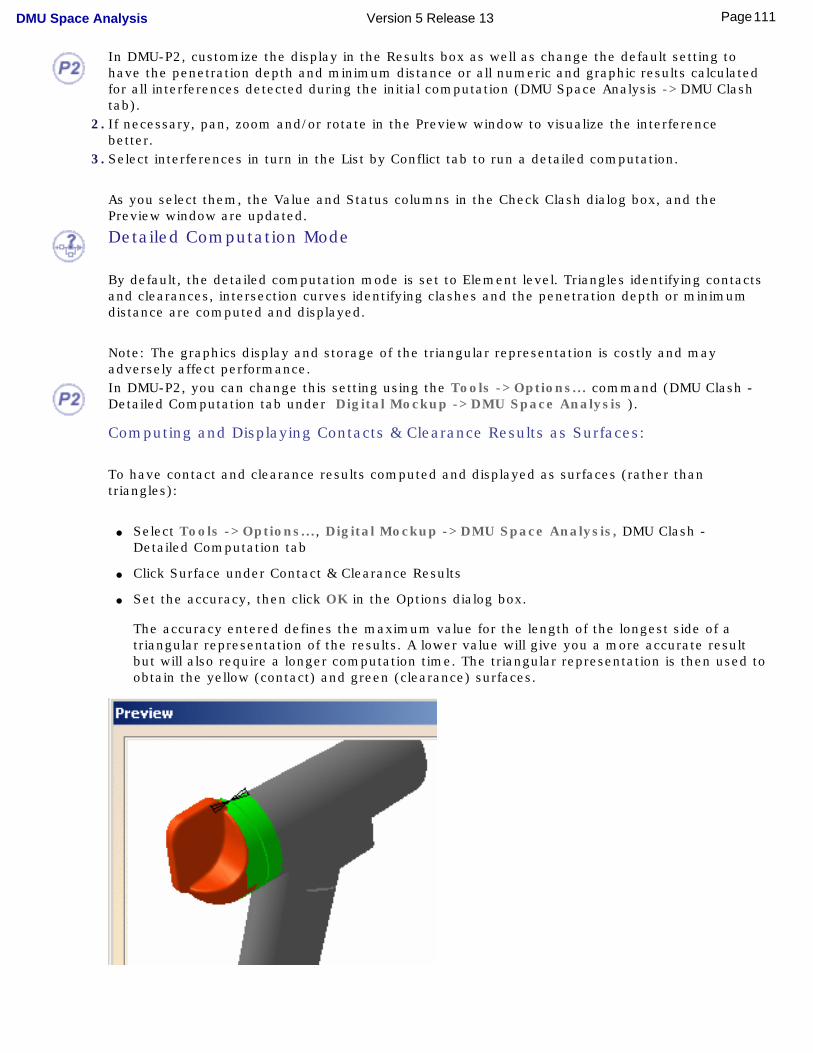
In DMU-P2, customize the display in the Results box as well as change the default setting to have the penetration depth and minimum distance or all numeric and graphic results calculated for all interferences detected during the initial computation (DMU Space Analysis ->DMU Clash tab).
2. If necessary, pan, zoom and/or rotate in the Preview window to visualize the interference better.
3. Select interferences in turn in the List by Conflict tab to run a detailed computation.
As you select them, the Value and Status columns in the Check Clash dialog box, and the Preview window are updated.
Detailed Computation Mode
By default, the detailed computation mode is set to Element level. Triangles identifying contacts and clearances, intersection curves identifying clashes and the penetration depth or minimum distance are computed and displayed.
Note: The graphics display and storage of the triangular representation is costly and may adversely affect performance.In DMU-P2, you can change this setting using the Tools ->Options... command (DMU Clash - Detailed Computation tab under Digital Mockup ->DMU Space Analysis ).
Computing and Displaying Contacts & Clearance Results as Surfaces:
To have contact and clearance results computed and displayed as surfaces (rather than triangles):
● Select Tools ->Options..., Digital Mockup ->DMU Space Analysis, DMU Clash - Detailed Computation tab
● Click Surface under Contact & Clearance Results
● Set the accuracy, then click OK in the Options dialog box.
The accuracy entered defines the maximum value for the length of the longest side of a triangular representation of the results. A lower value will give you a more accurate result but will also require a longer computation time. The triangular representation is then used to obtain the yellow (contact) and green (clearance) surfaces.
111Page DMU Space Analysis Version 5 Release 13
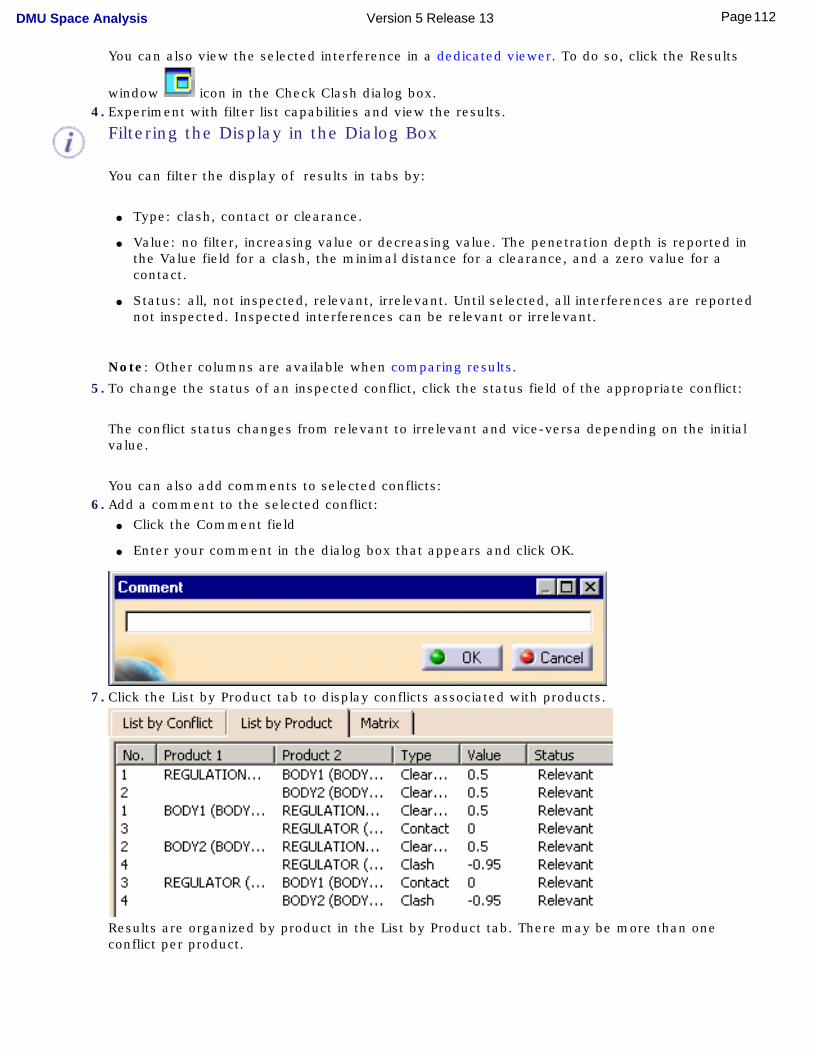
You can also view the selected interference in a dedicated viewer. To do so, click the Results
window icon in the Check Clash dialog box.4. Experiment with filter list capabilities and view the results.
Filtering the Display in the Dialog Box
You can filter the display of results in tabs by:
● Type: clash, contact or clearance.
● Value: no filter, increasing value or decreasing value. The penetration depth is reported in the Value field for a clash, the minimal distance for a clearance, and a zero value for a contact.
● Status: all, not inspected, relevant, irrelevant. Until selected, all interferences are reported not inspected. Inspected interferences can be relevant or irrelevant.
Note: Other columns are available when comparing results.
5. To change the status of an inspected conflict, click the status field of the appropriate conflict:
The conflict status changes from relevant to irrelevant and vice-versa depending on the initial value.
You can also add comments to selected conflicts:6. Add a comment to the selected conflict:
● Click the Comment field
● Enter your comment in the dialog box that appears and click OK.
7. Click the List by Product tab to display conflicts associated with products.
Results are organized by product in the List by Product tab. There may be more than one conflict per product.
112Page DMU Space Analysis Version 5 Release 13
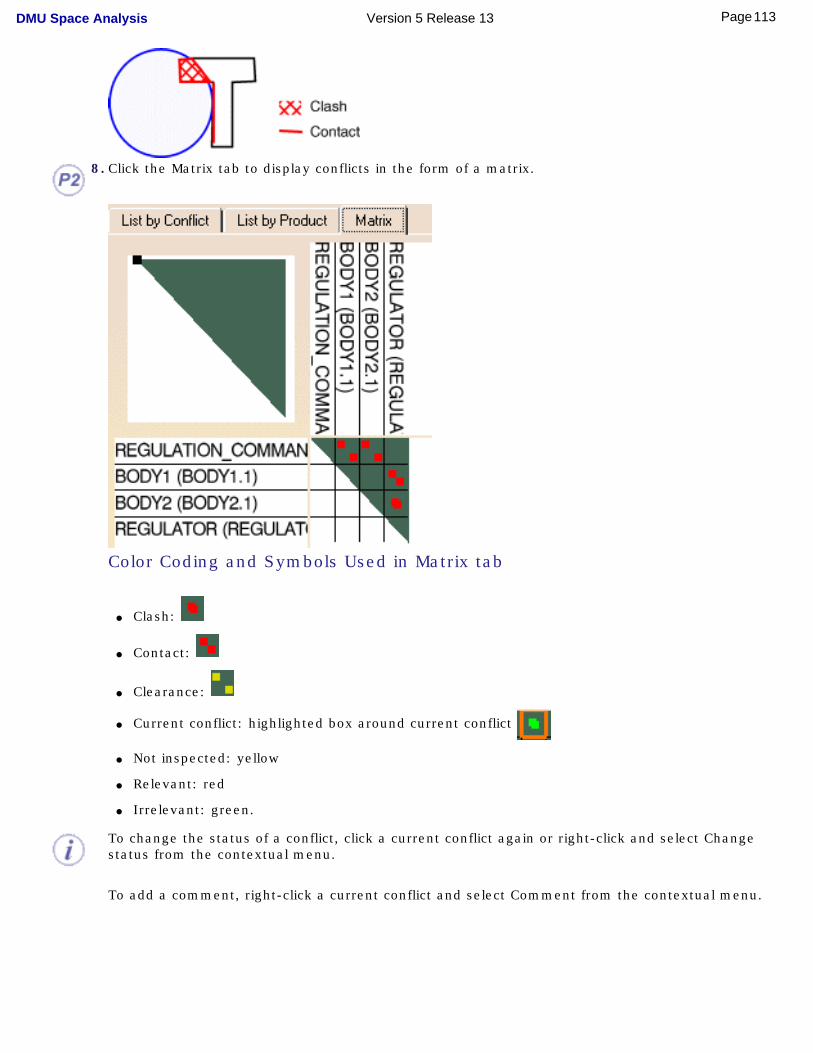
8. Click the Matrix tab to display conflicts in the form of a matrix.
Color Coding and Symbols Used in Matrix tab
● Clash:
● Contact:
● Clearance:
● Current conflict: highlighted box around current conflict
● Not inspected: yellow
● Relevant: red
● Irrelevant: green.
To change the status of a conflict, click a current conflict again or right-click and select Change status from the contextual menu.
To add a comment, right-click a current conflict and select Comment from the contextual menu.
113Page DMU Space Analysis Version 5 Release 13
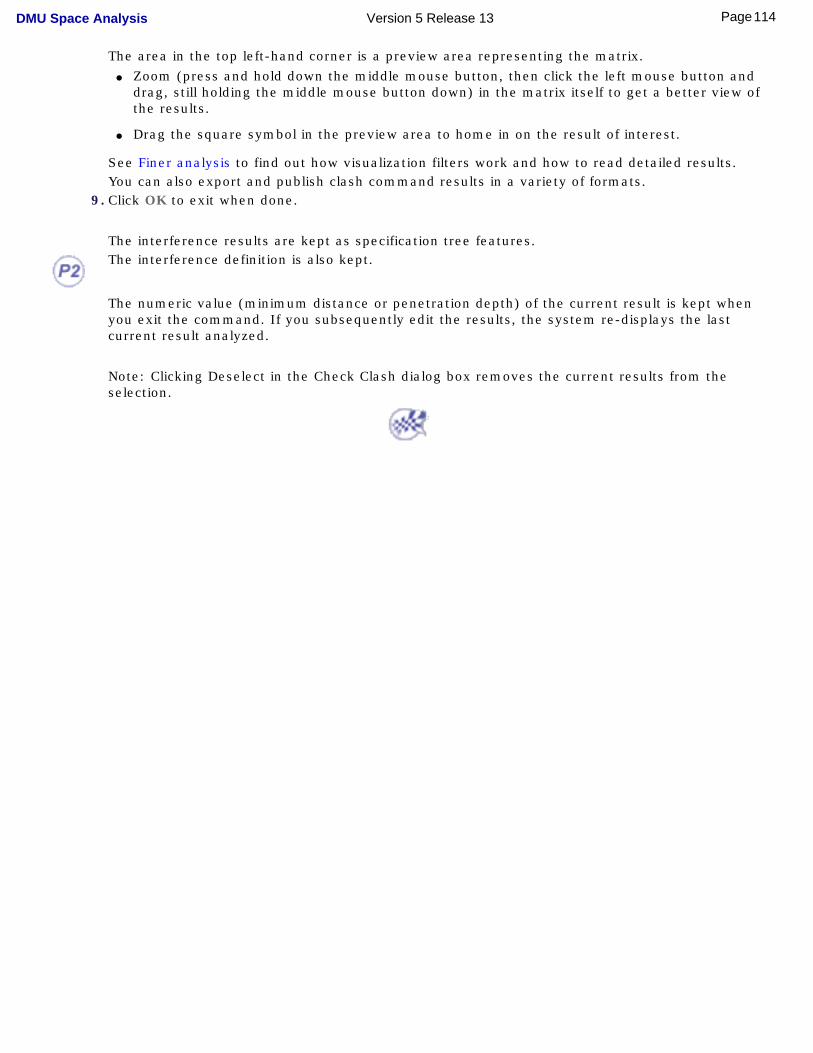
The area in the top left-hand corner is a preview area representing the matrix.● Zoom (press and hold down the middle mouse button, then click the left mouse button and
drag, still holding the middle mouse button down) in the matrix itself to get a better view of the results.
● Drag the square symbol in the preview area to home in on the result of interest.
See Finer analysis to find out how visualization filters work and how to read detailed results. You can also export and publish clash command results in a variety of formats.
9. Click OK to exit when done.
The interference results are kept as specification tree features.The interference definition is also kept.
The numeric value (minimum distance or penetration depth) of the current result is kept when you exit the command. If you subsequently edit the results, the system re-displays the last current result analyzed.
Note: Clicking Deselect in the Check Clash dialog box removes the current results from the selection.
114Page DMU Space Analysis Version 5 Release 13
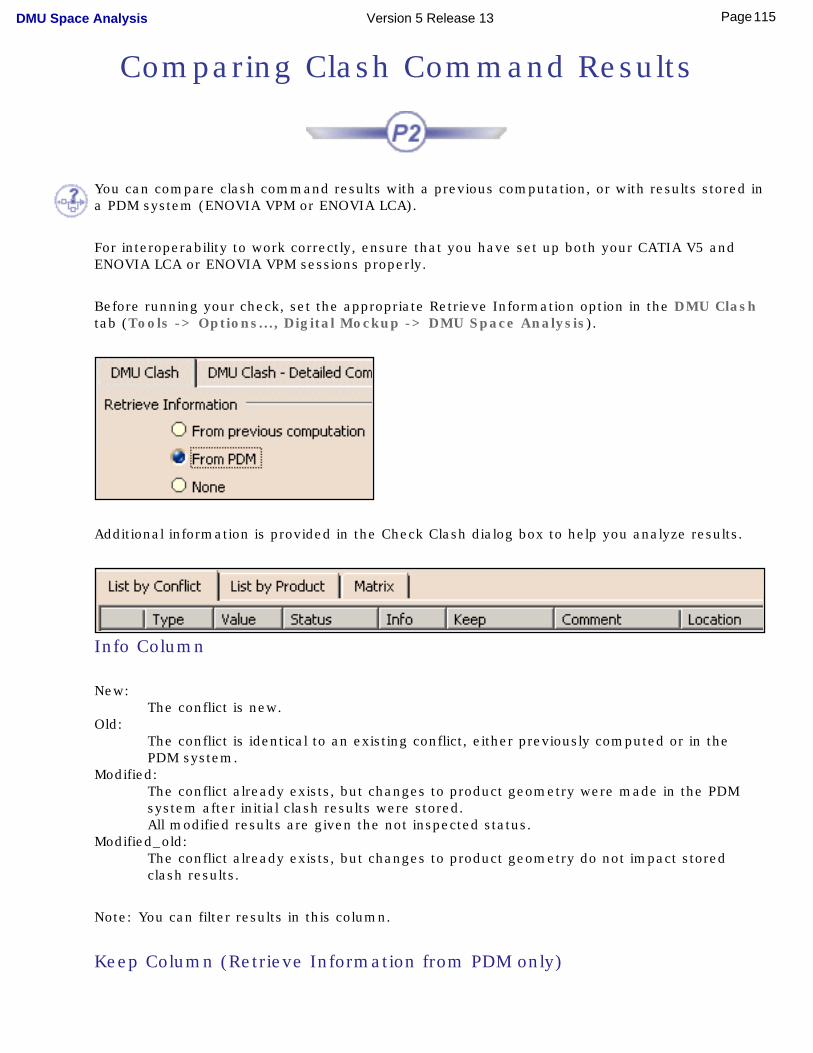
Comparing Clash Command Results
You can compare clash command results with a previous computation, or with results stored in a PDM system (ENOVIA VPM or ENOVIA LCA).
For interoperability to work correctly, ensure that you have set up both your CATIA V5 and ENOVIA LCA or ENOVIA VPM sessions properly.
Before running your check, set the appropriate Retrieve Information option in the DMU Clash tab (Tools -> Options..., Digital Mockup -> DMU Space Analysis).
Additional information is provided in the Check Clash dialog box to help you analyze results.
Info Column
New:The conflict is new.
Old:The conflict is identical to an existing conflict, either previously computed or in the PDM system.
Modified:The conflict already exists, but changes to product geometry were made in the PDM system after initial clash results were stored. All modified results are given the not inspected status.
Modified_old:The conflict already exists, but changes to product geometry do not impact stored clash results.
Note: You can filter results in this column.
Keep Column (Retrieve Information from PDM only)
115Page DMU Space Analysis Version 5 Release 13
This column lets you define which results you want to store in the PDM database.
No value:No decision to keep or otherwise results has been made.
Keep:Clash results will be stored in the PDM database when you exit the command (OK in the Check Clash dialog box).
No Keep:Clash results will not be stored in the PDM database.
Cannot Keep:Clash results cannot be stored in the PDM database. The geometry or position of at least one of the two conflicting products has changed. You must first save products in the PDM system before saving clash results.
Note: Simply click the Keep field of the appropriate conflict to toggle to No keep. Location Column (Retrieve Information from PDM only)
This column distinguishes between database and session conflicts.
Base:The conflict in the session and the one stored in the PDM system are identical. There has been no change in product geometry or position of either of the two conflicting products. Nor has there been any change in conflict attributes (status, comment, etc.).
Session:The conflict in the session is different from the one stored in the PDM system: the geometry or position of one of the two conflicting products, or one of the conflict attribues (status, comment, etc.) has changed.
Note: These two values are managed by the system. You cannot modify them directly.
116Page DMU Space Analysis Version 5 Release 13
Making a Finer Analysis of Clash Command Results
This task explains how to apply Clash command visualization filters and read detailed results.
Insert the following sample model files: ATOMIZER.model, BODY1.model, BODY2.model, LOCK.model, NOZZLE1.model, NOZZLE2.model, REGULATION_COMMAND.model, REGULATOR.model, TRIGGER.model and VALVE.model.
They are to be found in the online documentation filetree in the common functionalities sample folder cfysa\samples.
Switch to Design Mode (Edit -> Design Mode).
1. Select Insert -> Clash from the menu bar or click the Clash icon in the DMU Space
Analysis toolbar to run a check of type Clearance (3mm) + Contact + Clash between the valve and all the other products in the document (Selection against all).To enable a finer analysis at element level, ensure that the detailed computation mode is set to Element level. To do so, select the Tools ->Options..., Digital Mockup command (DMU Space Analysis ->DMU Clash Detailed Computation tab).Element level is the default detailed computation mode. Triangles identifying contacts and clearances, intersection curves identifying clashes and the penetration depth or minimum distance are computed and displayed.Note: The graphics display and storage of the triangular representation is costly and may adversely affect performance.The Check Clash dialog box expands to show the results of the initial computation. The number of interferences detected along with the type is indicated in the dialog box: 4 interferences have been detected.
Note: The results given in the various tabs of the dialog box correspond to the worst case.
117Page DMU Space Analysis Version 5 Release 13
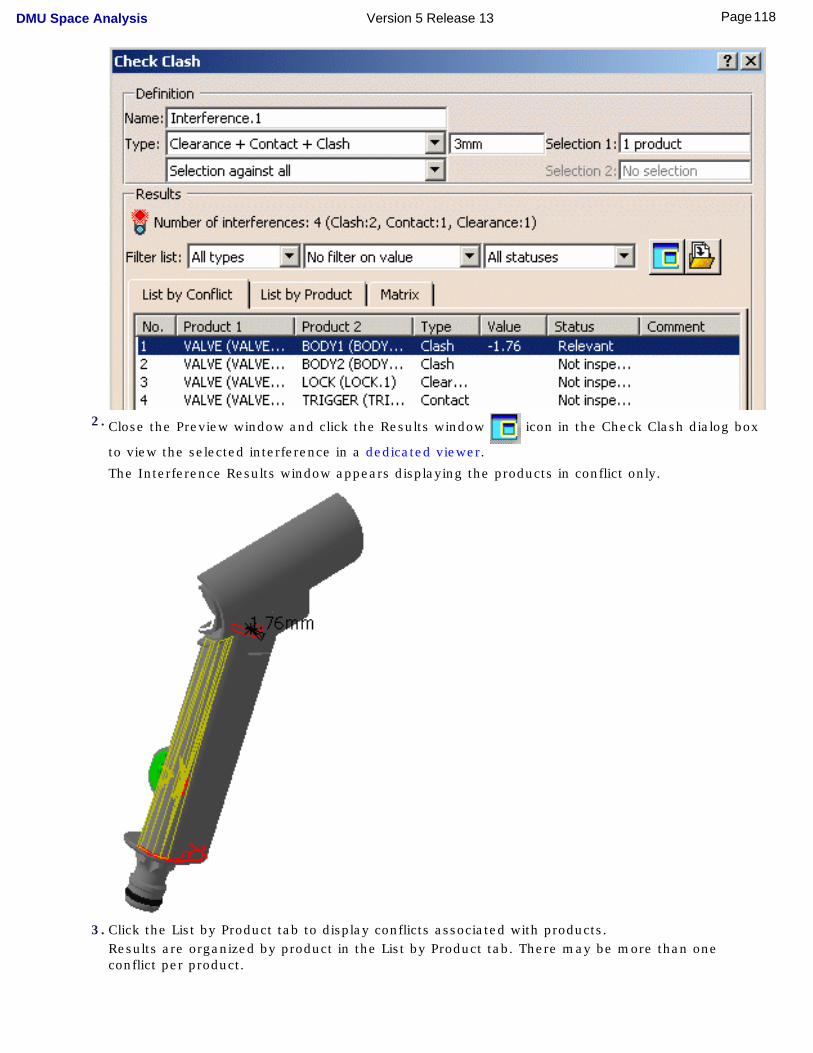
2. Close the Preview window and click the Results window icon in the Check Clash dialog box
to view the selected interference in a dedicated viewer.
The Interference Results window appears displaying the products in conflict only.
3. Click the List by Product tab to display conflicts associated with products.Results are organized by product in the List by Product tab. There may be more than one conflict per product.
118Page DMU Space Analysis Version 5 Release 13
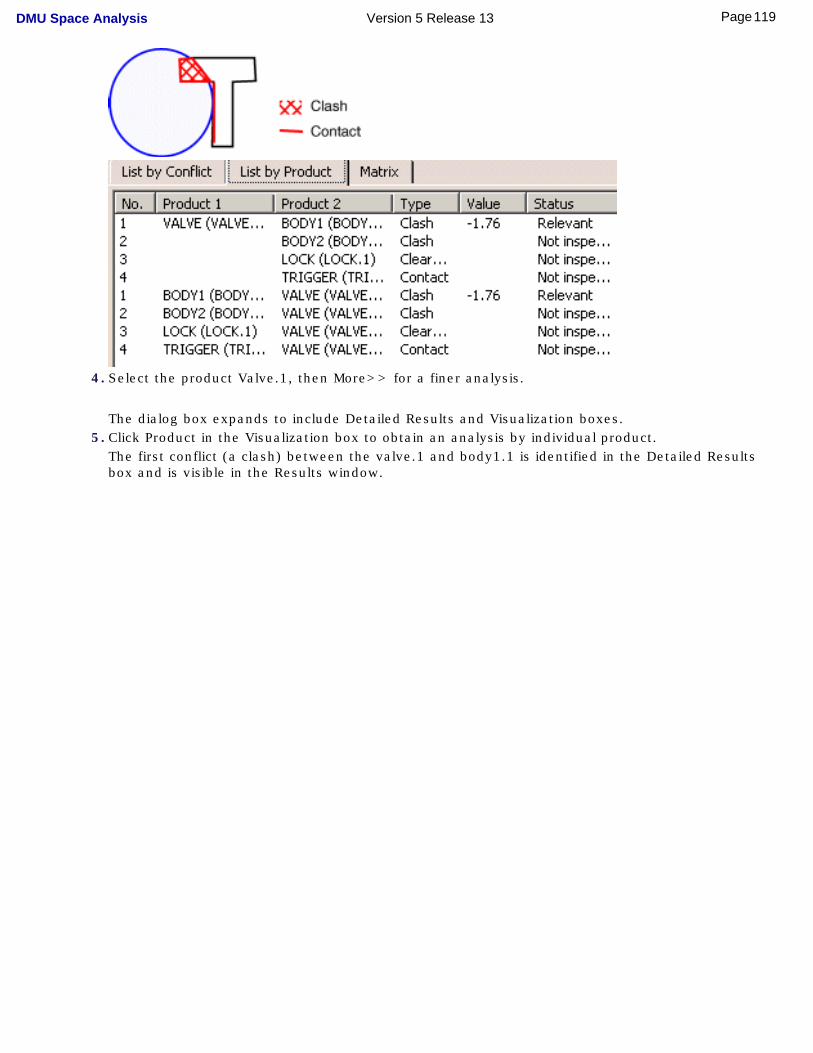
4. Select the product Valve.1, then More>> for a finer analysis.
The dialog box expands to include Detailed Results and Visualization boxes.5. Click Product in the Visualization box to obtain an analysis by individual product.
The first conflict (a clash) between the valve.1 and body1.1 is identified in the Detailed Results box and is visible in the Results window.
119Page DMU Space Analysis Version 5 Release 13
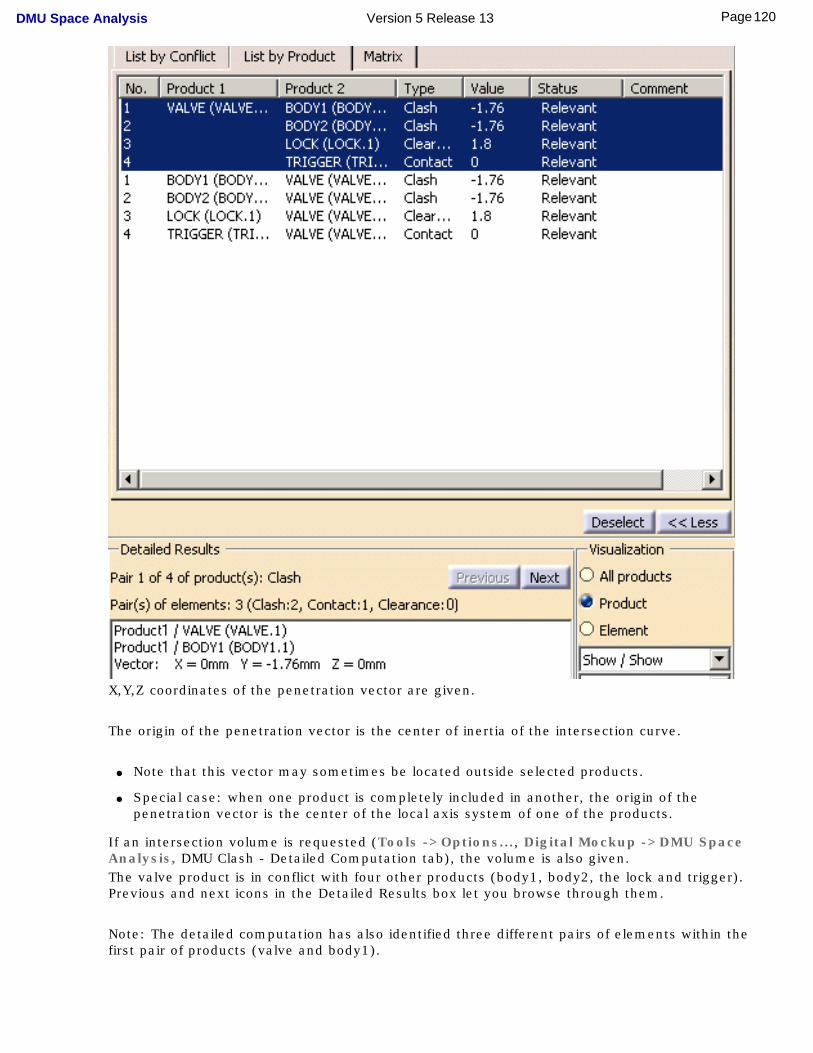
X,Y,Z coordinates of the penetration vector are given.
The origin of the penetration vector is the center of inertia of the intersection curve.
● Note that this vector may sometimes be located outside selected products.
● Special case: when one product is completely included in another, the origin of the penetration vector is the center of the local axis system of one of the products.
If an intersection volume is requested (Tools ->Options..., Digital Mockup ->DMU Space Analysis, DMU Clash - Detailed Computation tab), the volume is also given.The valve product is in conflict with four other products (body1, body2, the lock and trigger). Previous and next icons in the Detailed Results box let you browse through them.
Note: The detailed computation has also identified three different pairs of elements within the first pair of products (valve and body1).
120Page DMU Space Analysis Version 5 Release 13
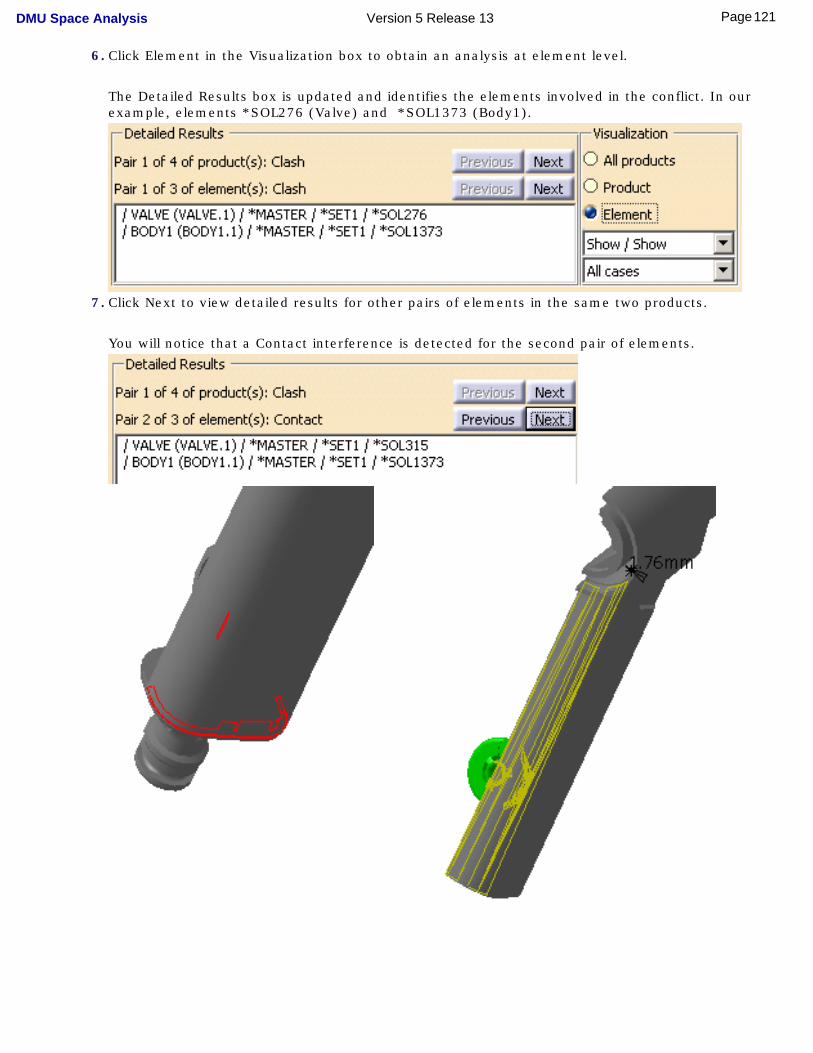
6. Click Element in the Visualization box to obtain an analysis at element level.
The Detailed Results box is updated and identifies the elements involved in the conflict. In our example, elements *SOL276 (Valve) and *SOL1373 (Body1).
7. Click Next to view detailed results for other pairs of elements in the same two products.
You will notice that a Contact interference is detected for the second pair of elements.
121Page DMU Space Analysis Version 5 Release 13
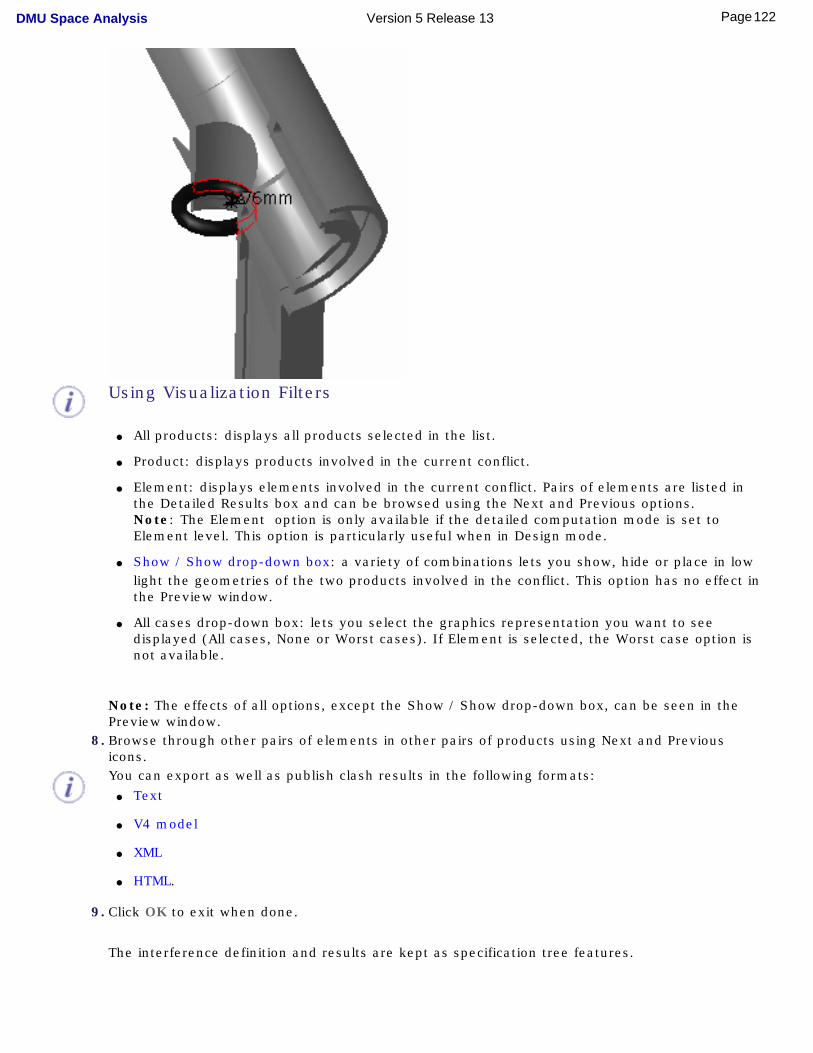
Using Visualization Filters
● All products: displays all products selected in the list.
● Product: displays products involved in the current conflict.
● Element: displays elements involved in the current conflict. Pairs of elements are listed in the Detailed Results box and can be browsed using the Next and Previous options.Note: The Element option is only available if the detailed computation mode is set to Element level. This option is particularly useful when in Design mode.
● Show / Show drop-down box: a variety of combinations lets you show, hide or place in low light the geometries of the two products involved in the conflict. This option has no effect in the Preview window.
● All cases drop-down box: lets you select the graphics representation you want to see displayed (All cases, None or Worst cases). If Element is selected, the Worst case option is not available.
Note: The effects of all options, except the Show / Show drop-down box, can be seen in the Preview window.
8. Browse through other pairs of elements in other pairs of products using Next and Previous icons.You can export as well as publish clash results in the following formats:
● Text
● V4 model
● XML
● HTML.
9. Click OK to exit when done.
The interference definition and results are kept as specification tree features.
122Page DMU Space Analysis Version 5 Release 13

The numeric value (minimum distance or penetration depth) of the current result is kept when you exit the command. If you edit the results, the system re-displays the last current result analyzed.
Note: Clicking Deselect in the Check Clash dialog box removes the current results from the selection.
123Page DMU Space Analysis Version 5 Release 13
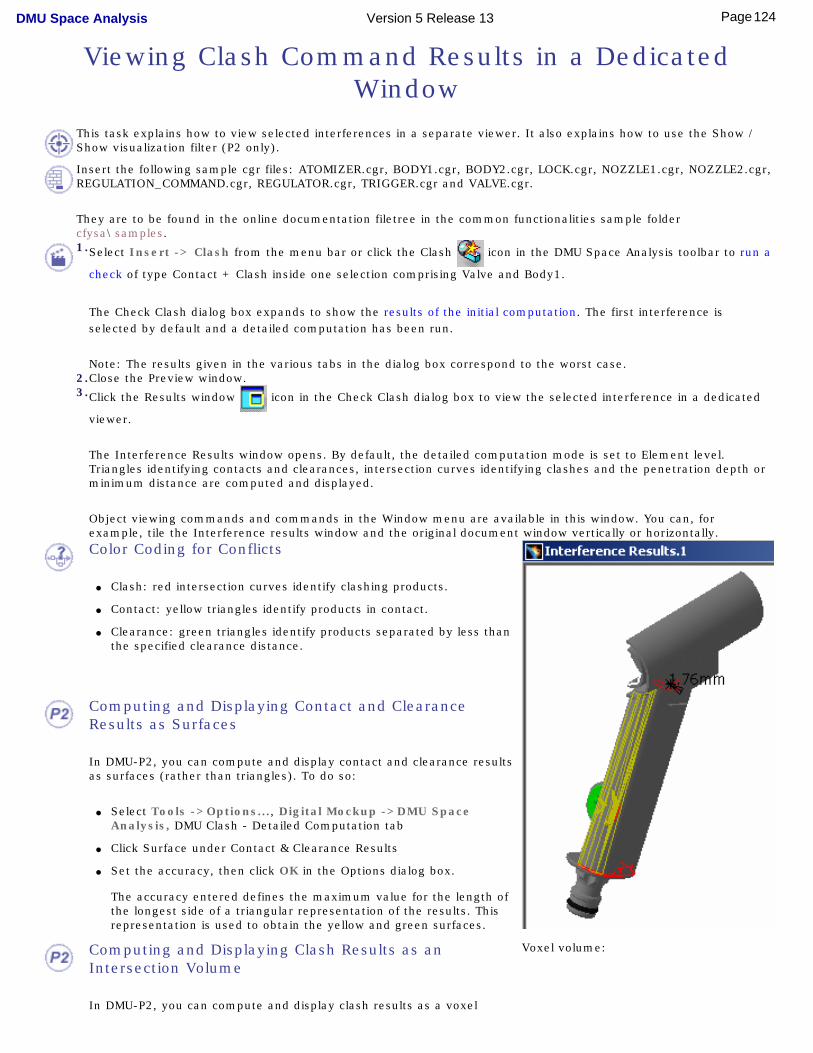
Viewing Clash Command Results in a Dedicated Window
This task explains how to view selected interferences in a separate viewer. It also explains how to use the Show / Show visualization filter (P2 only).
Insert the following sample cgr files: ATOMIZER.cgr, BODY1.cgr, BODY2.cgr, LOCK.cgr, NOZZLE1.cgr, NOZZLE2.cgr, REGULATION_COMMAND.cgr, REGULATOR.cgr, TRIGGER.cgr and VALVE.cgr.
They are to be found in the online documentation filetree in the common functionalities sample folder cfysa\samples.
1.Select Insert -> Clash from the menu bar or click the Clash icon in the DMU Space Analysis toolbar to run a
check of type Contact + Clash inside one selection comprising Valve and Body1.
The Check Clash dialog box expands to show the results of the initial computation. The first interference is selected by default and a detailed computation has been run.
Note: The results given in the various tabs in the dialog box correspond to the worst case.2.Close the Preview window.3.Click the Results window icon in the Check Clash dialog box to view the selected interference in a dedicated
viewer.
The Interference Results window opens. By default, the detailed computation mode is set to Element level. Triangles identifying contacts and clearances, intersection curves identifying clashes and the penetration depth or minimum distance are computed and displayed.
Object viewing commands and commands in the Window menu are available in this window. You can, for example, tile the Interference results window and the original document window vertically or horizontally.Color Coding for Conflicts
● Clash: red intersection curves identify clashing products.
● Contact: yellow triangles identify products in contact.
● Clearance: green triangles identify products separated by less than the specified clearance distance.
Computing and Displaying Contact and Clearance Results as Surfaces
In DMU-P2, you can compute and display contact and clearance results as surfaces (rather than triangles). To do so:
● Select Tools ->Options..., Digital Mockup ->DMU Space Analysis, DMU Clash - Detailed Computation tab
● Click Surface under Contact & Clearance Results
● Set the accuracy, then click OK in the Options dialog box.
The accuracy entered defines the maximum value for the length of the longest side of a triangular representation of the results. This representation is used to obtain the yellow and green surfaces.
Computing and Displaying Clash Results as an Intersection Volume
In DMU-P2, you can compute and display clash results as a voxel
Voxel volume:
124Page DMU Space Analysis Version 5 Release 13
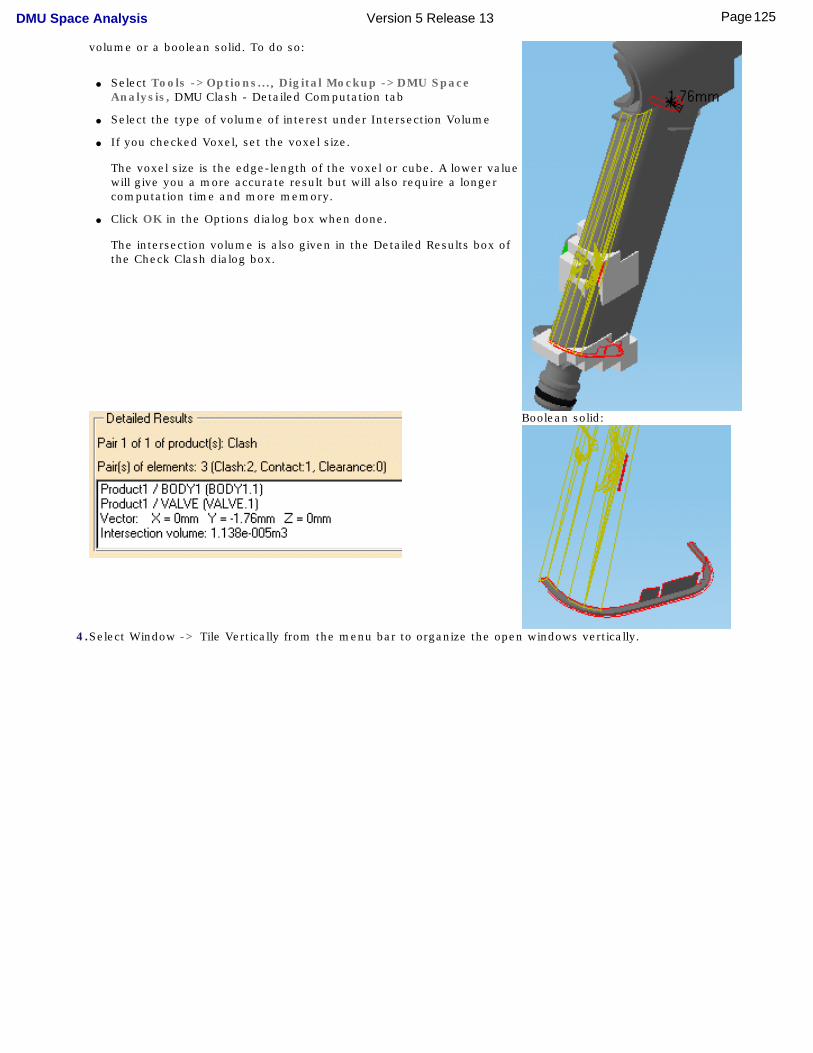
volume or a boolean solid. To do so:
● Select Tools ->Options..., Digital Mockup ->DMU Space Analysis, DMU Clash - Detailed Computation tab
● Select the type of volume of interest under Intersection Volume
● If you checked Voxel, set the voxel size.
The voxel size is the edge-length of the voxel or cube. A lower value will give you a more accurate result but will also require a longer computation time and more memory.
● Click OK in the Options dialog box when done.
The intersection volume is also given in the Detailed Results box of the Check Clash dialog box.
Boolean solid:
4.Select Window -> Tile Vertically from the menu bar to organize the open windows vertically.
125Page DMU Space Analysis Version 5 Release 13

5.Click More in the Check Clash dialog box to access visualization filters.
Using Visualization Filters
Visualization filters offer a more precise display in the Interference Results window.
● All products: displays all products selected in the list.
● Product: displays products involved in the current conflict.
● Element: displays elements involved in the current conflict. Pairs of elements are listed in the Detailed Results box and can be browsed using the Next and Previous options.Note: The Element option is only available if the detailed computation mode is set to Element level. This option is particularly useful when in Design mode.
● Show / Show drop-down box: a variety of combinations lets you better visualize the geometries of the two products involved in the conflict.
126Page DMU Space Analysis Version 5 Release 13
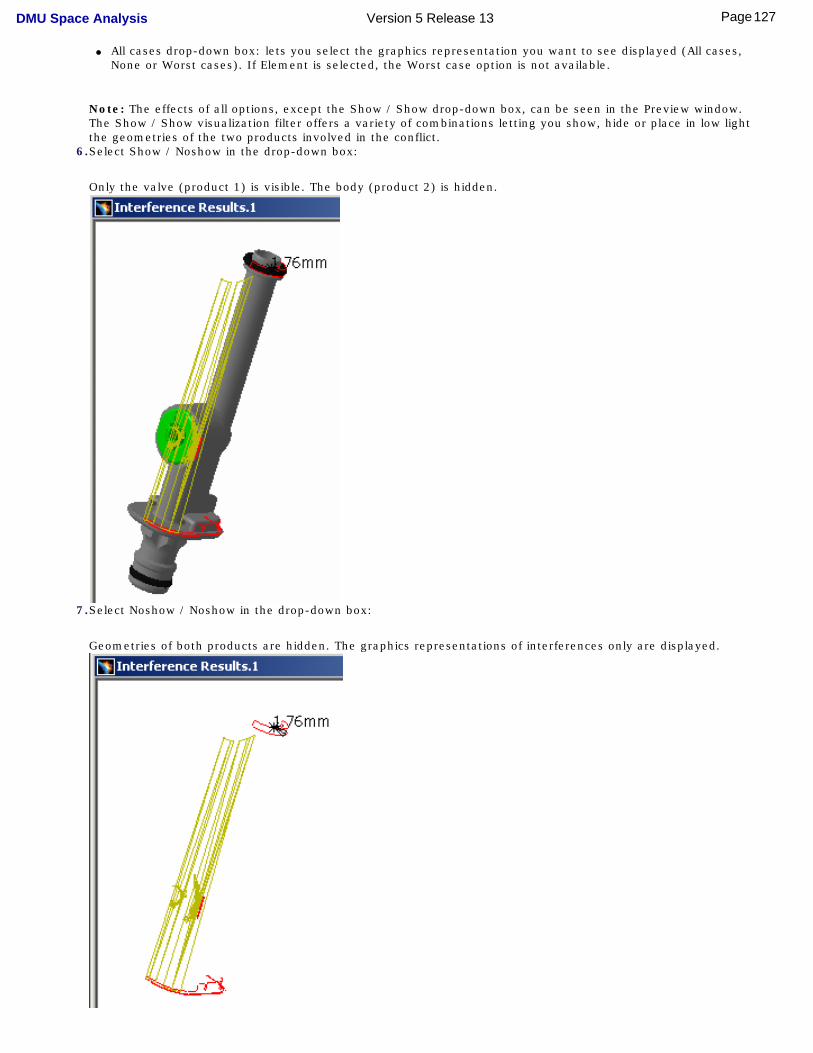
● All cases drop-down box: lets you select the graphics representation you want to see displayed (All cases, None or Worst cases). If Element is selected, the Worst case option is not available.
Note: The effects of all options, except the Show / Show drop-down box, can be seen in the Preview window. The Show / Show visualization filter offers a variety of combinations letting you show, hide or place in low light the geometries of the two products involved in the conflict.
6.Select Show / Noshow in the drop-down box:
Only the valve (product 1) is visible. The body (product 2) is hidden.
7.Select Noshow / Noshow in the drop-down box:
Geometries of both products are hidden. The graphics representations of interferences only are displayed.
127Page DMU Space Analysis Version 5 Release 13
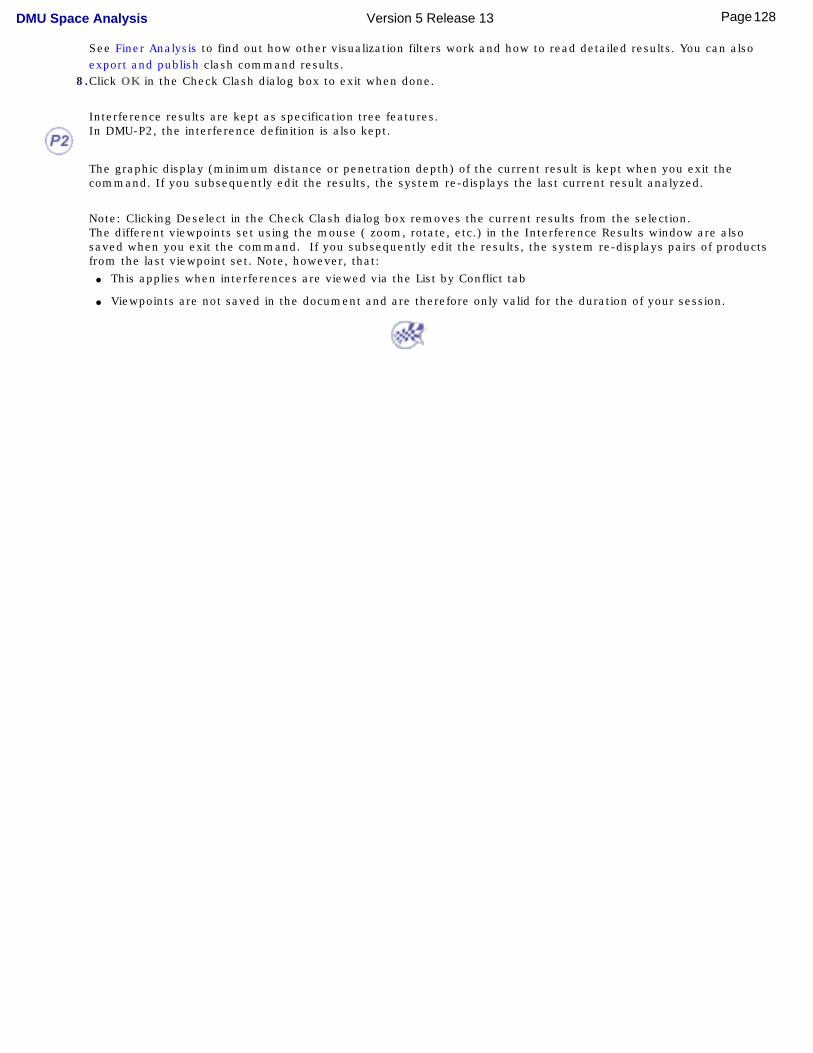
See Finer Analysis to find out how other visualization filters work and how to read detailed results. You can also export and publish clash command results.
8.Click OK in the Check Clash dialog box to exit when done.
Interference results are kept as specification tree features.
In DMU-P2, the interference definition is also kept.
The graphic display (minimum distance or penetration depth) of the current result is kept when you exit the command. If you subsequently edit the results, the system re-displays the last current result analyzed.
Note: Clicking Deselect in the Check Clash dialog box removes the current results from the selection. The different viewpoints set using the mouse ( zoom, rotate, etc.) in the Interference Results window are also saved when you exit the command. If you subsequently edit the results, the system re-displays pairs of products from the last viewpoint set. Note, however, that:
● This applies when interferences are viewed via the List by Conflict tab
● Viewpoints are not saved in the document and are therefore only valid for the duration of your session.
128Page DMU Space Analysis Version 5 Release 13
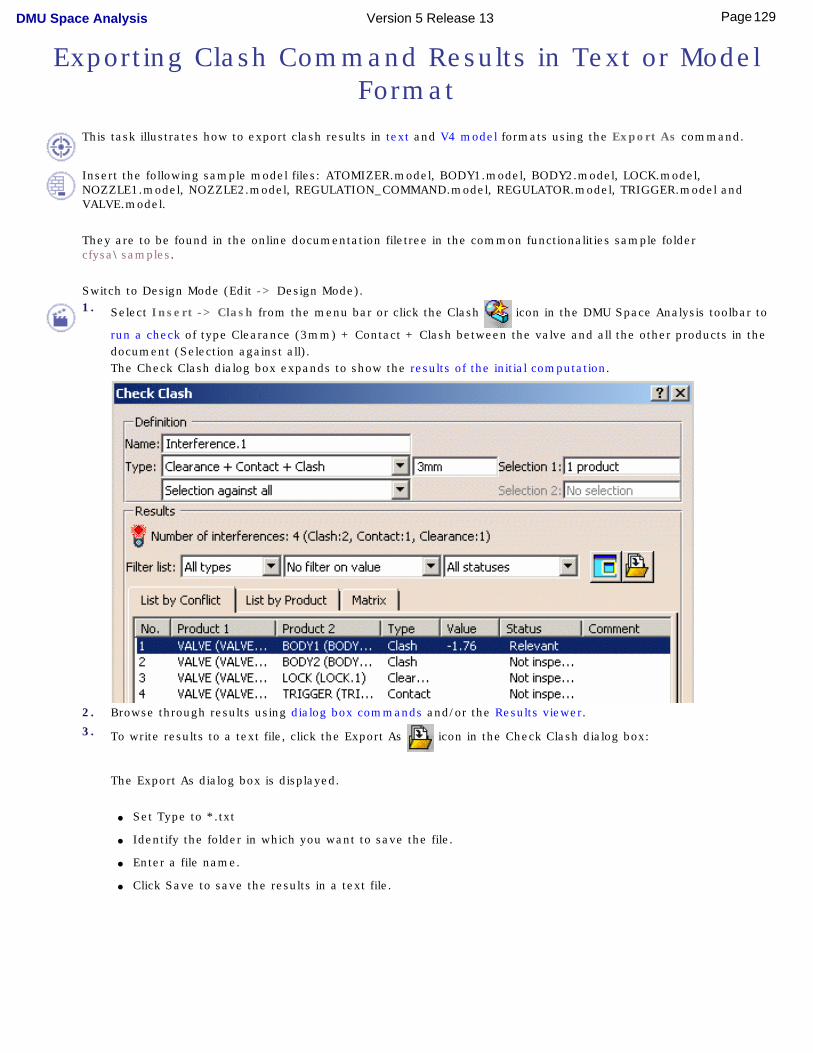
Exporting Clash Command Results in Text or Model Format
This task illustrates how to export clash results in text and V4 model formats using the Export As command.
Insert the following sample model files: ATOMIZER.model, BODY1.model, BODY2.model, LOCK.model, NOZZLE1.model, NOZZLE2.model, REGULATION_COMMAND.model, REGULATOR.model, TRIGGER.model and VALVE.model.
They are to be found in the online documentation filetree in the common functionalities sample folder cfysa\samples.
Switch to Design Mode (Edit -> Design Mode).1. Select Insert -> Clash from the menu bar or click the Clash icon in the DMU Space Analysis toolbar to
run a check of type Clearance (3mm) + Contact + Clash between the valve and all the other products in the document (Selection against all).The Check Clash dialog box expands to show the results of the initial computation.
2. Browse through results using dialog box commands and/or the Results viewer.
3. To write results to a text file, click the Export As icon in the Check Clash dialog box:
The Export As dialog box is displayed.
● Set Type to *.txt
● Identify the folder in which you want to save the file.
● Enter a file name.
● Click Save to save the results in a text file.
129Page DMU Space Analysis Version 5 Release 13
4. To save the selected interference results as a V4 model: ● Select the conflict of interest in the Check Clash dialog box.
● Click the Export As icon.
The Export As dialog box is displayed.
● Set Type to *.model
● Identify the folder in which you want to save the file.
● Enter a file name.
● Click Save to save the results as a V4 model.
● Click OK to confirm in the Confirm Export as V4 model dialog box that appears.
Intersection curves (clash) or the minimum distance line (clearance) are exported as V4 lines. You can also save intersection volumes (clash) as a V4 model.
Important: Results are exported in V4 model format conflict by conflict.5. Click OK in the Check Clash dialog box to exit when done. You can also:
● Publish clash results in HTML format
● Export clash results and geometry in XML format.
130Page DMU Space Analysis Version 5 Release 13
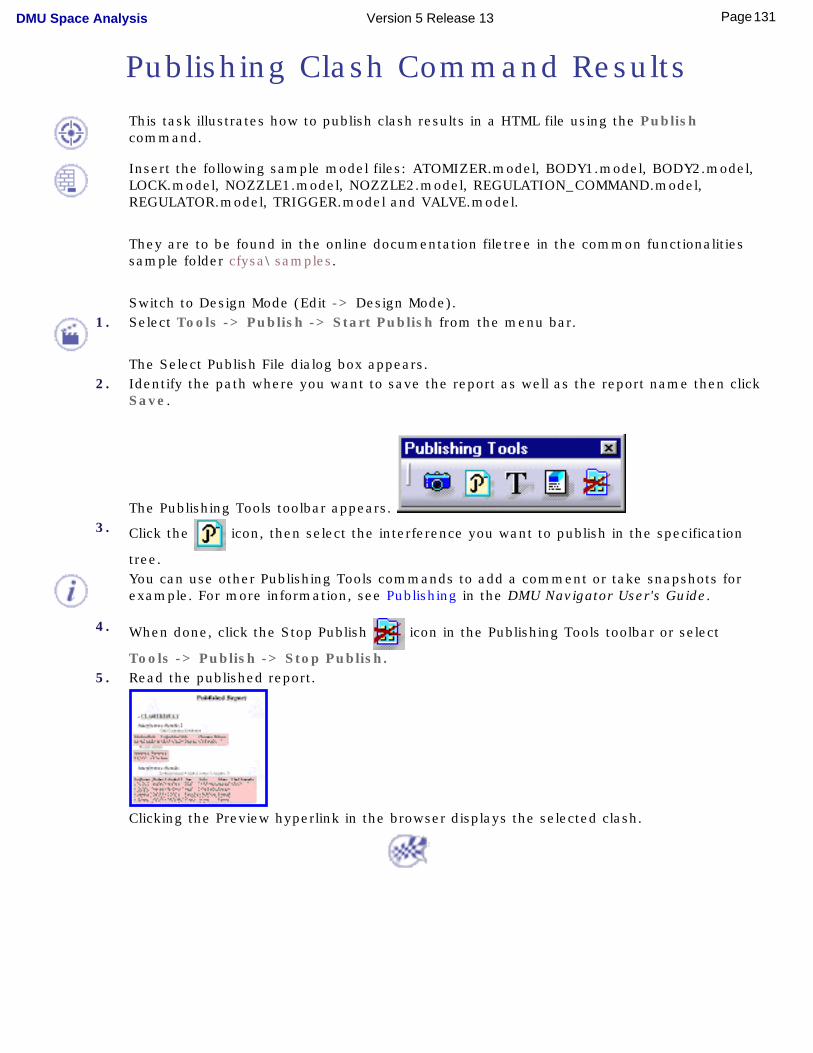
Publishing Clash Command Results
This task illustrates how to publish clash results in a HTML file using the Publish command.
Insert the following sample model files: ATOMIZER.model, BODY1.model, BODY2.model, LOCK.model, NOZZLE1.model, NOZZLE2.model, REGULATION_COMMAND.model, REGULATOR.model, TRIGGER.model and VALVE.model.
They are to be found in the online documentation filetree in the common functionalities sample folder cfysa\samples.
Switch to Design Mode (Edit -> Design Mode).1. Select Tools -> Publish -> Start Publish from the menu bar.
The Select Publish File dialog box appears.2. Identify the path where you want to save the report as well as the report name then click
Save.
The Publishing Tools toolbar appears. 3. Click the icon, then select the interference you want to publish in the specification
tree.
You can use other Publishing Tools commands to add a comment or take snapshots for example. For more information, see Publishing in the DMU Navigator User's Guide.
4. When done, click the Stop Publish icon in the Publishing Tools toolbar or select
Tools -> Publish -> Stop Publish.5. Read the published report.
Clicking the Preview hyperlink in the browser displays the selected clash.
131Page DMU Space Analysis Version 5 Release 13
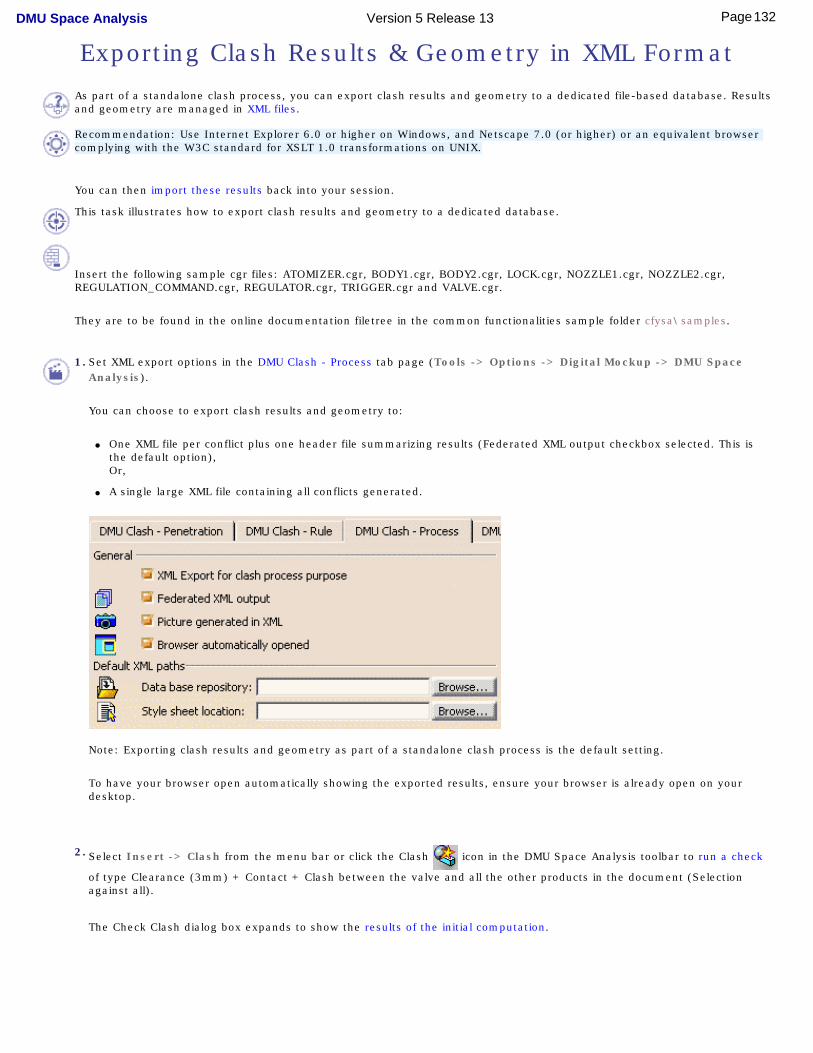
Exporting Clash Results & Geometry in XML Format
As part of a standalone clash process, you can export clash results and geometry to a dedicated file-based database. Results and geometry are managed in XML files.
Recommendation: Use Internet Explorer 6.0 or higher on Windows, and Netscape 7.0 (or higher) or an equivalent browser complying with the W3C standard for XSLT 1.0 transformations on UNIX.
You can then import these results back into your session.
This task illustrates how to export clash results and geometry to a dedicated database.
Insert the following sample cgr files: ATOMIZER.cgr, BODY1.cgr, BODY2.cgr, LOCK.cgr, NOZZLE1.cgr, NOZZLE2.cgr, REGULATION_COMMAND.cgr, REGULATOR.cgr, TRIGGER.cgr and VALVE.cgr.
They are to be found in the online documentation filetree in the common functionalities sample folder cfysa\samples.
1. Set XML export options in the DMU Clash - Process tab page (Tools -> Options -> Digital Mockup -> DMU Space Analysis).
You can choose to export clash results and geometry to:
● One XML file per conflict plus one header file summarizing results (Federated XML output checkbox selected. This is the default option),Or,
● A single large XML file containing all conflicts generated.
Note: Exporting clash results and geometry as part of a standalone clash process is the default setting.
To have your browser open automatically showing the exported results, ensure your browser is already open on your desktop.
2. Select Insert -> Clash from the menu bar or click the Clash icon in the DMU Space Analysis toolbar to run a check
of type Clearance (3mm) + Contact + Clash between the valve and all the other products in the document (Selection against all).
The Check Clash dialog box expands to show the results of the initial computation.
132Page DMU Space Analysis Version 5 Release 13
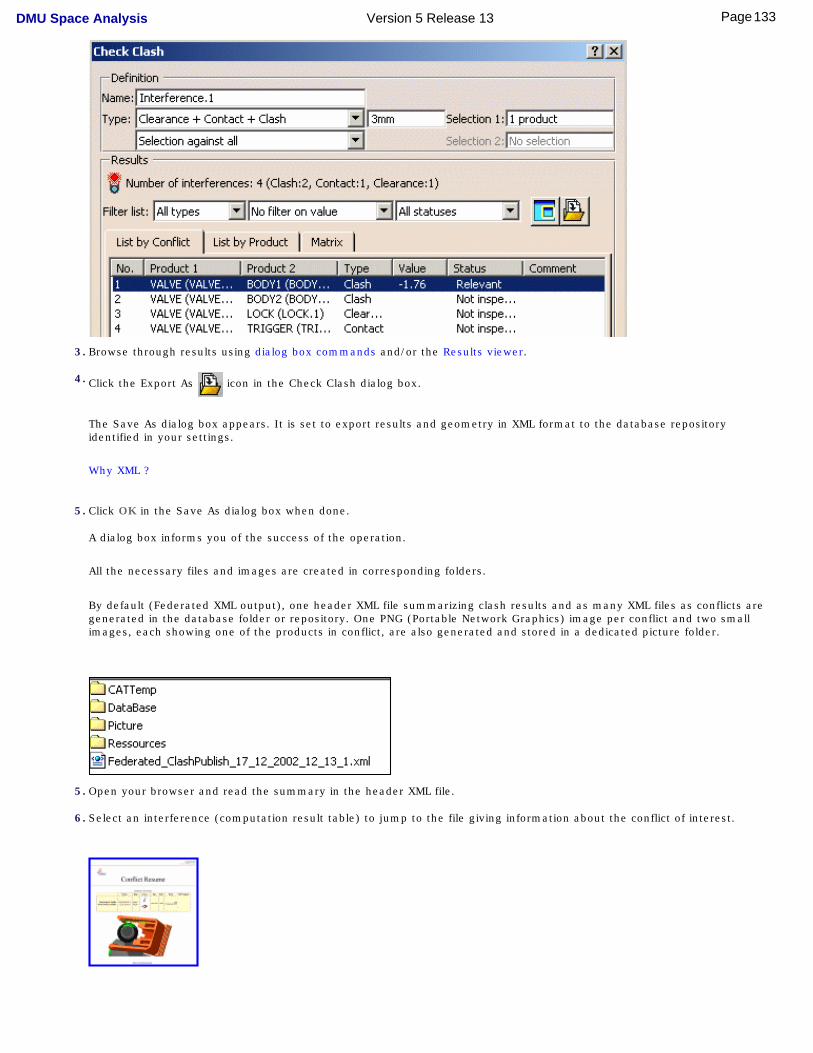
3. Browse through results using dialog box commands and/or the Results viewer.
4. Click the Export As icon in the Check Clash dialog box.
The Save As dialog box appears. It is set to export results and geometry in XML format to the database repository identified in your settings.
Why XML ?
5. Click OK in the Save As dialog box when done.
A dialog box informs you of the success of the operation.
All the necessary files and images are created in corresponding folders.
By default (Federated XML output), one header XML file summarizing clash results and as many XML files as conflicts are generated in the database folder or repository. One PNG (Portable Network Graphics) image per conflict and two small images, each showing one of the products in conflict, are also generated and stored in a dedicated picture folder.
5. Open your browser and read the summary in the header XML file.
6. Select an interference (computation result table) to jump to the file giving information about the conflict of interest.
133Page DMU Space Analysis Version 5 Release 13
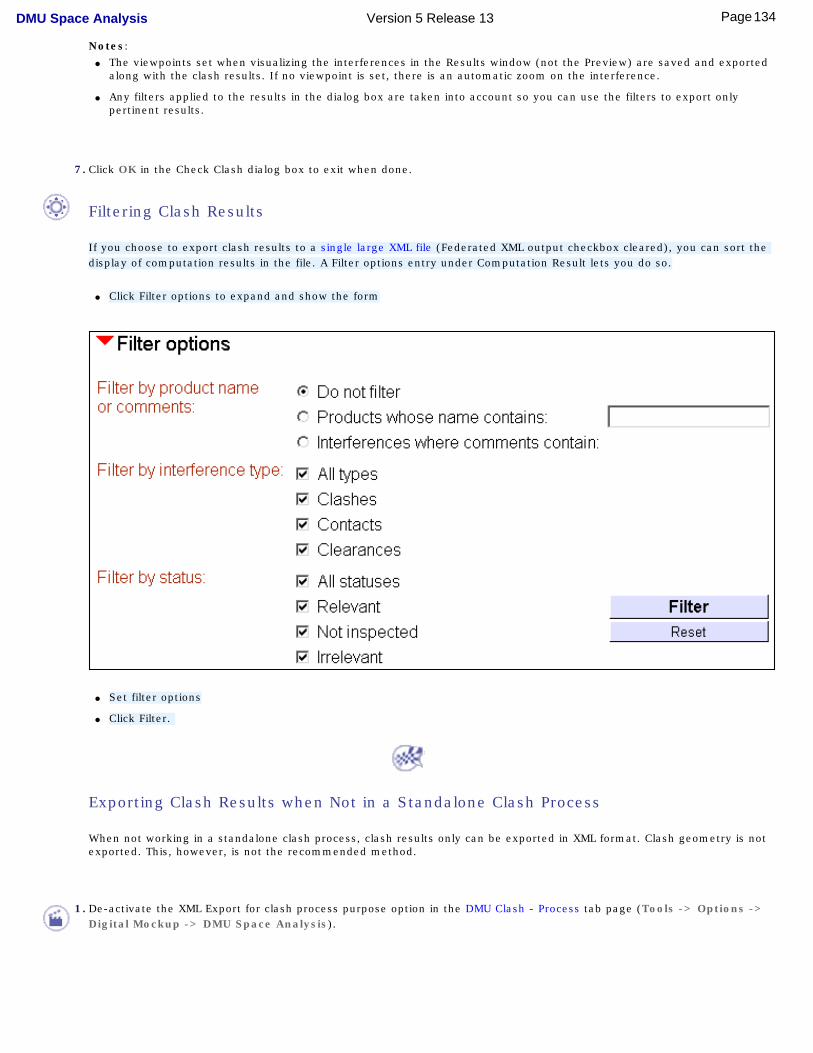
Notes: ● The viewpoints set when visualizing the interferences in the Results window (not the Preview) are saved and exported
along with the clash results. If no viewpoint is set, there is an automatic zoom on the interference.
● Any filters applied to the results in the dialog box are taken into account so you can use the filters to export only pertinent results.
7. Click OK in the Check Clash dialog box to exit when done.
Filtering Clash Results
If you choose to export clash results to a single large XML file (Federated XML output checkbox cleared), you can sort the display of computation results in the file. A Filter options entry under Computation Result lets you do so.
● Click Filter options to expand and show the form
● Set filter options
● Click Filter.
Exporting Clash Results when Not in a Standalone Clash Process
When not working in a standalone clash process, clash results only can be exported in XML format. Clash geometry is not exported. This, however, is not the recommended method.
1. De-activate the XML Export for clash process purpose option in the DMU Clash - Process tab page (Tools -> Options -> Digital Mockup -> DMU Space Analysis).
134Page DMU Space Analysis Version 5 Release 13
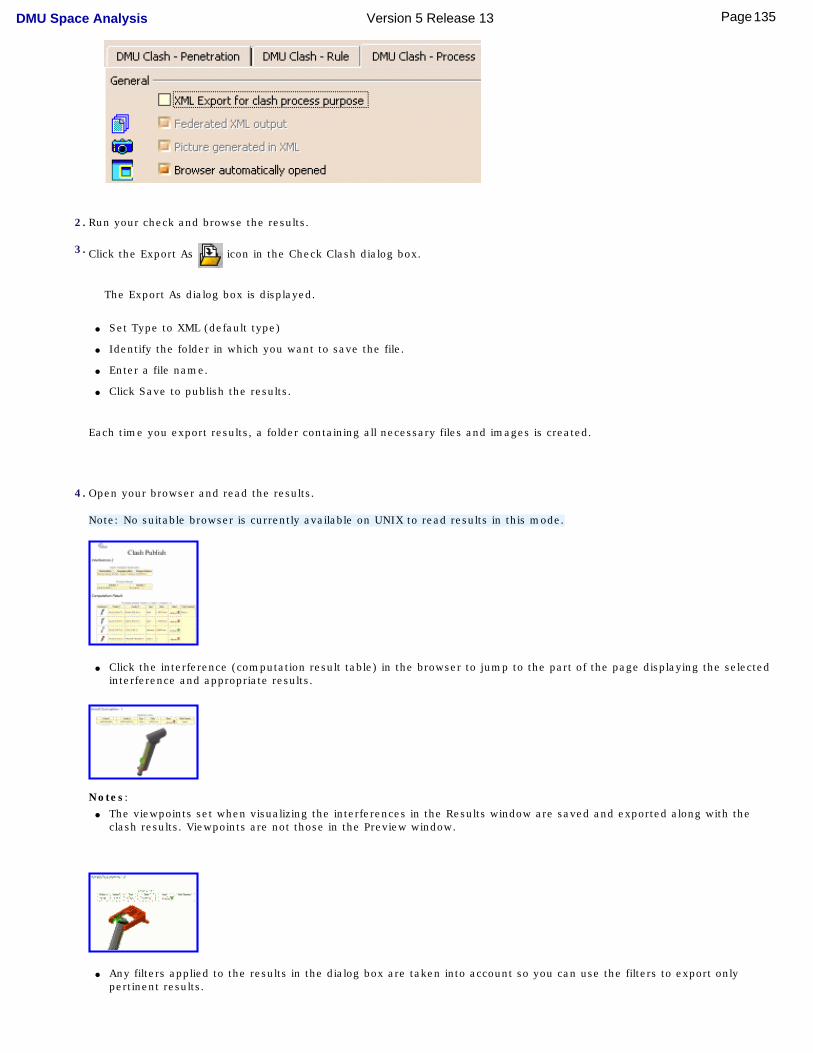
2. Run your check and browse the results.
3. Click the Export As icon in the Check Clash dialog box.
The Export As dialog box is displayed.
● Set Type to XML (default type)
● Identify the folder in which you want to save the file.
● Enter a file name.
● Click Save to publish the results.
Each time you export results, a folder containing all necessary files and images is created.
4. Open your browser and read the results.
Note: No suitable browser is currently available on UNIX to read results in this mode.
● Click the interference (computation result table) in the browser to jump to the part of the page displaying the selected interference and appropriate results.
Notes: ● The viewpoints set when visualizing the interferences in the Results window are saved and exported along with the
clash results. Viewpoints are not those in the Preview window.
● Any filters applied to the results in the dialog box are taken into account so you can use the filters to export only pertinent results.
135Page DMU Space Analysis Version 5 Release 13

Using the Tools ->Options..., Digital Mockup command (DMU Space Analysis ->DMU Clash Process tab), you can: ● Specify the default location of the XML file
● Indicate the style sheet used, and
● Have the browser open automatically.To have your browser open automatically showing the exported results, ensure your browser is already open on your desktop.
136Page DMU Space Analysis Version 5 Release 13
Reading XML Clash Files
XML has its own vocabulary. The following explains XML grammar as used in XML clash files. Explanations are given in blue.
Elements and attributes required to be able to import clash results back into DMU session are identified in red. <?xml version="1.0" encoding="ISO-8859-1"?><!ELEMENT Comment EMPTY> -> a Comment node does not contain any children<!ELEMENT Picture EMPTY> -> a Picture node does not contain any children<!ELEMENT Vector EMPTY> -> a Vector node does not contain any children<!ELEMENT Point EMPTY> -> a Point node does not contain any children<!ELEMENT Date EMPTY> -> a Date node does not contain any children<!ELEMENT ViolatedRule EMPTY> -> a ViolatedRule node does not contain any children<!ELEMENT Viewpoint (Vector+)> -> a Viewpoint node contains 1 or n Vector nodes<!ELEMENT Matrix (Vector+ , Point)> -> a Matrix node contains 1 or n Vector nodes and a Point node<!ELEMENT Product (Matrix*)> -> a Product node contains 0 or n Matrix nodes<!ELEMENT Specification (Product+)> -> a Specification node contains 1 or n Product nodes<!ELEMENT GeometricAspect (Point*, Viewpoint*)> -> a GeometricAspect node contains 0 or n Point nodes and 0 or n Viewpoint nodes<!ELEMENT Interference (Product+, ViolatedRule*, GeometricAspect, Comment, Picture*)> -> an Interference node contains 1 or n Product nodes, 0 or n ViolatedRule nodes, a GeometricAspect node, a Comment node and 0 or n Picture nodes<!ELEMENT ClashResult (Interference*)> -> a ClashResult node contains 0 or n Interference nodes<!ELEMENT ClashSpec (Specification*)> -> a ClashSpec node contains 0 or n Specification nodes<!ELEMENT ClashElement (Date, ClashSpec, ClashResult)> -> a ClashElement node contains a Date node, a ClashSpec node and a ClashResult node
<!ATTLIST ClashElement Responsible CDATA #REQUIRED -> name of the person who owns the clash CATDocument CDATA #REQUIRED -> useful in standalone mode; URL path to the CATProductVersion (1.0|1.1|1.2) "1.2"> -> the XML version; 1.2 refers to the current version
<!ATTLIST ClashSpec -> describes the clash specificationName CDATA #REQUIRED -> name of the clash node in the DMU treeDistanceClearance CDATA #REQUIRED -> distance clearance distance specified in the clash specificationTabTitle CDATA #REQUIRED -> useful for the XSL style sheet; only the name of a titleTabListTitle CDATA #REQUIRED -> useful for the XSL style sheet; only the name of a titleSelectMode (INSIDE|OUTSIDE|ALL|TWO_LIST) "ALL" -> corresponds to the second Type drop-down list box in interactive modeCaseOfCalc (INTERFERE_CONT|INTERFERE_CLEAR|INTERFERE_PENETR_CLASH|INTERFERE_RULE) "INTERFERE_CONT"> -> corresponds to the first Type drop-down list box (interference type) in interactive mode
<!ATTLIST ClashResult -> describes the clash resultName CDATA #REQUIRED -> the name of the clash result in the DMU treeTabTitle CDATA #REQUIRED -> just here for the XSL style sheet; name of the titleNbInterf CDATA #REQUIRED -> number of interferences contained in the clash resultComputationCase
137Page DMU Space Analysis Version 5 Release 13
(INTERFERE_CONT|INTERFERE_CLEAR|INTERFERE_PENETR_CLASH|INTERFERE_RULE) "INTERFERE_CONT"> -> the interference type used to check for interferences
<!ATTLIST Date -> attributes corresponding to the date of the exportYear CDATA #REQUIREDMonth CDATA #REQUIREDDay CDATA #REQUIREDHour CDATA #REQUIREDMinute CDATA #REQUIREDSecond CDATA #REQUIRED>
<!ATTLIST Product Alias CDATA #REQUIRED -> the name of the clashing product ProcessMode (ENOVIAV5|ENOVIAVPM|STANDALONE) "ENOVIAV5" -> describes the type of connection we need to retrieve the productDescriptionID CDATA #IMPLIED -> depending on the type of connection, the descriptionID will contain:
● ENOVIAVPM: coID compID caEnv catab Clinkable
● ENOVIA LCA: UUID/DocumentVersion
● STANDALONE: the path in the tree from the terminal node to the root product, excluding the root product itself
ShapeSource CDATA #IMPLIED -> the path to the shape when working in standalone ShapeName CDATA #REQUIRED -> the name of the shapeAlien (YES|NO) "YES"> -> useful only in a Space Engineering Assistant context (SPE product)
<!ATTLIST Point Ux CDATA #REQUIRED -> the X-coordinate of the pointUy CDATA #REQUIRED -> the Y-coordinate of the pointUz CDATA #REQUIRED> -> the Z-coordinate of the point
<!ATTLIST Vector CorrespondingData (Rx|Ry|Rz) "Rx" -> the corresponding rotation vector in the matrixVx CDATA #REQUIRED -> the X-coordinate of the vectorVy CDATA #REQUIRED -> the Y-coordinate of the vectorVz CDATA #REQUIRED> -> the Z-coordinate of the vector
<!ATTLIST Viewpoint -> the focus, angle and projection for the corresponding viewpoint Focus CDATA #REQUIREDAngle CDATA #REQUIREDProjection (CYLINDRIC|CONIC) "CYLINDRIC">
<!ATTLIST Picture HRef CDATA #REQUIREDPreview CDATA #IMPLIED> -> the URL corresponding to the picture and its preview (relative path)
<!ATTLIST Comment Value CDATA #REQUIRED> -> if a comment has been defined on the corresponding interference, the value will contain it
138Page DMU Space Analysis Version 5 Release 13
<!ATTLIST GeometricAspect IntersectCurveLength CDATA #REQUIRED -> contains the length of the curve describing the clashExtractOrDistValue CDATA #REQUIRED> -> contains the length of the vector corresponding to:
● If the result is a clearance, it contains the minimum distance between the two products
● If the result is a clash, it contains the length of the extraction vector
<!ATTLIST Interference NumInterf CDATA #REQUIRED -> the position of the interference in the clash featureResultType (Clash|Contact|Clearance) "Clash" -> the interference type, either clash, contact or clearance DistanceClearance CDATA #IMPLIED -> just in case of clearance computation; contains the clearance value defined in the dialog boxStatus (NotInspected|Relevant|Irrelevant|Solved) "NotInspected" -> the status of the interferenceRetrieveInf (Old|New|Modified) "New"> -> the information about clash history
The following node is needed only in case of clash computation with knowledge rules:
<!ATTLIST ViolatedRule Name CDATA #REQUIRED -> the name of the ruleTypeCalc CDATA #REQUIRED -> the type of computation defined by the ruleClearance CDATA #REQUIRED -> the clearance value defined in the rulePriority CDATA #REQUIRED -> the priority of the rulePenetrationCandidate CDATA #IMPLIED -> Yes if it is candidate for penetration, No if notSeverity CDATA #IMPLIED> -> the severity of the rule
139Page DMU Space Analysis Version 5 Release 13
Comparing Products
This task explains how to compare two parts or two products to detect differences between them and identify where material has been added and/or removed.
This is useful when comparing assemblies or products at different stages in the design process or when considering internal and external (client) changes to the same product.
Two comparison modes are available: ● Visual (default value): the comparison is entirely visual. A single view shows the results.
● Geometric: differences between assemblies or products are represented by cubes with separate views showing added and removed material.
Visual comparison offers faster and finer comparison:
● Computation time is proportional to the size of the Visual Comparison viewer.
● Visual comparison is purely in terms of pixels; zooming in gives a better view.
In both modes, you can compare assemblies or products with respect to the:
● Absolute axis system in the document (default value), or
● Local axis systems.
Insert the PEDALV1.model and PEDALV2.model documents in the DMU Space Analysis samples folder spaug/samples.
Important: Products or parts you want to compare must be in the same CATproduct document.
1. Click the Compare Products icon in the DMU Space Analysis toolbar:
The Compare Products dialog box appears.
Visual comparison is the default comparison mode.
140Page DMU Space Analysis Version 5 Release 13
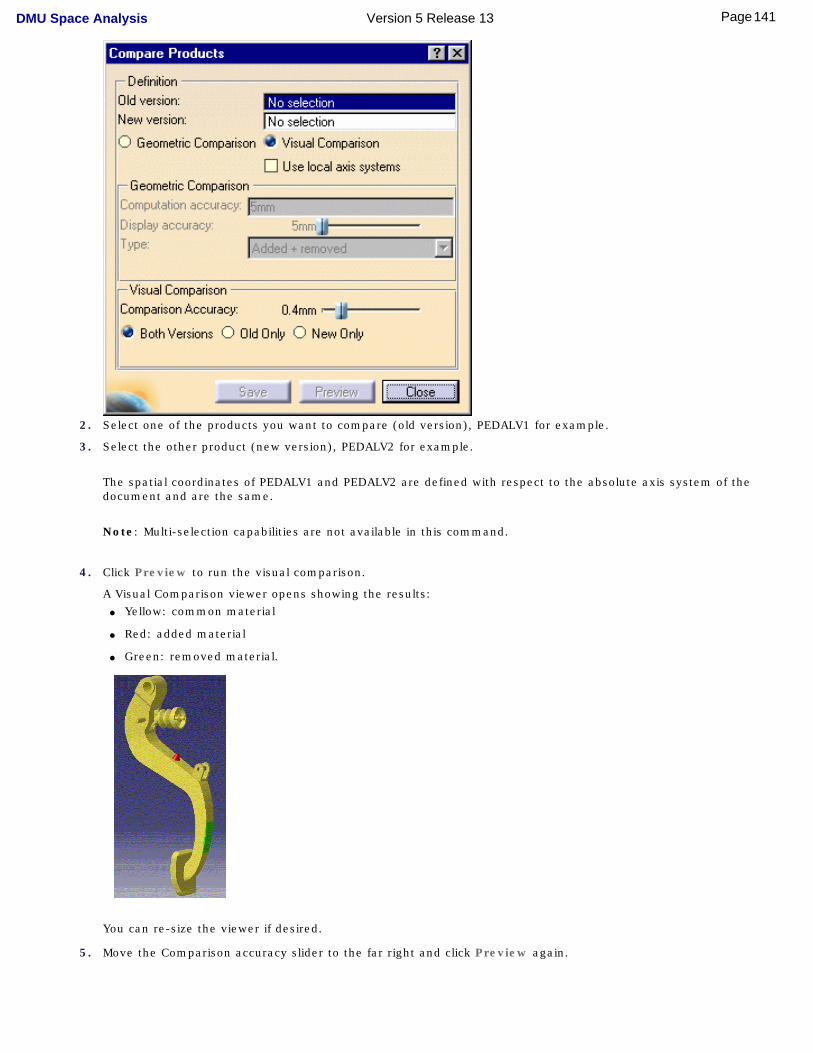
2. Select one of the products you want to compare (old version), PEDALV1 for example.
3. Select the other product (new version), PEDALV2 for example.
The spatial coordinates of PEDALV1 and PEDALV2 are defined with respect to the absolute axis system of the document and are the same.
Note: Multi-selection capabilities are not available in this command.
4. Click Preview to run the visual comparison.
A Visual Comparison viewer opens showing the results: ● Yellow: common material
● Red: added material
● Green: removed material.
You can re-size the viewer if desired.
5. Move the Comparison accuracy slider to the far right and click Preview again.
141Page DMU Space Analysis Version 5 Release 13
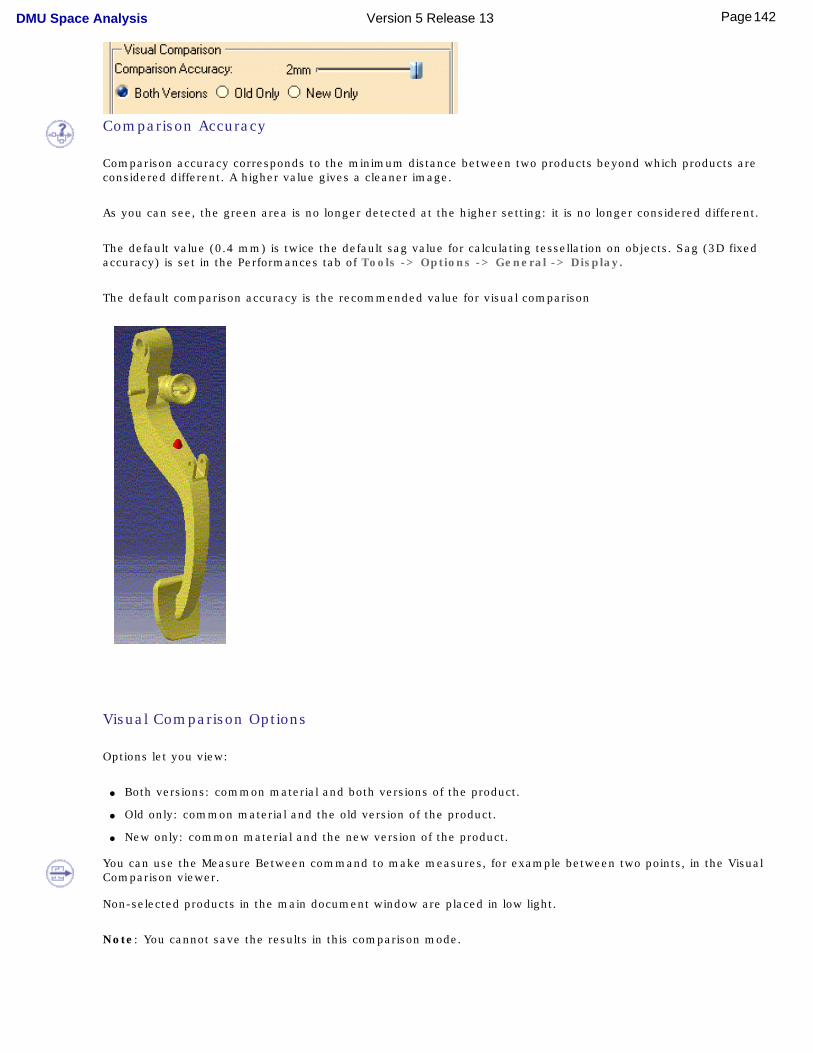
Comparison Accuracy
Comparison accuracy corresponds to the minimum distance between two products beyond which products are considered different. A higher value gives a cleaner image.
As you can see, the green area is no longer detected at the higher setting: it is no longer considered different.
The default value (0.4 mm) is twice the default sag value for calculating tessellation on objects. Sag (3D fixed accuracy) is set in the Performances tab of Tools -> Options -> General -> Display.
The default comparison accuracy is the recommended value for visual comparison
Visual Comparison Options
Options let you view:
● Both versions: common material and both versions of the product.
● Old only: common material and the old version of the product.
● New only: common material and the new version of the product.
You can use the Measure Between command to make measures, for example between two points, in the Visual Comparison viewer.
Non-selected products in the main document window are placed in low light.
Note: You cannot save the results in this comparison mode.
142Page DMU Space Analysis Version 5 Release 13
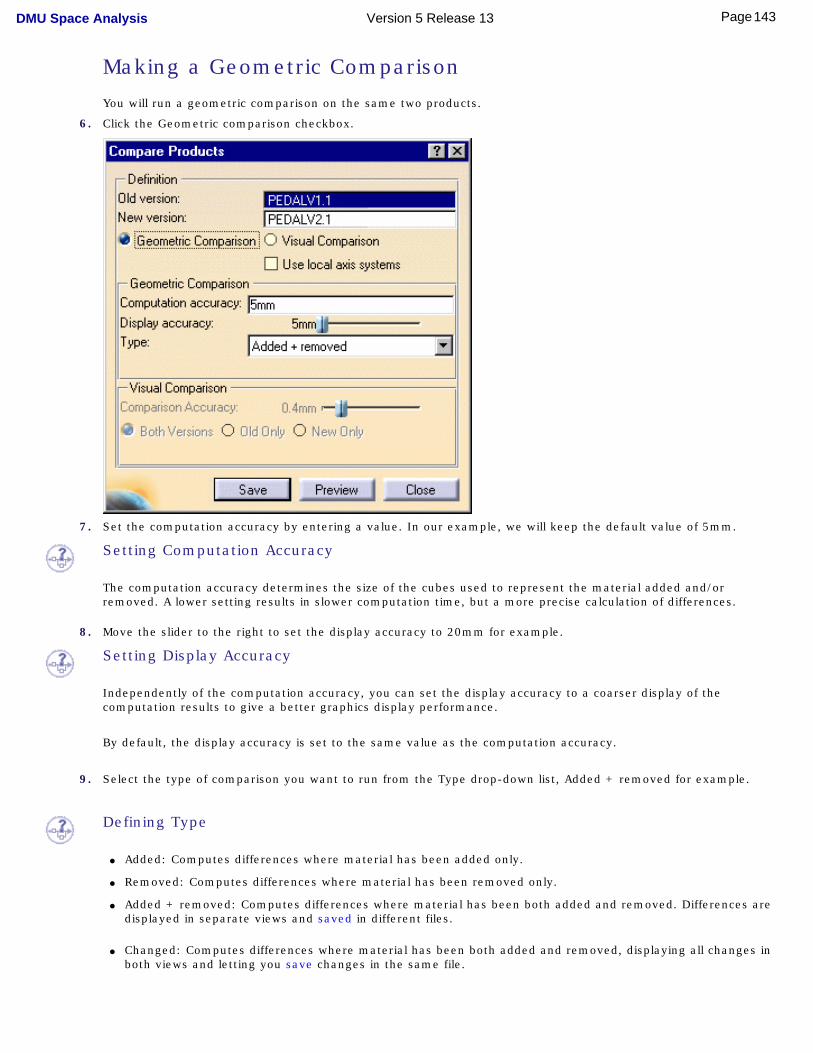
Making a Geometric Comparison
You will run a geometric comparison on the same two products.
6. Click the Geometric comparison checkbox.
7. Set the computation accuracy by entering a value. In our example, we will keep the default value of 5mm.
Setting Computation Accuracy
The computation accuracy determines the size of the cubes used to represent the material added and/or removed. A lower setting results in slower computation time, but a more precise calculation of differences.
8. Move the slider to the right to set the display accuracy to 20mm for example.
Setting Display Accuracy
Independently of the computation accuracy, you can set the display accuracy to a coarser display of the computation results to give a better graphics display performance.
By default, the display accuracy is set to the same value as the computation accuracy.
9. Select the type of comparison you want to run from the Type drop-down list, Added + removed for example.
Defining Type
● Added: Computes differences where material has been added only.
● Removed: Computes differences where material has been removed only.
● Added + removed: Computes differences where material has been both added and removed. Differences are displayed in separate views and saved in different files.
● Changed: Computes differences where material has been both added and removed, displaying all changes in
both views and letting you save changes in the same file.
143Page DMU Space Analysis Version 5 Release 13
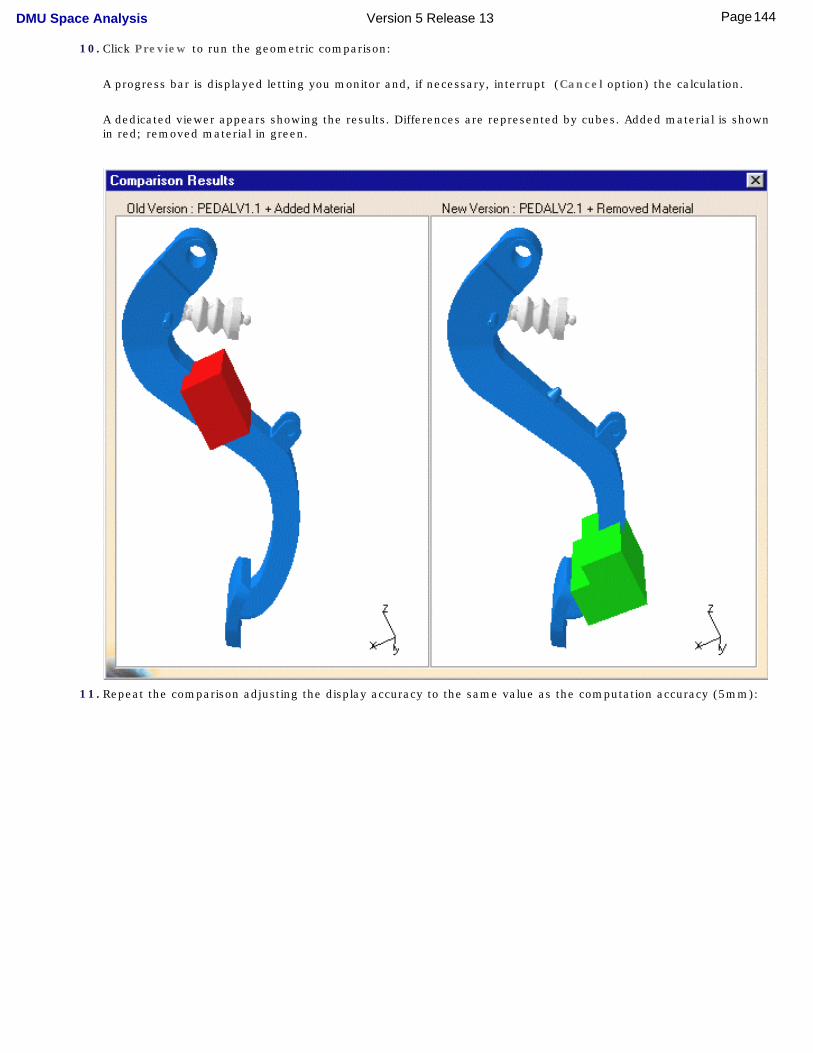
10. Click Preview to run the geometric comparison:
A progress bar is displayed letting you monitor and, if necessary, interrupt (Cancel option) the calculation.
A dedicated viewer appears showing the results. Differences are represented by cubes. Added material is shown in red; removed material in green.
11. Repeat the comparison adjusting the display accuracy to the same value as the computation accuracy (5mm):
144Page DMU Space Analysis Version 5 Release 13
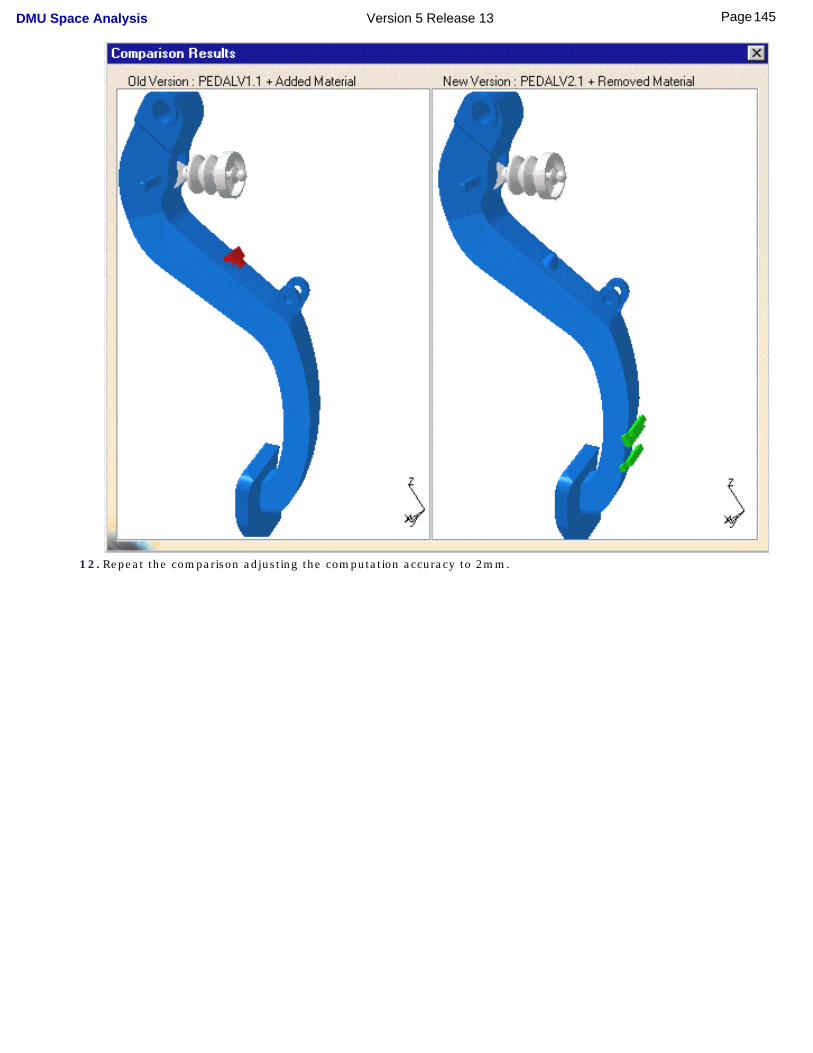
12. Repeat the comparison adjusting the computation accuracy to 2mm.
145Page DMU Space Analysis Version 5 Release 13
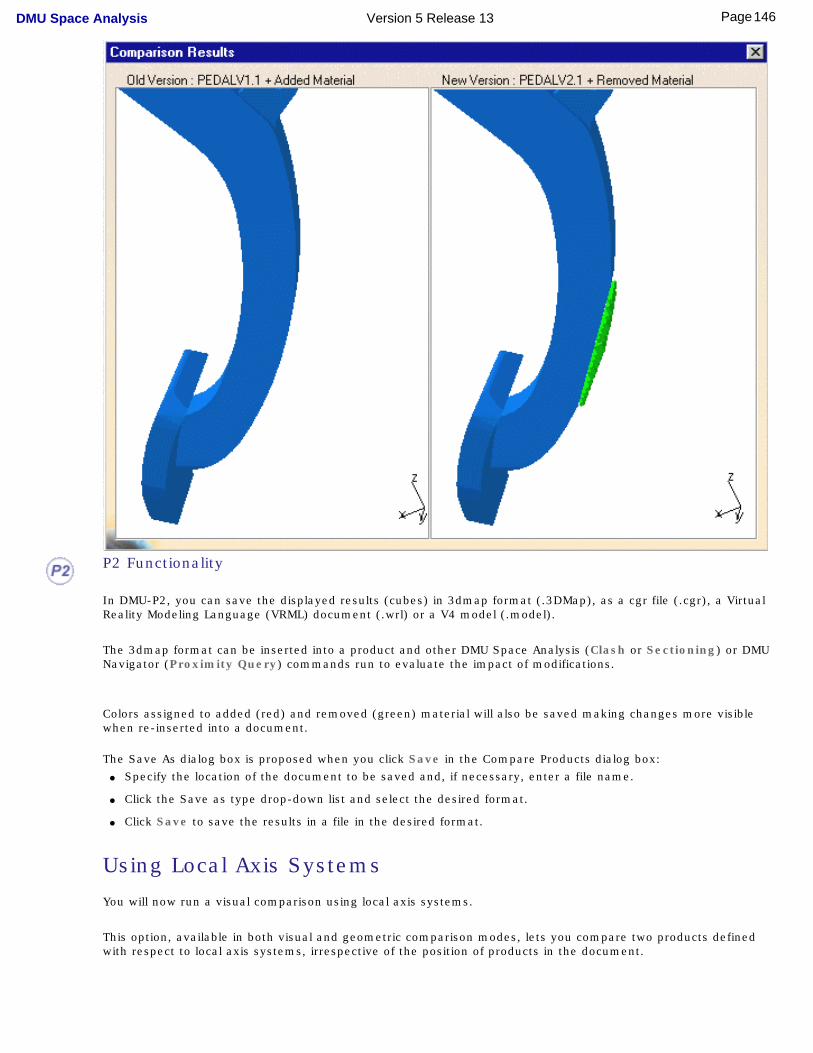
P2 Functionality
In DMU-P2, you can save the displayed results (cubes) in 3dmap format (.3DMap), as a cgr file (.cgr), a Virtual Reality Modeling Language (VRML) document (.wrl) or a V4 model (.model).
The 3dmap format can be inserted into a product and other DMU Space Analysis (Clash or Sectioning) or DMU Navigator (Proximity Query) commands run to evaluate the impact of modifications.
Colors assigned to added (red) and removed (green) material will also be saved making changes more visible when re-inserted into a document.
The Save As dialog box is proposed when you click Save in the Compare Products dialog box: ● Specify the location of the document to be saved and, if necessary, enter a file name.
● Click the Save as type drop-down list and select the desired format.
● Click Save to save the results in a file in the desired format.
Using Local Axis Systems
You will now run a visual comparison using local axis systems.
This option, available in both visual and geometric comparison modes, lets you compare two products defined with respect to local axis systems, irrespective of the position of products in the document.
146Page DMU Space Analysis Version 5 Release 13
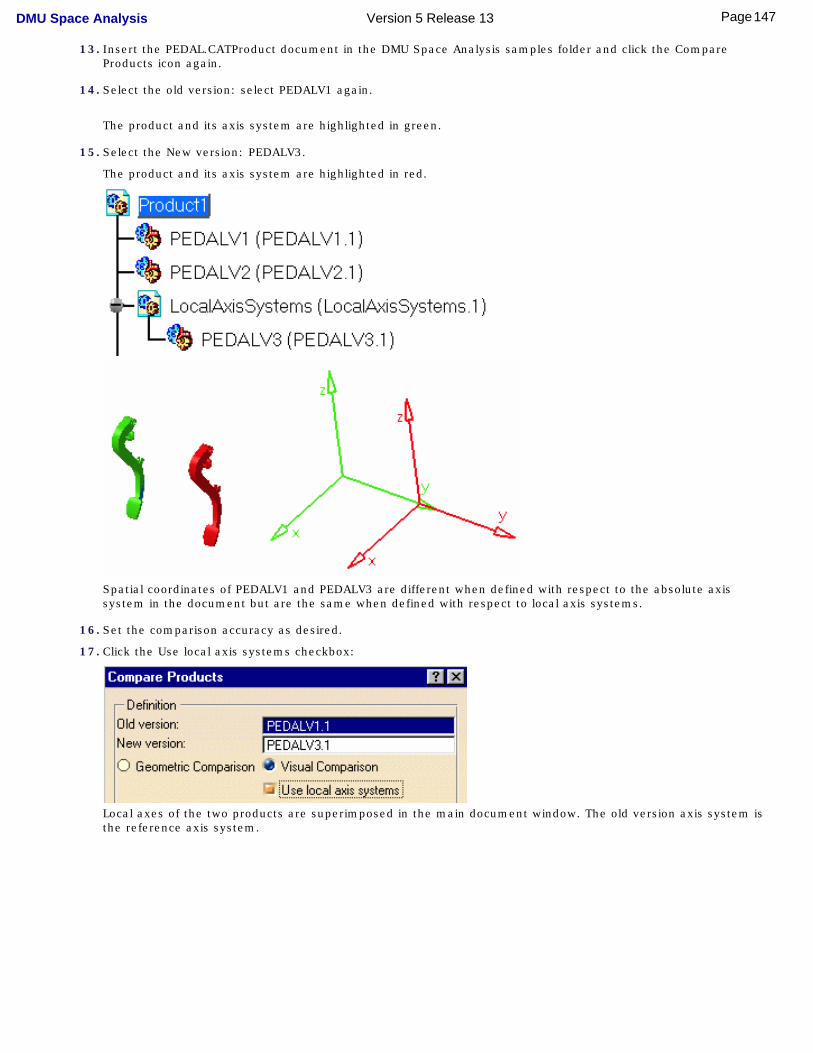
13. Insert the PEDAL.CATProduct document in the DMU Space Analysis samples folder and click the Compare Products icon again.
14. Select the old version: select PEDALV1 again.
The product and its axis system are highlighted in green.
15. Select the New version: PEDALV3.
The product and its axis system are highlighted in red.
Spatial coordinates of PEDALV1 and PEDALV3 are different when defined with respect to the absolute axis system in the document but are the same when defined with respect to local axis systems.
16. Set the comparison accuracy as desired.
17. Click the Use local axis systems checkbox:
Local axes of the two products are superimposed in the main document window. The old version axis system is the reference axis system.
147Page DMU Space Analysis Version 5 Release 13
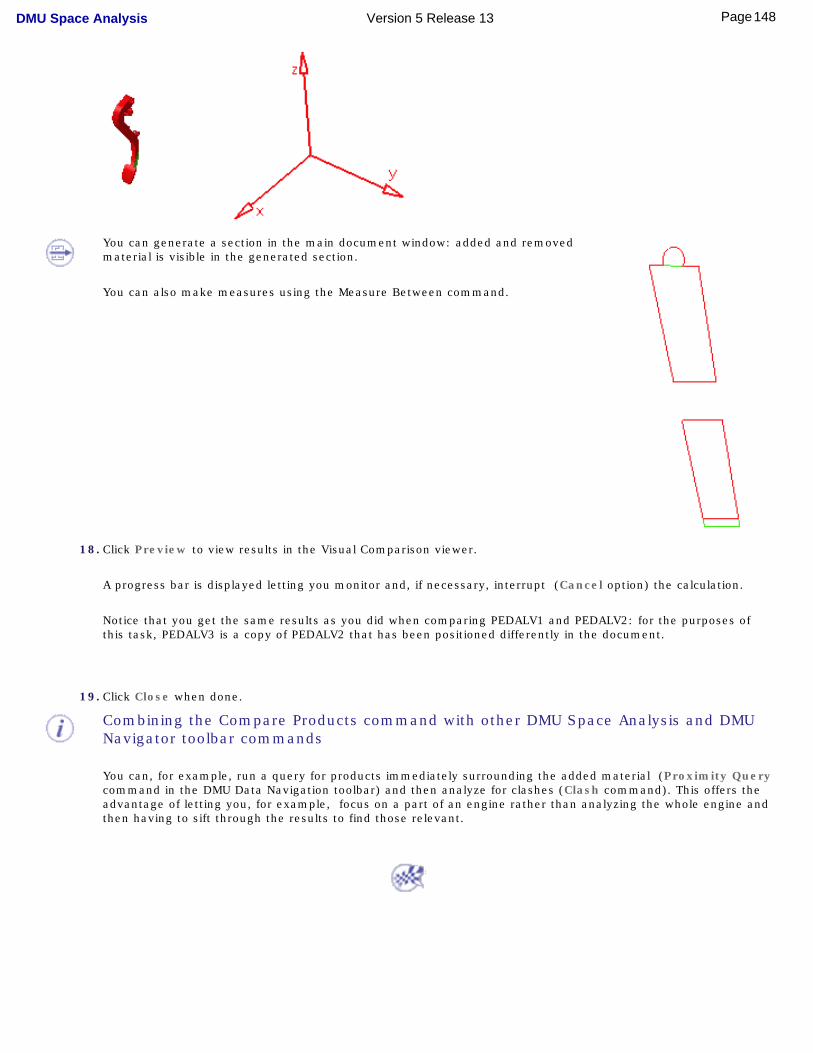
You can generate a section in the main document window: added and removed material is visible in the generated section.
You can also make measures using the Measure Between command.
18. Click Preview to view results in the Visual Comparison viewer.
A progress bar is displayed letting you monitor and, if necessary, interrupt (Cancel option) the calculation.
Notice that you get the same results as you did when comparing PEDALV1 and PEDALV2: for the purposes of this task, PEDALV3 is a copy of PEDALV2 that has been positioned differently in the document.
19. Click Close when done.
Combining the Compare Products command with other DMU Space Analysis and DMU Navigator toolbar commands
You can, for example, run a query for products immediately surrounding the added material (Proximity Query command in the DMU Data Navigation toolbar) and then analyze for clashes (Clash command). This offers the advantage of letting you, for example, focus on a part of an engine rather than analyzing the whole engine and then having to sift through the results to find those relevant.
148Page DMU Space Analysis Version 5 Release 13
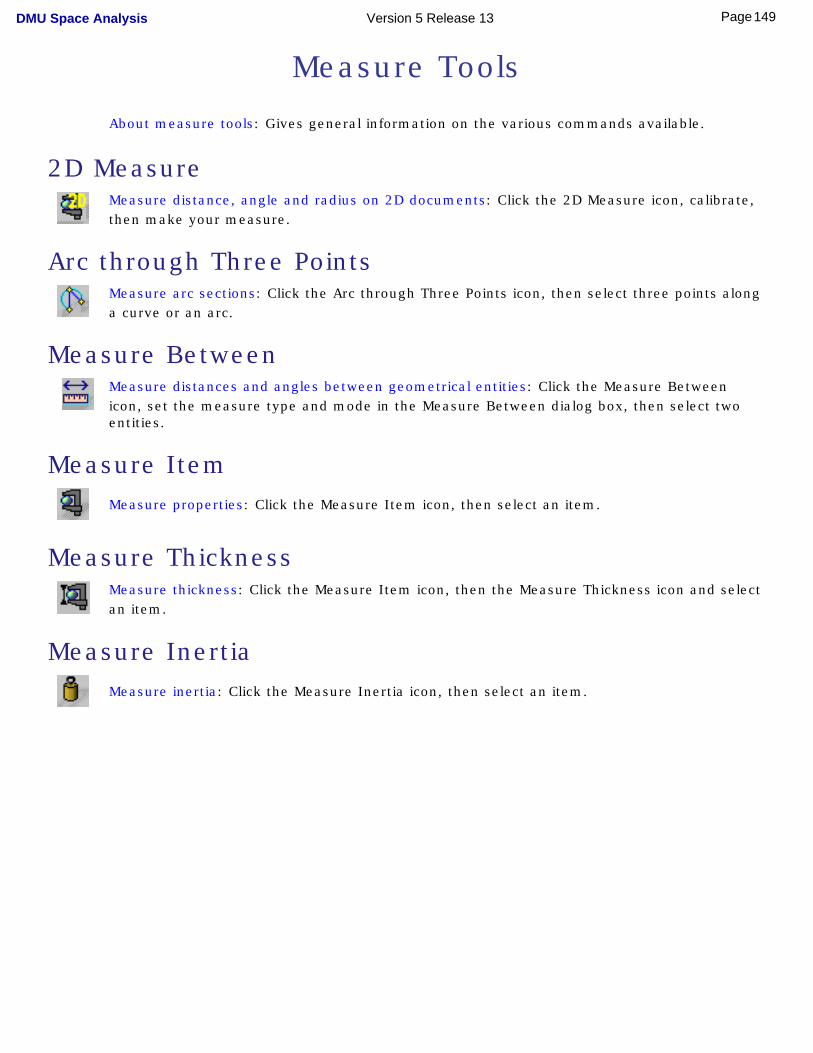
Measure Tools
About measure tools: Gives general information on the various commands available.
2D Measure
Measure distance, angle and radius on 2D documents: Click the 2D Measure icon, calibrate, then make your measure.
Arc through Three Points
Measure arc sections: Click the Arc through Three Points icon, then select three points along a curve or an arc.
Measure Between
Measure distances and angles between geometrical entities: Click the Measure Between icon, set the measure type and mode in the Measure Between dialog box, then select two entities.
Measure Item
Measure properties: Click the Measure Item icon, then select an item.
Measure Thickness
Measure thickness: Click the Measure Item icon, then the Measure Thickness icon and select an item.
Measure Inertia
Measure inertia: Click the Measure Inertia icon, then select an item.
149Page DMU Space Analysis Version 5 Release 13
About Measure Tools
A certain number of generic tools are supplied with DMU Space Analysis. These tools let you measure the minimum distance and angle between geometrical entities or points, properties associated to selected items, and the moments of inertia, density and mass of items.
You can also measure the length, radius and angle of an arc drawn through three points as well as measure distances, angles and the radius on 2D documents of both pixel and vector type.
Note: In the No Show space, measure commands are not accessible.
Shading with Edges
To get the most out of these tools, set the Render Style to Shading with Edges. The various command options work differently depending on the selected render style.
Measure Between and Measure Item commands
Measure Between and Measure Item offer a complete set of exact measurements on and between products, parts and features, as well as on all types of 3D formats, including in Visualization mode and for CGR files.
Exact measures are also available on V4 skins.These commands also offer an approximate mode for faster calculation.
Measure Between and Measure Item are useful when performing sectioning operations to, for example, annotate the generated section. To do so, check the Keep Measure box.
150Page DMU Space Analysis Version 5 Release 13
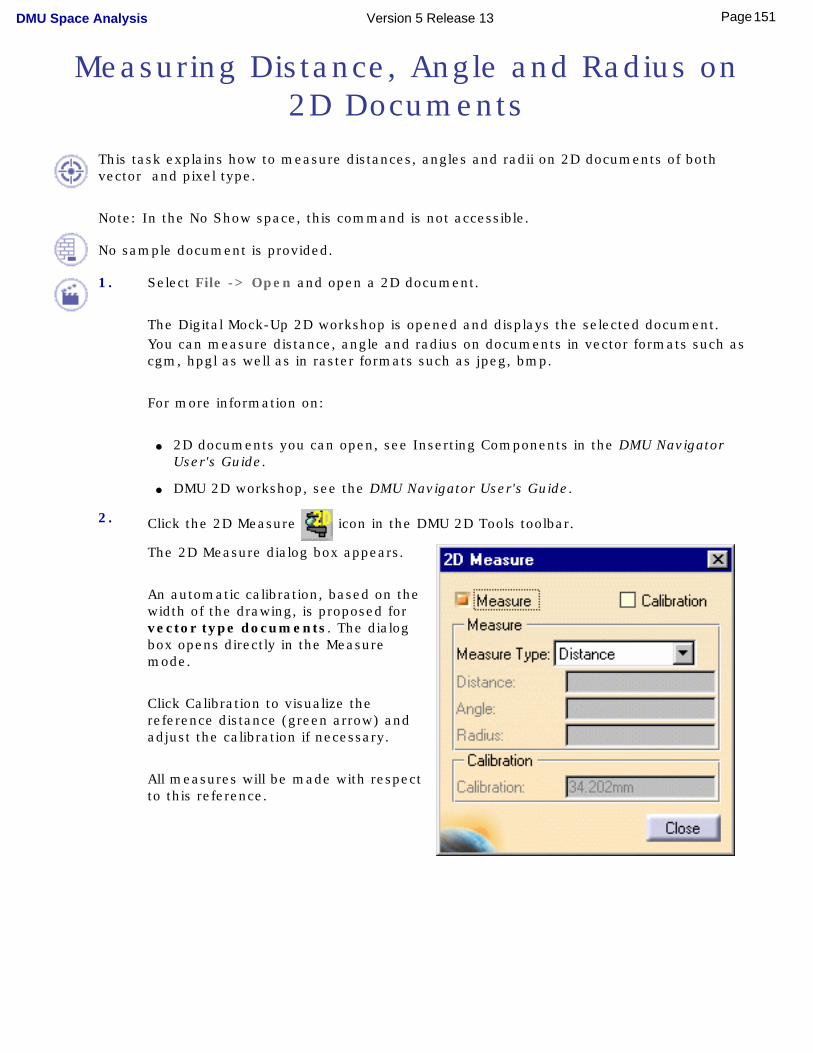
Measuring Distance, Angle and Radius on 2D Documents
This task explains how to measure distances, angles and radii on 2D documents of both vector and pixel type.
Note: In the No Show space, this command is not accessible.
No sample document is provided.
1. Select File -> Open and open a 2D document.
The Digital Mock-Up 2D workshop is opened and displays the selected document. You can measure distance, angle and radius on documents in vector formats such as cgm, hpgl as well as in raster formats such as jpeg, bmp.
For more information on:
● 2D documents you can open, see Inserting Components in the DMU Navigator User's Guide.
● DMU 2D workshop, see the DMU Navigator User's Guide.
2. Click the 2D Measure icon in the DMU 2D Tools toolbar.
The 2D Measure dialog box appears.
An automatic calibration, based on the width of the drawing, is proposed for vector type documents. The dialog box opens directly in the Measure mode.
Click Calibration to visualize the reference distance (green arrow) and adjust the calibration if necessary.
All measures will be made with respect to this reference.
151Page DMU Space Analysis Version 5 Release 13
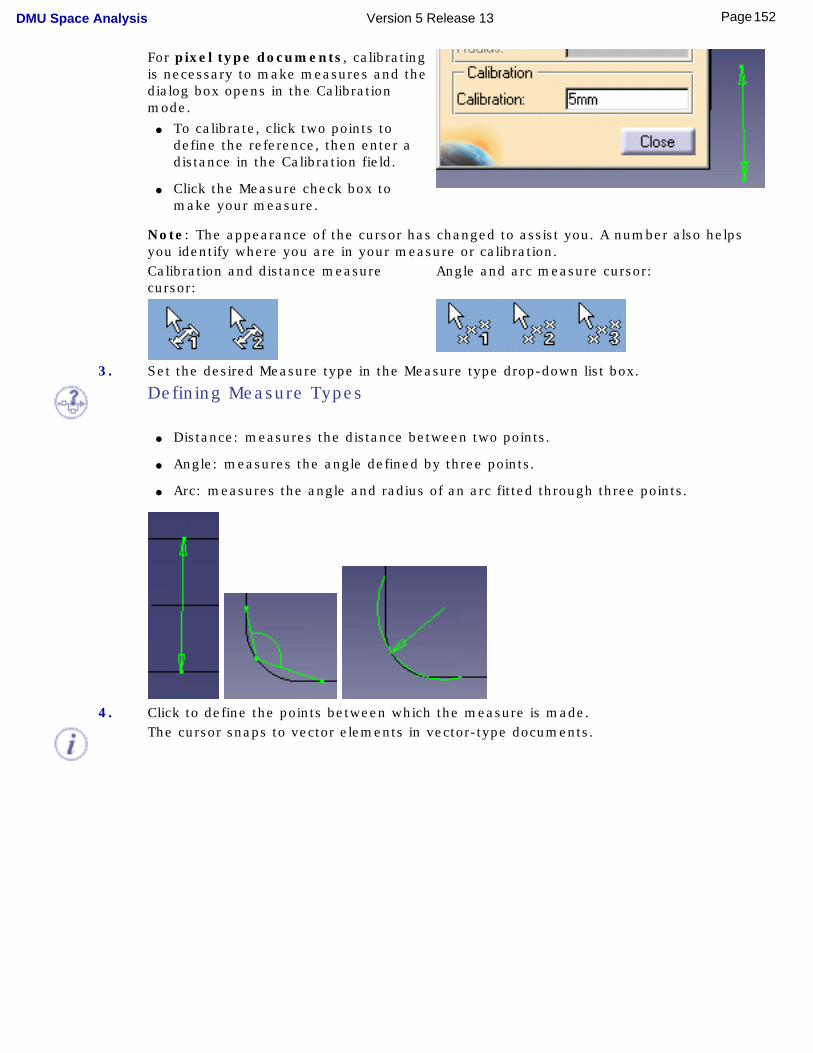
For pixel type documents, calibrating is necessary to make measures and the dialog box opens in the Calibration mode.
● To calibrate, click two points to define the reference, then enter a distance in the Calibration field.
● Click the Measure check box to make your measure.
Note: The appearance of the cursor has changed to assist you. A number also helps you identify where you are in your measure or calibration.Calibration and distance measure cursor:
Angle and arc measure cursor:
3. Set the desired Measure type in the Measure type drop-down list box.
Defining Measure Types
● Distance: measures the distance between two points.
● Angle: measures the angle defined by three points.
● Arc: measures the angle and radius of an arc fitted through three points.
4. Click to define the points between which the measure is made.
The cursor snaps to vector elements in vector-type documents.
152Page DMU Space Analysis Version 5 Release 13
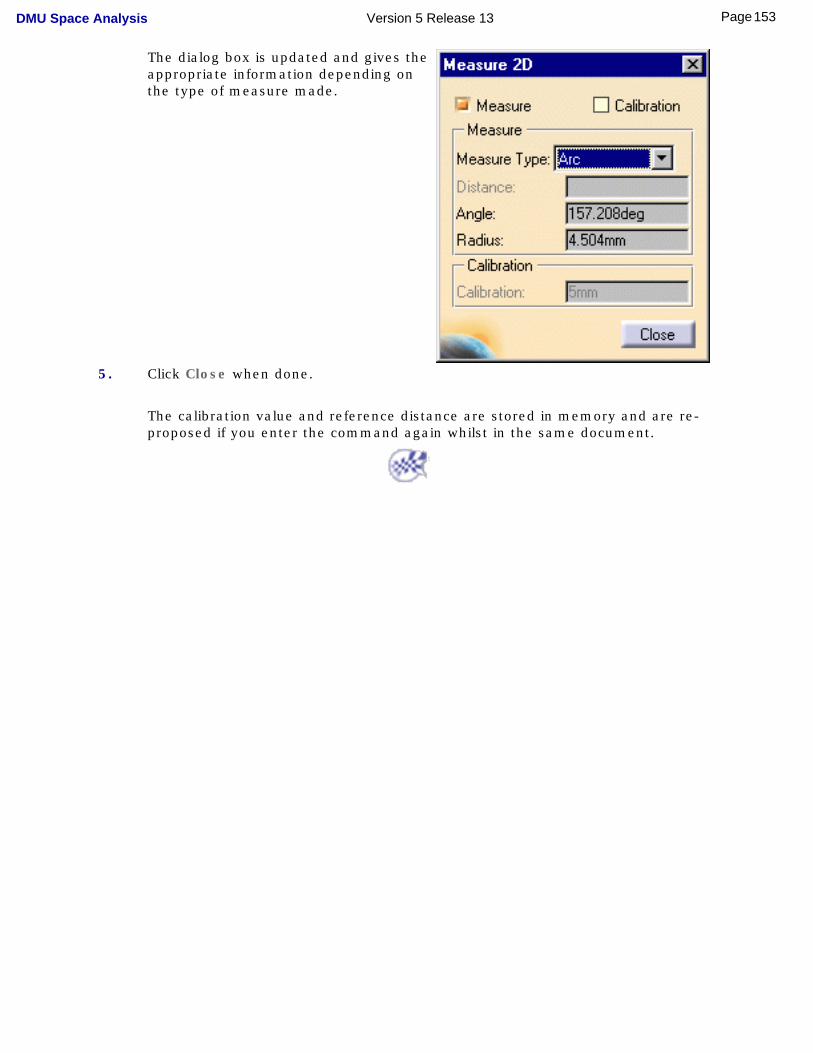
The dialog box is updated and gives the appropriate information depending on the type of measure made.
5. Click Close when done.
The calibration value and reference distance are stored in memory and are re-proposed if you enter the command again whilst in the same document.
153Page DMU Space Analysis Version 5 Release 13

Measuring Arc Sections
This task explains how to measure the length, radius and angles of an arc drawn through three points.
Insert the following sample model files: ATOMIZER.model, BODY1.model, BODY2.model, LOCK.model, NOZZLE1.model, NOZZLE2.model, REGULATION_COMMAND.model, REGULATOR.model, TRIGGER.model and VALVE.model.
They are to be found in the online documentation filetree in the common functionalities samples folder cfyug/samples.
1. Click the Arc through Three Points icon in the DMU Space Analysis toolbar or
select Analyze -> Arc through Three Points from the menu bar:
The Measure Arc Section dialog box appears.
● A Keep Measure option in the dialog box lets you keep the current and subsequent measures as features. This is useful if you want to keep the measures as annotations for example.
● Double-clicking an existing measure lets you re-edit the presentation of the measure, review information in the dialog box or delete measures.
154Page DMU Space Analysis Version 5 Release 13
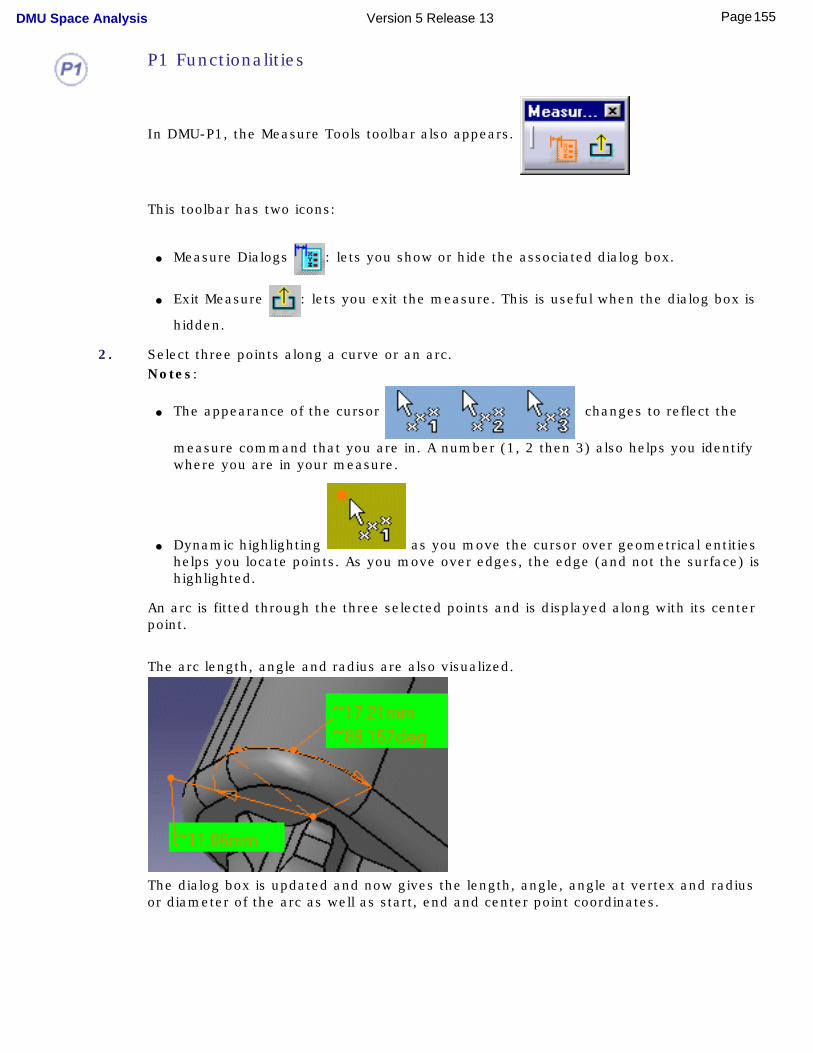
P1 Functionalities
In DMU-P1, the Measure Tools toolbar also appears.
This toolbar has two icons:
● Measure Dialogs : lets you show or hide the associated dialog box.
● Exit Measure : lets you exit the measure. This is useful when the dialog box is
hidden.
2. Select three points along a curve or an arc.Notes:
● The appearance of the cursor changes to reflect the
measure command that you are in. A number (1, 2 then 3) also helps you identify where you are in your measure.
● Dynamic highlighting as you move the cursor over geometrical entities helps you locate points. As you move over edges, the edge (and not the surface) is highlighted.
An arc is fitted through the three selected points and is displayed along with its center point.
The arc length, angle and radius are also visualized.
The dialog box is updated and now gives the length, angle, angle at vertex and radius or diameter of the arc as well as start, end and center point coordinates.
155Page DMU Space Analysis Version 5 Release 13
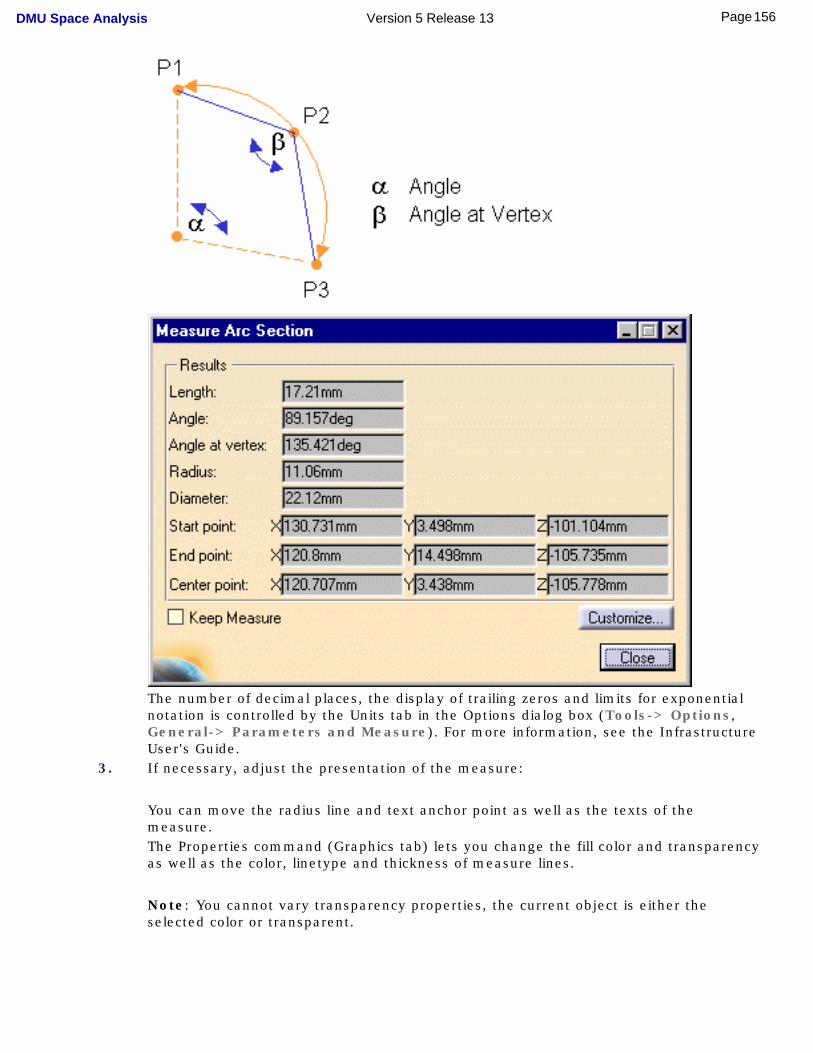
The number of decimal places, the display of trailing zeros and limits for exponential notation is controlled by the Units tab in the Options dialog box (Tools-> Options, General-> Parameters and Measure). For more information, see the Infrastructure User's Guide.
3. If necessary, adjust the presentation of the measure:
You can move the radius line and text anchor point as well as the texts of the measure.The Properties command (Graphics tab) lets you change the fill color and transparency as well as the color, linetype and thickness of measure lines.
Note: You cannot vary transparency properties, the current object is either the selected color or transparent.
156Page DMU Space Analysis Version 5 Release 13
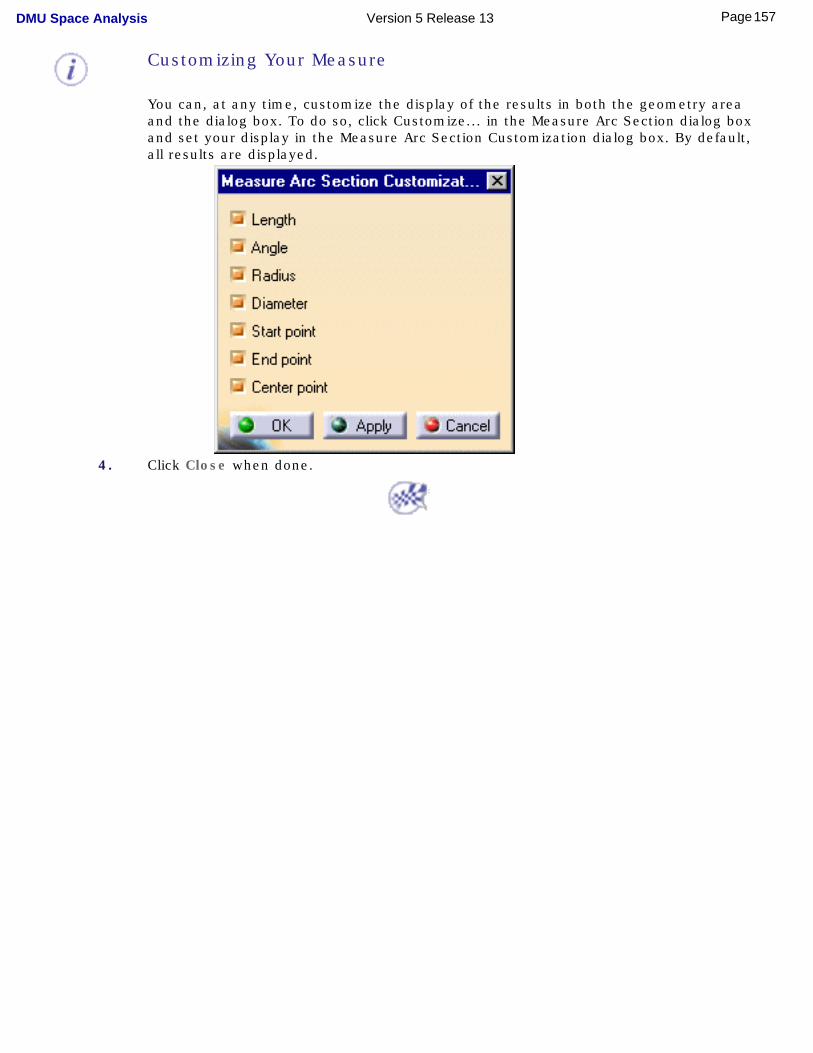
Customizing Your Measure
You can, at any time, customize the display of the results in both the geometry area and the dialog box. To do so, click Customize... in the Measure Arc Section dialog box and set your display in the Measure Arc Section Customization dialog box. By default, all results are displayed.
4. Click Close when done.
157Page DMU Space Analysis Version 5 Release 13
Measuring Distances between Geometrical Entities The Measure Between command lets you measure distance between geometrical entities. You can measure:
● Minimum distance and, if applicable angles, between points, surfaces, edges, vertices and entire productsOr,
● Maximum distance between two surfaces, two volumes or a surface and a volume.
This section deals with the following topics:
Measuring minimum distance and anglesMeasuring maximum distance
Measuring distances in a local axis systemCustomizing measure between
Editing measuresCreating geometry from measure results
Exact measures on CGRs and in visualization modeMeasuring exact anglesAssociative measures
Using measures in knowledgewareMeasure cursors
Insert the following sample model files: ATOMIZER.model, BODY1.model, BODY2.model, LOCK.model, NOZZLE1.model, NOZZLE2.model, REGULATION_COMMAND.model, REGULATOR.model, TRIGGER.model and VALVE.model.
They are to be found in the online documentation filetree in the common functionalities sample folder cfysa/samples.
Restriction: Neither Visualization Mode nor cgr files permit selection of individual vertices.
Note: In the No Show space, the Measure Between command is not accessible.
Measuring Minimum Distance and Angles This task explains how to measure minimum and, if applicable, angles between geometrical entities (points, surfaces,
edges, vertices and entire products).
1. Click the Measure Between icon.
In DMU, you can also select Analyze-> Measure Between from the menu bar.
The Measure Between dialog box appears.
158Page DMU Space Analysis Version 5 Release 13
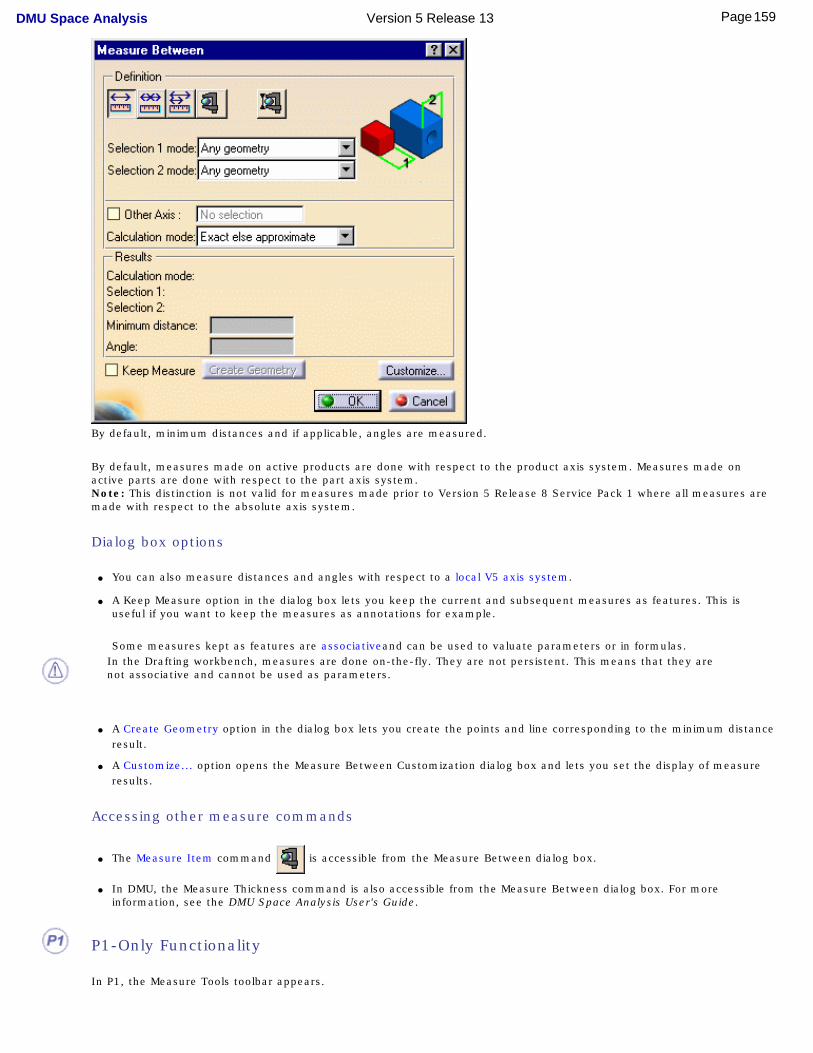
By default, minimum distances and if applicable, angles are measured.
By default, measures made on active products are done with respect to the product axis system. Measures made on active parts are done with respect to the part axis system. Note: This distinction is not valid for measures made prior to Version 5 Release 8 Service Pack 1 where all measures are made with respect to the absolute axis system.
Dialog box options
● You can also measure distances and angles with respect to a local V5 axis system.
● A Keep Measure option in the dialog box lets you keep the current and subsequent measures as features. This is useful if you want to keep the measures as annotations for example.
Some measures kept as features are associativeand can be used to valuate parameters or in formulas.In the Drafting workbench, measures are done on-the-fly. They are not persistent. This means that they are not associative and cannot be used as parameters.
● A Create Geometry option in the dialog box lets you create the points and line corresponding to the minimum distance
result.
● A Customize... option opens the Measure Between Customization dialog box and lets you set the display of measure results.
Accessing other measure commands
● The Measure Item command is accessible from the Measure Between dialog box.
● In DMU, the Measure Thickness command is also accessible from the Measure Between dialog box. For more information, see the DMU Space Analysis User's Guide.
P1-Only Functionality
In P1, the Measure Tools toolbar appears.
159Page DMU Space Analysis Version 5 Release 13
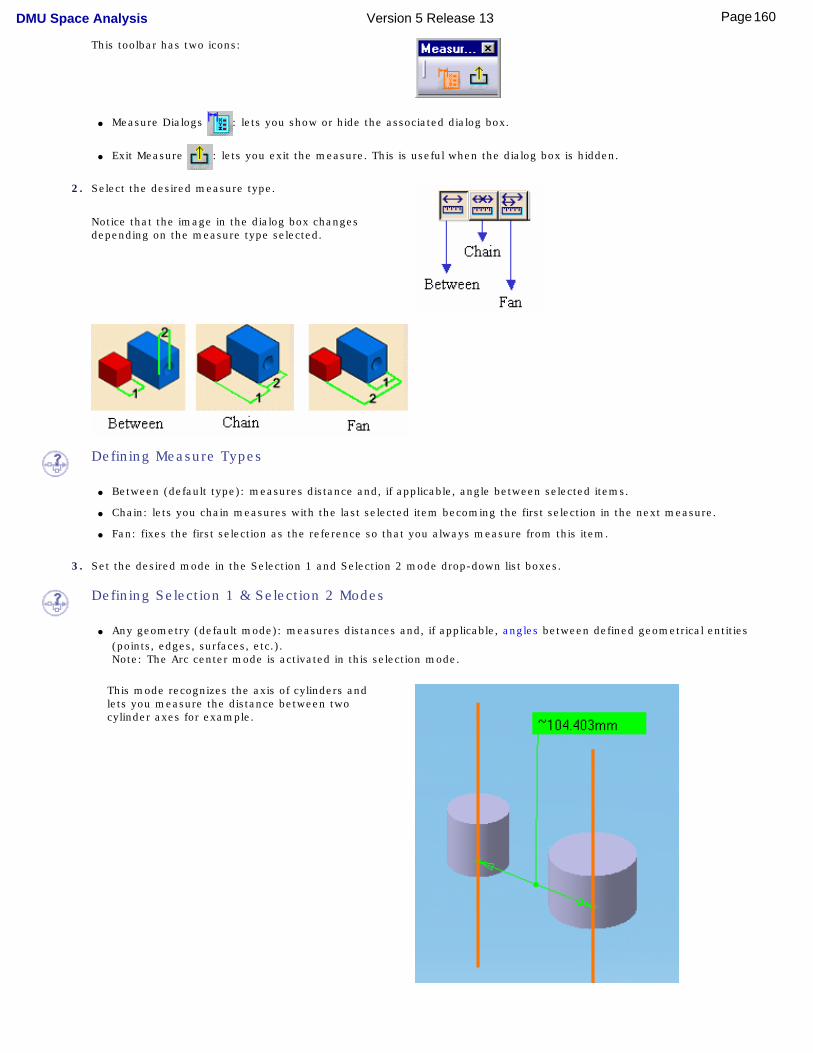
This toolbar has two icons:
● Measure Dialogs : lets you show or hide the associated dialog box.
● Exit Measure : lets you exit the measure. This is useful when the dialog box is hidden.
2. Select the desired measure type.
Notice that the image in the dialog box changes depending on the measure type selected.
Defining Measure Types
● Between (default type): measures distance and, if applicable, angle between selected items.
● Chain: lets you chain measures with the last selected item becoming the first selection in the next measure.
● Fan: fixes the first selection as the reference so that you always measure from this item.
3. Set the desired mode in the Selection 1 and Selection 2 mode drop-down list boxes.
Defining Selection 1 & Selection 2 Modes
● Any geometry (default mode): measures distances and, if applicable, angles between defined geometrical entities (points, edges, surfaces, etc.). Note: The Arc center mode is activated in this selection mode.
This mode recognizes the axis of cylinders and lets you measure the distance between two cylinder axes for example.
160Page DMU Space Analysis Version 5 Release 13
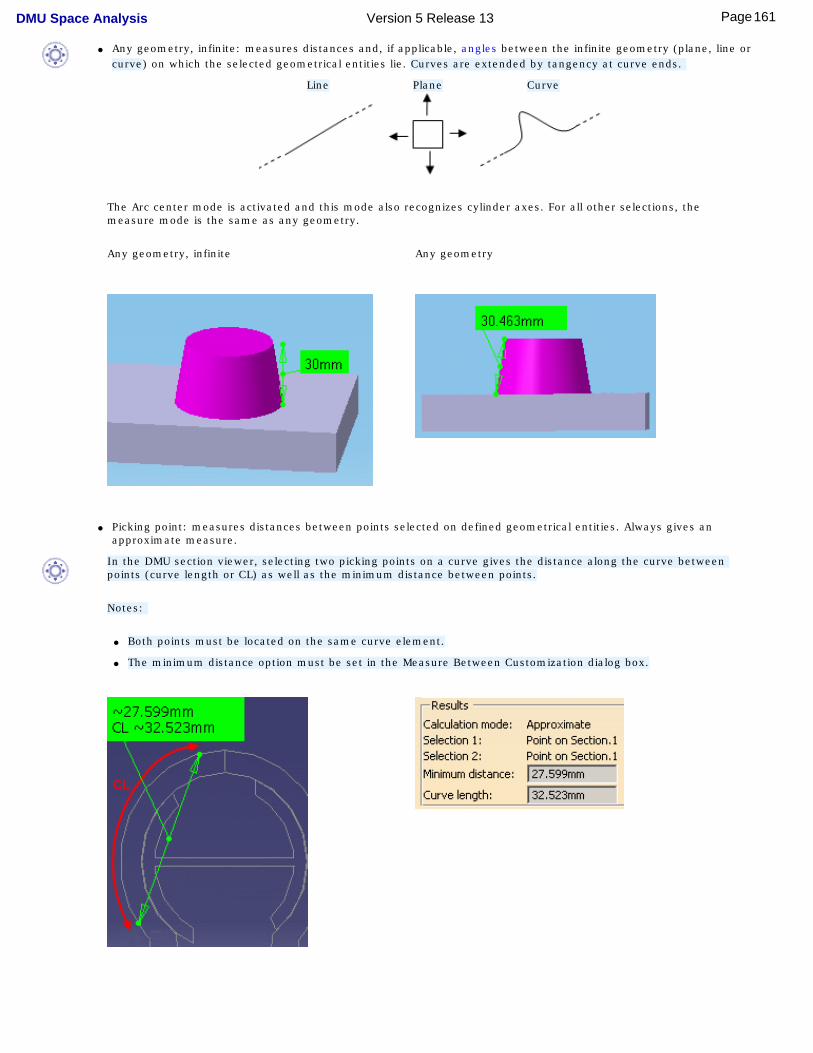
● Any geometry, infinite: measures distances and, if applicable, angles between the infinite geometry (plane, line or curve) on which the selected geometrical entities lie. Curves are extended by tangency at curve ends.
Line Plane Curve
The Arc center mode is activated and this mode also recognizes cylinder axes. For all other selections, the measure mode is the same as any geometry.
Any geometry, infinite Any geometry
● Picking point: measures distances between points selected on defined geometrical entities. Always gives an approximate measure.
In the DMU section viewer, selecting two picking points on a curve gives the distance along the curve between points (curve length or CL) as well as the minimum distance between points.
Notes:
● Both points must be located on the same curve element.
● The minimum distance option must be set in the Measure Between Customization dialog box.
161Page DMU Space Analysis Version 5 Release 13
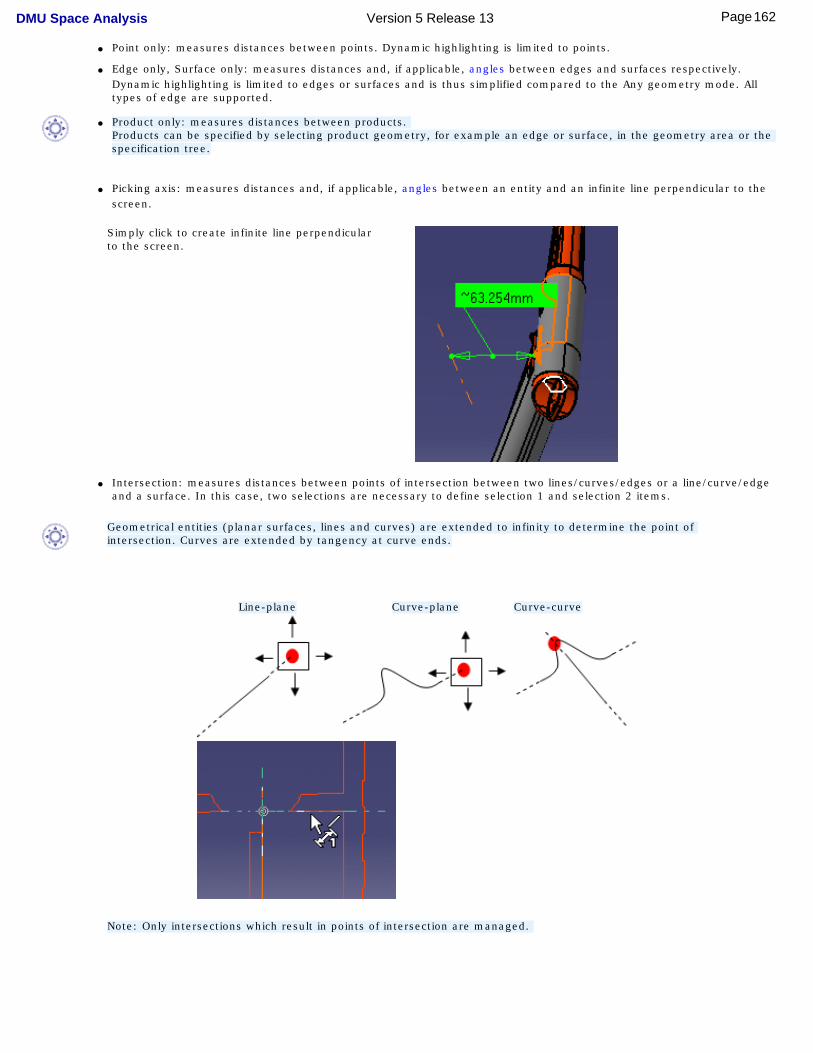
● Point only: measures distances between points. Dynamic highlighting is limited to points.
● Edge only, Surface only: measures distances and, if applicable, angles between edges and surfaces respectively. Dynamic highlighting is limited to edges or surfaces and is thus simplified compared to the Any geometry mode. All types of edge are supported.
● Product only: measures distances between products.
Products can be specified by selecting product geometry, for example an edge or surface, in the geometry area or the specification tree.
● Picking axis: measures distances and, if applicable, angles between an entity and an infinite line perpendicular to the screen.
Simply click to create infinite line perpendicular to the screen.
● Intersection: measures distances between points of intersection between two lines/curves/edges or a line/curve/edge and a surface. In this case, two selections are necessary to define selection 1 and selection 2 items.
Geometrical entities (planar surfaces, lines and curves) are extended to infinity to determine the point of intersection. Curves are extended by tangency at curve ends.
Line-plane Curve-plane Curve-curve
Note: Only intersections which result in points of intersection are managed.
162Page DMU Space Analysis Version 5 Release 13
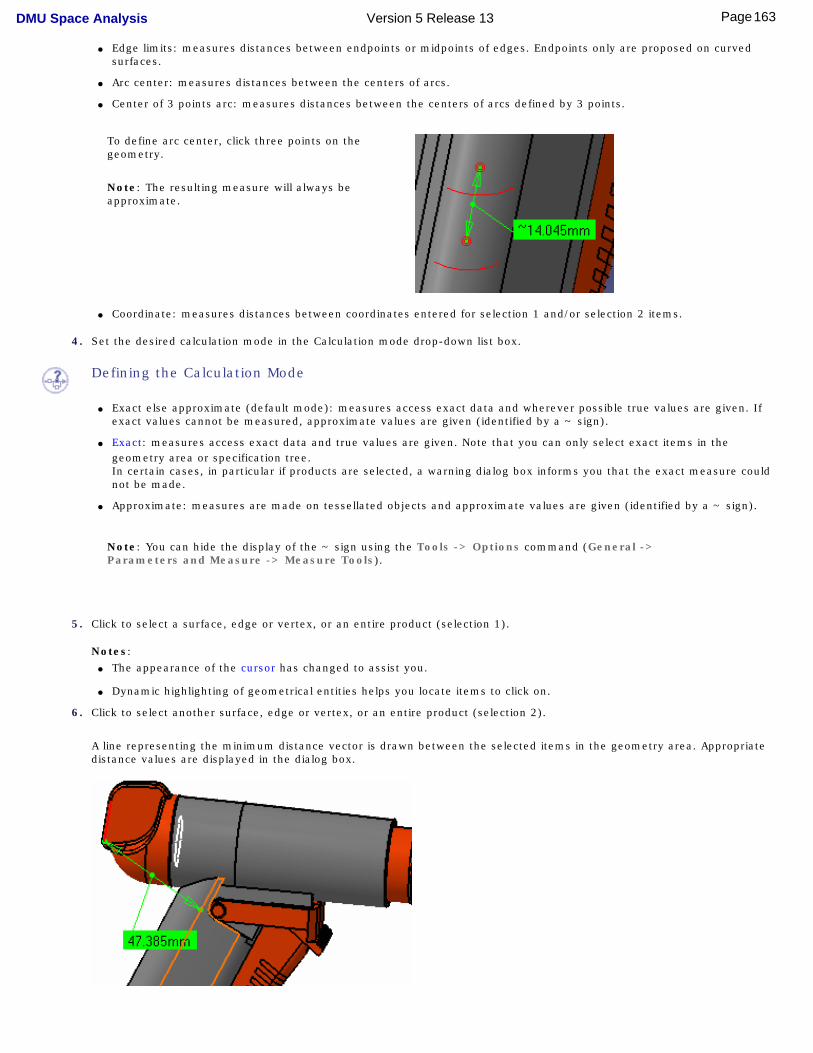
● Edge limits: measures distances between endpoints or midpoints of edges. Endpoints only are proposed on curved surfaces.
● Arc center: measures distances between the centers of arcs.
● Center of 3 points arc: measures distances between the centers of arcs defined by 3 points.
To define arc center, click three points on the geometry.
Note: The resulting measure will always be approximate.
● Coordinate: measures distances between coordinates entered for selection 1 and/or selection 2 items.
4. Set the desired calculation mode in the Calculation mode drop-down list box.
Defining the Calculation Mode
● Exact else approximate (default mode): measures access exact data and wherever possible true values are given. If exact values cannot be measured, approximate values are given (identified by a ~ sign).
● Exact: measures access exact data and true values are given. Note that you can only select exact items in the geometry area or specification tree.In certain cases, in particular if products are selected, a warning dialog box informs you that the exact measure could not be made.
● Approximate: measures are made on tessellated objects and approximate values are given (identified by a ~ sign).
Note: You can hide the display of the ~ sign using the Tools -> Options command (General -> Parameters and Measure -> Measure Tools).
5. Click to select a surface, edge or vertex, or an entire product (selection 1).
Notes: ● The appearance of the cursor has changed to assist you.
● Dynamic highlighting of geometrical entities helps you locate items to click on.
6. Click to select another surface, edge or vertex, or an entire product (selection 2).
A line representing the minimum distance vector is drawn between the selected items in the geometry area. Appropriate distance values are displayed in the dialog box.
163Page DMU Space Analysis Version 5 Release 13
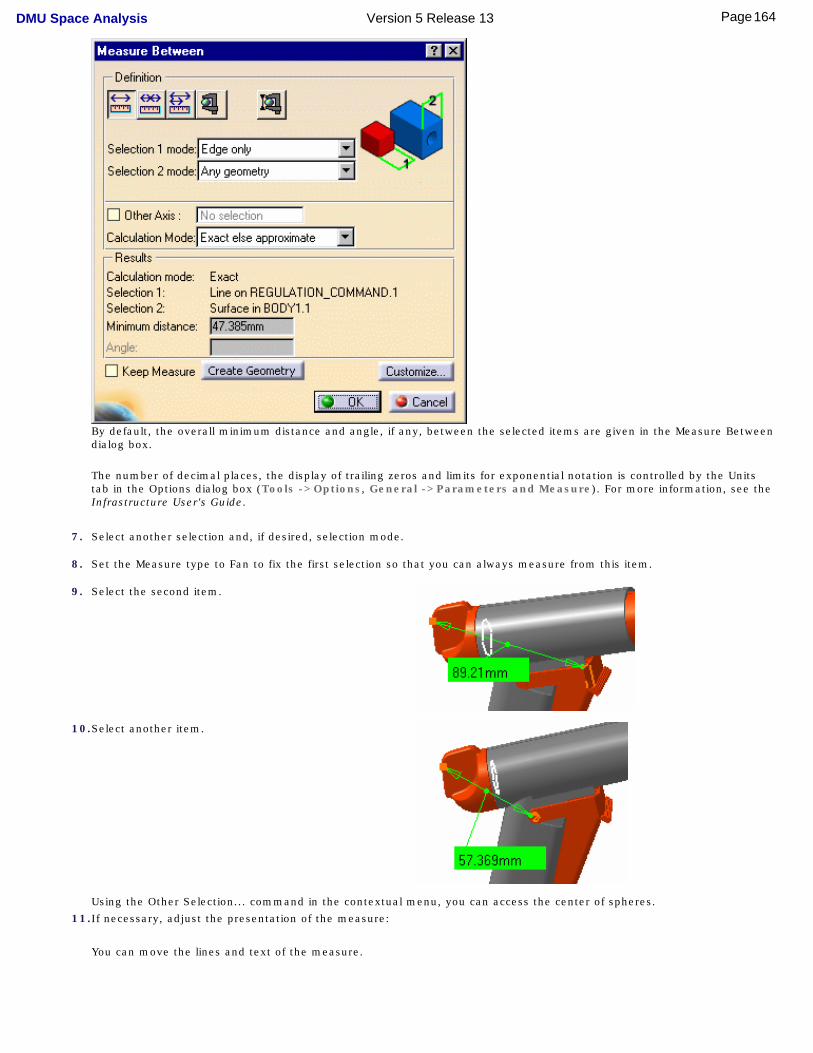
By default, the overall minimum distance and angle, if any, between the selected items are given in the Measure Between dialog box.
The number of decimal places, the display of trailing zeros and limits for exponential notation is controlled by the Units tab in the Options dialog box (Tools ->Options, General ->Parameters and Measure). For more information, see the Infrastructure User's Guide.
7. Select another selection and, if desired, selection mode.
8. Set the Measure type to Fan to fix the first selection so that you can always measure from this item.
9. Select the second item.
10.Select another item.
Using the Other Selection... command in the contextual menu, you can access the center of spheres.
11.If necessary, adjust the presentation of the measure:
You can move the lines and text of the measure.
164Page DMU Space Analysis Version 5 Release 13
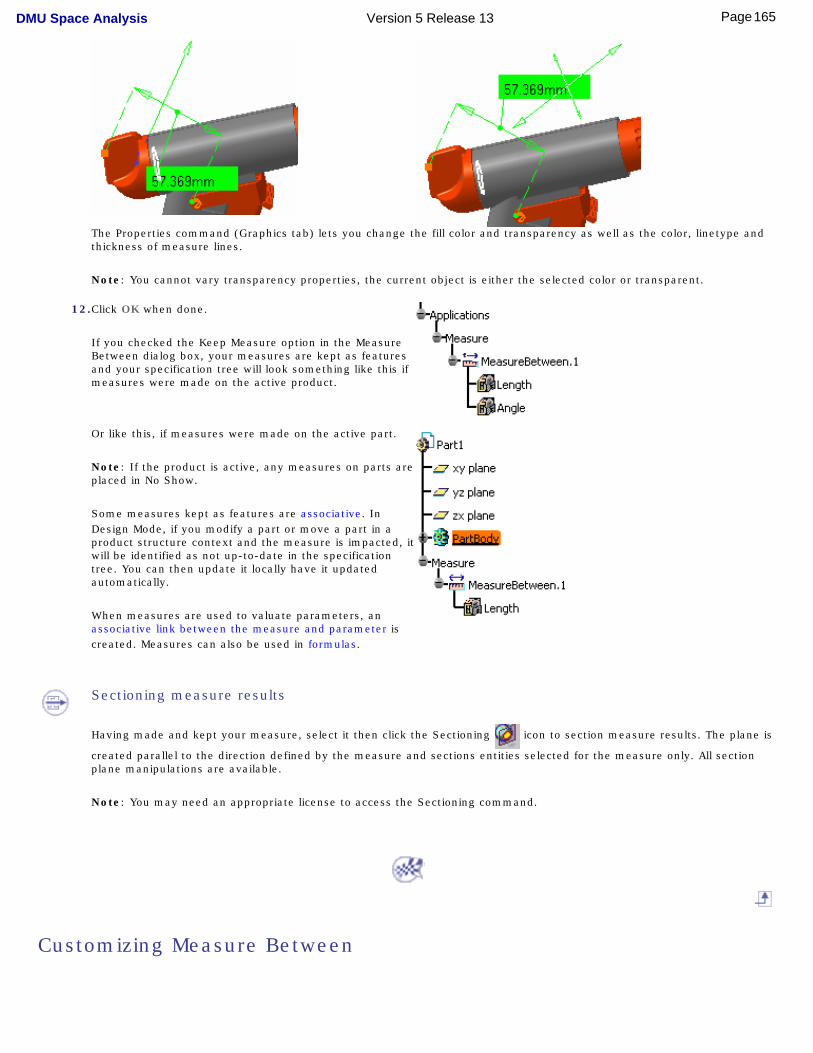
The Properties command (Graphics tab) lets you change the fill color and transparency as well as the color, linetype and thickness of measure lines.
Note: You cannot vary transparency properties, the current object is either the selected color or transparent.
12.Click OK when done.
If you checked the Keep Measure option in the Measure Between dialog box, your measures are kept as features and your specification tree will look something like this if measures were made on the active product.
Or like this, if measures were made on the active part.
Note: If the product is active, any measures on parts are placed in No Show.
Some measures kept as features are associative. In Design Mode, if you modify a part or move a part in a product structure context and the measure is impacted, it will be identified as not up-to-date in the specification tree. You can then update it locally have it updated automatically.
When measures are used to valuate parameters, an associative link between the measure and parameter is created. Measures can also be used in formulas.
Sectioning measure results
Having made and kept your measure, select it then click the Sectioning icon to section measure results. The plane is
created parallel to the direction defined by the measure and sections entities selected for the measure only. All section plane manipulations are available.
Note: You may need an appropriate license to access the Sectioning command.
Customizing Measure Between
165Page DMU Space Analysis Version 5 Release 13
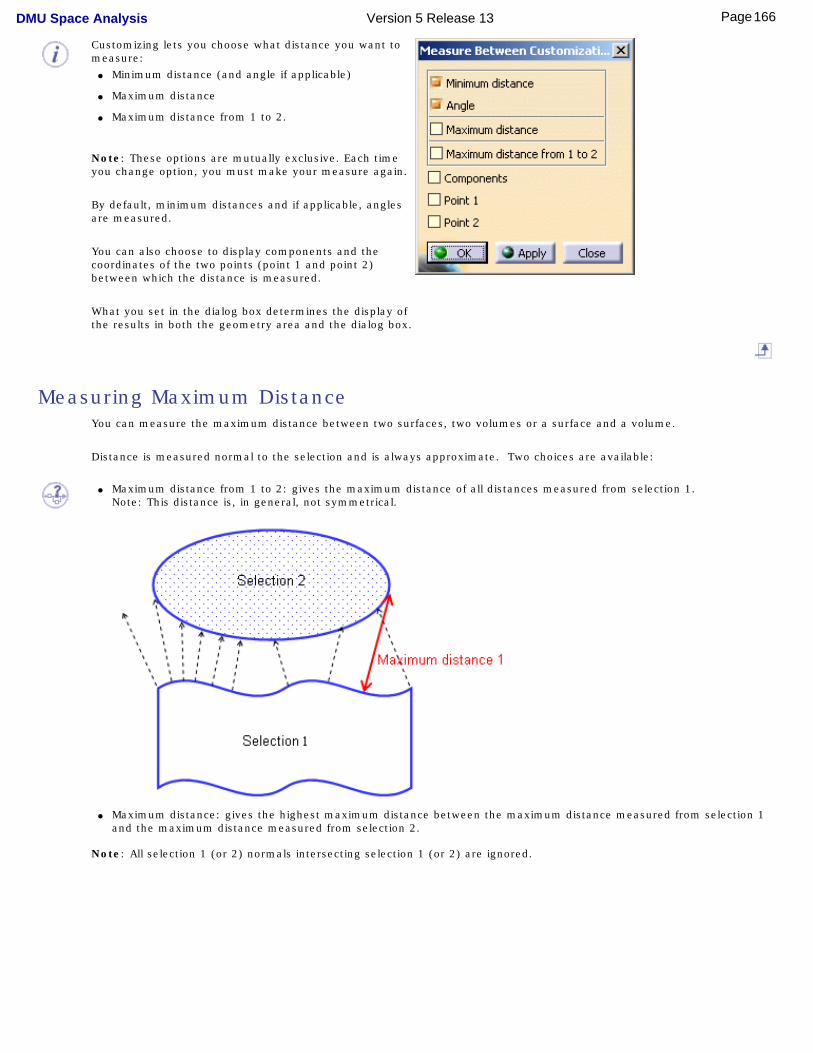
Customizing lets you choose what distance you want to measure:
● Minimum distance (and angle if applicable)
● Maximum distance
● Maximum distance from 1 to 2.
Note: These options are mutually exclusive. Each time you change option, you must make your measure again.
By default, minimum distances and if applicable, angles are measured.
You can also choose to display components and the coordinates of the two points (point 1 and point 2) between which the distance is measured.
What you set in the dialog box determines the display of the results in both the geometry area and the dialog box.
Measuring Maximum Distance You can measure the maximum distance between two surfaces, two volumes or a surface and a volume.
Distance is measured normal to the selection and is always approximate. Two choices are available:
● Maximum distance from 1 to 2: gives the maximum distance of all distances measured from selection 1.
Note: This distance is, in general, not symmetrical.
● Maximum distance: gives the highest maximum distance between the maximum distance measured from selection 1
and the maximum distance measured from selection 2.
Note: All selection 1 (or 2) normals intersecting selection 1 (or 2) are ignored.
166Page DMU Space Analysis Version 5 Release 13
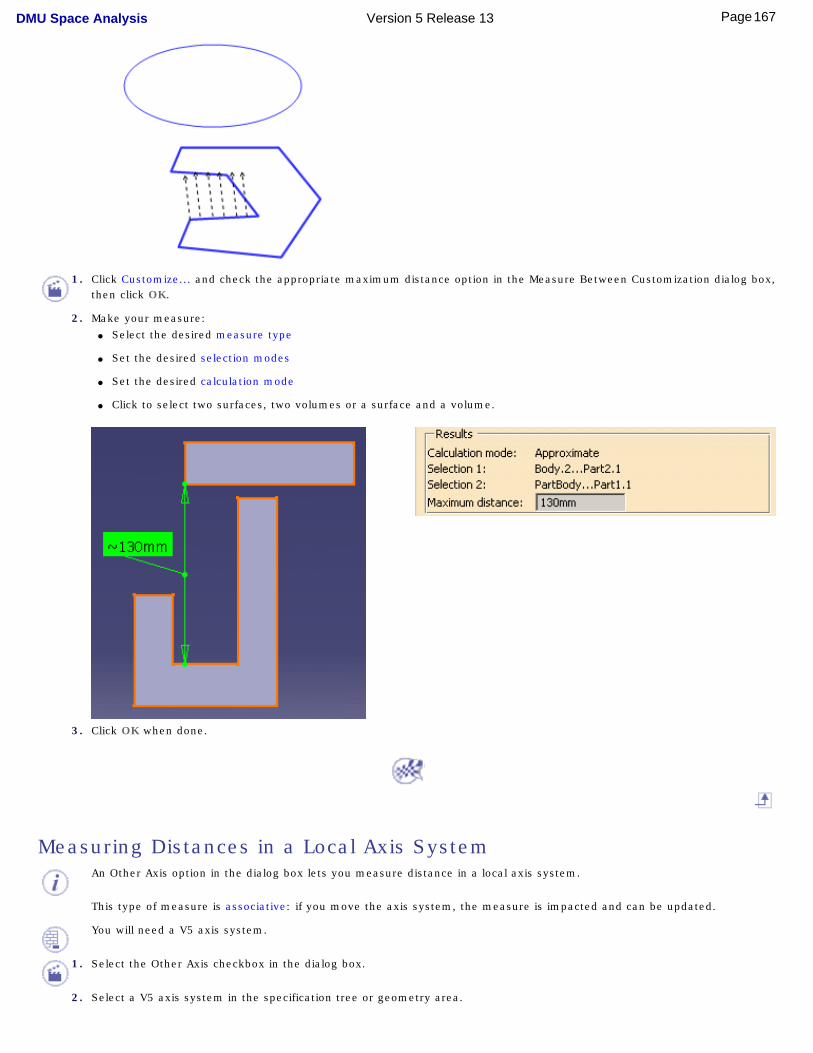
1. Click Customize... and check the appropriate maximum distance option in the Measure Between Customization dialog box, then click OK.
2. Make your measure:● Select the desired measure type
● Set the desired selection modes
● Set the desired calculation mode
● Click to select two surfaces, two volumes or a surface and a volume.
3. Click OK when done.
Measuring Distances in a Local Axis System An Other Axis option in the dialog box lets you measure distance in a local axis system.
This type of measure is associative: if you move the axis system, the measure is impacted and can be updated.
You will need a V5 axis system.
1. Select the Other Axis checkbox in the dialog box.
2. Select a V5 axis system in the specification tree or geometry area.
167Page DMU Space Analysis Version 5 Release 13
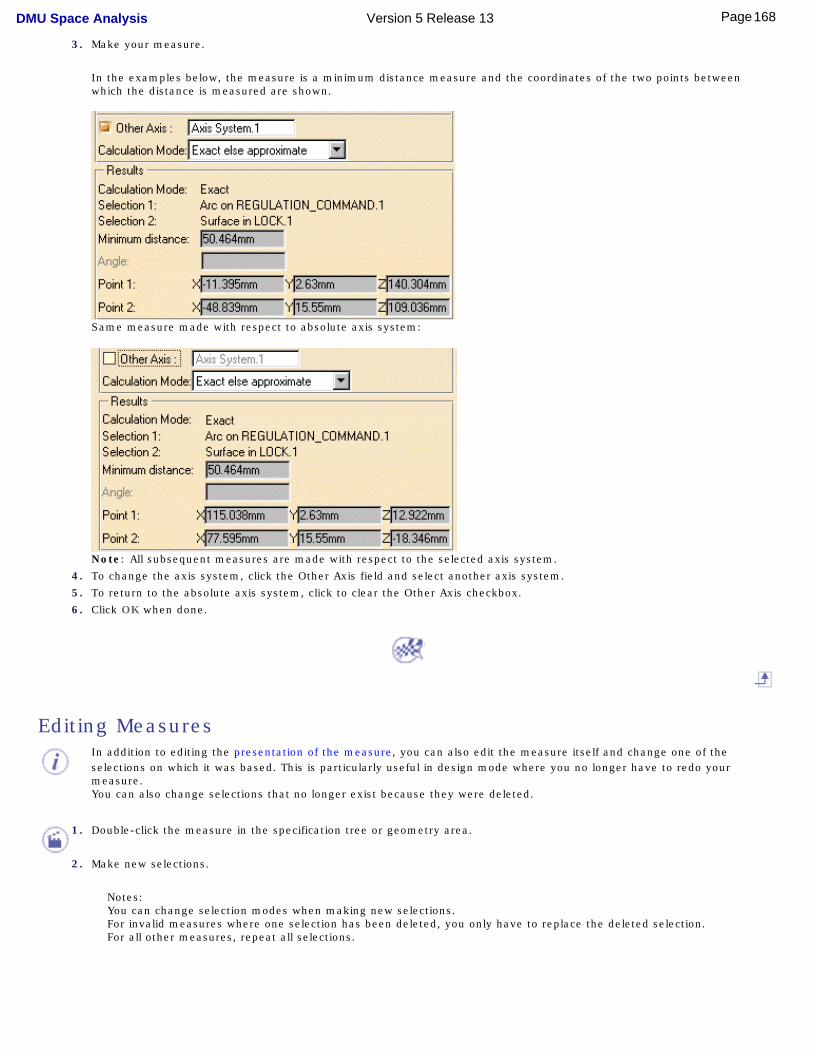
3. Make your measure.
In the examples below, the measure is a minimum distance measure and the coordinates of the two points between which the distance is measured are shown.
Same measure made with respect to absolute axis system:
Note: All subsequent measures are made with respect to the selected axis system.
4. To change the axis system, click the Other Axis field and select another axis system.
5. To return to the absolute axis system, click to clear the Other Axis checkbox.
6. Click OK when done.
Editing Measures In addition to editing the presentation of the measure, you can also edit the measure itself and change one of the
selections on which it was based. This is particularly useful in design mode where you no longer have to redo your measure. You can also change selections that no longer exist because they were deleted.
1. Double-click the measure in the specification tree or geometry area.
2. Make new selections.
Notes:You can change selection modes when making new selections.For invalid measures where one selection has been deleted, you only have to replace the deleted selection.For all other measures, repeat all selections.
168Page DMU Space Analysis Version 5 Release 13

3. Click OK when done.
169Page DMU Space Analysis Version 5 Release 13
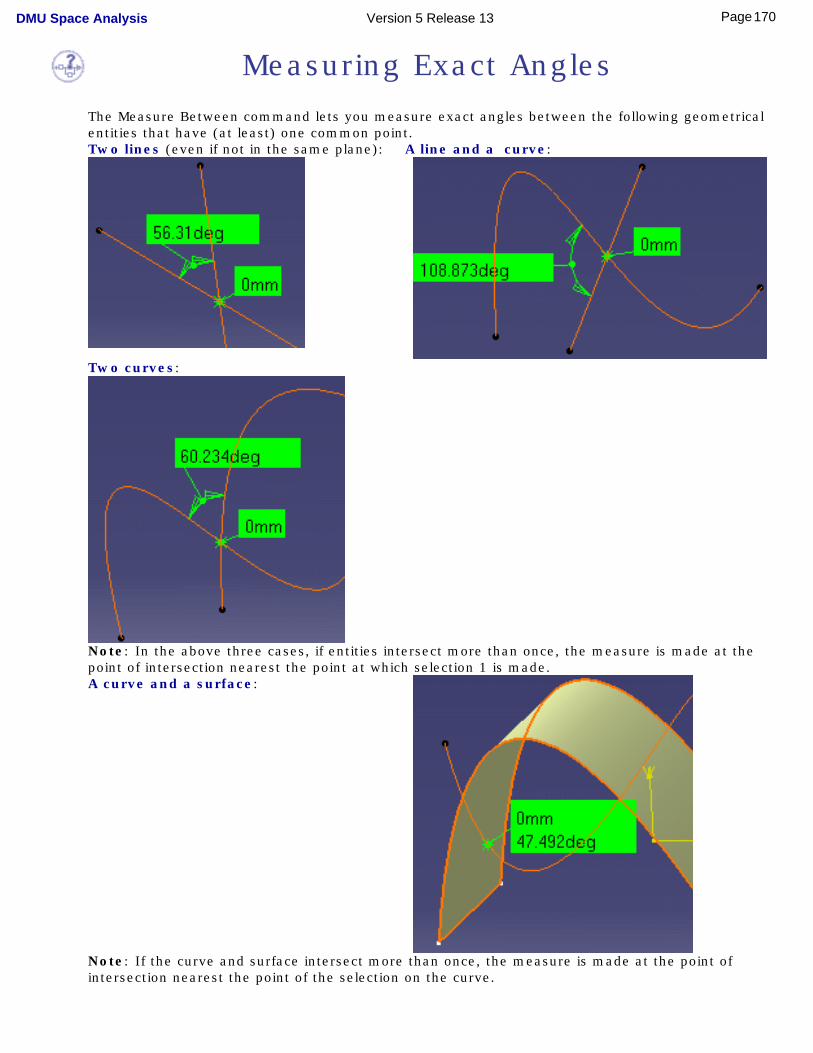
Measuring Exact AnglesThe Measure Between command lets you measure exact angles between the following geometrical entities that have (at least) one common point.Two lines (even if not in the same plane): A line and a curve:
Two curves:
Note: In the above three cases, if entities intersect more than once, the measure is made at the point of intersection nearest the point at which selection 1 is made.A curve and a surface:
Note: If the curve and surface intersect more than once, the measure is made at the point of intersection nearest the point of the selection on the curve.
170Page DMU Space Analysis Version 5 Release 13
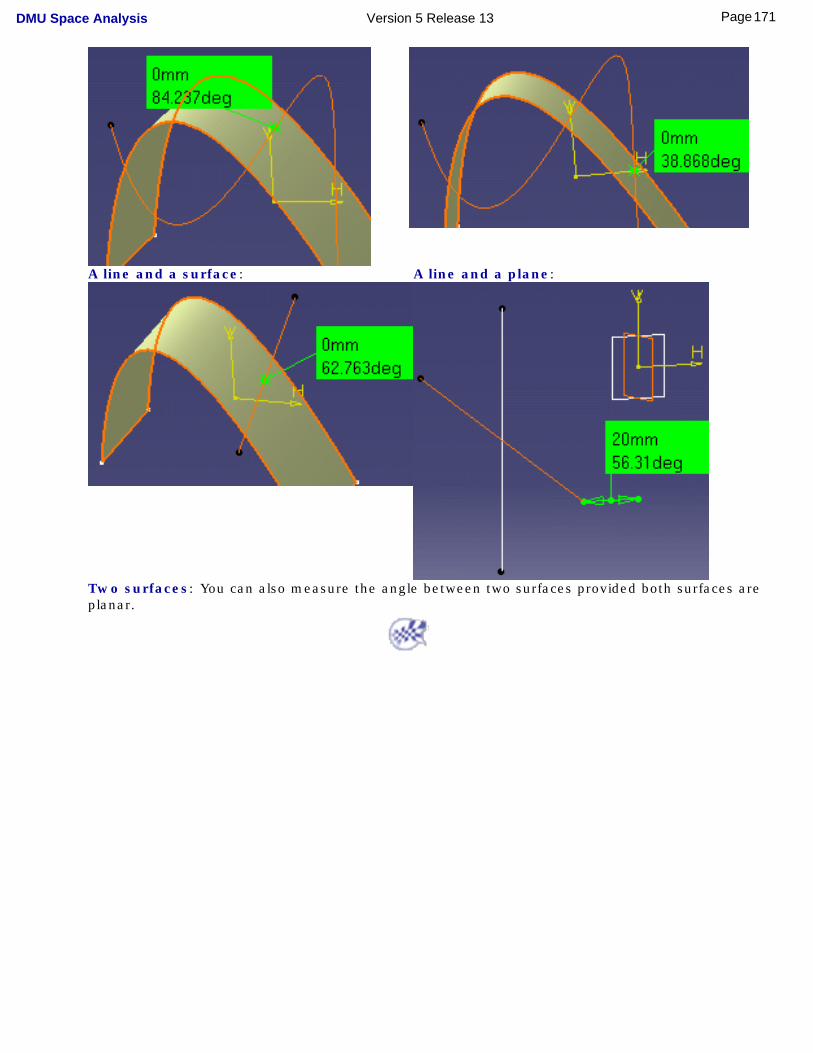
A line and a surface: A line and a plane:
Two surfaces: You can also measure the angle between two surfaces provided both surfaces are planar.
171Page DMU Space Analysis Version 5 Release 13
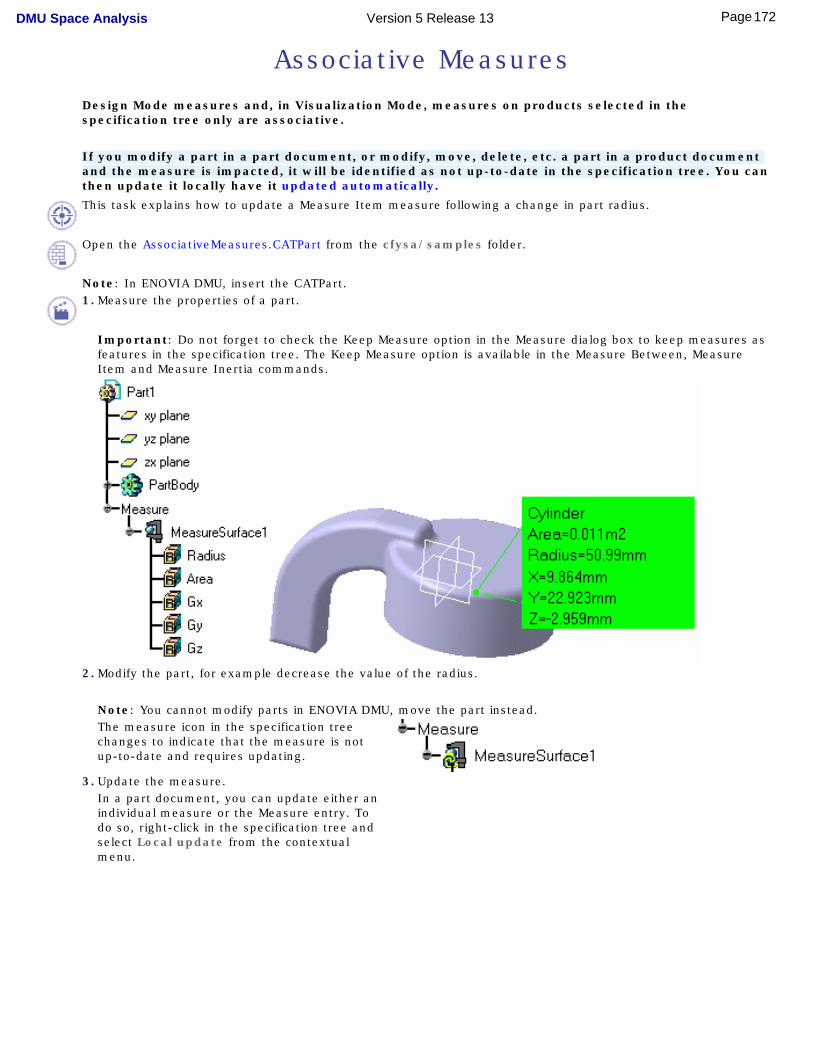
Associative Measures Design Mode measures and, in Visualization Mode, measures on products selected in the specification tree only are associative.
If you modify a part in a part document, or modify, move, delete, etc. a part in a product document and the measure is impacted, it will be identified as not up-to-date in the specification tree. You can then update it locally have it updated automatically.
This task explains how to update a Measure Item measure following a change in part radius.
Open the AssociativeMeasures.CATPart from the cfysa/samples folder.
Note: In ENOVIA DMU, insert the CATPart.1. Measure the properties of a part.
Important: Do not forget to check the Keep Measure option in the Measure dialog box to keep measures as features in the specification tree. The Keep Measure option is available in the Measure Between, Measure Item and Measure Inertia commands.
2. Modify the part, for example decrease the value of the radius.
Note: You cannot modify parts in ENOVIA DMU, move the part instead. The measure icon in the specification tree changes to indicate that the measure is not up-to-date and requires updating.
3. Update the measure.In a part document, you can update either an individual measure or the Measure entry. To do so, right-click in the specification tree and select Local update from the contextual menu.
172Page DMU Space Analysis Version 5 Release 13
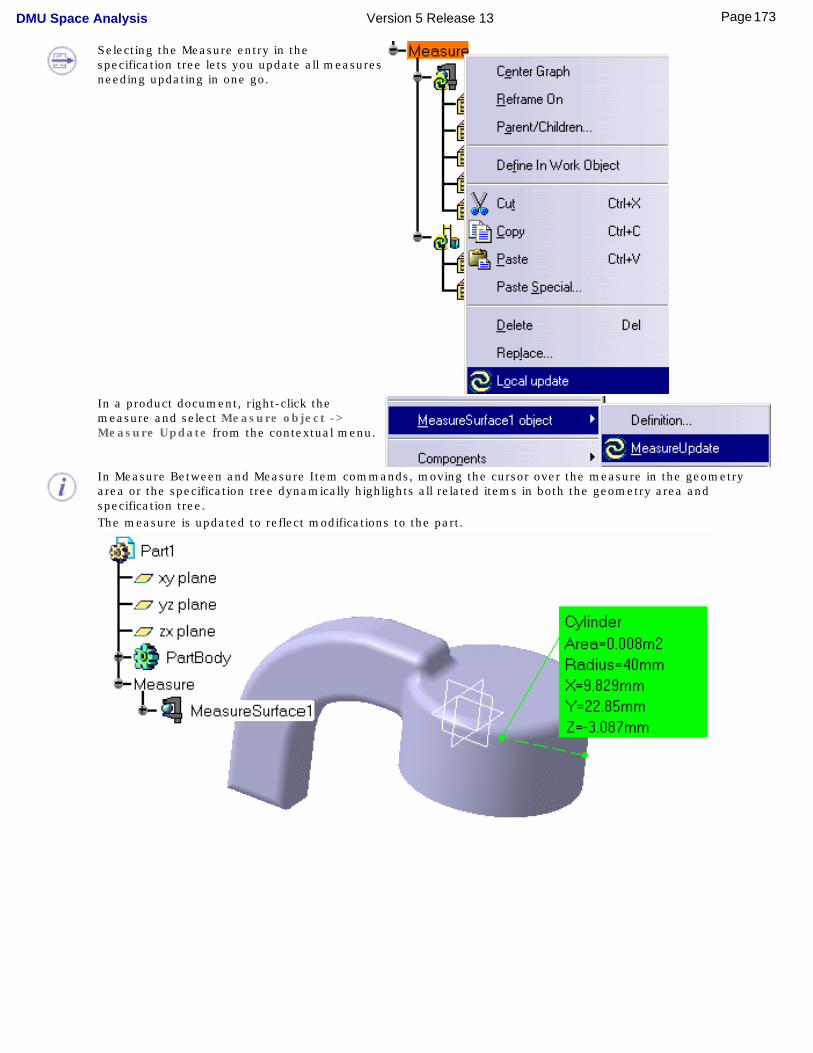
Selecting the Measure entry in the specification tree lets you update all measures needing updating in one go.
In a product document, right-click the measure and select Measure object -> Measure Update from the contextual menu.
In Measure Between and Measure Item commands, moving the cursor over the measure in the geometry area or the specification tree dynamically highlights all related items in both the geometry area and specification tree.The measure is updated to reflect modifications to the part.
173Page DMU Space Analysis Version 5 Release 13
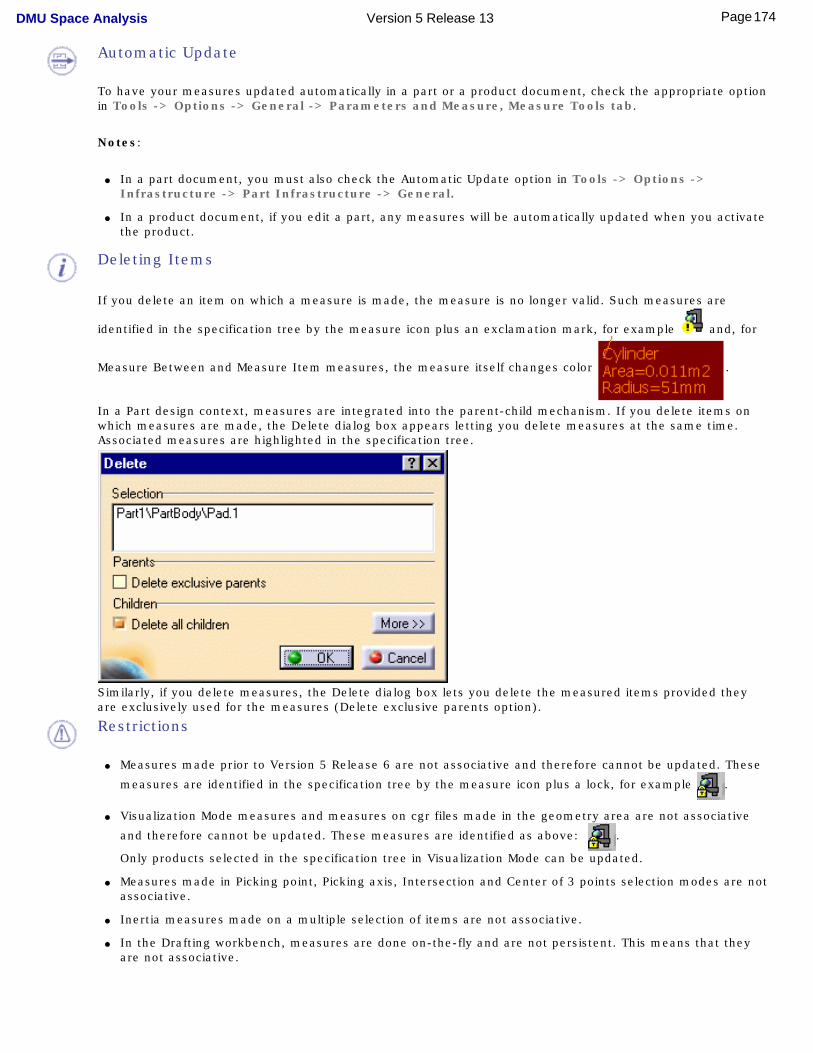
Automatic Update
To have your measures updated automatically in a part or a product document, check the appropriate option in Tools -> Options -> General -> Parameters and Measure, Measure Tools tab.
Notes:
● In a part document, you must also check the Automatic Update option in Tools -> Options -> Infrastructure -> Part Infrastructure -> General.
● In a product document, if you edit a part, any measures will be automatically updated when you activate the product.
Deleting Items
If you delete an item on which a measure is made, the measure is no longer valid. Such measures are
identified in the specification tree by the measure icon plus an exclamation mark, for example and, for
Measure Between and Measure Item measures, the measure itself changes color .
In a Part design context, measures are integrated into the parent-child mechanism. If you delete items on which measures are made, the Delete dialog box appears letting you delete measures at the same time. Associated measures are highlighted in the specification tree.
Similarly, if you delete measures, the Delete dialog box lets you delete the measured items provided they are exclusively used for the measures (Delete exclusive parents option).
Restrictions
● Measures made prior to Version 5 Release 6 are not associative and therefore cannot be updated. These
measures are identified in the specification tree by the measure icon plus a lock, for example .
● Visualization Mode measures and measures on cgr files made in the geometry area are not associative
and therefore cannot be updated. These measures are identified as above: .
Only products selected in the specification tree in Visualization Mode can be updated.
● Measures made in Picking point, Picking axis, Intersection and Center of 3 points selection modes are not associative.
● Inertia measures made on a multiple selection of items are not associative.
● In the Drafting workbench, measures are done on-the-fly and are not persistent. This means that they are not associative.
174Page DMU Space Analysis Version 5 Release 13
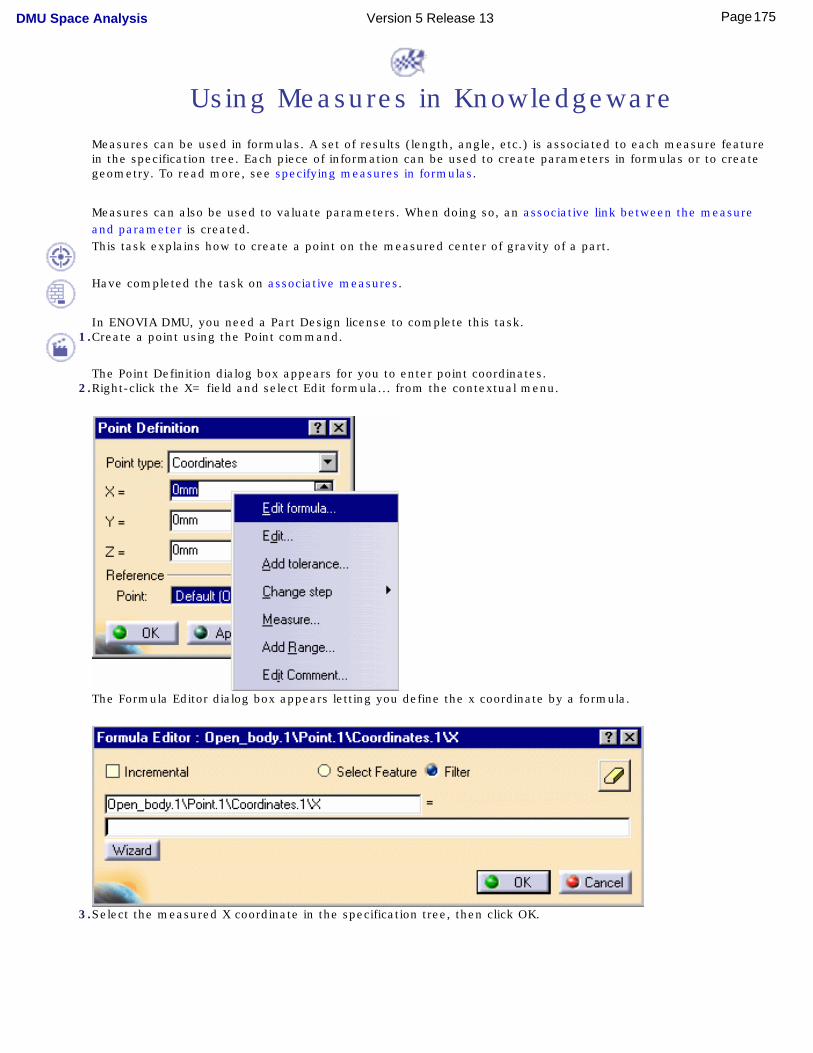
Using Measures in KnowledgewareMeasures can be used in formulas. A set of results (length, angle, etc.) is associated to each measure feature in the specification tree. Each piece of information can be used to create parameters in formulas or to create geometry. To read more, see specifying measures in formulas.
Measures can also be used to valuate parameters. When doing so, an associative link between the measure and parameter is created. This task explains how to create a point on the measured center of gravity of a part.
Have completed the task on associative measures.
In ENOVIA DMU, you need a Part Design license to complete this task.1.Create a point using the Point command.
The Point Definition dialog box appears for you to enter point coordinates. 2.Right-click the X= field and select Edit formula... from the contextual menu.
The Formula Editor dialog box appears letting you define the x coordinate by a formula.
3.Select the measured X coordinate in the specification tree, then click OK.
175Page DMU Space Analysis Version 5 Release 13
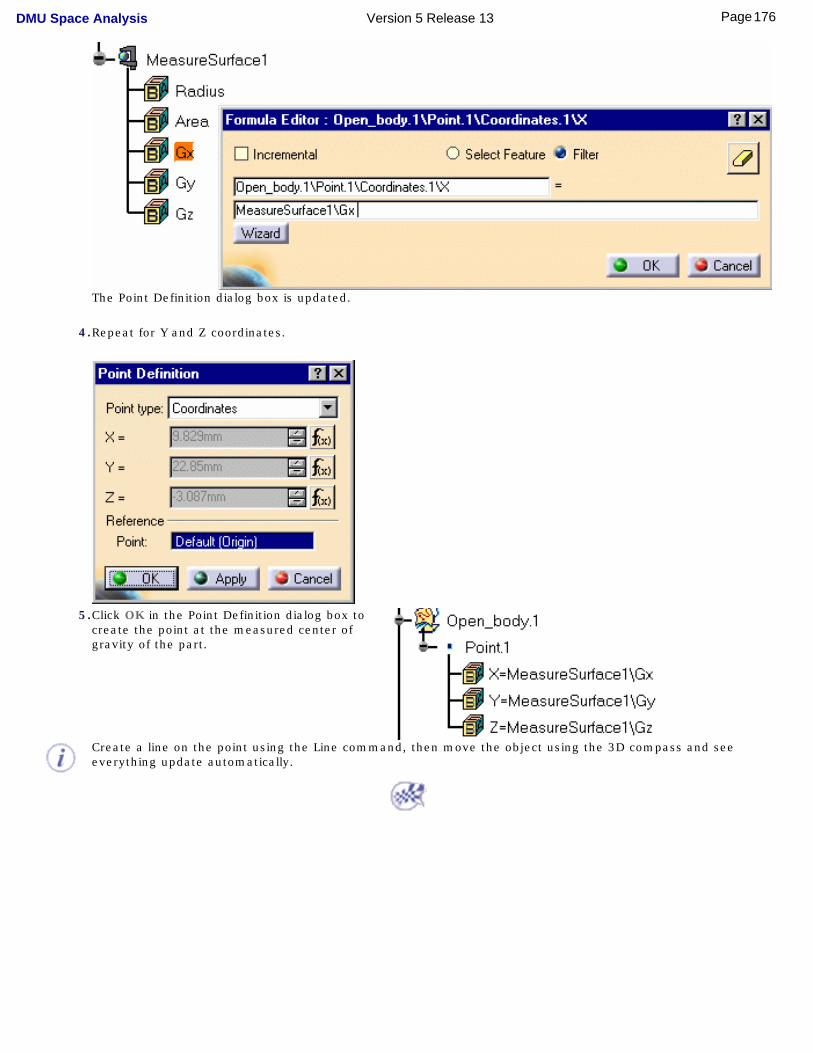
The Point Definition dialog box is updated.
4.Repeat for Y and Z coordinates.
5.Click OK in the Point Definition dialog box to
create the point at the measured center of gravity of the part.
Create a line on the point using the Line command, then move the object using the 3D compass and see everything update automatically.
176Page DMU Space Analysis Version 5 Release 13
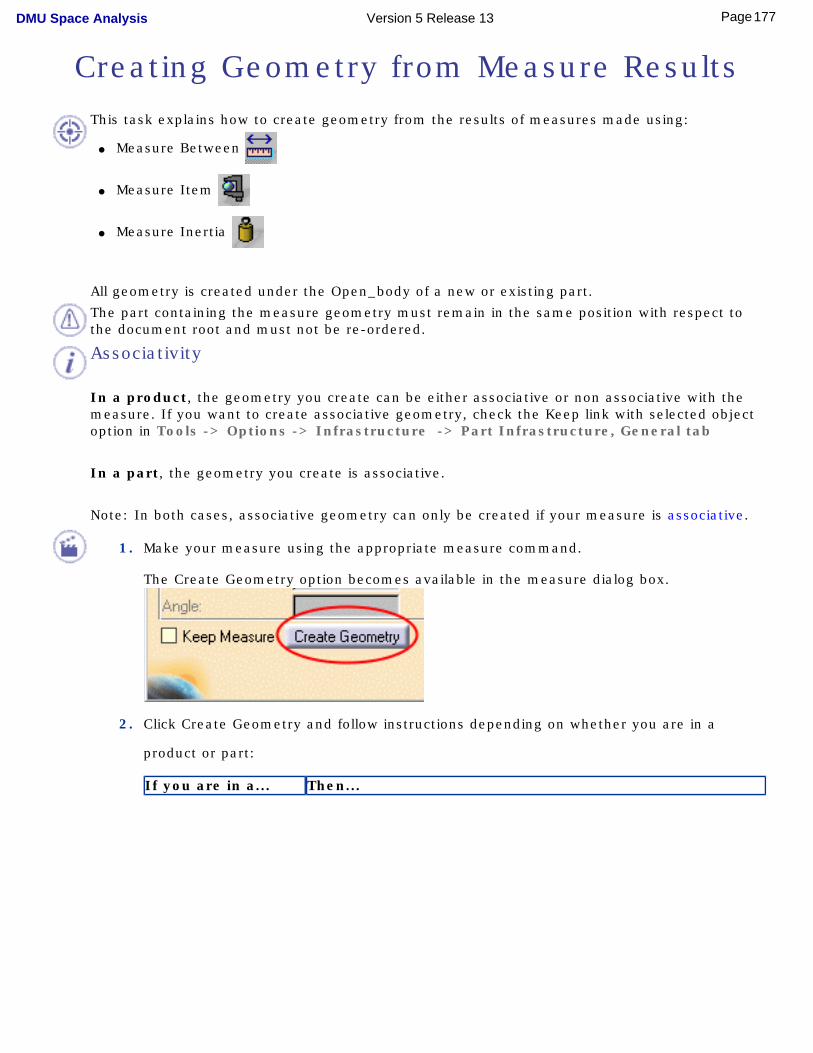
Creating Geometry from Measure ResultsThis task explains how to create geometry from the results of measures made using:
● Measure Between
● Measure Item
● Measure Inertia
All geometry is created under the Open_body of a new or existing part.
The part containing the measure geometry must remain in the same position with respect to the document root and must not be re-ordered.
Associativity
In a product, the geometry you create can be either associative or non associative with the measure. If you want to create associative geometry, check the Keep link with selected object option in Tools -> Options -> Infrastructure -> Part Infrastructure, General tab
In a part, the geometry you create is associative.
Note: In both cases, associative geometry can only be created if your measure is associative.
1. Make your measure using the appropriate measure command.
The Create Geometry option becomes available in the measure dialog box.
2. Click Create Geometry and follow instructions depending on whether you are in a
product or part:
If you are in a... Then...
177Page DMU Space Analysis Version 5 Release 13
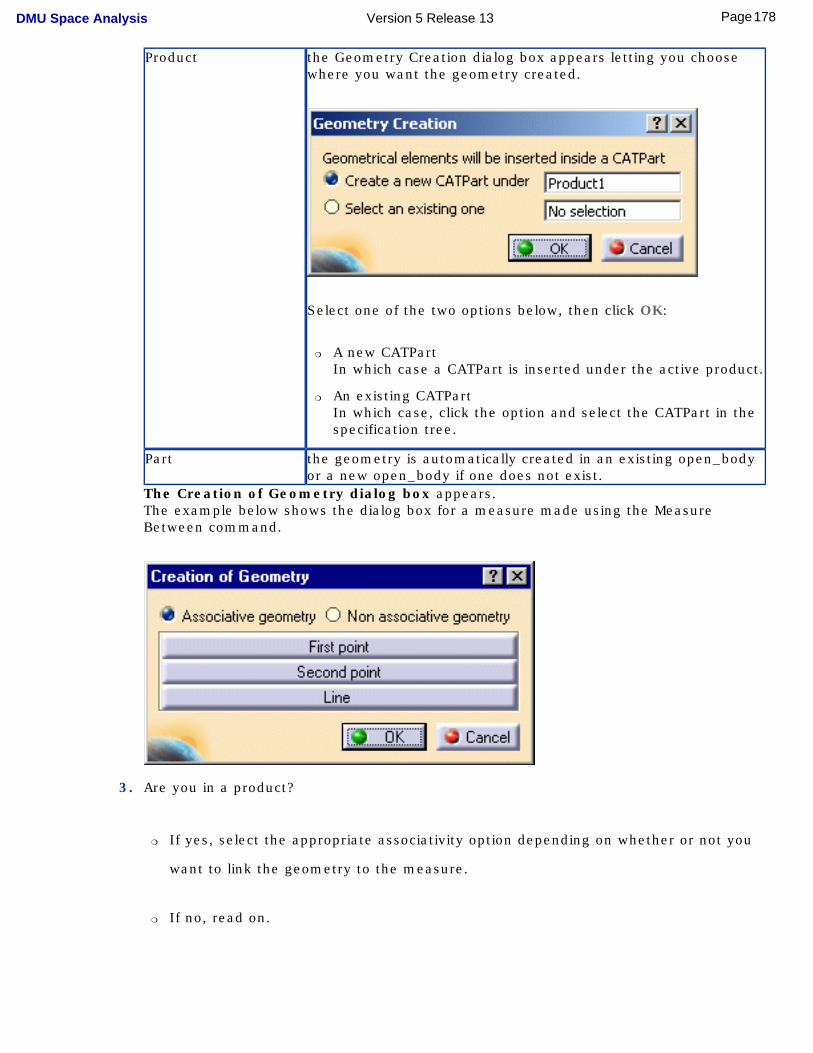
Product the Geometry Creation dialog box appears letting you choose where you want the geometry created.
Select one of the two options below, then click OK:
❍ A new CATPart In which case a CATPart is inserted under the active product.
❍ An existing CATPartIn which case, click the option and select the CATPart in the specification tree.
Part the geometry is automatically created in an existing open_body or a new open_body if one does not exist.
The Creation of Geometry dialog box appears.The example below shows the dialog box for a measure made using the Measure Between command.
3. Are you in a product?
❍ If yes, select the appropriate associativity option depending on whether or not you
want to link the geometry to the measure.
❍ If no, read on.
178Page DMU Space Analysis Version 5 Release 13
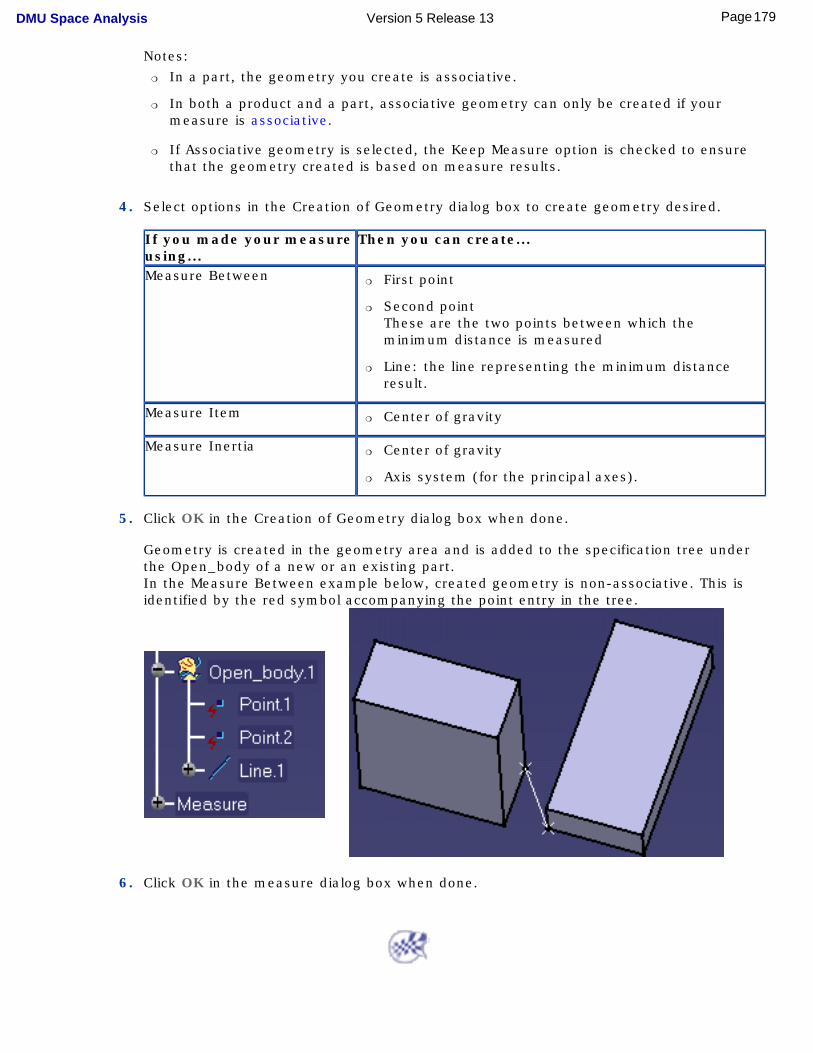
Notes: ❍ In a part, the geometry you create is associative.
❍ In both a product and a part, associative geometry can only be created if your measure is associative.
❍ If Associative geometry is selected, the Keep Measure option is checked to ensure that the geometry created is based on measure results.
4. Select options in the Creation of Geometry dialog box to create geometry desired.
If you made your measure using...
Then you can create...
Measure Between ❍ First point
❍ Second pointThese are the two points between which the minimum distance is measured
❍ Line: the line representing the minimum distance result.
Measure Item❍ Center of gravity
Measure Inertia❍ Center of gravity
❍ Axis system (for the principal axes).
5. Click OK in the Creation of Geometry dialog box when done.
Geometry is created in the geometry area and is added to the specification tree under the Open_body of a new or an existing part.In the Measure Between example below, created geometry is non-associative. This is identified by the red symbol accompanying the point entry in the tree.
6. Click OK in the measure dialog box when done.
179Page DMU Space Analysis Version 5 Release 13

180Page DMU Space Analysis Version 5 Release 13
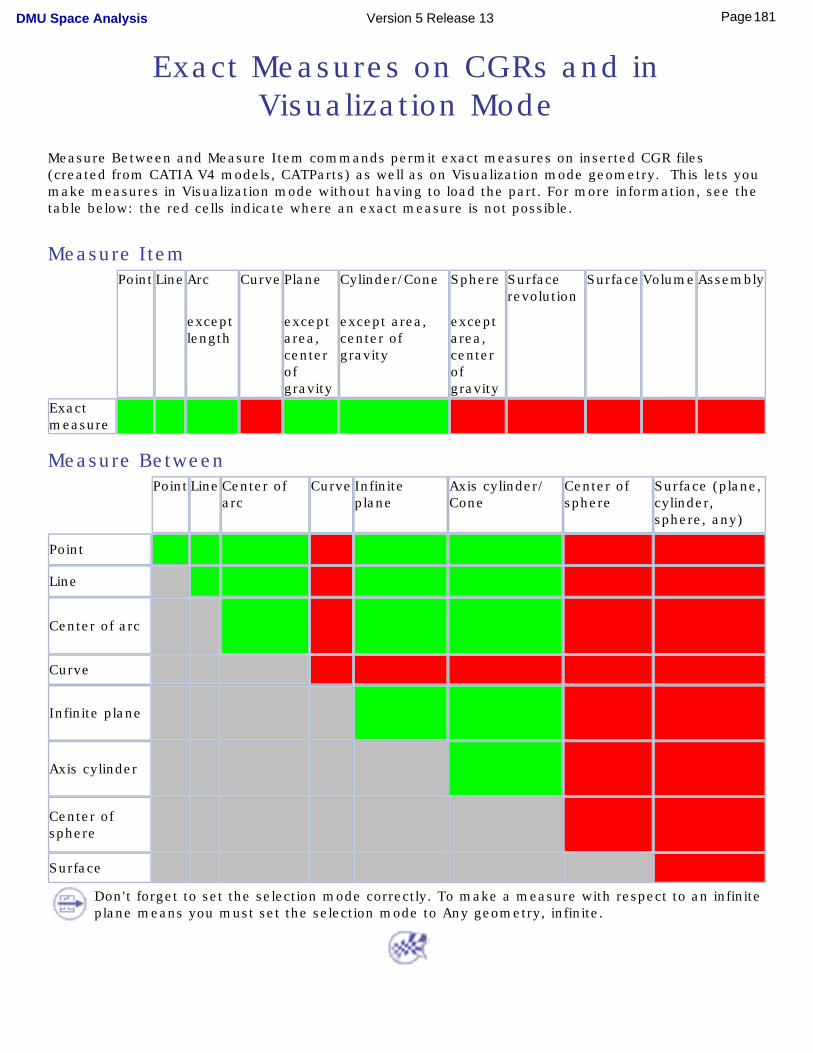
Exact Measures on CGRs and in Visualization Mode
Measure Between and Measure Item commands permit exact measures on inserted CGR files (created from CATIA V4 models, CATParts) as well as on Visualization mode geometry. This lets you make measures in Visualization mode without having to load the part. For more information, see the table below: the red cells indicate where an exact measure is not possible.
Measure ItemPoint Line Arc
except length
Curve Plane
except area, center of gravity
Cylinder/Cone
except area, center of gravity
Sphere
except area, center of gravity
Surface revolution
Surface Volume Assembly
Exact measure
Measure BetweenPoint Line Center of
arcCurve Infinite
planeAxis cylinder/ Cone
Center of sphere
Surface (plane, cylinder, sphere, any)
Point
Line
Center of arc
Curve
Infinite plane
Axis cylinder
Center of sphere
Surface
Don't forget to set the selection mode correctly. To make a measure with respect to an infinite plane means you must set the selection mode to Any geometry, infinite.
181Page DMU Space Analysis Version 5 Release 13
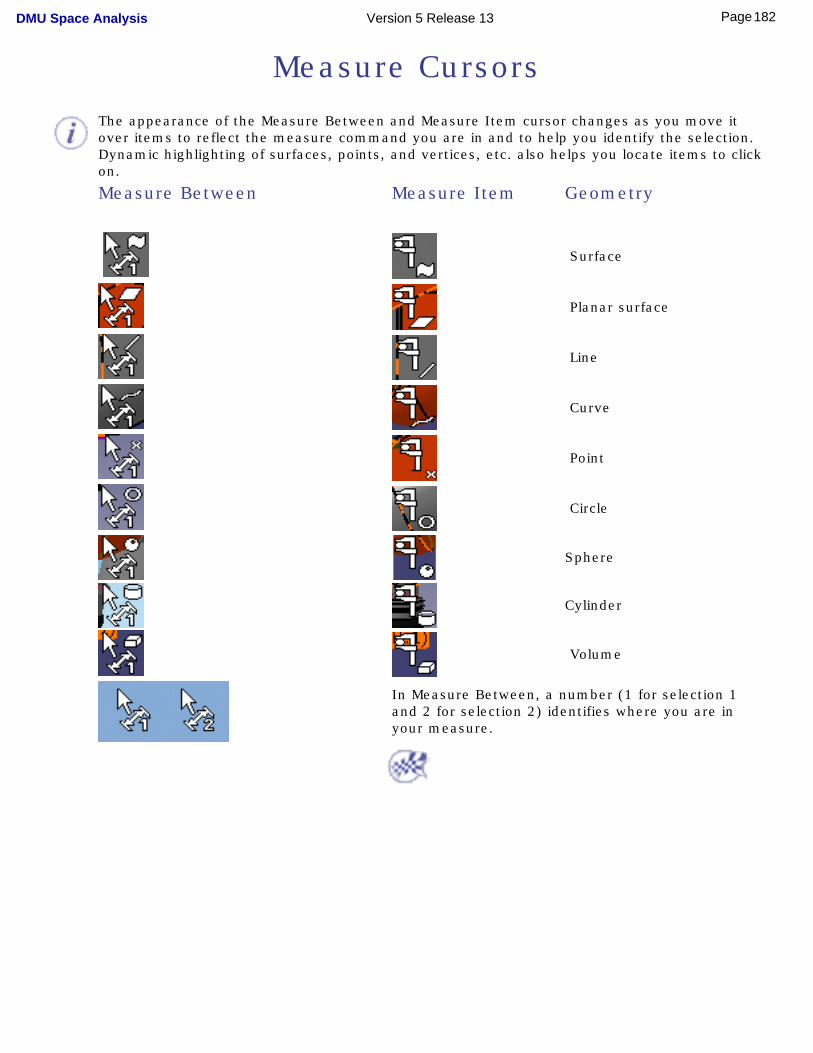
Measure Cursors
The appearance of the Measure Between and Measure Item cursor changes as you move it over items to reflect the measure command you are in and to help you identify the selection. Dynamic highlighting of surfaces, points, and vertices, etc. also helps you locate items to click on.
Measure Between Measure Item Geometry
Surface
Planar surface
Line
Curve
Point
Circle
Sphere
Cylinder
Volume
In Measure Between, a number (1 for selection 1 and 2 for selection 2) identifies where you are in your measure.
182Page DMU Space Analysis Version 5 Release 13
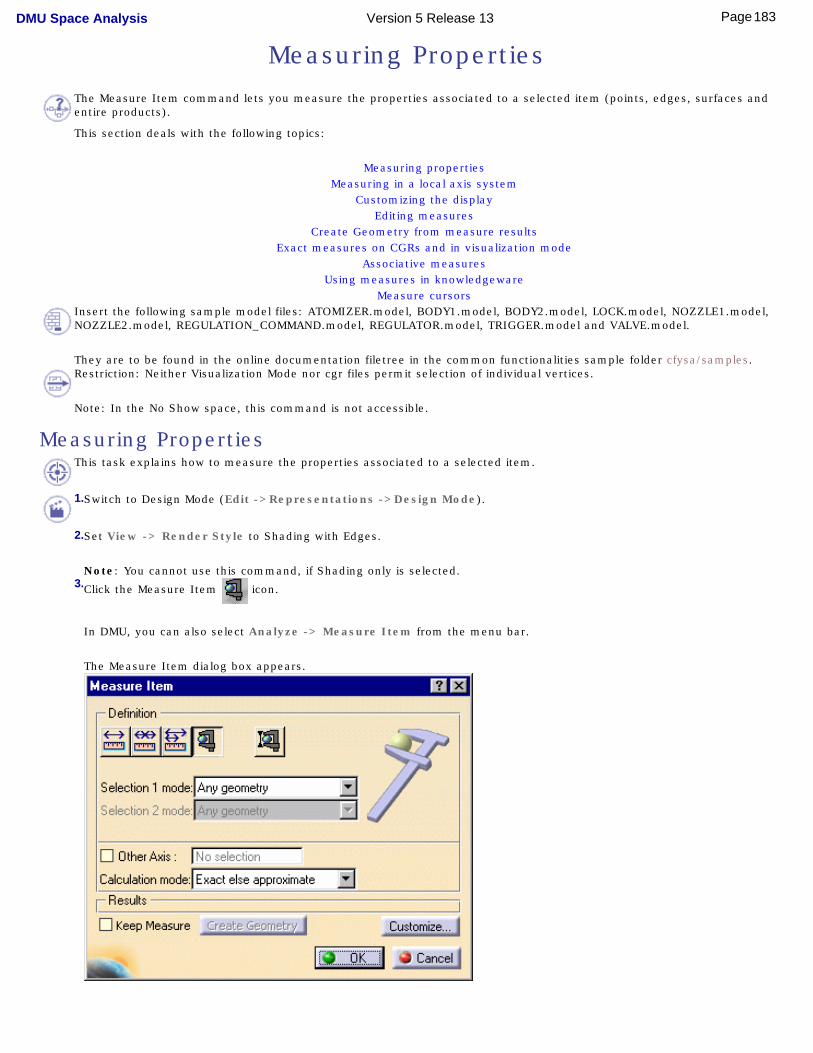
Measuring Properties The Measure Item command lets you measure the properties associated to a selected item (points, edges, surfaces and entire products).
This section deals with the following topics:
Measuring propertiesMeasuring in a local axis system
Customizing the displayEditing measures
Create Geometry from measure resultsExact measures on CGRs and in visualization mode
Associative measuresUsing measures in knowledgeware
Measure cursorsInsert the following sample model files: ATOMIZER.model, BODY1.model, BODY2.model, LOCK.model, NOZZLE1.model, NOZZLE2.model, REGULATION_COMMAND.model, REGULATOR.model, TRIGGER.model and VALVE.model.
They are to be found in the online documentation filetree in the common functionalities sample folder cfysa/samples.
Restriction: Neither Visualization Mode nor cgr files permit selection of individual vertices.
Note: In the No Show space, this command is not accessible.
Measuring Properties
This task explains how to measure the properties associated to a selected item.
1.Switch to Design Mode (Edit ->Representations ->Design Mode).
2.Set View -> Render Style to Shading with Edges.
Note: You cannot use this command, if Shading only is selected.3.Click the Measure Item icon.
In DMU, you can also select Analyze -> Measure Item from the menu bar.
The Measure Item dialog box appears.
183Page DMU Space Analysis Version 5 Release 13
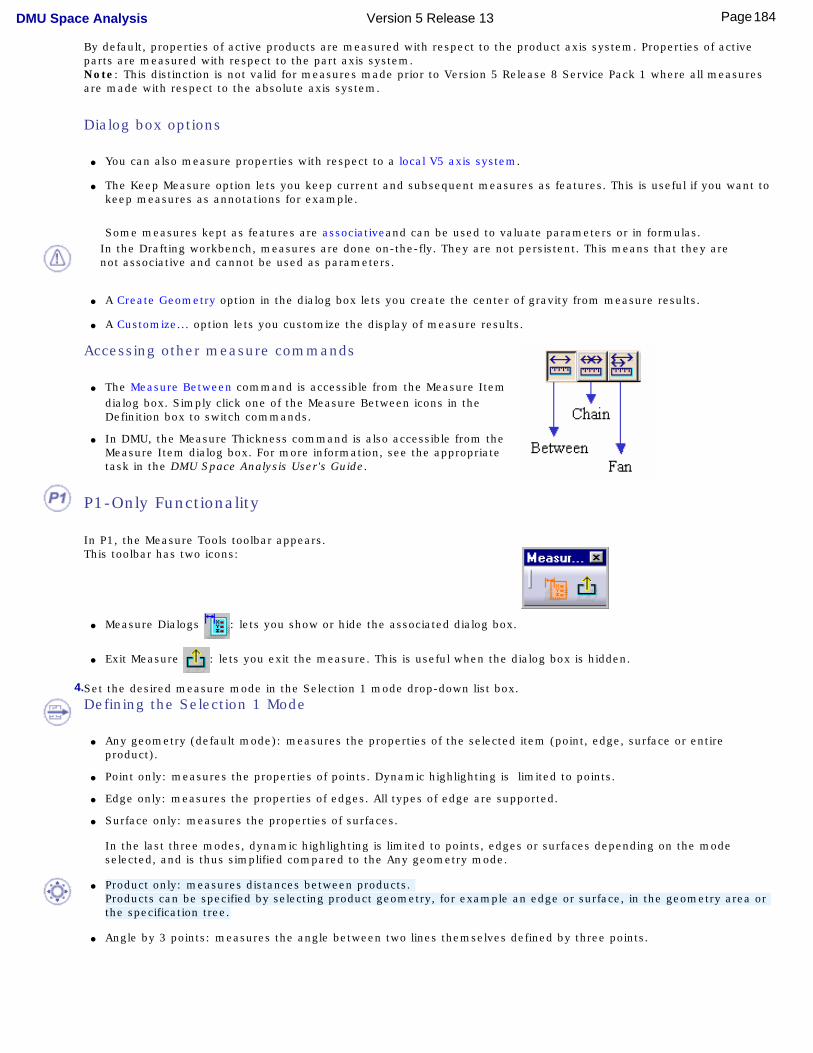
By default, properties of active products are measured with respect to the product axis system. Properties of active parts are measured with respect to the part axis system. Note: This distinction is not valid for measures made prior to Version 5 Release 8 Service Pack 1 where all measures are made with respect to the absolute axis system.
Dialog box options
● You can also measure properties with respect to a local V5 axis system.
● The Keep Measure option lets you keep current and subsequent measures as features. This is useful if you want to keep measures as annotations for example.
Some measures kept as features are associativeand can be used to valuate parameters or in formulas. In the Drafting workbench, measures are done on-the-fly. They are not persistent. This means that they are not associative and cannot be used as parameters.
● A Create Geometry option in the dialog box lets you create the center of gravity from measure results.
● A Customize... option lets you customize the display of measure results.
Accessing other measure commands
● The Measure Between command is accessible from the Measure Item dialog box. Simply click one of the Measure Between icons in the Definition box to switch commands.
● In DMU, the Measure Thickness command is also accessible from the Measure Item dialog box. For more information, see the appropriate task in the DMU Space Analysis User's Guide.
P1-Only Functionality
In P1, the Measure Tools toolbar appears. This toolbar has two icons:
● Measure Dialogs : lets you show or hide the associated dialog box.
● Exit Measure : lets you exit the measure. This is useful when the dialog box is hidden.
4.Set the desired measure mode in the Selection 1 mode drop-down list box.Defining the Selection 1 Mode
● Any geometry (default mode): measures the properties of the selected item (point, edge, surface or entire product).
● Point only: measures the properties of points. Dynamic highlighting is limited to points.
● Edge only: measures the properties of edges. All types of edge are supported.
● Surface only: measures the properties of surfaces.
In the last three modes, dynamic highlighting is limited to points, edges or surfaces depending on the mode selected, and is thus simplified compared to the Any geometry mode.
● Product only: measures distances between products.
Products can be specified by selecting product geometry, for example an edge or surface, in the geometry area or the specification tree.
● Angle by 3 points: measures the angle between two lines themselves defined by three points.
184Page DMU Space Analysis Version 5 Release 13
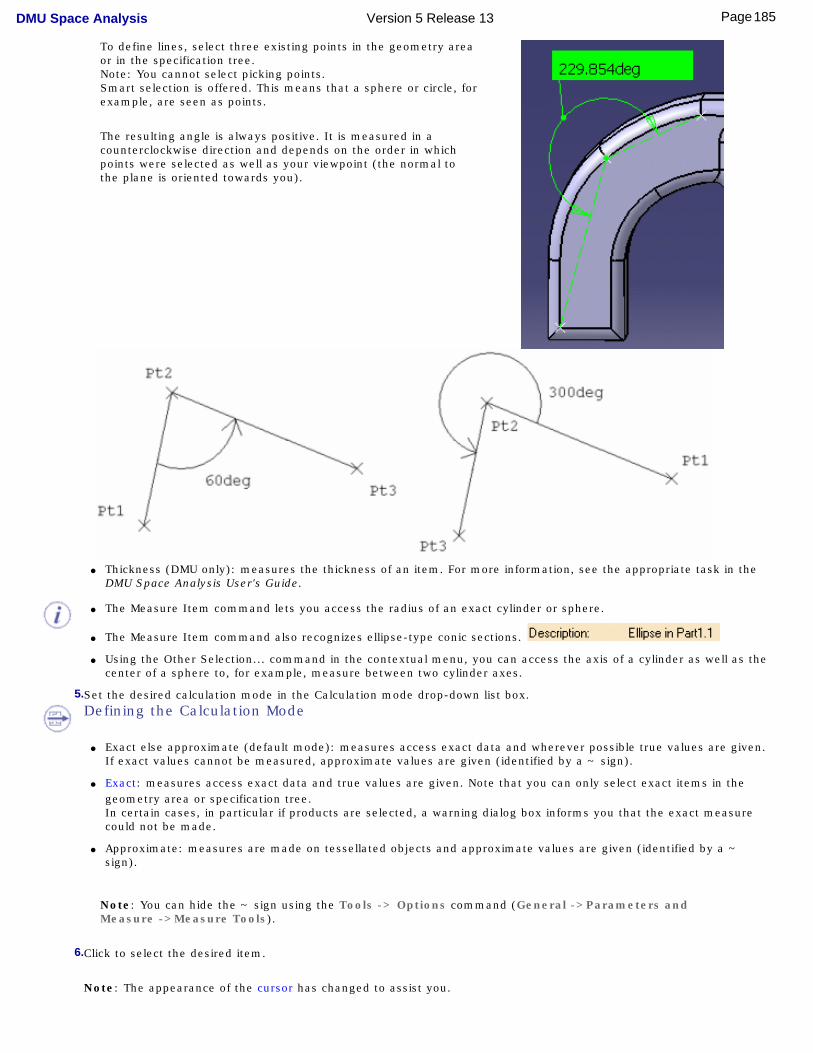
To define lines, select three existing points in the geometry area or in the specification tree.Note: You cannot select picking points.Smart selection is offered. This means that a sphere or circle, for example, are seen as points.
The resulting angle is always positive. It is measured in a counterclockwise direction and depends on the order in which points were selected as well as your viewpoint (the normal to the plane is oriented towards you).
● Thickness (DMU only): measures the thickness of an item. For more information, see the appropriate task in the
DMU Space Analysis User's Guide.
● The Measure Item command lets you access the radius of an exact cylinder or sphere.
● The Measure Item command also recognizes ellipse-type conic sections.
● Using the Other Selection... command in the contextual menu, you can access the axis of a cylinder as well as the center of a sphere to, for example, measure between two cylinder axes.
5.Set the desired calculation mode in the Calculation mode drop-down list box.Defining the Calculation Mode
● Exact else approximate (default mode): measures access exact data and wherever possible true values are given. If exact values cannot be measured, approximate values are given (identified by a ~ sign).
● Exact: measures access exact data and true values are given. Note that you can only select exact items in the geometry area or specification tree.In certain cases, in particular if products are selected, a warning dialog box informs you that the exact measure could not be made.
● Approximate: measures are made on tessellated objects and approximate values are given (identified by a ~ sign).
Note: You can hide the ~ sign using the Tools -> Options command (General ->Parameters and Measure ->Measure Tools).
6.Click to select the desired item.
Note: The appearance of the cursor has changed to assist you.
185Page DMU Space Analysis Version 5 Release 13
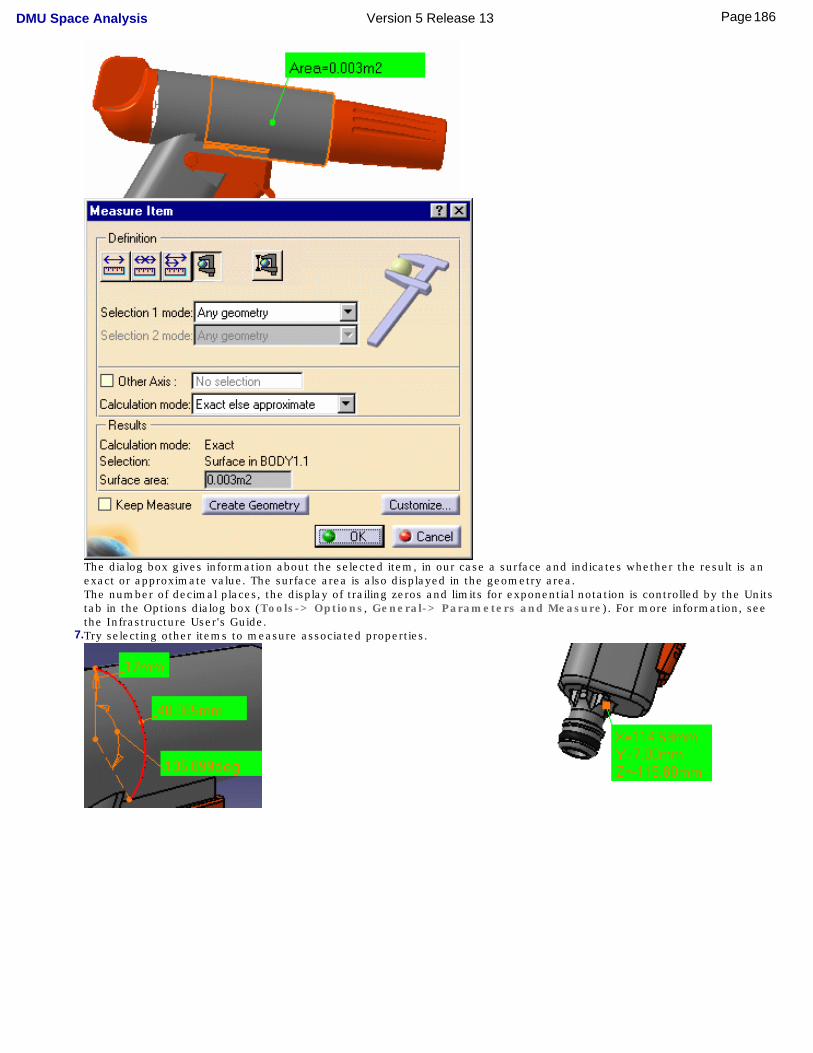
The dialog box gives information about the selected item, in our case a surface and indicates whether the result is an exact or approximate value. The surface area is also displayed in the geometry area.The number of decimal places, the display of trailing zeros and limits for exponential notation is controlled by the Units tab in the Options dialog box (Tools-> Options, General-> Parameters and Measure). For more information, see the Infrastructure User's Guide.
7.Try selecting other items to measure associated properties.
186Page DMU Space Analysis Version 5 Release 13
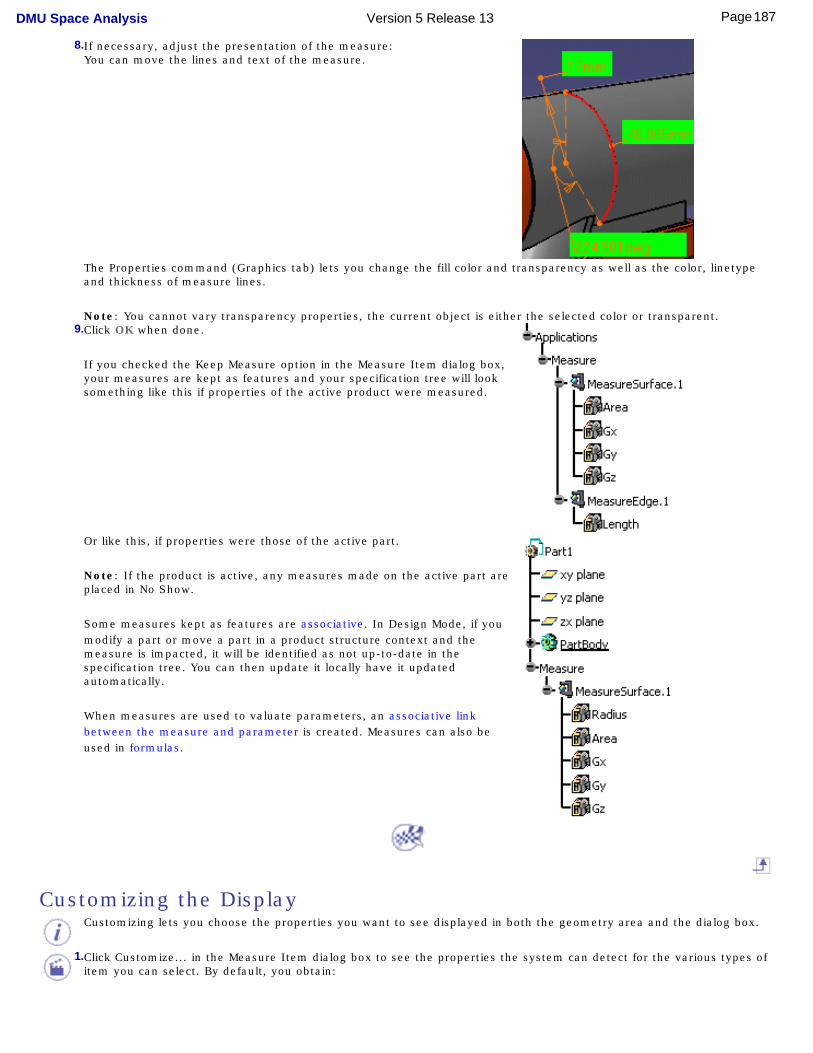
8.If necessary, adjust the presentation of the measure:You can move the lines and text of the measure.
The Properties command (Graphics tab) lets you change the fill color and transparency as well as the color, linetype and thickness of measure lines.
Note: You cannot vary transparency properties, the current object is either the selected color or transparent.9.Click OK when done.
If you checked the Keep Measure option in the Measure Item dialog box, your measures are kept as features and your specification tree will look something like this if properties of the active product were measured.
Or like this, if properties were those of the active part.
Note: If the product is active, any measures made on the active part are placed in No Show.
Some measures kept as features are associative. In Design Mode, if you modify a part or move a part in a product structure context and the measure is impacted, it will be identified as not up-to-date in the specification tree. You can then update it locally have it updated automatically.
When measures are used to valuate parameters, an associative link between the measure and parameter is created. Measures can also be used in formulas.
Customizing the Display Customizing lets you choose the properties you want to see displayed in both the geometry area and the dialog box.
1.Click Customize... in the Measure Item dialog box to see the properties the system can detect for the various types of item you can select. By default, you obtain:
187Page DMU Space Analysis Version 5 Release 13
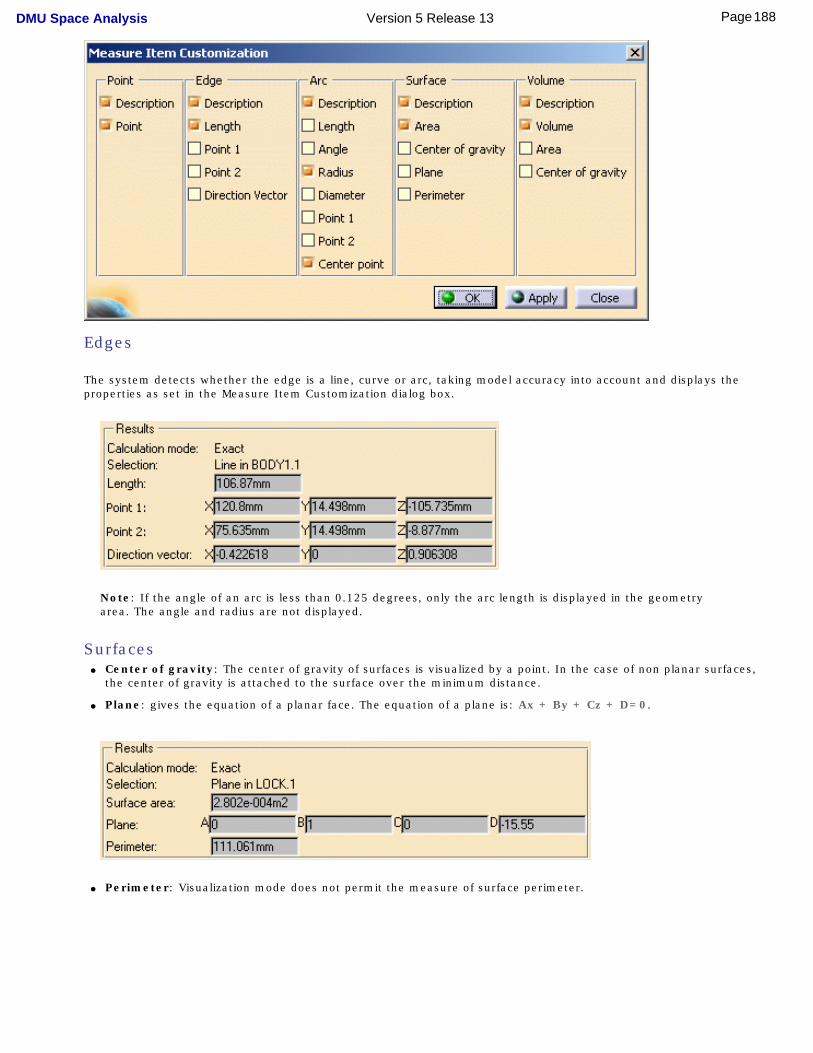
Edges
The system detects whether the edge is a line, curve or arc, taking model accuracy into account and displays the properties as set in the Measure Item Customization dialog box.
Note: If the angle of an arc is less than 0.125 degrees, only the arc length is displayed in the geometry area. The angle and radius are not displayed.
Surfaces● Center of gravity: The center of gravity of surfaces is visualized by a point. In the case of non planar surfaces,
the center of gravity is attached to the surface over the minimum distance.
● Plane: gives the equation of a planar face. The equation of a plane is: Ax + By + Cz + D=0.
● Perimeter: Visualization mode does not permit the measure of surface perimeter.
188Page DMU Space Analysis Version 5 Release 13
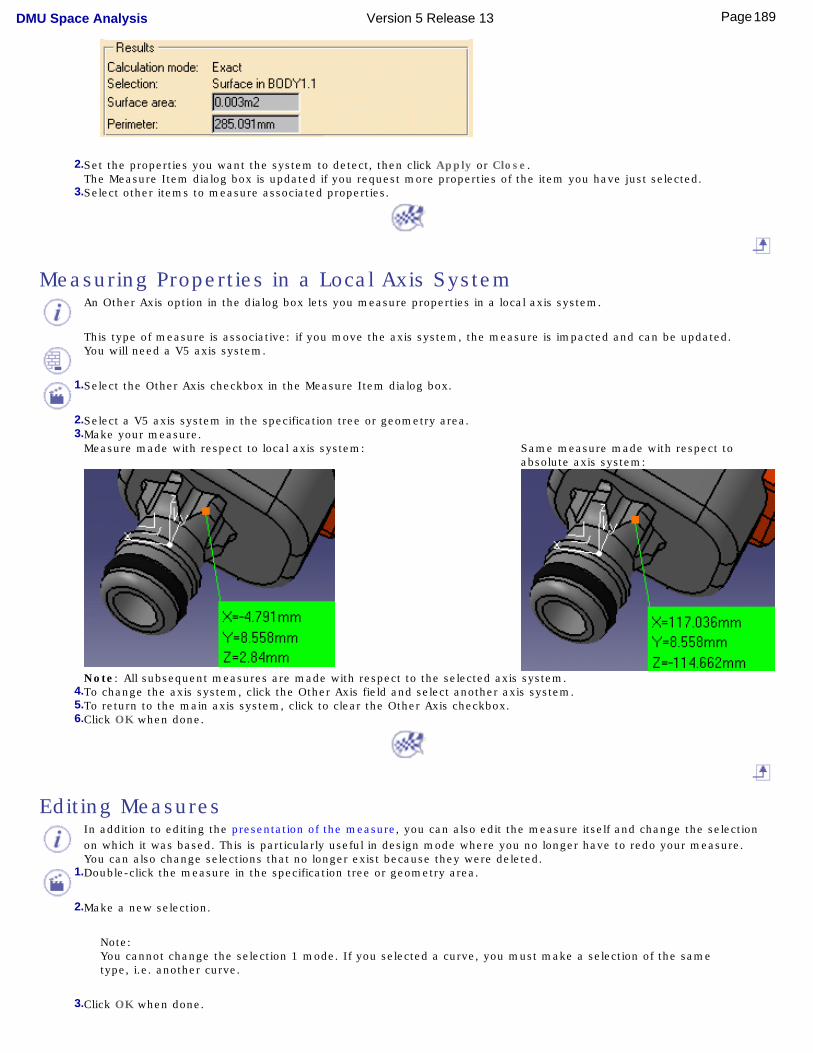
2.Set the properties you want the system to detect, then click Apply or Close.The Measure Item dialog box is updated if you request more properties of the item you have just selected.
3.Select other items to measure associated properties.
Measuring Properties in a Local Axis System An Other Axis option in the dialog box lets you measure properties in a local axis system.
This type of measure is associative: if you move the axis system, the measure is impacted and can be updated. You will need a V5 axis system.
1.Select the Other Axis checkbox in the Measure Item dialog box.
2.Select a V5 axis system in the specification tree or geometry area.3.Make your measure.
Measure made with respect to local axis system: Same measure made with respect to absolute axis system:
Note: All subsequent measures are made with respect to the selected axis system. 4.To change the axis system, click the Other Axis field and select another axis system. 5.To return to the main axis system, click to clear the Other Axis checkbox. 6.Click OK when done.
Editing Measures In addition to editing the presentation of the measure, you can also edit the measure itself and change the selection
on which it was based. This is particularly useful in design mode where you no longer have to redo your measure. You can also change selections that no longer exist because they were deleted.
1.Double-click the measure in the specification tree or geometry area.
2.Make a new selection.
Note:You cannot change the selection 1 mode. If you selected a curve, you must make a selection of the same type, i.e. another curve.
3.Click OK when done.
189Page DMU Space Analysis Version 5 Release 13
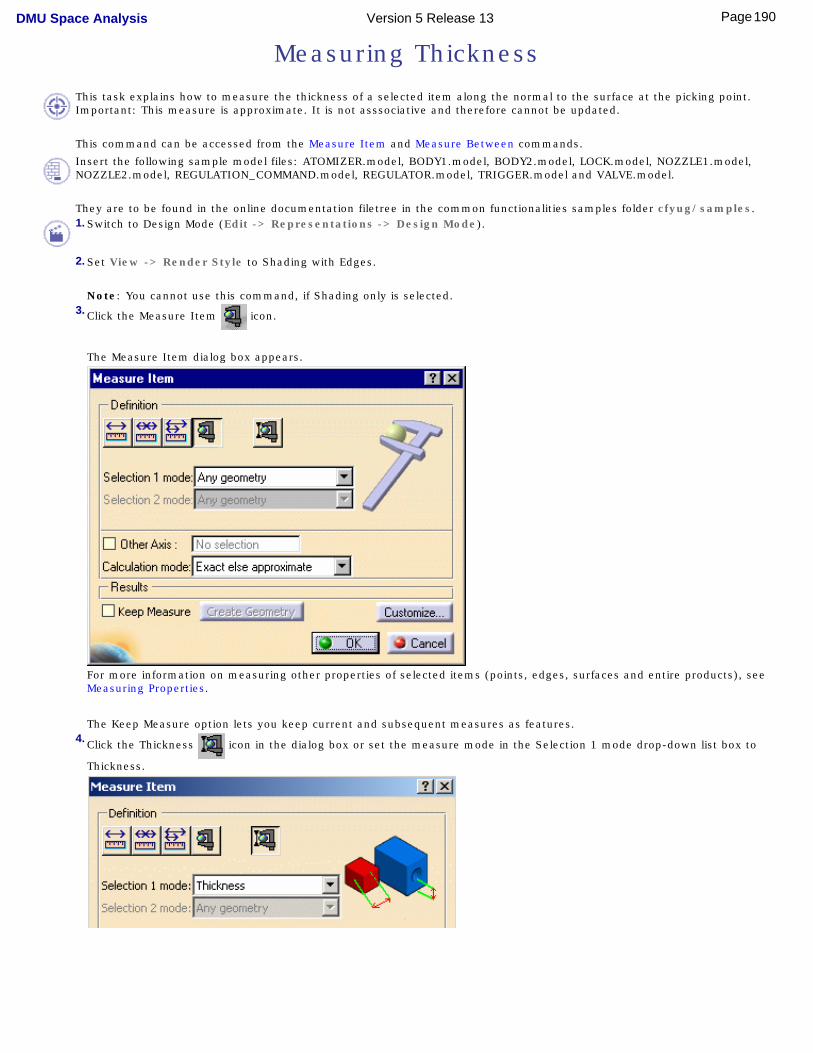
Measuring Thickness
This task explains how to measure the thickness of a selected item along the normal to the surface at the picking point. Important: This measure is approximate. It is not asssociative and therefore cannot be updated.
This command can be accessed from the Measure Item and Measure Between commands.
Insert the following sample model files: ATOMIZER.model, BODY1.model, BODY2.model, LOCK.model, NOZZLE1.model, NOZZLE2.model, REGULATION_COMMAND.model, REGULATOR.model, TRIGGER.model and VALVE.model.
They are to be found in the online documentation filetree in the common functionalities samples folder cfyug/samples.
1. Switch to Design Mode (Edit -> Representations -> Design Mode).
2. Set View -> Render Style to Shading with Edges.
Note: You cannot use this command, if Shading only is selected.3. Click the Measure Item icon.
The Measure Item dialog box appears.
For more information on measuring other properties of selected items (points, edges, surfaces and entire products), see Measuring Properties.
The Keep Measure option lets you keep current and subsequent measures as features.
4. Click the Thickness icon in the dialog box or set the measure mode in the Selection 1 mode drop-down list box to
Thickness.
190Page DMU Space Analysis Version 5 Release 13
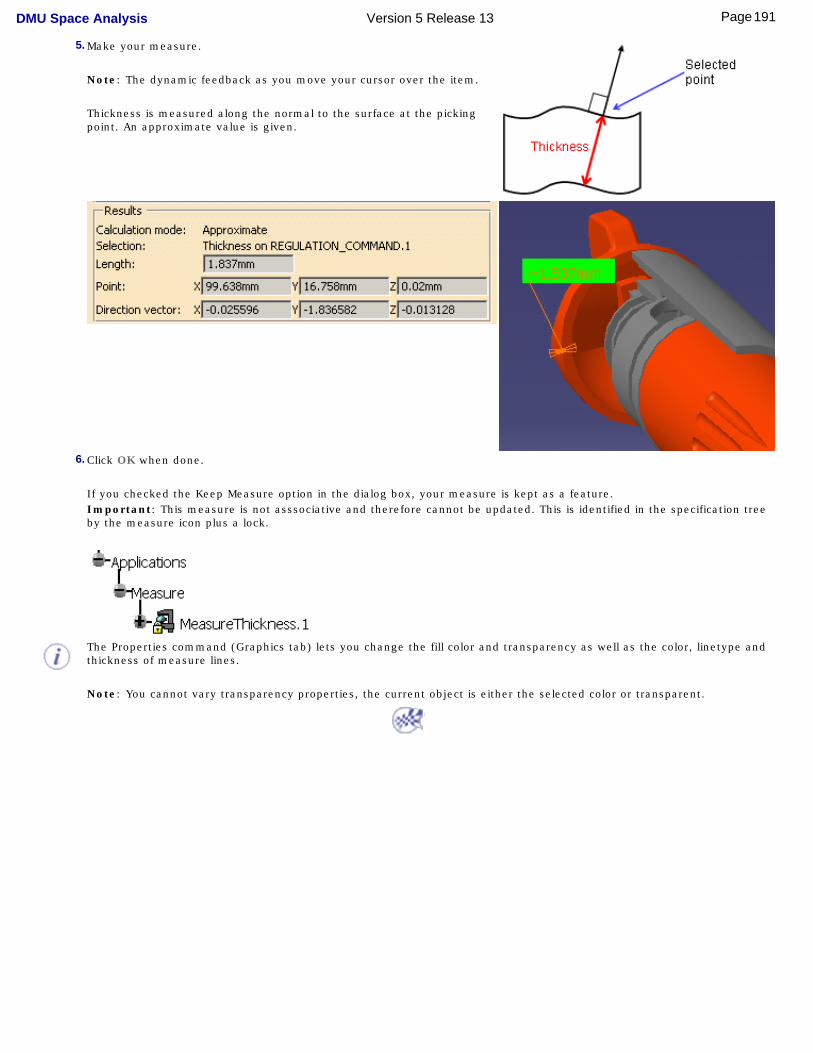
5. Make your measure.
Note: The dynamic feedback as you move your cursor over the item.
Thickness is measured along the normal to the surface at the picking point. An approximate value is given.
6. Click OK when done.
If you checked the Keep Measure option in the dialog box, your measure is kept as a feature.
Important: This measure is not asssociative and therefore cannot be updated. This is identified in the specification tree by the measure icon plus a lock.
The Properties command (Graphics tab) lets you change the fill color and transparency as well as the color, linetype and thickness of measure lines.
Note: You cannot vary transparency properties, the current object is either the selected color or transparent.
191Page DMU Space Analysis Version 5 Release 13
Measuring Inertia
The Measure Inertia command lets you measure:● 3D inertia properties of surfaces and volumes (explained below)
● 2D inertia properties of plane surfaces.
Note: In the No Show space, this command is not accessible. This section deals with the following topics:
Measuring 3D inertia propertiesMeasuring 2D inertia properties
Customizing your measureExporting measure results
Creating geometry from measure resultsNotations used
Inertia equivalentsPrincipal axes
Inertia matrix with respect to the origin OInertia matrix with respect to a point P
Inertia matrix with respect to an axis systemMoment of inertia about an axis
Associative measuresUsing measures in knowledgeware
Measuring 3D Inertia Properties
This task explains how to measure the 3D inertia properties of an object.
You can measure the 3D inertia properties of both surfaces and volumes, as well as retrieve the density or surface density if valuated from V4 model type documents. You can also retrieve inertia equivalents set in Knowledgeware formulas.
The area, density, mass and volume (volumes only) of the object are also calculated. Measures are persistent: a Keep Measure option in the Measure Inertia dialog box lets you keep the
current measure as a feature in the specification tree.
Note: The Keep Measure option is not available in the Drafting workbench.For examples showing 3D inertia properties measured on surfaces. To find out more about notations used.
Insert the Valve.cgr document from the samples folder. It is to be found in the online documentation filetree in the common functionalities sample folder cfysa/samples.
1. Click the Measure Inertia icon.
In DMU, you can also select Analyze -> Measure Inertia from the menu bar.The Measure Inertia dialog box appears. By default 3D inertia properties are measured.
The Measure 2D Inertia icon lets you measure 2D inertia properties of plane surfaces.
192Page DMU Space Analysis Version 5 Release 13
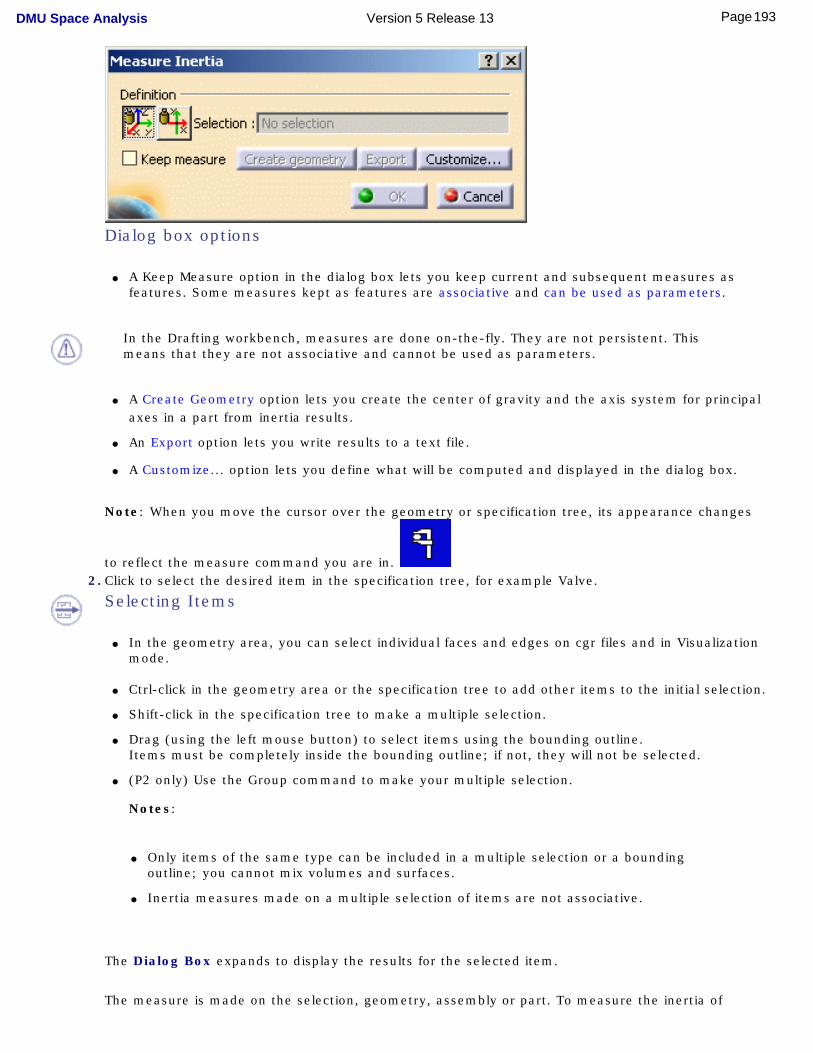
Dialog box options
● A Keep Measure option in the dialog box lets you keep current and subsequent measures as features. Some measures kept as features are associative and can be used as parameters.
In the Drafting workbench, measures are done on-the-fly. They are not persistent. This means that they are not associative and cannot be used as parameters.
● A Create Geometry option lets you create the center of gravity and the axis system for principal
axes in a part from inertia results.
● An Export option lets you write results to a text file.
● A Customize... option lets you define what will be computed and displayed in the dialog box.
Note: When you move the cursor over the geometry or specification tree, its appearance changes
to reflect the measure command you are in. 2. Click to select the desired item in the specification tree, for example Valve.
Selecting Items
● In the geometry area, you can select individual faces and edges on cgr files and in Visualization mode.
● Ctrl-click in the geometry area or the specification tree to add other items to the initial selection.
● Shift-click in the specification tree to make a multiple selection.
● Drag (using the left mouse button) to select items using the bounding outline.Items must be completely inside the bounding outline; if not, they will not be selected.
● (P2 only) Use the Group command to make your multiple selection.
Notes:
● Only items of the same type can be included in a multiple selection or a bounding outline; you cannot mix volumes and surfaces.
● Inertia measures made on a multiple selection of items are not associative.
The Dialog Box expands to display the results for the selected item.
The measure is made on the selection, geometry, assembly or part. To measure the inertia of
193Page DMU Space Analysis Version 5 Release 13
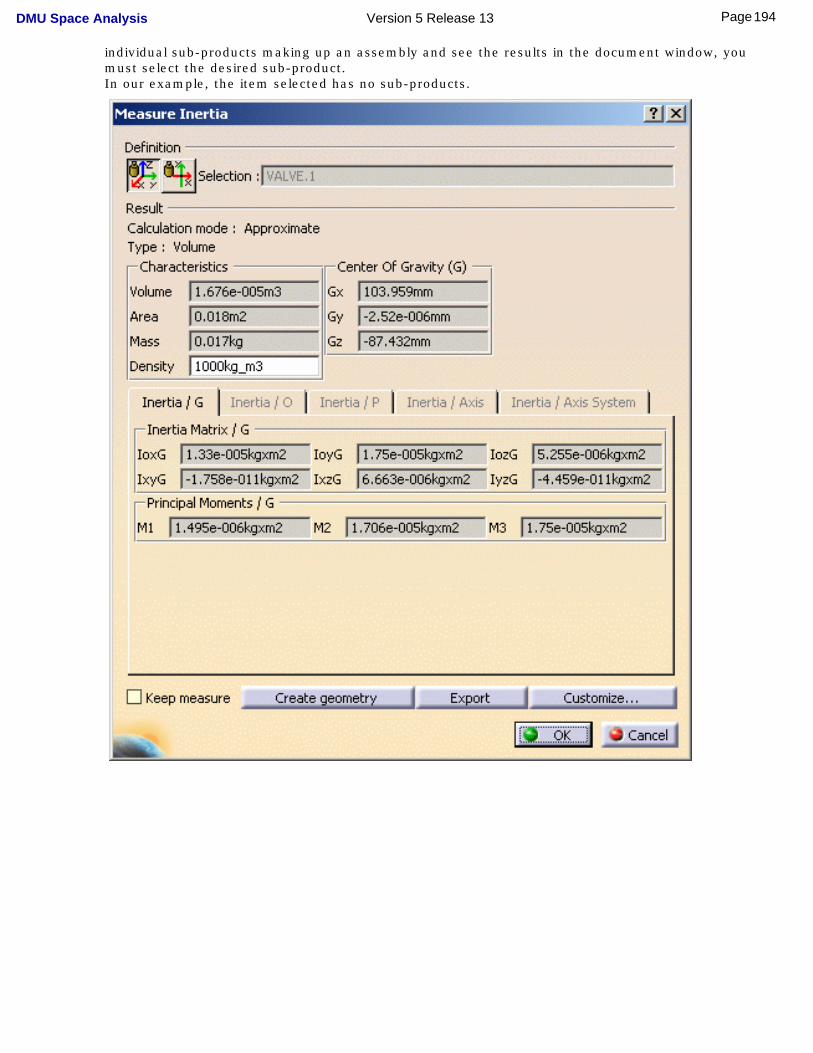
individual sub-products making up an assembly and see the results in the document window, you must select the desired sub-product.In our example, the item selected has no sub-products.
194Page DMU Space Analysis Version 5 Release 13
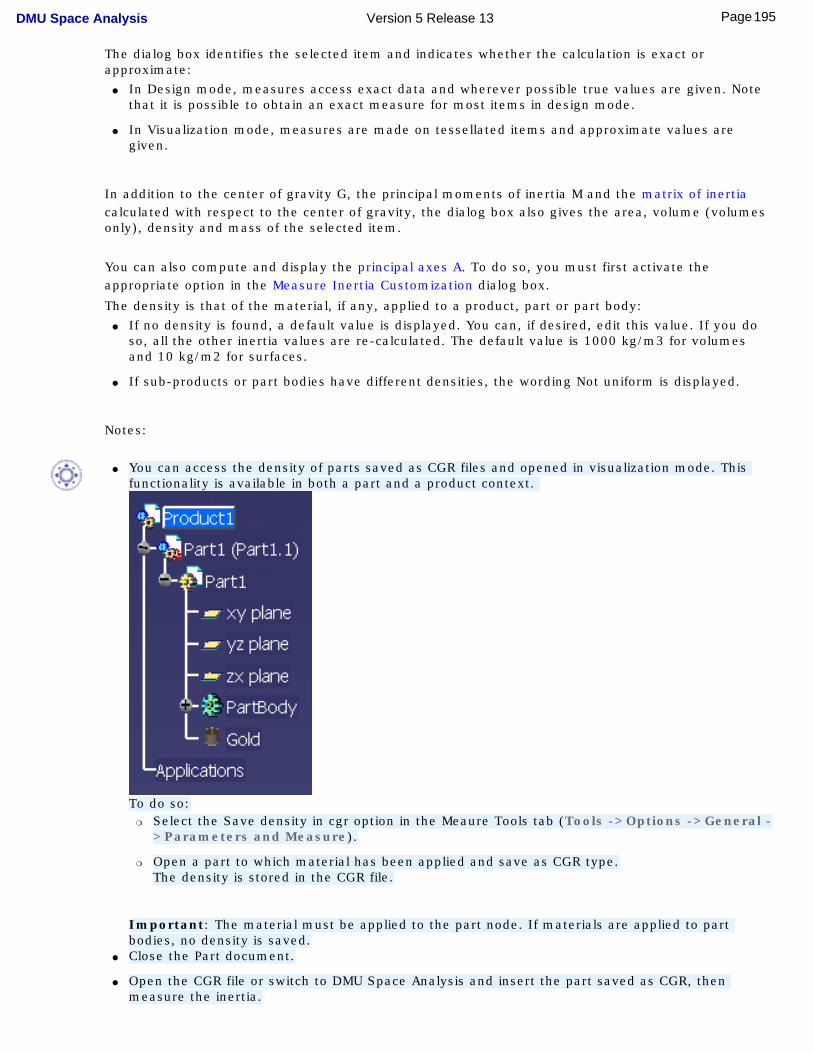
The dialog box identifies the selected item and indicates whether the calculation is exact or approximate:
● In Design mode, measures access exact data and wherever possible true values are given. Note that it is possible to obtain an exact measure for most items in design mode.
● In Visualization mode, measures are made on tessellated items and approximate values are given.
In addition to the center of gravity G, the principal moments of inertia M and the matrix of inertia calculated with respect to the center of gravity, the dialog box also gives the area, volume (volumes only), density and mass of the selected item.
You can also compute and display the principal axes A. To do so, you must first activate the appropriate option in the Measure Inertia Customization dialog box.
The density is that of the material, if any, applied to a product, part or part body:● If no density is found, a default value is displayed. You can, if desired, edit this value. If you do
so, all the other inertia values are re-calculated. The default value is 1000 kg/m3 for volumes and 10 kg/m2 for surfaces.
● If sub-products or part bodies have different densities, the wording Not uniform is displayed.
Notes:
● You can access the density of parts saved as CGR files and opened in visualization mode. This
functionality is available in both a part and a product context.
To do so:❍ Select the Save density in cgr option in the Meaure Tools tab (Tools ->Options ->General -
>Parameters and Measure).
❍ Open a part to which material has been applied and save as CGR type.The density is stored in the CGR file.
Important: The material must be applied to the part node. If materials are applied to part bodies, no density is saved.
● Close the Part document.
● Open the CGR file or switch to DMU Space Analysis and insert the part saved as CGR, then measure the inertia.
195Page DMU Space Analysis Version 5 Release 13
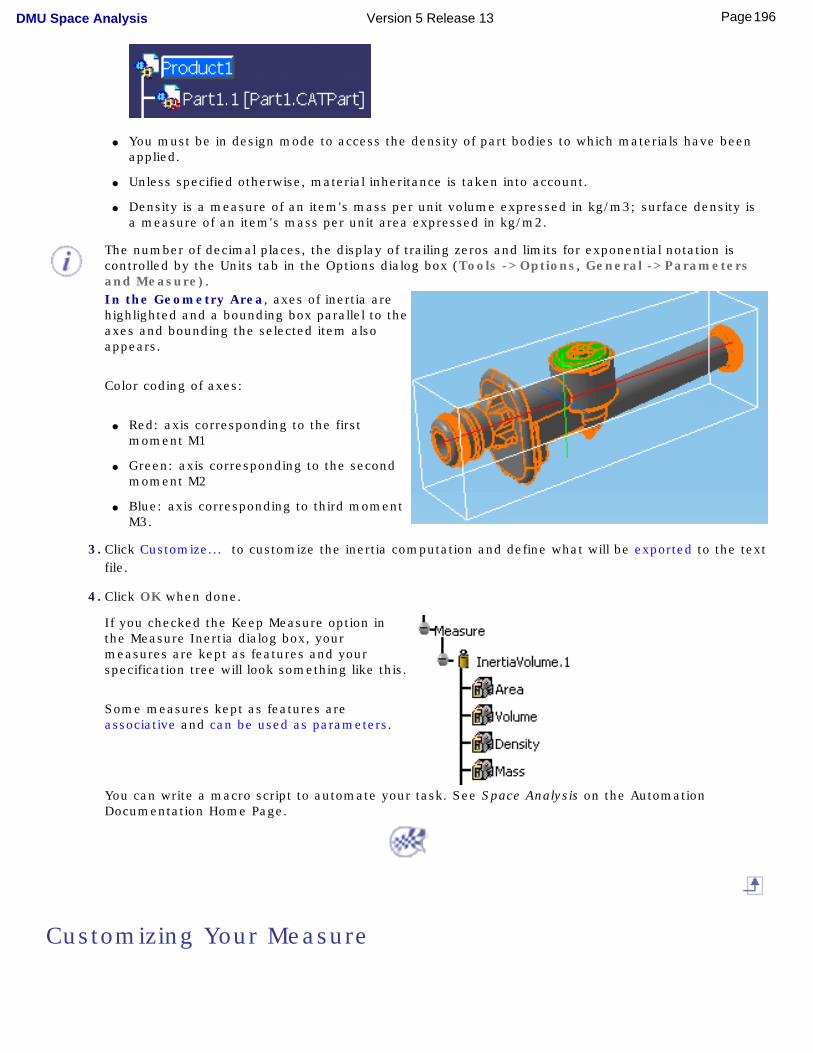
● You must be in design mode to access the density of part bodies to which materials have been
applied.
● Unless specified otherwise, material inheritance is taken into account.
● Density is a measure of an item's mass per unit volume expressed in kg/m3; surface density is a measure of an item's mass per unit area expressed in kg/m2.
The number of decimal places, the display of trailing zeros and limits for exponential notation is controlled by the Units tab in the Options dialog box (Tools ->Options, General ->Parameters and Measure). In the Geometry Area, axes of inertia are highlighted and a bounding box parallel to the axes and bounding the selected item also appears.
Color coding of axes:
● Red: axis corresponding to the first moment M1
● Green: axis corresponding to the second moment M2
● Blue: axis corresponding to third moment M3.
3. Click Customize... to customize the inertia computation and define what will be exported to the text file.
4. Click OK when done.
If you checked the Keep Measure option in the Measure Inertia dialog box, your measures are kept as features and your specification tree will look something like this.
Some measures kept as features are associative and can be used as parameters.
You can write a macro script to automate your task. See Space Analysis on the Automation Documentation Home Page.
Customizing Your Measure
196Page DMU Space Analysis Version 5 Release 13
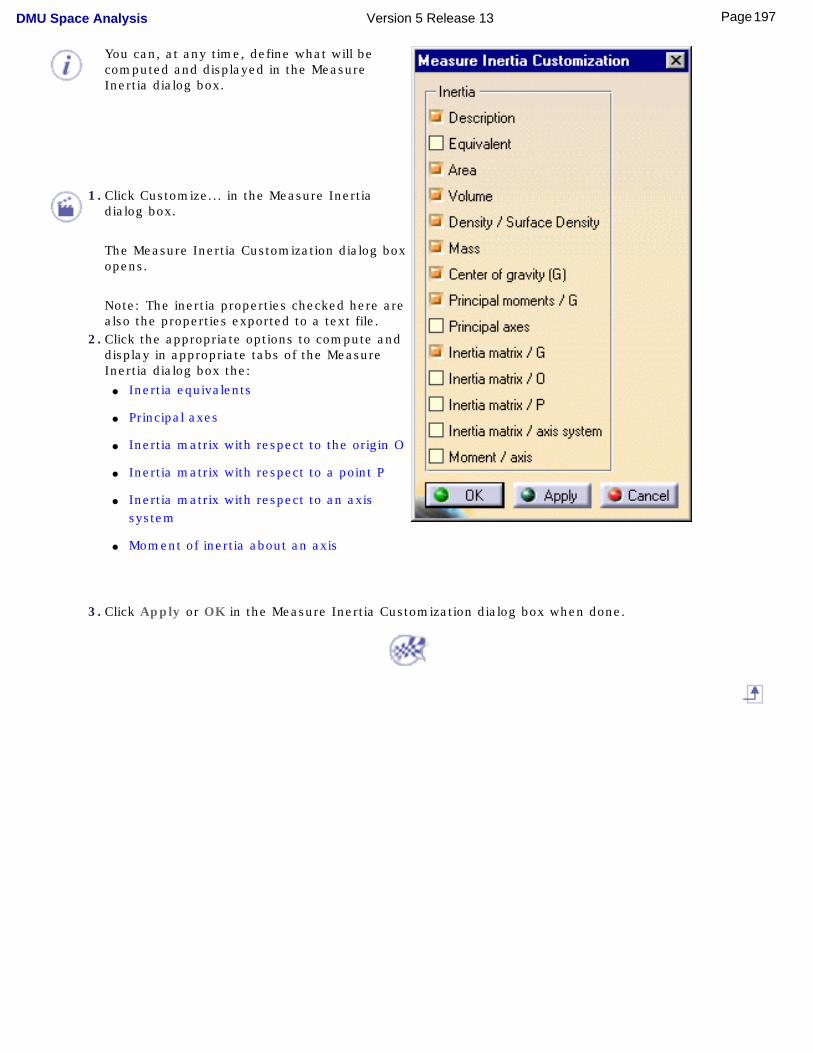
You can, at any time, define what will be computed and displayed in the Measure Inertia dialog box.
1. Click Customize... in the Measure Inertia dialog box.
The Measure Inertia Customization dialog box opens.
Note: The inertia properties checked here are also the properties exported to a text file.
2. Click the appropriate options to compute and display in appropriate tabs of the Measure Inertia dialog box the:
● Inertia equivalents
● Principal axes
● Inertia matrix with respect to the origin O
● Inertia matrix with respect to a point P
● Inertia matrix with respect to an axis system
● Moment of inertia about an axis
3. Click Apply or OK in the Measure Inertia Customization dialog box when done.
197Page DMU Space Analysis Version 5 Release 13
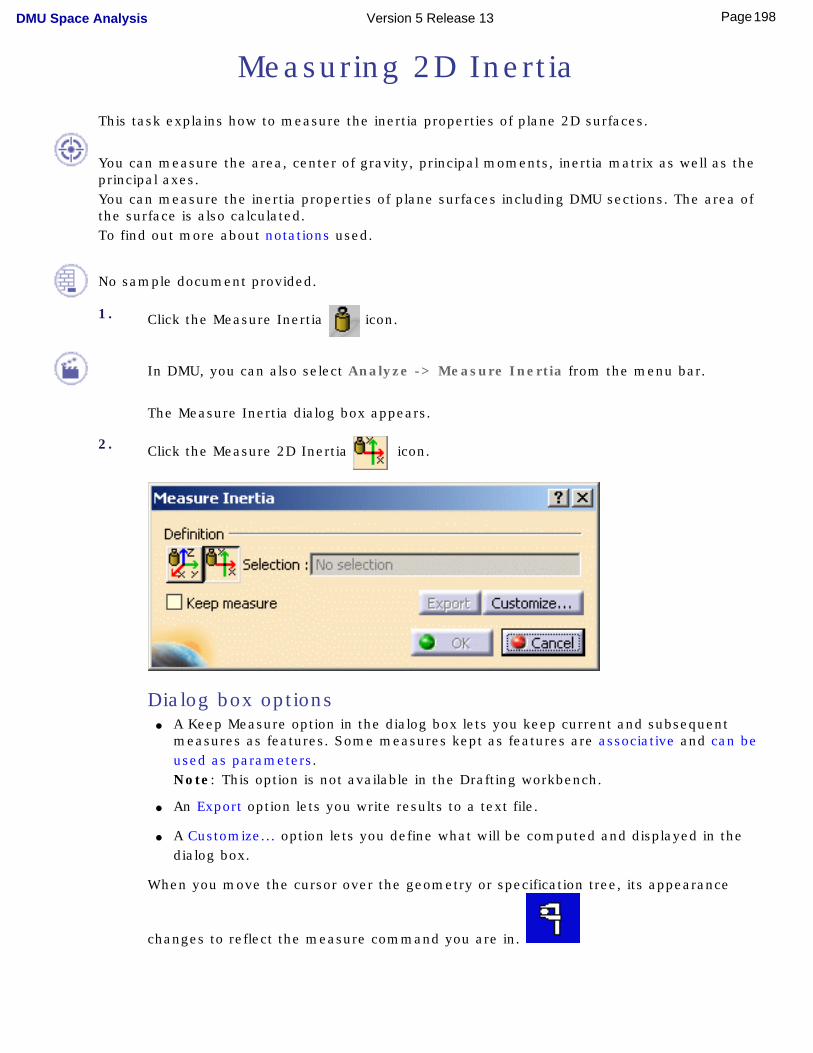
Measuring 2D Inertia
This task explains how to measure the inertia properties of plane 2D surfaces.
You can measure the area, center of gravity, principal moments, inertia matrix as well as the principal axes.You can measure the inertia properties of plane surfaces including DMU sections. The area of the surface is also calculated.To find out more about notations used.
No sample document provided.
1. Click the Measure Inertia icon.
In DMU, you can also select Analyze -> Measure Inertia from the menu bar.
The Measure Inertia dialog box appears.
2. Click the Measure 2D Inertia icon.
Dialog box options ● A Keep Measure option in the dialog box lets you keep current and subsequent
measures as features. Some measures kept as features are associative and can be used as parameters.Note: This option is not available in the Drafting workbench.
● An Export option lets you write results to a text file.
● A Customize... option lets you define what will be computed and displayed in the dialog box.
When you move the cursor over the geometry or specification tree, its appearance
changes to reflect the measure command you are in.
198Page DMU Space Analysis Version 5 Release 13
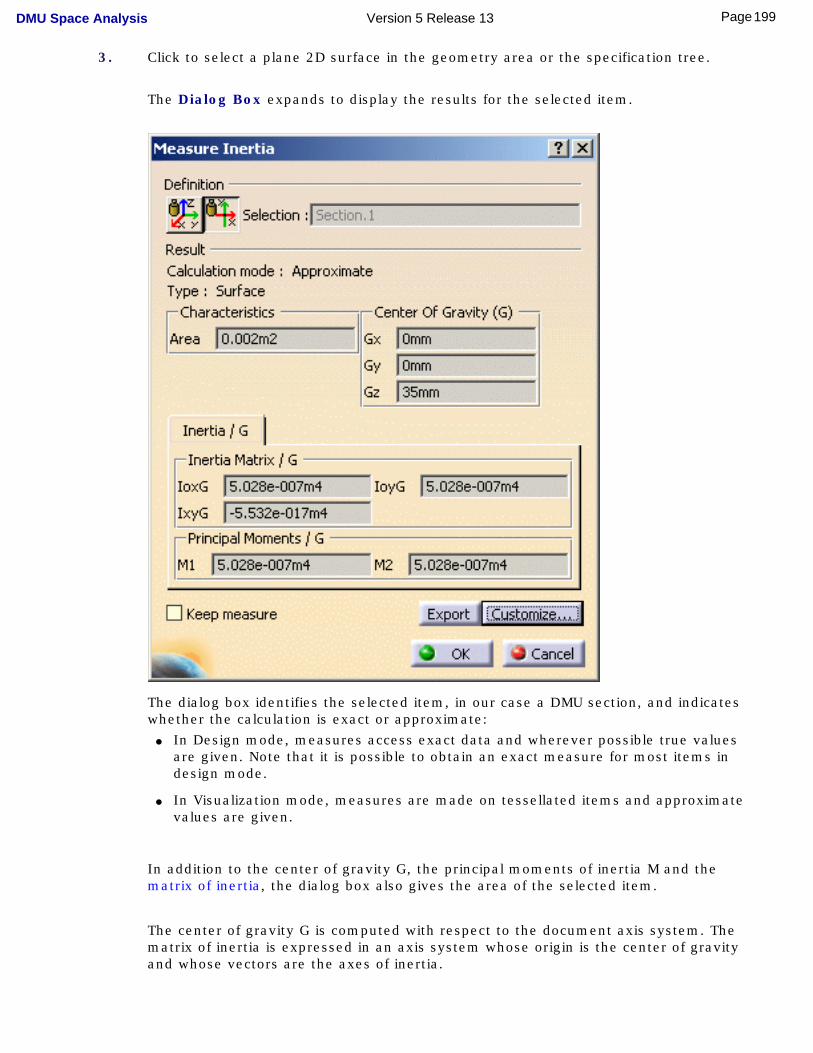
3. Click to select a plane 2D surface in the geometry area or the specification tree.
The Dialog Box expands to display the results for the selected item.
The dialog box identifies the selected item, in our case a DMU section, and indicates whether the calculation is exact or approximate:
● In Design mode, measures access exact data and wherever possible true values are given. Note that it is possible to obtain an exact measure for most items in design mode.
● In Visualization mode, measures are made on tessellated items and approximate values are given.
In addition to the center of gravity G, the principal moments of inertia M and the matrix of inertia, the dialog box also gives the area of the selected item.
The center of gravity G is computed with respect to the document axis system. The matrix of inertia is expressed in an axis system whose origin is the center of gravity and whose vectors are the axes of inertia.
199Page DMU Space Analysis Version 5 Release 13
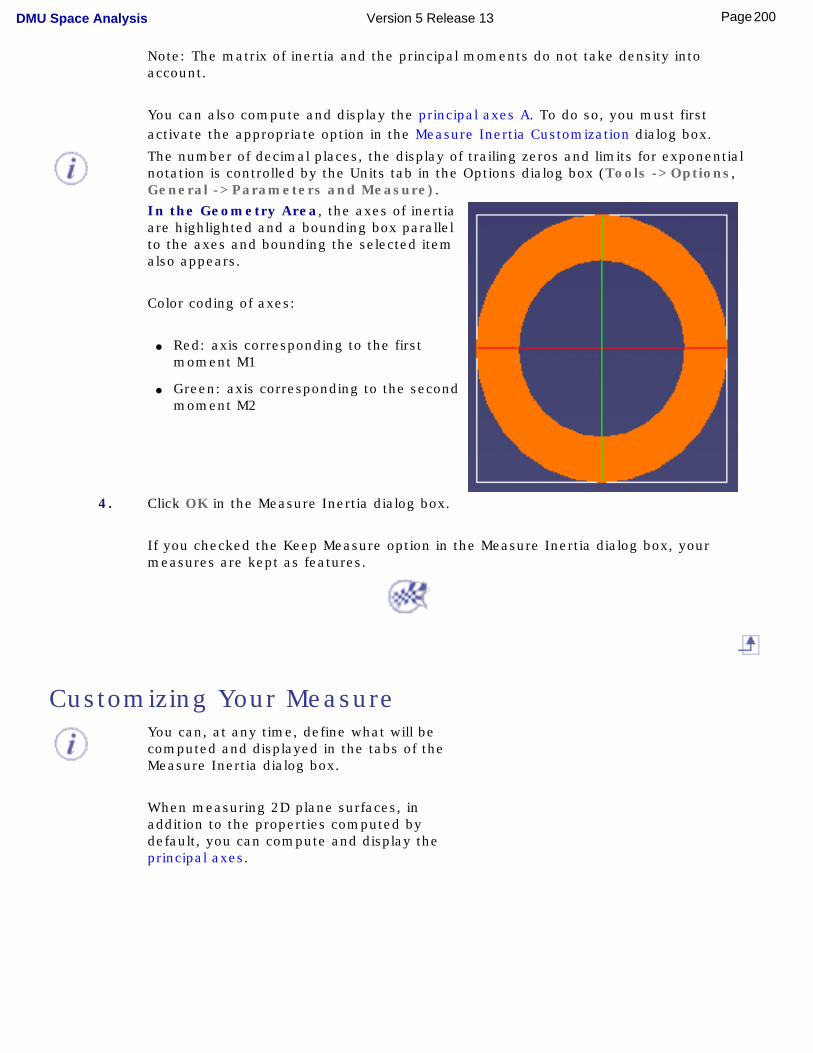
Note: The matrix of inertia and the principal moments do not take density into account.
You can also compute and display the principal axes A. To do so, you must first activate the appropriate option in the Measure Inertia Customization dialog box.
The number of decimal places, the display of trailing zeros and limits for exponential notation is controlled by the Units tab in the Options dialog box (Tools ->Options, General ->Parameters and Measure). In the Geometry Area, the axes of inertia are highlighted and a bounding box parallel to the axes and bounding the selected item also appears.
Color coding of axes:
● Red: axis corresponding to the first moment M1
● Green: axis corresponding to the second moment M2
4. Click OK in the Measure Inertia dialog box.
If you checked the Keep Measure option in the Measure Inertia dialog box, your measures are kept as features.
Customizing Your MeasureYou can, at any time, define what will be computed and displayed in the tabs of the Measure Inertia dialog box.
When measuring 2D plane surfaces, in addition to the properties computed by default, you can compute and display the principal axes.
200Page DMU Space Analysis Version 5 Release 13
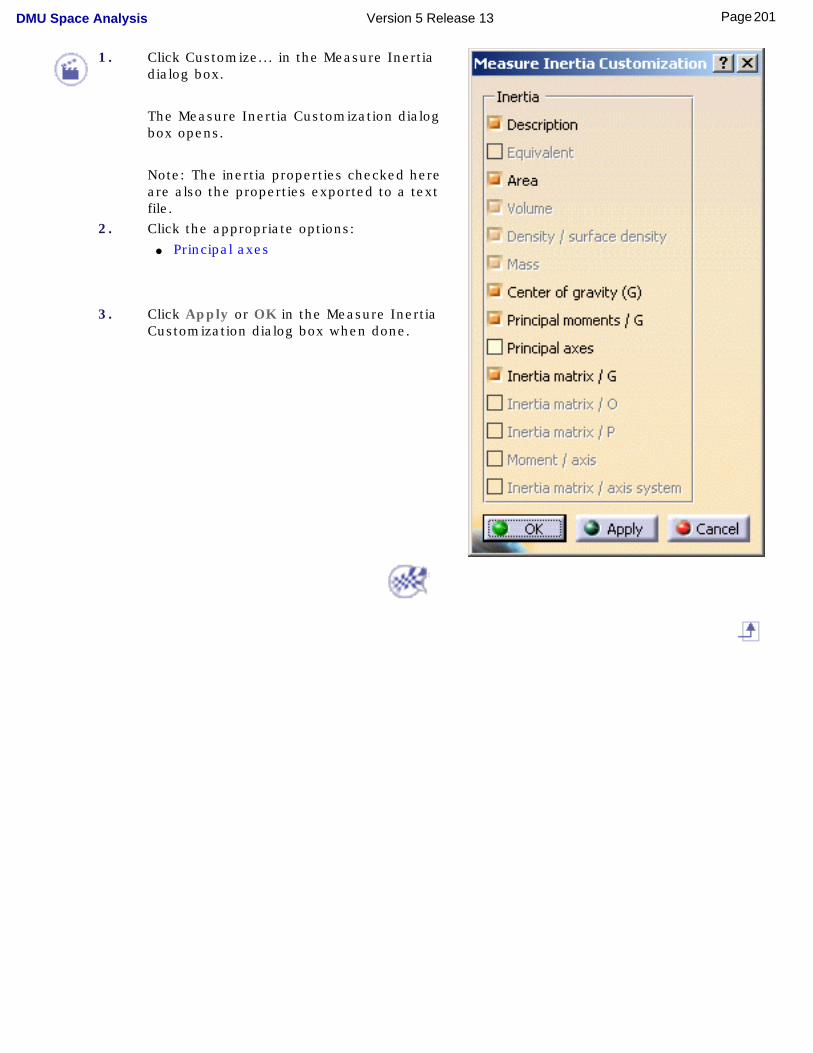
1. Click Customize... in the Measure Inertia dialog box.
The Measure Inertia Customization dialog box opens.
Note: The inertia properties checked here are also the properties exported to a text file.
2. Click the appropriate options:● Principal axes
3. Click Apply or OK in the Measure Inertia Customization dialog box when done.
201Page DMU Space Analysis Version 5 Release 13
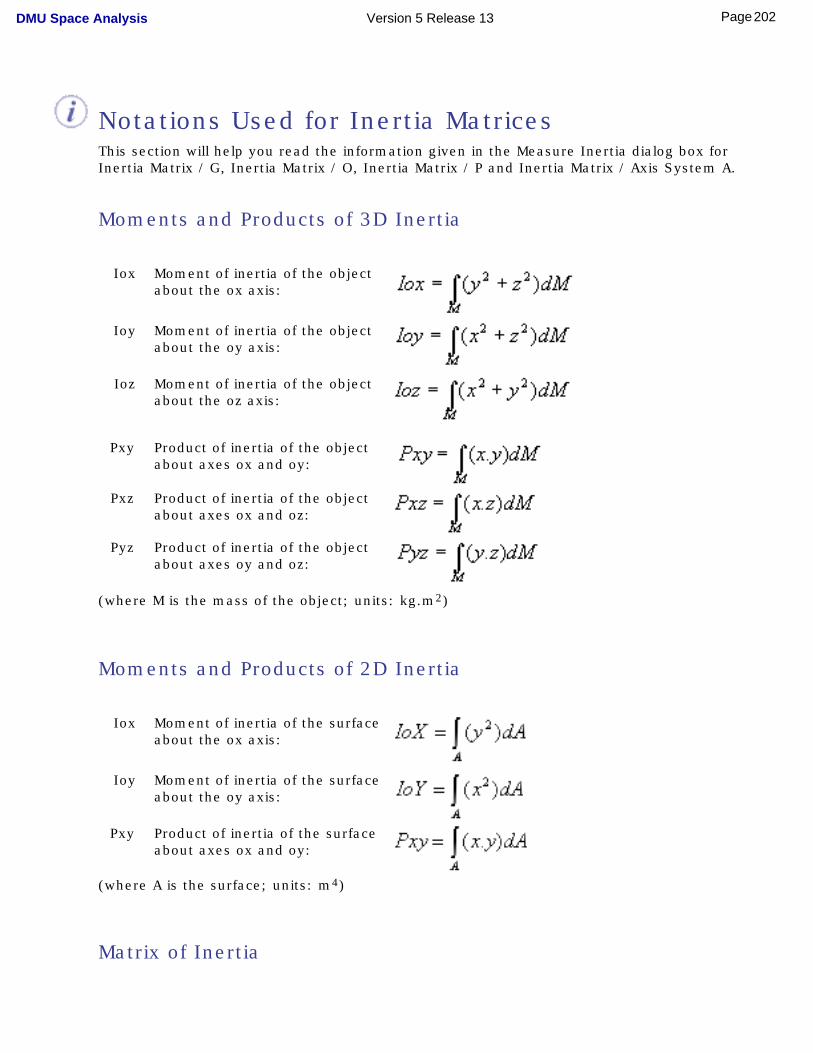
Notations Used for Inertia MatricesThis section will help you read the information given in the Measure Inertia dialog box for Inertia Matrix / G, Inertia Matrix / O, Inertia Matrix / P and Inertia Matrix / Axis System A.
Moments and Products of 3D Inertia
Iox Moment of inertia of the object about the ox axis:
Ioy Moment of inertia of the object about the oy axis:
Ioz Moment of inertia of the object about the oz axis:
Pxy Product of inertia of the object about axes ox and oy:
Pxz Product of inertia of the object about axes ox and oz:
Pyz Product of inertia of the object about axes oy and oz:
(where M is the mass of the object; units: kg.m2)
Moments and Products of 2D Inertia
Iox Moment of inertia of the surface about the ox axis:
Ioy Moment of inertia of the surface about the oy axis:
Pxy Product of inertia of the surface about axes ox and oy:
(where A is the surface; units: m4)
Matrix of Inertia
202Page DMU Space Analysis Version 5 Release 13
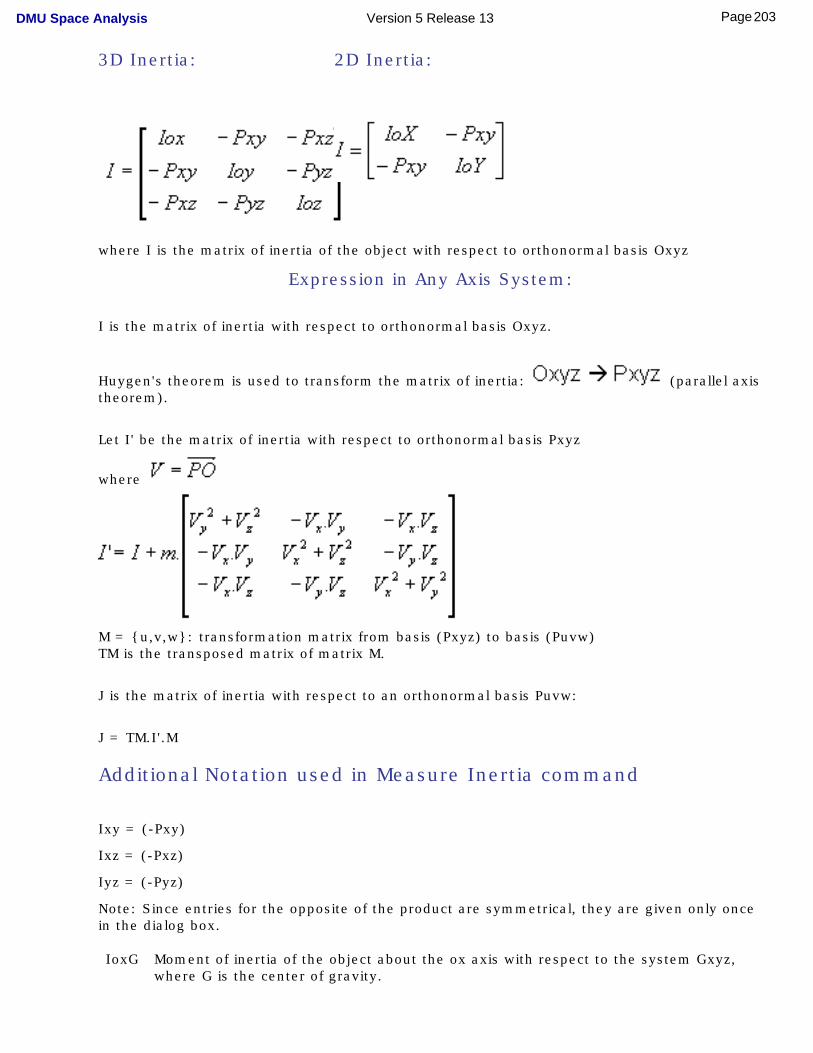
3D Inertia: 2D Inertia:
where I is the matrix of inertia of the object with respect to orthonormal basis Oxyz
Expression in Any Axis System:
I is the matrix of inertia with respect to orthonormal basis Oxyz.
Huygen's theorem is used to transform the matrix of inertia: (parallel axis theorem).
Let I' be the matrix of inertia with respect to orthonormal basis Pxyz
where
M = {u,v,w}: transformation matrix from basis (Pxyz) to basis (Puvw)TM is the transposed matrix of matrix M.
J is the matrix of inertia with respect to an orthonormal basis Puvw:
J = TM.I'.M
Additional Notation used in Measure Inertia command
Ixy = (-Pxy)
Ixz = (-Pxz)
Iyz = (-Pyz)
Note: Since entries for the opposite of the product are symmetrical, they are given only once in the dialog box.
IoxG Moment of inertia of the object about the ox axis with respect to the system Gxyz, where G is the center of gravity.
203Page DMU Space Analysis Version 5 Release 13
IoxO Moment of inertia of the object about the ox axis with respect to the system Oxyz, where O is the origin of the document.
IoxP Moment of inertia of the object about the ox axis with respect to the system Pxyz, where P is a selected point.
IoxA Moment of inertia of the object about the ox axis with respect to the system Axyz, where A is a selected axis system.
etc.
204Page DMU Space Analysis Version 5 Release 13
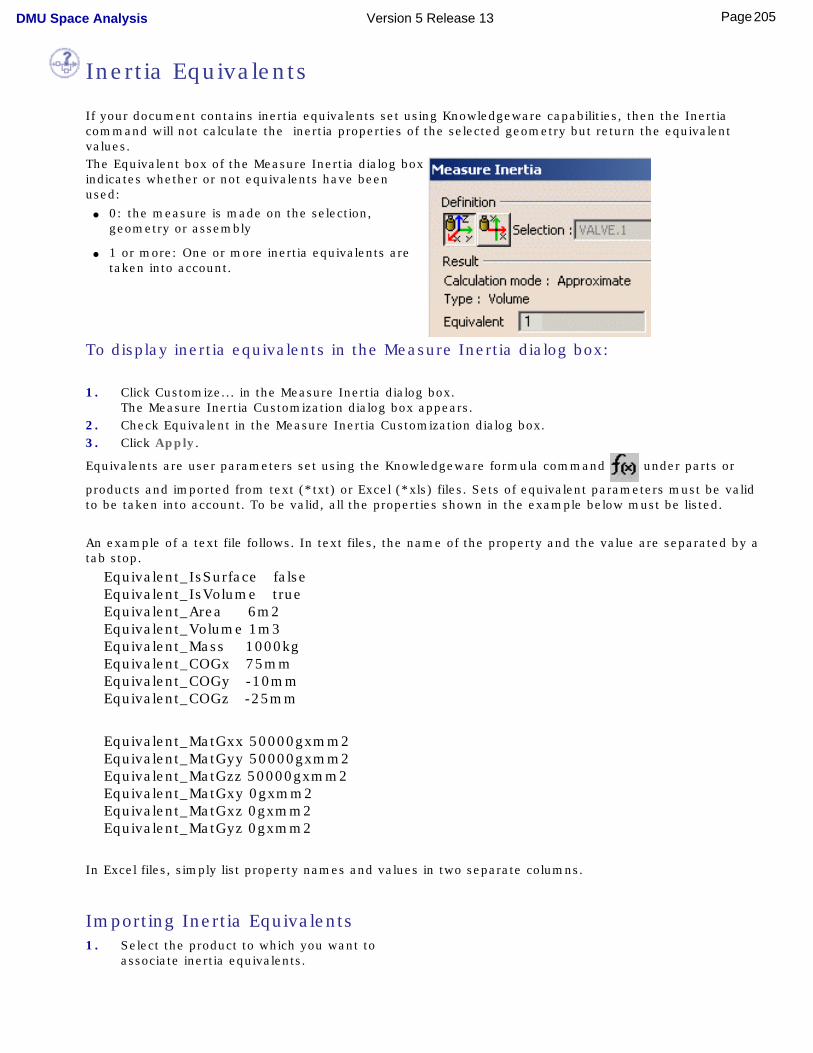
Inertia Equivalents
If your document contains inertia equivalents set using Knowledgeware capabilities, then the Inertia command will not calculate the inertia properties of the selected geometry but return the equivalent values.The Equivalent box of the Measure Inertia dialog box indicates whether or not equivalents have been used:
● 0: the measure is made on the selection, geometry or assembly
● 1 or more: One or more inertia equivalents are taken into account.
To display inertia equivalents in the Measure Inertia dialog box:
1. Click Customize... in the Measure Inertia dialog box.The Measure Inertia Customization dialog box appears.
2. Check Equivalent in the Measure Inertia Customization dialog box.3. Click Apply.
Equivalents are user parameters set using the Knowledgeware formula command under parts or
products and imported from text (*txt) or Excel (*xls) files. Sets of equivalent parameters must be valid to be taken into account. To be valid, all the properties shown in the example below must be listed.
An example of a text file follows. In text files, the name of the property and the value are separated by a tab stop.
Equivalent_IsSurface falseEquivalent_IsVolume trueEquivalent_Area 6m2Equivalent_Volume 1m3Equivalent_Mass 1000kgEquivalent_COGx 75mmEquivalent_COGy -10mmEquivalent_COGz -25mm
Equivalent_MatGxx 50000gxmm2Equivalent_MatGyy 50000gxmm2Equivalent_MatGzz 50000gxmm2Equivalent_MatGxy 0gxmm2Equivalent_MatGxz 0gxmm2Equivalent_MatGyz 0gxmm2
In Excel files, simply list property names and values in two separate columns.
Importing Inertia Equivalents1. Select the product to which you want to
associate inertia equivalents.
205Page DMU Space Analysis Version 5 Release 13
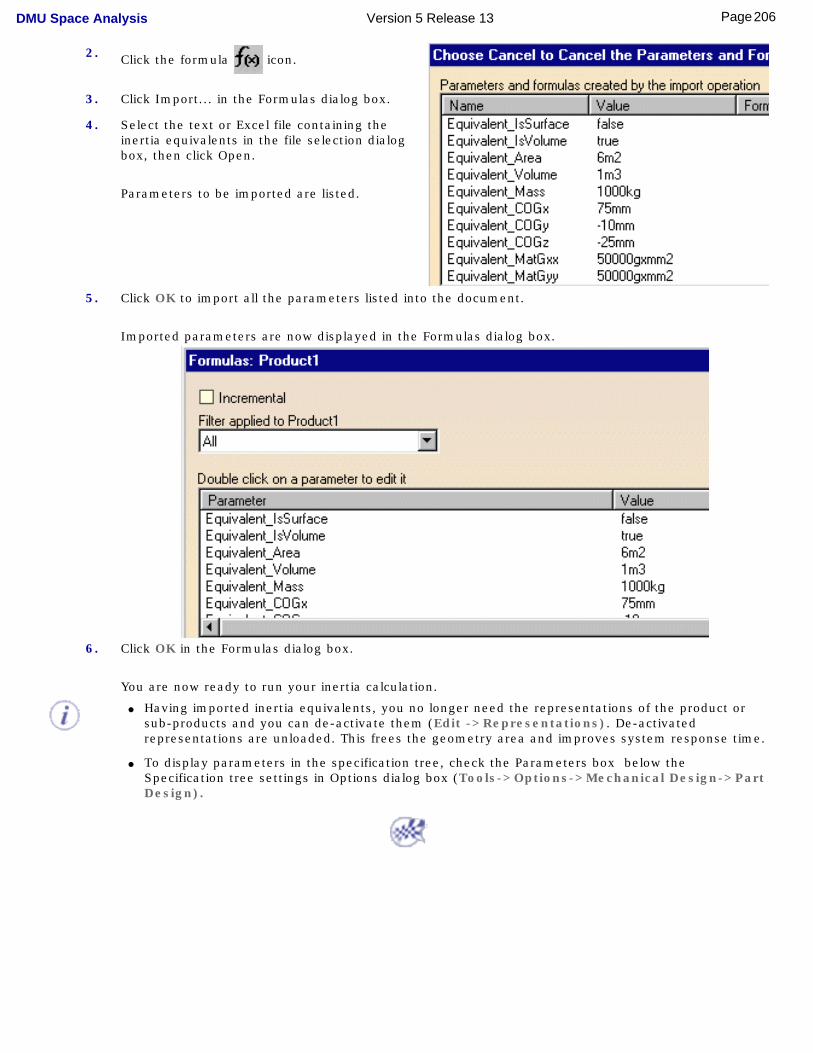
2. Click the formula icon.
3. Click Import... in the Formulas dialog box.
4. Select the text or Excel file containing the inertia equivalents in the file selection dialog box, then click Open.
Parameters to be imported are listed.
5. Click OK to import all the parameters listed into the document.
Imported parameters are now displayed in the Formulas dialog box.
6. Click OK in the Formulas dialog box.
You are now ready to run your inertia calculation.
● Having imported inertia equivalents, you no longer need the representations of the product or sub-products and you can de-activate them (Edit ->Representations). De-activated representations are unloaded. This frees the geometry area and improves system response time.
● To display parameters in the specification tree, check the Parameters box below the Specification tree settings in Options dialog box (Tools->Options->Mechanical Design->Part Design).
206Page DMU Space Analysis Version 5 Release 13
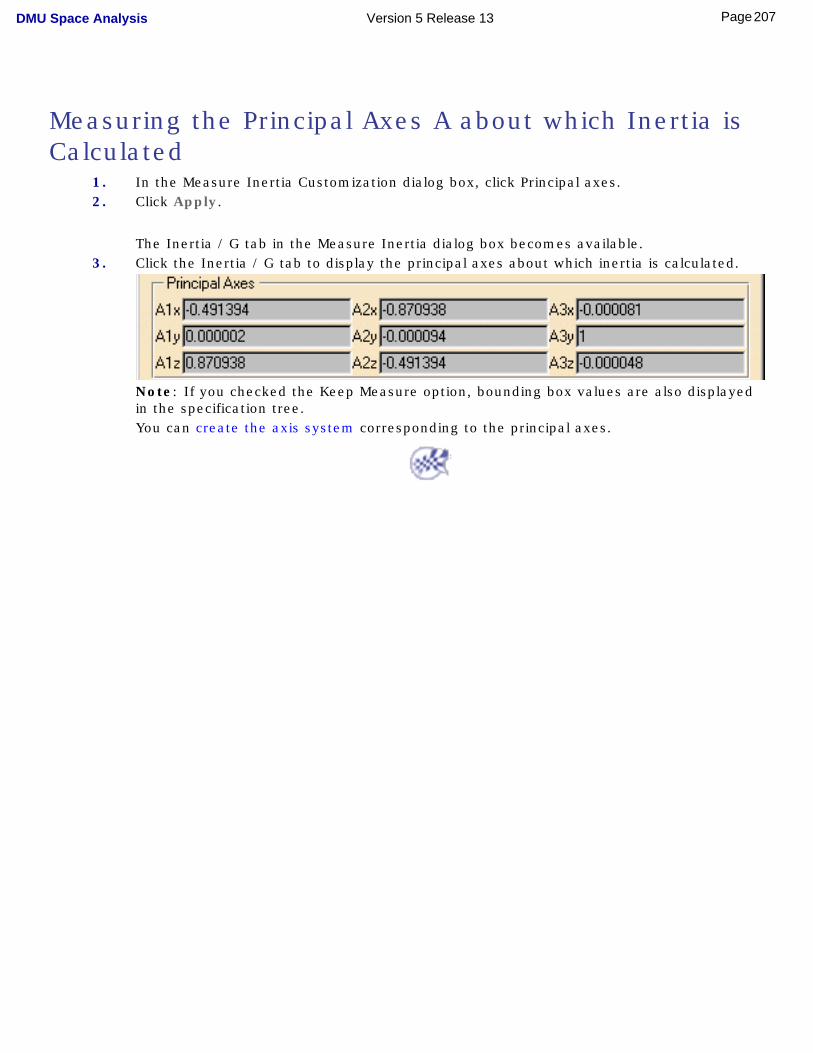
Measuring the Principal Axes A about which Inertia is Calculated
1. In the Measure Inertia Customization dialog box, click Principal axes.2. Click Apply.
The Inertia / G tab in the Measure Inertia dialog box becomes available. 3. Click the Inertia / G tab to display the principal axes about which inertia is calculated.
Note: If you checked the Keep Measure option, bounding box values are also displayed in the specification tree.You can create the axis system corresponding to the principal axes.
207Page DMU Space Analysis Version 5 Release 13
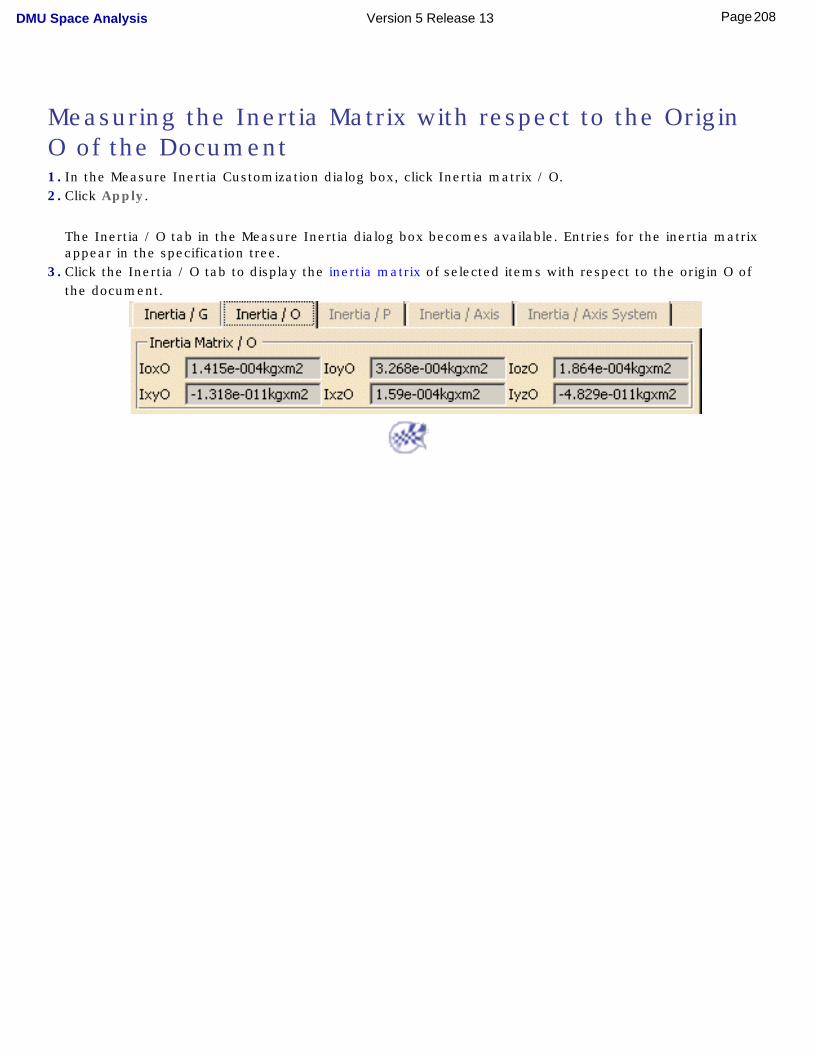
Measuring the Inertia Matrix with respect to the Origin O of the Document1. In the Measure Inertia Customization dialog box, click Inertia matrix / O.2. Click Apply.
The Inertia / O tab in the Measure Inertia dialog box becomes available. Entries for the inertia matrix appear in the specification tree.
3. Click the Inertia / O tab to display the inertia matrix of selected items with respect to the origin O of the document.
208Page DMU Space Analysis Version 5 Release 13
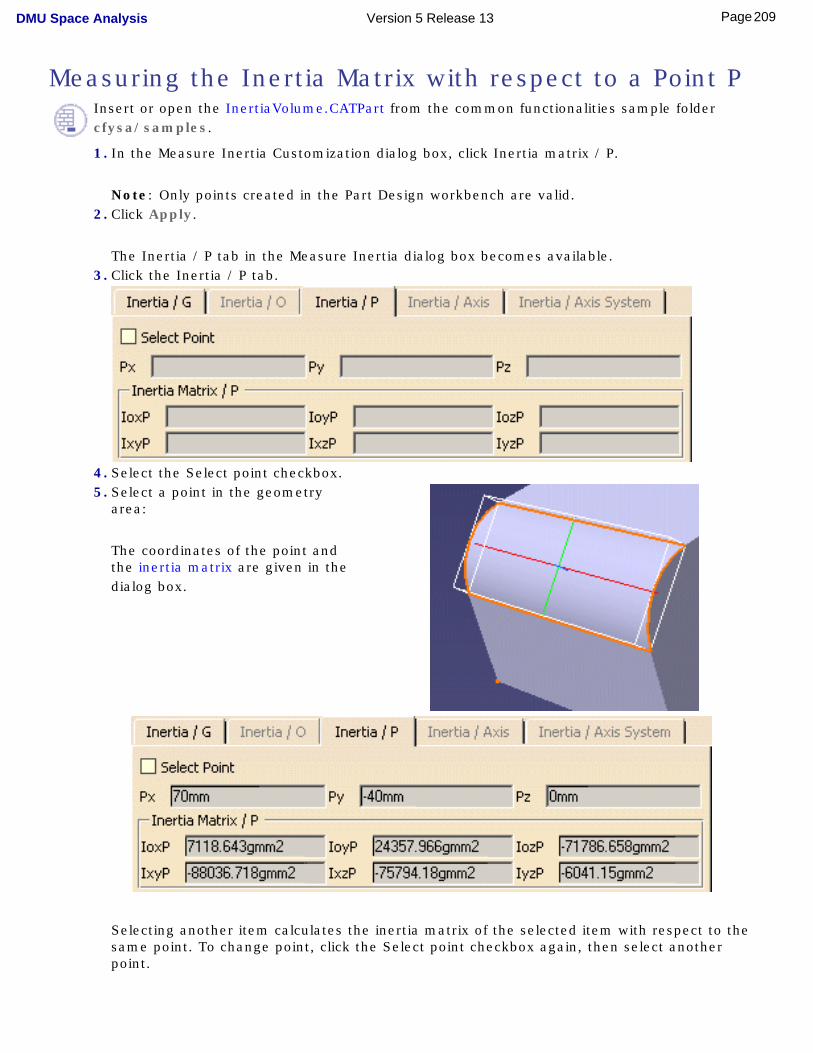
Measuring the Inertia Matrix with respect to a Point PInsert or open the InertiaVolume.CATPart from the common functionalities sample folder cfysa/samples.
1. In the Measure Inertia Customization dialog box, click Inertia matrix / P.
Note: Only points created in the Part Design workbench are valid.2. Click Apply.
The Inertia / P tab in the Measure Inertia dialog box becomes available. 3. Click the Inertia / P tab.
4. Select the Select point checkbox.5. Select a point in the geometry
area:
The coordinates of the point and the inertia matrix are given in the dialog box.
Selecting another item calculates the inertia matrix of the selected item with respect to the same point. To change point, click the Select point checkbox again, then select another point.
209Page DMU Space Analysis Version 5 Release 13

210Page DMU Space Analysis Version 5 Release 13
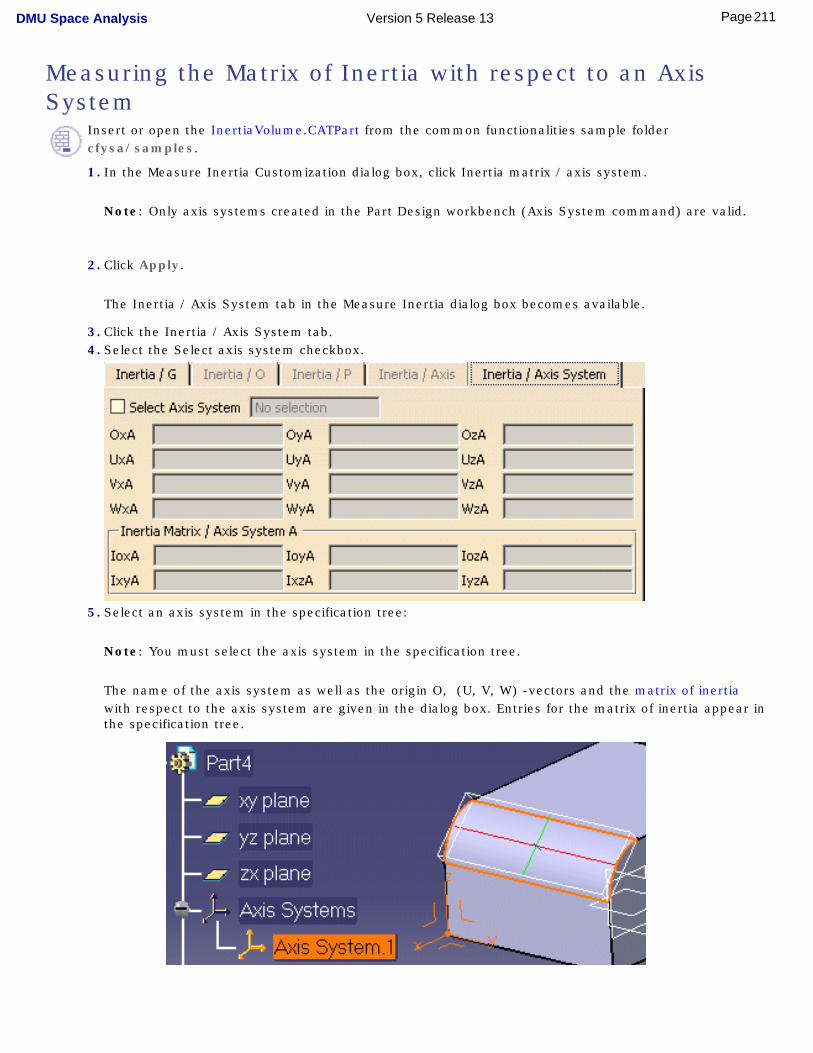
Measuring the Matrix of Inertia with respect to an Axis System
Insert or open the InertiaVolume.CATPart from the common functionalities sample folder cfysa/samples.
1. In the Measure Inertia Customization dialog box, click Inertia matrix / axis system.
Note: Only axis systems created in the Part Design workbench (Axis System command) are valid.
2. Click Apply.
The Inertia / Axis System tab in the Measure Inertia dialog box becomes available.
3. Click the Inertia / Axis System tab.4. Select the Select axis system checkbox.
5. Select an axis system in the specification tree:
Note: You must select the axis system in the specification tree.
The name of the axis system as well as the origin O, (U, V, W) -vectors and the matrix of inertia with respect to the axis system are given in the dialog box. Entries for the matrix of inertia appear in the specification tree.
211Page DMU Space Analysis Version 5 Release 13
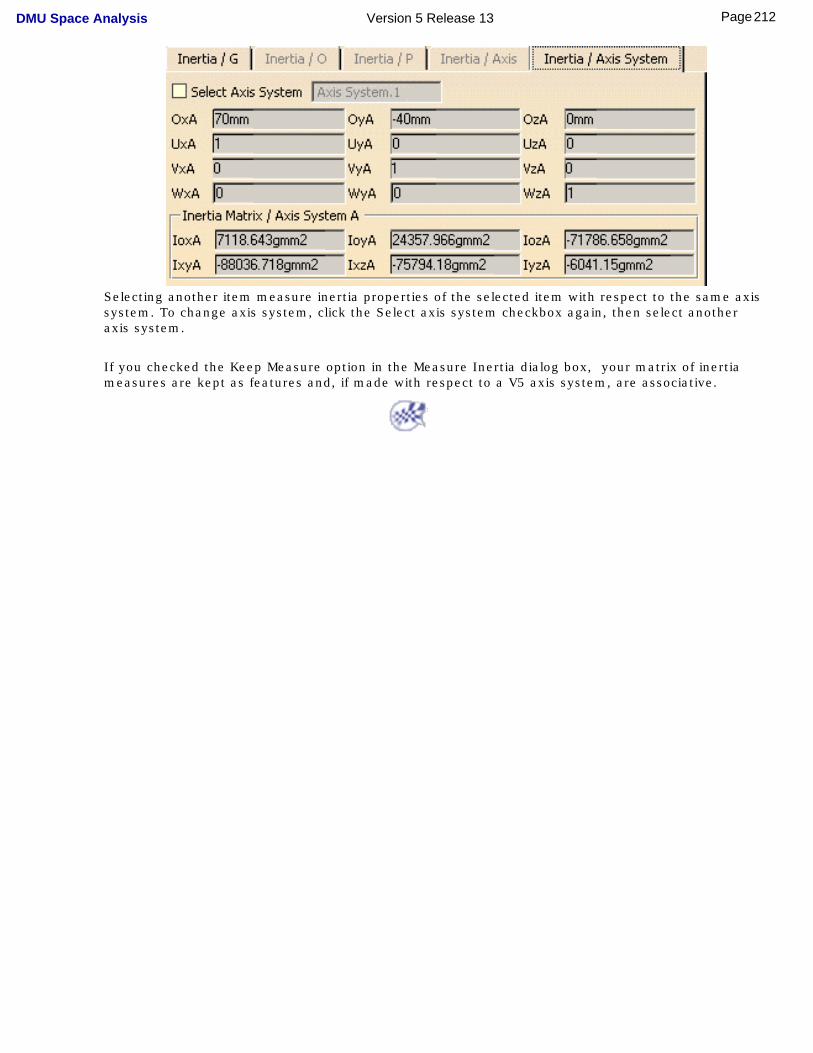
Selecting another item measure inertia properties of the selected item with respect to the same axis system. To change axis system, click the Select axis system checkbox again, then select another axis system.
If you checked the Keep Measure option in the Measure Inertia dialog box, your matrix of inertia measures are kept as features and, if made with respect to a V5 axis system, are associative.
212Page DMU Space Analysis Version 5 Release 13
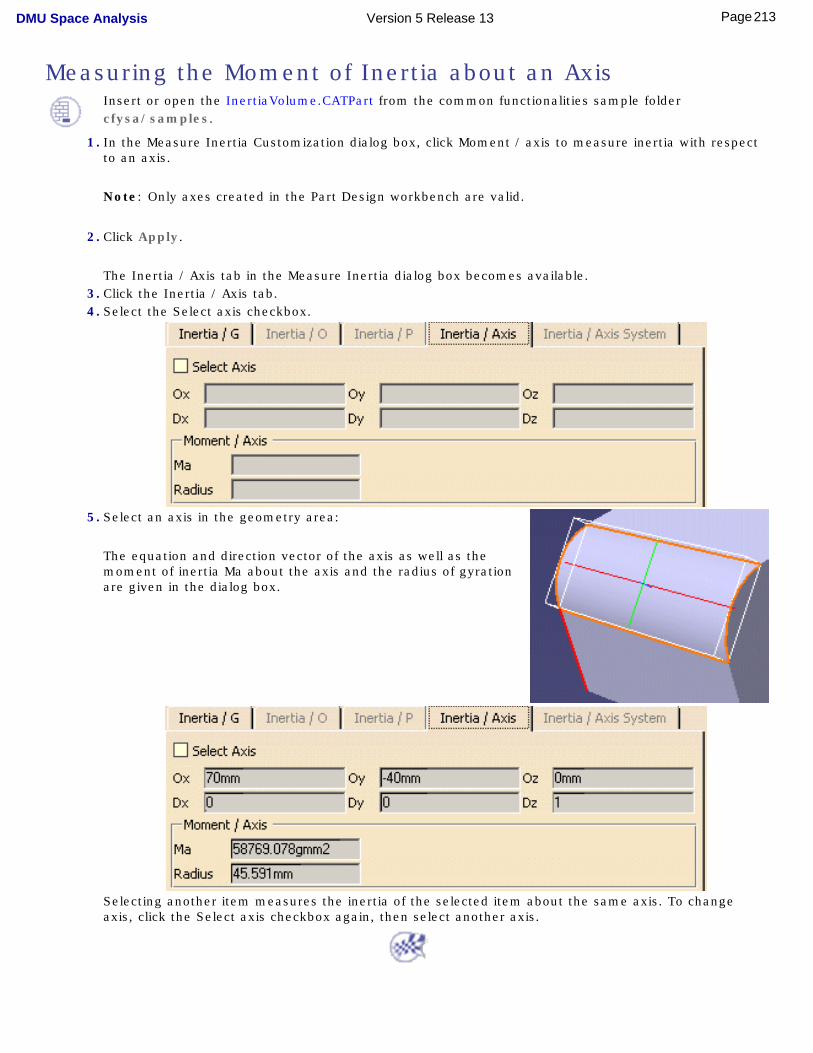
Measuring the Moment of Inertia about an AxisInsert or open the InertiaVolume.CATPart from the common functionalities sample folder cfysa/samples.
1. In the Measure Inertia Customization dialog box, click Moment / axis to measure inertia with respect to an axis.
Note: Only axes created in the Part Design workbench are valid.
2. Click Apply.
The Inertia / Axis tab in the Measure Inertia dialog box becomes available. 3. Click the Inertia / Axis tab.
4. Select the Select axis checkbox.
5. Select an axis in the geometry area:
The equation and direction vector of the axis as well as the moment of inertia Ma about the axis and the radius of gyration are given in the dialog box.
Selecting another item measures the inertia of the selected item about the same axis. To change axis, click the Select axis checkbox again, then select another axis.
213Page DMU Space Analysis Version 5 Release 13
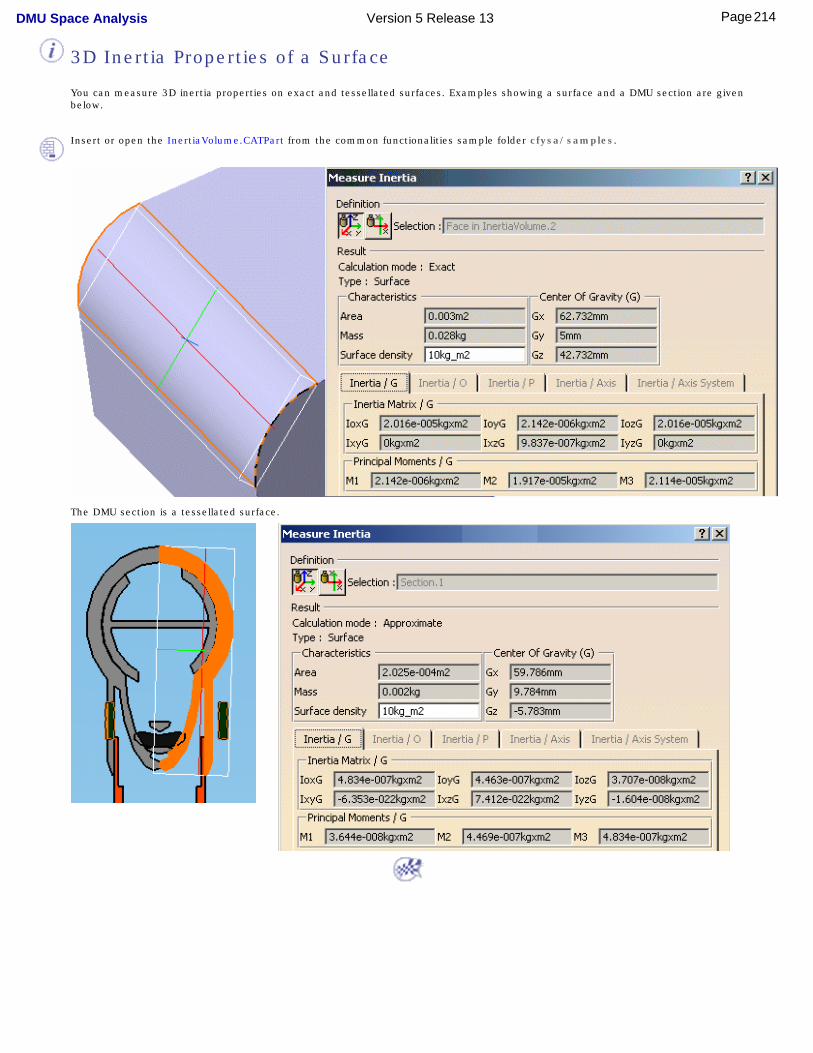
3D Inertia Properties of a Surface
You can measure 3D inertia properties on exact and tessellated surfaces. Examples showing a surface and a DMU section are given below.
Insert or open the InertiaVolume.CATPart from the common functionalities sample folder cfysa/samples.
The DMU section is a tessellated surface.
214Page DMU Space Analysis Version 5 Release 13
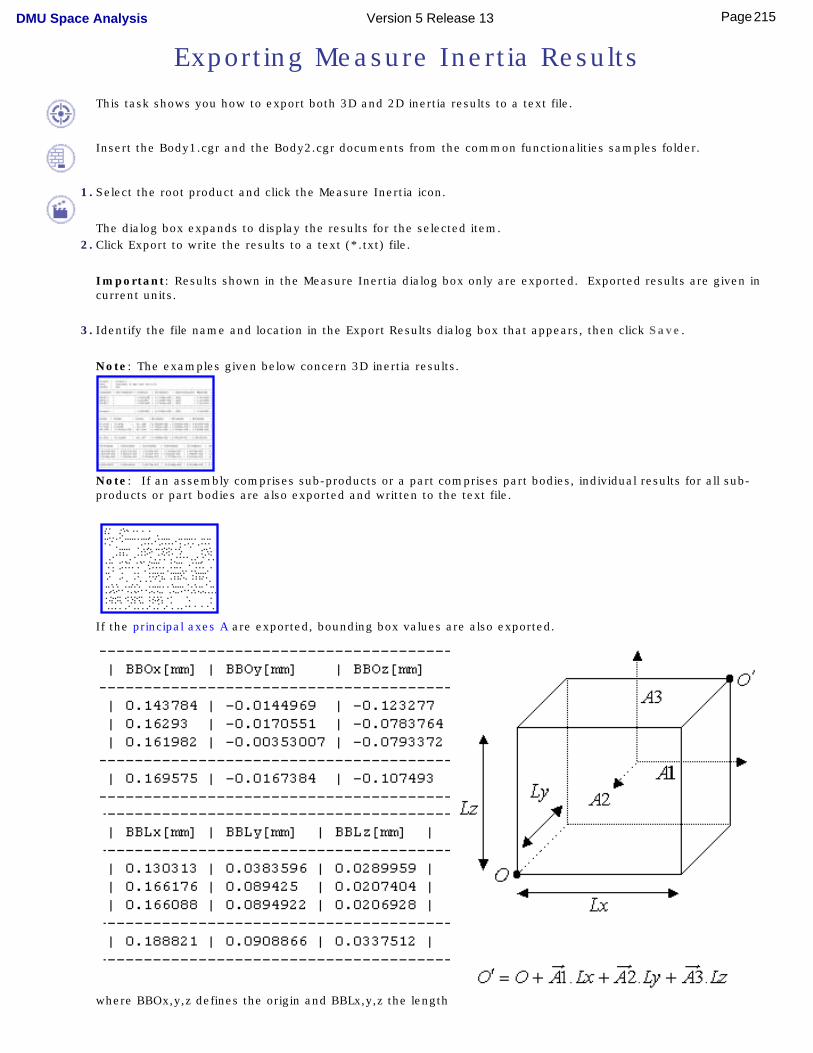
Exporting Measure Inertia Results
This task shows you how to export both 3D and 2D inertia results to a text file.
Insert the Body1.cgr and the Body2.cgr documents from the common functionalities samples folder.
1. Select the root product and click the Measure Inertia icon.
The dialog box expands to display the results for the selected item.2. Click Export to write the results to a text (*.txt) file.
Important: Results shown in the Measure Inertia dialog box only are exported. Exported results are given in current units.
3. Identify the file name and location in the Export Results dialog box that appears, then click Save.
Note: The examples given below concern 3D inertia results.
Note: If an assembly comprises sub-products or a part comprises part bodies, individual results for all sub-products or part bodies are also exported and written to the text file.
If the principal axes A are exported, bounding box values are also exported.
where BBOx,y,z defines the origin and BBLx,y,z the length
215Page DMU Space Analysis Version 5 Release 13

along the corresponding axis.Note: When importing the text file into an Excel spreadsheet, do not forget to identify the pipe character (|) used as separator in the Text Import Wizard dialog box.
216Page DMU Space Analysis Version 5 Release 13
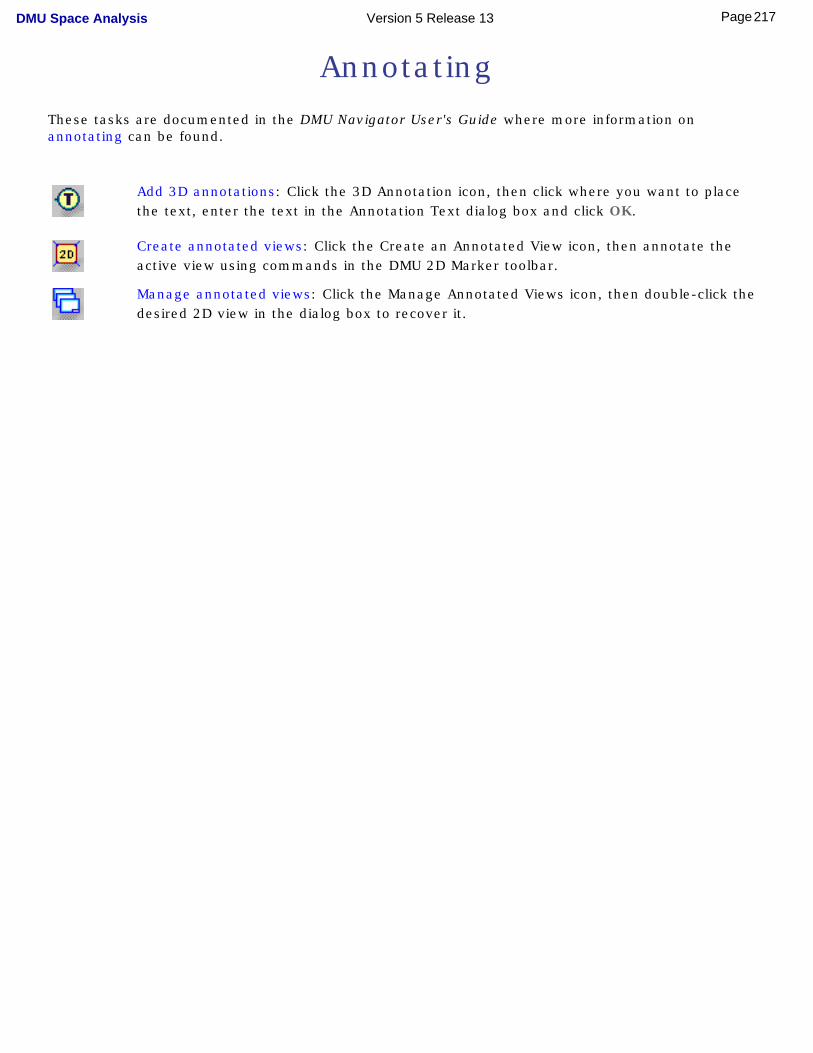
AnnotatingThese tasks are documented in the DMU Navigator User's Guide where more information on annotating can be found.
Add 3D annotations: Click the 3D Annotation icon, then click where you want to place the text, enter the text in the Annotation Text dialog box and click OK.
Create annotated views: Click the Create an Annotated View icon, then annotate the active view using commands in the DMU 2D Marker toolbar.
Manage annotated views: Click the Manage Annotated Views icon, then double-click the desired 2D view in the dialog box to recover it.
217Page DMU Space Analysis Version 5 Release 13
Defining Groups of Products
This task explains how to define groups of products.
A group is a set of products defined explicitly by selecting products individually. Groups are persistent and can be stored in the document.
Insert the following sample cgr files: ATOMIZER.cgr, BODY1.cgr, BODY2.cgr, LOCK.cgr, NOZZLE1.cgr, NOZZLE2.cgr, REGULATION_COMMAND.cgr, REGULATOR.cgr, TRIGGER.cgr and VALVE.cgr.
They are to be found in the online documentation filetree in the common functionalities sample folder cfysa\samples.
1. Select a product in the geometry area or in the specification tree.
2. Ctrl-click other products to add them to the initial selection.
218Page DMU Space Analysis Version 5 Release 13
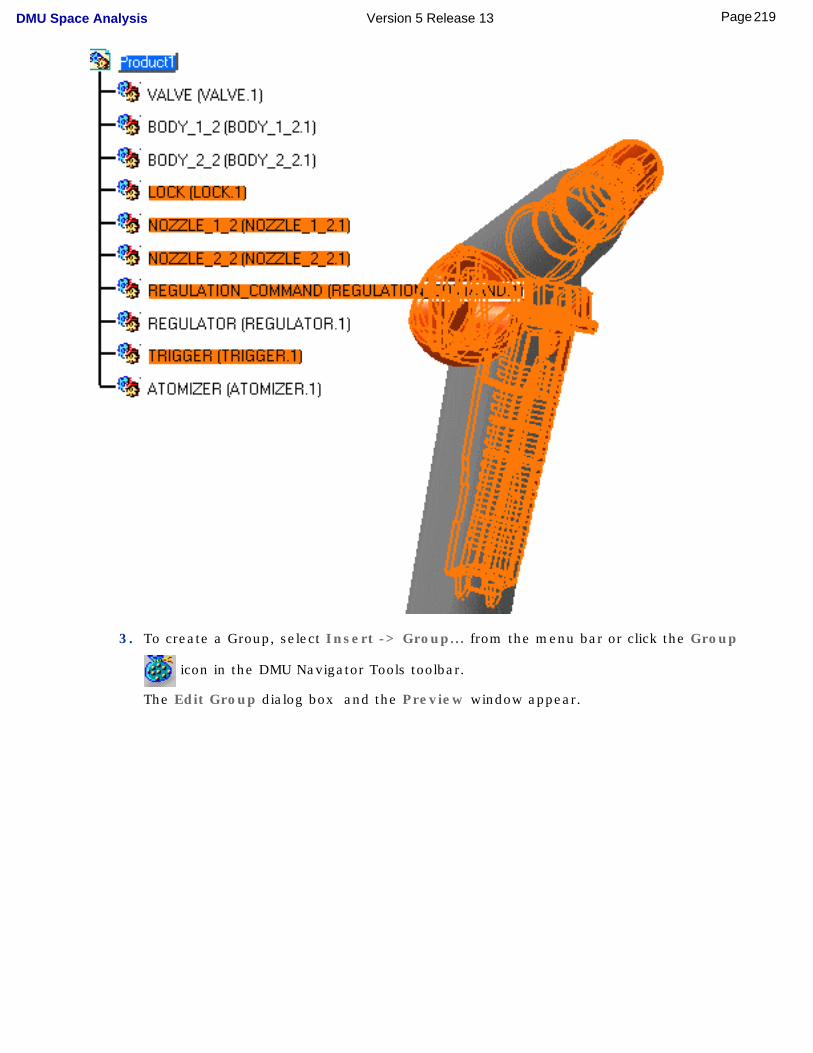
3. To create a Group, select Insert -> Group... from the menu bar or click the Group
icon in the DMU Navigator Tools toolbar.
The Edit Group dialog box and the Preview window appear.
219Page DMU Space Analysis Version 5 Release 13
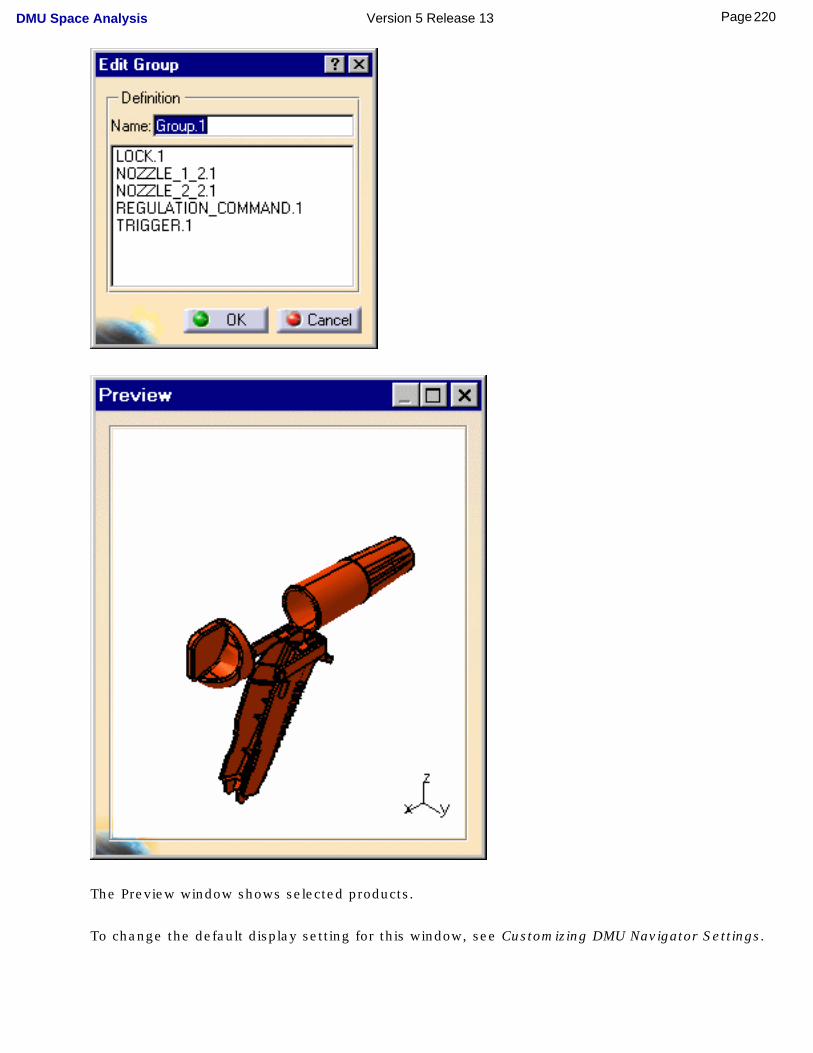
The Preview window shows selected products.
To change the default display setting for this window, see Customizing DMU Navigator Settings.
220Page DMU Space Analysis Version 5 Release 13
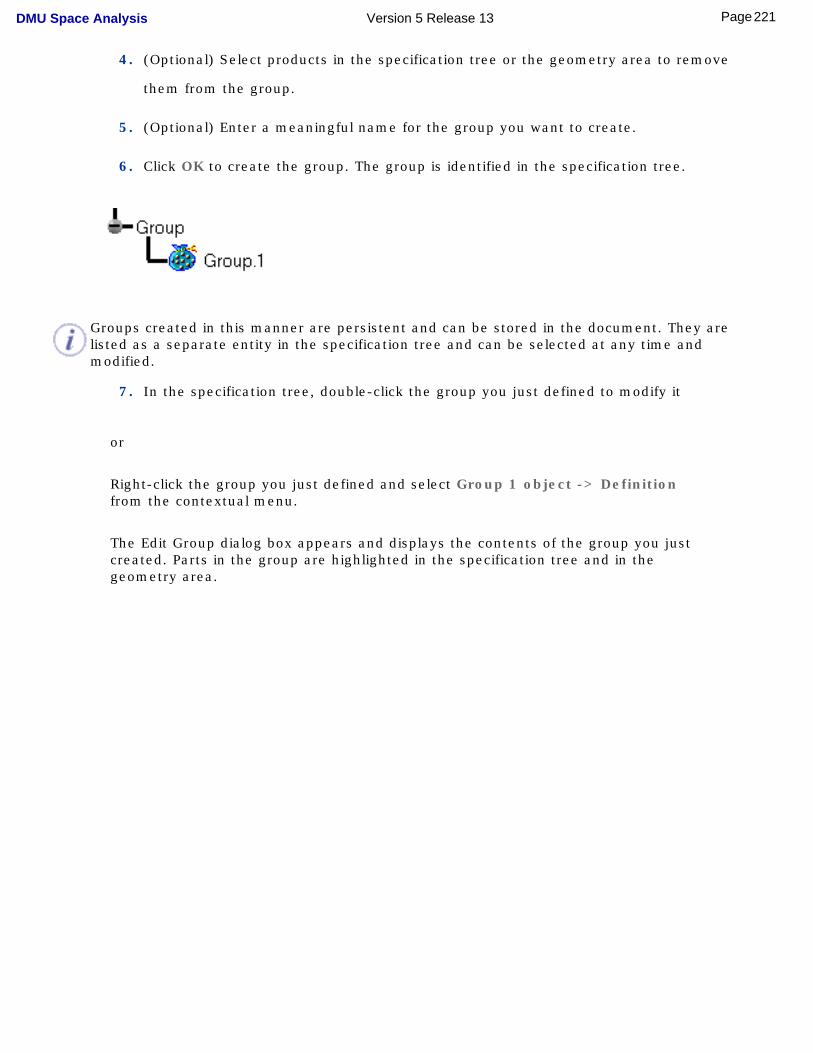
4. (Optional) Select products in the specification tree or the geometry area to remove
them from the group.
5. (Optional) Enter a meaningful name for the group you want to create.
6. Click OK to create the group. The group is identified in the specification tree.
Groups created in this manner are persistent and can be stored in the document. They are listed as a separate entity in the specification tree and can be selected at any time and modified.
7. In the specification tree, double-click the group you just defined to modify it
or
Right-click the group you just defined and select Group 1 object -> Definition from the contextual menu.
The Edit Group dialog box appears and displays the contents of the group you just created. Parts in the group are highlighted in the specification tree and in the geometry area.
221Page DMU Space Analysis Version 5 Release 13
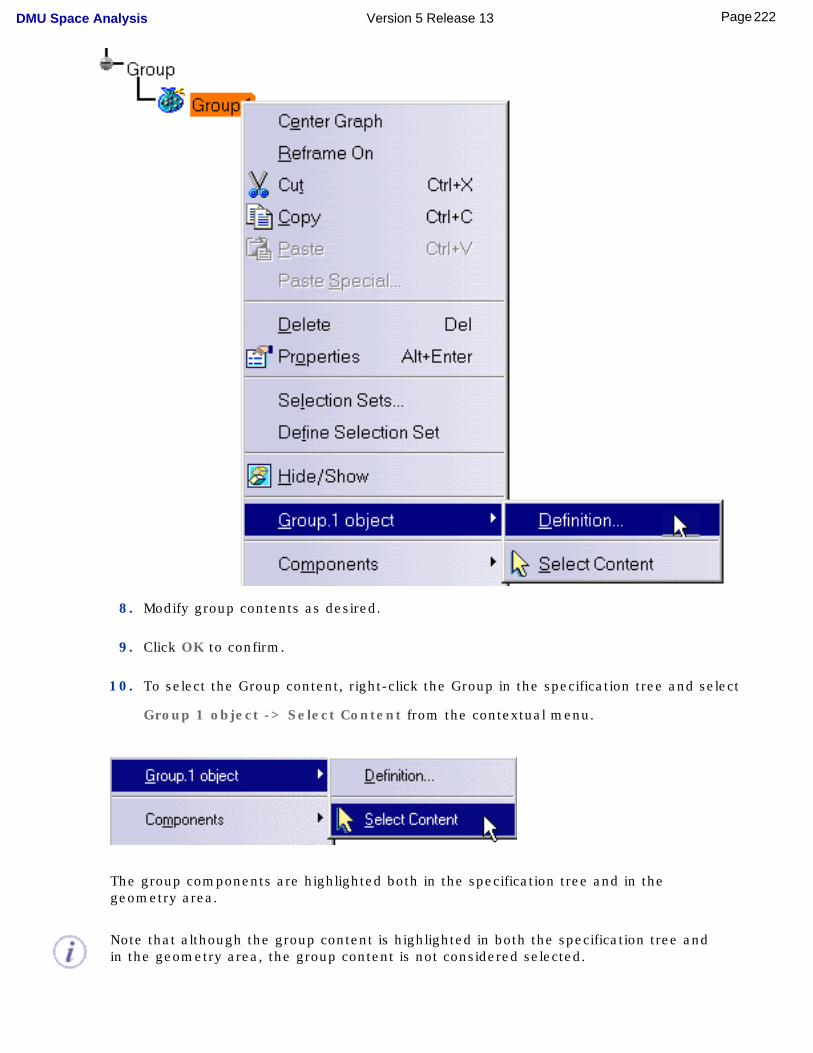
8. Modify group contents as desired.
9. Click OK to confirm.
10. To select the Group content, right-click the Group in the specification tree and select
Group 1 object -> Select Content from the contextual menu.
The group components are highlighted both in the specification tree and in the geometry area.
Note that although the group content is highlighted in both the specification tree and in the geometry area, the group content is not considered selected.
222Page DMU Space Analysis Version 5 Release 13
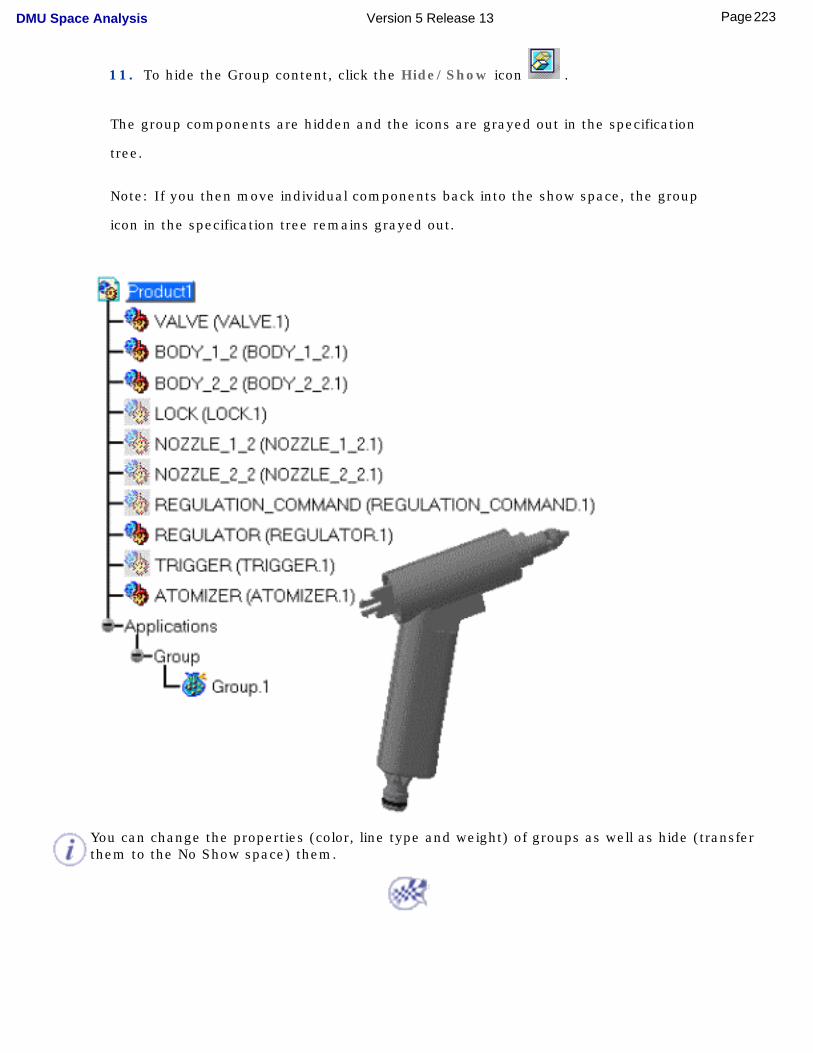
11. To hide the Group content, click the Hide/Show icon .
The group components are hidden and the icons are grayed out in the specification
tree.
Note: If you then move individual components back into the show space, the group
icon in the specification tree remains grayed out.
You can change the properties (color, line type and weight) of groups as well as hide (transfer them to the No Show space) them.
223Page DMU Space Analysis Version 5 Release 13

Combining Space Analysis CommandsSectioning in Interference & Distance Viewers
Measuring Minimum Distance in the Section ViewerSectioning & Visual Comparison
224Page DMU Space Analysis Version 5 Release 13
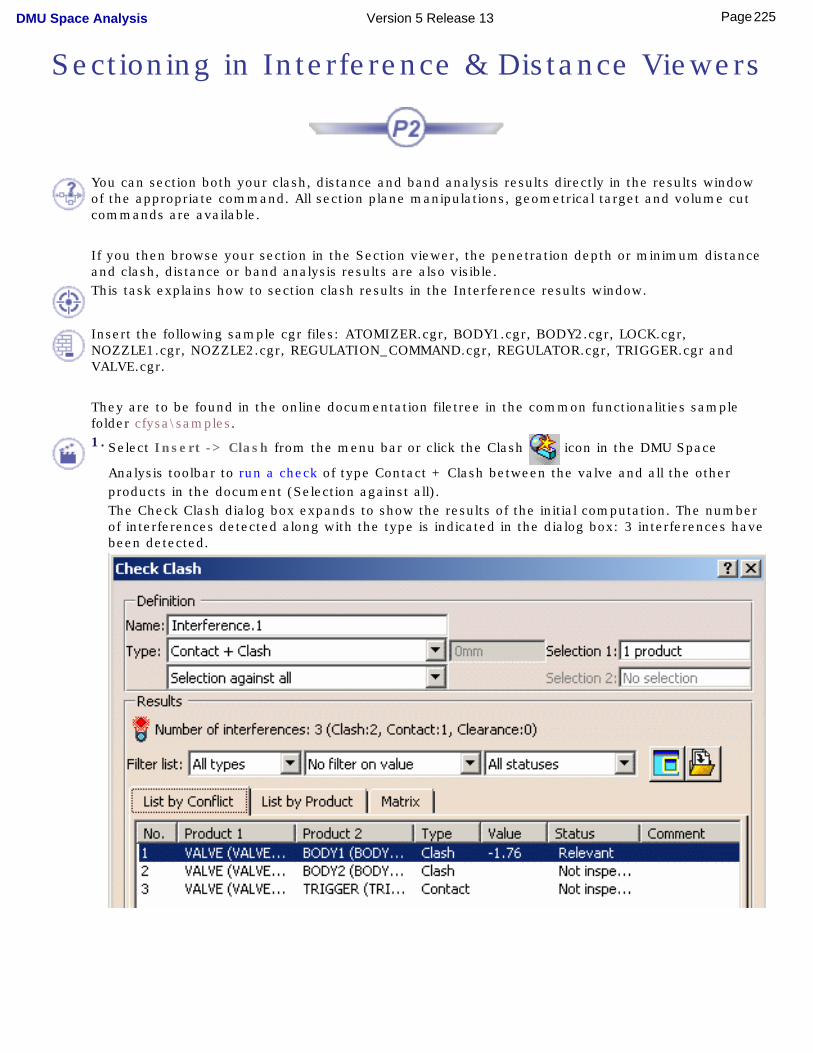
Sectioning in Interference & Distance Viewers
You can section both your clash, distance and band analysis results directly in the results window of the appropriate command. All section plane manipulations, geometrical target and volume cut commands are available.
If you then browse your section in the Section viewer, the penetration depth or minimum distance and clash, distance or band analysis results are also visible.This task explains how to section clash results in the Interference results window.
Insert the following sample cgr files: ATOMIZER.cgr, BODY1.cgr, BODY2.cgr, LOCK.cgr, NOZZLE1.cgr, NOZZLE2.cgr, REGULATION_COMMAND.cgr, REGULATOR.cgr, TRIGGER.cgr and VALVE.cgr.
They are to be found in the online documentation filetree in the common functionalities sample folder cfysa\samples.
1. Select Insert -> Clash from the menu bar or click the Clash icon in the DMU Space
Analysis toolbar to run a check of type Contact + Clash between the valve and all the other products in the document (Selection against all).The Check Clash dialog box expands to show the results of the initial computation. The number of interferences detected along with the type is indicated in the dialog box: 3 interferences have been detected.
225Page DMU Space Analysis Version 5 Release 13
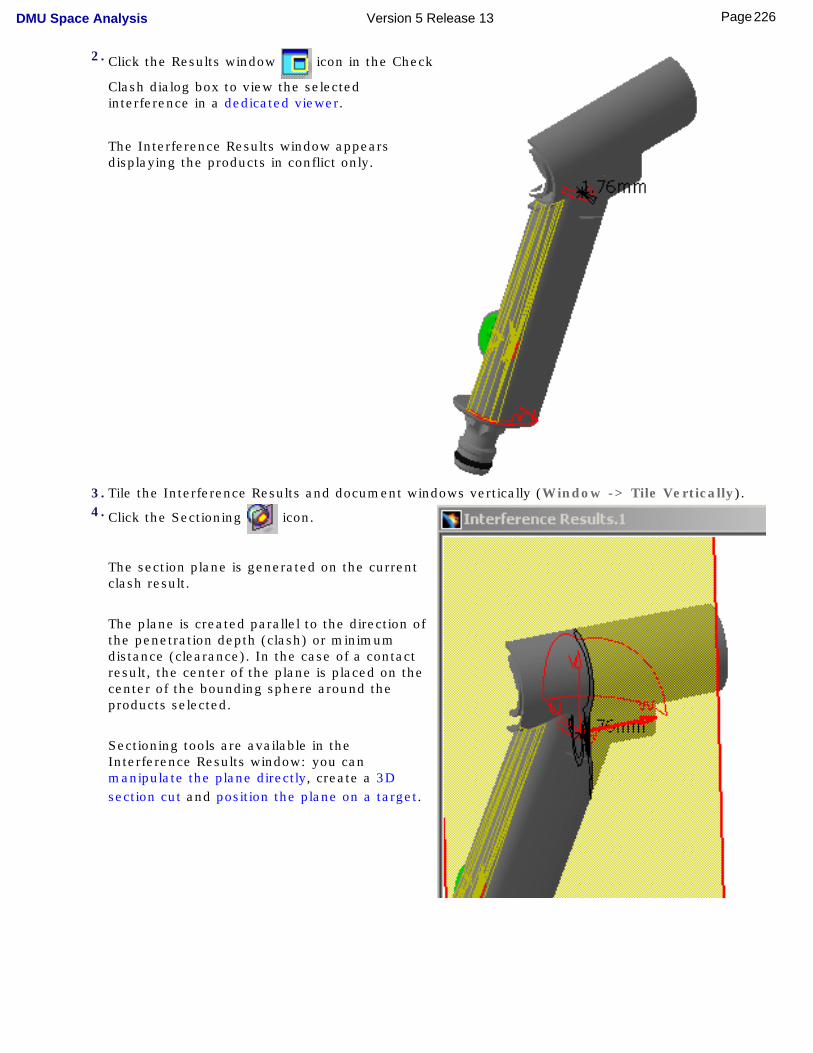
2. Click the Results window icon in the Check
Clash dialog box to view the selected interference in a dedicated viewer.
The Interference Results window appears displaying the products in conflict only.
3. Tile the Interference Results and document windows vertically (Window -> Tile Vertically).4. Click the Sectioning icon.
The section plane is generated on the current clash result.
The plane is created parallel to the direction of the penetration depth (clash) or minimum distance (clearance). In the case of a contact result, the center of the plane is placed on the center of the bounding sphere around the products selected.
Sectioning tools are available in the Interference Results window: you can manipulate the plane directly, create a 3D section cut and position the plane on a target.
226Page DMU Space Analysis Version 5 Release 13
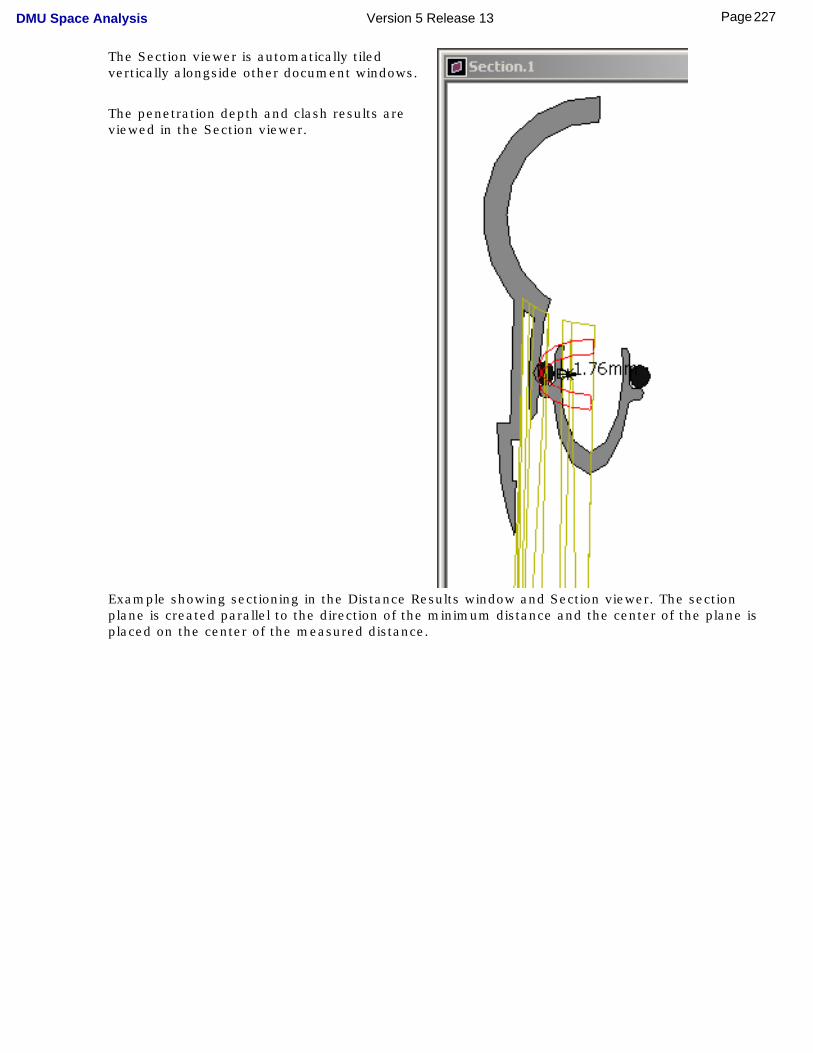
The Section viewer is automatically tiled vertically alongside other document windows.
The penetration depth and clash results are viewed in the Section viewer.
Example showing sectioning in the Distance Results window and Section viewer. The section plane is created parallel to the direction of the minimum distance and the center of the plane is placed on the center of the measured distance.
227Page DMU Space Analysis Version 5 Release 13
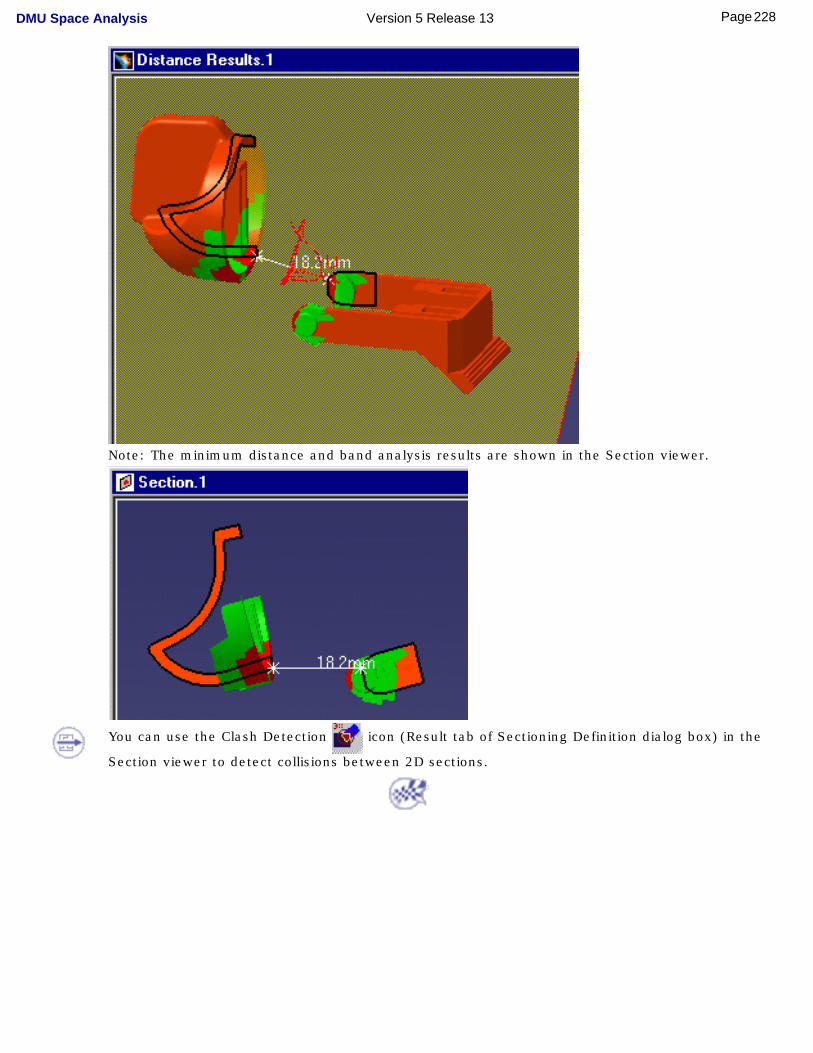
Note: The minimum distance and band analysis results are shown in the Section viewer.
You can use the Clash Detection icon (Result tab of Sectioning Definition dialog box) in the
Section viewer to detect collisions between 2D sections.
228Page DMU Space Analysis Version 5 Release 13
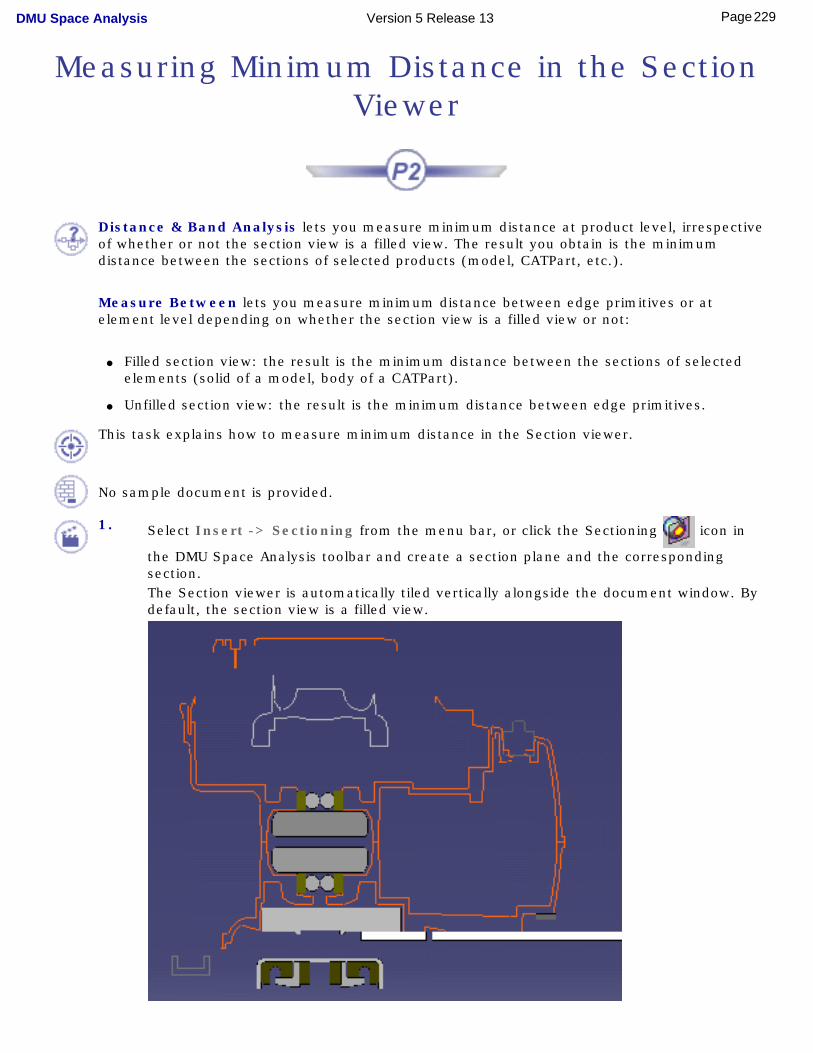
Measuring Minimum Distance in the Section Viewer
Distance & Band Analysis lets you measure minimum distance at product level, irrespective of whether or not the section view is a filled view. The result you obtain is the minimum distance between the sections of selected products (model, CATPart, etc.).
Measure Between lets you measure minimum distance between edge primitives or at element level depending on whether the section view is a filled view or not:
● Filled section view: the result is the minimum distance between the sections of selected elements (solid of a model, body of a CATPart).
● Unfilled section view: the result is the minimum distance between edge primitives.
This task explains how to measure minimum distance in the Section viewer.
No sample document is provided.
1. Select Insert -> Sectioning from the menu bar, or click the Sectioning icon in
the DMU Space Analysis toolbar and create a section plane and the corresponding section.
The Section viewer is automatically tiled vertically alongside the document window. By default, the section view is a filled view.
229Page DMU Space Analysis Version 5 Release 13
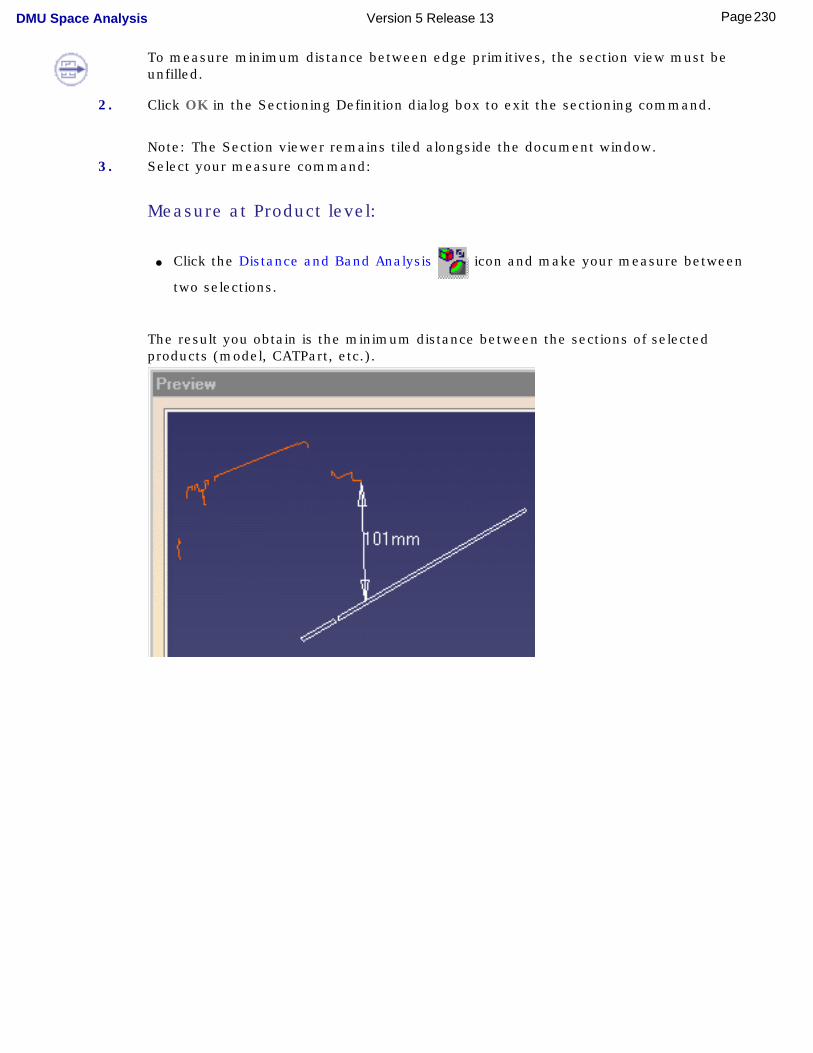
To measure minimum distance between edge primitives, the section view must be unfilled.
2. Click OK in the Sectioning Definition dialog box to exit the sectioning command.
Note: The Section viewer remains tiled alongside the document window.3. Select your measure command:
Measure at Product level:
● Click the Distance and Band Analysis icon and make your measure between
two selections.
The result you obtain is the minimum distance between the sections of selected products (model, CATPart, etc.).
230Page DMU Space Analysis Version 5 Release 13
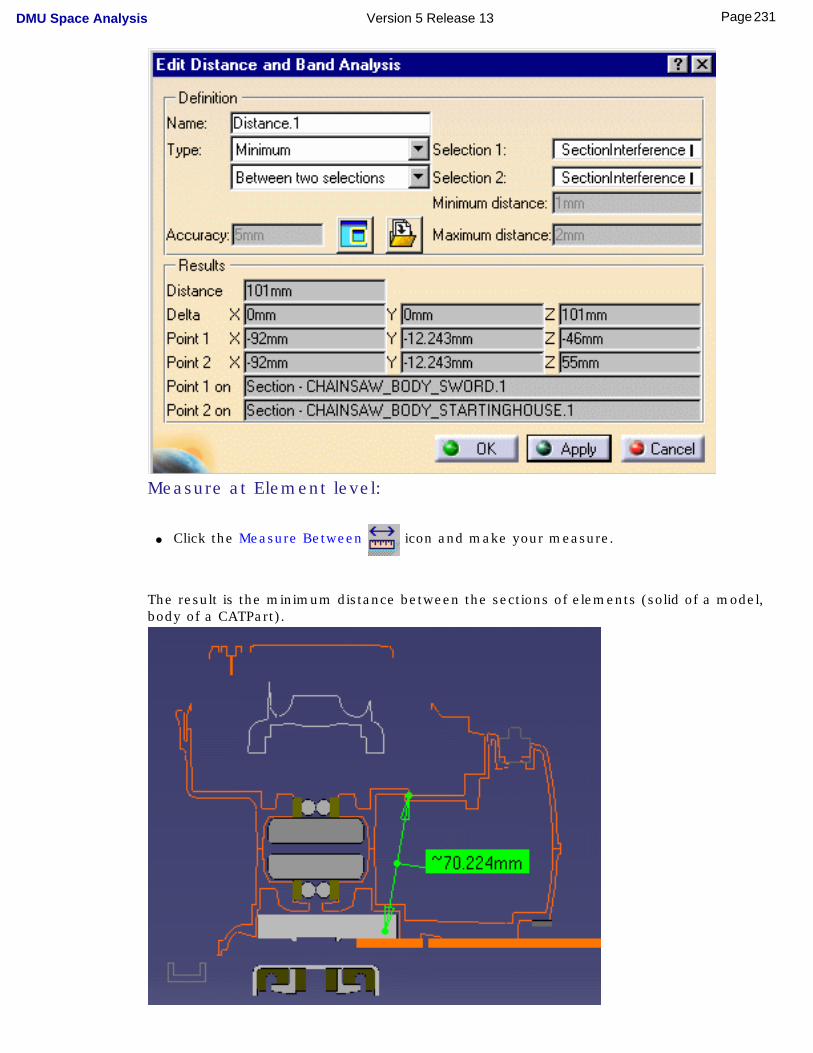
Measure at Element level:
● Click the Measure Between icon and make your measure.
The result is the minimum distance between the sections of elements (solid of a model, body of a CATPart).
231Page DMU Space Analysis Version 5 Release 13
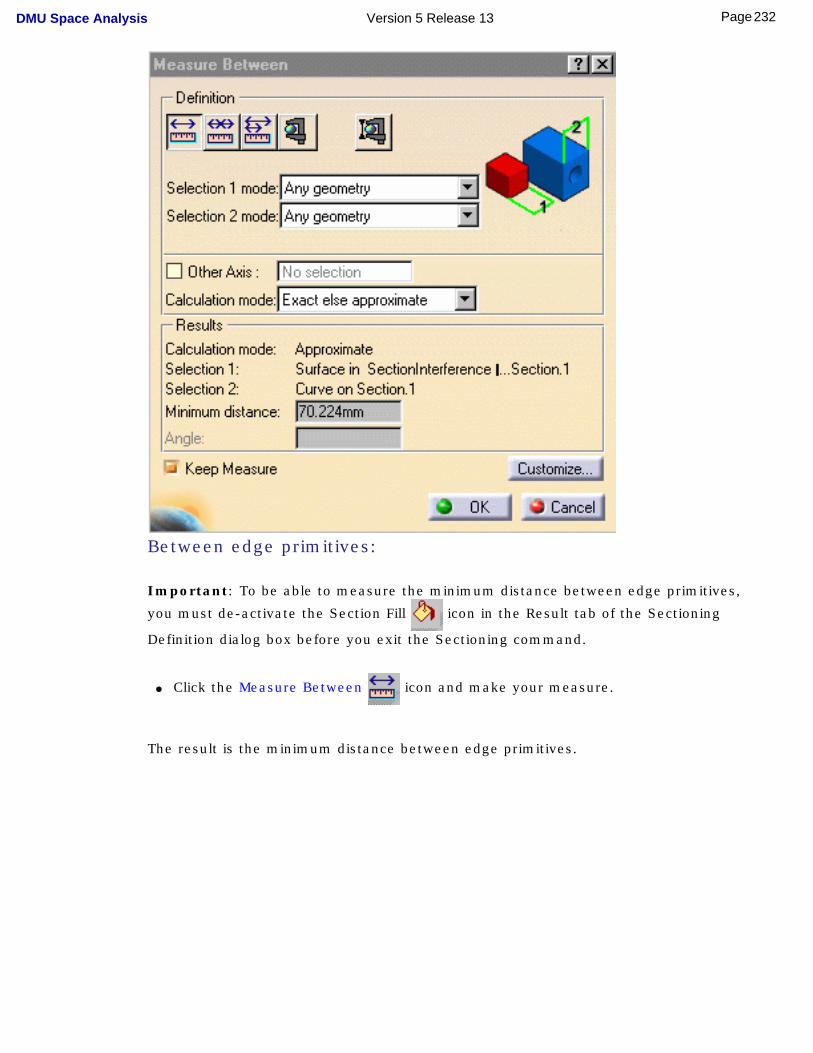
Between edge primitives:
Important: To be able to measure the minimum distance between edge primitives,
you must de-activate the Section Fill icon in the Result tab of the Sectioning
Definition dialog box before you exit the Sectioning command.
● Click the Measure Between icon and make your measure.
The result is the minimum distance between edge primitives.
232Page DMU Space Analysis Version 5 Release 13
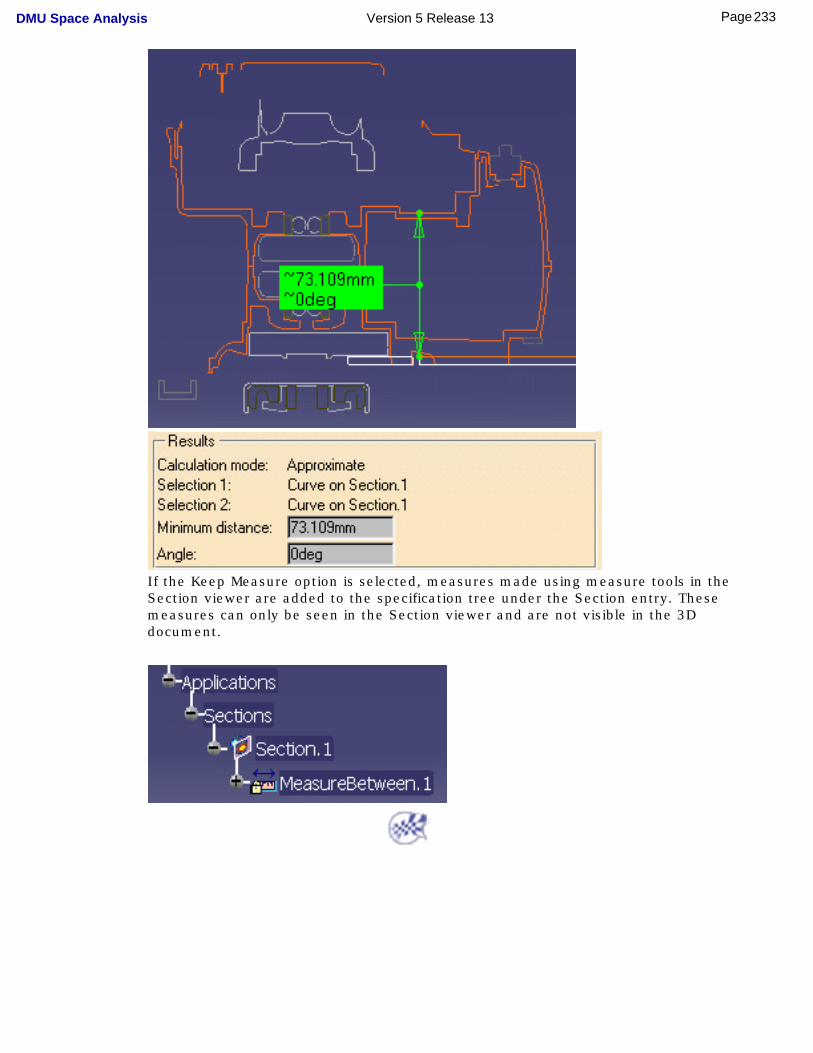
If the Keep Measure option is selected, measures made using measure tools in the Section viewer are added to the specification tree under the Section entry. These measures can only be seen in the Section viewer and are not visible in the 3D document.
233Page DMU Space Analysis Version 5 Release 13
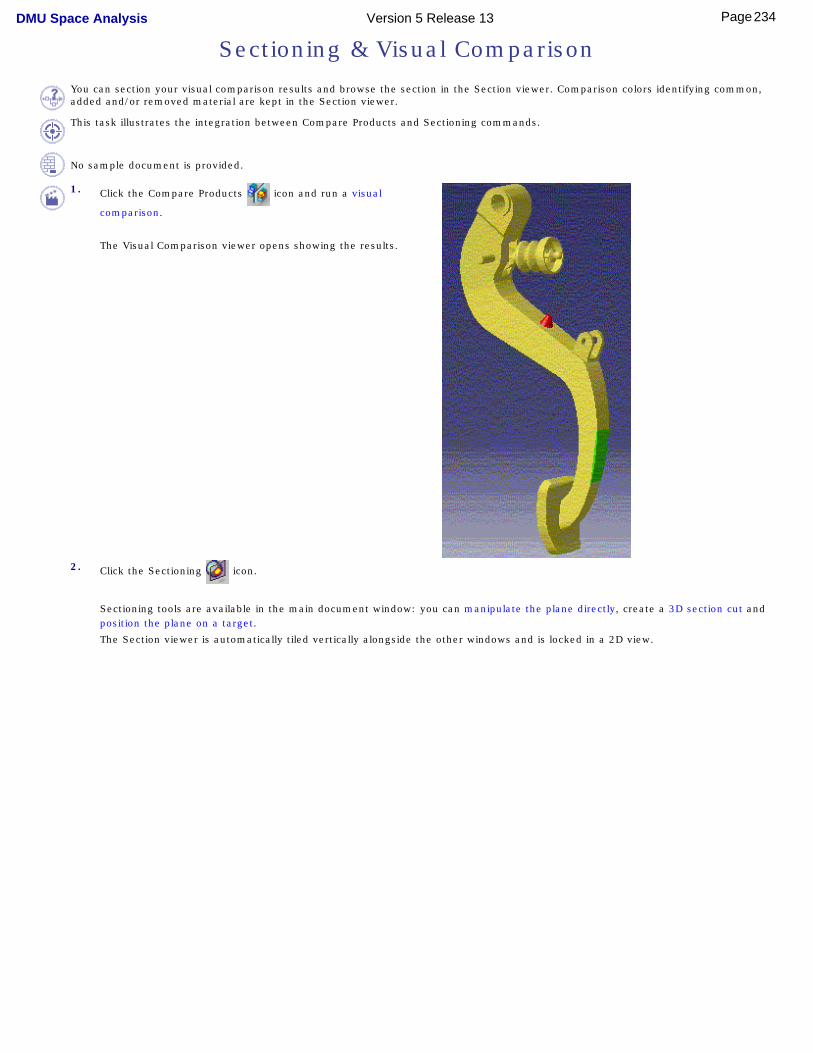
Sectioning & Visual Comparison
You can section your visual comparison results and browse the section in the Section viewer. Comparison colors identifying common, added and/or removed material are kept in the Section viewer.
This task illustrates the integration between Compare Products and Sectioning commands.
No sample document is provided.
1. Click the Compare Products icon and run a visual
comparison.
The Visual Comparison viewer opens showing the results.
2. Click the Sectioning icon.
Sectioning tools are available in the main document window: you can manipulate the plane directly, create a 3D section cut and position the plane on a target.
The Section viewer is automatically tiled vertically alongside the other windows and is locked in a 2D view.
234Page DMU Space Analysis Version 5 Release 13
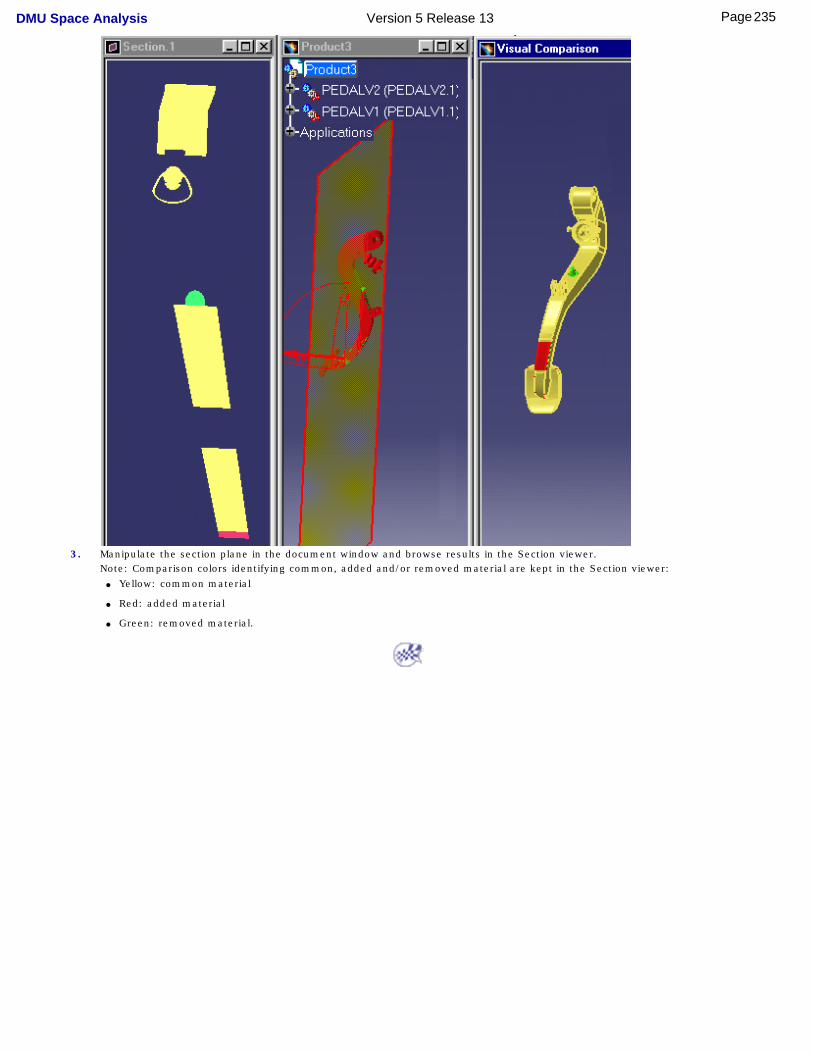
3. Manipulate the section plane in the document window and browse results in the Section viewer.Note: Comparison colors identifying common, added and/or removed material are kept in the Section viewer:
● Yellow: common material
● Red: added material
● Green: removed material.
235Page DMU Space Analysis Version 5 Release 13

Batches and Macros for Interference Analysis
Batch Processing CGR Files & Model DocumentsBatch Processing Existing CATProducts
Using a Macro to Import Clash Results Saved in XML FormatUsing a Macro to Export Clash Results to an XML File
236Page DMU Space Analysis Version 5 Release 13
Batch Processing CGR Files & Model Documents
This task explains how to run interference analyses as a batch process on cgr files.
Note: The batch process can also be run on model documents.
The batch process takes into account penetration mode settings.
To batch process interference analyses, you need to prepare two input files, one defining the computation parameters and the other listing the cgr files or model documents you want to analyze.
On UNIX, the variable DISPLAY must be correctly valuated.
1. Prepare the input file defining computation parameters.
A typical computation parameters file looks like this:
Computation typeClearance valueInput fileOutput fileResult file
= clearance + contact + clash= 20.0= OK_YLE= OK_YLE.out= OK_YLE.result
Computation type:You can run your analysis on one of two interference types:
● Contact + Clash
● Clearance + Contact + Clash
Clearance value:Is required if you specified Clearance + Contact + Clash as computation type and must be specified in millimeters. The clearance value must be a positive value.
Input file:Lists the files you want to analyze. You can batch process cgr files.
Output file:Gives the overall results of the computation and lists any files posing a problem during the computation.
Result file:Gives the detailed results, listing the pairs of files in conflict and indicating the interference type and value.
237Page DMU Space Analysis Version 5 Release 13
2. Prepare the input file listing the files you want to analyze:
A typical model input file looks like this:
group = 1##################################path = /u/users/yle/mdlv5/WHITE.cgrmatrix = 1.000000 0.000000 0.000000 0.000000 1.000000 0.000000 0.000000 0.000000 1.000000 100.0000 0.000000 0.000000//--------------------------------------------------path = /u/users/yle/mdlv5/BLUE.cgrmatrix = 1.000000 0.000000 0.000000 0.000000 1.000000 0.000000 0.000000 0.000000 1.000000 0.000000 -100.000 0.000000//--------------------------------------------------group = 2##################################path = /u/users/yle/mdlv5/YELLOW.cgrmatrix = 1.000000 0.000000 0.000000 0.000000 1.000000 0.000000 0.000000 0.000000 1.000000 -300.000 0.000000 -200.000//--------------------------------------------------path = /u/users/yle/mdlv5/RED.cgrmatrix = 1.000000 0.000000 0.000000 0.000000 1.000000 0.000000 0.000000 0.000000 1.000000 0.000000 0.000000 100.0000//--------------------------------------------------path = /u/users/yle/mdlv5/file_not_present_in_directory.cgr
Note: Special characters # and // identify comments.
Group (optional) Used to group files you want to analyze.Groups must be described in increasing order: group 1, group 2, etc.The batch process tests each file in the group against all files in all other groups. No test is run on files within a group.Note: If no group is specified, the batch process tests each file listed against all other files.
Path Tells the batch where to find the files you want to analyze.
Matrix (optional) Positions the file just identified with respect to the absolute axis system of the document. Enter data in mm in text format. For example:
1.000000 0.000000 0.0000000.000000 1.000000 0.0000000.000000 0.000000 1.000000100.0000 0.000000 0.000000
238Page DMU Space Analysis Version 5 Release 13
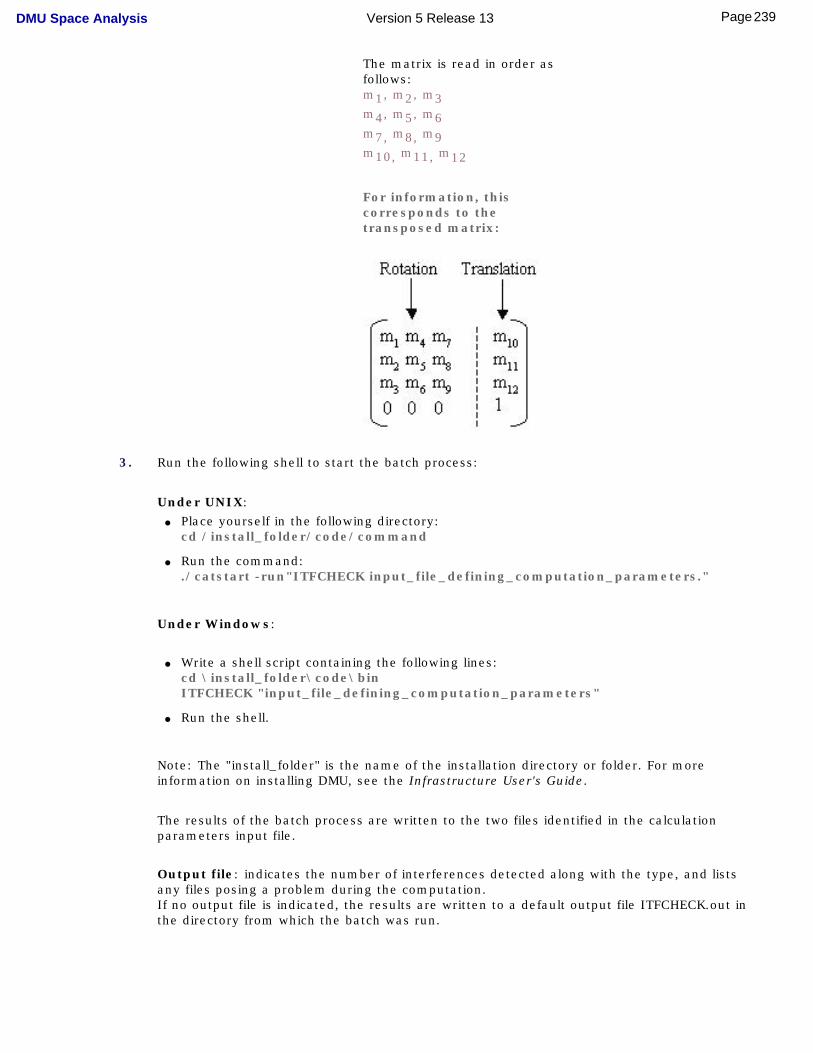
The matrix is read in order as follows:m1, m2, m3m4, m5, m6m7, m8, m9m10, m11, m12
For information, this corresponds to the transposed matrix:
3. Run the following shell to start the batch process:
Under UNIX: ● Place yourself in the following directory:
cd /install_folder/code/command
● Run the command:./catstart -run"ITFCHECK input_file_defining_computation_parameters."
Under Windows:
● Write a shell script containing the following lines:cd \install_folder\code\binITFCHECK "input_file_defining_computation_parameters"
● Run the shell.
Note: The "install_folder" is the name of the installation directory or folder. For more information on installing DMU, see the Infrastructure User's Guide.
The results of the batch process are written to the two files identified in the calculation parameters input file.
Output file: indicates the number of interferences detected along with the type, and lists any files posing a problem during the computation.If no output file is indicated, the results are written to a default output file ITFCHECK.out in the directory from which the batch was run.
239Page DMU Space Analysis Version 5 Release 13
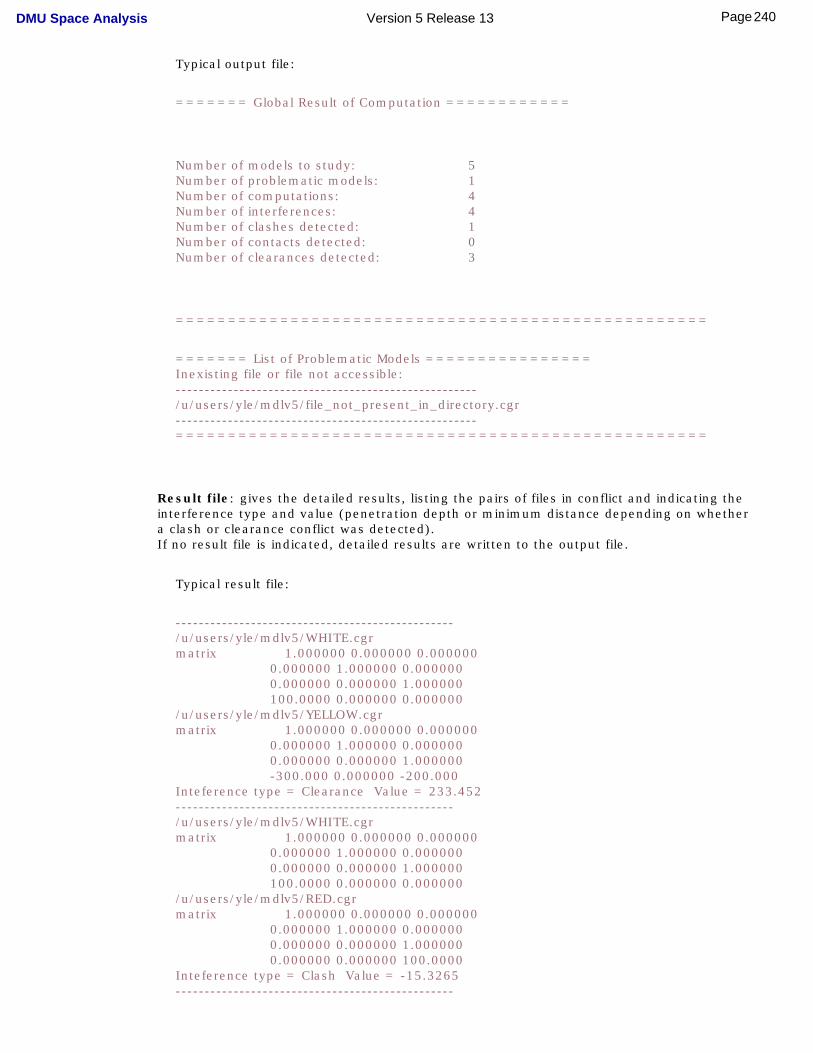
Typical output file:
======= Global Result of Computation ============
Number of models to study:Number of problematic models:Number of computations:Number of interferences:Number of clashes detected:Number of contacts detected:Number of clearances detected:
5144103
===================================================
======= List of Problematic Models ================Inexisting file or file not accessible:----------------------------------------------------/u/users/yle/mdlv5/file_not_present_in_directory.cgr----------------------------------------------------===================================================
Result file: gives the detailed results, listing the pairs of files in conflict and indicating the interference type and value (penetration depth or minimum distance depending on whether a clash or clearance conflict was detected).If no result file is indicated, detailed results are written to the output file.
Typical result file:
------------------------------------------------/u/users/yle/mdlv5/WHITE.cgrmatrix 1.000000 0.000000 0.000000 0.000000 1.000000 0.000000 0.000000 0.000000 1.000000 100.0000 0.000000 0.000000/u/users/yle/mdlv5/YELLOW.cgrmatrix 1.000000 0.000000 0.000000 0.000000 1.000000 0.000000 0.000000 0.000000 1.000000 -300.000 0.000000 -200.000Inteference type = Clearance Value = 233.452------------------------------------------------/u/users/yle/mdlv5/WHITE.cgrmatrix 1.000000 0.000000 0.000000 0.000000 1.000000 0.000000 0.000000 0.000000 1.000000 100.0000 0.000000 0.000000/u/users/yle/mdlv5/RED.cgrmatrix 1.000000 0.000000 0.000000 0.000000 1.000000 0.000000 0.000000 0.000000 1.000000 0.000000 0.000000 100.0000Inteference type = Clash Value = -15.3265------------------------------------------------
240Page DMU Space Analysis Version 5 Release 13
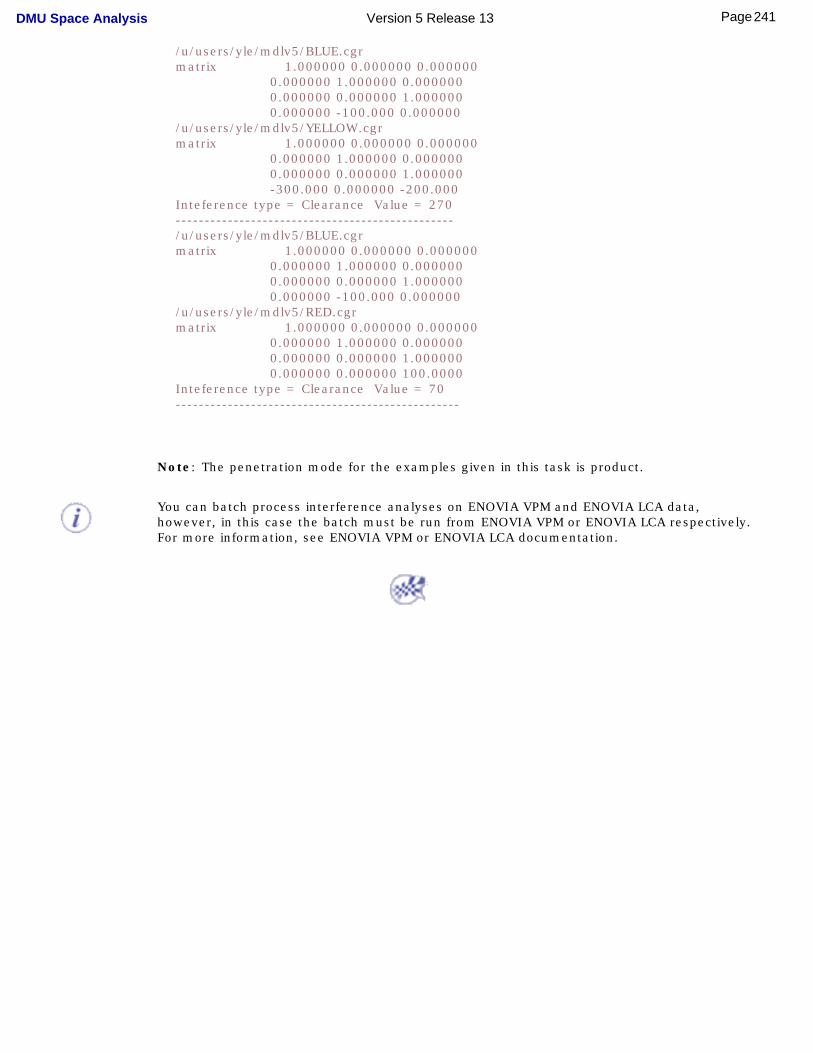
/u/users/yle/mdlv5/BLUE.cgrmatrix 1.000000 0.000000 0.000000 0.000000 1.000000 0.000000 0.000000 0.000000 1.000000 0.000000 -100.000 0.000000/u/users/yle/mdlv5/YELLOW.cgrmatrix 1.000000 0.000000 0.000000 0.000000 1.000000 0.000000 0.000000 0.000000 1.000000 -300.000 0.000000 -200.000Inteference type = Clearance Value = 270------------------------------------------------/u/users/yle/mdlv5/BLUE.cgrmatrix 1.000000 0.000000 0.000000 0.000000 1.000000 0.000000 0.000000 0.000000 1.000000 0.000000 -100.000 0.000000/u/users/yle/mdlv5/RED.cgrmatrix 1.000000 0.000000 0.000000 0.000000 1.000000 0.000000 0.000000 0.000000 1.000000 0.000000 0.000000 100.0000Inteference type = Clearance Value = 70-------------------------------------------------
Note: The penetration mode for the examples given in this task is product.
You can batch process interference analyses on ENOVIA VPM and ENOVIA LCA data, however, in this case the batch must be run from ENOVIA VPM or ENOVIA LCA respectively. For more information, see ENOVIA VPM or ENOVIA LCA documentation.
241Page DMU Space Analysis Version 5 Release 13
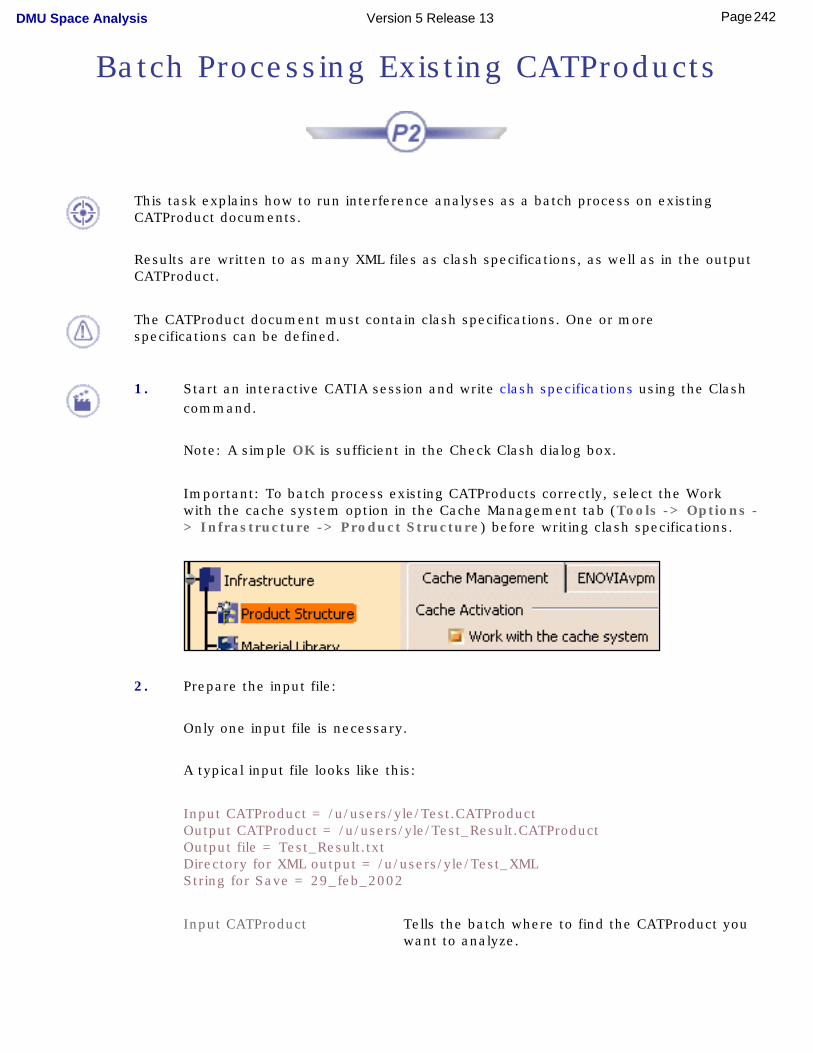
Batch Processing Existing CATProducts
This task explains how to run interference analyses as a batch process on existing CATProduct documents.
Results are written to as many XML files as clash specifications, as well as in the output CATProduct.
The CATProduct document must contain clash specifications. One or more specifications can be defined.
1. Start an interactive CATIA session and write clash specifications using the Clash command.
Note: A simple OK is sufficient in the Check Clash dialog box.
Important: To batch process existing CATProducts correctly, select the Work with the cache system option in the Cache Management tab (Tools -> Options -> Infrastructure -> Product Structure) before writing clash specifications.
2. Prepare the input file:
Only one input file is necessary.
A typical input file looks like this:
Input CATProduct = /u/users/yle/Test.CATProductOutput CATProduct = /u/users/yle/Test_Result.CATProductOutput file = Test_Result.txtDirectory for XML output = /u/users/yle/Test_XMLString for Save = 29_feb_2002
Input CATProduct Tells the batch where to find the CATProduct you want to analyze.
242Page DMU Space Analysis Version 5 Release 13
Output CATProduct Tells the batch where to write the CATProduct with the results.
● If Output CATProduct = Input CATProduct, equivalent to a Save operation.
● If Output CATProduct is different from Input CATProduct, equivalent to a Save As operation.
● If not valuated, no CATProduct is written.
Output file Summaries the input information.
Directory for XML output Tells the batch where to write the XML files. If this keyword is not valuated, no XML files are generated.
String for Save String used to generate the XML filename.
Rule used to generate the XML filename:
XML filename = specification_identifier + String_for_Save + extension .xml
3. Run the following shell to start the batch process:
Under UNIX: ● Place yourself in the following directory:
cd /install_folder/code/command
● Run the command:./catstart -run"ITFCHECK input_file_defining_computation_parameters."
Under Windows:
● Write a shell script containing the following lines:cd \install_folder\code\binITFCHECK "input_file_defining_computation_parameters"
● Run the shell.
Note: The "install_folder" is the name of the installation directory or folder. For more information on installing DMU, see the Infrastructure User's Guide.
The results of the batch process are written to as many XML files as clash specifications. They are also saved in the output CATProduct document.
243Page DMU Space Analysis Version 5 Release 13
Typical XML file:
You can import and analyze your results in an interactive DMU session using the Clash command.
244Page DMU Space Analysis Version 5 Release 13
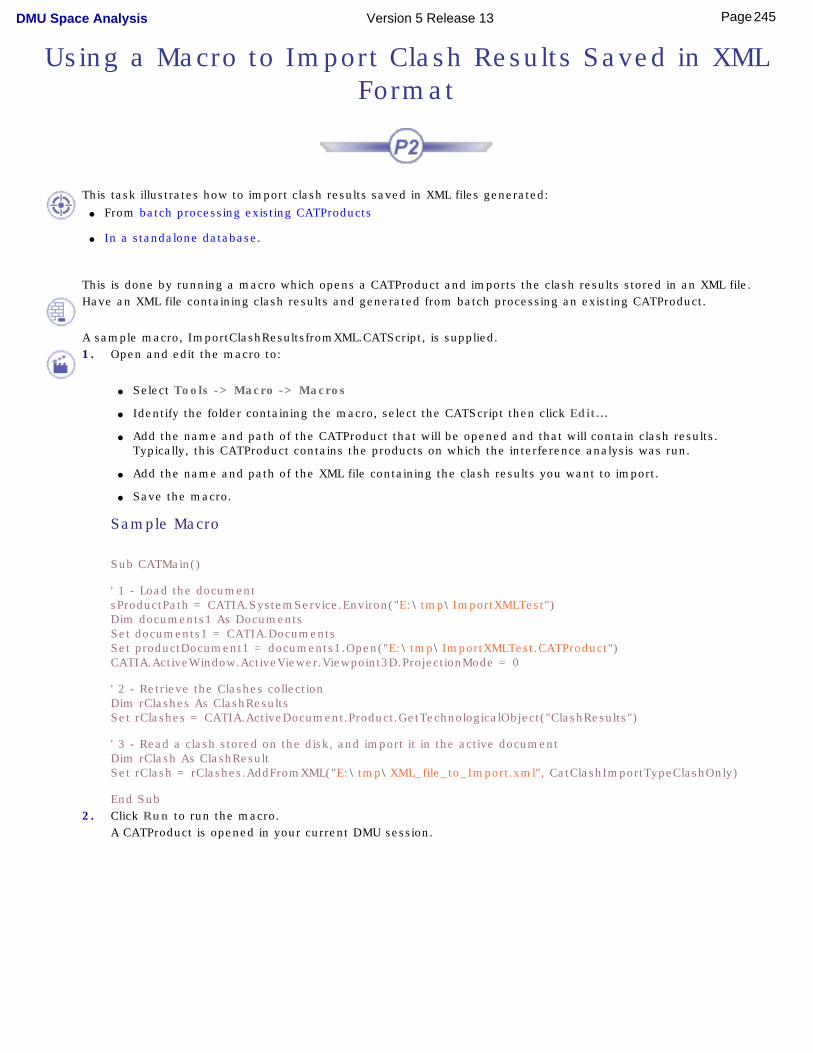
Using a Macro to Import Clash Results Saved in XML Format
This task illustrates how to import clash results saved in XML files generated:● From batch processing existing CATProducts
● In a standalone database.
This is done by running a macro which opens a CATProduct and imports the clash results stored in an XML file.Have an XML file containing clash results and generated from batch processing an existing CATProduct.
A sample macro, ImportClashResultsfromXML.CATScript, is supplied.
1. Open and edit the macro to:
● Select Tools -> Macro -> Macros
● Identify the folder containing the macro, select the CATScript then click Edit...
● Add the name and path of the CATProduct that will be opened and that will contain clash results.Typically, this CATProduct contains the products on which the interference analysis was run.
● Add the name and path of the XML file containing the clash results you want to import.
● Save the macro.
Sample Macro
Sub CATMain()
' 1 - Load the documentsProductPath = CATIA.SystemService.Environ("E:\tmp\ImportXMLTest")Dim documents1 As DocumentsSet documents1 = CATIA.DocumentsSet productDocument1 = documents1.Open("E:\tmp\ImportXMLTest.CATProduct")CATIA.ActiveWindow.ActiveViewer.Viewpoint3D.ProjectionMode = 0
' 2 - Retrieve the Clashes collectionDim rClashes As ClashResultsSet rClashes = CATIA.ActiveDocument.Product.GetTechnologicalObject("ClashResults")
' 3 - Read a clash stored on the disk, and import it in the active documentDim rClash As ClashResultSet rClash = rClashes.AddFromXML("E:\tmp\XML_file_to_Import.xml", CatClashImportTypeClashOnly)
End Sub2. Click Run to run the macro.
A CATProduct is opened in your current DMU session.
245Page DMU Space Analysis Version 5 Release 13
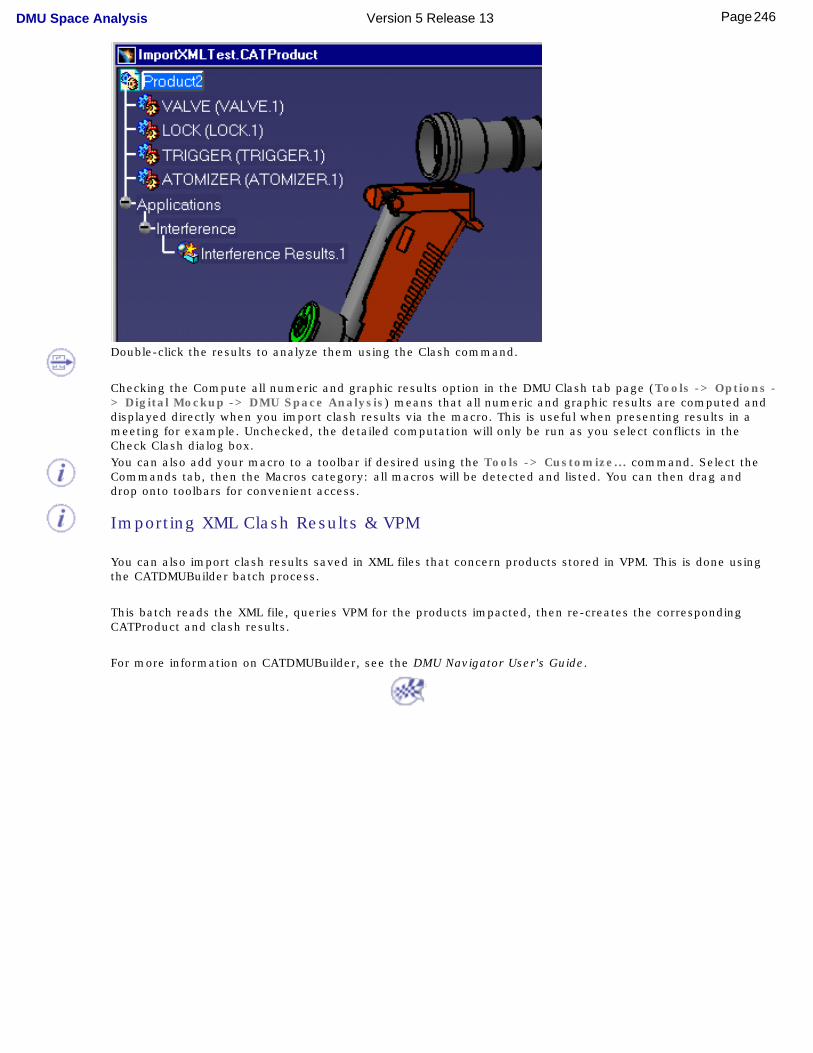
Double-click the results to analyze them using the Clash command.
Checking the Compute all numeric and graphic results option in the DMU Clash tab page (Tools -> Options -> Digital Mockup -> DMU Space Analysis) means that all numeric and graphic results are computed and displayed directly when you import clash results via the macro. This is useful when presenting results in a meeting for example. Unchecked, the detailed computation will only be run as you select conflicts in the Check Clash dialog box.
You can also add your macro to a toolbar if desired using the Tools -> Customize... command. Select the Commands tab, then the Macros category: all macros will be detected and listed. You can then drag and drop onto toolbars for convenient access.
Importing XML Clash Results & VPM
You can also import clash results saved in XML files that concern products stored in VPM. This is done using the CATDMUBuilder batch process.
This batch reads the XML file, queries VPM for the products impacted, then re-creates the corresponding CATProduct and clash results.
For more information on CATDMUBuilder, see the DMU Navigator User's Guide.
246Page DMU Space Analysis Version 5 Release 13
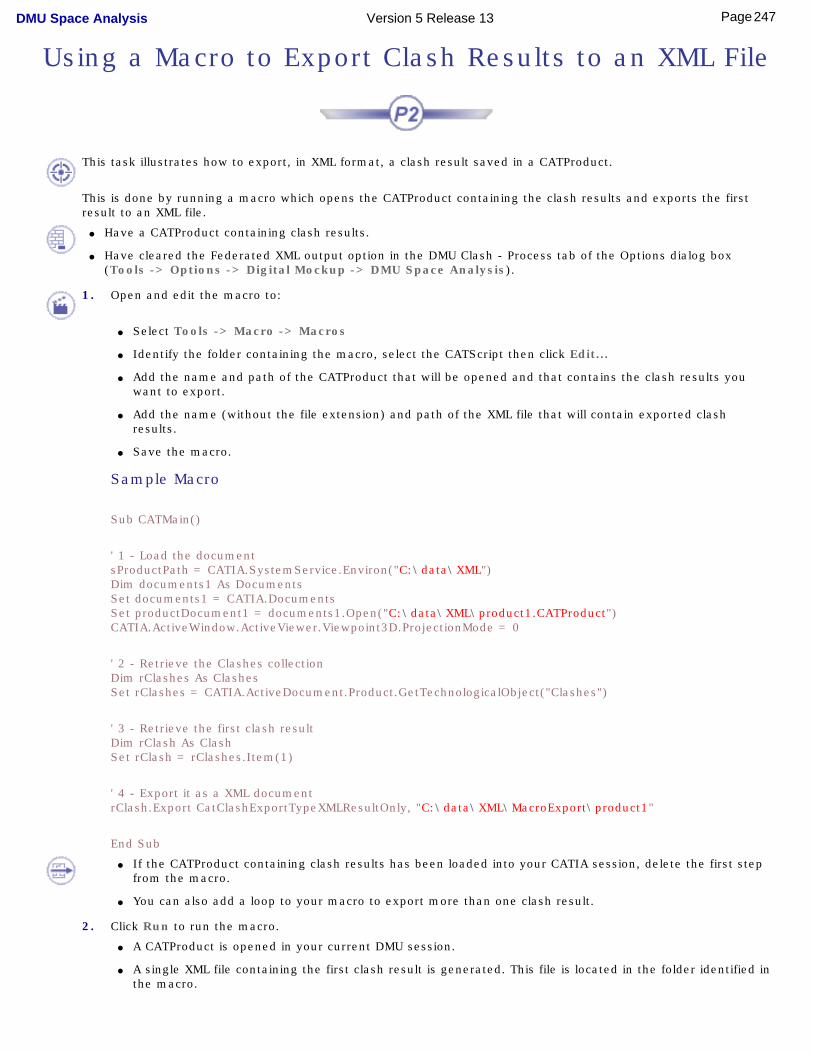
Using a Macro to Export Clash Results to an XML File
This task illustrates how to export, in XML format, a clash result saved in a CATProduct.
This is done by running a macro which opens the CATProduct containing the clash results and exports the first result to an XML file.
● Have a CATProduct containing clash results.
● Have cleared the Federated XML output option in the DMU Clash - Process tab of the Options dialog box (Tools -> Options -> Digital Mockup -> DMU Space Analysis).
1. Open and edit the macro to:
● Select Tools -> Macro -> Macros
● Identify the folder containing the macro, select the CATScript then click Edit...
● Add the name and path of the CATProduct that will be opened and that contains the clash results you want to export.
● Add the name (without the file extension) and path of the XML file that will contain exported clash results.
● Save the macro.
Sample Macro
Sub CATMain()
' 1 - Load the documentsProductPath = CATIA.SystemService.Environ("C:\data\XML")Dim documents1 As DocumentsSet documents1 = CATIA.DocumentsSet productDocument1 = documents1.Open("C:\data\XML\product1.CATProduct")CATIA.ActiveWindow.ActiveViewer.Viewpoint3D.ProjectionMode = 0
' 2 - Retrieve the Clashes collectionDim rClashes As ClashesSet rClashes = CATIA.ActiveDocument.Product.GetTechnologicalObject("Clashes")
' 3 - Retrieve the first clash resultDim rClash As ClashSet rClash = rClashes.Item(1)
' 4 - Export it as a XML documentrClash.Export CatClashExportTypeXMLResultOnly, "C:\data\XML\MacroExport\product1"
End Sub
● If the CATProduct containing clash results has been loaded into your CATIA session, delete the first step from the macro.
● You can also add a loop to your macro to export more than one clash result.
2. Click Run to run the macro.
● A CATProduct is opened in your current DMU session.
● A single XML file containing the first clash result is generated. This file is located in the folder identified in the macro.
247Page DMU Space Analysis Version 5 Release 13

For more information on XML grammar, see reading XML clash files.
You can also add your macro to a toolbar if desired using the Tools -> Customize... command. Select the Commands tab, then the Macros category: all macros will be detected and listed. You can then drag and drop onto toolbars for convenient access.
248Page DMU Space Analysis Version 5 Release 13
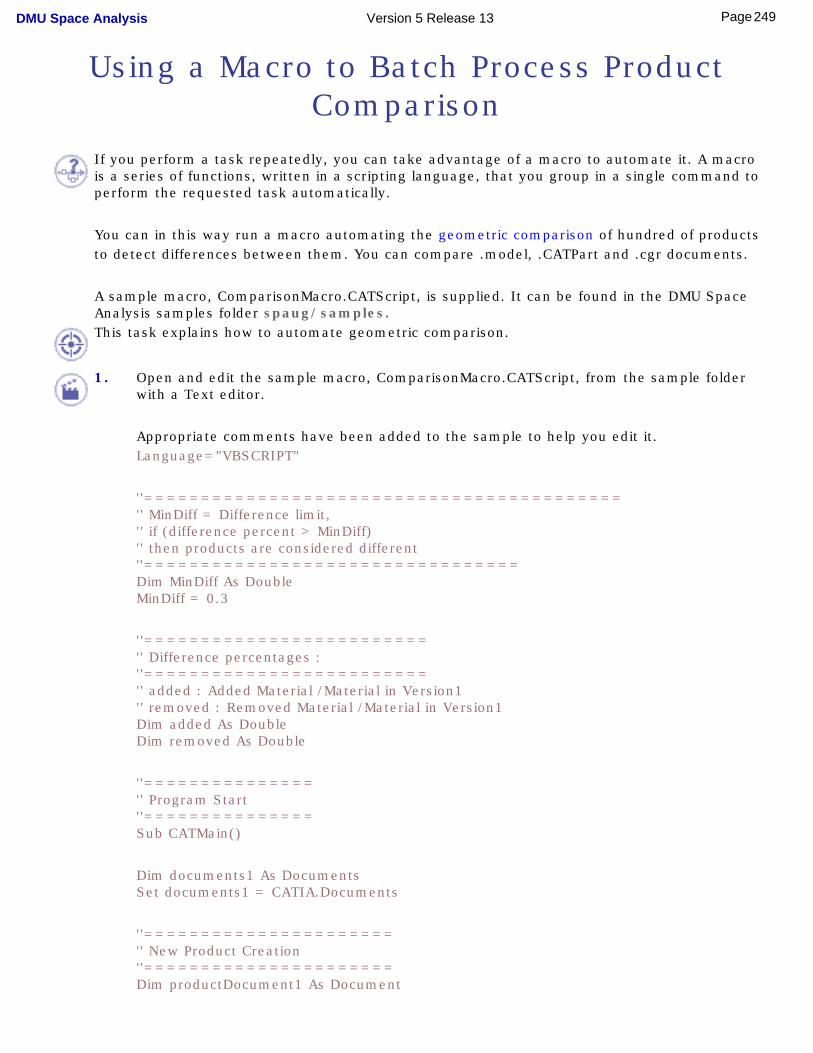
Using a Macro to Batch Process Product Comparison
If you perform a task repeatedly, you can take advantage of a macro to automate it. A macro is a series of functions, written in a scripting language, that you group in a single command to perform the requested task automatically.
You can in this way run a macro automating the geometric comparison of hundred of products to detect differences between them. You can compare .model, .CATPart and .cgr documents.
A sample macro, ComparisonMacro.CATScript, is supplied. It can be found in the DMU Space Analysis samples folder spaug/samples.This task explains how to automate geometric comparison.
1. Open and edit the sample macro, ComparisonMacro.CATScript, from the sample folder with a Text editor.
Appropriate comments have been added to the sample to help you edit it.Language="VBSCRIPT"
''=========================================='' MinDiff = Difference limit,'' if (difference percent > MinDiff)'' then products are considered different''=================================Dim MinDiff As DoubleMinDiff = 0.3
''========================='' Difference percentages :''========================='' added : Added Material /Material in Version1'' removed : Removed Material /Material in Version1Dim added As DoubleDim removed As Double
''==============='' Program Start''===============Sub CATMain()
Dim documents1 As DocumentsSet documents1 = CATIA.Documents
''======================'' New Product Creation''======================Dim productDocument1 As Document
249Page DMU Space Analysis Version 5 Release 13
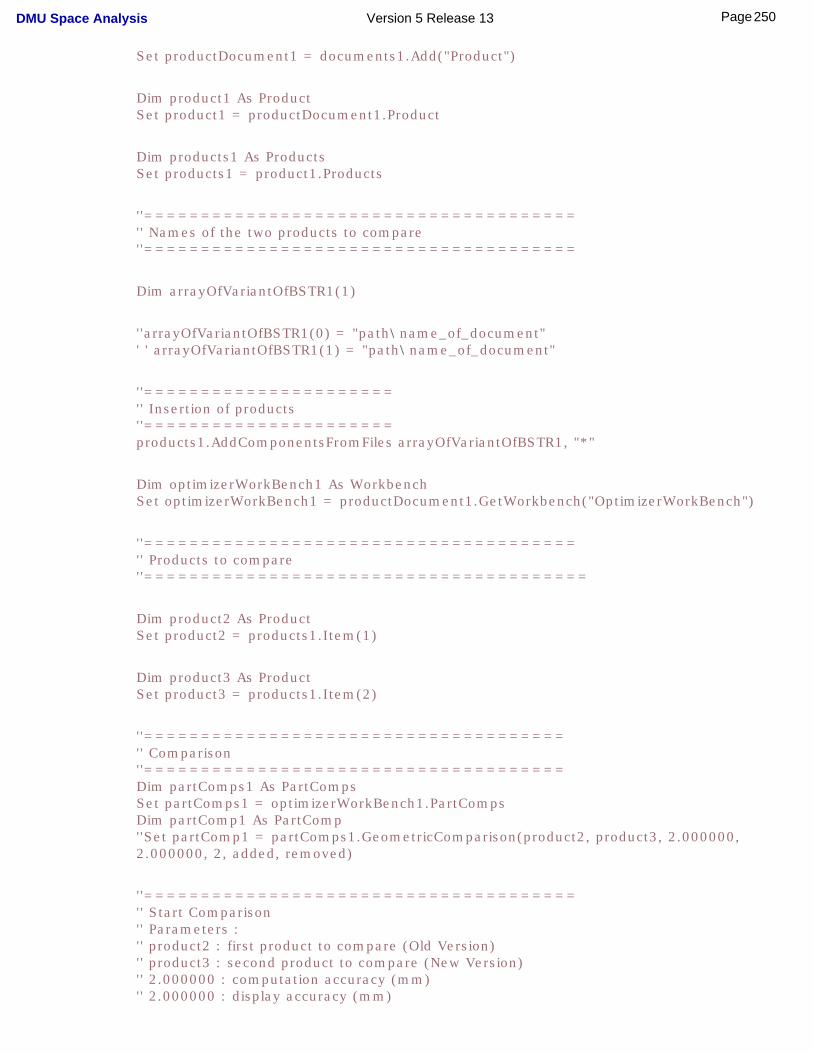
Set productDocument1 = documents1.Add("Product")
Dim product1 As ProductSet product1 = productDocument1.Product
Dim products1 As ProductsSet products1 = product1.Products
''======================================'' Names of the two products to compare''======================================
Dim arrayOfVariantOfBSTR1(1)
''arrayOfVariantOfBSTR1(0) = "path\name_of_document"' ' arrayOfVariantOfBSTR1(1) = "path\name_of_document"
''======================'' Insertion of products''======================products1.AddComponentsFromFiles arrayOfVariantOfBSTR1, "*"
Dim optimizerWorkBench1 As WorkbenchSet optimizerWorkBench1 = productDocument1.GetWorkbench("OptimizerWorkBench")
''======================================'' Products to compare''=======================================
Dim product2 As ProductSet product2 = products1.Item(1)
Dim product3 As ProductSet product3 = products1.Item(2)
''====================================='' Comparison''=====================================Dim partComps1 As PartCompsSet partComps1 = optimizerWorkBench1.PartCompsDim partComp1 As PartComp''Set partComp1 = partComps1.GeometricComparison(product2, product3, 2.000000, 2.000000, 2, added, removed)
''======================================'' Start Comparison'' Parameters :'' product2 : first product to compare (Old Version)'' product3 : second product to compare (New Version)'' 2.000000 : computation accuracy (mm)'' 2.000000 : display accuracy (mm)
250Page DMU Space Analysis Version 5 Release 13
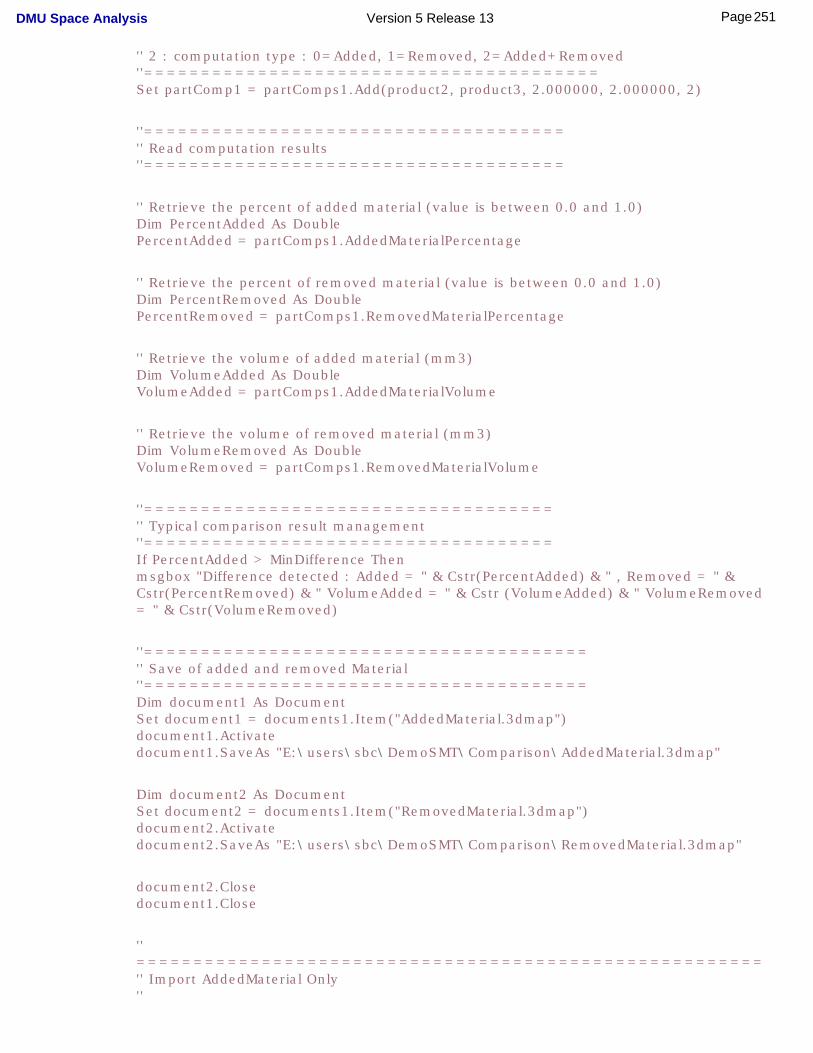
'' 2 : computation type : 0=Added, 1=Removed, 2=Added+Removed''========================================Set partComp1 = partComps1.Add(product2, product3, 2.000000, 2.000000, 2)
''====================================='' Read computation results''=====================================
'' Retrieve the percent of added material (value is between 0.0 and 1.0)Dim PercentAdded As DoublePercentAdded = partComps1.AddedMaterialPercentage
'' Retrieve the percent of removed material (value is between 0.0 and 1.0)Dim PercentRemoved As DoublePercentRemoved = partComps1.RemovedMaterialPercentage
'' Retrieve the volume of added material (mm3)Dim VolumeAdded As DoubleVolumeAdded = partComps1.AddedMaterialVolume
'' Retrieve the volume of removed material (mm3)Dim VolumeRemoved As DoubleVolumeRemoved = partComps1.RemovedMaterialVolume
''===================================='' Typical comparison result management''====================================If PercentAdded > MinDifference Thenmsgbox "Difference detected : Added = " & Cstr(PercentAdded) & " , Removed = " & Cstr(PercentRemoved) & " VolumeAdded = " & Cstr (VolumeAdded) & " VolumeRemoved = " & Cstr(VolumeRemoved)
''======================================='' Save of added and removed Material''=======================================Dim document1 As DocumentSet document1 = documents1.Item("AddedMaterial.3dmap")document1.Activatedocument1.SaveAs "E:\users\sbc\DemoSMT\Comparison\AddedMaterial.3dmap"
Dim document2 As DocumentSet document2 = documents1.Item("RemovedMaterial.3dmap")document2.Activatedocument2.SaveAs "E:\users\sbc\DemoSMT\Comparison\RemovedMaterial.3dmap"
document2.Closedocument1.Close
'' ======================================================='' Import AddedMaterial Only''
251Page DMU Space Analysis Version 5 Release 13
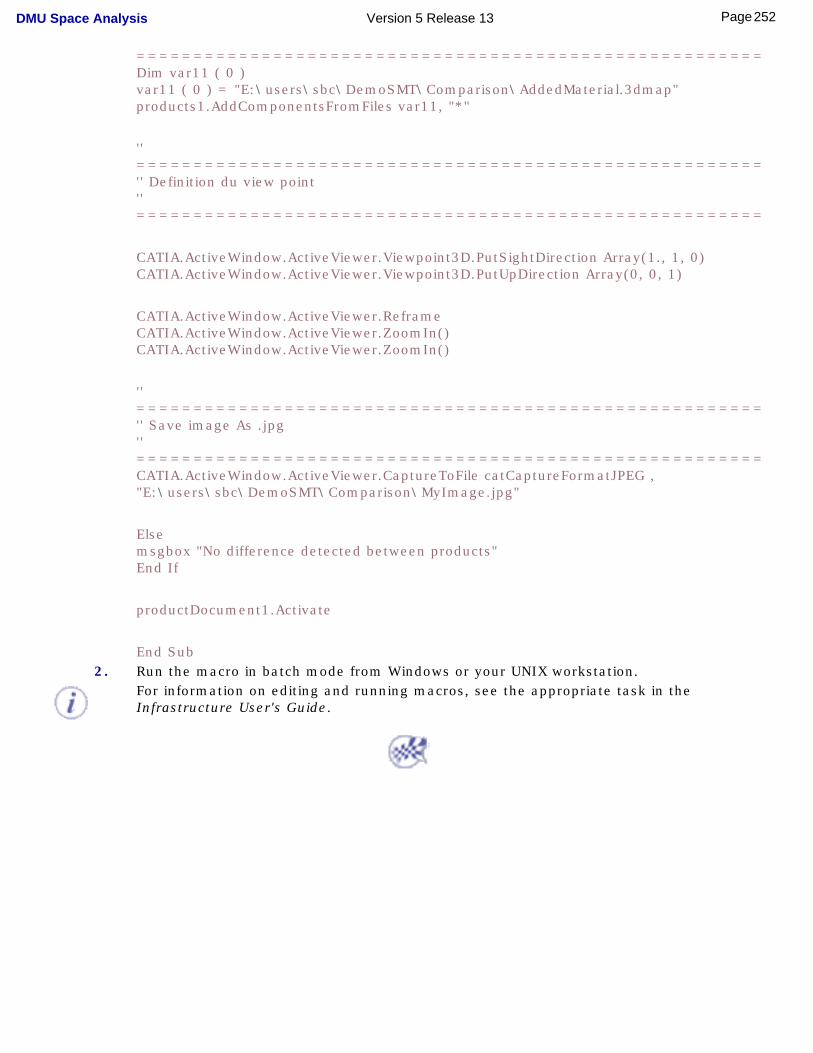
=======================================================Dim var11 ( 0 )var11 ( 0 ) = "E:\users\sbc\DemoSMT\Comparison\AddedMaterial.3dmap"products1.AddComponentsFromFiles var11, "*"
'' ======================================================='' Definition du view point'' =======================================================
CATIA.ActiveWindow.ActiveViewer.Viewpoint3D.PutSightDirection Array(1., 1, 0)CATIA.ActiveWindow.ActiveViewer.Viewpoint3D.PutUpDirection Array(0, 0, 1)
CATIA.ActiveWindow.ActiveViewer.ReframeCATIA.ActiveWindow.ActiveViewer.ZoomIn()CATIA.ActiveWindow.ActiveViewer.ZoomIn()
'' ======================================================='' Save image As .jpg'' =======================================================CATIA.ActiveWindow.ActiveViewer.CaptureToFile catCaptureFormatJPEG , "E:\users\sbc\DemoSMT\Comparison\MyImage.jpg"
Elsemsgbox "No difference detected between products"End If
productDocument1.Activate
End Sub2. Run the macro in batch mode from Windows or your UNIX workstation.
For information on editing and running macros, see the appropriate task in the Infrastructure User's Guide.
252Page DMU Space Analysis Version 5 Release 13

Knowledgeware CapabilitiesKnowledgeware Rule-based Clash
Space Analysis Functions in Knowledge Expert
253Page DMU Space Analysis Version 5 Release 13
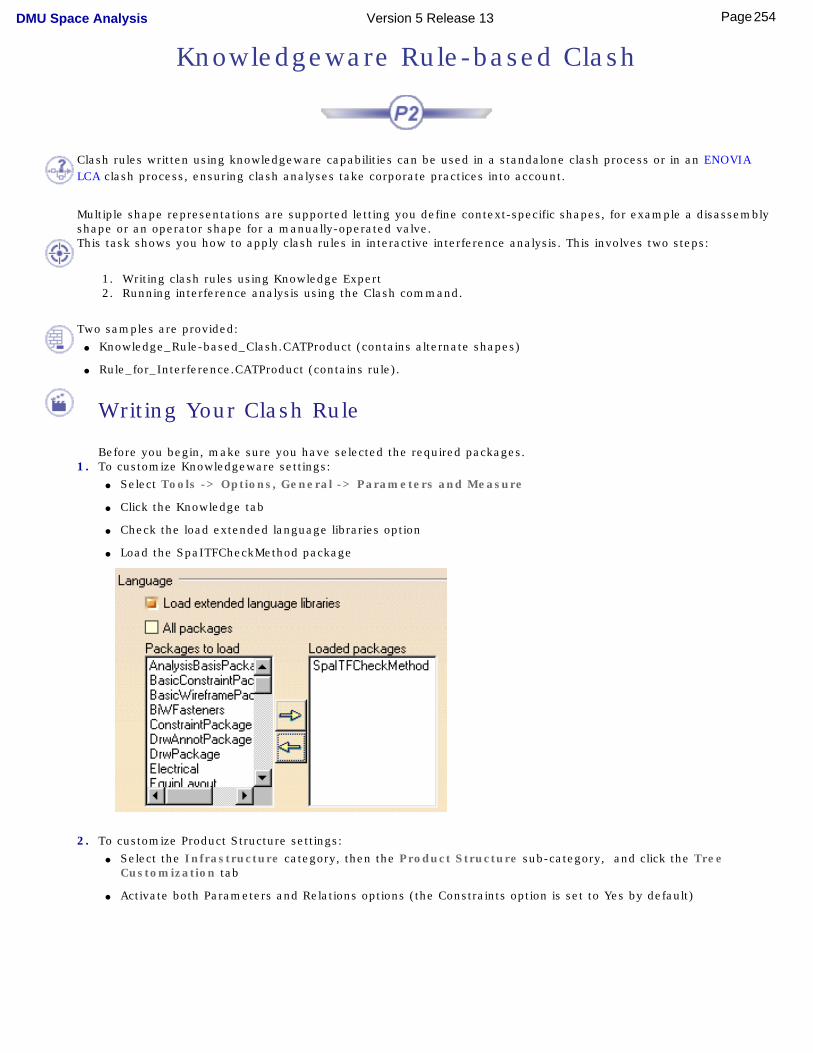
Knowledgeware Rule-based Clash
Clash rules written using knowledgeware capabilities can be used in a standalone clash process or in an ENOVIA LCA clash process, ensuring clash analyses take corporate practices into account.
Multiple shape representations are supported letting you define context-specific shapes, for example a disassembly shape or an operator shape for a manually-operated valve.This task shows you how to apply clash rules in interactive interference analysis. This involves two steps:
1. Writing clash rules using Knowledge Expert2. Running interference analysis using the Clash command.
Two samples are provided: ● Knowledge_Rule-based_Clash.CATProduct (contains alternate shapes)
● Rule_for_Interference.CATProduct (contains rule).
Writing Your Clash Rule
Before you begin, make sure you have selected the required packages. 1. To customize Knowledgeware settings:
● Select Tools -> Options, General -> Parameters and Measure
● Click the Knowledge tab
● Check the load extended language libraries option
● Load the SpaITFCheckMethod package
2. To customize Product Structure settings: ● Select the Infrastructure category, then the Product Structure sub-category, and click the Tree
Customization tab
● Activate both Parameters and Relations options (the Constraints option is set to Yes by default)
254Page DMU Space Analysis Version 5 Release 13
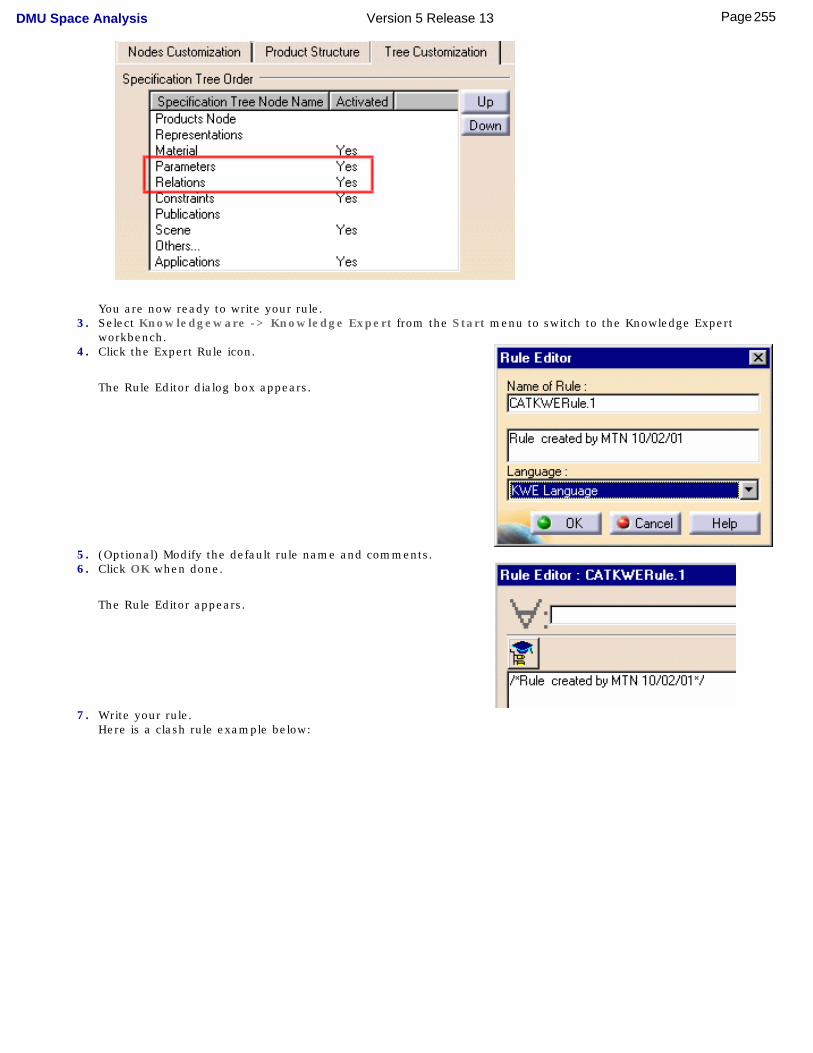
You are now ready to write your rule.3. Select Knowledgeware -> Knowledge Expert from the Start menu to switch to the Knowledge Expert
workbench.4. Click the Expert Rule icon.
The Rule Editor dialog box appears.
5. (Optional) Modify the default rule name and comments.6. Click OK when done.
The Rule Editor appears.
7. Write your rule.Here is a clash rule example below:
255Page DMU Space Analysis Version 5 Release 13
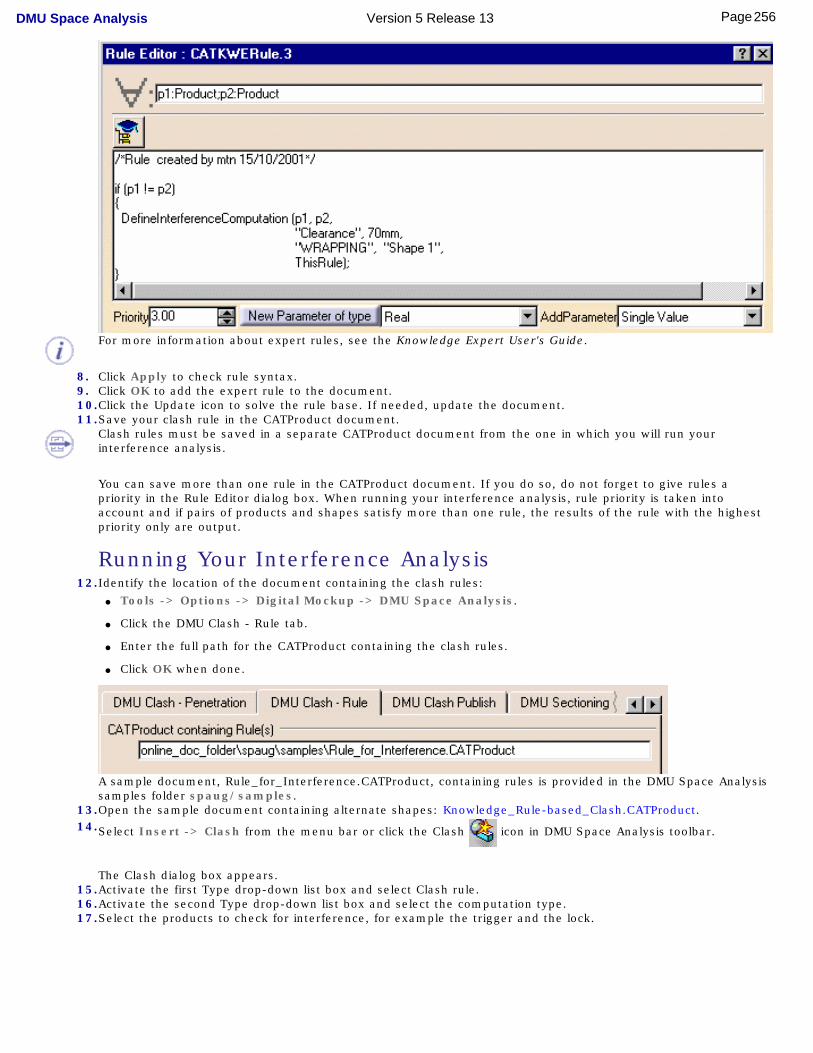
For more information about expert rules, see the Knowledge Expert User's Guide.
8. Click Apply to check rule syntax.9. Click OK to add the expert rule to the document.10.Click the Update icon to solve the rule base. If needed, update the document.11.Save your clash rule in the CATProduct document.
Clash rules must be saved in a separate CATProduct document from the one in which you will run your interference analysis.
You can save more than one rule in the CATProduct document. If you do so, do not forget to give rules a priority in the Rule Editor dialog box. When running your interference analysis, rule priority is taken into account and if pairs of products and shapes satisfy more than one rule, the results of the rule with the highest priority only are output.
Running Your Interference Analysis12.Identify the location of the document containing the clash rules:
● Tools -> Options -> Digital Mockup -> DMU Space Analysis.
● Click the DMU Clash - Rule tab.
● Enter the full path for the CATProduct containing the clash rules.
● Click OK when done.
A sample document, Rule_for_Interference.CATProduct, containing rules is provided in the DMU Space Analysis samples folder spaug/samples.
13.Open the sample document containing alternate shapes: Knowledge_Rule-based_Clash.CATProduct.14.Select Insert -> Clash from the menu bar or click the Clash icon in DMU Space Analysis toolbar.
The Clash dialog box appears.15.Activate the first Type drop-down list box and select Clash rule.16.Activate the second Type drop-down list box and select the computation type.17.Select the products to check for interference, for example the trigger and the lock.
256Page DMU Space Analysis Version 5 Release 13
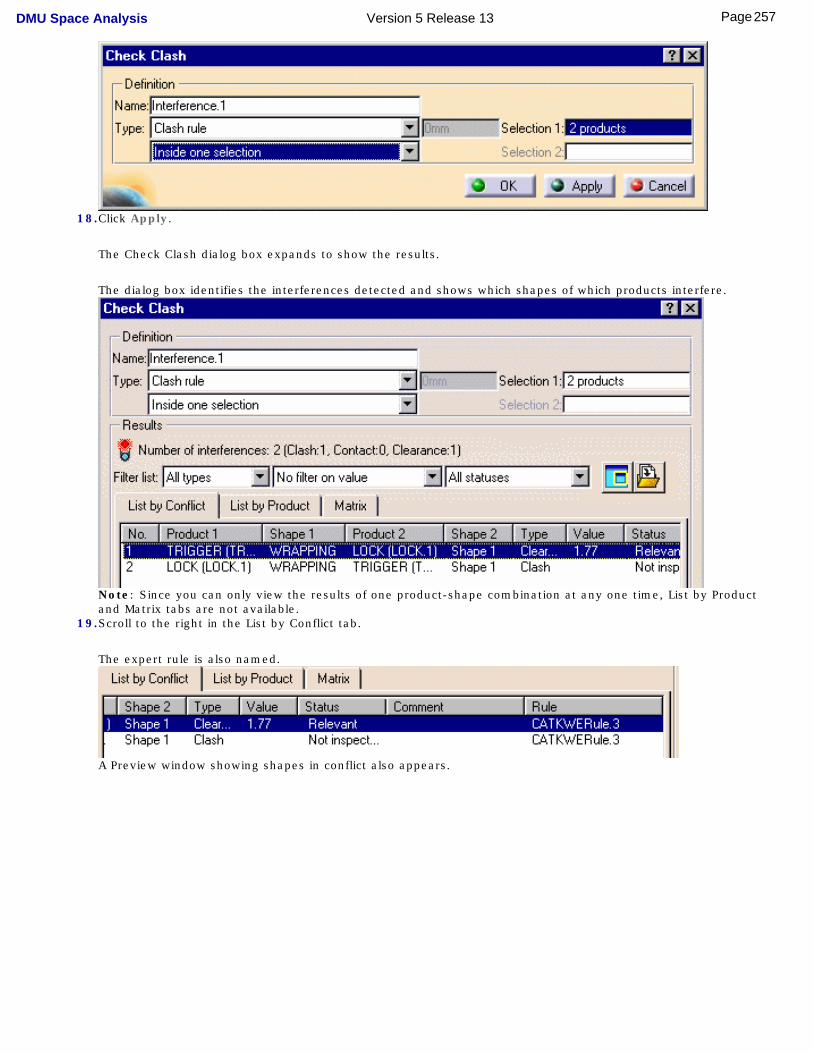
18.Click Apply.
The Check Clash dialog box expands to show the results.
The dialog box identifies the interferences detected and shows which shapes of which products interfere.
Note: Since you can only view the results of one product-shape combination at any one time, List by Product and Matrix tabs are not available.
19.Scroll to the right in the List by Conflict tab.
The expert rule is also named.
A Preview window showing shapes in conflict also appears.
257Page DMU Space Analysis Version 5 Release 13
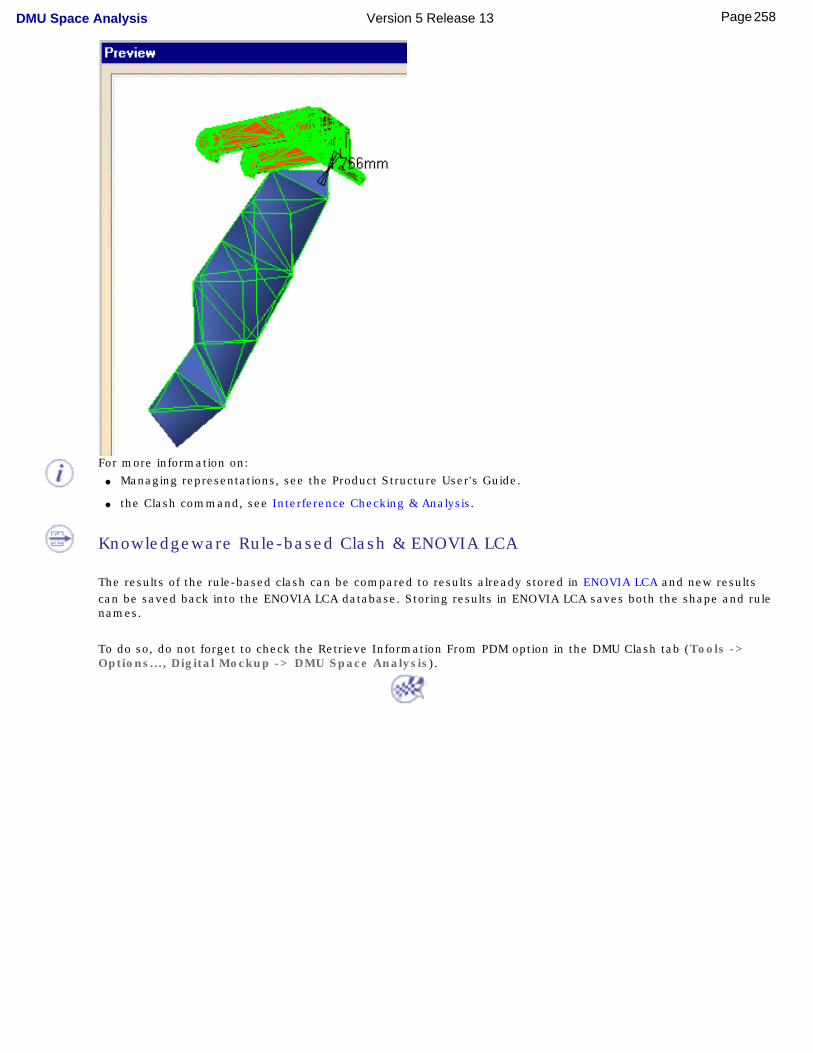
For more information on:● Managing representations, see the Product Structure User's Guide.
● the Clash command, see Interference Checking & Analysis.
Knowledgeware Rule-based Clash & ENOVIA LCA
The results of the rule-based clash can be compared to results already stored in ENOVIA LCA and new results can be saved back into the ENOVIA LCA database. Storing results in ENOVIA LCA saves both the shape and rule names.
To do so, do not forget to check the Retrieve Information From PDM option in the DMU Clash tab (Tools -> Options..., Digital Mockup -> DMU Space Analysis).
258Page DMU Space Analysis Version 5 Release 13
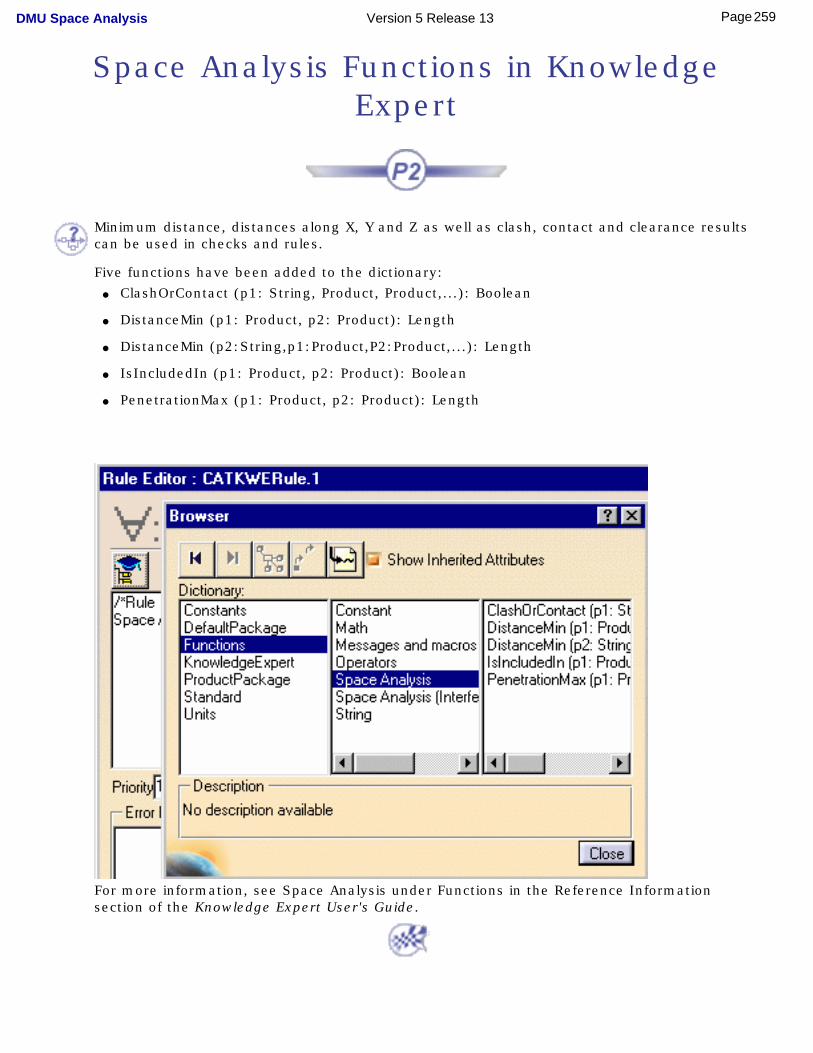
Space Analysis Functions in Knowledge Expert
Minimum distance, distances along X, Y and Z as well as clash, contact and clearance results can be used in checks and rules.
Five functions have been added to the dictionary: ● ClashOrContact (p1: String, Product, Product,...): Boolean
● DistanceMin (p1: Product, p2: Product): Length
● DistanceMin (p2:String,p1:Product,P2:Product,...): Length
● IsIncludedIn (p1: Product, p2: Product): Boolean
● PenetrationMax (p1: Product, p2: Product): Length
For more information, see Space Analysis under Functions in the Reference Information section of the Knowledge Expert User's Guide.
259Page DMU Space Analysis Version 5 Release 13
Working with CGRs in DMU
This section provides information on working with CGRs in a DMU context. This is the default document format used for DMU sessions when working in Visualization mode and with the cache system. This format is not suitable for design.
CGR stands for CATIA Graphical Representation. CGR files always have a .cgr extension.All MULTICAx Plug-in products convert native part data into CGR format.
When using CGRs, a representation of the geometry only is available; the geometry is not available.
Advantages:
● Requires less memory
● Documents are lighter
● Considerably reduces the time required to load your data
For example, with the following CATProduct document, you can easily check the difference between the .Model document and the corresponding CGR file:
With .Model: 6,708 MB
With CGR: 670KB
This may be useful when dealing with complex products or assemblies involving large amounts of data.
Drawbacks:
● No design possible
● Relations between objects cannot be established because they are based on design features. For example, in DMU Kinematics, you cannot create joints because joints are built on design constraints.
In DMU:
● CGR documents can be inserted directly into DMU sessions
● They are generated automatically from exact geometry ( V4 Models, CATParts...) when working with the cache system
● You can also generate CGR representations in certain DMU applications and save them as CGR files, for example DMU Optimizer
Definitions:
Cache system concept: Two different modes are available when a component (V4 model, V5 CATPart, V5 CATProduct, etc.) is inserted into a DMU Navigator CATProduct document
● Design mode
● Visualization mode
260Page DMU Space Analysis Version 5 Release 13
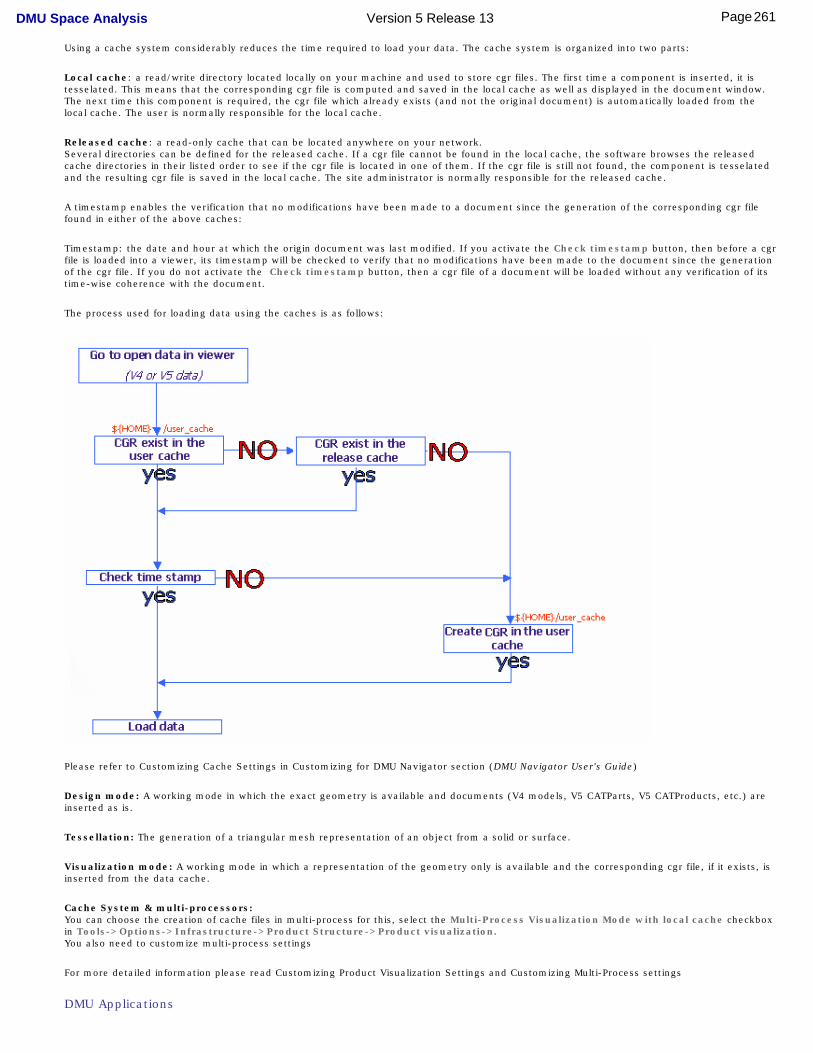
Using a cache system considerably reduces the time required to load your data. The cache system is organized into two parts:
Local cache: a read/write directory located locally on your machine and used to store cgr files. The first time a component is inserted, it is tesselated. This means that the corresponding cgr file is computed and saved in the local cache as well as displayed in the document window. The next time this component is required, the cgr file which already exists (and not the original document) is automatically loaded from the local cache. The user is normally responsible for the local cache.
Released cache: a read-only cache that can be located anywhere on your network.Several directories can be defined for the released cache. If a cgr file cannot be found in the local cache, the software browses the released cache directories in their listed order to see if the cgr file is located in one of them. If the cgr file is still not found, the component is tesselated and the resulting cgr file is saved in the local cache. The site administrator is normally responsible for the released cache.
A timestamp enables the verification that no modifications have been made to a document since the generation of the corresponding cgr file found in either of the above caches:
Timestamp: the date and hour at which the origin document was last modified. If you activate the Check timestamp button, then before a cgr file is loaded into a viewer, its timestamp will be checked to verify that no modifications have been made to the document since the generation of the cgr file. If you do not activate the Check timestamp button, then a cgr file of a document will be loaded without any verification of its time-wise coherence with the document.
The process used for loading data using the caches is as follows:
Please refer to Customizing Cache Settings in Customizing for DMU Navigator section (DMU Navigator User's Guide)
Design mode: A working mode in which the exact geometry is available and documents (V4 models, V5 CATParts, V5 CATProducts, etc.) are inserted as is.
Tessellation: The generation of a triangular mesh representation of an object from a solid or surface.
Visualization mode: A working mode in which a representation of the geometry only is available and the corresponding cgr file, if it exists, is inserted from the data cache.
Cache System & multi-processors:You can choose the creation of cache files in multi-process for this, select the Multi-Process Visualization Mode with local cache checkbox in Tools->Options->Infrastructure->Product Structure->Product visualization.You also need to customize multi-process settings
For more detailed information please read Customizing Product Visualization Settings and Customizing Multi-Process settings
DMU Applications
261Page DMU Space Analysis Version 5 Release 13
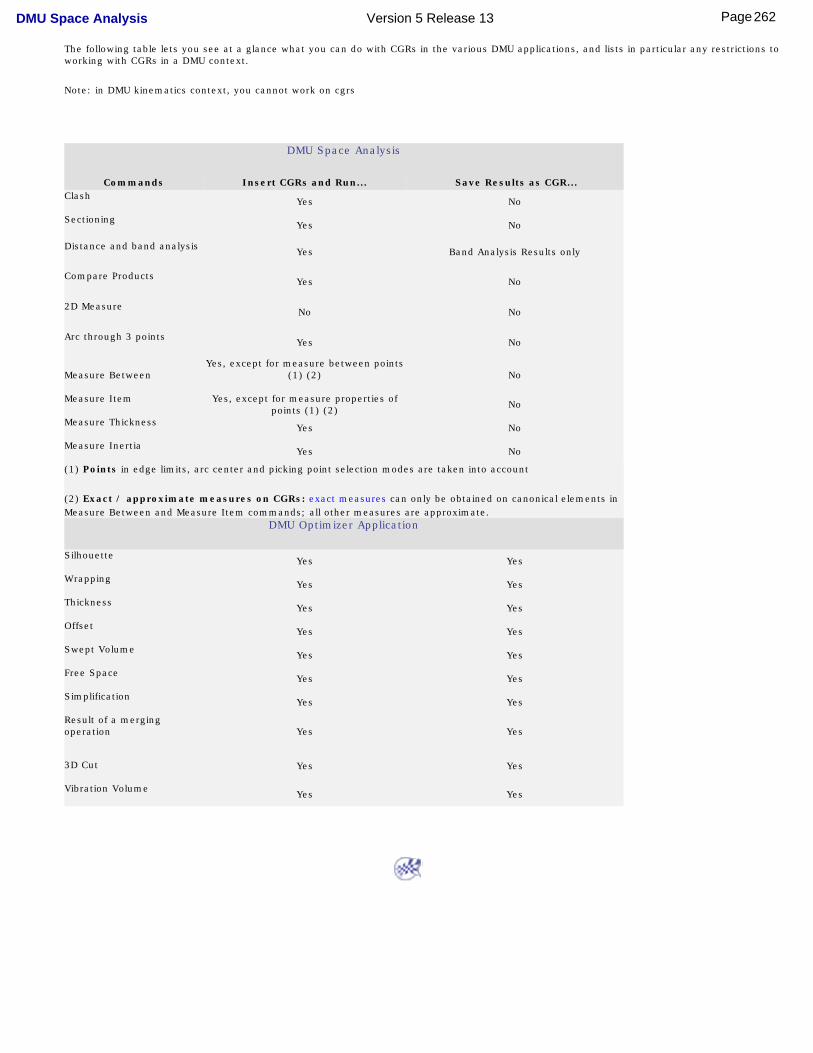
The following table lets you see at a glance what you can do with CGRs in the various DMU applications, and lists in particular any restrictions to working with CGRs in a DMU context.
Note: in DMU kinematics context, you cannot work on cgrs
DMU Space Analysis
Commands Insert CGRs and Run... Save Results as CGR...Clash Yes No
Sectioning Yes No
Distance and band analysis Yes Band Analysis Results only
Compare Products Yes No
2D Measure No No
Arc through 3 points Yes No
Measure BetweenYes, except for measure between points
(1) (2)
No
Measure Item
Yes, except for measure properties of points (1) (2) No
Measure Thickness Yes No
Measure Inertia Yes No
(1) Points in edge limits, arc center and picking point selection modes are taken into account
(2) Exact / approximate measures on CGRs: exact measures can only be obtained on canonical elements in Measure Between and Measure Item commands; all other measures are approximate.
DMU Optimizer Application
Silhouette Yes Yes
Wrapping Yes Yes
Thickness Yes Yes
Offset Yes Yes
Swept Volume Yes Yes
Free Space Yes Yes
Simplification Yes Yes
Result of a merging operation
Yes Yes
3D Cut
Yes Yes
Vibration Volume Yes Yes
262Page DMU Space Analysis Version 5 Release 13
DMU Space Analysis InteroperabilityIn this section, you will find information on working with PDM systems and DMU Space Analysis.
Working with ENOVIA LCAENOVIA VPM / Interference Analysis
263Page DMU Space Analysis Version 5 Release 13

Working with ENOVIA LCA
Optimal DMU PLM Usability for Space AnalysisInterference Analysis / ENOVIA LCA Interoperability
264Page DMU Space Analysis Version 5 Release 13
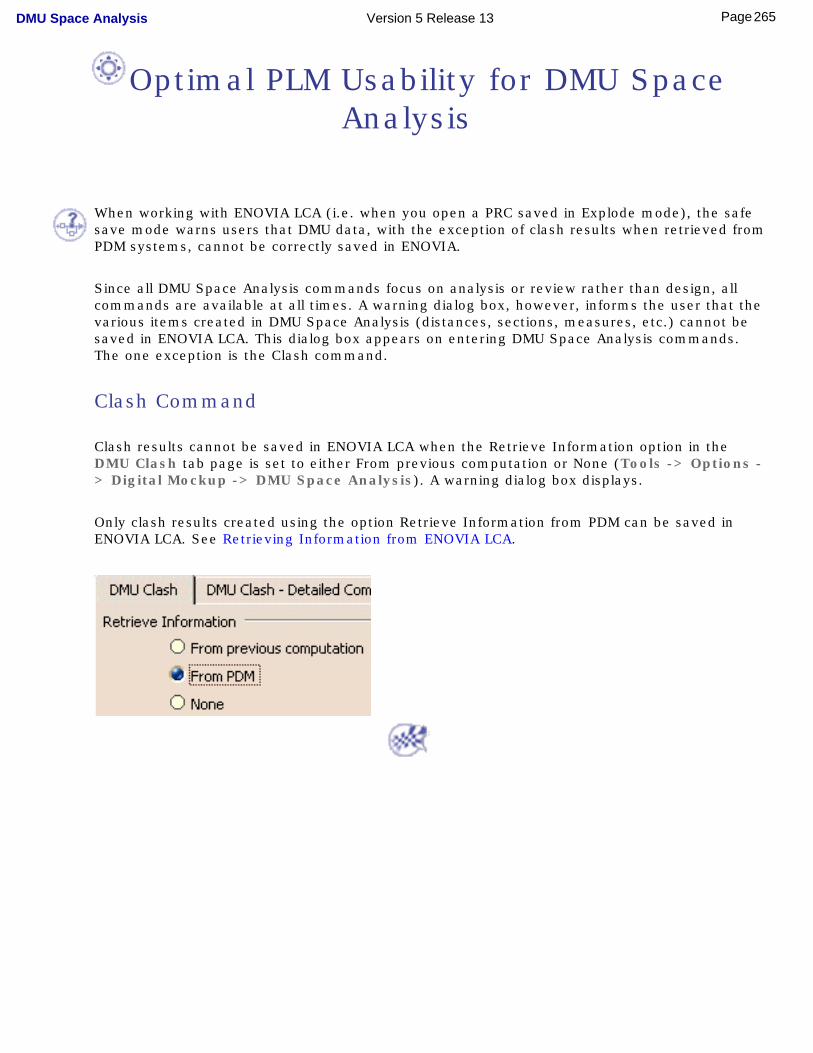
Optimal PLM Usability for DMU Space Analysis
When working with ENOVIA LCA (i.e. when you open a PRC saved in Explode mode), the safe save mode warns users that DMU data, with the exception of clash results when retrieved from PDM systems, cannot be correctly saved in ENOVIA.
Since all DMU Space Analysis commands focus on analysis or review rather than design, all commands are available at all times. A warning dialog box, however, informs the user that the various items created in DMU Space Analysis (distances, sections, measures, etc.) cannot be saved in ENOVIA LCA. This dialog box appears on entering DMU Space Analysis commands. The one exception is the Clash command.
Clash Command
Clash results cannot be saved in ENOVIA LCA when the Retrieve Information option in the DMU Clash tab page is set to either From previous computation or None (Tools -> Options -> Digital Mockup -> DMU Space Analysis). A warning dialog box displays.
Only clash results created using the option Retrieve Information from PDM can be saved in ENOVIA LCA. See Retrieving Information from ENOVIA LCA.
265Page DMU Space Analysis Version 5 Release 13
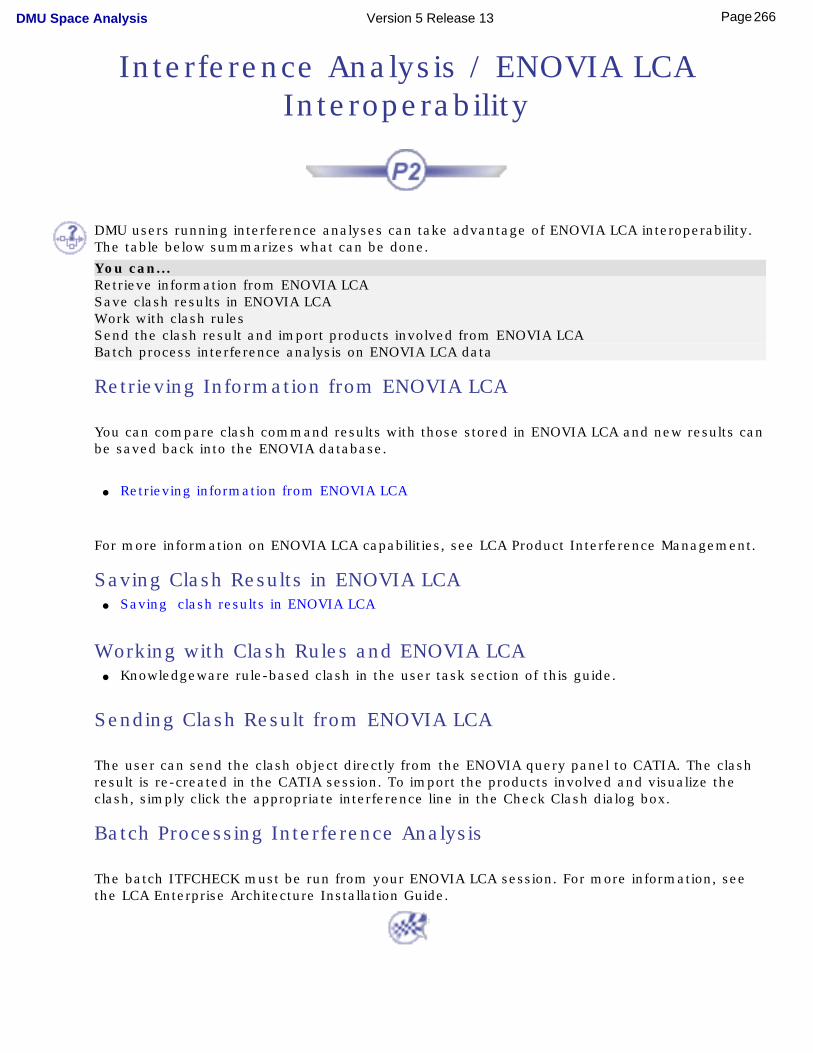
Interference Analysis / ENOVIA LCA Interoperability
DMU users running interference analyses can take advantage of ENOVIA LCA interoperability. The table below summarizes what can be done.
You can...Retrieve information from ENOVIA LCA Save clash results in ENOVIA LCA Work with clash rules Send the clash result and import products involved from ENOVIA LCA Batch process interference analysis on ENOVIA LCA data
Retrieving Information from ENOVIA LCA
You can compare clash command results with those stored in ENOVIA LCA and new results can be saved back into the ENOVIA database.
● Retrieving information from ENOVIA LCA
For more information on ENOVIA LCA capabilities, see LCA Product Interference Management.
Saving Clash Results in ENOVIA LCA ● Saving clash results in ENOVIA LCA
Working with Clash Rules and ENOVIA LCA ● Knowledgeware rule-based clash in the user task section of this guide.
Sending Clash Result from ENOVIA LCA
The user can send the clash object directly from the ENOVIA query panel to CATIA. The clash result is re-created in the CATIA session. To import the products involved and visualize the clash, simply click the appropriate interference line in the Check Clash dialog box.
Batch Processing Interference Analysis
The batch ITFCHECK must be run from your ENOVIA LCA session. For more information, see the LCA Enterprise Architecture Installation Guide.
266Page DMU Space Analysis Version 5 Release 13
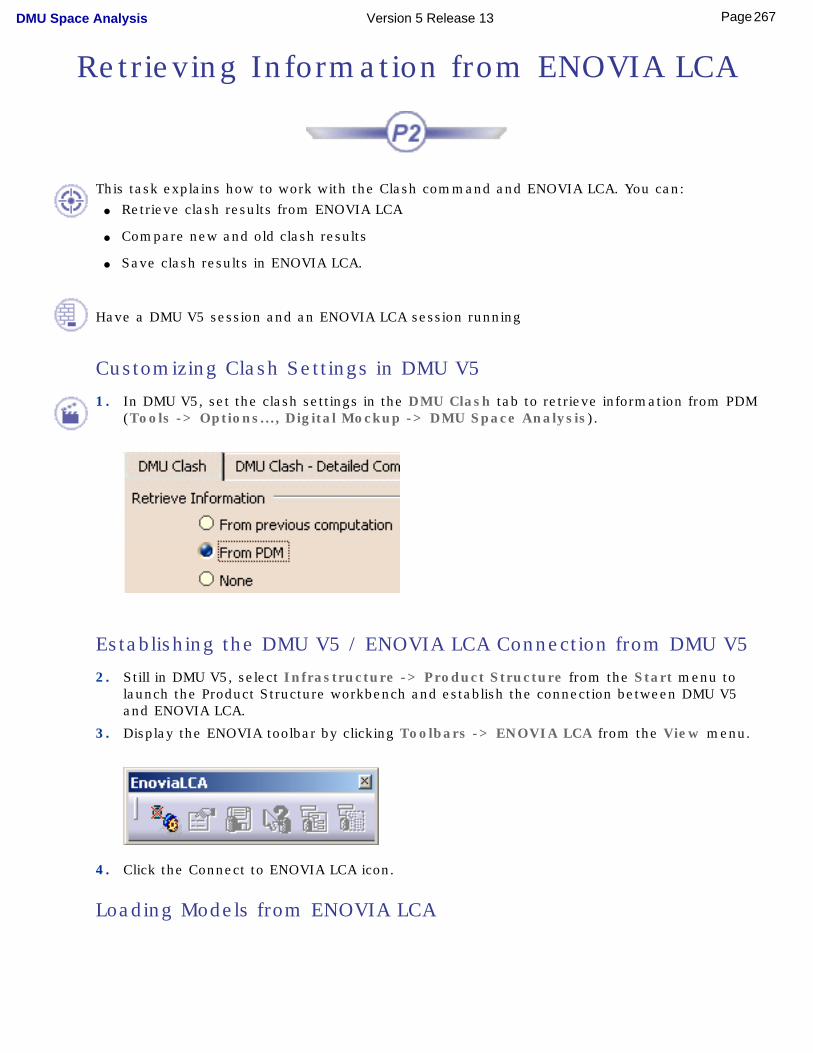
Retrieving Information from ENOVIA LCA
This task explains how to work with the Clash command and ENOVIA LCA. You can:● Retrieve clash results from ENOVIA LCA
● Compare new and old clash results
● Save clash results in ENOVIA LCA.
Have a DMU V5 session and an ENOVIA LCA session running
Customizing Clash Settings in DMU V5
1. In DMU V5, set the clash settings in the DMU Clash tab to retrieve information from PDM (Tools -> Options..., Digital Mockup -> DMU Space Analysis).
Establishing the DMU V5 / ENOVIA LCA Connection from DMU V5
2. Still in DMU V5, select Infrastructure -> Product Structure from the Start menu to launch the Product Structure workbench and establish the connection between DMU V5 and ENOVIA LCA.
3. Display the ENOVIA toolbar by clicking Toolbars -> ENOVIA LCA from the View menu.
4. Click the Connect to ENOVIA LCA icon.
Loading Models from ENOVIA LCA
267Page DMU Space Analysis Version 5 Release 13
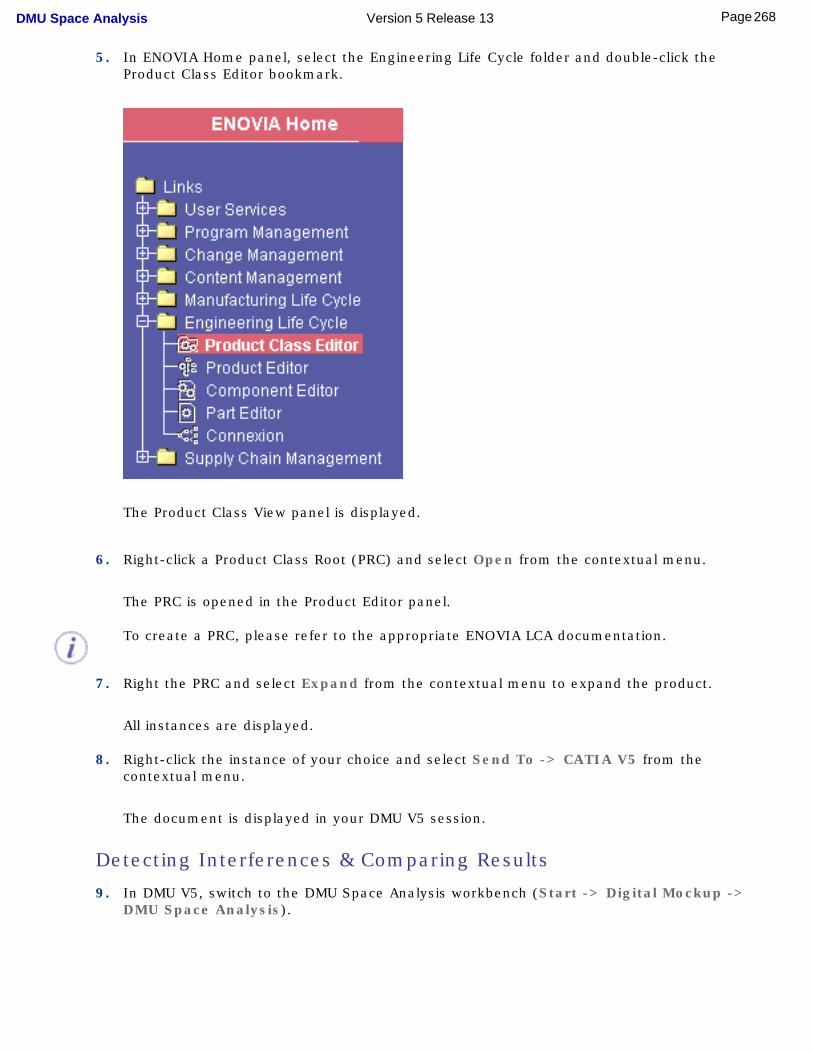
5. In ENOVIA Home panel, select the Engineering Life Cycle folder and double-click the Product Class Editor bookmark.
The Product Class View panel is displayed.
6. Right-click a Product Class Root (PRC) and select Open from the contextual menu.
The PRC is opened in the Product Editor panel.
To create a PRC, please refer to the appropriate ENOVIA LCA documentation.
7. Right the PRC and select Expand from the contextual menu to expand the product.
All instances are displayed.
8. Right-click the instance of your choice and select Send To -> CATIA V5 from the contextual menu.
The document is displayed in your DMU V5 session.
Detecting Interferences & Comparing Results
9. In DMU V5, switch to the DMU Space Analysis workbench (Start -> Digital Mockup -> DMU Space Analysis).
268Page DMU Space Analysis Version 5 Release 13
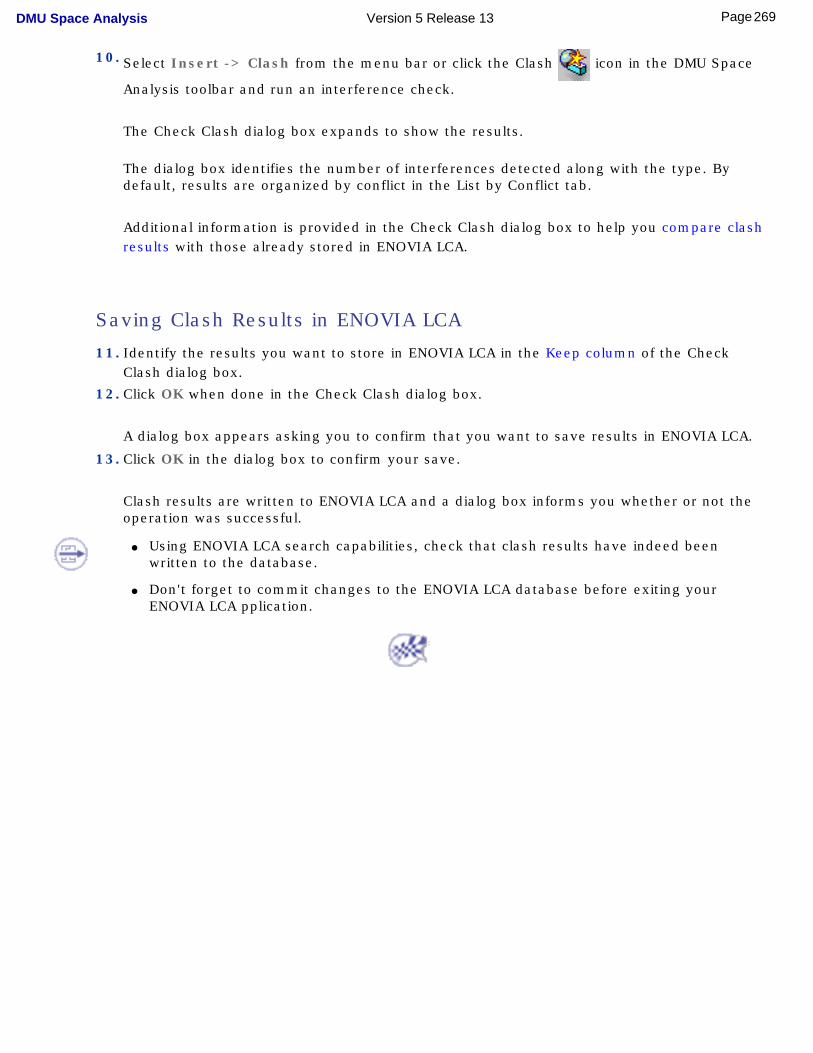
10. Select Insert -> Clash from the menu bar or click the Clash icon in the DMU Space
Analysis toolbar and run an interference check.
The Check Clash dialog box expands to show the results.
The dialog box identifies the number of interferences detected along with the type. By default, results are organized by conflict in the List by Conflict tab.
Additional information is provided in the Check Clash dialog box to help you compare clash results with those already stored in ENOVIA LCA.
Saving Clash Results in ENOVIA LCA
11. Identify the results you want to store in ENOVIA LCA in the Keep column of the Check Clash dialog box.
12. Click OK when done in the Check Clash dialog box.
A dialog box appears asking you to confirm that you want to save results in ENOVIA LCA.
13. Click OK in the dialog box to confirm your save.
Clash results are written to ENOVIA LCA and a dialog box informs you whether or not the operation was successful.
● Using ENOVIA LCA search capabilities, check that clash results have indeed been written to the database.
● Don't forget to commit changes to the ENOVIA LCA database before exiting your ENOVIA LCA pplication.
269Page DMU Space Analysis Version 5 Release 13
ENOVIAVPM / Interference Analysis
DMU users running interference analyses can take advantage of ENOVIAVPM interoperability. The table below summarizes what can be done.
You can...Retrieve information from ENOVIAVPMSave clash results in ENOVIAVPMBatch process interference analysis on ENOVIAVPM data
Retrieving Information from ENOVIAVPM
You can compare clash command results with those stored in ENOVIA VPM and new results can be saved back into the ENOVIA database.
● Retrieving information from ENOVIAVPM
For more information on ENOVIAVPM capabilities, see the VPM Installation & Administration Guide.
Saving Clash Results in ENOVIAVPM● Saving clash results in ENOVIAVPM
● Saving DMU applicative data in ENOVIAVPM in the DMU Navigator User's Guide.
Batch Processing Interference Analysis
The batch ITFCHECK must be run from your ENOVIAVPM session. For more information, see the VPM Installation & Administration Guide.
270Page DMU Space Analysis Version 5 Release 13
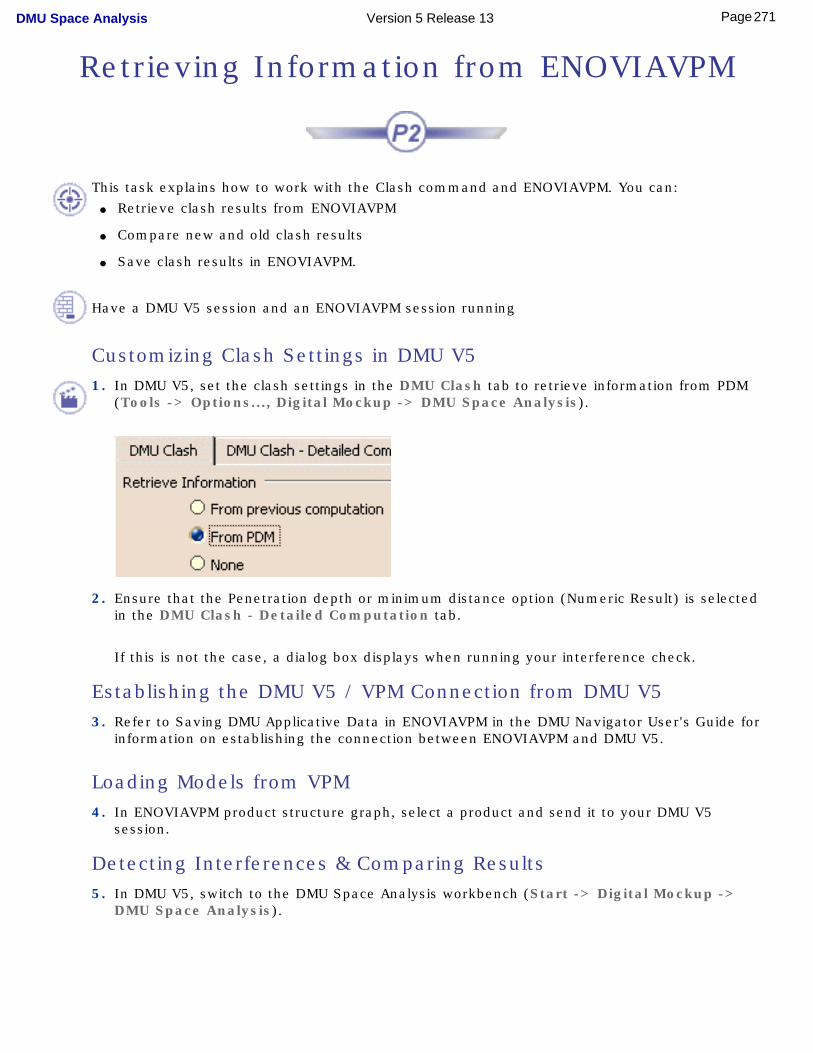
Retrieving Information from ENOVIAVPM
This task explains how to work with the Clash command and ENOVIAVPM. You can:● Retrieve clash results from ENOVIAVPM
● Compare new and old clash results
● Save clash results in ENOVIAVPM.
Have a DMU V5 session and an ENOVIAVPM session running
Customizing Clash Settings in DMU V51. In DMU V5, set the clash settings in the DMU Clash tab to retrieve information from PDM
(Tools -> Options..., Digital Mockup -> DMU Space Analysis).
2. Ensure that the Penetration depth or minimum distance option (Numeric Result) is selected in the DMU Clash - Detailed Computation tab.
If this is not the case, a dialog box displays when running your interference check.
Establishing the DMU V5 / VPM Connection from DMU V5 3. Refer to Saving DMU Applicative Data in ENOVIAVPM in the DMU Navigator User's Guide for
information on establishing the connection between ENOVIAVPM and DMU V5.
Loading Models from VPM4. In ENOVIAVPM product structure graph, select a product and send it to your DMU V5
session.
Detecting Interferences & Comparing Results5. In DMU V5, switch to the DMU Space Analysis workbench (Start -> Digital Mockup ->
DMU Space Analysis).
271Page DMU Space Analysis Version 5 Release 13
6. Select Insert -> Clash from the menu bar or click the Clash icon in the DMU Space
Analysis toolbar and run an interference check.
The Check Clash dialog box expands to show the results.
The dialog box identifies the number of interferences detected along with the type. By default, results are organized by conflict in the List by Conflict tab.
Additional information is provided in the Check Clash dialog box to help you compare clash results with those already stored in ENOVIAVPM.
Saving Clash Results in VPM 7. Identify the results you want to store in ENOVIAVPM in the Keep column of the Check Clash
dialog box.8. Click OK when done in the Check Clash dialog box.
A dialog box appears asking you to confirm that you want to save results in VPM.
9. Click OK in the dialog box to confirm your save.
Clash results are written to ENOVIAVPM and a dialog box informs you whether or not the operation was successful.
● Using ENOVIAVPM query capabilities (Interferences Management panel), check that clash results have indeed been written to the PSN graph.
● Don't forget to commit changes in the PSN graph to the ENOVIAVPM database before exiting your VPM application.
272Page DMU Space Analysis Version 5 Release 13
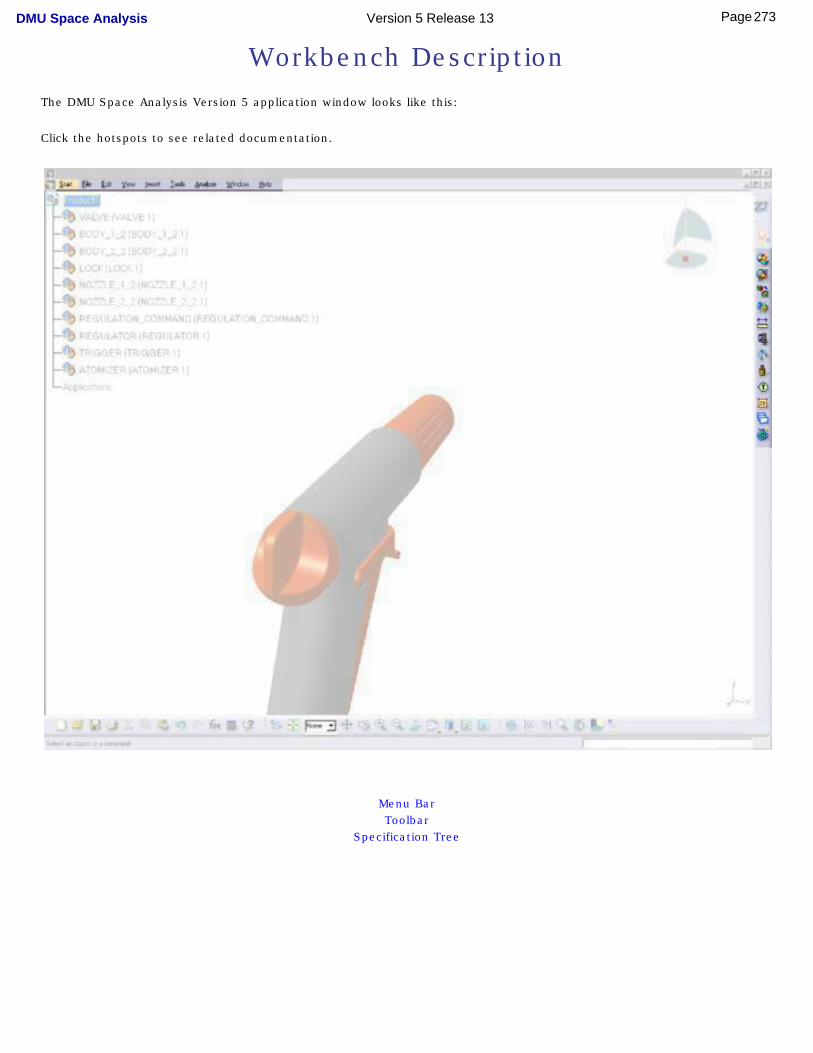
Workbench Description The DMU Space Analysis Version 5 application window looks like this:
Click the hotspots to see related documentation.
Menu BarToolbar
Specification Tree
273Page DMU Space Analysis Version 5 Release 13
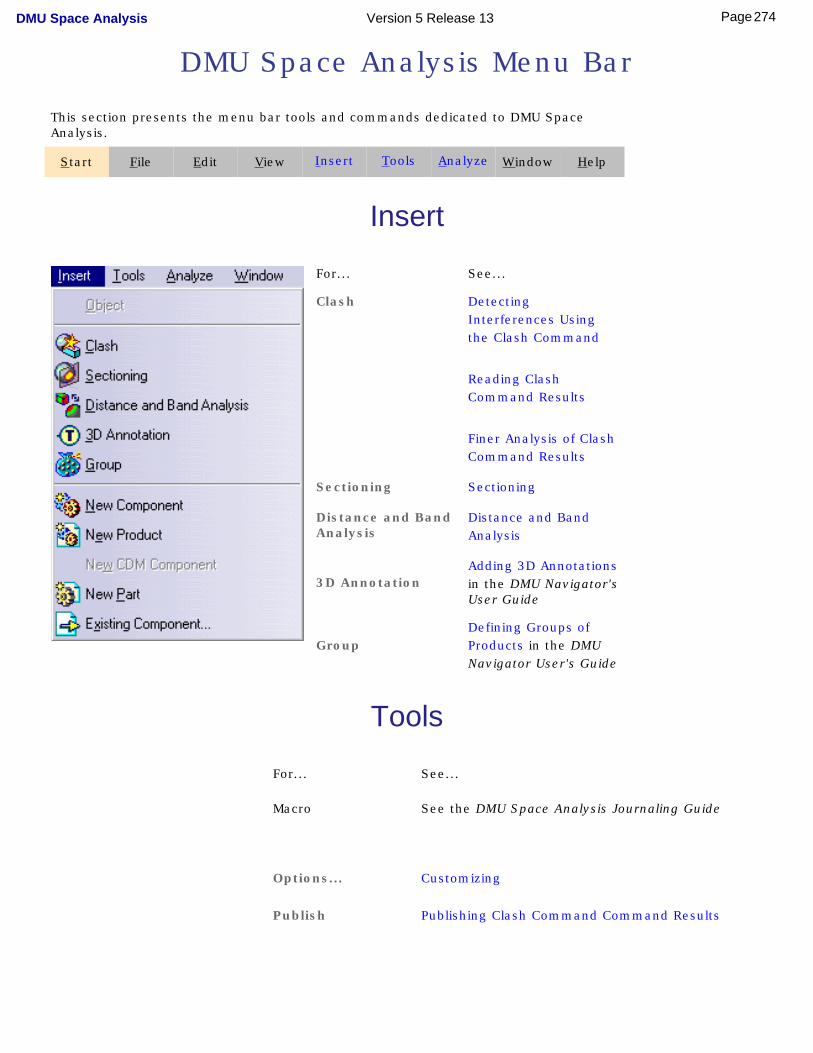
DMU Space Analysis Menu Bar
This section presents the menu bar tools and commands dedicated to DMU Space Analysis.
Start File Edit View Insert Tools Analyze Window Help
Insert
For... See...
Clash Detecting Interferences Using the Clash Command
Reading Clash Command Results
Finer Analysis of Clash Command Results
Sectioning Sectioning
Distance and Band Analysis
Distance and Band Analysis
3D AnnotationAdding 3D Annotations in the DMU Navigator's User Guide
GroupDefining Groups of Products in the DMU Navigator User's Guide
Tools
For... See...
Macro See the DMU Space Analysis Journaling Guide
Options... Customizing
Publish Publishing Clash Command Command Results
274Page DMU Space Analysis Version 5 Release 13
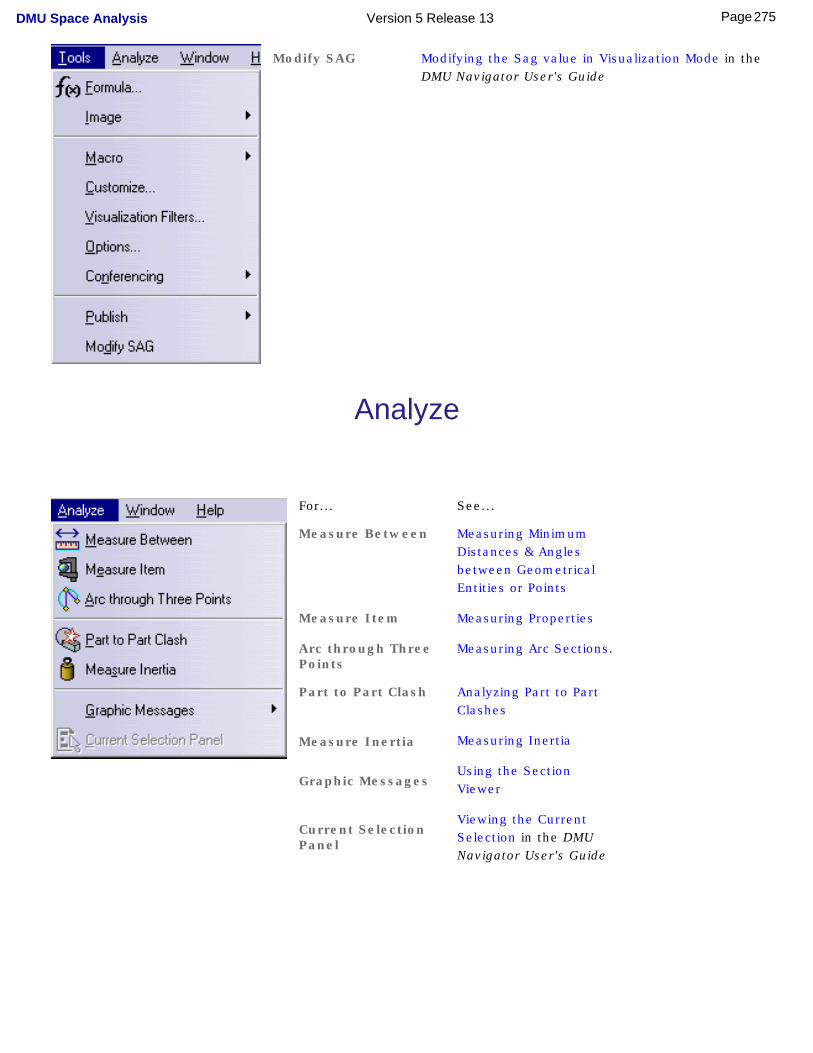
Modify SAG Modifying the Sag value in Visualization Mode in the DMU Navigator User's Guide
Analyze
For... See...
Measure Between Measuring Minimum Distances & Angles between Geometrical Entities or Points
Measure Item Measuring Properties
Arc through Three Points
Measuring Arc Sections.
Part to Part Clash Analyzing Part to Part Clashes
Measure Inertia Measuring Inertia
Graphic MessagesUsing the Section Viewer
Current Selection Panel
Viewing the Current Selection in the DMU Navigator User's Guide
275Page DMU Space Analysis Version 5 Release 13
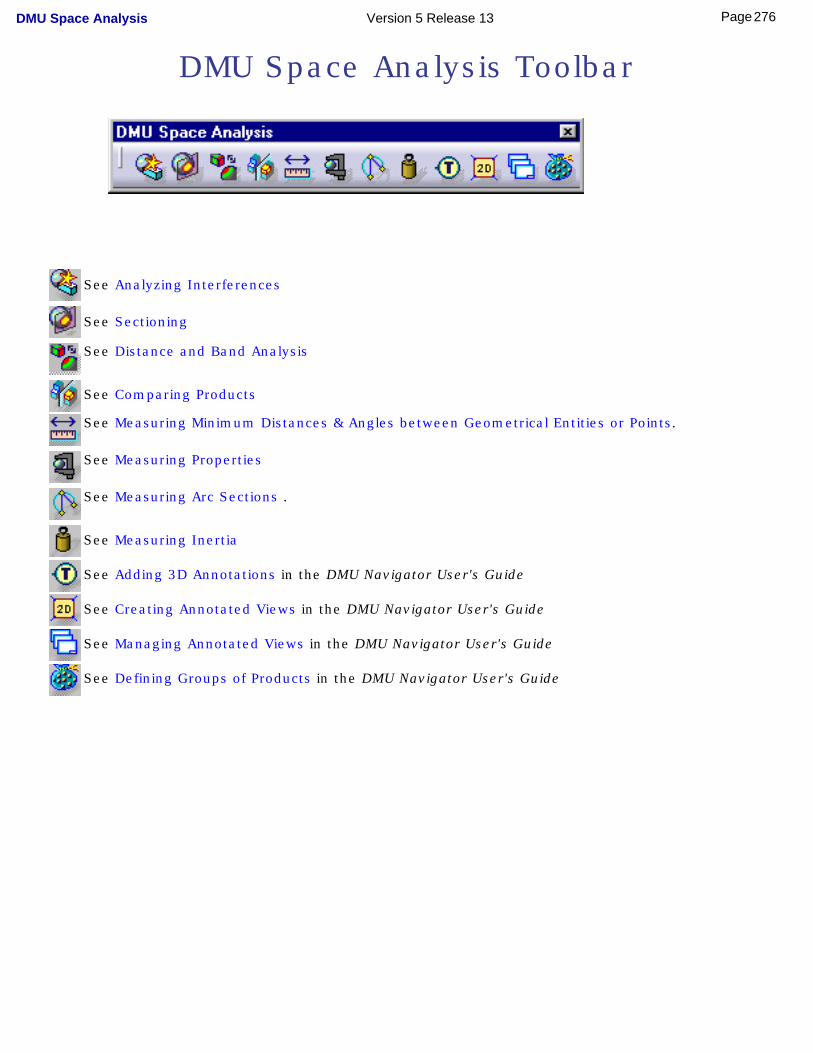
DMU Space Analysis Toolbar
See Analyzing Interferences
See Sectioning
See Distance and Band Analysis
See Comparing Products
See Measuring Minimum Distances & Angles between Geometrical Entities or Points.
See Measuring Properties
See Measuring Arc Sections .
See Measuring Inertia
See Adding 3D Annotations in the DMU Navigator User's Guide
See Creating Annotated Views in the DMU Navigator User's Guide
See Managing Annotated Views in the DMU Navigator User's Guide
See Defining Groups of Products in the DMU Navigator User's Guide
276Page DMU Space Analysis Version 5 Release 13
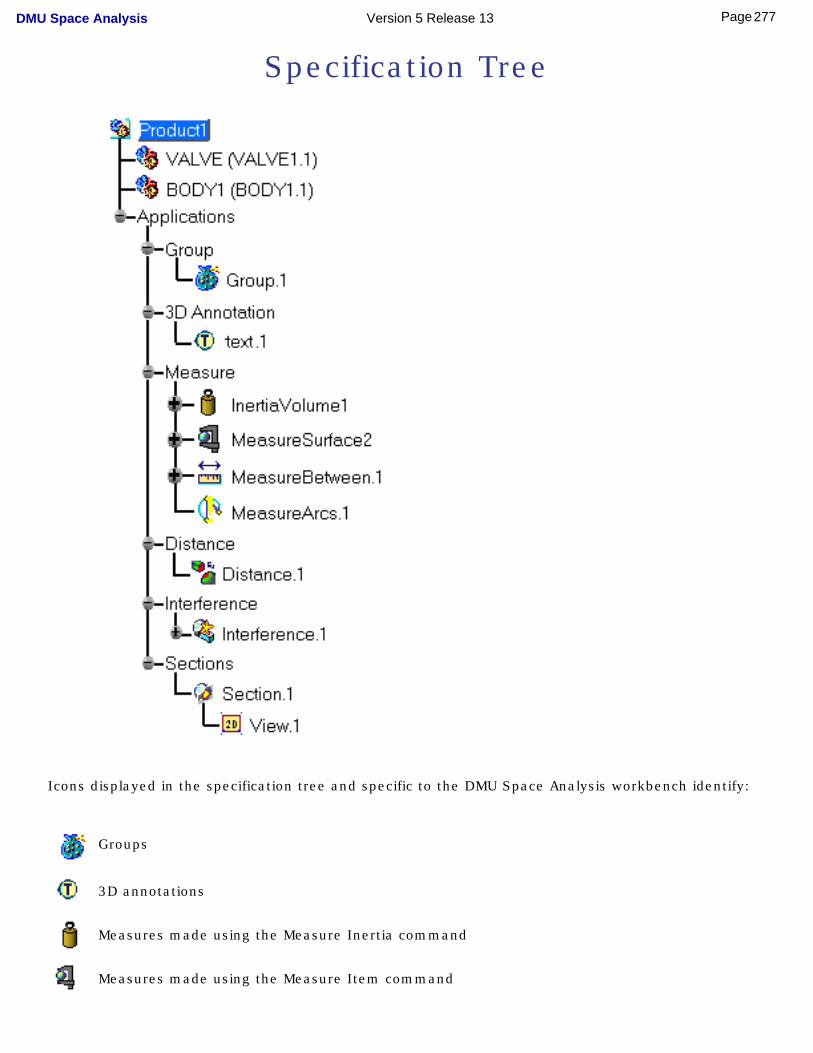
Specification Tree
Icons displayed in the specification tree and specific to the DMU Space Analysis workbench identify:
Groups
3D annotations
Measures made using the Measure Inertia command
Measures made using the Measure Item command
277Page DMU Space Analysis Version 5 Release 13
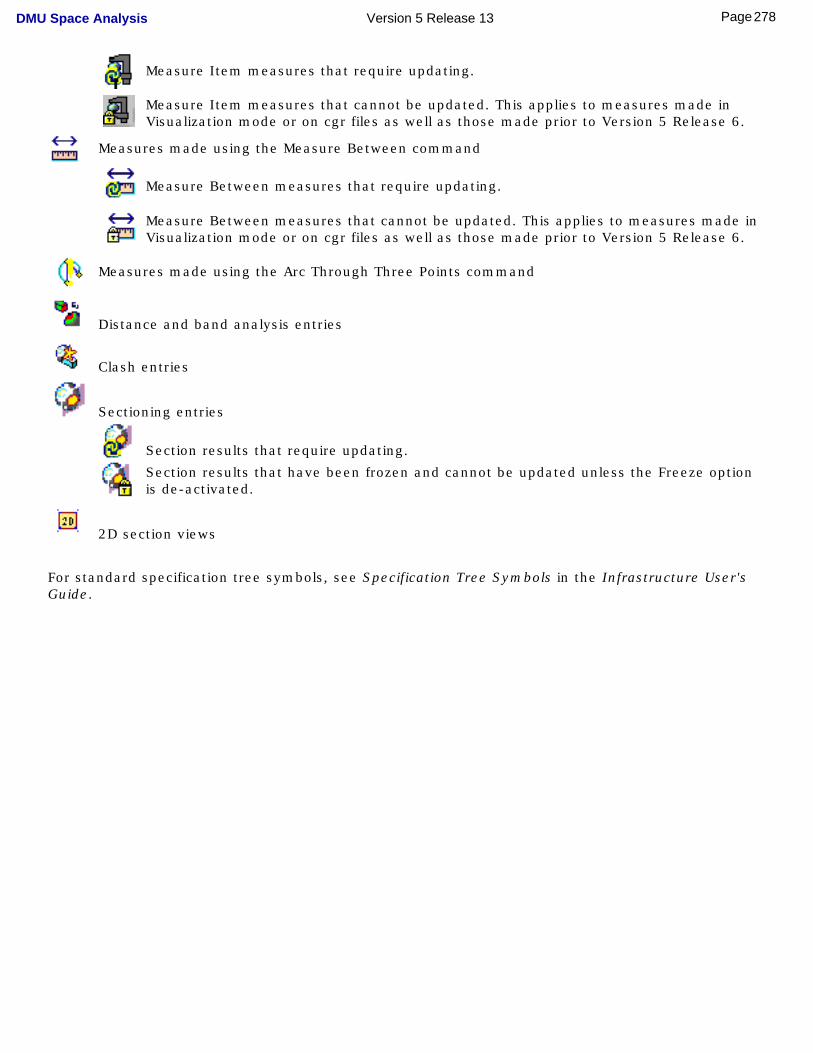
Measure Item measures that require updating.
Measure Item measures that cannot be updated. This applies to measures made in Visualization mode or on cgr files as well as those made prior to Version 5 Release 6.
Measures made using the Measure Between command
Measure Between measures that require updating.
Measure Between measures that cannot be updated. This applies to measures made in Visualization mode or on cgr files as well as those made prior to Version 5 Release 6.
Measures made using the Arc Through Three Points command
Distance and band analysis entries
Clash entries
Sectioning entries
Section results that require updating. Section results that have been frozen and cannot be updated unless the Freeze option
is de-activated.
2D section views
For standard specification tree symbols, see Specification Tree Symbols in the Infrastructure User's Guide.
278Page DMU Space Analysis Version 5 Release 13
Customizing for DMU Space Analysis
DMU ClashDMU Clash - Detailed Computation
DMU Clash - PenetrationDMU Clash - Rule
DMU Clash - ProcessDMU SectioningDMU DistanceMeasure Tools
279Page DMU Space Analysis Version 5 Release 13
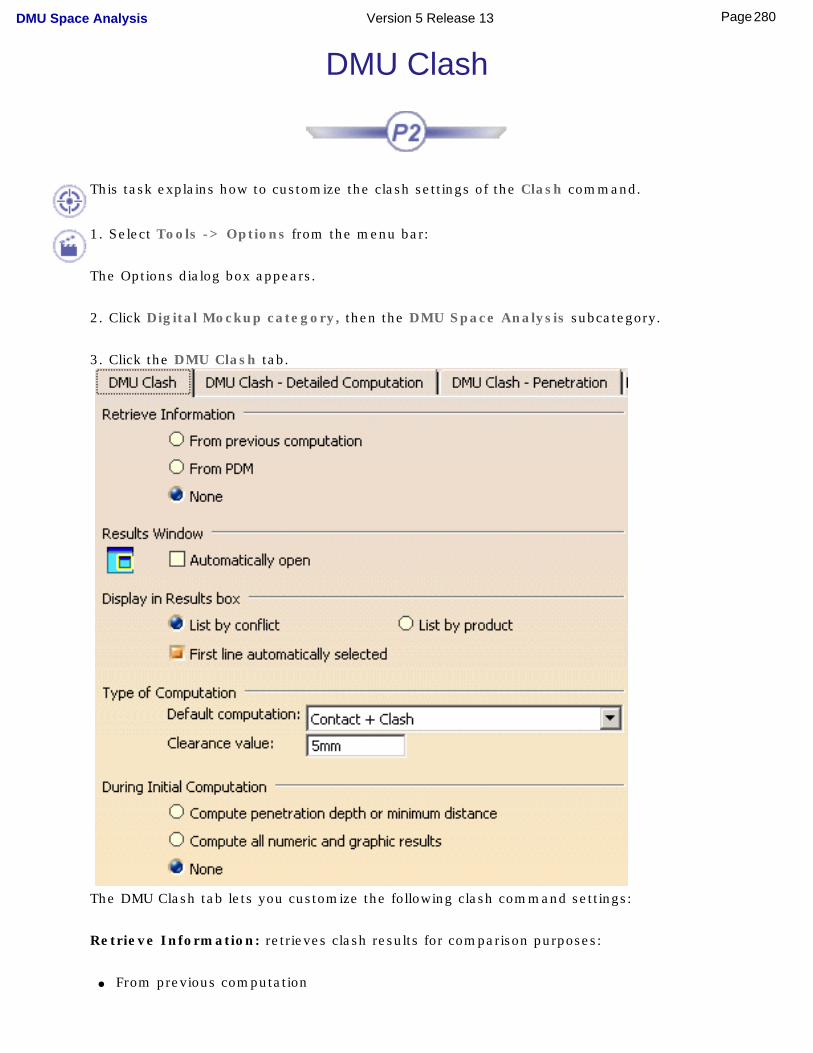
DMU Clash
This task explains how to customize the clash settings of the Clash command.
1. Select Tools -> Options from the menu bar:
The Options dialog box appears.
2. Click Digital Mockup category, then the DMU Space Analysis subcategory.
3. Click the DMU Clash tab.
The DMU Clash tab lets you customize the following clash command settings:
Retrieve Information: retrieves clash results for comparison purposes:
● From previous computation
280Page DMU Space Analysis Version 5 Release 13
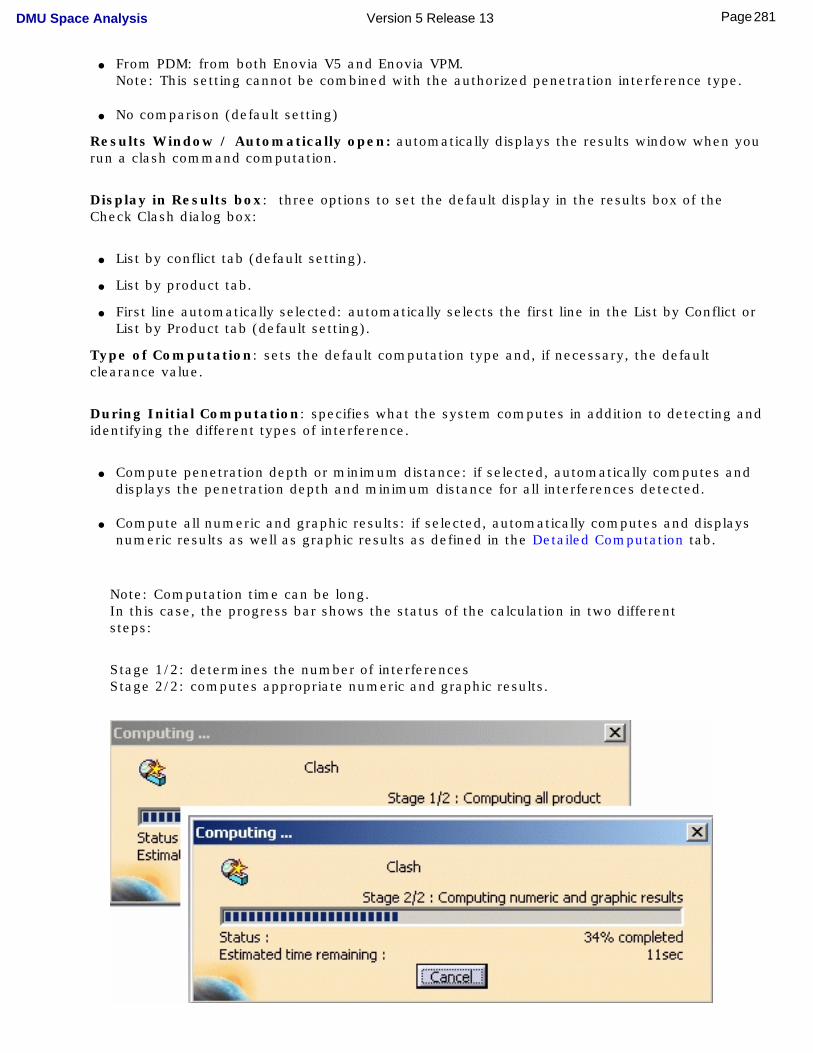
● From PDM: from both Enovia V5 and Enovia VPM.
Note: This setting cannot be combined with the authorized penetration interference type.
● No comparison (default setting)
Results Window / Automatically open: automatically displays the results window when you run a clash command computation.
Display in Results box: three options to set the default display in the results box of the Check Clash dialog box:
● List by conflict tab (default setting).
● List by product tab.
● First line automatically selected: automatically selects the first line in the List by Conflict or List by Product tab (default setting).
Type of Computation: sets the default computation type and, if necessary, the default clearance value.
During Initial Computation: specifies what the system computes in addition to detecting and identifying the different types of interference.
● Compute penetration depth or minimum distance: if selected, automatically computes and displays the penetration depth and minimum distance for all interferences detected.
● Compute all numeric and graphic results: if selected, automatically computes and displays numeric results as well as graphic results as defined in the Detailed Computation tab.
Note: Computation time can be long. In this case, the progress bar shows the status of the calculation in two different steps:
Stage 1/2: determines the number of interferencesStage 2/2: computes appropriate numeric and graphic results.
281Page DMU Space Analysis Version 5 Release 13

● None: if selected, the initial computation detects and identifies the different types of
interference only.
4. Click OK in the dialog box when done
282Page DMU Space Analysis Version 5 Release 13
DMU Clash - Detailed Computation
This task explains how to customize the detailed computation settings of the Clash command.
The detailed computation mode defines what is computed when you select a conflict or product in the Check Clash Results box. It can be run at element or product level.
By default, the detailed computation is run at element level. The graphics representation of interferences (triangles for contacts and clearances, curves for clashes) and the penetration depth or minimum distance are computed.
1. Select Tools -> Options from the menu bar:
The Options dialog box appears.
2. Click Digital Mockup -> DMU Space Analysis in the left-hand box.
3. Click the DMU Clash - Detailed Computation tab.
283Page DMU Space Analysis Version 5 Release 13
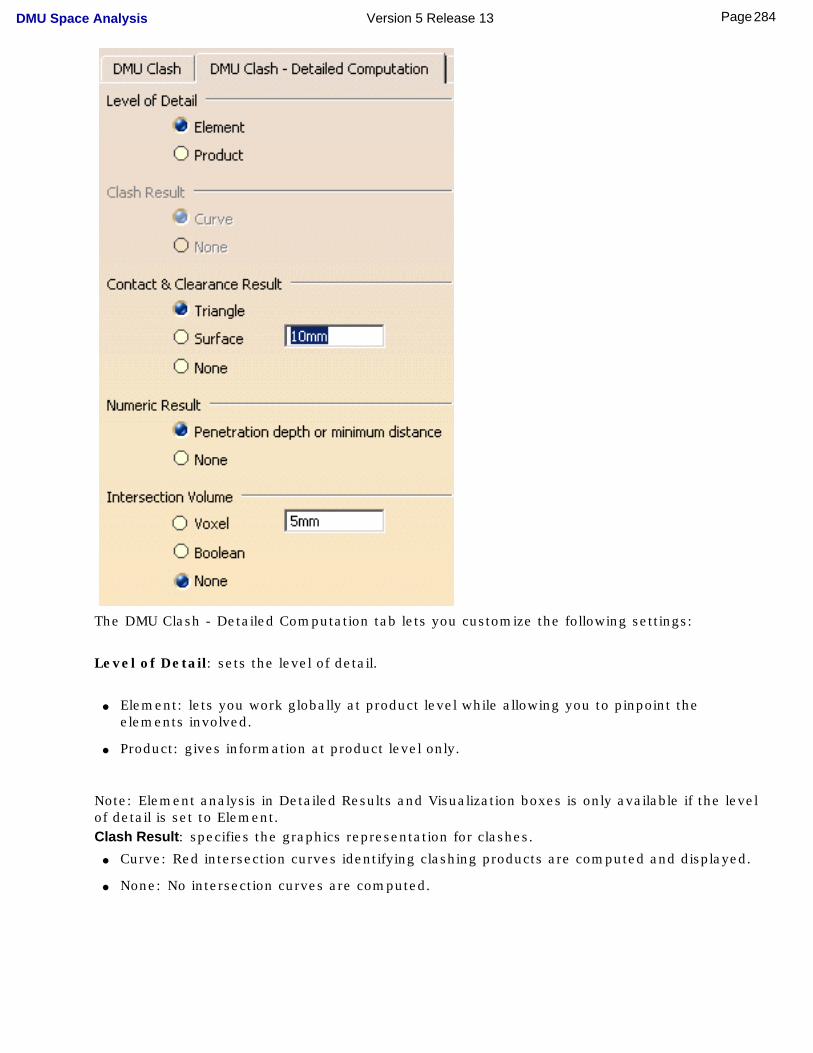
The DMU Clash - Detailed Computation tab lets you customize the following settings:
Level of Detail: sets the level of detail.
● Element: lets you work globally at product level while allowing you to pinpoint the elements involved.
● Product: gives information at product level only.
Note: Element analysis in Detailed Results and Visualization boxes is only available if the level of detail is set to Element.Clash Result: specifies the graphics representation for clashes.
● Curve: Red intersection curves identifying clashing products are computed and displayed.
● None: No intersection curves are computed.
284Page DMU Space Analysis Version 5 Release 13
Contact & Clearance Result: specifies the graphics representation for contacts and clearances.
● Triangles: Yellow and green triangles identifying products in contact and products separated by less than the specified clearance distance respectively are computed and displayed.
Note: The graphics display and storage of the triangular representation is costly and may adversely affect performance.
● Surface: Yellow and green surfaces identifying products in contact and products separated by less than the specified clearance distance respectively are computed and displayed.
If you select this option, you must set an accuracy. The value entered defines the maximum value for the length of the longest side of a triangular representation of the results. This representation is used to obtain the yellow and green surfaces.
● None: No triangles or surfaces are computed.
Numeric Result: specifies the numeric result computed and displayed.
● Penetration depth or minimum distance: The penetration depth of clashes and the minimum distance for clearances is computed and displayed.
● None: No penetration depth or minimum distance is computed.
Intersection Volume: specifies a graphics representation for clashes. This representation can be requested in addition to that selected under Clash Result.
Important: The intersection volume is only visible in the Results window.
● Voxel: Voxels (cubes) identifying clashing products are computed and displayed.
If you check this option, you must set the voxel size. The value entered is the edge-length of the voxel or cube. A lower value will give a more accurate result but will also require a longer computation time and more memory. The minimum value is 1mm (0.03937 inch).
● Boolean: Boolean solids identifying clashing products are computed and displayed.
● None: No intersection volume is computed.
Notes:
● The intersection volume is also given in the Detailed Results box of the Check Clash dialog box.
● The intersection volume is not stored in the model and cannot be saved in ENOVIA LCA or ENOVIA VPM.
4. Click OK in the dialog box when done.
285Page DMU Space Analysis Version 5 Release 13
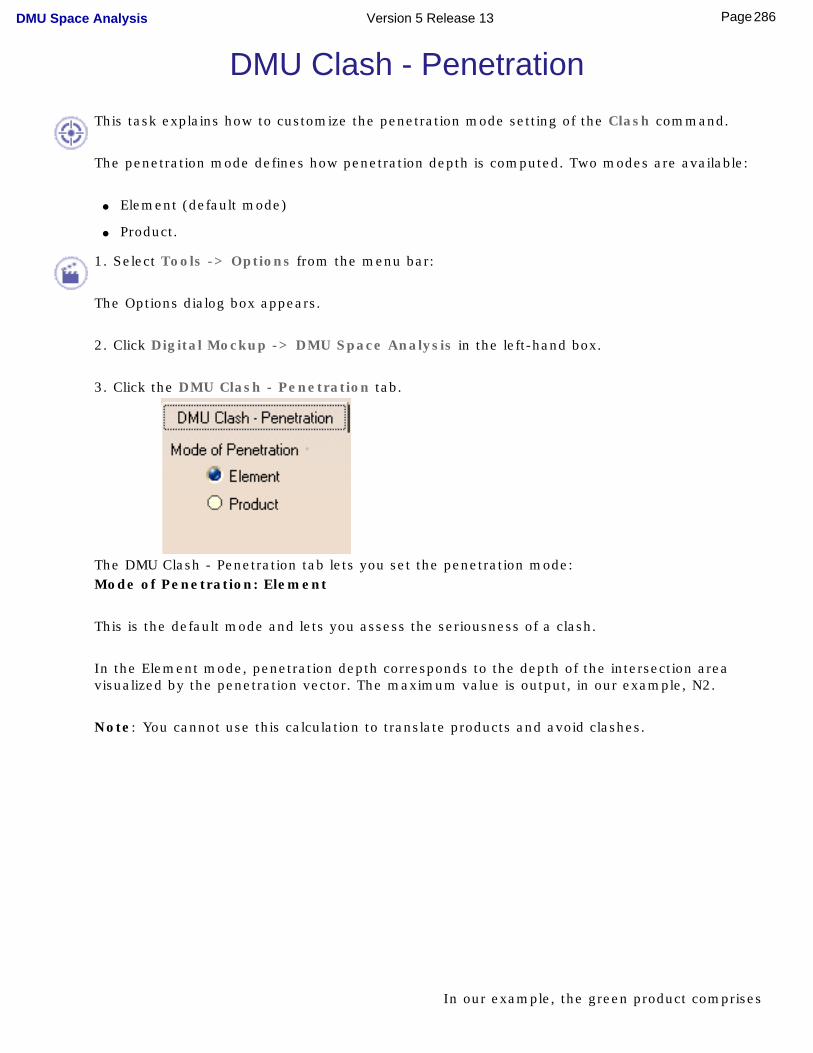
DMU Clash - Penetration
This task explains how to customize the penetration mode setting of the Clash command.
The penetration mode defines how penetration depth is computed. Two modes are available:
● Element (default mode)
● Product.
1. Select Tools -> Options from the menu bar:
The Options dialog box appears.
2. Click Digital Mockup -> DMU Space Analysis in the left-hand box.
3. Click the DMU Clash - Penetration tab.
The DMU Clash - Penetration tab lets you set the penetration mode: Mode of Penetration: Element
This is the default mode and lets you assess the seriousness of a clash.
In the Element mode, penetration depth corresponds to the depth of the intersection area visualized by the penetration vector. The maximum value is output, in our example, N2.
Note: You cannot use this calculation to translate products and avoid clashes.
In our example, the green product comprises
286Page DMU Space Analysis Version 5 Release 13
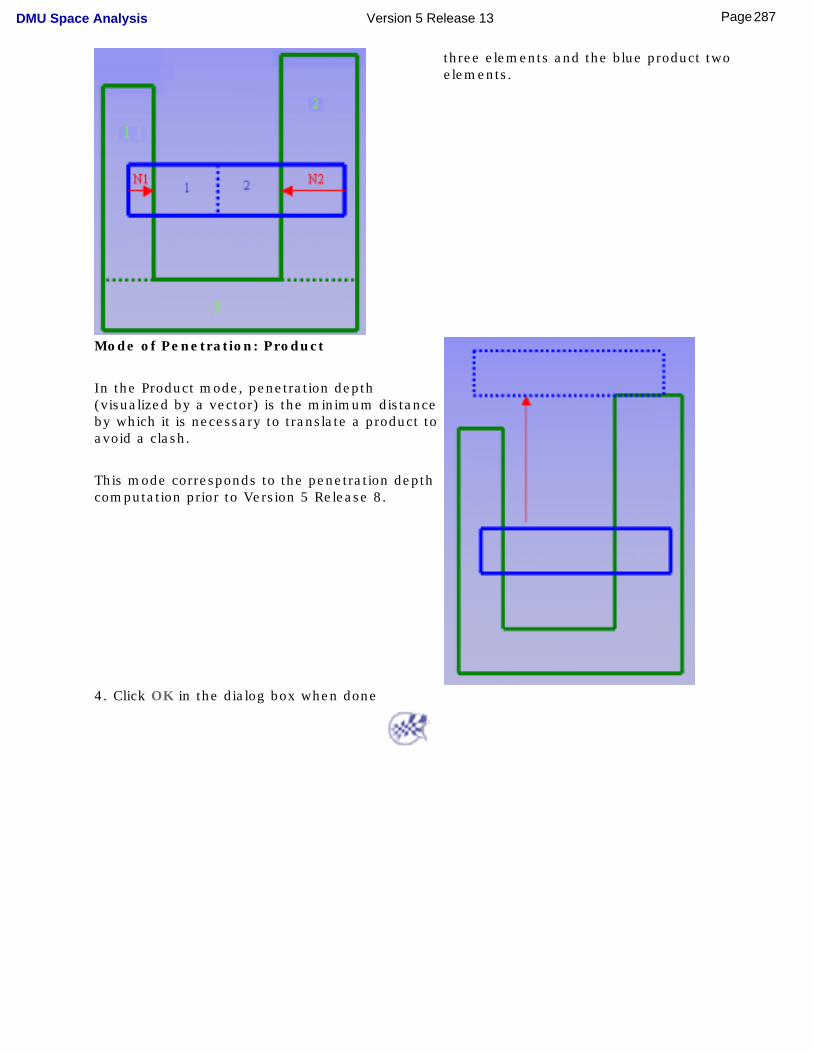
three elements and the blue product two elements.
Mode of Penetration: Product
In the Product mode, penetration depth (visualized by a vector) is the minimum distance by which it is necessary to translate a product to avoid a clash.
This mode corresponds to the penetration depth computation prior to Version 5 Release 8.
4. Click OK in the dialog box when done
287Page DMU Space Analysis Version 5 Release 13
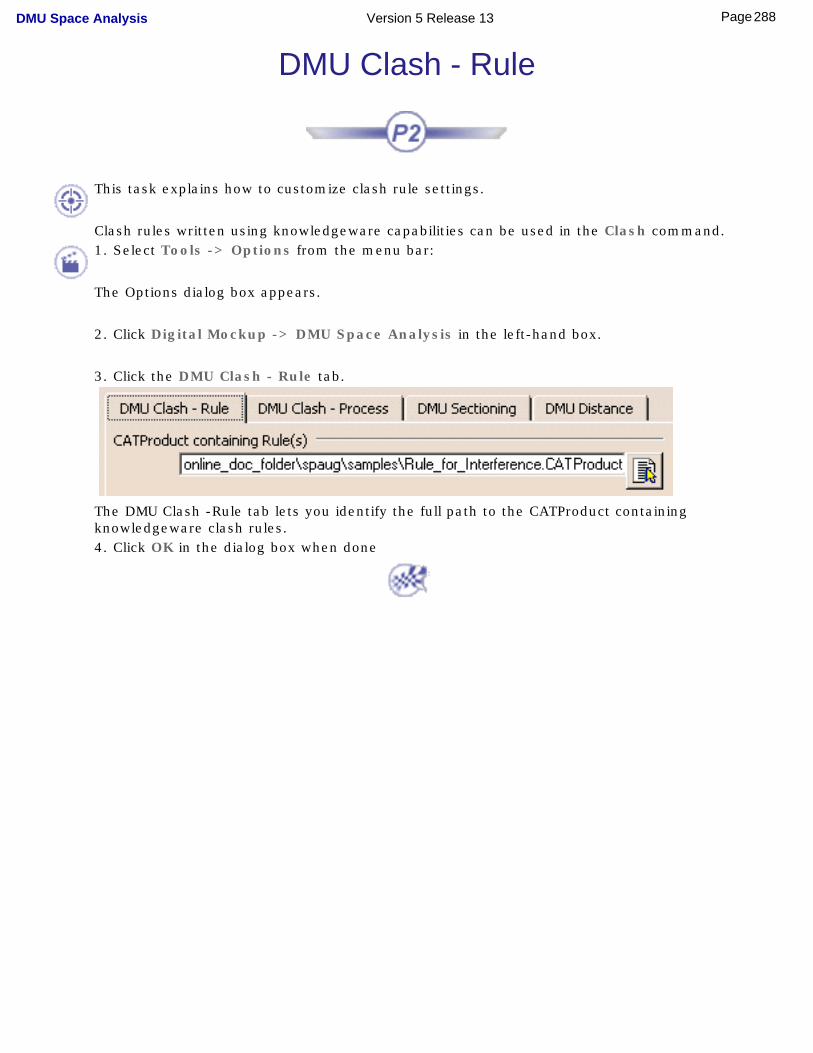
DMU Clash - Rule
This task explains how to customize clash rule settings.
Clash rules written using knowledgeware capabilities can be used in the Clash command.
1. Select Tools -> Options from the menu bar:
The Options dialog box appears.
2. Click Digital Mockup -> DMU Space Analysis in the left-hand box.
3. Click the DMU Clash - Rule tab.
The DMU Clash -Rule tab lets you identify the full path to the CATProduct containing knowledgeware clash rules. 4. Click OK in the dialog box when done
288Page DMU Space Analysis Version 5 Release 13
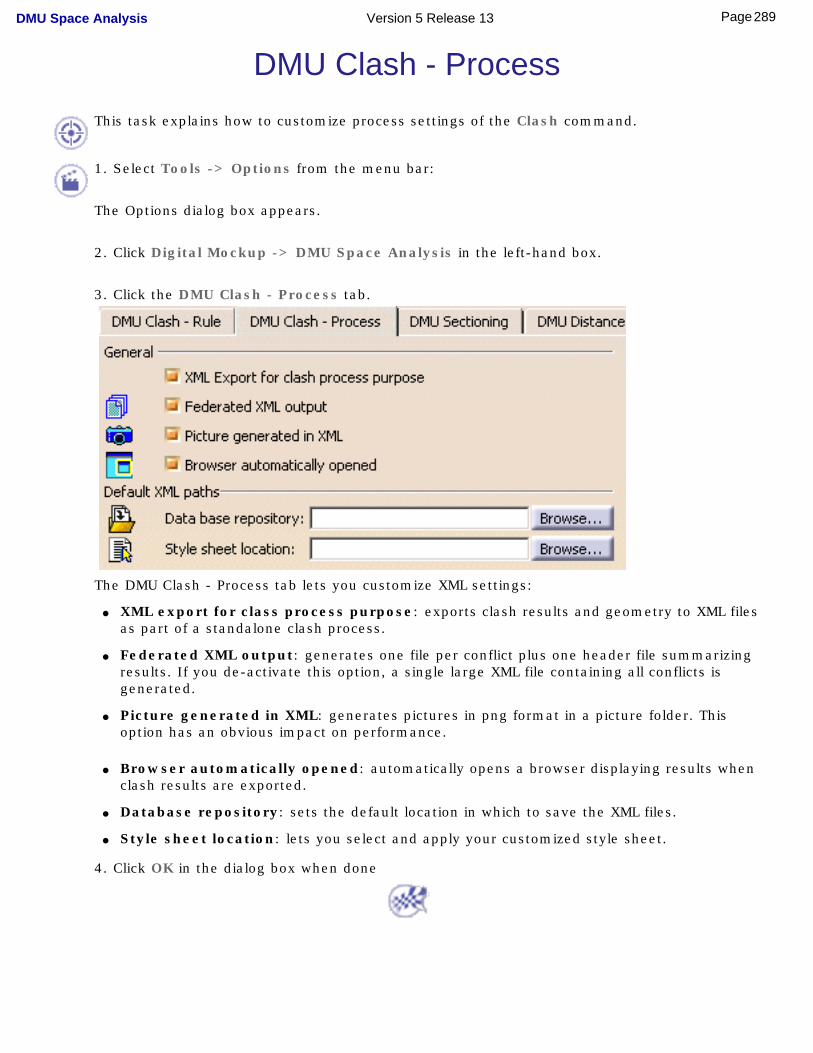
DMU Clash - Process
This task explains how to customize process settings of the Clash command.
1. Select Tools -> Options from the menu bar:
The Options dialog box appears.
2. Click Digital Mockup -> DMU Space Analysis in the left-hand box.
3. Click the DMU Clash - Process tab.
The DMU Clash - Process tab lets you customize XML settings:
● XML export for class process purpose: exports clash results and geometry to XML files as part of a standalone clash process.
● Federated XML output: generates one file per conflict plus one header file summarizing results. If you de-activate this option, a single large XML file containing all conflicts is generated.
● Picture generated in XML: generates pictures in png format in a picture folder. This option has an obvious impact on performance.
● Browser automatically opened: automatically opens a browser displaying results when clash results are exported.
● Database repository: sets the default location in which to save the XML files.
● Style sheet location: lets you select and apply your customized style sheet.
4. Click OK in the dialog box when done
289Page DMU Space Analysis Version 5 Release 13
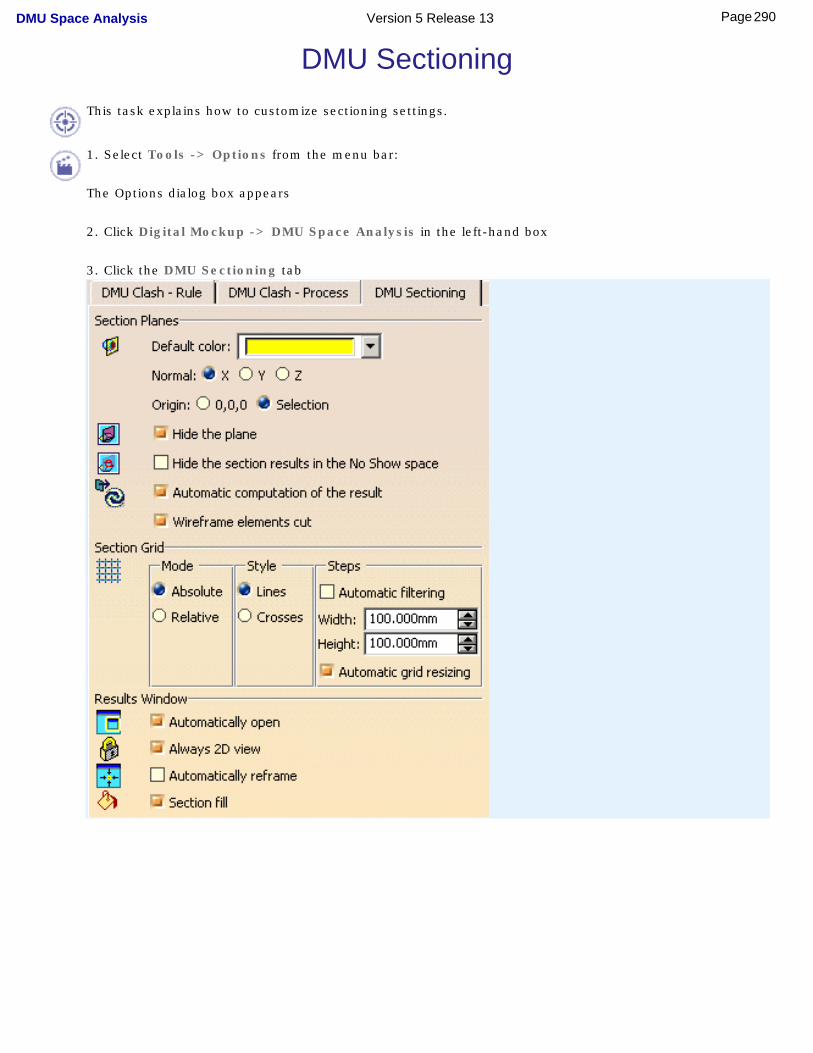
DMU Sectioning
This task explains how to customize sectioning settings.
1. Select Tools -> Options from the menu bar:
The Options dialog box appears
2. Click Digital Mockup -> DMU Space Analysis in the left-hand box
3. Click the DMU Sectioning tab
290Page DMU Space Analysis Version 5 Release 13
The DMU Sectioning tab lets you customize:
Section Planes: sets default section plane settings.
● Default color: sets the default color of the section plane.
● Normal X,Y,Z: specifies the absolute axis along which you want to orient the normal vector of the section plane (master plane in the case of slices and boxes).
● Origin: locates the center of the plane at absolute coordinates 0,0,0 or at the center of the bounding sphere around the products in the selection you defined.
● Hide the plane: hides the plane on exiting the command. De-activate this option to keep the plane in the Show space.
● Hide the section results in the No Show space: transfers the section results to the No Show place on exiting the command.
● Automatic computation of the result: automatically updates sectioning results while manipulating the plane. De-activating this option means that results are computed when you release the mouse button.
● Wireframe elements cut: the section plane sections any wireframe elements present. Points represent the intersection of the plane with wireframe elements.De-activating this option means that wireframe elements are not taken into account.
Section Grid: sets default grid options. ● Absolute mode: sets grid coordinates with respect to the absolute axis system of the document.
● Relative mode: places the center of the grid on the center of the section plane (master plane in the case of slices and boxes).
● Style: sets the grid representation to lines or crosses.
● Automatic filtering: if clicked, automatically adjusts the level of detail of the grid display when you zoom in and out.
● Steps: specifies the spacing between grid lines. The default value is 100. Units are current units set using Tools -> Options.
● Automatic grid resizing: automatically re-sizes the grid to section results when moving the section plane. De-activating this option means that the grid has the same dimensions as the section plane.
Automatic grid resizing ON: Automatic grid resizing OFF:
291Page DMU Space Analysis Version 5 Release 13
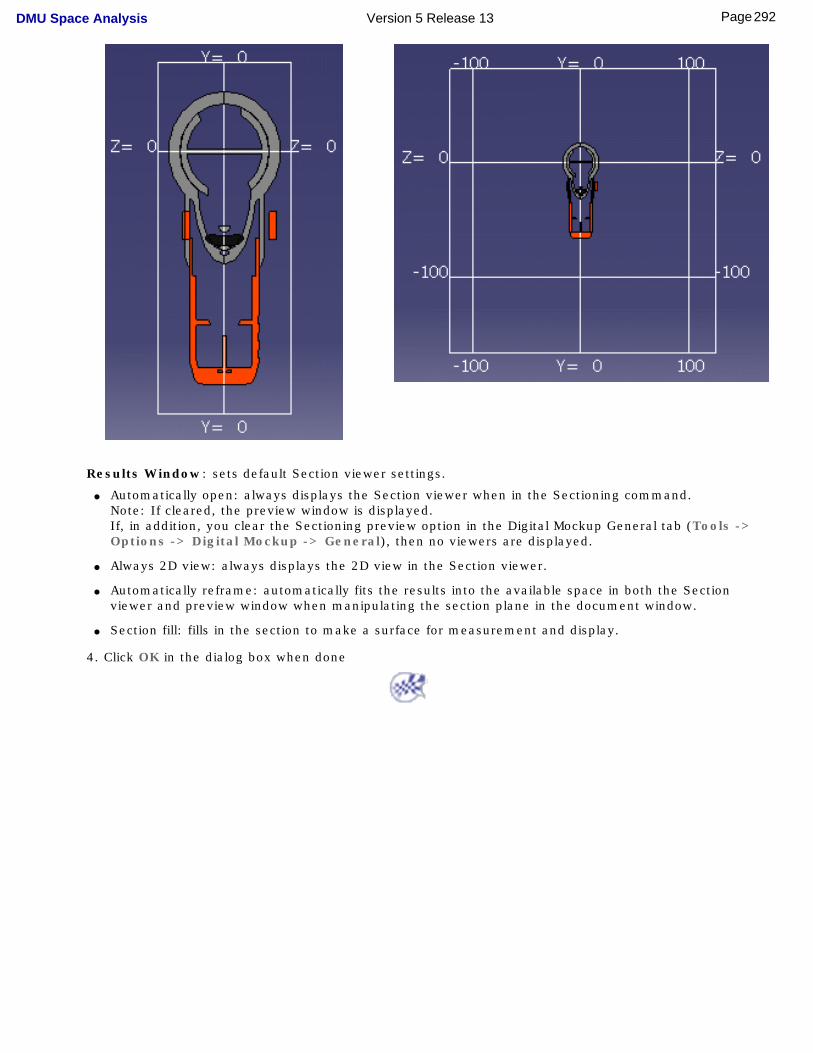
Results Window: sets default Section viewer settings.
● Automatically open: always displays the Section viewer when in the Sectioning command. Note: If cleared, the preview window is displayed. If, in addition, you clear the Sectioning preview option in the Digital Mockup General tab (Tools -> Options -> Digital Mockup -> General), then no viewers are displayed.
● Always 2D view: always displays the 2D view in the Section viewer.
● Automatically reframe: automatically fits the results into the available space in both the Section viewer and preview window when manipulating the section plane in the document window.
● Section fill: fills in the section to make a surface for measurement and display.
4. Click OK in the dialog box when done
292Page DMU Space Analysis Version 5 Release 13
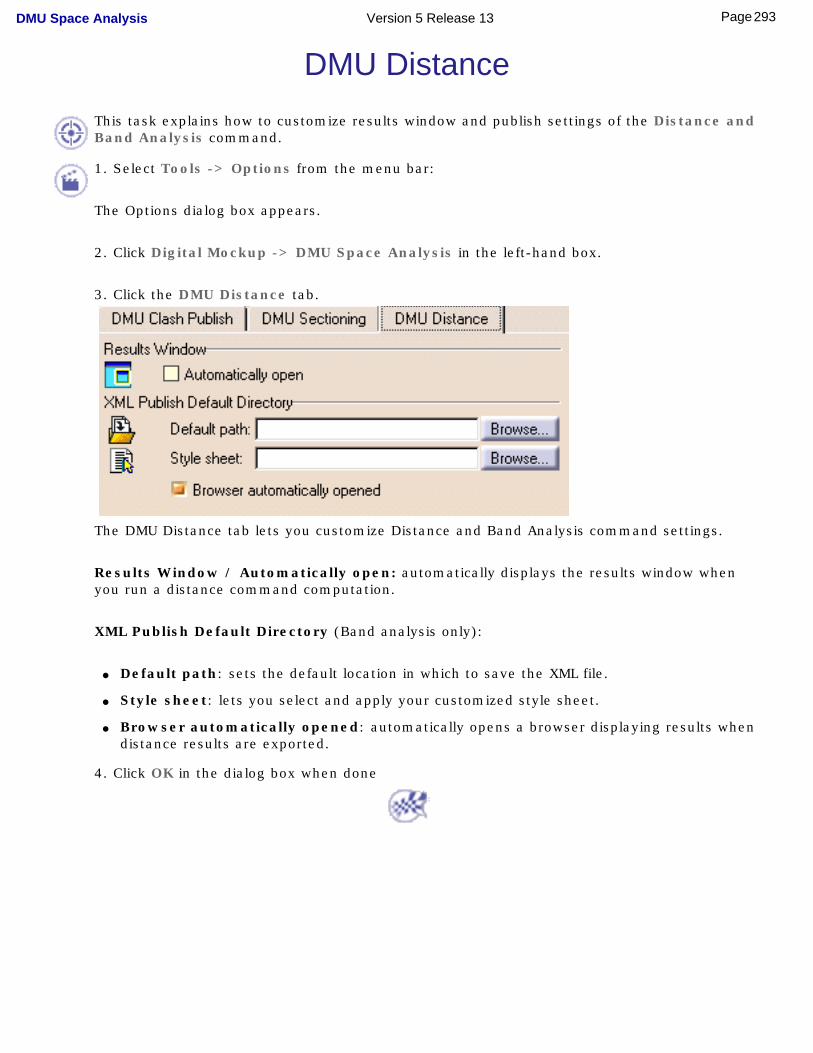
DMU Distance
This task explains how to customize results window and publish settings of the Distance and Band Analysis command.
1. Select Tools -> Options from the menu bar:
The Options dialog box appears.
2. Click Digital Mockup -> DMU Space Analysis in the left-hand box.
3. Click the DMU Distance tab.
The DMU Distance tab lets you customize Distance and Band Analysis command settings.
Results Window / Automatically open: automatically displays the results window when you run a distance command computation.
XML Publish Default Directory (Band analysis only):
● Default path: sets the default location in which to save the XML file.
● Style sheet: lets you select and apply your customized style sheet.
● Browser automatically opened: automatically opens a browser displaying results when distance results are exported.
4. Click OK in the dialog box when done
293Page DMU Space Analysis Version 5 Release 13
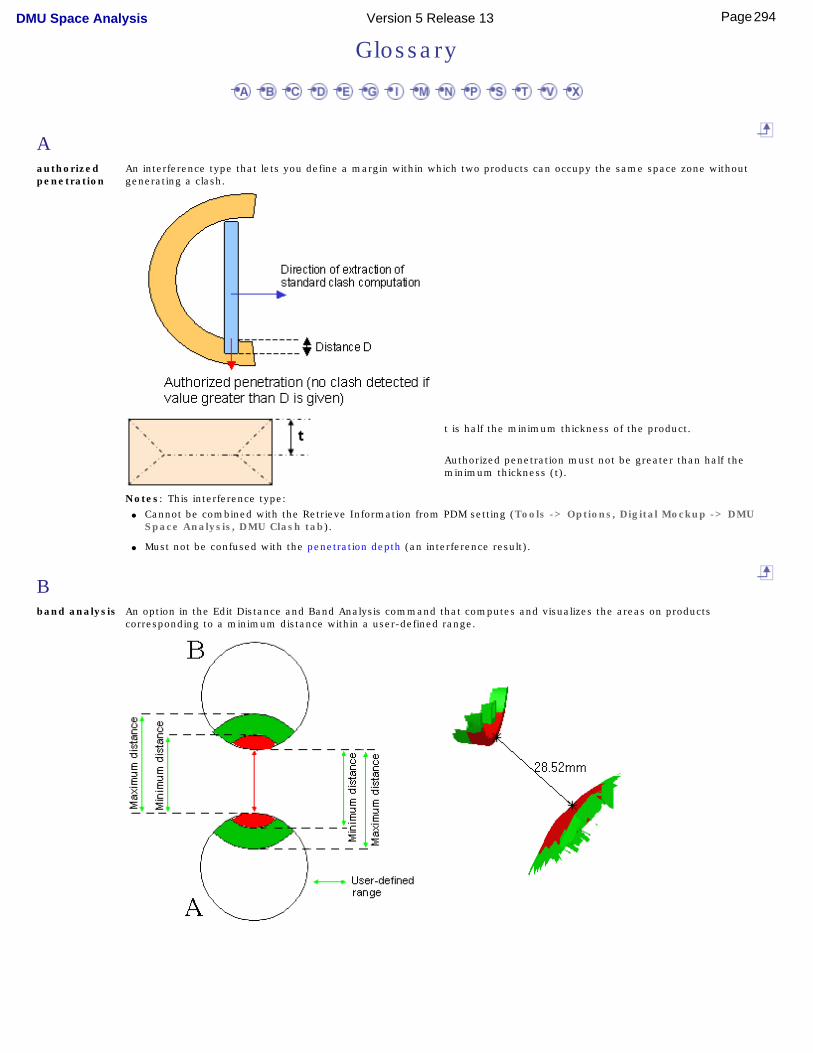
Glossary
Aauthorized penetration
An interference type that lets you define a margin within which two products can occupy the same space zone without generating a clash.
t is half the minimum thickness of the product.
Authorized penetration must not be greater than half the minimum thickness (t).
Notes: This interference type:● Cannot be combined with the Retrieve Information from PDM setting (Tools -> Options, Digital Mockup -> DMU
Space Analysis, DMU Clash tab).
● Must not be confused with the penetration depth (an interference result).
Bband analysis An option in the Edit Distance and Band Analysis command that computes and visualizes the areas on products
corresponding to a minimum distance within a user-defined range.
294Page DMU Space Analysis Version 5 Release 13
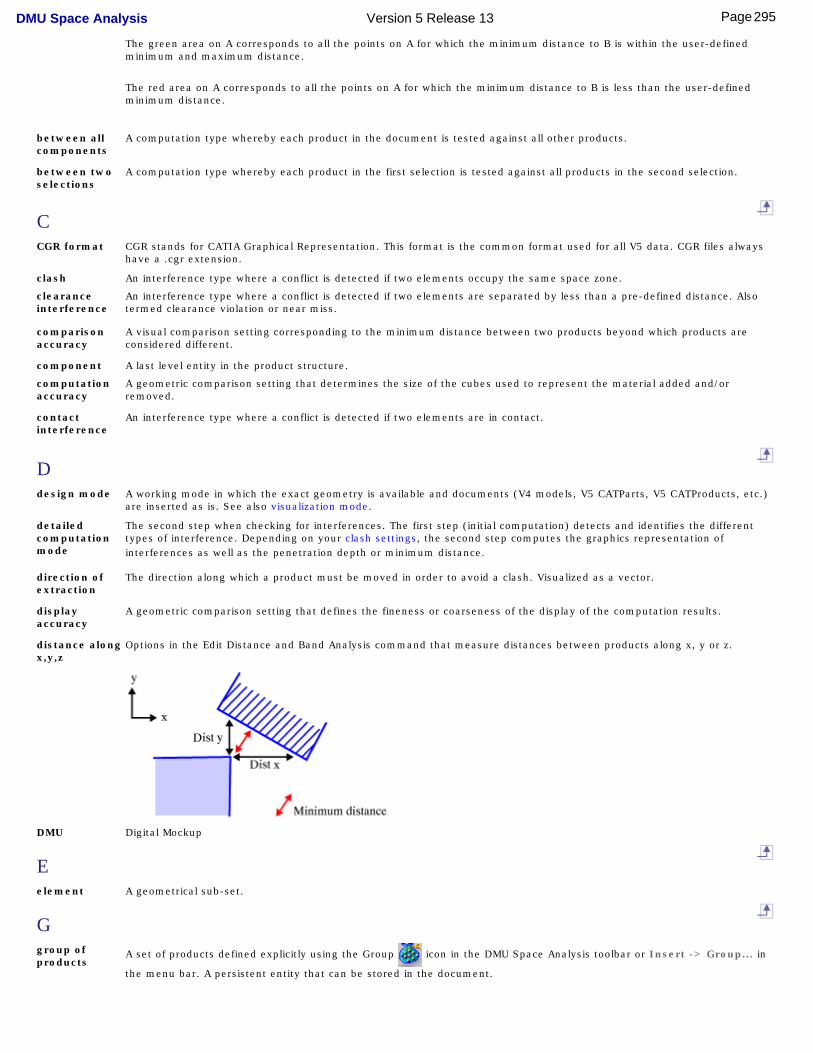
The green area on A corresponds to all the points on A for which the minimum distance to B is within the user-defined minimum and maximum distance.
The red area on A corresponds to all the points on A for which the minimum distance to B is less than the user-defined minimum distance.
between all components
A computation type whereby each product in the document is tested against all other products.
between two selections
A computation type whereby each product in the first selection is tested against all products in the second selection.
CCGR format CGR stands for CATIA Graphical Representation. This format is the common format used for all V5 data. CGR files always
have a .cgr extension.
clash An interference type where a conflict is detected if two elements occupy the same space zone.
clearance interference
An interference type where a conflict is detected if two elements are separated by less than a pre-defined distance. Also termed clearance violation or near miss.
comparison accuracy
A visual comparison setting corresponding to the minimum distance between two products beyond which products are considered different.
component A last level entity in the product structure.
computation accuracy
A geometric comparison setting that determines the size of the cubes used to represent the material added and/or removed.
contact interference
An interference type where a conflict is detected if two elements are in contact.
Ddesign mode A working mode in which the exact geometry is available and documents (V4 models, V5 CATParts, V5 CATProducts, etc.)
are inserted as is. See also visualization mode.
detailed computation mode
The second step when checking for interferences. The first step (initial computation) detects and identifies the different types of interference. Depending on your clash settings, the second step computes the graphics representation of interferences as well as the penetration depth or minimum distance.
direction of extraction
The direction along which a product must be moved in order to avoid a clash. Visualized as a vector.
display accuracy
A geometric comparison setting that defines the fineness or coarseness of the display of the computation results.
distance along x,y,z
Options in the Edit Distance and Band Analysis command that measure distances between products along x, y or z.
DMU Digital Mockup
Eelement A geometrical sub-set.
Ggroup of products
A set of products defined explicitly using the Group icon in the DMU Space Analysis toolbar or Insert -> Group... in
the menu bar. A persistent entity that can be stored in the document.
295Page DMU Space Analysis Version 5 Release 13
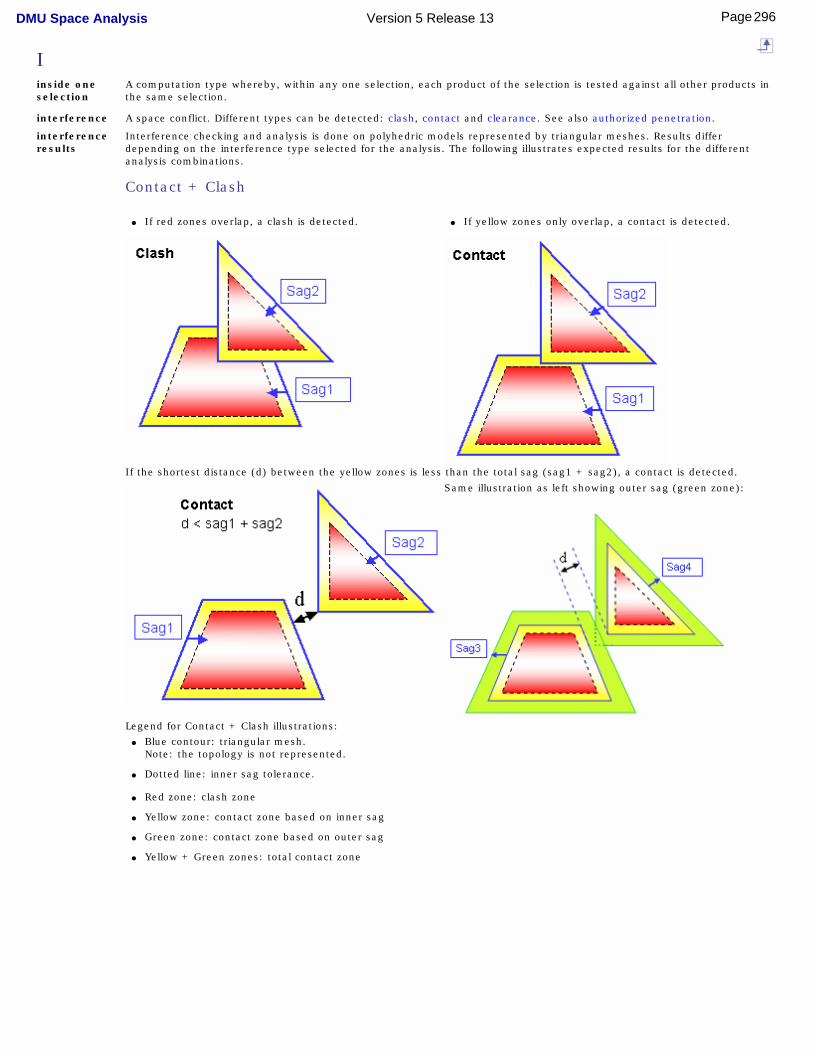
Iinside one selection
A computation type whereby, within any one selection, each product of the selection is tested against all other products in the same selection.
interference A space conflict. Different types can be detected: clash, contact and clearance. See also authorized penetration.
interference results
Interference checking and analysis is done on polyhedric models represented by triangular meshes. Results differ depending on the interference type selected for the analysis. The following illustrates expected results for the different analysis combinations.
Contact + Clash
● If red zones overlap, a clash is detected. ● If yellow zones only overlap, a contact is detected.
If the shortest distance (d) between the yellow zones is less than the total sag (sag1 + sag2), a contact is detected.
Same illustration as left showing outer sag (green zone):
Legend for Contact + Clash illustrations:● Blue contour: triangular mesh.
Note: the topology is not represented.
● Dotted line: inner sag tolerance.
● Red zone: clash zone
● Yellow zone: contact zone based on inner sag
● Green zone: contact zone based on outer sag
● Yellow + Green zones: total contact zone
296Page DMU Space Analysis Version 5 Release 13
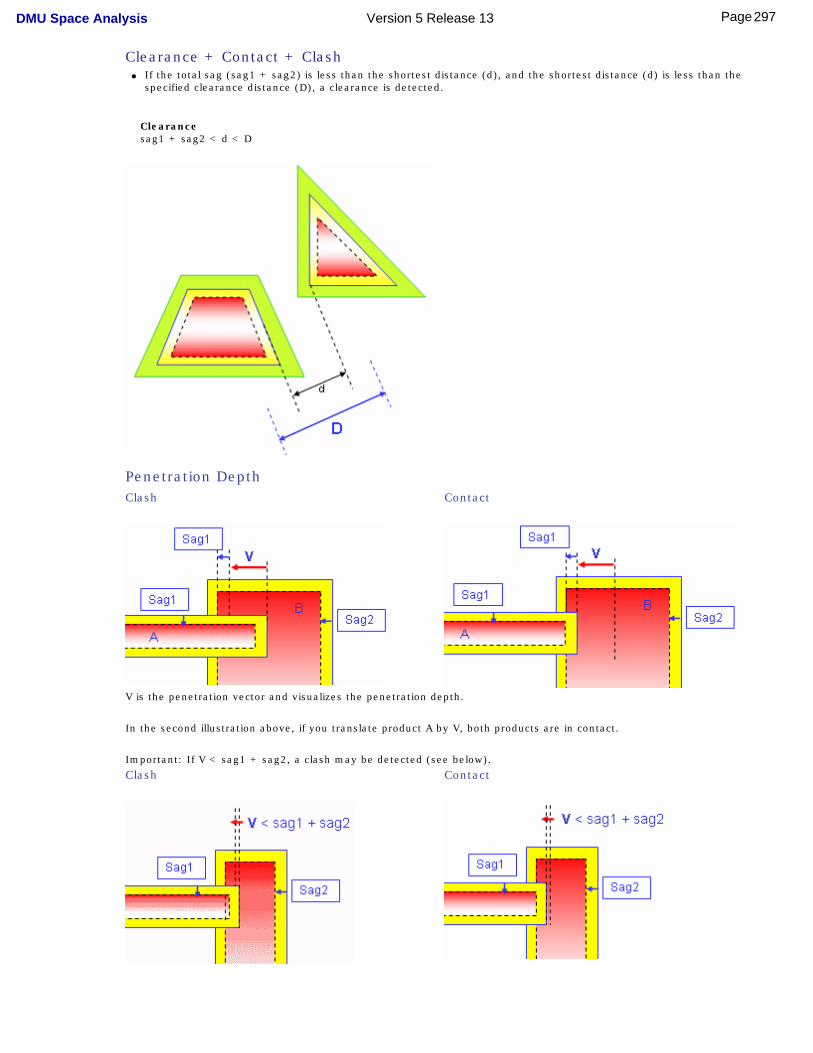
Clearance + Contact + Clash● If the total sag (sag1 + sag2) is less than the shortest distance (d), and the shortest distance (d) is less than the
specified clearance distance (D), a clearance is detected.
Clearancesag1 + sag2 < d < D
Penetration DepthClash Contact
V is the penetration vector and visualizes the penetration depth.
In the second illustration above, if you translate product A by V, both products are in contact.
Important: If V < sag1 + sag2, a clash may be detected (see below).
Clash Contact
297Page DMU Space Analysis Version 5 Release 13
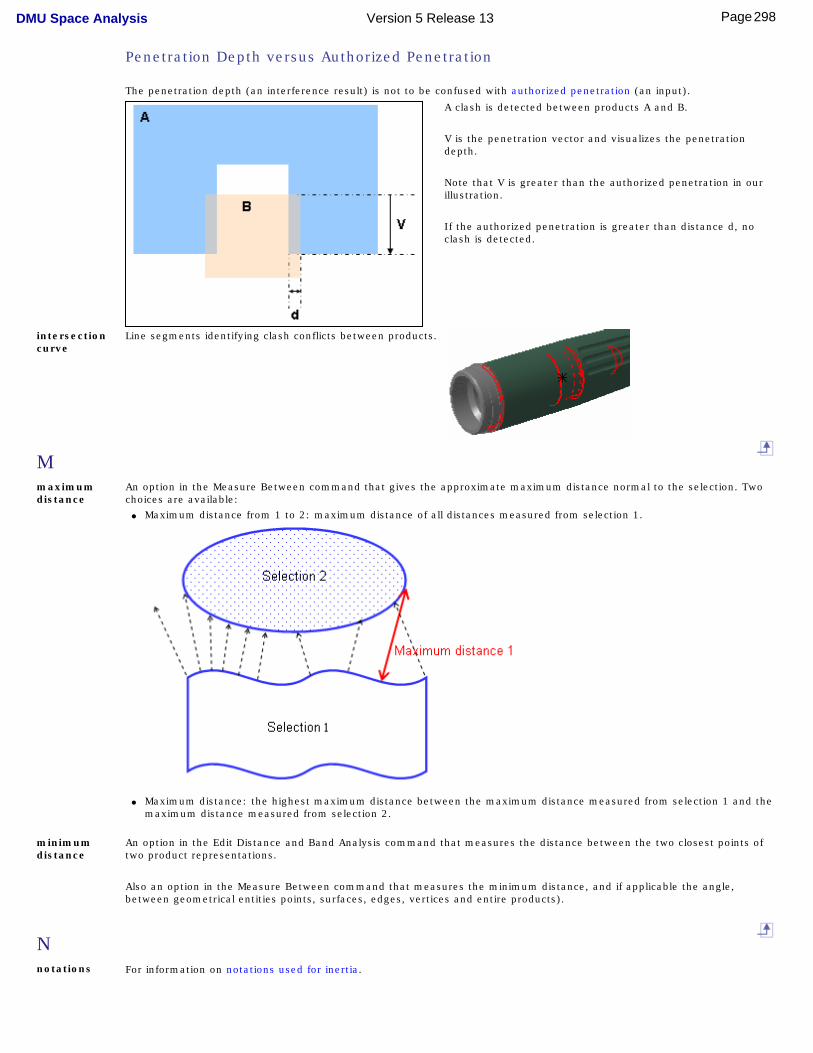
Penetration Depth versus Authorized Penetration
The penetration depth (an interference result) is not to be confused with authorized penetration (an input).
A clash is detected between products A and B.
V is the penetration vector and visualizes the penetration depth.
Note that V is greater than the authorized penetration in our illustration.
If the authorized penetration is greater than distance d, no clash is detected.
intersection curve
Line segments identifying clash conflicts between products.
Mmaximum distance
An option in the Measure Between command that gives the approximate maximum distance normal to the selection. Two choices are available:
● Maximum distance from 1 to 2: maximum distance of all distances measured from selection 1.
● Maximum distance: the highest maximum distance between the maximum distance measured from selection 1 and the maximum distance measured from selection 2.
minimum distance
An option in the Edit Distance and Band Analysis command that measures the distance between the two closest points of two product representations.
Also an option in the Measure Between command that measures the minimum distance, and if applicable the angle, between geometrical entities points, surfaces, edges, vertices and entire products).
Nnotations For information on notations used for inertia.
298Page DMU Space Analysis Version 5 Release 13
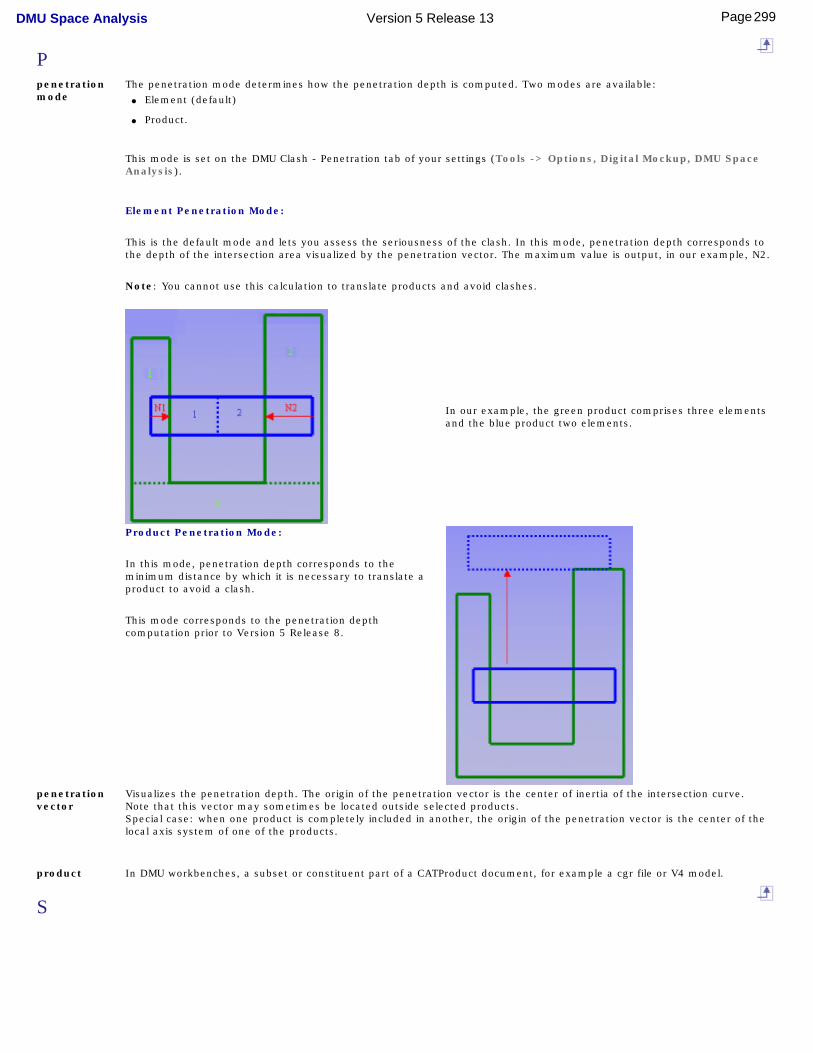
Ppenetration mode
The penetration mode determines how the penetration depth is computed. Two modes are available: ● Element (default)
● Product.
This mode is set on the DMU Clash - Penetration tab of your settings (Tools -> Options, Digital Mockup, DMU Space Analysis).
Element Penetration Mode:
This is the default mode and lets you assess the seriousness of the clash. In this mode, penetration depth corresponds to the depth of the intersection area visualized by the penetration vector. The maximum value is output, in our example, N2.
Note: You cannot use this calculation to translate products and avoid clashes.
In our example, the green product comprises three elements and the blue product two elements.
Product Penetration Mode:
In this mode, penetration depth corresponds to the minimum distance by which it is necessary to translate a product to avoid a clash.
This mode corresponds to the penetration depth computation prior to Version 5 Release 8.
penetration vector
Visualizes the penetration depth. The origin of the penetration vector is the center of inertia of the intersection curve.Note that this vector may sometimes be located outside selected products.Special case: when one product is completely included in another, the origin of the penetration vector is the center of the local axis system of one of the products.
product In DMU workbenches, a subset or constituent part of a CATProduct document, for example a cgr file or V4 model.
S
299Page DMU Space Analysis Version 5 Release 13
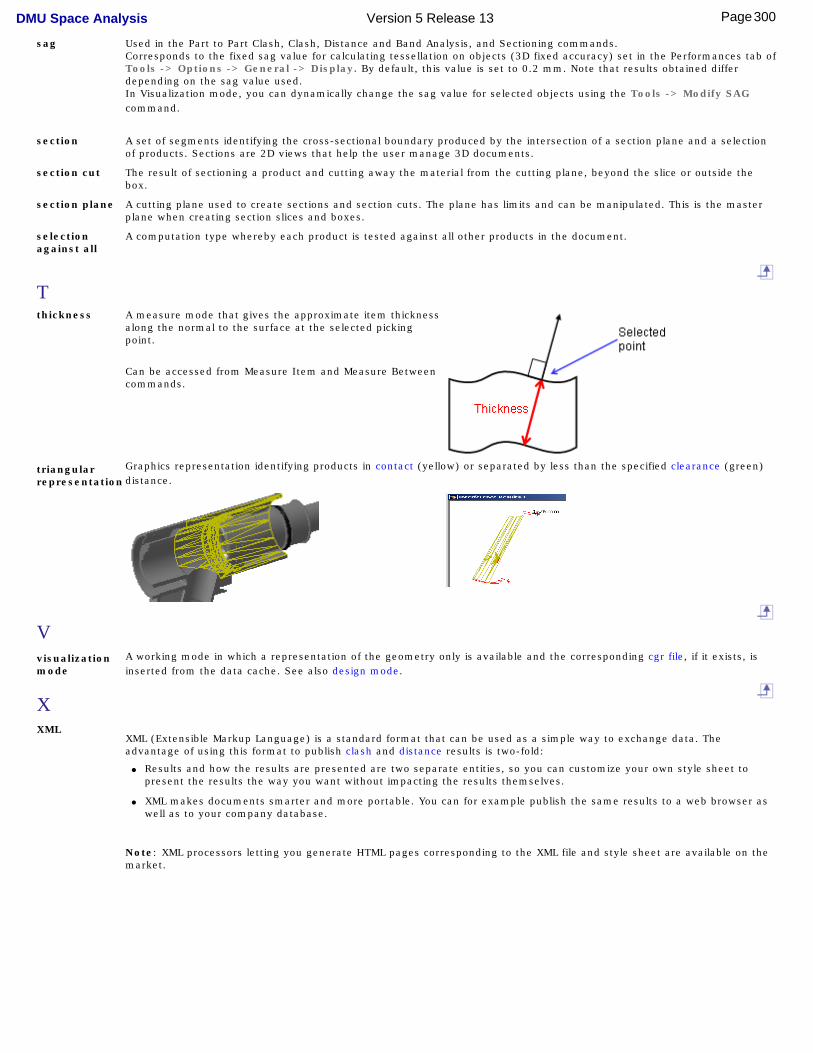
sag Used in the Part to Part Clash, Clash, Distance and Band Analysis, and Sectioning commands. Corresponds to the fixed sag value for calculating tessellation on objects (3D fixed accuracy) set in the Performances tab of Tools -> Options -> General -> Display. By default, this value is set to 0.2 mm. Note that results obtained differ depending on the sag value used.In Visualization mode, you can dynamically change the sag value for selected objects using the Tools -> Modify SAG command.
section A set of segments identifying the cross-sectional boundary produced by the intersection of a section plane and a selection of products. Sections are 2D views that help the user manage 3D documents.
section cut The result of sectioning a product and cutting away the material from the cutting plane, beyond the slice or outside the box.
section plane A cutting plane used to create sections and section cuts. The plane has limits and can be manipulated. This is the master plane when creating section slices and boxes.
selection against all
A computation type whereby each product is tested against all other products in the document.
Tthickness A measure mode that gives the approximate item thickness
along the normal to the surface at the selected picking point.
Can be accessed from Measure Item and Measure Between commands.
triangular representation
Graphics representation identifying products in contact (yellow) or separated by less than the specified clearance (green) distance.
Vvisualization mode
A working mode in which a representation of the geometry only is available and the corresponding cgr file, if it exists, is inserted from the data cache. See also design mode.
XXML
XML (Extensible Markup Language) is a standard format that can be used as a simple way to exchange data. The advantage of using this format to publish clash and distance results is two-fold:
● Results and how the results are presented are two separate entities, so you can customize your own style sheet to present the results the way you want without impacting the results themselves.
● XML makes documents smarter and more portable. You can for example publish the same results to a web browser as well as to your company database.
Note: XML processors letting you generate HTML pages corresponding to the XML file and style sheet are available on the market.
300Page DMU Space Analysis Version 5 Release 13
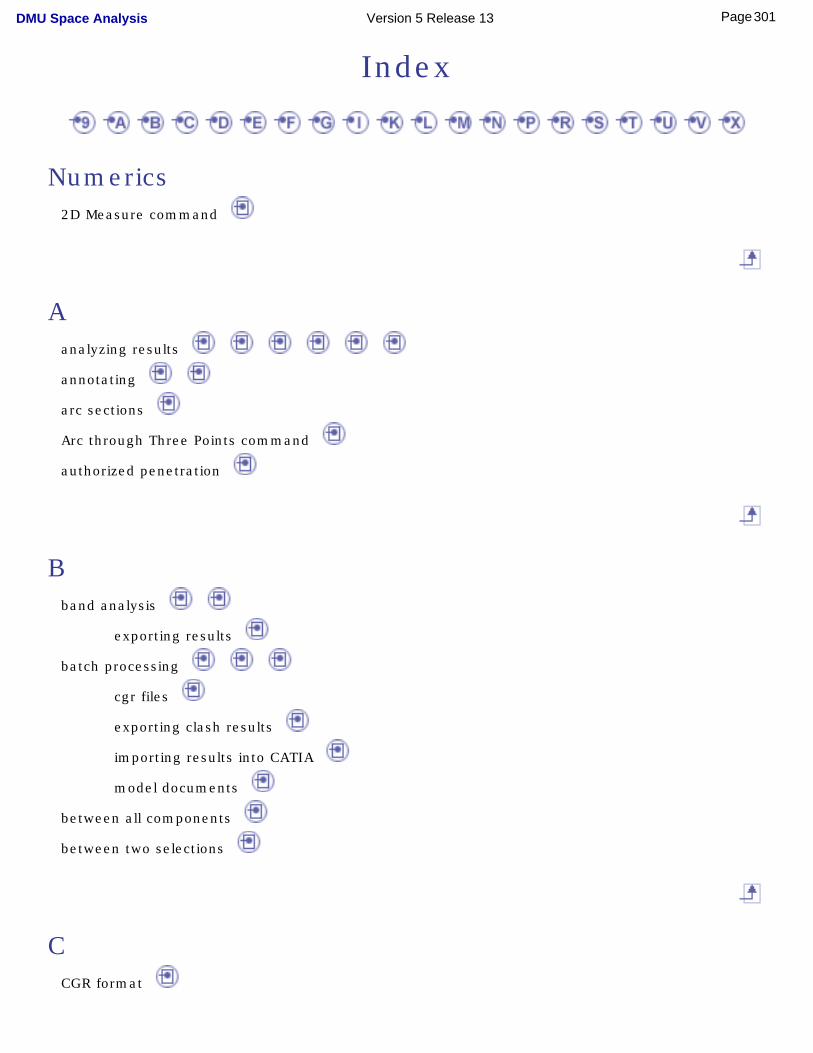
Index
Numerics2D Measure command
Aanalyzing results
annotating
arc sections
Arc through Three Points command
authorized penetration
Bband analysis
exporting results
batch processing
cgr files
exporting clash results
importing results into CATIA
model documents
between all components
between two selections
CCGR format
301Page DMU Space Analysis Version 5 Release 13
changing position
section plane(s)
clash
interference(s)
knowledgeware rule-based clash
preview window
Clash command
clearance
interference(s) color coding
clash
clearance
contact
interference(s) command
2D Measure
Arc through Three Points
Clash
Clash Detection
Compare Products
Distance and Band Analysis
Edit Grid
Edit Position and Dimensions
Export As
Flip Horizontal
Flip Vertical
Geometrical Target
Grid
Invert Normal
Measure Between
Measure Inertia
Measure Item
302Page DMU Space Analysis Version 5 Release 13
Part to Part Clash
Positioning by 2 or 3 Selections
Publish
Reset Position
Results Window
Rotate Left
Rotate Right
Section Box
Section Fill
Section Slice
Sectioning
Volume Cut
Compare Products command comparing
analyzing results
comparing products
macro to batch process
results window
sectioning comparing results
interference(s)
comparison accuracy
component
computation accuracy
contact
interference(s) contextual menu
sectioning
creating
section box(es)
section cut(s)
section slice(s)
303Page DMU Space Analysis Version 5 Release 13
Ddefining
authorized penetration
band analysis
between all components
between two selections
clash
clearance
comparison accuracy
component
computation accuracy
contact
design mode
detailed computation mode
direction of extraction
display accuracy
distance along x,y,z
distance within a user-defined range
DMU
element
group of products
inside one selection
interference(s)
intersection curve
minimum distance
penetration mode
product
sag
section
section cut(s)
304Page DMU Space Analysis Version 5 Release 13
section plane(s)
selection against all
triangular representation
visualization mode
xml
design mode
detailed computation mode
analyzing results
interference(s)
detecting
collisions between 2D sections
direction of extraction
display accuracy
distance
preview window
distance (maximum) between surfaces and volumes
distance (minimum) and angle between geometrical entities and points
distance along x,y,z
Distance and Band Analysis command
distance between products
distance within a user-defined range distance, angle and radius on 2D documents
measuring distances
measuring
DMU
DMU Space Analysis toolbar
EEdit Grid command
305Page DMU Space Analysis Version 5 Release 13
Edit Position and Dimensions command
element
ENOVIA LCA interoperability
ENOVIA VPM interoperability existing CATProduct
batch processing
importing results
Export As command
exporting clash results
exporting results
clash in XML format
FFlip Horizontal command
Flip Vertical command
freezing section results
Ggeometric comparison
comparing products
Geometrical Target command
Grid command
group of products
Iimporting clash results
importing clash results from VPM initial computation mode
306Page DMU Space Analysis Version 5 Release 13
analyzing results
interference(s)
inside one selection
interference types
interference(s)
analyzing results
authorized penetration
batch processing
detecting
ENOVIA LCA interoperability
ENOVIA VPM interoperability
exporting results
publishing clash results
retrieving information
standalone mode interoperability
interference analysis
saving data in ENOVIA LCA
intersection curve
Invert Normal command
Kknowledgeware
rule-based clash
space analysis functions
Llength, radius and angle of 3-point arc
measuring
307Page DMU Space Analysis Version 5 Release 13
Mmanipulating
maximum distance
Measure Between command
Measure Inertia command
Measure Item command
measuring
arc sections
distance along x,y,z
distance between products
distance within a user-defined range
maximum distance
minimum distance
minimum distance
properties
section viewer minimum distance and angle
measuring
moving
Nnotations
Ppart to part clash
analyzing results
detecting
308Page DMU Space Analysis Version 5 Release 13
penetration mode positioning
section boxes
section planes
section planes along a curve or edge
section planes on geometrical target
section planes using the Edit Position and Dimensions command
Positioning by 2 or 3 Selections command
preview window
product
properties
Publish command
publishing clash results
Rreading results
interference(s)
re-dimensioning
Reset Position command
results window
distance
interference(s)
Results Window command
Rotate Left command
Rotate Right command
rotating running
band analysis
309Page DMU Space Analysis Version 5 Release 13
Ssag
saving clash results
section
exporting results
measuring minimum distance
Section Box command
section box(es)
snapping
section cut(s)
section plane(s)
along a curve or edge
creating
manipulating
moving
on geometrical target
re-dimensioning
rotating
snapping
using the Edit Position and Dimensions command
Section Slice command
section slice(s)
sectioning
about
automatically updating results
collision detection
creating section planes
freezing results
in interference and distance viewers
manually updating results
results window
310Page DMU Space Analysis Version 5 Release 13
Sectioning command
selection against all
Tthickness
measuring
triangular representation
Uusing local axis systems
comparing products
Vviewer
band analysis
distance
interference
sectioning visual comparison
sectioning
visualization filters
visualization mode
Volume Cut command
Xxml
311Page DMU Space Analysis Version 5 Release 13

export clash results
312Page DMU Space Analysis Version 5 Release 13