dna damage induces a secretory program in the quiescent...
TRANSCRIPT

1
DNA Damage Induces a Secretory Program in the Quiescent
TME that Fosters Adverse Cancer Phenotypes
Luis Gomez-Sarosi*1, Yu Sun*2, Ilsa Coleman1, Daniella Bianchi-Frias1, and
Peter S. Nelson1,3
1Division of Human Biology Fred Hutchinson Cancer Research Center, Seattle, WA 98109 2Shanghai Institutes for Biology Sciences Chinese Academy of Sciences, Shanghai, China 3Division of Clinical Research Fred Hutchinson Cancer Research Center, Seattle, WA, 98109 Running Title: A DNA Damage Secretory Program in Quiescent Cells Keywords: prostate, quiescence, DNA damage, senescence, microenvironment, fibro-blasts * These authors contributed equally to this study. Correspondence to: Peter S. Nelson Division of Human Biology Fred Hutchinson Cancer Research Center Mailstop D4-100 1100 Fairview Ave N Seattle, WA 98109-1024 Email: [email protected] Telephone: (206) 667-3377 Fax: (206) 667-2917
on May 13, 2019. © 2017 American Association for Cancer Research. mcr.aacrjournals.org Downloaded from
Author manuscripts have been peer reviewed and accepted for publication but have not yet been edited. Author Manuscript Published OnlineFirst on March 29, 2017; DOI: 10.1158/1541-7786.MCR-16-0387

2
ABSTRACT Carcinomas develop in complex environments that include a diverse spectrum of cell types that 1
influence tumor cell behavior. These microenvironments represent dynamic systems that con-2
tribute to pathological processes. Damage to DNA is a notable inducer of both transient and 3
permanent alterations in cellular phenotypes. Induction of a DNA-damage secretory program is 4
known to promote adverse tumor cell behaviors such as proliferation, invasion, metastasis, and 5
treatment resistance. However, prior studies designed to identify genotoxic stress-induced fac-6
tors evaluated actively proliferating in vitro cultures of cells such as fibroblasts as experimental 7
models. Conversely, the vast majority of benign cells in a typical tumor microenvironment (TME) 8
are not proliferating, but rather exist in quiescent (i.e., G0) or in terminally-differentiated states. 9
In this study, the diversity and magnitude of transcriptional responses to genotoxic damage in 10
quiescent prostate fibroblasts were assessed using gene expression profiling. The secretory 11
damage response in quiescent cells was highly concordant with that of actively dividing cells. 12
Quiescent human prostate stroma exposed to genotoxic agents (e.g., mitoxantrone) in vivo re-13
sulted in significant upregulation (2.7-5.7 fold; (p≤0.01) of growth factors and cytokines includ-14
ing: IL-1ß, MMP3, IL-6, and IL-8. The paracrine effects of damaged quiescent cells consistently 15
increased the proliferation and invasion of prostate cancer cells and promoted cell survival and 16
resistance to apoptosis following exposure to chemotherapy. 17
18
IMPLICATIONS 19
Benign quiescent cells in the TME respond to genotoxic stress by inducing a secretory program 20
capable of promoting therapy resistance. Developing approaches to suppress the secretory 21
program may improve treatment responses. 22
on May 13, 2019. © 2017 American Association for Cancer Research. mcr.aacrjournals.org Downloaded from
Author manuscripts have been peer reviewed and accepted for publication but have not yet been edited. Author Manuscript Published OnlineFirst on March 29, 2017; DOI: 10.1158/1541-7786.MCR-16-0387
3
INTRODUCTION
Malignant neoplasms arise in complex biophysical environments comprised of a diverse 23
spectrum of cell types, structural components, and biochemical constituents that have profound 24
influences on tumor cell behavior (1-3). Of importance, organ and tissue microenvironments 25
represent dynamic systems with shifts in the numbers and types of benign resident cells – such 26
as fibroblasts and endothelium, and immigrating cells – including those of immune lineage, in 27
the context of normal development and pathological processes (4, 5). The phenotypes of these 28
cells also vary depending on responses to extrinsic factors such as paracrine signaling from 29
other juxtaposed cell types, concentrations of hormones and systemic growth factors, patho-30
gens, nutrients, oxygen, pH and a spectrum of other influences that can either reversibly or irre-31
versibly alter cellular functions (6). 32
Damage to DNA is a notable inducer of both transient and permanent alterations in cellular 33
phenotype. Genotoxic stress can result from a variety of events that include exposure to free 34
radicals, telomere shortening, oncogenes, errors in DNA replication, and treatment with cancer 35
therapeutics. Cell cycle arrest is a well-described consequence of DNA damage, with subse-36
quent proliferation if damage is repaired, or if severe, irreversible growth arrest manifest as se-37
nescence or programmed cell death (7-9). DNA-damage response (DDR) programs provide 38
mechanisms to avoid propagating oncogenic mutations, and also activate a secretory program 39
that comprises a diverse spectrum of proteases, growth factors, and cytokines, collectively and 40
somewhat synonymously termed a senescence associated secretory phenotype (SASP), se-41
nescence messaging secretome, acute stress-associated secretome, and DNA damage secre-42
tory program (DDSP)(10-13). The composite effects of these programs have been shown to 43
contribute to wound healing, aging phenotypes, altered immune responses, and are also capa-44
ble of promoting adverse tumor cell behaviors such as proliferation, invasion, metastasis, and 45
treatment resistance (13-17). 46
on May 13, 2019. © 2017 American Association for Cancer Research. mcr.aacrjournals.org Downloaded from
Author manuscripts have been peer reviewed and accepted for publication but have not yet been edited. Author Manuscript Published OnlineFirst on March 29, 2017; DOI: 10.1158/1541-7786.MCR-16-0387

4
Large scale discovery-driven efforts designed to define the spectrum of secreted proteins 47
induced by genotoxic damage have identified several hundred growth factors, cytokines, en-48
zymes, and matricellular proteins that are altered in benign cells following genotoxic stress or in 49
the context of cellular senescence (13, 18, 19). However, to date the majority of these profiling 50
studies have used actively proliferating in vitro cultures of cells such as fibroblasts as experi-51
mental models (18-20). Conversely, the vast majority of benign cells in a typical tumor microen-52
vironment, including fibroblasts, endothelium, smooth muscle and inflammatory cells, are not 53
proliferating, but rather exist in quiescent, G0, or terminally-differentiated states. As the cell cycle 54
phase has been shown to influence cellular responses to genotoxic exposures and other 55
stresses (21, 22), it is unclear to what extent damage to proliferating cells reflects that of non-56
dividing cells in tissue microenvironments. In this study we sought to assess the diversity and 57
magnitude of transcriptional responses to genotoxic damage in quiescent fibroblasts, compare 58
the secretory damage response to that of actively dividing cells, and determine if the paracrine-59
acting factors derived from quiescent cells promote adverse cancer cell phenotypes such as 60
proliferation, invasion, and resistance to cancer treatment-induced cell death. 61
62
MATERIALS AND METHODS 63
Biospecimens, cell lines and culture conditions. Tissue samples were obtained under IRB-64
approved biospecimen collection and handling protocols. The primary human prostate fibroblast 65
cell line, designated PSC27, was a gift from Dr. Beatrice Knudsen. PSC27 cells were cultured in 66
prostate stromal cell (PSC) complete medium as described previously (23). The human prostat-67
ic epithelial cell line BPH1 was a gift from Dr. Simon Hayward and was derived from nonmalig-68
nant prostatic tissue with benign hyperplasia, immortalized by SV40-LT antigen, and cultured as 69
previously described (24). The HeLa, PC3, VCaP, LNCaP and DU145 cell lines were obtained 70
from ATCC and routinely sub-cultured as per ATCC recommendations. Cells were either used 71
on May 13, 2019. © 2017 American Association for Cancer Research. mcr.aacrjournals.org Downloaded from
Author manuscripts have been peer reviewed and accepted for publication but have not yet been edited. Author Manuscript Published OnlineFirst on March 29, 2017; DOI: 10.1158/1541-7786.MCR-16-0387

5
within 4 passages after receipt from ATCC or authenticated prior to initiating the studies by gen-72
otyping at DNA Diagnostics (Fairfield, OH). 73
74
Immunohistochemistry. Prostate tissue staining for Ki-67/MIB-1 has been described previous-75
ly (25). The monoclonal antibody, MIB-1 (clone MIB-1, DAKO) was used to determine the pro-76
portion of cancer epithelial, cancer-associated stromal and benign-associated stromal cells 77
staining positive for Ki-67. Prostate cancer tissue microarray slides were scanned on Aperio 78
ScanScope AT (Aperio Technologies, Vista, CA, USA). High-resolution 20X digital images were 79
created for the cancer and benign cores of twenty randomly selected cases. Positive Ki-67-80
stained cells and the total number of cells in 20X fields were counted using ImageJ2 Cell Coun-81
ter plug-in (ImageJ, U. S. National Institutes of Health, Bethesda, Maryland, USA). Any nuclear 82
staining, regardless of intensity, was considered positive for Ki-67/MIB-1. For the stromal com-83
partment, only spindle-like cells were included in the analysis, while round small nuclei cells 84
were not considered for immunohistochemical evaluation, thus avoiding the inclusion of inflam-85
matory cell in the analysis. The number of Ki-67 positive cells was expressed as a percentage 86
of immunoreactive stromal (or epithelial) cells to the total counted stromal cells (or epithelial) in 87
a 20X field. 88
89
Laser Microdissection. Frozen sections (7 µM) from were cut from OCT embedded snap-90
frozen radical prostatectomy specimens into PAP-membrane slides. Approximately 1000 cells 91
were separately microdissected for prostate cancer epithelium (CPE), benign prostate epitheli-92
um (BPE) and stroma adjacent to cancer (CAS). The corresponding benign cells for each case 93
were microdissected from separate blocks identified as containing no adenocarcinoma cells 94
(first choice) or, from non-neoplastic tissues at a distance >1mm from the cancer. Digital photos 95
were taken of tissue sections before, during, and after LCM and assessed to confirm the cell 96
type-specificity of the captured cells. 97
on May 13, 2019. © 2017 American Association for Cancer Research. mcr.aacrjournals.org Downloaded from
Author manuscripts have been peer reviewed and accepted for publication but have not yet been edited. Author Manuscript Published OnlineFirst on March 29, 2017; DOI: 10.1158/1541-7786.MCR-16-0387
6
98
Growth arrest conditions and cell treatments. PSC27 fibroblasts were plated at a density of 99
2 × 10⁴ cells per cm2 in PSC medium and allowed to attach to the tissue culture dishes. To in-100
duce quiescence by growth factor starvation, the medium was changed to DMEM with 0.1% se-101
rum and cultured for 4 days before analysis. These cells were designed PSC27-QSS. To arrest 102
cells by contact inhibition, cells were plated at a density of 2 × 10⁴ cells per cm2 in stromal me-103
dium and allowed to grow to confluence, usually reaching complete confluency in 7~10 days. 104
These cells were designed PSC27-QCI. Proliferating or quiescent cells were treated with 1 µM 105
mitoxantrone in PSC medium, or ionizing-radiation by a 137Cs source at 743 rad/min. Media un-106
der each condition was changed every 3 days for 10 days until cells were lysed for analysis. For 107
quiescent cells allowed to resume proliferation, quiescent cells were trypsinized, replated to cell 108
culture vessels of larger growth area or divided into multiple vessels, with the same media ap-109
plied for each subculture. For each condition, three independent replicates were performed. 110
111
Immunofluorescence analysis and quantitation of DNA-damage foci. Cells grown on co-112
verslips were rinsed in PBS, subjected to fixation in 4% paraformaldehyde and permeabilized 113
with 0.1% Triton-X100 prior to immunostaining. Primary mouse monoclonal anti-phospho-114
Histone H2A.X (Ser139) (clone JBW301) and secondary antibody Alexa Fluor® 488 (or 594)-115
conjugated F(ab')2 goat anti-mouse IgG were sequentially applied. Nuclei were counterstained 116
with 2 μg/ml of 4',6-diamidino-2-phenylindole (DAPI) and coverslips were mounted onto glass 117
slides. H2A.X foci were manually counted and recorded with a 4-category counting strategy: 0 118
foci, 1-3 foci, 4-10 foci, and >10 foci. Data from each cell line/treatment were averaged from a 119
pool of 3 independent fields counting 100 nuclei per pool. 120
121
Bromodeoxyuridine incorporation and flow cytometry. Cells were labeled with 100-μM 122
bromodeoxyuridine (BrdU) for 6 h before collection with trypsin; the latter was inactivated with 123
on May 13, 2019. © 2017 American Association for Cancer Research. mcr.aacrjournals.org Downloaded from
Author manuscripts have been peer reviewed and accepted for publication but have not yet been edited. Author Manuscript Published OnlineFirst on March 29, 2017; DOI: 10.1158/1541-7786.MCR-16-0387

7
either serum or 1 mg/ml soybean trypsin inhibitor (Sigma, St. Louis). Cells were then fixed in 124
PBS with 67% cold ethanol. Cell membranes were lysed at 37 °C in 0.08% pepsin for 20 min, 125
and nuclei were treated with 2M HCl for 20 min. Samples were neutralized with 0.1M sodium 126
borate, incubated in a buffer of 10 mM Hepes, (pH7.4), 150 mM NaCl, 4% fetal bovine serum 127
(100 mg/ml), gelatin (0.04%), and EGTA (5M), and 2 μg of anti-BrdU-FITC antibody (BD 128
Pharmingen, San Diego) on ice for 2 h. Mouse IgG1κ was run in parallel as a negative control. 129
For nuclear labeling, cells were incubated with 5 μg/ml Hoescht 33342 (Calbiochem-130
Novabiochem, San Diego) or 100 μg/ml propidium iodide (Sigma). For cells arrested by mitogen 131
withdrawal for 4 days, Hoescht was not applied as it induced cell death. Samples were run on a 132
Beckton Dickinson FACS Vantage SE and the data were analyzed using FACSDiva software 133
(BD Biosciences, Palo Alto). 134
135
Genotoxic treatments and cell proliferation, invasion, and chemoresistance assays. 136
PSC27 cells were grown until 80% confluent, or induced to arrest growth (PSC27-Q) and were 137
treated with 1 µM mitoxantrone in PSC medium, or ionizing-radiation by a 137Cs source at 743 138
rad/min as previously described (13). After treatment, the cells were rinsed 3-times with PBS 139
and left to recover 3 days in PSC medium. Following recovery, cells were designated PSC27-140
MIT or PSC27-Rad. Normally proliferating PSC27 cells receiving sham treatment were desig-141
nated as PSC27-Pro. 142
To generate conditioned medium, PSC27-Pro, PSC27-Rad, PSC27-Q, and PSC27-QRad 143
cells were rinsed three times in PBS and incubated for 3 days in DMEM with 0.5% charcoal-144
stripped FBS. The supernatant was harvested as conditioned media (CM) and stored frozen at 145
−80°C. Epithelial cell lines were seeded at 20,000 cells per well in six-well plates in PSC27 con-146
ditioned medium. Cultures were incubated for 3 days and the cell numbers were indirectly de-147
termined using the CellTiter96®AQueous One Solution Cell Proliferation Assay (MTS, Promega) 148
with signals captured using a 96-well plate reader. For trans-well invasion assays, serum-149
on May 13, 2019. © 2017 American Association for Cancer Research. mcr.aacrjournals.org Downloaded from
Author manuscripts have been peer reviewed and accepted for publication but have not yet been edited. Author Manuscript Published OnlineFirst on March 29, 2017; DOI: 10.1158/1541-7786.MCR-16-0387

8
starved cells in serum-free medium were added to the top chambers of Cultrex 24-well Cell Mi-150
gration Assay plates (8 µm size, Trevigen) coated with basement membrane extract (BM) pre-151
pared as 0.5X of stock solution. CM from PSC27 cells or regular epithelial media containing 10% 152
fetal calf serum (FCS) was added to the bottom chambers. Invading cells in the bottom cham-153
bers were stained and plate absorbance was recorded at 485/520 nm emission. All assays were 154
done in triplicate and the data are presented as the average absorbance of invading cells. 155
For assessing responses to chemotherapy, epithelial cells were cultured with either DMEM, 156
or CM generated from the various PSC27 treatments. Cells received Mitoxantrone (Sigma) 157
treatment for 3 days at concentrations near individual cell line’s IC50 levels. Cell viability was 158
then assayed, and the percentage of viable cells was calculated by normalizing absorbance of 159
each experiment to untreated cells. 160
161
Apoptosis assays. Prostate epithelial cells were plated at a density of 2 × 10⁴ cells per well in 162
6-well culture plates and cultured with CM PSC27 cells. Twelve hours later, IC50 concentrations 163
of mitoxantrone were added to each epithelial line, with distilled water applied in parallel as con-164
trol. To examine acute survival, the cell numbers were determined 12 hours after drug exposure 165
by counting viable cells with a hemocytometer. To quantitate apoptosis, lysates were prepared 166
24 hours post treatment from each group, and caspase levels were measured using the Caspa-167
se-Glo 3/7 assay (Promega). For the morphological analyses, bright field pictures were taken for 168
epithelial cells using inverted phase-contrast microscopy. 169
170
Gene expression analysis by real-time qPCR. Single-stranded cDNA for qPCR analysis was 171
synthesized from 1 µg total RNA using a final concentration of 5 μM random hexamer priming 172
and M-MLV RT according to Ambion’s instructions. qPCR reactions were set up in a total vol-173
ume of 25 μl containing 12.5 μl of 2 × Universal Master Mix, 250 nM of each primer, and 10 ng 174
of total RNA (as hexamer-primed single-stranded cDNA). The mixtures were prepared in 96-well 175
on May 13, 2019. © 2017 American Association for Cancer Research. mcr.aacrjournals.org Downloaded from
Author manuscripts have been peer reviewed and accepted for publication but have not yet been edited. Author Manuscript Published OnlineFirst on March 29, 2017; DOI: 10.1158/1541-7786.MCR-16-0387

9
optical microtiter plates and amplified on the ABI7900HT Sequence Detection System using the 176
following cycling parameters: 2 min at 50 °C, 10 min at 95 °C, and 40 alternate cycles of 15 s at 177
95 °C and 60 s at 60 °C. Each sample cDNA was tested in triplicate. SDS 2.4 software was 178
used for analysis. Human RPL13A primers were used as endogenous control for normalization 179
of signals. 180
181
Gene expression analysis by microarray hybridization. Total RNA from experimental sam-182
ples was isolated using the RNeasy maxi kit (Qiagen), incorporating on-column DNase treat-183
ment using the RNase-Free DNase Set (Qiagen). A reference standard RNA for use in two-184
color oligo arrays was prepared as described previously (13). Total RNA was amplified one 185
round using the Ambion MessageAmp aRNA Kit (Ambion Inc., Austin, TX). Probe labeling and 186
hybridization was performed following the Agilent suggested protocols and fluorescent array im-187
ages were collected using the Agilent DNA microarray scanner G2505C. Agilent Feature Extrac-188
tion software version 10.7.3.1 was used to grid and extract the data using the GE2_105_Jan09 189
protocol with default settings. Data was loess normalized within arrays and quantile normalized 190
between arrays in R using the Limma Bioconductor package. Microarray data are deposited in 191
the Gene Expression Omnibus (GEO) database under the accession number GSE92853. The 192
data was reduced to unique genes using the probe with the highest average signal intensity and 193
filtered to exclude probes with average signal intensity less than 300. The Statistical Analysis of 194
Microarray (SAM) program (2) was used to analyze expression differences between groups us-195
ing unpaired, two-sample t tests and controlled for multiple testing by estimation of q-values us-196
ing the false discovery rate (FDR) method. Genes up and down-regulated with q-value <10%, 197
>= 3-fold were considered significant and used for enrichment analysis. 198
We created a quiescence signature using data generated by Lemons et al (26). Raw Ag-199
ilent gene expression data was downloaded from the GEO data repository accession 200
GSE42612, and normalized as described above, then analyzed by applying a 1-sample t-test 201
on May 13, 2019. © 2017 American Association for Cancer Research. mcr.aacrjournals.org Downloaded from
Author manuscripts have been peer reviewed and accepted for publication but have not yet been edited. Author Manuscript Published OnlineFirst on March 29, 2017; DOI: 10.1158/1541-7786.MCR-16-0387
10
comparing 7d+14d contact inhibited vs. proliferating human neonatal dermal fibroblasts. Figure 202
1f shows the top 20 genes up and down-regulated dermal fibroblast quiescence genes in com-203
parison to quiescent gene expression in prostate fibroblasts. The GSEA analyses (Figure 1g) 204
uses the up-regulated signature, 266 genes up-regulated with q-value <10%, >= 3-fold. Path-205
way analysis of both quiescent datasets was performed using the Gene Ontology pathway an-206
notations and the DAVID Functional Annotation Bioinformatics Microarray Analysis tool 207
(https://david.ncifcrf.gov/). A summary of non-redundant pathways with modified Fisher's exact 208
test (EASE score) < 0.05 are shown. 209
The DNA damage signature used in the GSEA analysis of radiation-treated quiescent 210
cells (Figure 2d) is defined as 204 genes up-regulated with q-value <0.01% >= 3-fold by 2-211
sample t-test comparing control vs. DNA damaging agents from Sun et al (27). 212
213
on May 13, 2019. © 2017 American Association for Cancer Research. mcr.aacrjournals.org Downloaded from
Author manuscripts have been peer reviewed and accepted for publication but have not yet been edited. Author Manuscript Published OnlineFirst on March 29, 2017; DOI: 10.1158/1541-7786.MCR-16-0387

11
RESULTS 214
A gene expression program associated with prostate fibroblast quiescence. 215
Previous studies have demonstrated that benign proliferating mesenchymal cells comprising 216
the prostate stroma sustain DNA damage following exposure to systemic genotoxic cancer 217
therapeutics and respond with a robust DNA damage secretory program (13, 23). To determine 218
whether stromal cells in the prostate microenvironment are proliferative or quiescent in vivo, we 219
used immunohistochemistry to quantitate the percentage of Ki-67 positive cells in the prostate 220
gland in different cell compartments including prostate cancer epithelium (CPE), stroma adja-221
cent to cancer (CAS) and stroma adjacent to benign epithelium (BAS). Overall, proliferation 222
rates were extremely low in all compartments. Compared to the average Ki-67 index of 4% in 223
carcinoma cells (4.0 ± 0.8%; ±SEM), the Ki-67 index the other compartments was significantly 224
lower with only rare positive cells identified: 0.5 ± 0.1% in BAS (p<0.01, Student’s t-test) and 0.6 225
± 0.1% in CAS (p<0.01) (Figure 1a,b). We also calculated a cell cycle progression (CCP) score 226
for cancer epithelium and stroma using a set of 31 genes previously shown to associate with 227
adverse prostate cancer outcomes (28). The mean CCP scores for proliferating PC3 and 228
LNCaP prostate cancer cell lines in vitro in full growth medium were 79 and 76, respectively. 229
The mean CCP score for proliferating PSC27 fibroblasts in full growth medium was 60 and for 230
quiescent, G0, PSC27 cells in growth medium devoid of serum the CCP score was 31. We cal-231
culated CCP scores from transcript profiles of CPE (n = 33), BPE (n = 24) and CAS (n = 7) mi-232
crodissected from frozen radical prostatectomy specimens. In BPE and CPE the scores were 25 233
(range 19 – 32) and 31 (range 23 – 42), respectively, whereas the score for CAS was 19 (range 234
10 – 31) (Figure 1c,d). These data indicate that cells comprising the prostate stroma are gen-235
erally quiescent, even in the context of adjacent cancerous epithelium. 236
To determine the effects of genotoxic exposures on non-dividing cells, we established cell 237
quiescence using two strategies to reversibly-arrest cellular proliferation. We placed primary 238
on May 13, 2019. © 2017 American Association for Cancer Research. mcr.aacrjournals.org Downloaded from
Author manuscripts have been peer reviewed and accepted for publication but have not yet been edited. Author Manuscript Published OnlineFirst on March 29, 2017; DOI: 10.1158/1541-7786.MCR-16-0387

12
PSC27 prostate fibroblasts in culture conditions with serum-free growth medium deprived of mi-239
togens, hereafter designated quiescence by serum-starvation (PSC27-QSS), or allowed PSC27 240
fibroblasts to grow to a high density, hereafter designated quiescence by contact inhibition 241
(PSC27-QCI). We confirmed that that >80% of PSC27-QSS and PSC27-QCI cells were in a G0-242
G1 cell cycle stage by flow cytometry. Whereas non-confluent proliferating PSC27 cells growing 243
in medium supplemented with 10% FBS (PSC27-PRO) had a cell cycle distribution of 53% 244
G0/G1, 24% S and 22% G2, the phase distributions of PSC27-QSS were 82% G0/G1, 6% S, 10% 245
G2 and PSC27-QCI were 88% G0/G1, 2% S, 10% G2, respectively. We confirmed the low pro-246
liferative rate of PSC27-QSS and PSC27-QCI cells by treating cultures with bromodeoxyuridine 247
(BrdU) and assessing the percentage of BrdU positive cells which ranged from 26% of PSC27 248
cells grown in full medium to 5% of PSC27-QCI and 4% of PSC27-QSS (p<0.01) (Figure 1e). 249
We next confirmed that the gene expression program in the growth-arrested quiescent 250
PSC27 prostate fibroblast population was concordant with previously reported assessments of 251
gene expression in quiescence (26). We quantitated transcript levels in growth-arrested cells 252
using genome-wide transcript microarrays. Compared to proliferating PSC27 cells, 108 tran-253
scripts were increased and 203 transcripts were decreased by 3-fold or greater (q<10%). Gene 254
set enrichment analyses confirmed a significant enrichment of quiescence-altered transcripts 255
between the PSC27 fibroblasts and a report by Lemons et al defining transcriptional alterations 256
that accompany cellular quiescence (26, 29) (Figure 1f,g). Gene Set Enrichment Analyses de-257
termined that genes comprising cell-cell signaling and cell communication were significantly en-258
hanced in quiescent cells whereas genes involved in mitotic cell cycle and cell proliferation were 259
reduced (Supplementary Figure 1). 260
261
DNA damage in quiescent fibroblasts activates a gene expression program that encodes 262
secreted proteins involved in wound repair, inflammatory responses and tumor growth. 263
on May 13, 2019. © 2017 American Association for Cancer Research. mcr.aacrjournals.org Downloaded from
Author manuscripts have been peer reviewed and accepted for publication but have not yet been edited. Author Manuscript Published OnlineFirst on March 29, 2017; DOI: 10.1158/1541-7786.MCR-16-0387

13
To ascertain differences in DNA damage sustained by proliferating fibroblasts and quiescent 264
fibroblasts, we treated prostate fibroblast cell cultures with 10Gy ionizing radiation given in a 265
single fraction, and 12 hours later measured DNA damage by quantitating γH2AX foci by immu-266
nofluorescence. Compared to untreated control cells, untreated PSC27-QSS and PSC27-QCI 267
cells had no significant differences in the percentage of γH2AX foci, indicating that induced cel-268
lular quiescence is not associated with measurable DNA damage by this assay (Figure 2a). In 269
contrast, treatment with ionizing radiation resulted in readily detectable γH2AX foci with signifi-270
cantly increased foci numbers in each treated cell population compared to controls (p<0.01) 271
(Figure 2b). There were no significant differences in the number of γH2AX foci between irradi-272
ated PSC27-PRO, PSC27-QSS or PSC27-QCI cells (Figure 2a). 273
Having ascertained that quiescent fibroblasts respond to DNA damage by phosphorylating 274
H2AX, indicating that DNA damage checkpoint kinases are activated, we next sought to deter-275
mine if components of the downstream gene expression program induced by DNA damage are 276
also activated. We quantitated transcript levels in quiescent PSC27 cells 7 days after exposure 277
to 10Gy radiation using genome wide transcript microarrays. Compared to sham-treatment, ra-278
diation treatment increased the expression of 548 genes and decreased the expression of 207 279
genes by 3-fold or greater (q<0.01%) of which 127 of the genes with increased expression and 280
60 of the genes with decreased expression encode secreted or extracellular proteins (Figure 281
2c). We have previously reported that DNA damage induces a spectrum of growth factors, cyto-282
kines and proteases termed the DNA damage secretory program (DDSP)(13). Collectively, 283
GSEA determined that transcripts comprising the DDSP were significantly enriched in the qui-284
escent PSC27 fibroblasts following radiation (Figure 2d). 285
Quiescent PSC27 fibroblasts treated with the genotoxic chemotherapeutic agent mitoxan-286
trone also responded by increasing the expression of DDSP components (Figure 2e). Overall, 287
the diversity of genes with altered expression following genotoxic damage in proliferating versus 288
on May 13, 2019. © 2017 American Association for Cancer Research. mcr.aacrjournals.org Downloaded from
Author manuscripts have been peer reviewed and accepted for publication but have not yet been edited. Author Manuscript Published OnlineFirst on March 29, 2017; DOI: 10.1158/1541-7786.MCR-16-0387

14
quiescent fibroblasts was quite similar, though the magnitude of transcript upregulation following 289
DNA damaging exposure was less in quiescent compared to proliferating cells (Figure 2e). 290
291
The quiescent cell DDSP is augmented by subsequent cell division. 292
We determined that quiescent cells can activate a robust transcriptional response following 293
genotoxic damage (Figure 2c), but the magnitude of the response was not as substantial as 294
that when proliferating cells were exposed to genotoxic stress. In certain circumstances, the 295
quiescent state is reversible, for example by exposure to endocrine or paracrine mitogens, in-296
flammatory mediators, or reprogramming cues, and G0 cells can be induced to re-enter the cell 297
cycle. To determine if cells damaged in G0, and then allowed to proliferate would further aug-298
ment a secretory damage response, we treated quiescent PSC27 cells (PSC27-QCI) with radia-299
tion or mitoxantrone, and replated them in subconfluent conditions which reduced contact-300
inhibited growth suppression and allowed for the resumption of proliferation. Three days after 301
replating, cells were harvested for gene expression measurements. For most DDSP-associated 302
transcripts, the levels were significantly greater in the quiescent cells allowed to proliferate com-303
pared to cells maintained in a quiescent state (Figure 3), though the magnitude of the DDSP 304
gene expression was still less than that produced by genotoxic exposures to proliferating cells. 305
For IL8, a well-characterized prostate fibroblast DDSP factor, radiation exposure increased IL8 306
transcripts 3-fold over quiescent sham-treated PSC27 cells (p < 0.001) and 5-fold after cells 307
were allowed to resume proliferation (p < 0.0001). In comparison, radiation treatment of prolifer-308
ating PSC27 cells increased IL8 expression by 7-fold compared to sham-treated PSC27 cells (p 309
< 0.001) and 4-fold over radiated PSC27 cells in a quiescent cell state (p < 0.001). 310
311
DNA damage in vivo induces the expression of DDSP components in prostate stroma. 312
To assess the damage responses of benign cells comprising the tumor microenvironment, 313
we examined tissues collected before and after chemotherapy exposure in men with aggressive 314
on May 13, 2019. © 2017 American Association for Cancer Research. mcr.aacrjournals.org Downloaded from
Author manuscripts have been peer reviewed and accepted for publication but have not yet been edited. Author Manuscript Published OnlineFirst on March 29, 2017; DOI: 10.1158/1541-7786.MCR-16-0387

15
localized prostate cancer enrolled on a clinical trial of neoadjuvant chemotherapy consisting of 315
four cycles of the genotoxic drug mitoxantrone (MIT) and the microtubule poison docetaxel 316
(DOC)(30, 31). We have previously shown that cells in the prostate tumor microenvironment 317
exhibit evidence of DNA damage following chemotherapy, as determined by histone H2AX 318
phosphorylation on Ser139 (γ-H2AX)(13). 319
We used laser-capture microdissection (LCM) to isolate stroma from transrectal ultrasound-320
guided prostate biopsies prior to chemotherapy treatment (n = 10 patients) and from radical 321
prostatectomy tissue from the same patients after chemotherapy exposure. We quantitated 322
transcripts by microarray hybridization and identified 65 genes encoding extracellular proteins 323
with increased transcript levels of 1.5-fold or greater (p < 0.05) after chemotherapy exposure 324
(Figure 4a). Genes with the most substantial induction of expression encode proteins such as 325
WNT16, IL6, and EGF with known paracrine roles in promoting adverse tumor phenotypes (13). 326
We further confirmed these findings using qRT-PCR to quantitate transcript levels of repre-327
sentative DDSP genes after and before chemotherapy and measured 2.7-fold increases in IL1ß 328
(p<0.01), 5.7-fold increases in MMP3, 4.3-fold increases in IL6 (p=0.01), and 4.5-fold increases 329
in IL8 (p<0.01) (Figure 4b-e). 330
331
The DDSP from quiescent cells promotes tumor cell proliferation, invasion, and re-332
sistance to therapy. 333
Previous studies have demonstrated that the SASP and DDSP resulting from damage to 334
proliferating fibroblasts can promote adverse cancer cell phenotypes including enhanced cell 335
proliferation, cell invasion, and resistance to cytotoxic chemotherapy (13, 32). We next sought to 336
determine if the attenuated DDSP from quiescent fibroblasts, which more accurately reflect the 337
proliferative state of tissue fibroblasts in vivo, could also influence tumor cell behavior. We col-338
lected conditioned growth medium (CM) from PSC27 cells that were: proliferating (PSC27-Pro), 339
exposed to 10 Gy radiation while proliferating (PSC27-Rad), quiescent by contact inhibition 340
on May 13, 2019. © 2017 American Association for Cancer Research. mcr.aacrjournals.org Downloaded from
Author manuscripts have been peer reviewed and accepted for publication but have not yet been edited. Author Manuscript Published OnlineFirst on March 29, 2017; DOI: 10.1158/1541-7786.MCR-16-0387

16
(PSC27-Q) or exposed to 10 Gy radiation while quiescent (PSC27-QRad). Compared to CM 341
from proliferating PSC27 cells, CM from quiescent PSC27 cells had no effect on tumor cell pro-342
liferation or invasion. As expected, PSC27-Rad CM significantly increased the proliferation of 5 343
different prostate epithelial cell lines and enhanced the invasion of cancer cells through a modi-344
fied basement membrane (Figure 5a,b). For example, exposure of PC3 cells to PSC27-Rad 345
CM increased the number of tumor cells by 2-fold compared to control medium after 5 days of 346
culture (p<0.01) and increased the percentage of invasive tumor cells from 15% to 40% 347
(p<0.001). CM from irradiated quiescent PSC27 cells also significantly increased the prolifera-348
tion of each prostate cancer cell line tested and promoted tumor cell invasion, though the effects 349
on these parameters was slightly less than that induced by CM from irradiated proliferating 350
PSC27 cells (Figure 5b): compared to PSC27-Pro CM, exposure to PSC27-QRad CM in-351
creased PC3 tumor cell numbers from 40,000 to 80,000 after 5 days in culture and the percent-352
age of invasive cells increased from 12% to 30% (Figure 5b). 353
We have previously shown that the DDSP from proliferating fibroblasts exposed to genotox-354
ic therapeutics can promote the resistance of prostate cancer to the effects of chemotherapy. To 355
determine if the DDSP from quiescent cells was also sufficient to enhance chemotherapy re-356
sistance, we exposed BPH1, PC3, DU145, LNCaP and VCaP prostate cells to IC50 concentra-357
tions of mitoxantrone, which inhibits type II topoisomerase resulting in cell death by disrupting 358
DNA synthesis and repair. After 3 days of MIT treatment, tumor cells exposed to CM from 359
PSC27-Rad consistently demonstrated significant attenuation of chemotherapy-induced cytotox-360
icity across a range of MIT concentrations (p<0.05) (Figure 5c). The exposure of prostate can-361
cer cells to CM from irradiated quiescent fibroblasts also significantly improved cell viability after 362
MIT exposure (Figure 5c,d). For example, the percentage of surviving VCaP cells after MIT 363
treatment increased from 63% to 83% and the percentage of surviving PC3 cells increased from 364
66 to 86% in a growth environment containing PSC27-QRad CM (p<0.001)(Figure 5c). To de-365
termine if the DDSP influenced tumor cell growth rates versus cell death, we measured PC3 cell 366
on May 13, 2019. © 2017 American Association for Cancer Research. mcr.aacrjournals.org Downloaded from
Author manuscripts have been peer reviewed and accepted for publication but have not yet been edited. Author Manuscript Published OnlineFirst on March 29, 2017; DOI: 10.1158/1541-7786.MCR-16-0387

17
apoptosis 24 hours after exposure to MIT and determined that the DDSP from quescent PSC27 367
cells significantly reduced MIT-induced PC3 apoptosis by 2-fold (p<0.01)(Figure 5e,f). 368
369
DISCUSSION: 370
The tissue microenvironments within which tumor cells exist profoundly influence a range of 371
malignant phenotypes that include proliferation, migration, invasion, and responses to cytostatic 372
and cytotoxic drugs. Of importance, tissue microenvironments are not static, but rather comprise 373
a dynamic interactive system that responds to the gradual and progressive processes linked to 374
aging, as well as those punctuated events produced by acute tissue damage including genotox-375
ic cancer therapeutics. Molecular events associated with cellular aging processess have now 376
been characterized in mechanistic detail. A consequence of cellular aging is the irreversible ar-377
rest of cell growth brought about DNA damage signals that culminate in the activation of cell cy-378
cle regulators such as p16 that contribute to a senescence phenotype. The physiological state 379
of cellular senescence is accompanied by the induction of a gene expression program that 380
comprises a spectrum of secreted growth factors and cytokines that regulate inflammatory re-381
sponses and tissue repair processes. Noteably, components of this senescence-associated se-382
cretory phenotype promote tumor cell proliferation and invasion(13, 33). Though the overall bur-383
den of senescent cells in the aging host is low, they have been shown to contribute to aging–384
related pathologies and are hypothesized to influence the development and progression of car-385
cinomas(14, 17). 386
Though DNA damage occurs contininuously at low levels due to internal metabolic process-387
es and external exposures such as environmental radiation, cancer therapeutics have the po-388
tential to acutely and profoundly increase the levels of DNA damage far beyond the exposures a 389
typical individual would experience during a lifetime. Such acute exposures produced by geno-390
toxic drugs and radiotherapy overwhelm cellular repair processes and consequently result in the 391
on May 13, 2019. © 2017 American Association for Cancer Research. mcr.aacrjournals.org Downloaded from
Author manuscripts have been peer reviewed and accepted for publication but have not yet been edited. Author Manuscript Published OnlineFirst on March 29, 2017; DOI: 10.1158/1541-7786.MCR-16-0387

18
death of neoplastic cells. Since most therapeutics lack precise selectivity toward malignant cells, 392
benign cells are also exposed to these insults and respond to these stresses by engaging repair 393
processes that also include a secretory program(6, 34). Previous studies have characterized 394
secretory damage responses in proliferating cells and the results of experiments comprising this 395
study demonstrate that secretory responses accompany genotoxic insults in nonproliferating 396
quiescent cells in vitro and in vivo. 397
The DNA damage secretory program is comprised of a complex amalgam of proteases, 398
growth factors and cytokines that have the potential to influence different cell types within a tis-399
sue or tumor microenvironment: IL6, IL8, and IL27 regulate inflammatory cell activity, AREG and 400
EGF promote epithelial cell proliferation, MMPs modify structural extracellular matrix proteins 401
and WNT family members influence the functions of several different mesenchymal and epithe-402
lial cell types. In addition to their roles in maintaining tissue homeostasis via remodeling and re-403
pair, these and other individual DDSP components can promote adverse tumor cell phenotypes 404
that include proliferation, invasion, and resistance to chemotherapy-induced cell death(6, 36). 405
The complexity and redundancy of the DDSP suggests that while targeting the paracrine in-406
teractions of individual DDSP components may have some beneficial effects in terms of aug-407
menting cancer directed therapeutics, a more effective strategy may involve methods to elimi-408
nate senescent cells(17), or by inhibiting key upstream nodes that propogate the initiating DNA 409
damage signal to downstream transcription factors that regulate the expression of DDSP 410
mRNAs. A subset of the SASP and DDSP transcriptional programs are known to be directly 411
regulated via NFkB and indirectly via GATA4, mTOR and MAPK (33-35). As the mTOR and 412
MAP kinases have potent pharmacological inhibitors available, clinical studies combining mTOR 413
or MAPK inhibition in conjuction with genotoxic chemotherapy or radiotherapy could be ad-414
vanced to test the concept that inhibiting a treatment-induced microenvironment-derived secre-415
tory program would augment the effectiveness of conventional cancer therapeutics. 416
417
on May 13, 2019. © 2017 American Association for Cancer Research. mcr.aacrjournals.org Downloaded from
Author manuscripts have been peer reviewed and accepted for publication but have not yet been edited. Author Manuscript Published OnlineFirst on March 29, 2017; DOI: 10.1158/1541-7786.MCR-16-0387

19
ACKNOWLEDGMENTS 419
The authors declare they have no conflicts of interest and financial disclosures that are relevant 420
to this publication. We thank the patients and their families for their altruistic participation in this 421
study. We thank Dr. Thomasz Beer and Celestia Higano for the development and conduct of the 422
neoadjuvant chemotherapy clinical trial. This study was supported by NIH grants to the Fred 423
Hutchinson Cancer Research Center P30CA015704, U01CA164188, R01CA165573, the Pacific 424
Northwest Prostate Cancer SPORE CA097186, awards from the Department of Defense 425
PC131820 and awards from the Canary Foundation and Prostate Cancer Foundation. 426
427
on May 13, 2019. © 2017 American Association for Cancer Research. mcr.aacrjournals.org Downloaded from
Author manuscripts have been peer reviewed and accepted for publication but have not yet been edited. Author Manuscript Published OnlineFirst on March 29, 2017; DOI: 10.1158/1541-7786.MCR-16-0387

20
FIGURE LEGENDS 428
429
Figure 1. Cell proliferation and quiescence in prostate epithelium and stroma. 430
a. Ki-67 immunohistochemistry of prostate carcinoma cells (CPE), cancer adjacent stromal cells 431
(CAS) and stromal cells adjacent to benign glands (BAS). The mean (±SEM) Ki67-index (%) for 432
CPE, CAS and BAS was 4.0 ± 0.8% (±SEM), 0.5 ± 0.1% and 0.6 ± 0.1%, respectively. The dif-433
ferences were statistically different by Student’s t test for CPE vs. CAS and CPE vs. BAS. 434
b. Image of Ki-67 immunohistochemistry. Brown chromogenic nuclear staining denotes a Ki-67 435
positive cell (arrow). Black line = 100 µM. 436
c. Cell cycle proliferation (CCP) score calculated from microarray-based quantitation of gene 437
expession from microdissected benign prostate epithelium (BPE), prostate carcinoma (CPE) 438
and cancer adjacent stroma (CAS). 439
d. Heatmap of genes comprising the cell cycle progression (CCP) score. Rows represent CCP 440
genes and columns are tissue samples from different patients. 441
e. Quantitation of bromodeoxyuridine (BrdU) values from PSC27 fibroblasts proliferating (Pro) or 442
growth arrested by contact inhibition (QCI) or serum starvation (QSS). 443
f. Heatmap of gene epression comparing a gene set previously shown to associate with cellular 444
quiescence (left panels) with PSC27 prostate fibroblast quiescence (right panels). P, proliferat-445
ing cells; 7dCI, cells 7 days after contact growth inhibition; 14dCI, cells 14 days after contact 446
growth inhibition (from Lemons et al (26)). C1,C2,C3, biological replicates of proliferating PSC27 447
prostate fibroblasts; Q1,Q2, Q3, biological replicates of quiescent PSC27 prostate fibroblasts. 448
g. Gene set enrichment analysis comparing quiescent PSC27 prostate fibroblast gene expres-449
sion with the quiescent fibroblast gene expression profile as determined by Lemons et al. (26). 450
451
on May 13, 2019. © 2017 American Association for Cancer Research. mcr.aacrjournals.org Downloaded from
Author manuscripts have been peer reviewed and accepted for publication but have not yet been edited. Author Manuscript Published OnlineFirst on March 29, 2017; DOI: 10.1158/1541-7786.MCR-16-0387

21
Figure 2. Effects of DNA damage on quiescent prostate fibroblast gene expression 452
a. Cellular DNA damage response (DDR) foci were determined by counting H2AX foci in PSC27 453
prostate fibroblasts that were proliferating (Pro) or quiescent by serum starvation (QSS) or qui-454
escent by contact inhibition (QCI). 455
b. Immunofluorescence detection of H2AX foci (pink; arrow) in PSC27 prostate fibroblasts. P-456
CON, proliferating cells sham irradiated; P-RAD, proliferating cells following irradiation; Q-SS-457
RAD, serum-starved quiescent cells following irradiation; Q-CI-RAD, contact inhibited quiescent 458
cells following irradiation. Nuclei were counterstained with DAPI (blue). 459
c. Gene expression profiles of quiescent PSC27 prostate fibroblasts before and after exposure 460
to ionizing radiation. Shown are heatmaps of the subset of genes altered by 3-fold or greater 461
with an expanded view of a subset of transcripts encoding secreted proteins. 462
d. Gene set enrichment analysis comparing transcript alterations in irradiated quiescent PSC27 463
prostate fibroblasts to previously reported gene expression alterations in proliferating fibroblasts 464
following DNA damage(27). 465
e. Transcript quantitation by qRT-PCR of gene expression changes following ionizing radiation. 466
C, proliferating PSC27 cells sham irradiated; Q, quiescent PSC27 cells sham irradiated; Q+R, 467
quiescent PSC27 irradiated; R, proliferating PSC27 cells irradiated; Q+M, quiescent PSC27 468
cells treated with mitoxantrone; M, proliferating PSC27 cells treated with mitoxantrone. 469
470
Figure 3. Effects of cell proliferation on the quiescent cell DNA damage secretory pro-471
gram. qRT-PCR measurements of gene expression alterations in quiescent PSC27 prostate 472
fibroblasts before and after resumption of proliferation. C, proliferating PSC27 cells sham irradi-473
ated; Q, quiescent PSC27 cells sham irradiated; Q+R, quiescent PSC27 irradiated; Q+R+P, 474
quiescent PSC27 prostate fibroblasts were irradiated, replated to allow proliferation for 3 days, 475
and harvested for analysis; R, proliferating PSC27 cells irradiated; Q+M, quiescent PSC27 cells 476
treated with mitoxantrone; M, proliferating PSC27 cells treated with mitoxantrone; Q+M+P, qui-477
on May 13, 2019. © 2017 American Association for Cancer Research. mcr.aacrjournals.org Downloaded from
Author manuscripts have been peer reviewed and accepted for publication but have not yet been edited. Author Manuscript Published OnlineFirst on March 29, 2017; DOI: 10.1158/1541-7786.MCR-16-0387

22
escent PSC27 prostate fibroblasts were treated with mitoxantrone, re-plated to allow prolifera-478
tion for 3 days, and harvested for analysis 479
480
Figure 4. Gene expression alterations in quiescent prostate stroma in vivo following 481
genotoxic chemotherapy. 482
a. Quantitation of gene expression in microdissected prostate stroma by microarray hybridiza-483
tion before (Pre) and after (Post) exposure to mitoxantrone and docetaxel (≥1.5-fold increase 484
with p<0.05). Expanded heatmap shows a subset of the transcripts encoding extracellular pro-485
teins. 486
b-e. Quantitation of gene expression by qRT-PCR in microdissected prostate stroma before and 487
after chemotherapy. 488
489
Figure 5. Effects of paracrine factors from damaged quiescent fibroblasts on tumor cell 490
proliferation, invasion and therapy resistance. 491
a. Prostate cancer cell proliferation following exposure to conditioned medium from proliferating 492
sham-treated (PSC27-Pro), irradiated (PSC27-Rad), quiescent (PSC27-Q), or irradiated quies-493
cent (PSC27-QRad) fibroblast cells. 494
b. Assessments of cancer cell invasion following exposure to conditioned medium from prolifer-495
ating sham-treated (PSC27-Pro), irradiated (PSC27-Rad), quiescent (PSC27-Q), or irradiated 496
quiescent (PSC27-QRad) fibroblast cells. 497
c. Assessment of prostate cancer cell viability following exposure to IC50 concentrations of mi-498
toxantrone in the context of conditioned medium from sham-treated proliferating fibroblasts 499
(PSC27), irradiated proliferating fibroblasts (PSC27-Rad), quiescent fibroblasts (PSC27-Q), or 500
irradiated quiescent fibroblasts (PSC27-QRad). 501
d. Assessments of PC3 prostate cancer cell viability across a range of mitoxantrone concentra-502
tions in the context of concurrent exposure to conditioned medium from sham-treated proliferat-503
on May 13, 2019. © 2017 American Association for Cancer Research. mcr.aacrjournals.org Downloaded from
Author manuscripts have been peer reviewed and accepted for publication but have not yet been edited. Author Manuscript Published OnlineFirst on March 29, 2017; DOI: 10.1158/1541-7786.MCR-16-0387

23
ing fibroblasts (PSC27), irradiated proliferating fibroblasts (PSC27-Rad), quiescent fibroblasts 504
(PSC27-Q), or irradiated quiescent fibroblasts (PSC27-QRad). Cell viability was determined 3 505
days after mitoxantrone exposure. 506
e. Assessments of PC3 prostate cancer cell apoptosis following exposure to mitoxantrone in the 507
context of conditioned medium from sham-treated proliferating fibroblasts (PSC27), irradiated 508
proliferating fibroblasts (PSC27-Rad), quiescent fibroblasts (PSC27-Q), or irradiated quiescent 509
fibroblasts (PSC27-QRad). Caspase 3 and 7 activities were measured (Glo assay of apoptosis) 510
24 h post exposure of PC3 cells to IC50 of mitoxantrone. 511
f. Bright field microscopy images of PC3 cells photographed 24 h post exposure to IC50 con-512
centrations of mitoxantrone in the context of conditioned medium from sham-treated proliferat-513
ing fibroblasts (PSC27-CM), irradiated proliferating fibroblasts (PSC27-Rad), quiescent fibro-514
blasts (PSC27-Q CM), or irradiated quiescent fibroblasts (PSC27-QRad CM). Highly refractile 515
cells in PSC27-CM and PSC27-Q CM conditions are indicative of apoptosis. 516
517
on May 13, 2019. © 2017 American Association for Cancer Research. mcr.aacrjournals.org Downloaded from
Author manuscripts have been peer reviewed and accepted for publication but have not yet been edited. Author Manuscript Published OnlineFirst on March 29, 2017; DOI: 10.1158/1541-7786.MCR-16-0387
24
REFERENCES 518 519
1. Polyak K, Haviv I, Campbell IG. Co-evolution of tumor cells and their microenvironment. 520
Trends Genet. 2009;25:30-8. 521
2. Perez-Moreno M. When neighbourhood matters: tumour microenvironment. Clin Transl 522
Oncol. 2009;11:70-4. 523
3. Hu M, Polyak K. Microenvironmental regulation of cancer development. Curr Opin Genet 524
Dev. 2008;18:27-34. 525
4. Bianchi-Frias D, Vakar-Lopez F, Coleman IM, Plymate SR, Reed MJ, Nelson PS. The 526
effects of aging on the molecular and cellular composition of the prostate microenvironment. 527
PLoS One. 2010;5. 528
5. Denardo DG, Brennan DJ, Rexhepaj E, Ruffell B, Shiao SL, Madden SF, et al. 529
Leukocyte Complexity Predicts Breast Cancer Survival and Functionally Regulates Response to 530
Chemotherapy. Cancer Discov. 2011;1:54-67. 531
6. Sun Y, Nelson PS. Molecular pathways: involving microenvironment damage responses 532
in cancer therapy resistance. Clin Cancer Res. 2012;18:4019-25. 533
7. Di Micco R, Fumagalli M, Cicalese A, Piccinin S, Gasparini P, Luise C, et al. Oncogene-534
induced senescence is a DNA damage response triggered by DNA hyper-replication. Nature. 535
2006;444:638-42. 536
8. Rodier F, Munoz DP, Teachenor R, Chu V, Le O, Bhaumik D, et al. DNA-SCARS: 537
distinct nuclear structures that sustain damage-induced senescence growth arrest and 538
inflammatory cytokine secretion. J Cell Sci. 2011;124:68-81. 539
9. Childs BG, Baker DJ, Kirkland JL, Campisi J, van Deursen JM. Senescence and 540
apoptosis: dueling or complementary cell fates? EMBO Rep. 2014;15:1139-53. 541
10. Gilbert LA, Hemann MT. DNA damage-mediated induction of a chemoresistant niche. 542
Cell. 2010;143:355-66. 543
11. Rodier F, Coppe JP, Patil CK, Hoeijmakers WAM, Munoz D, Raza SR, et al. Persistent 544
DNA damage signaling triggers senescence-associated inflammatory cytokine secretion. Nature 545
Cell Biol. 2009;11:973-9. 546
12. Kuilman T, Peeper DS. Senescence-messaging secretome: SMS-ing cellular stress. Nat 547
Rev Cancer. 2009;9:81-94. 548
13. Sun Y, Campisi J, Higano C, Beer TM, Porter P, Coleman I, et al. Treatment-induced 549
damage to the tumor microenvironment promotes prostate cancer therapy resistance through 550
WNT16B. Nat Med. 2012;18:1359-68. 551
on May 13, 2019. © 2017 American Association for Cancer Research. mcr.aacrjournals.org Downloaded from
Author manuscripts have been peer reviewed and accepted for publication but have not yet been edited. Author Manuscript Published OnlineFirst on March 29, 2017; DOI: 10.1158/1541-7786.MCR-16-0387

25
14. Baker DJ, Wijshake T, Tchkonia T, LeBrasseur NK, Childs BG, van de Sluis B, et al. 552
Clearance of p16Ink4a-positive senescent cells delays ageing-associated disorders. Nature. 553
2011;479:232-6. 554
15. Nguyen DH, Oketch-Rabah HA, Illa-Bochaca I, Geyer FC, Reis-Filho JS, Mao JH, et al. 555
Radiation acts on the microenvironment to affect breast carcinogenesis by distinct mechanisms 556
that decrease cancer latency and affect tumor type. Cancer Cell. 2011;19:640-51. 557
16. Davalos AR, Coppe JP, Campisi J, Desprez PY. Senescent cells as a source of 558
inflammatory factors for tumor progression. Cancer Metastasis Rev. 2010;29:273-83. 559
17. Chang J, Wang Y, Shao L, Laberge RM, Demaria M, Campisi J, et al. Clearance of 560
senescent cells by ABT263 rejuvenates aged hematopoietic stem cells in mice. Nat Med. 561
2016;22:78-83. 562
18. Coppe JP, Patil CK, Rodier F, Sun Y, Munoz DP, Goldstein J, et al. Senescence-563
associated secretory phenotypes reveal cell-nonautonomous functions of oncogenic RAS and 564
the p53 tumor suppressor. PLoS Biol. 2008;6:2853-68. 565
19. Kuilman T, Michaloglou C, Vredeveld LC, Douma S, van Doorn R, Desmet CJ, et al. 566
Oncogene-induced senescence relayed by an interleukin-dependent inflammatory network. Cell. 567
2008;133:1019-31. 568
20. Herranz N, Gallage S, Mellone M, Wuestefeld T, Klotz S, Hanley CJ, et al. mTOR 569
regulates MAPKAPK2 translation to control the senescence-associated secretory phenotype. 570
Nat Cell Biol. 2015;17:1205-17. 571
21. Barlow JH, Lisby M, Rothstein R. Differential regulation of the cellular response to DNA 572
double-strand breaks in G1. Mol Cell. 2008;30:73-85. 573
22. Ambrosio S, Di Palo G, Napolitano G, Amente S, Dellino GI, Faretta M, et al. Cell cycle-574
dependent resolution of DNA double-strand breaks. Oncotarget. 2015. 575
23. Bavik C, Coleman I, Dean JP, Knudsen B, Plymate S, Nelson PS. The Gene Expression 576
Program of Prostate Fibroblast Senescence Modulates Neoplastic Epithelial Cell Proliferation 577
through Paracrine Mechanisms. Cancer Res. 2006;66:794-802. 578
24. Hayward SW, Wang Y, Cao M, Hom YK, Zhang B, Grossfeld GD, et al. Malignant 579
transformation in a nontumorigenic human prostatic epithelial cell line. Cancer Res. 580
2001;61:8135-42. 581
25. Tretiakova MS, Wei W, Boyer HD, Newcomb LF, Hawley S, Auman H, et al. Prognostic 582
value of Ki67 in localized prostate carcinoma: a multi-institutional study of >1000 583
prostatectomies. Prostate Cancer Prostatic Dis. 2016;19:264-70. 584
on May 13, 2019. © 2017 American Association for Cancer Research. mcr.aacrjournals.org Downloaded from
Author manuscripts have been peer reviewed and accepted for publication but have not yet been edited. Author Manuscript Published OnlineFirst on March 29, 2017; DOI: 10.1158/1541-7786.MCR-16-0387

26
26. Lemons JM, Feng XJ, Bennett BD, Legesse-Miller A, Johnson EL, Raitman I, et al. 585
Quiescent fibroblasts exhibit high metabolic activity. PLoS Biol. 2010;8:e1000514. 586
27. Sun Y, Campisi J, Higano C, Beer TM, Porter P, Coleman I, et al. Treatment-induced 587
damage to the tumor microenvironment promotes prostate cancer therapy resistance through 588
WNT16B. Nat Med. 2012. 589
28. Cuzick J, Swanson GP, Fisher G, Brothman AR, Berney DM, Reid JE, et al. Prognostic 590
value of an RNA expression signature derived from cell cycle proliferation genes in patients with 591
prostate cancer: a retrospective study. Lancet Oncol. 2011;12:245-55. 592
29. Coller HA, Sang L, Roberts JM. A new description of cellular quiescence. PLoS Biol. 593
2006;4:e83. 594
30. Garzotto M, Myrthue A, Higano CS, Beer TM. Neoadjuvant mitoxantrone and docetaxel 595
for high-risk localized prostate cancer. Urol Oncol. 2006;24:254-9. 596
31. Beer TM, Garzotto M, Lowe BA, Ellis WJ, Montalto MA, Lange PH, et al. Phase I study 597
of weekly mitoxantrone and docetaxel before prostatectomy in patients with high-risk localized 598
prostate cancer. Clin Cancer Res. 2004;10:1306-11. 599
32. Krtolica A, Parrinello S, Lockett S, Desprez PY, Campisi J. Senescent fibroblasts 600
promote epithelial cell growth and tumorigenesis: a link between cancer and aging. Proc Natl 601
Acad Sci U S A. 2001;98:12072-7. 602
33. Laberge RM, Sun Y, Orjalo AV, Patil CK, Freund A, Zhou L, et al. MTOR regulates the 603
pro-tumorigenic senescence-associated secretory phenotype by promoting IL1A translation. Nat 604
Cell Biol. 2015;17:1049-61. 605
34. Kang C, Xu Q, Martin TD, Li MZ, Demaria M, Aron L, et al. The DNA damage response 606
induces inflammation and senescence by inhibiting autophagy of GATA4. Science. 607
2015;349:aaa5612. 608
35. Freund A, Patil CK, Campisi J. p38MAPK is a novel DNA damage response-609
independent regulator of the senescence-associated secretory phenotype. EMBO J. 610
2011:30(8):1536-46. 611
36. Wang T, Notta F, Navab R, Joseph J, Ibrahimov E, Xu J, , et al., Senescent Carcinoma-612
associated Fibroblasts Upregulate IL8 to Enhance Pro-metastatic Phenotypes. Mol Cancer Res, 613
2016;15(1):1-12. 614
615
on May 13, 2019. © 2017 American Association for Cancer Research. mcr.aacrjournals.org Downloaded from
Author manuscripts have been peer reviewed and accepted for publication but have not yet been edited. Author Manuscript Published OnlineFirst on March 29, 2017; DOI: 10.1158/1541-7786.MCR-16-0387

a
b
e
FIGURE 1
d
c
f
g
on May 13, 2019. © 2017 American Association for Cancer Research. mcr.aacrjournals.org Downloaded from
Author manuscripts have been peer reviewed and accepted for publication but have not yet been edited. Author Manuscript Published OnlineFirst on March 29, 2017; DOI: 10.1158/1541-7786.MCR-16-0387
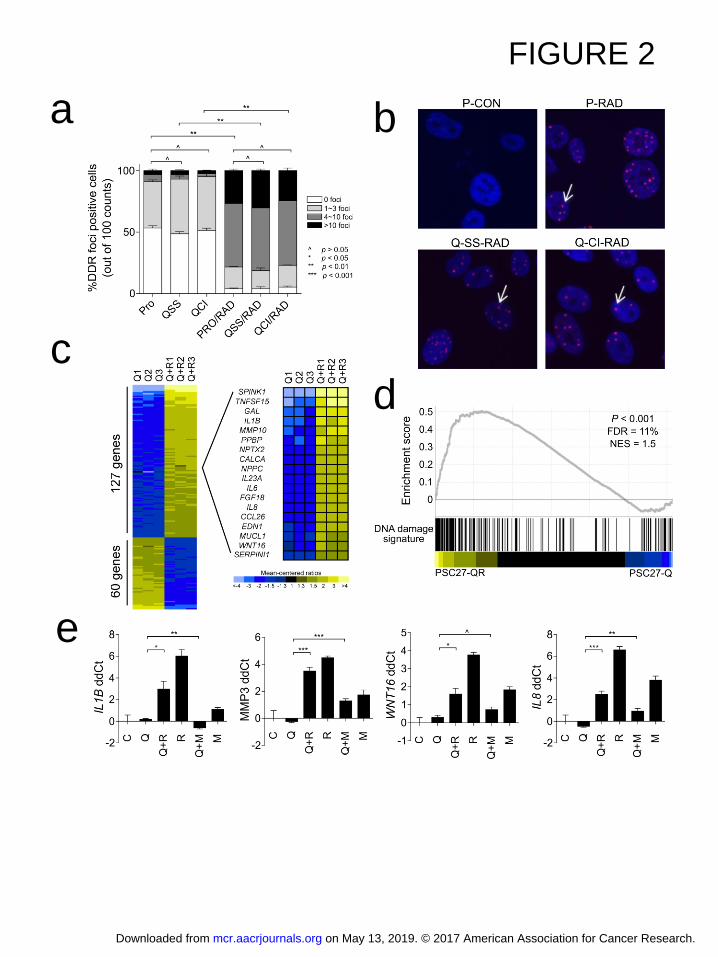
FIGURE 2
a
c d
e
b
on May 13, 2019. © 2017 American Association for Cancer Research. mcr.aacrjournals.org Downloaded from
Author manuscripts have been peer reviewed and accepted for publication but have not yet been edited. Author Manuscript Published OnlineFirst on March 29, 2017; DOI: 10.1158/1541-7786.MCR-16-0387

FIGURE 3
on May 13, 2019. © 2017 American Association for Cancer Research. mcr.aacrjournals.org Downloaded from
Author manuscripts have been peer reviewed and accepted for publication but have not yet been edited. Author Manuscript Published OnlineFirst on March 29, 2017; DOI: 10.1158/1541-7786.MCR-16-0387
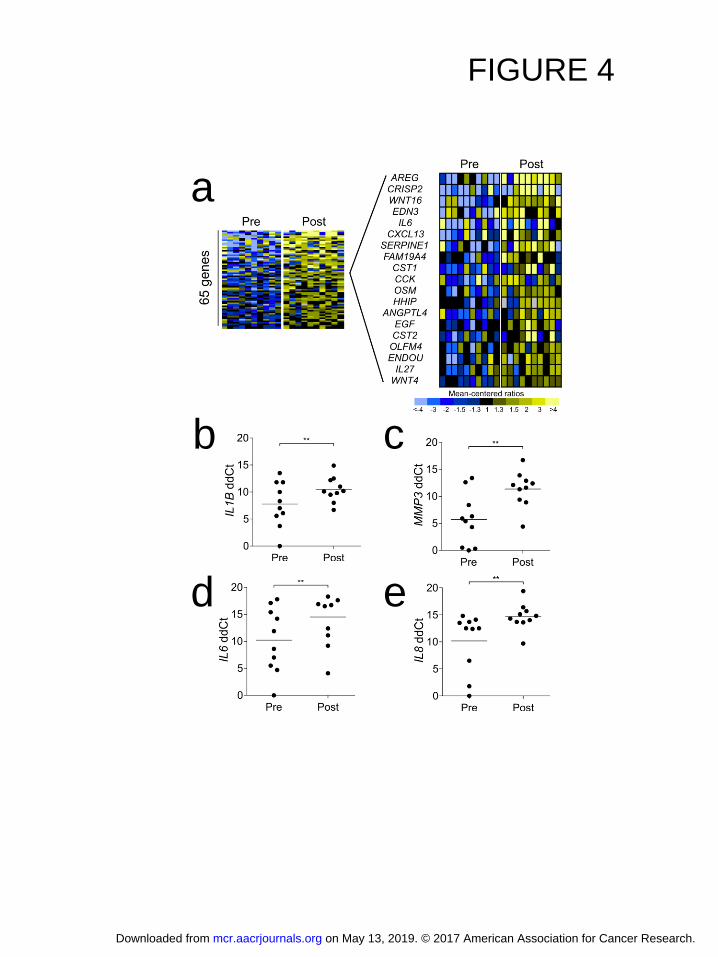
FIGURE 4
a
b c
d e
on May 13, 2019. © 2017 American Association for Cancer Research. mcr.aacrjournals.org Downloaded from
Author manuscripts have been peer reviewed and accepted for publication but have not yet been edited. Author Manuscript Published OnlineFirst on March 29, 2017; DOI: 10.1158/1541-7786.MCR-16-0387
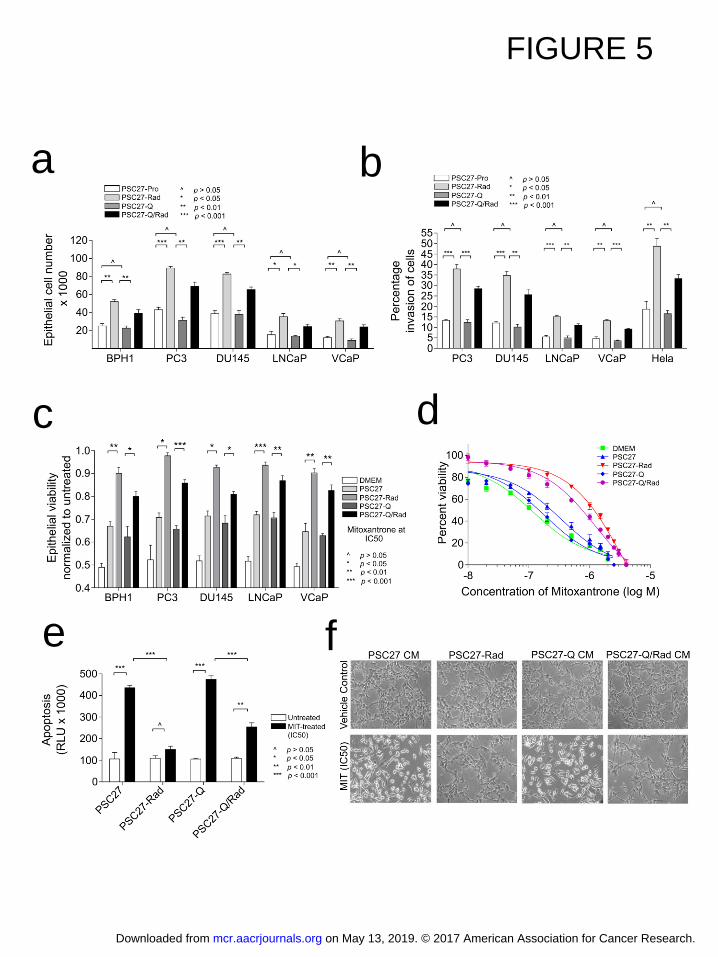
FIGURE 5
a b
c d
e f
on May 13, 2019. © 2017 American Association for Cancer Research. mcr.aacrjournals.org Downloaded from
Author manuscripts have been peer reviewed and accepted for publication but have not yet been edited. Author Manuscript Published OnlineFirst on March 29, 2017; DOI: 10.1158/1541-7786.MCR-16-0387
Published OnlineFirst March 29, 2017.Mol Cancer Res Luis Gomez-Sarosi, Yu Sun, Ilsa Coleman, et al. TME that Fosters Adverse Cancer PhenotypesDNA Damage Induces a Secretory Program in the Quiescent
Updated version
10.1158/1541-7786.MCR-16-0387doi:
Access the most recent version of this article at:
Material
Supplementary
http://mcr.aacrjournals.org/content/suppl/2017/02/08/1541-7786.MCR-16-0387.DC1
Access the most recent supplemental material at:
Manuscript
Authoredited. Author manuscripts have been peer reviewed and accepted for publication but have not yet been
E-mail alerts related to this article or journal.Sign up to receive free email-alerts
Subscriptions
Reprints and
To order reprints of this article or to subscribe to the journal, contact the AACR Publications
Permissions
Rightslink site. Click on "Request Permissions" which will take you to the Copyright Clearance Center's (CCC)
.http://mcr.aacrjournals.org/content/early/2017/01/28/1541-7786.MCR-16-0387To request permission to re-use all or part of this article, use this link
on May 13, 2019. © 2017 American Association for Cancer Research. mcr.aacrjournals.org Downloaded from
Author manuscripts have been peer reviewed and accepted for publication but have not yet been edited. Author Manuscript Published OnlineFirst on March 29, 2017; DOI: 10.1158/1541-7786.MCR-16-0387