do institutions, ownership, exporting and competition ...repec.iza.org/dp2637.pdf · do...
TRANSCRIPT

IZA DP No. 2637
Do Institutions, Ownership, Exporting andCompetition Explain Firm Performance?Evidence from 26 Transition Countries
Simon CommanderJan Svejnar
DI
SC
US
SI
ON
PA
PE
R S
ER
IE
S
Forschungsinstitutzur Zukunft der ArbeitInstitute for the Studyof Labor
February 2007

Do Institutions, Ownership, Exporting and Competition Explain Firm Performance? Evidence from 26 Transition Countries
Simon Commander EBRD, London Business School
and IZA
Jan Svejnar University of Michigan,
CERGE-EI, CEPR and IZA
Discussion Paper No. 2637 February 2007
IZA
P.O. Box 7240 53072 Bonn
Germany
Phone: +49-228-3894-0 Fax: +49-228-3894-180
E-mail: [email protected]
Any opinions expressed here are those of the author(s) and not those of the institute. Research disseminated by IZA may include views on policy, but the institute itself takes no institutional policy positions. The Institute for the Study of Labor (IZA) in Bonn is a local and virtual international research center and a place of communication between science, politics and business. IZA is an independent nonprofit company supported by Deutsche Post World Net. The center is associated with the University of Bonn and offers a stimulating research environment through its research networks, research support, and visitors and doctoral programs. IZA engages in (i) original and internationally competitive research in all fields of labor economics, (ii) development of policy concepts, and (iii) dissemination of research results and concepts to the interested public. IZA Discussion Papers often represent preliminary work and are circulated to encourage discussion. Citation of such a paper should account for its provisional character. A revised version may be available directly from the author.

IZA Discussion Paper No. 2637 February 2007
ABSTRACT
Do Institutions, Ownership, Exporting and Competition Explain Firm Performance? Evidence from 26 Transition Countries*
We analyze a large stratified random sample of firms that provide us with measures of performance and each firm’s top manager’s perception of the severity of business environment constraints faced by his/her firm. Unlike most existing studies that rely on external and aggregated proxy measures of the business environment, defined to include legal and institutional features, we have information from each surveyed firm. Specifically, we use the 2005 and 2002 Business Environment and Enterprise Performance Survey (BEEPS) to assess the effect on performance of ownership, competition, export orientation and the business environment of the firm. We employ a variety of approaches to deal with the problem of omitted variables, errors in variables and endogeneity that plague studies in this area. We find that foreign ownership and competition have an impact on performance – measured as the level of sales controlling for inputs. Export orientation of the firm does not have an effect on performance once ownership is taken into account. When we analyze the impact of perceived constraints, we show that few retain explanatory power once they are introduced jointly rather than one at a time, or when country, industry and year fixed effects are introduced. Indeed, country fixed effects largely absorb the explanatory power of the constraints faced by individual firms. Replicating the analysis with commonly used country-level indicators of the business environment, we do not find much of a relationship between constraints and performance. Our analysis brings into question an important part of the conventional wisdom in this area. It indicates that country fixed effects, reflecting time-invariant differences in the business environment but also other factors, matter for firm performance, but that differences in the business environment observed across firms within countries do not. Moreover, the limited firm- and country-level variations in the business environment over time do not appear to affect performance either. This suggests that the effect of business environment on performance and the analysts’ ability to identify this effect are more limited than has been assumed to date. JEL Classification: D24, L21, O12, O57 Keywords: firm performance, productivity, competition, institutions, business environment,
export orientation, firm ownership, subjective data Corresponding author: Simon Commander London Business School Sussex Place Regent’s Park London NW1 4SA United Kingdom E-mail: [email protected]
* We would like to thank Hein Bogaard, Randolph Bruno and Matias Busso for excellent assistance in preparing this paper. We thank John DiNardo, Sam Fankhauser, Steven Fries, Yuriy Gorodnichenko, Alex Muravyev, Mark Schaffer and Utku Teksoz for helpful discussion and/or comments on an earlier version. The paper was written with the support of EBRD. The usual disclaimer applies.

1. Introduction
The efficiency of firms in developing countries, including the transition economies, is
obviously central to explaining the performance of these economies as a whole. In many
developing countries, large firms were often historically state-owned and widely regarded
as inefficient. Indeed, almost all firms in the transition economies started as being state
owned with their objectives set consistent with the dictates of central planning. To escape
these limitations, a combination of privatisation, entry of new private firms, and
fundamental changes in the legal, institutional and regulatory systems has been at the
core of the development and transition process over the last two decades.
The above policies have been based on the premise that a key determinant of firm
performance in developing as well as developed economies is the state of the business
environment, defined broadly to include the key features of the legal, regulatory,
financial, and institutional system.2 Indeed, it has been noted that the barriers to doing
business vary widely across regions and countries,3 and it has been argued that the
business environment will affect aggregate performance, as well as exert influence on the
operation of financial markets.4 A sizable empirical literature supporting various aspects
of this view has appeared, using data at the country, industry and firm levels. However,
the measurement of the business environment has encountered major methodological
challenges that may have generated biased estimates on account of issues such as errors
in variables, omitted variables and endogeneity of regressors.
First, much of the knowledge in this area derives from studies that rely on
country-level proxy indicators of the business environment, such as governance (e.g.,
2 See for example, World Bank (2002) and EBRD (1999) 3 World Bank (2005); World Economic Forum (2005) 4 See Hausmann et al. (2004). For the financial market angle, see Durnev et al. (2004).
2
Kaufmann et al., 1999 and 2002), regulatory constraints (e.g., Djankov et al., 2002, and
Botero et al. 2004), competitiveness (e.g., World Economic Forum), transparency (e.g.,
Transparency International), bureaucratic quality, corruption and law and order (e.g.,
Political Risk Services), strength of the legal system (Durnev and Kim, 2005), and the
level of economic freedom in an economy (e.g., Heritage Foundation). Many of these
aggregate proxies of the actual phenomena contain little or no variation over time and
thus are completely or almost indistinguishable from country-, sector- or region-specific
effects that may reflect other features than the business environment. Second, the
aggregate studies usually estimate the association between features of business
environment and macroeconomic performance rather than identify the causal effects of
the environment on performance (see, for example, discussion in Levine and Zervos,
1998, and Rajan and Zingales, 1998).
Industry-level studies, such as Rajan and Zingales (1998), Klapper et al. (2004),
and Micco and Pages (2006), estimate the effects of a particular feature of the business
environment on industry performance. They represent an advance over country-level
studies in that they can control for country and industry effects and thus suffer less from
an omitted variable bias. The trade-off is that in order to identify the performance effect,
these studies need to assume that one country, the United States, has an optimal value of
the particular feature of business environment and that there is some technological or
other reason why in all countries some industries depend more than others on this feature
of the environment. While these studies attempt to account for the possible endogeneity
of the business environment, the extent of their control of this issue is limited.
3

Finally, a number of firm-level studies have been carried out in the last few years,
taking advantage of cross-firm variation in performance and in perceived or actual
severity of business environment constraints. While these studies represent an important
advance over the ones based on more aggregate data, they also suffer from a number of
the aforementioned econometric problems. For example, using a 1995 survey of about
440 firms in Bulgaria and Russia, Pissarides et al. (2003) examine the absolute and
relative severity of various constraints and how it relates to the characteristics of the
manager, firm and sector of operation, but they do not address the issue of endogeneity of
regressors. Johnson et al. (2002a,b) use a 1997 firm-level survey of about 1,400 firms in
five transition economies to estimate the effects of property rights and access to credit on
profit reinvestment, but also assume that all regressors are exogenous. Dollar et al.
(2005) use surveys from eight developing countries covering nearly 6500 firms to look at
the association between exporting and the investment climate. The empirical
implementation relies, however, on probit estimations where perceived constraints are
entered on the right hand and assumed to be exogenous. Beck et al. (2005) use the World
Business Environment Survey (WBES) of more than 4,000 firms in 54 countries to
examine the effect of business environment constraints on firm growth, but do not
address endogeneity and in most estimations they enter the constraints one at a time
rather than simultaneously. The authors also do not control for country and industry
heterogeneity with country and industry fixed effects, relying instead only on country
random effects and a manufacturing and a services dummy variable. Ayagari et al. (2005)
examine the importance of financing constraints in explaining firm performance using the
WBES data for 80 countries, relating firm growth rates to the different obstacles that the
4

firms report and assuming that the regressors are exogenous. Finally, Hallward-Driemeier
et al. (2006) use an investment climate survey administered in 2000 to 1,500 Chinese
firms in five cities, with some constraints being measured by managerial perceptions and
others by management-provided information on phenomena such as losses in sales due to
power problems. The authors are concerned with endogeneity, find the instrumental
variable approach infeasible, and use city-industry average values of the business climate
variables, together with city information and sector dummies, to alleviate the endogeneity
problem. They address the omitted variable problem by entering all the constraint
variables simultaneously, but firm ownership is treated as exogenous. In short, the
literature is rich and informative, but compared to most other empirical literatures it is
still somewhat tentative because of the technical estimation issues discussed above.5
In parallel to the investigations of the effects of business environment, researchers
have been analyzing the effects on firm performance of three key structural features,
namely the extent of firm’s export orientation, competition and ownership. The number
of studies and findings is large, but the overall sense is that the performance effects of
exports are found to be positive, (see Tybout, 2003, for a review), those of competition
are found to be positive by Nickell (1999), but questioned as a uniform effect by Carlin et
al. (2004) and Aghion et al. (2005), the effect of ownership is found to be, by and large,
positive for foreign ownership but less clear cut for domestic private ownership.6
Interestingly, while these literatures often use the same or similar dependent variables, 5 There are also other conceptual issues, noted for instance by Carlin et al (2006) who argue that subjective evaluations of constraints can provide important insights but need to be very carefully interpreted. For example, reported constraints for public goods - as against those relating to finance - may require different interpretation as the former may act as a common constraint on firms in a country, while the latter may vary between firms, let alone between countries. 6 Surveys by Djankov and Murrell (2002) and Estrin et al. (2007) point to the positive effect of foreign ownership. While Djankov and Murrell (2002) also find a positive effect of domestic private ownership, Estrin et al. (2007) find this effect to be much weaker and more varied.
5

each of them focuses on a particular set of explanatory variables and usually does not
take into account the explanatory variables deemed important in other strands of research.
This raises the issue of whether existing studies generate biased estimates on account of
omitted variables.
In this paper we carry out an econometric analysis of a large firm-level survey
dataset that includes measures of performance, structural variables related to ownership,
competition and export orientation, and each firm’s top manager’s perception of the
business environment that his/her firm faces. Specifically, we use the 2005 and 2002
Business Environment and Enterprise Performance Survey (BEEPS), collected by the
European Bank for Reconstruction and Development (EBRD) and the World Bank, to
examine what robust relationships, if any, can be identified by linking firm performance
in 26 transition countries to a range of explanatory variables, including the firm’s
business environment, ownership, export orientation, and competition. Aside from
providing a large number of observations, over 4,000 firms in 2002 and 6,600 firms in
2005, the BEEPS dataset also provides us with data on firms over a six-year period, as it
includes three year retrospective information for each survey round. Our objective is to
assess whether the widely accepted claim that the business environment and structural
features of firms are major explanatory factors behind performance is supported in our
large data set under a series of econometric tests.
Given the aforementioned analytical issues, we pay attention to the likely
problems of endogeneity by adopting a number of approaches, including instrumental
variables (IVs), and by assessing the seriousness of the omitted variable bias. We focus
on how efficiently firms generate sales revenue, taking into account inputs of capital and
6

labour. This is equivalent to total factor productivity but broader in that it also captures
improvements in pricing, marketing and other aspects of revenue generation. The reason
we use this broader measure is that the performance of different types of firms may vary
for a number of reasons, including differences in, efficiencies in generating output from
inputs, abilities to charge high prices due to diverse product quality or marketing,
intangible assets and the cost of capital, location in highly competitive industries,
efficiency of vertical integration, and extent of outsourcing. In order to capture as many
of these factors as possible, we focus on the revenues of the firm as our dependent
variable. Our approach explicitly allows for the efficiency of different firms to vary on
account of any of these factors. We do not presume that firms are in a technical or
economic steady state but rather that they are trying to improve their performance by
discovering new methods of production, importing advanced technologies, launching
new products, learning new managerial and marketing techniques and implementing
other changes. The extent to which firms are able to succeed may, of course, also depend
on the macroeconomic, legal and institutional environment. The paper focuses on this
association – or its absence.
We find that foreign (but not domestic private) ownership and competition have
an impact on performance – measured as the level of sales controlling for inputs. Export
orientation of the firm does not have an effect on performance once ownership is taken
into account. When we analyze the impact of perceived constraints, we show that few
retain explanatory power once they are introduced jointly rather than one at a time, or
when country and year fixed effects are introduced. Indeed, country fixed effects largely
absorb the explanatory power of the constraints faced by individual firms. Replicating the
7

analysis with commonly used country-level indicators of the business environment
(Heritage Foundation indices and World Bank’s Doing Business indicators), we do not
find much of a relationship between constraints and performance. Our analysis brings
into question an important part of the conventional wisdom in this area. It indicates that
country fixed effects, reflecting time-invariant differences in the business environment
but also other factors, matter for firm performance, but that differences in the business
environment observed within countries across firms do not. Moreover, the limited firm-
and country-level variations in the business environment over time do not appear to affect
performance either. This suggests that the effect of business environment on performance
and the analysts’ ability to identify this effect are more limited than has been widely
assumed to date.
The paper is organized as follows. In section 2 we discuss the relevant features of
the transition economies. In Section 3 we describe the data, while in Section 4 we outline
the analytical framework. We present our empirical findings in Section 5 and we
conclude in Section 6.
2. The Context of Transition
At the start of transition, firms were characterised by widespread over-staffing, inefficient
working practices, an inadequate emphasis on product quality and marketing, and limited
access to modern technology. In addition, firms often received subsidies that allowed
them to perpetuate inefficiencies and under-performance. Above all, firms were not
generally motivated by the maximisation of profit. Consequently, transition has had two
main aspects – the reallocation of resources from the state to the private sector, and the
8

restructuring of firms to raise their efficiency.7 With the exception of a small number of
countries in the Commonwealth of Independent States (CIS), there has been significant
progress in reallocation of resources and restructuring across the transition countries.8 In
most transition countries, the private sector accounts for most of GDP and has been the
main engine of growth. The private sector has also diversified, with new private firms
entering alongside privatised enterprises, while foreign investment has also
complemented domestic ownership in many countries.
Earlier research that looked into the determinants of firm performance has found
that privately owned firms – especially new private firms – have generally performed
better. The evidence also points to foreign participation and exposure to export markets
as factors associated with strong performance, whether measured in terms of sales, labour
productivity or total factor productivity (output relative to labour and capital inputs).9
However, ownership change does not appear to have had any positive impact on
performance without complementary changes in management structure, financing, the
competitive environment and/or other factors specific to the firm. Further, some recent
evidence has suggested that privatised domestic firms do not necessarily perform
markedly better than the remaining state-owned firms. Moreover, the evidence suggests
that all types of domestic firms in transition countries continue to lag behind their
equivalents in advanced market economies.10 Domestic firms tend to have lower
efficiency in generating output from inputs while their scope for raising prices may be
7 See, for example, Blanchard (1998). 8 However, see a recent study by Mitra and Yemtsov (2006) for arguments that the transitional restructuring is not yet over. 9 See, for example, Carlin (2000), Claessens and Djankov (1999), Frydman et al. (1999), and the EBRD Transition Report 1995 and 1999. 10 See, for example, Sabirianova et al. (2005) and Hanousek et al. (2007).
9
limited by product quality, poor marketing and highly competitive markets. In addition,
they tend to have fewer intangible assets, greater vertical integration and higher financing
costs. Research on the determinants of firm performance has also begun to look at how
factors external to the firm can also exert an influence on performance. Studies using
earlier rounds of the BEEPS have suggested that a better business environment can
indeed have a positive effect, although the size – and robustness - of that effect have
remained open to question.11 Our paper extends this literature by relating firm
performance not only to a set of ownership variables but also to other key attributes,
including perceived constraints, competition and export orientation.
3. Data description
We use the 2002 and 2005 rounds of the BEEPS. The BEEPS data are stratified random
samples of firms. Concerning ownership, most firms in the samples were privatised or
had always been private from the start of their operations. However, quota sampling was
imposed for foreign owned companies (defined as having a foreign stake of at least 50
per cent) and state-owned companies (defined as the state owning more than 50 percent).
These quotas were set at 10 per cent of the total sample for each category. The
distribution of the sample between manufacturing and service sectors was determined
according to these sectors’ relative contribution to GDP in each country. Firms that
operated in sectors subject to government price regulation and prudential supervision,
such as banking, electric power, rail transport, and water were excluded from the sample.
11 See Carlin et al. (2001).
10

As regards size, firms that had 10,000 employees or more were excluded from the
sample, as were firms that had started operations in 2002, 2003 or 2004. Around 90 per
cent of the BEEPS sample in both years comprised small and medium enterprises. The
2002 round of the BEEPS surveyed over 6,100 firms from 26 transition countries while
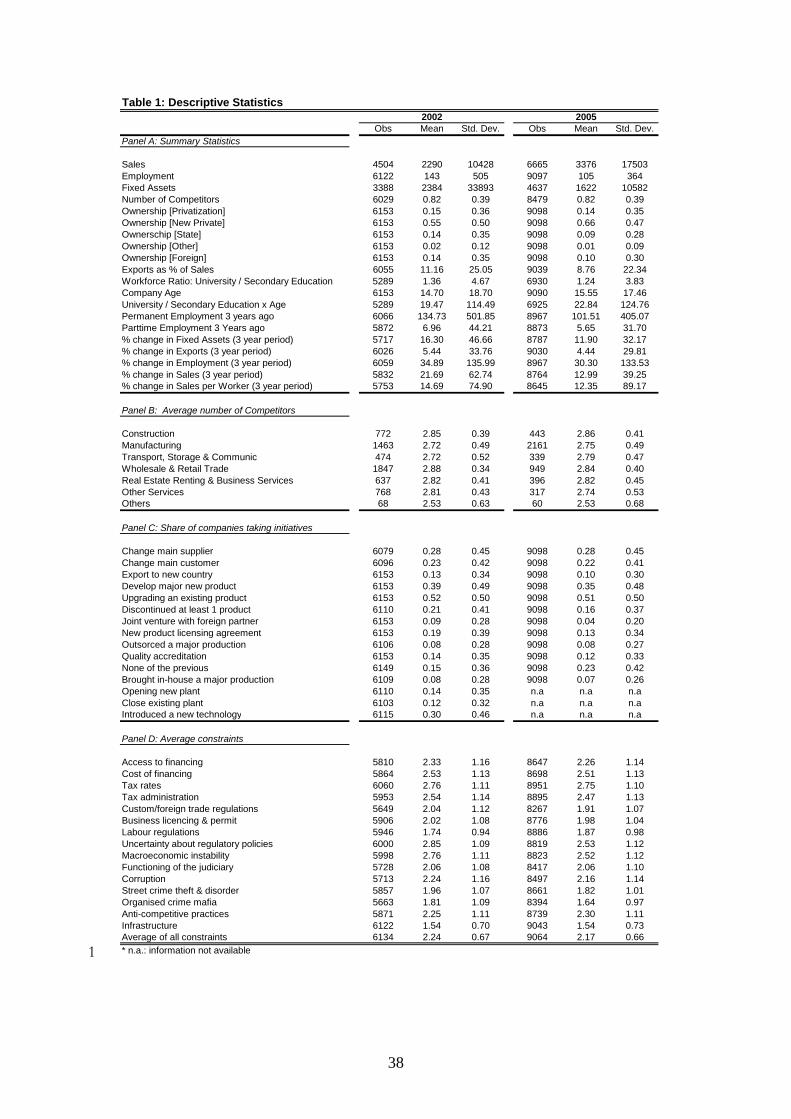
the 2005 round covered nearly 9,100 firms in the same countries. The summary statistics
comprising the number of observations, means and standard deviations of the key
variables are given in Table 1 for the 2002 and 2005 datasets. Values are expressed in US
dollars.
As can be seen from Table 1, the key variables display reasonable mean values
and significant variation. Panel A indicates that the average age of the firm was around
15 years. The average firm had between 105 and 145 employees in both surveys.
Employment, fixed assets, sales and sales per worker had all increased between 1999 and
2002, as well as between 2002 and 2005. In the case of employment, growth over these
three year periods was greater than 30%, while for sales, growth actually decelerated
after 2002. The increase in sales per worker was roughly equal over both three year
periods. The variation in employment, sales and capital across firms and in their growth
has been substantial, as indicated by the standard deviations. Exports have constituted
about 10% of sales and there has again been considerable variation around the mean in
both years. In terms of ownership-related performance statistics not reported in Table 1,
foreign firms have had about 40 per cent higher levels of sales per worker than state-
owned firms. Privatised state firms have had around 10 per cent higher levels while new
private firms have been about 20 per cent higher. Overall, the average foreign firm has
produced 20 to 50 per cent more sales revenue and has had 20 to 40 per cent higher
11

revenue per worker than the average domestic firm. However, the difference between
foreign and domestic firms could be due, in part or fully, to foreign owners acquiring
better-performing firms.12
Panel B of Table 1 provides descriptive information concerning competition,
specifically the average number of competitors reported by firms in both 2002 and 2005
disaggregated by sector. What emerges is that there is little perceived difference across
regions or sectors, as well as little change over the two periods. The average number of
perceived competitors falls between 2.5 and 3 in each sector, but there is considerable
variation within each sector and this variation has risen over time.
Panel C of Table 1 gives some indication of the incidence of firm level changes or
initiatives, broken down by the type of initiative. It can be seen that during the three years
prior to either 2002 or 2005 about one-half of the firms had upgraded an existing product,
while over a third had developed a new product. Around 30% of firms had introduced
new technologies – a share that varies relatively little across regions – while between 20-
30% of firms had either changed their main customer or supplier. There is far less
evidence of firms seeking quality accreditation, joint venturing or use of outsourcing
arrangements. Interestingly, no more than 10-13% of firms had developed exports to new
countries. Overall, this suggests that the early phase of restructuring in many transition
countries has already taken place, except possibly in some strategic industries that are
under-represented in the sample. Firms have certainly invested in changing their product
lines and have taken other steps to improve their performance. This in turn has likely
resulted in a broad range of outcomes. However, particular attributes of firms, such as the
12 This finding is corroborated by other studies of individual or smaller sets of countries (see, for example, Sabirianova et al., 2005).
12

type of ownership, no longer appear to give a good indication of the expected level of
restructuring. Further, firms may periodically make adjustments, such as introducing a
new product, but major restructuring appears not to be a widespread feature of the
transition countries.
Panel D of Table 1 gives for 2002 and 2005 the mean constraint scores and the
associated standard deviations for the fifteen main constraints that the top manager of
each firm was asked to evaluate. Individual firm scores for each constraint to doing
business range from 1 {= no obstacle} to 4 {= a major obstacle}. The panel shows
considerable variation in the average value across constraints, ranging from 1.54 in both
years for the presence of anti-competitive practices to 2.85 in 2002 for uncertainty about
regulatory policies and 2.75 in 2005 for the constraining nature of tax rates. There is also
considerable variation in the reported values of individual constraints across firms, with
the standard deviation of the responses being around or exceeding 1.0 for all but one
constraint (infrastructure) in each year. Averaging the reported values of all 15
constraints, the mean score in both years was 2.2 with a standard deviation of around 0.7.
Further, the variation is considerable when we look for each country and year at the
average value of the reported constraint at the level of 4 digit NACE industry and across
firm size.
As we discuss later, we have also been able to construct a panel component of
approximately 1,300 firms that participated in both the 2002 and 2005 rounds of the
BEEPS. While relatively small, this panel data set is useful for a complementary analysis
to the pooled cross-sectional data set.13
13 To make the matching of the panel firms between 2002 and 2005 datasets possible, the latter includes the variable ‘seno2002’, comprising the serial numbers of the participating firms from the former survey.
13

4. Analytical framework
In analyzing the determinants of the efficiency with which the firms generate sales
revenue from inputs, we use an augmented Cobb Douglas revenue function
ititititiktkkit vTCIZxy εςθδρββ +++++++= ∑ lnln 0 , (1)
where yit represents the revenue of firm i in period t, x's represent the capital and labor
inputs, Zit is a vector of the business environment and structural variables (business
constraints, export orientation of the firm, extent of product market competition and firm
ownership), the I's, C’s and T’s denote a set of dummy variables for industries, countries
and years, respectively, vi is an unobserved time-invariant firm-specific effect that we
control for in some estimations, and εit is an independently distributed error term.
Equation (1) allows efficiency to vary across institutional and structural variables,
industries, countries and time.
Equation (1) represents our basic specification. We also have access to a measure
of material inputs which, however, is noisier than the measures of labour and capital.
However, to check the robustness of our results, we also estimate equation (1) with the
left hand side variable being the log of value added defined as the difference between
revenues and the material input variable. Moreover, as we discuss below, using the panel
data we are able to provide estimates of an ‘initial value’ equation in which we regress
the rate of change of revenues between 2002 and 2005 on the 2002-05 rate of change of
labour and capital and on the 2002 levels of the business environment constraints and the
structural variables (ownership, competition and export orientation).
14
In estimating equation (1), the question that naturally arises is how best to control
for the potential endogeneity/selection issues related to some of the explanatory variables.
In particular, given the nature of the privatisation process, firm ownership may not be
assigned at random, and there is generally a need to account for possible unobserved
heterogeneity and to isolate the effect of inputs, perceived business environment and
structural factors on a firm’s performance from the effects of performance on these
explanatory variables.14 We use an instrumental variable (IV) approach, noting that we
are fortunate that the BEEPS data contain a large number of firms as IV estimates are
consistent but not unbiased. However, controlling adequately for endogeneity is not an
easy task in survey data such as ours that do not come from a natural experiment. We use
several complementary approaches to estimate the average effect of the explanatory
variables on performance. First, for several key variables, the 2002 and 2005 samples
provide information on the rate of change between 1999 and 2002, and between 2002 and
2005, so that we can use lagged three-year differences in some of these variables as
potential instrumental variables for our cross sectional analysis of the 2002 and 2005
levels of variables. For each year in each firm, we also have data on the number of
workers with university and secondary education and following Marschak and Andrews
(1944) and Schmidt (1988), we can use the ratio of these two inputs (skill ratio) as an
instrumental variable.15 The use of a skill ratio relies on the exogeneity of the ratio of
wages of the more and less educated workers at the firm-level, and on variation in this
14 Gupta et al. (2000), for instance, show that better performing firms tend to be privatised first while Sabirianova et al. (2005) find that foreign firms acquire better-performing domestic firms. 15 The rationale for this instrument comes from economic optimization and an assumed exogeneity of input prices (wages). In particular, if the production function is Cobb-Douglas and the firm maximizes profit or minimizes cost, the first order conditions dictate that the ratio of inputs equal the ratio of input prices and technological parameters. If the firm is a price taker in the input market, the ratio of inputs reflects these exogenous factors.
15
wage ratio across regions and countries. Since firms in our survey operate in very
different regions and countries, the ratio of wages of workers with greater and lesser
education is likely to vary considerably across our observations.
Given that the bias of two-stage least squares is proportional to the degree of
over-identification, our approach has been to estimate the first stage regressions with as
few IVs as possible, while ensuring that the IVs have adequate explanatory power and
pass the over-identification tests. In particular, we start by estimating equation (1) in
levels on the pooled 2002 and 2005 samples of firms and we use as IVs the age and
location of the firm, the skill ratio interacted with the three main regions covered by our
data,16 the skill ratio interacted with firm age and the three regions, a three-year lagged
number of full time employees, the change in fixed assets in the preceding three years,
and the change in the export share over the preceding three years. We use these variables
as instruments for the levels of the capital and labour inputs, categories of ownership and
the export orientation of the firm. We find that these IVs are good predictors of all the
potentially endogenous variables and pass the J (Sargan) over-identification test.17 We
treat the extent of competition in the firm’s product market as exogenous to a given firm.
Finally, in order to assess the robustness of our results with respect to the business
environment (institutional) constraints, we have estimated these effects in several ways.
First, we have carried out estimations using the individual values of the constraints
directly as reported by the top managers of the interviewed firms. This approach has the
16 The regions are (a) Central Europe and Baltics, (b) the Commonwealth of Independent States (CIS), and (c) Southeastern Europe. 17 The summary statistics from the first stage estimates are reported in the tables with the second stage results. Complete results of the first stage regressions are available on request. Given the choice of IVs, the need to address the endogeneity issue is also indicated by the Hausman-Wu F tests and Durbin-Hausman-Wu Chi square tests that suggest that the null hypothesis of the exogeneity of the regressors is rejected in our data.
16

advantage that it provides a direct firm-specific measure and generates high variance in
the values of these variables, but it may generate biased estimates if a manager’s
perception of the severity of constraints is, for instance, influenced by the performance of
his/her firm.18 Second, in order to address this potential endogeneity bias, we have
carried out estimations in which we instrument the individual managers’ values of
constraints with the above mentioned, as well as other IVs. Third, we have used an
average value of each constraint reported by other firms, where the average is based on
responses either by all other firms in a given industry in each country and year, or by all
other firms of a given size in a given industry in each country and year. The advantage of
using the responses of other firms that are subject to the same external shocks is that the
value of the constraint is not affected by the firm’s own performance. It turns out that the
estimates based on all the above approaches are similar, with estimates based on the
average value of constraints reported by other firms of a given size in a given NACE 2
digit industry in each country and year being slightly more frequently significant than
others. Since our analysis suggests that the literature has overstated the significance of the
effect of business constraints on firm performance, in what follows we report the set of
estimates that are most likely to generate significant estimates of the business constraints
(i.e., provide the greatest support for the existing literature and go most against our
thesis), namely estimates based on the average values of constraints reported each year by
other firms within a given 2 digit industry and firm size category (small, medium and
large) in a given country. This approach gives both a considerable variation in the values
of constraints and a sufficient number of firms per cell to minimise problems associated
18 For example, managers of efficient firms operate near full capacity and feel constrained, while managers of poorly performing firms may have considerable unused capacity and do not find many constraints binding.
17

with potential measurement error. The standard errors of all estimates are clustered by
year, country, industry and firm size.
Our second approach is to use the smaller panel data set that we have constructed
from the 2002 and 2005 BEEPS surveys to explain the three-year rate of change in
performance. For this analysis we have over 600 firms and as we discuss below, the
sample is relatively representative of the larger cross section of firms. The panel data
generate broadly similar estimates as the entire pooled cross sectional sample, suggesting
that the panel dataset is a usable subset of the entire sample. Using the panel data we
estimate an equation in which we regress the rate of change of revenues between 2002
and 2005 on the 2002-05 rate of change of labour and capital, and on the 2002 levels of
the business environment constraints and structural variables. This ‘initial value’
regression parallels the specification used by Levine and Zervos (1998) at the macro level
and allows us to ask the question of how initial (2002) conditions affect the subsequent
(2002-05) rate of change of performance.19
As mentioned earlier, the principal variables whose performance effect we
analyse include the intensity of the various constraints reported by the firms, firm
ownership, the extent of competition faced by the firm, and the extent of exporting
carried out by the firm. In addition, coefficients on country dummy variables provide an
estimate of the effect on efficiency of the business environment at the country level. We
also apply a sector fixed effect in the estimations reported below and, where possible, a
year dummy.
19 This is about as far as we can go in estimation, however, since for most firms we have data on the percentage change in revenues between 2002 and 2005, but we lack 2002-05 rate of change observations for many of the explanatory variables. For instance, we cannot estimate equation (1) in first differences.
18

5. Effects of Ownership, Competition, Exports and Business Environment
5.1 Level of Efficiency
Table 2 contains our baseline IV estimates without the explanatory variables capturing
the business environment (institutional) constraints. These regressions use pooled data
from the entire 2002 and 2005 BEEPS and correspond to studies that have examined the
efficiency effects of exporting, competition and firm ownership. The number of
observations varies from 5,624 to 5,897, depending on specification, and the results are
therefore based on the largest data set available to us. All regressions include country,
year and sector fixed effects. State ownership serves as the reference and the coefficients
on other ownership categories hence reflect the log point differential effect relative to
state ownership.
Column 1 reports a base estimate where just the two factors – labour and capital –
are included. The labour coefficient is relatively small and not statistically significant but,
as we show presently, it is larger and significant in the more preferred models that we
run. Column 2 adds in the ratio of exports to sales and this variable enters positively and
significantly. Columns 3 and 4 introduce the competition variable – defined as 1 if the
firm has three or more competitors and 0 otherwise. Entered alone with the inputs the
coefficient is positive, but small and insignificant. This is also the case when competition
is entered alongside the export share and controlling for inputs. The coefficient on the
export share remains large and highly significant. Columns 5-8 introduce the ownership
variables. In these specifications the labour and capital coefficients are both positive and
statistically significant, and their sum approaches unity. It is of interest to note that the
coefficients on both the privatised and new private firms are negative and, in the latter
19
case, marginally significant in two of the four specifications. By contrast, foreign
ownership has a large and positive coefficient that is significant at the 1% level. The
positive effect of foreign ownership is maintained but the significance of the negative
effect of new private ownership disappears when the export share and competition
variables are entered. Interestingly, when we control for ownership, the export share
variable loses all significance. In Columns 7 and 8, where most or all the explanatory
variables are entered simultaneously, we find that competition has a small, positive and
significant (at 10-11% level) impact on performance with foreign ownership exerting a
strong and positive impact on performance as well. Being privatised or being a new
private firm remains negatively signed but insignificant relative to the reference of state-
owned firms. The augmented specifications in Columns 5-8 also generate acceptable
values of the J and F tests related to the selection of IVs in the first stage of estimation.
Our preferred (all-encompassing) specification in Column 8 points to the importance of
foreign ownership and to a lesser extent competition on performance. The corresponding
value added regressions, reported in Appendix Table A1, yield qualitatively similar
results except that the estimated coefficient on competition, while positive, is not
statistically significant. (In what follows, we do not report additional value added
regressions because they generate results that are similar to those in the revenue
regressions.)
Having estimated the base performance equation, we proceed to considering
directly the impact of business environment constraints on firm performance. As
mentioned above, for each constraint we use the average of responses of other firms in
the same 2 digit sector, firm size (small, medium and large), country and year throughout
20

the analysis, with the other unreported specifications yielding similar results. Entering all
15 categories of constraints invariably yields insignificant estimates and the question
naturally arises as to whether collinearity across constraints induces this insignificance of
results. We have examined the relationships among the various constraints and we report
the key findings in Tables A2 and A3 in the Appendix. As may be seen from the
correlation matrix in Table A2, most constraints are not highly correlated, although
several pairs display high correlation (e.g., access to financing and cost of financing, tax
rates and tax administration, uncertainty about regulatory policies and macroeconomic
instability, and street crime and organized crime). This pairwise correlation is also
detected in an ANOVA regression that we have run to assess the extent to which the
variation in the value of any given constraint can be explained by the other constraints. In
what follows, we enter only one of these pairwise correlated constraint variables, noting
that it generally does not matter which of the two is entered. We also exclude the
constraint related to labour regulation as it is almost completely explained by the
interaction of country and year fixed effects and hence insignificant. This leaves us with
nine constraints whose effects we analyze in the remainder of the paper. As may be seen
from Table A3, the partial correlation coefficients among these nine constraints are
relatively low and the total R squared in the reported regressions of each constraint on
others is at or below 0.4 in all except one regression (corruption), where it is at 0.48.
When we add country, year and sector fixed effects to the regressions in Table A3, we
increase the R squared in the constraints regressions to 0.41-0.57. Finally, adding all
other regressors from the IV revenue regressions raises the R squared to 0.44-0.73.
21

Collinearity among the constraints is hence limited but becomes somewhat more
pronounced for some constraints when all the regressors are considered simultaneously.
Table 3 provides a first pass at including the nine constraints in the performance
regression -- individually (Columns 1-9), as an average of all nine constraints (Column
10) and with all nine constraints entered together (Column 11). Despite the obvious
omitted variable problem, we report the specifications with the constraints entered one at
a time because this approach has been used frequently in the literature and much of the
accepted wisdom on the effects of institutions and regulation on performance derives
from these types of specifications. In line with a large part of the literature, the
regressions in Table 3 are without country, year and sector fixed effects (note that this
model appears to be mis-specified compared to a model that includes these fixed effects
(Table 4 below) in that the labour coefficient is small and insignificant, and the p values
on the J test are very small). It can be seen that when entered individually, all except one
of the constraints enter negatively – as would be expected - and most are significant at
1% or 5% levels. In these specifications, we hence replicate the conventional wisdom
obtained in many studies that the business/institutional environment matters. The
regression with the average value of all nine constraints, proxying the overall severity of
the business environment, also yields a negative and statistically significant coefficient.
When all the constraints are entered simultaneously in the IV estimation in Table 3,
however, the infrastructure and to a lesser extent tax rate and macro instability constraints
remain negative and significant, but others lose significance or, in the case of crime, theft
and disorder, become positive and significant. Hence, when we correct at least in part for
the possible omitted variables problem, the negative effect of most business environment
22

constraints on performance disappears. As may be seen from Table A4 in the appendix,
the corresponding OLS estimates are very similar for the individually entered constraints
(Columns 1-10) and they differ only slightly when all the constraints are entered
simultaneously (Column 11) in that 4 of the 9 constraints retain a negative coefficient.
Table 4 repeats the same exercise but includes country, year and sector fixed
effects whose omission may have biased the estimates in Table 3. In this case, the
significance of the coefficients on inputs, ownership, exports and competition correspond
to those in the base estimations in Table 2 – foreign ownership and having three or more
competitors exert a positive and significant impact, while export orientation does not and
the effect of new private firms becomes negative and statistically significant in some
specifications. However, the picture changes substantially with respect to the business
environment constraints. While most of the constraints terms entered individually retain
their negative sign, only one – corruption -- is significant. The effect of the average of all
constraints, reported in Column 10, is statistically insignificant, as are all the constraint
coefficients in Column 11 where all constraints are entered simultaneously. The
corresponding OLS estimates in Table A5 are similar in that only one constraint – this
time crime – has a significant negative coefficient when the constraints are entered
individually, and only one has a significant (but positive) coefficient when all the
constraints are entered simultaneously. An examination of the role played by the country,
year and sector effects indicates that it is the country as well as country cum year fixed
effects in particular that serve to knock out the significance of the individual (and in the
case of OLS also the jointly entered) constraints. Hence, once we control for country-
23

wide differences in the ‘business environment’ (together with aggregate shocks and other
effects), the negative effects of most constraints disappear.
We have also extended the analysis by looking at the possible impact that
interactions of constraints might have on performance, in line with recent explorations in
the development literature (see e.g., Aghion et al., 2005, 2006). The intuition here is that,
say, corruption may or may not have a direct impact itself, but it may exert an effect
through its association with other constraints related to government policies and
regulations, such as the functioning of the judiciary, uncertainty about regulatory policies,
labour regulations, business licensing, and tax administration and tax rates. To explore
whether this is indeed the case we have augmented the base model with interactions of
constraints that may be hypothesised to be related. For example, in Table 5 we report the
results of interacting corruption with functioning of the judiciary, uncertainty about
regulatory policies, labour regulations, business licensing, and tax administration and tax
rates. As may be seen from the table, neither when the interactions are entered one at a
time, nor when they are all entered simultaneously, do we find statistically significant
results. The results in Table 5 are representative in that we were unable to find any robust
evidence for other interactions either.
In another set of extensions, we have explored the idea of heterogeneity across
regions and examined whether significant results can be obtained if we estimate the
models separately within each of the three main regions covered by our data – Central
Europe and the Baltics (CEB), South-eastern Europe (SEE) and the CIS. The findings
from these estimations allow the slope coefficients to vary by region and they are similar
to those presented for the sample as a whole. When the country, year and sector fixed
24

effects are excluded, few constraints are significant and a number of the signs are
counter-intuitive. When the country, year and sector fixed effects are included, virtually
all constraints lose significance.
One important result that we are obtaining in our analysis is that country
differences, presumably in the overall business environment but also in other aspects,
matter for firm performance while the within-country cross-firm differences do not.
Closer inspection of the country fixed effects reveals that while not all are significant, the
ranking of countries that occurs corresponds to a significant extent to what might be
expected from other indicators, such as the EBRD transition indicators.20 That is, the
ranking for instance mostly confirms that firms in the Central European countries have
higher average levels of efficiency than either those from SEE or the CIS. However, the
rankings are not stable and have a number of unexpected features. For instance, Serbia
and Macedonia consistently rank above the most economically advanced (EU accession)
countries such as the Czech Republic, Hungary and Poland. This suggests that the
country effects are also capturing other sources of heterogeneity, such as differences in
accounting and reporting systems. For these very reasons, it is desirable to control for
country effects, realizing that they capture many features of heterogeneity, rather than
excluding them or attributing the cross-country heterogeneity to just a single factor, such
as a particular aspect of the business environment.
5.2 Using Heritage Foundation and Doing Business Indicators
In view of our findings based on manager perceptions of the business environment, a
question arises as to whether the findings are robust in that other measures of the 20 See EBRD Transition Reports
25

business/institutional environment would produce similar results. To answer this
question, we have examined the effects that widely used indices of the business
environment and institutions have when combined with our firm-level data.21 In
particular, we have merged our firm-level data with the 10 indices of economic freedom
produced by the Heritage Foundation – trade tariffs, tax rates, government intervention,
monetary policy (inflation), restrictions on foreign direct investment, banking/finance
sector restrictions, wage/price controls, property rights issues, business and other
regulations, and the extent of informal markets. As an alternative, we have also used 12
of the Doing Business indicators produced by the World Bank. These are, the number of
procedures to register a business, time to register a business, cost of registering a
business, rigidity of employment regulations, restrictions on firing workers, cost of firing
a worker, number of procedures to enforce a contract payment after default, time to
enforce a contract payment after default, cost of enforcing a contract payment after
default, time to effectuate bankruptcy, cost of effectuating bankruptcy, and recovery rate
in a bankruptcy. The Heritage Foundation indices are measured on a 1-5 scale (1 =
best/most free and 5 = worst/least free), while the Doing Business indicators are on a 1-
100 scale or have a natural value (days, number of procedures, etc.). The data for the
Heritage Foundation relate to 2001 and 2004, while those for Doing Business were
published in 2003 and 2006 (and collected mostly in 2002 and 2005).22
When we enter the Heritage Foundation indices of regulation one at a time into
our OLS regressions without country, industry and year fixed effects, the indices all
produce the expected negative effects of regulation/constraints on firm performance, as
21 We would like to thank John DiNardo for suggesting this analytical extension to us. 22 “Doing Business” was first published in 2003.
26

does a simple average index of these 10 indices (columns 1-10 in Appendix Table A6).
When the ten indices are entered simultaneously in column 11 of Table A6, five retain
negative coefficients, two coefficients turn positive, and three become statistically
insignificant. Our data hence reproduce the traditional result that when the Heritage
indicators are entered one at a time in an OLS regression, they show a strong negative
effect of regulation on performance. The effects are quite mixed, however, when the
indicators are entered jointly.
A major empirical and policy issue arises from the fact that the values of the
individual Heritage Foundation indicators are highly correlated over time. For the two
years that we use, these indicators for our 27 countries have a correlation that ranges
between 0.91 (government intervention) and 0.99 (business and other regulation). This
means that the indicators are close to being indistinguishable from country fixed effects.
Indeed, when we run the OLS regressions with country, industry and year fixed effects,
and the Heritage Foundation indicators are entered one at a time, two of the ten indicators
retain negative coefficients, one becomes positive and seven become statistically
insignificant (columns 1-10 in Appendix Table A7). When all the indicators are entered
simultaneously, two coefficients are negative, three are positive and five are insignificant
(column 11 in Table A7).
When we use the Heritage Foundation indicators in our IV regressions, with or
without country, industry and year fixed effects, the coefficients of the individual
Heritage Foundation indicators all become insignificant when entered individually, and
they produce three negative, one to three positive and four to six insignificant coefficients
when entered simultaneously. Moreover, the coefficients that are negative are not the
27
same ones in the various specifications. For the sake of brevity, we report in Table 6 the
results for the IV estimation with country, industry and year fixed effects, noting that the
estimates in the regressions without these fixed effects are similar. In sum, specifications
other than a simple OLS model with each Heritage Foundation constraint entered
individually basically fail to generate the expected negative effect of
regulation/constraints indicators on firm performance.23
As may be seen from Appendix Table A8, when we use the Doing Business
indicators and enter them one at a time, the OLS regressions without country, industry
and year fixed effects generate seven coefficients that are negative, three that are positive
and two that are statistically insignificant. When all the business environment indicators
are entered simultaneously, six coefficients are negative, five are positive and one is
statistically insignificant. In these “basic” specifications, the Doing Business indicators
hence generate less support for the expected negative effects of regulations/constraints on
firm performance than the Heritage Foundation indices.
The Doing Business indicators are potentially more interesting than the Heritage
Foundation indices for the fixed effects regressions, however, because some are less
correlated over time -- the correlation coefficients range from 0.84 for time to start a
business to almost 1.0 for contracts procedures. Yet, as may be seen from Appendix
Table A9, when we enter the Doing Business indicators individually into the OLS
regressions with country, industry and year fixed effects, four coefficients are negative,
23 The power of the tests is obviously low in those instances when we are exploiting the limited variation in the values of these indices over time and one might not be rejecting the null hypothesis of no effects of the constraints even when this null hypothesis is false. The point that we are making is simply that with the indicators at hand one does not generate the expected negative effect when controlling for cross-country heterogeneity.
28

one is positive and seven are statistically insignificant. When we enter the indicators
simultaneously, three are negative and nine are insignificant. Of the three indicators that
have a correlation of the 2003 and 2006 values below 0.9 (time to register a business, cost
of registering a business, and restrictions on firing workers), two generate a negative
effect and one a positive effect when entered individually, while one produces a negative
coefficient and two produce an insignificant coefficient when entered simultaneously.
The OLS results in Appendix Table A9 are hence quite mixed and do not provide much
support for the hypothesis that greater regulation impedes firm performance.
When we introduce the Doing Business indicators into our IV regressions, we
obtain similarly mixed results. In the specification with country, industry and year fixed
effects (Table 7), only four of the twelve indicators generate the expected negative
coefficients. In the IV regressions without fixed effects (not reported in tabular form
here) only two of the twelve indicators have negative effects. Moreover, the indicators
with the negative coefficients are not the same ones across specifications.
Overall, our results indicate that the widely used country-level indicators of
business/institutional environment do not provide much evidence of a negative
relationship between constraining environment and firm performance. Some of these
indicators, particularly the Heritage Foundation indices, produce evidence consistent with
this hypothesis in the simplest OLS specifications when the indices are entered one at a
time, but not in the specifications when the indices are entered jointly or models that
control for other relevant factors.
29

5.3 Rate of Growth of Revenues
Having looked at the effects of the constraints and the structural variables capturing
ownership, export orientation and competition on the level of revenue efficiency, we next
address the question of whether these variables have any effect on the rate of change in
the revenue efficiency of firms. These “initial value” regressions are estimated on the
smaller number of firms in the panel data set. We have checked the comparability of the
panel to the larger data set by comparing summary statistics and we have also replicated
on the panel data the same base estimations as we present for the pooled cross sectional
data in Table 2. These base estimations performed on the panel data are reported in
Appendix Table A10.
In Table 8 we report the results of relating the 2002-05 rate of change of real sales
revenues to the lagged (2002) levels of the ownership, competition, export orientation,
and constraint variables, controlling for the rate of change in labour and capital over the
same period. By construction, these “initial value” regressions eliminate the possibility
that the relationship between efficiency, constraints and the structural variables is brought
about by contemporaneous shocks to these variables. Estimation in this instance is by
OLS with country, sector and year fixed effects included. While foreign ownership enters
positively and the coefficient on new private ownership tends to be negative as before,
we do not find evidence for any type of ownership having a statistically significant
impact on the rate of change of performance. Export orientation enters positively and is
statistically insignificant, and we are unable to find any impact from competition. As to
the business/institutional constraints, none of the variables generate a significant negative
effect, whether entered individually or jointly and the size of the estimated coefficients
30
tends to be small. We hence find no evidence that the level of perceived constraints
matters for subsequent rate of change of performance. In particular, the different aspects
of the business environment, as measured by these reported constraints, do not affect the
subsequent rate of change of efficiency with which firms generate revenue from inputs.
6. Conclusions
It has become almost fashionable in recent years to argue that the business environment
plays a major role in determining the overall strength of a given economy, primarily
through its impact on the performance of firms. ’Bad’ business environments –
commonly characterised as those in which, for example, corruption and regulation is high
and where there is pervasive uncertainty with respect to taxation, business licensing or
even macroeconomic policy -- are widely believed to cause poor economic performance.
The evidence for such conclusions has indeed been drawn from a variety of sources,
including cross-country estimations of growth but also, increasingly, from firm level
surveys that have gathered subjective information on perceived constraints to activity
emanating from the business environment. However, while the general thrust of the
argument – that the business environment is an important determinant of economic
performance – carries considerable intuitive appeal, the importance of establishing the
hypothesised relationship through careful analysis of data cannot be emphasised enough.
A similar reasoning applies to the relatively broadly accepted notion that private
ownership of basically any kind generates superior performance to state ownership of
firms. Indeed, a certain amount of the recent research in this area using aggregate and
firm-level survey evidence may be misleading through its reliance on relatively simple
31
econometric implementation that may suffer from biases due to omitted variables,
measurement error and endogeneity.
In this paper we have addressed the challenge by using firm-level information – in
this case the large BEEPS dataset – to analyze the performance effects of firm’s
ownership, competition, export orientation and the business (institutional) environment.
To that end, we have employed a variety of approaches, including instrumental variables
and using average values of constraints reported by other firms with similar
characteristics. We find that there is evidence that ownership and competition exert an
impact on performance, but the results differ from much of the earlier literature in that
foreign ownership of firms has a positive effect on performance but domestic private
ownership does not. Export orientation of the firm is found to have a positive effect on
performance in simple specifications but the effect disappears once firm ownership is
taken into account. When we examine the impact of perceived business environment
constraints, we find that few retain explanatory power, in either IV or OLS specification,
once they are entered simultaneously rather than one at a time, or once country, year and
sector fixed effects are introduced. Indeed, country fixed effects largely absorb the
explanatory power of the constraints in all specifications. In neither the level equations
nor in the “initial value” rates of change regressions can we identify any strong and
robust effects of these variables. The lack of a detectable effect of the reported severity of
various constraints in the business environment could reflect the fact that (a) firms can
get around these constraints at a relatively low cost and the effect is hence not detectable
in the data (e.g., the firms must pay a bribe to obtain a license but the cost of the bribe is
small), or (b) managers who face severe constraints compensate for the presence of these
32

constraints and report lower severity than is actually the case (e.g., firms that need more
acutely external financing “pre-save” from retained earnings in the presence of financing
constraints and report lower severity of the financing constraint than is in fact the case
because they pre-saved and do not need as much external financing as they would
otherwise). Since we observe significant variation in reported constraints across firms,
the latter phenomenon (compensating for constraints) may reduce the observed effect of
constraints but should not eliminate it altogether.
In order to see if the overall results are brought about by some peculiarity of our
business environment data, we have also replicated the level equations using the country-
level indicators of the business environment provided by the Heritage Foundation and the
World Bank. We again do not detect a systematic relationship between constraints and
performance.
Overall, we show that country effects, reflecting differences in the business
environment but also other factors, matter for firm performance but that differences in the
business environment constraints observed across firms within countries do not.
Moreover, the limited firm- and country-level variations in the business environment over
time do not appear to affect performance either. A closer inspection of the country fixed
effects reveals that they are to some extent correlated with the expected differences in
corporate performance but that they are also likely to be capturing other sources of cross-
country heterogeneity. Our analysis hence brings into question an important part of the
conventional wisdom in this area. It suggests that the effect of business environment on
performance and the analysts’ ability to identify this effect are more limited than has been
widely assumed in the analytical and policy work to date. It indicates that it is important
33

to control for country effects, realizing that they capture many features of heterogeneity,
rather than excluding them or attributing the cross-country heterogeneity to just a single
factor such as the business (institutional) environment.
34

References
Aghion, P., Richard Blundell, Nick Bloom, Rachel Griffith, and Peter Howitt (2005), “Competition and Innovation: An Inverted U Relationship,” Quarterly Journal of Economics, Vol. CXX, No. 2, 701-728. Aghion, P., Robin Burgess, S. Redding, and F. Zilibotti (2006), “The Unequal Effects of Liberalization: Evidence from Dismantling the Licence Raj in India,” Mimeo, Harvard University. Beck, T., A. Demirguc-Kunt and V. Maksimovic (2005), “Financial and Legal Constraints to Growth: Does Firm Size Matter?, Journal of Finance, Vol. LX, No. 1, February, 137-177. Blanchard, O.J. (1998), The Economics of Post-communist Transition, Oxford University Press, Oxford. Botero, J, S. Djankov, R. La Porta, F. Lopez de Silanes, A. Shleifer, (2004), “The Regulation of Labor”, Quarterly Journal of Economics, Vol. 119, No.4, 1339-1382. Carlin, W. (2000), “Empirical analysis of corporate governance in transition”, in E. Rosenbaum, F. Bönker, H.-J. Wagener (eds.) (2000), Privatisation, Corporate Governance and the Emergence of Markets, Macmillan, Basingstoke/London. Carlin, W., S. Fries, M. Schaffer and P. Seabright (2001), “Competition, restructuring and firm performance: evidence of an inverted-U relationship from a cross country survey of firms in transition economies”, CEPR Discussion Paper No. 2840. Carlin, W., S. Fries, M. Schaffer and P. Seabright (2004), “A Minimum of Rivalry: Evidence from Transition Economies on the Importance of Competition for Innovation and Growth”, The B.E. Journal of Economic Analysis & Policy, Vol. 3, No. 1, Article 17. Carlin, W., M. Schaffer and P. Seabright (2006), “Where are the real bottlenecks? A Lagrangian approach to identifying constraints on growth from subjective survey data”, CEPR Discussion Paper 5719. Claessens, S. and S. Djankov (1999a), “Enterprise performance and management turnover in the Czech Republic”, European Economic Review, Vol. 43, Nos. 4-6, 1115–24. Claessens, S. and S. Djankov (1999b), “Ownership concentration and corporate performance in the Czech Republic”, Journal of Comparative Economics, Vol. 27, No. 3, 498–513.
35
Djankov, S. and P. Murrell (2002), “Enterprise restructuring in transition: a quantitative survey”, unpublished Working Paper, World Bank. Dollar, D., M. Hallward-Driemeier and T. Mengistae (2005), “Investment climate and international integration”, World Bank Working Paper, December. Durnev, A. and H. Kim (2005), “To Steal or Not to Steal: Firm Attributes, Legal Environment, and Valuation,” Journal of Finance, Vol. LX, No. 3, 1461-93. Durnev, A., K. Li, R. Morck and B. Yeung (2004), “Capital markets and capital allocation: implications for economies in transition”, Economics of Transition, Vol. 12, No. 4, 593-634. Estrin, S, J. Hanousek, E. Kocenda, and J. Svejnar (2007), “Privatization in Central-East Europe and the CIS,” Mimeo, University of Michigan-LSE-CERGE-EI. Frydman, R., C. Gray, M. Hessel and A. Rapaczynski (1999), “When does privatization work? The impact of private ownership on corporate performance in the transition economies”, Quarterly Journal of Economics, Vol. 114, No. 4, 1153–91. Gupta, N., J. C. Ham and J. Svejnar (2000), “Priorities and sequencing in privatisation: Theory and evidence from the Czech Republic”, William Davidson Institute Working Paper No. 323, University of Michigan, Stephen M. Ross Business School. Hallward-Driemeier, M., S.J, Wallstein and L.C. Xu, (2006) “Ownership, Investment Climate and Firm Performance”, Economics of Transition, Vol. 14, No. 4, 629-647. Hanousek, J., E. Kocenda and J. Svejnar (2007), “Origin and concentration: Corporate ownership, control and performance”, Economics of Transition, Vol. 15, No.1. Hausmann, R., D. Rodrik and A. Velasco (2004) “Growth diagnostics“, Harvard University, Kennedy School, mimeo. Johnson, S., J. McMillan and C. Woodruff (2002a), “Property Rights and Finance”, American Economic Review, Vol. 92, No. 5, December. Johnson, S., J. McMillan and C. Woodruff (2002b), “Courts and Relational Contracts”, Journal of Law, Economics and Organisation, Vol. 18, No. 1, 221-277. Kaufmann, D., A. Kraay and P. Ziodo-Lobaton (1999), “Governance Matters”, World Bank Policy Research Working Paper 2196, World Bank, Washington DC, October. Kaufmann, D., (2002), “Governance Crossroads” in Global Competitiveness Report, 2002-2003, World Economic Forum, Oxford University Press.
36

Klapper, L., and I. Love, (2004), “Corporate Governance, Investor Protection and Performance in Emerging Markets”, Journal of Corporate Finance, Vol. 10, No.5, November, 703-728. Levine, S. and S. Zervos (1998), “Stock Markets, Banks and Growth”, American Economic Review, Vol. 88, No. 3, 537-558, June. Marschak, J. and W.H. Andrews (1944), “Random Simultaneous Equations and the Theory of Production”, Econometrica, Vol. 12, No. 3-4, July-October, 143-205. Micco, Alejandro and Carmen Pages (2006) “The Economic Effects of Employment Protection: Evidence from International Industry-Level Data”, IZA Discussion Paper No. 2433. Mitra, P and Ruslan Yemtsov (2006) “Poverty and Inequality in the Transition” Paper presented at the ABCDE Conference, World Bank, St. Petersburg, January 18. Nickell, S. (1999) “Competition and Corporate Performance,” Journal of Political Economy, Vol. 105, August 724-46. Pissarides, F., M. Singer and J. Svejnar (2003), “Objectives and Constraints of Entrepreneurs: Evidence from Small and Medium Size Enterprises in Russia and Bulgaria”, Journal of Comparative Economics, September, Vol. 31, No. 3, 503-531. Rajan, R. and L. Zingales (1998), “Financial Development and Growth”, American Economic Review, Vol. 88, No. 3, 559-586, June. Sabirianova, K., J. Svejnar and K. Terrell (2005), “Distance to the Efficiency Frontier and Foreign Direct Investment Spillover,” Journal of the European Economic Association Papers and Proceedings 3, No. 2-3 (April-May) 576-586. Sabirianova, K., J. Svejnar and K. Terrell (2005), “Foreign investment, corporate ownership and development: Are firms in emerging markets catching up to the world standard?”, IZA Discussion Paper No. 1457. Schmidt, P. (1988), “Estimation of a Fixed-Effect Cobb-Douglas System Using Panel Data,” Journal of Econometrics, Vol. 37, 361-380. Tybout, J. (2003), “Plant and Firm-level evidence on the ‘new’ trade theories”, in E. Kwan Choi and J. Harrigan (editors), “Handbook of International Trade”, Basil Blackwell, Oxford.
37
2002 2005Obs Mean Std. Dev. Obs Mean Std. Dev.
Panel A: Summary Statistics
Sales 4504 2290 10428 6665 3376 17503Employment 6122 143 505 9097 105 364Fixed Assets 3388 2384 33893 4637 1622 10582Number of Competitors 6029 0.82 0.39 8479 0.82 0.39Ownership [Privatization] 6153 0.15 0.36 9098 0.14 0.35Ownership [New Private] 6153 0.55 0.50 9098 0.66 0.47Ownerschip [State] 6153 0.14 0.35 9098 0.09 0.28Ownership [Other] 6153 0.02 0.12 9098 0.01 0.09Ownership [Foreign] 6153 0.14 0.35 9098 0.10 0.30Exports as % of Sales 6055 11.16 25.05 9039 8.76 22.34Workforce Ratio: University / Secondary Education 5289 1.36 4.67 6930 1.24 3.83Company Age 6153 14.70 18.70 9090 15.55 17.46University / Secondary Education x Age 5289 19.47 114.49 6925 22.84 124.76Permanent Employment 3 years ago 6066 134.73 501.85 8967 101.51 405.07Parttime Employment 3 Years ago 5872 6.96 44.21 8873 5.65 31.70% change in Fixed Assets (3 year period) 5717 16.30 46.66 8787 11.90 32.17% change in Exports (3 year period) 6026 5.44 33.76 9030 4.44 29.81% change in Employment (3 year period) 6059 34.89 135.99 8967 30.30 133.53% change in Sales (3 year period) 5832 21.69 62.74 8764 12.99 39.25% change in Sales per Worker (3 year period) 5753 14.69 74.90 8645 12.35 89.17
Panel B: Average number of Competitors
Construction 772 2.85 0.39 443 2.86 0.41Manufacturing 1463 2.72 0.49 2161 2.75 0.49Transport, Storage & Communic 474 2.72 0.52 339 2.79 0.47Wholesale & Retail Trade 1847 2.88 0.34 949 2.84 0.40Real Estate Renting & Business Services 637 2.82 0.41 396 2.82 0.45Other Services 768 2.81 0.43 317 2.74 0.53Others 68 2.53 0.63 60 2.53 0.68
Panel C: Share of companies taking initiatives
Change main supplier 6079 0.28 0.45 9098 0.28 0.45Change main customer 6096 0.23 0.42 9098 0.22 0.41Export to new country 6153 0.13 0.34 9098 0.10 0.30Develop major new product 6153 0.39 0.49 9098 0.35 0.48Upgrading an existing product 6153 0.52 0.50 9098 0.51 0.50Discontinued at least 1 product 6110 0.21 0.41 9098 0.16 0.37Joint venture with foreign partner 6153 0.09 0.28 9098 0.04 0.20New product licensing agreement 6153 0.19 0.39 9098 0.13 0.34Outsorced a major production 6106 0.08 0.28 9098 0.08 0.27Quality accreditation 6153 0.14 0.35 9098 0.12 0.33None of the previous 6149 0.15 0.36 9098 0.23 0.42Brought in-house a major production 6109 0.08 0.28 9098 0.07 0.26Opening new plant 6110 0.14 0.35 n.a n.a n.aClose existing plant 6103 0.12 0.32 n.a n.a n.aIntroduced a new technology 6115 0.30 0.46 n.a n.a n.a
Panel D: Average constraints
Access to financing 5810 2.33 1.16 8647 2.26 1.14Cost of financing 5864 2.53 1.13 8698 2.51 1.13Tax rates 6060 2.76 1.11 8951 2.75 1.10Tax administration 5953 2.54 1.14 8895 2.47 1.13Custom/foreign trade regulations 5649 2.04 1.12 8267 1.91 1.07Business licencing & permit 5906 2.02 1.08 8776 1.98 1.04Labour regulations 5946 1.74 0.94 8886 1.87 0.98Uncertainty about regulatory policies 6000 2.85 1.09 8819 2.53 1.12Macroeconomic instability 5998 2.76 1.11 8823 2.52 1.12Functioning of the judiciary 5728 2.06 1.08 8417 2.06 1.10Corruption 5713 2.24 1.16 8497 2.16 1.14Street crime theft & disorder 5857 1.96 1.07 8661 1.82 1.01Organised crime mafia 5663 1.81 1.09 8394 1.64 0.97Anti-competitive practices 5871 2.25 1.11 8739 2.30 1.11Infrastructure 6122 1.54 0.70 9043 1.54 0.73Average of all constraints 6134 2.24 0.67 9064 2.17 0.66* n.a.: information not available
Table 1: Descriptive Statistics
1
38
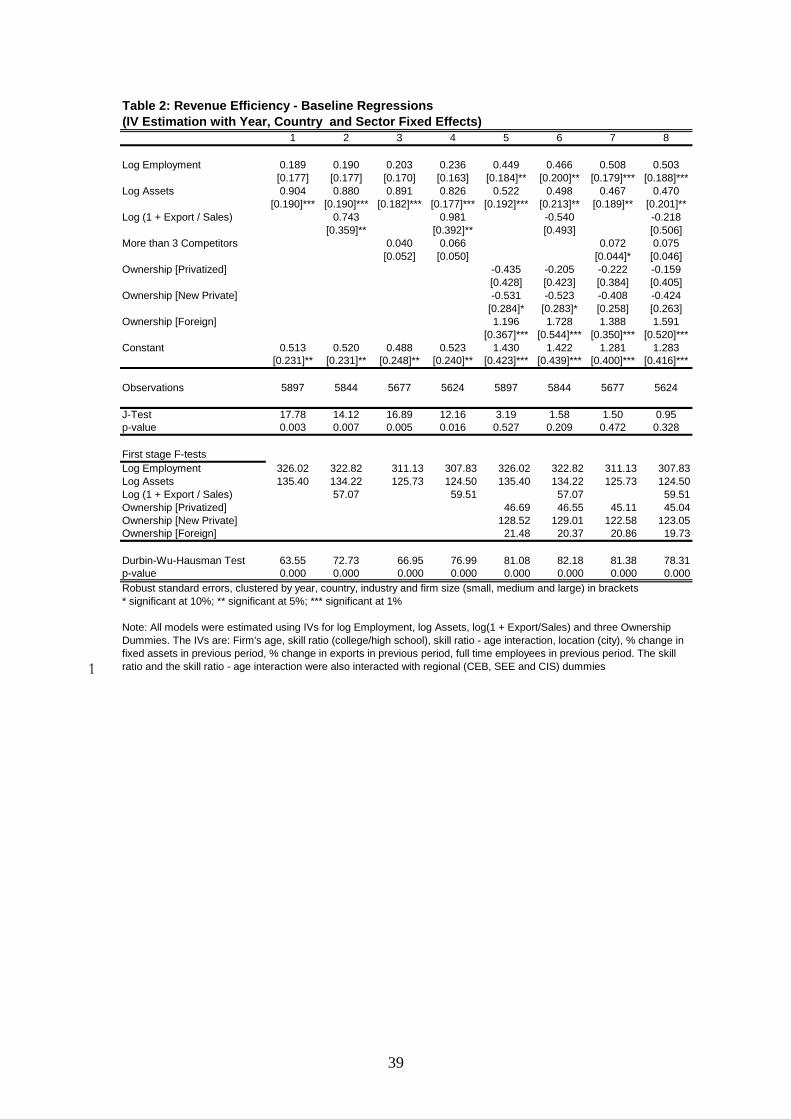
1 2 3 4 5 6 7 8
Log Employment 0.189 0.190 0.203 0.236 0.449 0.466 0.508 0.503[0.177] [0.177] [0.170] [0.163] [0.184]** [0.200]** [0.179]*** [0.188]***
Log Assets 0.904 0.880 0.891 0.826 0.522 0.498 0.467 0.470[0.190]*** [0.190]*** [0.182]*** [0.177]*** [0.192]*** [0.213]** [0.189]** [0.201]**
Log (1 + Export / Sales) 0.743 0.981 -0.540 -0.218[0.359]** [0.392]** [0.493] [0.506]
More than 3 Competitors 0.040 0.066 0.072 0.075[0.052] [0.050] [0.044]* [0.046]
Ownership [Privatized] -0.435 -0.205 -0.222 -0.159[0.428] [0.423] [0.384] [0.405]
Ownership [New Private] -0.531 -0.523 -0.408 -0.424[0.284]* [0.283]* [0.258] [0.263]
Ownership [Foreign] 1.196 1.728 1.388 1.591[0.367]*** [0.544]*** [0.350]*** [0.520]***
Constant 0.513 0.520 0.488 0.523 1.430 1.422 1.281 1.283[0.231]** [0.231]** [0.248]** [0.240]** [0.423]*** [0.439]*** [0.400]*** [0.416]***
Observations 5897 5844 5677 5624 5897 5844 5677 5624
J-Test 17.78 14.12 16.89 12.16 3.19 1.58 1.50 0.95p-value 0.003 0.007 0.005 0.016 0.527 0.209 0.472 0.328
First stage F-testsLog Employment 326.02 322.82 311.13 307.83 326.02 322.82 311.13 307.83Log Assets 135.40 134.22 125.73 124.50 135.40 134.22 125.73 124.50Log (1 + Export / Sales) 57.07 59.51 57.07 59.51Ownership [Privatized] 46.69 46.55 45.11 45.04Ownership [New Private] 128.52 129.01 122.58 123.05Ownership [Foreign] 21.48 20.37 20.86 19.73
Durbin-Wu-Hausman Test 63.55 72.73 66.95 76.99 81.08 82.18 81.38 78.31p-value 0.000 0.000 0.000 0.000 0.000 0.000 0.000 0.000Robust standard errors, clustered by year, country, industry and firm size (small, medium and large) in brackets* significant at 10%; ** significant at 5%; *** significant at 1%
Table 2: Revenue Efficiency - Baseline Regressions (IV Estimation with Year, Country and Sector Fixed Effects)
Note: All models were estimated using IVs for log Employment, log Assets, log(1 + Export/Sales) and three Ownership Dummies. The IVs are: Firm's age, skill ratio (college/high school), skill ratio - age interaction, location (city), % change in fixed assets in previous period, % change in exports in previous period, full time employees in previous period. The skill ratio and the skill ratio - age interaction were also interacted with regional (CEB, SEE and CIS) dummies 1
39

1 2 3 4 5 6 7 8 9 10 11Log Employment 0.079 0.067 0.064 0.079 0.081 0.088 0.044 0.063 0.077 0.073 0.109
[0.100] [0.102] [0.103] [0.109] [0.108] [0.106] [0.109] [0.108] [0.103] [0.101] [0.118]Log Fixed Assets 0.941 0.963 0.97 0.947 0.945 0.953 0.965 0.968 0.942 0.948 0.899
[0.080]*** [0.082]*** [0.081]*** [0.089]*** [0.090]*** [0.089]*** [0.090]*** [0.092]*** [0.086]*** [0.080]*** [0.102]***Ownership [Privatized] 0.789 0.758 0.834 0.806 0.924 1.016 0.801 0.94 0.642 0.752 0.371
[0.671] [0.708] [0.743] [0.737] [0.765] [0.747] [0.754] [0.731] [0.729] [0.658] [0.756]Ownership [New Private] 0.05 0.096 0.121 0.049 0.143 0.229 0.002 0.18 0.011 0.041 -0.14
[0.446] [0.434] [0.439] [0.453] [0.456] [0.441] [0.457] [0.449] [0.434] [0.423] [0.445]Ownership [Foreign] 2.416 2.542 2.456 2.563 2.719 2.653 2.684 2.764 2.446 2.45 2.101
[0.871]*** [0.872]*** [0.901]*** [0.853]*** [0.899]*** [0.902]*** [0.887]*** [0.913]*** [0.877]*** [0.821]*** [0.940]**Log (1 + Export / Sales) -1.51 -1.673 -1.632 -1.557 -1.756 -1.662 -1.737 -1.694 -1.565 -1.557 -1.37
[0.776]* [0.805]** [0.820]** [0.805]* [0.840]** [0.835]** [0.852]** [0.835]** [0.813]* [0.761]** [0.880]More than 3 Competitors 0.134 0.114 0.135 0.13 0.122 0.119 0.155 0.121 0.152 0.137 0.164
[0.076]* [0.076] [0.075]* [0.079]* [0.077] [0.076] [0.079]* [0.080] [0.074]** [0.074]* [0.078]**Cost of Financing -0.123 -0.007
[0.056]** [0.060]Infrastructure -0.287 -0.238
[0.090]*** [0.092]***Tax Rates -0.204 -0.127
[0.062]*** [0.065]*Customs / Foreign Trade Regulations -0.113 0.061
[0.060]* [0.065]Business Licencing & Permits -0.137 -0.067
[0.063]** [0.066]Macroeconomic Instability -0.134 -0.11
[0.055]** [0.065]*Corruption -0.097 0.007
[0.053]* [0.071]Street Crime, Theft & Disorder 0.013 0.17
[0.064] [0.083]**Anti-competitive Practices -0.15 -0.049
[0.071]** [0.092]Average of all Constraints -0.246
[0.092]***Constant 1.238 1.306 1.379 1.113 1.097 1.057 1.133 0.711 1.321 1.477 2.028
[0.557]** [0.550]** [0.561]** [0.571]* [0.594]* [0.605]* [0.591]* [0.644] [0.529]** [0.541]*** [0.584]***
Observations 4992 5121 5091 4741 4968 5059 4843 4938 4981 5127 4305
J-Test 4.77 5.96 4.51 4.60 5.33 4.79 5.66 3.78 7.79 5.50 5.99p-value 0.029 0.015 0.034 0.032 0.021 0.029 0.017 0.052 0.005 0.019 0.014
First stage F-testsLog Employment 249.83 258.70 258.02 243.55 253.18 256.76 240.20 243.49 251.08 259.63 211.75Log Assets 91.02 93.04 93.84 85.51 90.87 92.68 88.06 89.03 94.51 93.70 77.04Ownership [Privatized] 40.12 40.21 40.07 37.59 39.46 40.30 39.19 39.43 39.62 40.60 35.43Ownership [New Private] 102.85 106.78 107.99 98.06 104.78 107.93 102.33 102.91 105.91 108.86 85.77Ownership [Foreign] 17.92 19.07 18.90 17.27 19.07 18.31 17.99 17.93 18.94 19.07 14.37Log (1 + Export / Sales) 60.98 62.21 62.05 56.57 60.55 60.91 57.50 58.20 59.87 62.80 47.25
Durbin-Wu-Hausman Test 127.19 125.94 130.33 111.58 110.86 115.97 124.32 123.40 113.52 127.80 75.38p-value 0.000 0.000 0.000 0.000 0.000 0.000 0.000 0.000 0.000 0.000 0.000Robust standard errors, clustered by year, country, industry and firm size (small, medium and large) in brackets* significant at 10%; ** significant at 5%; *** significant at 1%
Table 3: Revenue Efficiency - Impact of Individual Constraints (IV Estimation without Year, Country or Sector Fixed Effects)
Note: All models were estimated using IVs for Log Employment, Log Assets, Log (1 + Export/Sales) and three Ownership Dummies. The IVs are: Firm's age, skill ratio (college/high school), skill ratio - age interaction, location (city), % change in fixed assets in previous period, % change in exports in previous period, full time employees in previous period. The skill ratio and the skill ratio - age interaction were also interacted with regional (CEB, SEE and CIS) dummies. The constraint variables at the firm level represent the average of the constraint reported by the other firms in the same year, country, 2-digit sector and firm size (small, medium, large). The average of all constraints is based on all 15 constraints in the BEEPS survey. 1
40

1 2 3 4 5 6 7 8 9 10 11Log Employment 0.586 0.59 0.608 0.604 0.541 0.512 0.54 0.605 0.585 0.592 0.458
[0.190]*** [0.184]*** [0.177]*** [0.184]*** [0.192]*** [0.195]*** [0.201]*** [0.182]*** [0.183]*** [0.185]*** [0.221]**Log Fixed Assets 0.369 0.367 0.349 0.361 0.422 0.462 0.397 0.341 0.368 0.365 0.511
[0.204]* [0.195]* [0.187]* [0.191]* [0.201]** [0.201]** [0.216]* [0.198]* [0.195]* [0.197]* [0.228]**Ownership [Privatized] -0.237 -0.422 -0.411 -0.407 -0.379 -0.337 -0.414 -0.413 -0.446 -0.306 -0.327
[0.387] [0.426] [0.422] [0.440] [0.469] [0.486] [0.444] [0.406] [0.429] [0.375] [0.527]Ownership [New Private] -0.489 -0.53 -0.518 -0.493 -0.496 -0.448 -0.597 -0.517 -0.543 -0.486 -0.478
[0.273]* [0.261]** [0.256]** [0.263]* [0.276]* [0.272]* [0.275]** [0.257]** [0.261]** [0.252]* [0.306]Ownership [Foreign] 1.765 1.577 1.56 1.479 1.514 1.504 1.644 1.591 1.556 1.699 1.508
[0.516]*** [0.538]*** [0.526]*** [0.520]*** [0.571]*** [0.596]** [0.545]*** [0.502]*** [0.546]*** [0.492]*** [0.636]**Log (1 + Export / Sales) -0.385 -0.25 -0.237 -0.146 -0.219 -0.116 -0.167 -0.103 -0.193 -0.339 -0.163
[0.528] [0.543] [0.534] [0.531] [0.568] [0.561] [0.565] [0.504] [0.552] [0.514] [0.633]More than 3 Competitors 0.091 0.092 0.094 0.09 0.096 0.099 0.117 0.092 0.096 0.09 0.118
[0.051]* [0.051]* [0.050]* [0.050]* [0.052]* [0.052]* [0.055]** [0.049]* [0.051]* [0.051]* [0.059]**Cost of Financing 0.009 0.024
[0.032] [0.041]Infrastructure -0.035 -0.024
[0.049] [0.066]Tax Rates -0.019 0.002
[0.031] [0.043]Customs / Foreign Trade Regulations -0.002 0.069
[0.032] [0.047]Business Licencing & Permits -0.056 -0.072
[0.037] [0.046]Macroeconomic Instability -0.012 0.004
[0.037] [0.043]Corruption -0.062 -0.053
[0.035]* [0.050]Street Crime, Theft & Disorder -0.053 0.015
[0.035] [0.059]Anti-competitive Practices -0.034 -0.054
[0.041] [0.053]Average of all Constraints -0.055
[0.055]Constant 1.47 1.585 1.601 1.482 1.559 1.373 1.742 1.68 1.603 1.616 1.481
[0.436]*** [0.388]*** [0.404]*** [0.392]*** [0.402]*** [0.402]*** [0.436]*** [0.436]*** [0.374]*** [0.402]*** [0.453]***
Observations 4992 5121 5091 4741 4968 5059 4843 4938 4981 5127 4305
J-Test 0.95 0.76 0.71 0.34 0.59 0.68 0.90 0.45 0.79 0.95 0.79p-value 0.329 0.385 0.399 0.560 0.444 0.409 0.342 0.501 0.374 0.331 0.373
First stage F-testsLog Employment 243.65 255.54 255.80 240.91 249.01 254.32 238.32 241.45 248.87 255.32 205.83Log Assets 97.05 102.59 102.37 94.86 100.12 101.96 96.53 97.55 100.88 102.10 81.76Ownership [Privatized] 41.15 41.18 40.78 38.44 40.65 40.75 40.11 40.67 40.55 41.03 34.88Ownership [New Private] 102.02 108.34 107.96 97.56 105.65 108.08 102.84 103.78 105.44 108.19 83.88Ownership [Foreign] 17.07 18.11 18.04 16.18 17.97 17.42 16.98 17.10 17.77 18.10 14.10Log (1 + Export / Sales) 48.78 50.56 49.90 44.90 48.62 49.20 46.15 46.84 47.95 50.70 38.15
Durbin-Wu-Hausman Test 62.86 66.98 64.25 62.95 64.99 66.42 71.95 68.13 67.71 66.24 63.21p-value 0.000 0.000 0.000 0.000 0.000 0.000 0.000 0.000 0.000 0.000 0.000Robust standard errors, clustered by year, country, industry and firm size (small, medium and large) in brackets* significant at 10%; ** significant at 5%; *** significant at 1%
Table 4: Revenue Efficiency - Impact of Individual Constraints (IV Estimation with Year, Country and Sector Fixed Effects)
Note: All models were estimated using IVs for Log Employment, Log Assets, Log (1 + Export/Sales) and three Ownership Dummies. The IVs are: Firm's age, skill ratio (college/high school), skill ratio - age interaction, location (city), % change in fixed assets in previous period, % change in exports in previous period, full time employees in previous period. The skill ratio and the skill ratio - age interaction were also interacted with regional (CEB, SEE and CIS) dummies. The constraint variables at the firm level represent the average of the constraint reported by the other firms in the same year, country, 2-digit sector and firm size (small, medium, large). The average of all constraints is based on all 15 constraints in the BEEPS survey. 1
41

1 2 3 4 5 6 7Log Employment 0.592 0.551 0.507 0.503 0.522 0.558 0.574
[0.178]*** [0.203]*** [0.224]** [0.204]** [0.215]** [0.194]*** [0.199]***Log Fixed Assets 0.345 0.389 0.429 0.442 0.412 0.379 0.362
[0.194]* [0.220]* [0.241]* [0.217]** [0.232]* [0.208]* [0.218]*Ownership [Privatized] -0.546 -0.345 -0.372 -0.407 -0.411 -0.415 -0.454
[0.430] [0.453] [0.464] [0.474] [0.469] [0.437] [0.472]Ownership [New Private] -0.605 -0.55 -0.589 -0.572 -0.631 -0.584 -0.588
[0.267]** [0.276]** [0.281]** [0.288]** [0.289]** [0.270]** [0.285]**Ownership [Foreign] 1.508 1.678 1.646 1.56 1.735 1.619 1.604
[0.502]*** [0.537]*** [0.567]*** [0.562]*** [0.590]*** [0.528]*** [0.538]***Log (1 + Export / Sales) -0.007 -0.185 -0.216 -0.125 -0.294 -0.168 -0.145
[0.525] [0.564] [0.579] [0.576] [0.610] [0.557] [0.563]More than 3 Competitors 0.111 0.114 0.111 0.117 0.13 0.115 0.112
[0.052]** [0.053]** [0.056]** [0.055]** [0.056]** [0.054]** [0.054]**Corruption -0.044 -0.012 -0.168 -0.066 -0.165 -0.202 -0.176
[0.083] [0.113] [0.087]* [0.086] [0.108] [0.112]* [0.144]Functioning of the Judiciary 0.085 0.15
[0.088] [0.115]Uncertainty about Regulatory Policies 0.109 0.196
[0.084] [0.113]*Labor Regulations -0.156 -0.182
[0.100] [0.111]*Business Licensing & Permits -0.075 -0.06
[0.101] [0.117]Tax Administration -0.08 -0.048
[0.081] [0.114]Tax Rates -0.109 -0.143
[0.081] [0.115]Corruption x Functioning of the Judiciary -0.019 -0.054
[0.034] [0.046]Corruption x Uncertainty about Regulatory Policies -0.026 -0.061
[0.037] [0.048]Corruption x Labor Regulation 0.061 0.074
[0.041] [0.046]Corruption x Business Licensing & Permits 0.013 0.006
[0.039] [0.043]Corruption x Tax Administration 0.04 0.014
[0.036] [0.048]Corruption x Tax Rates 0.05 0.072
[0.036] [0.050]Constant 1.689 1.436 1.991 1.767 1.968 2.06 1.929
[0.448]*** [0.504]*** [0.431]*** [0.427]*** [0.495]*** [0.474]*** [0.475]***
Observations 4705 4790 4788 4731 4778 4816 4487
J-Test 1.10 0.69 1.05 0.69 0.97 0.97 1.23p-value 0.294 0.407 0.306 0.405 0.325 0.325 0.267
First stage F-testsLog Employment 227.84 232.40 231.43 232.38 234.28 236.42 213.36Log Assets 91.59 94.36 95.14 94.33 95.77 96.31 88.27Ownership [Privatized] 37.70 39.02 39.50 39.73 38.94 39.41 35.45Ownership [New Private] 97.83 99.19 100.33 100.13 100.52 101.79 90.25Ownership [Foreign] 16.77 16.95 17.26 16.80 16.56 16.98 16.31Log (1 + Exports / Sales) 44.12 45.02 44.96 44.59 45.28 45.33 40.93
Durbin-Wu-Hausman Test 72.53 71.60 76.01 70.35 73.38 69.64 73.11p-value 0.000 0.000 0.000 0.000 0.000 0.000 0.000
* significant at 10%; ** significant at 5%; *** significant at 1%
Table 5: Revenue Efficiency - Interactions with Corruption (IV Estimation with Year, Country and Sector Fixed Effects)
Robust standard errors, clustered by year, country, industry and size (small, medium and large) in brackets
Note: All models were estimated using IVs for Log Employment, Log Assets, Log (1 + Export/Sales) and three Ownership Dummies. The IVs are: Firm's age, skill ratio (college/high school), skill ratio - age interaction, location (city), % change in fixed assets in previous period, % change in exports in previous period, full time employees in previous period. The skill ratio and the skill ratio - age interaction were also interacted with regional (CEB, SEE and CIS) dummies. The constraint variables at the firm level represent the average of the constraint reported by the other firms in the same year, country, 2-digit sector and firm size (small, medium, large). The average of all constraints is based on all 15 constraints in the BEEPS survey.1
42

1
1 2 3 4 5 6 7 8 9 10 11 12Log Employment 0.597 0.595 0.600 0.599 0.599 0.597 0.595 0.594 0.593 0.597 0.601 0.569
[0.168]*** [0.163]*** [0.168]*** [0.165]*** [0.167]*** [0.166]*** [0.166]*** [0.164]*** [0.169]*** [0.168]*** [0.164]*** [0.166]***Log Fixed Assets 0.373 0.378 0.372 0.373 0.373 0.376 0.378 0.379 0.383 0.376 0.371 0.411
[0.178]** [0.173]** [0.179]** [0.176]** [0.178]** [0.177]** [0.177]** [0.174]** [0.182]** [0.179]** [0.176]** [0.178]**Ownership [Privatized] -0.263 -0.264 -0.268 -0.281 -0.264 -0.266 -0.291 -0.259 -0.292 -0.262 -0.274 -0.245
[0.377] [0.375] [0.375] [0.378] [0.376] [0.375] [0.382] [0.375] [0.374] [0.373] [0.372] [0.368]Ownership [New Private] -0.441 -0.435 -0.439 -0.439 -0.437 -0.436 -0.436 -0.432 -0.433 -0.439 -0.441 -0.397
[0.255]* [0.255]* [0.255]* [0.257]* [0.256]* [0.255]* [0.255]* [0.255]* [0.255]* [0.252]* [0.254]* [0.249]Ownership [Foreign] 1.543 1.527 1.535 1.516 1.542 1.533 1.501 1.528 1.504 1.525 1.526 1.514
[0.479]*** [0.480]*** [0.475]*** [0.486]*** [0.479]*** [0.477]*** [0.488]*** [0.477]*** [0.485]*** [0.478]*** [0.479]*** [0.489]***Log (1 + Export / Sales) -0.155 -0.147 -0.149 -0.139 -0.154 -0.143 -0.133 -0.150 -0.143 -0.136 -0.142 -0.169
[0.480] [0.480] [0.477] [0.481] [0.481] [0.481] [0.482] [0.480] [0.480] [0.479] [0.478] [0.482]More than 3 Competitors 0.070 0.070 0.069 0.071 0.069 0.068 0.070 0.069 0.071 0.066 0.069 0.071
[0.044] [0.044] [0.044] [0.044] [0.044] [0.044] [0.044] [0.044] [0.044] [0.044] [0.044] [0.045]Trade Policy -0.061 -0.158
[0.063] [0.091]*Fiscal Burden of Government -0.024 -0.050
[0.059] [0.048]Government Intervention in the Economy -0.004 -0.064
[0.032] [0.050]Monetary Policy 0.111 0.252
[0.084] [0.127]**Capital Flows and Foreign Investment -0.050 0.129
[0.074] [0.117]Banking and Finance -0.051 -0.124
[0.051] [0.070]*Wages and Prices -0.102 -0.055
[0.066] [0.080]Property Rights -0.095 -0.302
[0.096] [0.090]***Regulation 0.381 0.551
[0.238] [0.313]*Informal Market 0.142 0.238
[0.095] [0.111]**
365]
30
9
88.4821.8642.1311.8519.1757.84
75.260.000
Table 6: Revenue Efficiency - Impact of Heritage Foundation Indices (IV Estimation with Year, Country and Sector Fixed Effects)
n
Index of Economic Freedom 0.042[0.224]
Constant 1.578 1.485 1.416 0.885 1.558 1.587 1.707 1.753 -0.131 0.813 1.241 -0.6[0.368]*** [0.537]*** [0.427]*** [0.658] [0.458]*** [0.450]*** [0.431]*** [0.621]*** [1.222] [0.675] [1.096] [2.34
Observations 5430 5430 5430 5430 5430 5430 5430 5430 5430 5430 5430 54
J-Test 1.11 1.16 1.15 1.02 1.09 1.12 1.04 1.17 1.11 1.18 1.16 0.95p-value 0.293 0.281 0.284 0.311 0.296 0.289 0.308 0.278 0.293 0.277 0.281 0.32
First stage F-testsLog Employment 290.13 291.60 290.68 290.90 291.23 291.27 290.36 292.09 291.45 290.76 290.38 2Log Assets 118.74 118.64 117.93 120.18 118.34 118.54 118.44 119.26 119.12 118.22 117.87 1Ownership [Privatized] 42.38 42.41 42.41 42.54 42.65 42.43 41.84 42.43 42.50 42.32 42.21Ownership [New Private] 112.79 113.09 112.79 113.45 113.09 113.15 112.47 113.18 113.14 112.67 112.48 1Ownership [Foreign] 19.02 19.00 19.12 19.04 19.04 19.10 19.03 19.02 19.02 19.03 19.10Log (1 + Export / Sales) 58.11 58.14 58.05 58.08 58.16 58.30 58.10 58.16 58.19 58.08 58.02
Durbin-Wu-Hausman Test 72.67 72.35 73.04 72.73 73.16 74.11 72.86 72.28 72.84 72.49 73.64p-value 0.000 0.000 0.000 0.000 0.000 0.000 0.000 0.000 0.000 0.000 0.000Robust standard errors, clustered by year, country, industry and firm size (small, medium and large) in brackets* significant at 10%; ** significant at 5%; *** significant at 1%
Note:All models were estimated using IVs for Log Employment, Log Assets, Log (1 + Export/Sales) and three Ownership Dummies. The IVs are: Firm's age, skill ratio (college/high school), skill ratio - age interaction, location (city), % change in fixed assets in previous period, % change in exports in previous period, full time employees iprevious period. The skill ratio and the skill ratio - age interaction were also interacted with regional (CEB, SEE and CIS) dummies. The Heritage Foundation Indices measure, on the country level, institutional factors determining economic freedom on a scale from 1 to 5. The index of economic freedom is the simple average of the 10individual indices.
43

1 2 3 4 5 6 7 8 9 10 11Log Employment 0.587 0.593 0.572 0.582 0.581 0.590 0.593 0.719 0.591 0.590 0.590 0.591 0.691
[0.178]*** [0.175]*** [0.184]*** [0.180]*** [0.181]*** [0.175]*** [0.174]*** [0.155]*** [0.177]*** [0.177]*** [0.178]*** [0.177]*** [0.155]***Log Fixed Assets 0.396 0.391 0.411 0.401 0.402 0.393 0.389 0.252 0.391 0.393 0.392 0.391 0.285
[0.192]** [0.190]** [0.199]** [0.195]** [0.196]** [0.188]** [0.188]** [0.162] [0.191]** [0.191]** [0.192]** [0.191]** [0.162]*Ownership [Privatized] -0.329 -0.354 -0.327 -0.325 -0.326 -0.357 -0.344 -0.554 -0.346 -0.354 -0.347 -0.351 -0.524
[0.395] [0.400] [0.404] [0.411] [0.409] [0.409] [0.406] [0.372] [0.407] [0.407] [0.406] [0.407] [0.382]Ownership [New Private] -0.433 -0.438 -0.437 -0.428 -0.427 -0.439 -0.439 -0.493 -0.439 -0.441 -0.440 -0.441 -0.462
[0.269] [0.269] [0.271] [0.273] [0.272] [0.270] [0.271] [0.257]* [0.271] [0.270] [0.271] [0.271] [0.255]*Ownership [Foreign] 1.475 1.450 1.486 1.468 1.455 1.447 1.471 1.219 1.449 1.450 1.460 1.455 1.186
[0.512]*** [0.516]*** [0.523]*** [0.521]*** [0.519]*** [0.521]*** [0.516]*** [0.450]*** [0.516]*** [0.521]*** [0.518]*** [0.521]*** [0.452]***Log (1 + Export / Sales) -0.066 -0.060 -0.082 -0.059 -0.051 -0.040 -0.059 0.254 -0.046 -0.045 -0.053 -0.050 0.256
[0.523] [0.525] [0.533] [0.529] [0.528] [0.528] [0.526] [0.449] [0.525] [0.529] [0.527] [0.528] [0.445]More than 3 Competitors 0.079 0.077 0.081 0.078 0.078 0.079 0.079 0.066 0.079 0.079 0.079 0.079 0.063
[0.046]* [0.046]* [0.047]* [0.046]* [0.046]* [0.046]* [0.046]* [0.043] [0.046]* [0.046]* [0.046]* [0.046]* [0.043]Registering a Business [Number of Procedures] -0.011 -0.011
[0.022] [0.022]Registering a Business [Time in Days] -0.006 -0.004
[0.003]* [0.004]Registering a Business [Cost in % GNI] -0.013 -0.016
[0.005]*** [0.006]***Employing Workers [Rigidity of Employment] 0.007 0.011
[0.005] [0.008]Employing Workers [Firing] 0.007 0.014
[0.004]* [0.009]Employing Workers [Firing Cost in Weeks of Wages] -0.005 -0.022
[0.006] [0.006]***Enforcing a Contract [Number of Procedures] 0.023 0.049
[0.036] [0.047]Enforcing a Contract [Time in Days] -0.001 -0.002
[0.001]* [0.001]**Enforcing a Contract [Cost in % of Debt] 0.020 -0.029
[0.017] [0.043]Closing a Business [Time in Years] -0.055 0.305
[0.182] [0.255]Closing a Business [Cost in % of Estate] -0.049 0.011
[0.008]*** [0.030]Closing a Business [100 - (Recovery Rate in Cents to de Dollar)] -0.002 -0.028
[0.009] [0.014]*Constant 1.461 1.568 1.580 0.899 0.724 1.382 0.676 1.776 1.001 1.481 3.384 1.554 1.467
[0.567]*** [0.388]*** [0.401]*** [0.585] [0.650] [0.452]*** [1.252] [0.340]*** [0.574]* [0.643]** [0.667]*** [0.928]* [2.448]
Observations 5050 5050 5050 5050 5050 5050 5050 4692 5050 5050 5050 5050 4692
J-Test 1.97 1.95 1.91 1.90 1.91 1.89 1.94 5.68 1.97 1.91 1.94 1.94 5.97p-value 0.161 0.162 0.167 0.168 0.167 0.170 0.163 0.017 0.161 0.167 0.164 0.163 0.015
First stage F-testsLog Employment 268.56 268.55 268.65 268.85 268.74 268.85 268.82 248.18 268.79 268.79 268.93 268.93 246.51Log Assets 107.47 107.70 108.01 108.06 108.40 108.01 107.99 100.18 108.03 107.86 107.99 107.96 100.26Ownership [Privatized] 37.86 37.90 37.93 37.99 37.97 37.83 37.95 37.18 37.90 38.00 37.95 37.94 36.98Ownership [New Private] 102.54 102.88 102.84 102.93 102.97 102.96 102.97 95.90 102.97 103.13 102.99 102.97 95.65Ownership [Foreign] 17.56 17.62 17.61 17.62 17.64 17.61 17.63 17.14 17.64 17.62 17.62 17.63 17.25Log (1 + Export / Sales) 54.16 54.21 54.17 54.18 54.12 54.19 54.19 51.24 54.16 54.15 54.21 54.37 51.17
Durbin-Wu-Hausman Test 62.16 62.15 63.72 62.61 62.38 62.57 62.56 56.44 61.97 62.41 62.54 62.57 56.01p-value 0.000 0.000 0.000 0.000 0.000 0.000 0.000 0.000 0.000 0.000 0.000 0.000 0.000Robust standard errors, clustered by year, country, industry and firm size [small, medium and large] in brackets* significant at 10%; ** significant at 5%; *** significant at 1%
Table 7: Revenue Efficiency - Impact of Doing Business Indicators (IV Estimation with Year, Country and Sector Fixed Effects)
Note: All models were estimated using IVs for Log Employment, Log Assets, Log (1 + Export/Sales) and three Ownership Dummies. The IVs are: Firm's age, skill ratio [college/high school], skill ratio - age interaction, location [city], % change in fixed assets in previous period, % change in exports in previous period, full time employees in previous period. The skill ratio and the skill ratio - age interaction were also interacted with regional (CEB, SEE and CIS) dummies. The Doing Business Indicators measure elements of the business climate on a country level a score indicates that the business climate is worse. All Indicators are measured defined, except for "Employing Workers [Rigidity of Employment]" and "Employing Workers [Firing]", which are measured on a scale from 0 to 100 (100 is the most rigid). The Doing Business Indicators report "Closing a Business [Recovery Rate in Cents to the Dollar]. This was recoded to "Closing a Business [100 - Recovery Rate in Cents to the Dollar]" such that, consistent with the other indicators, a higher score is associated with a worse business climate.
44
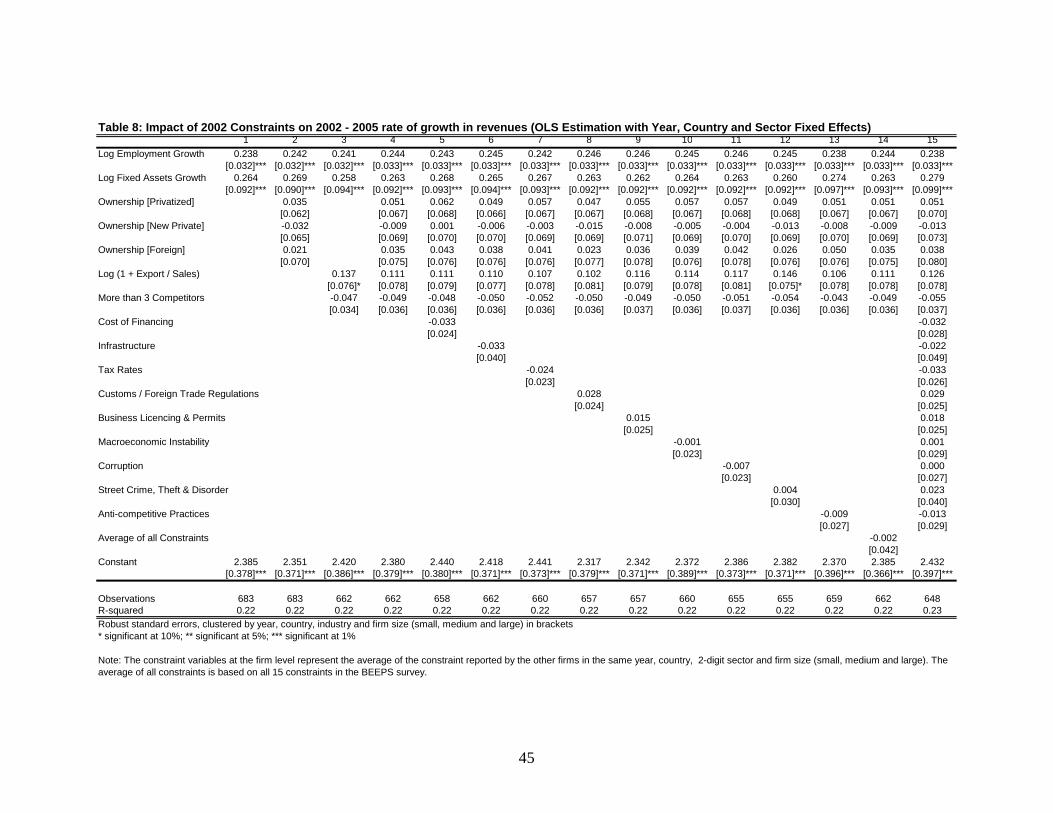
1 2 3 4 5 6 7 8 9 10 11 12 13 14 15Log Employment Growth 0.238 0.242 0.241 0.244 0.243 0.245 0.242 0.246 0.246 0.245 0.246 0.245 0.238 0.244 0.238
[0.032]*** [0.032]*** [0.032]*** [0.033]*** [0.033]*** [0.033]*** [0.033]*** [0.033]*** [0.033]*** [0.033]*** [0.033]*** [0.033]*** [0.033]*** [0.033]*** [0.033]***Log Fixed Assets Growth 0.264 0.269 0.258 0.263 0.268 0.265 0.267 0.263 0.262 0.264 0.263 0.260 0.274 0.263 0.279
[0.092]*** [0.090]*** [0.094]*** [0.092]*** [0.093]*** [0.094]*** [0.093]*** [0.092]*** [0.092]*** [0.092]*** [0.092]*** [0.092]*** [0.097]*** [0.093]*** [0.099]***Ownership [Privatized] 0.035 0.051 0.062 0.049 0.057 0.047 0.055 0.057 0.057 0.049 0.051 0.051 0.051
[0.062] [0.067] [0.068] [0.066] [0.067] [0.067] [0.068] [0.067] [0.068] [0.068] [0.067] [0.067] [0.070]Ownership [New Private] -0.032 -0.009 0.001 -0.006 -0.003 -0.015 -0.008 -0.005 -0.004 -0.013 -0.008 -0.009 -0.013
[0.065] [0.069] [0.070] [0.070] [0.069] [0.069] [0.071] [0.069] [0.070] [0.069] [0.070] [0.069] [0.073]Ownership [Foreign] 0.021 0.035 0.043 0.038 0.041 0.023 0.036 0.039 0.042 0.026 0.050 0.035 0.038
[0.070] [0.075] [0.076] [0.076] [0.076] [0.077] [0.078] [0.076] [0.078] [0.076] [0.076] [0.075] [0.080]Log (1 + Export / Sales) 0.137 0.111 0.111 0.110 0.107 0.102 0.116 0.114 0.117 0.146 0.106 0.111 0.126
[0.076]* [0.078] [0.079] [0.077] [0.078] [0.081] [0.079] [0.078] [0.081] [0.075]* [0.078] [0.078] [0.078]More than 3 Competitors -0.047 -0.049 -0.048 -0.050 -0.052 -0.050 -0.049 -0.050 -0.051 -0.054 -0.043 -0.049 -0.055
[0.034] [0.036] [0.036] [0.036] [0.036] [0.036] [0.037] [0.036] [0.037] [0.036] [0.036] [0.036] [0.037]Cost of Financing -0.033 -0.032
[0.024] [0.028]Infrastructure -0.033 -0.022
[0.040] [0.049]Tax Rates -0.024 -0.033
[0.023] [0.026]Customs / Foreign Trade Regulations 0.028 0.029
[0.024] [0.025]Business Licencing & Permits 0.015 0.018
[0.025] [0.025]Macroeconomic Instability -0.001 0.001
[0.023] [0.029]Corruption -0.007 0.000
[0.023] [0.027]Street Crime, Theft & Disorder 0.004 0.023
[0.030] [0.040]Anti-competitive Practices -0.009 -0.013
[0.027] [0.029]Average of all Constraints -0.002
[0.042]Constant 2.385 2.351 2.420 2.380 2.440 2.418 2.441 2.317 2.342 2.372 2.386 2.382 2.370 2.385 2.432
[0.378]*** [0.371]*** [0.386]*** [0.379]*** [0.380]*** [0.371]*** [0.373]*** [0.379]*** [0.371]*** [0.389]*** [0.373]*** [0.371]*** [0.396]*** [0.366]*** [0.397]***
Observations 683 683 662 662 658 662 660 657 657 660 655 655 659 662 648R-squared 0.22 0.22 0.22 0.22 0.22 0.22 0.22 0.22 0.22 0.22 0.22 0.22 0.22 0.22 0.23
* significant at 10%; ** significant at 5%; *** significant at 1%
Table 8: Impact of 2002 Constraints on 2002 - 2005 rate of growth in revenues (OLS Estimation with Year, Country and Sector Fixed Effects)
Note: The constraint variables at the firm level represent the average of the constraint reported by the other firms in the same year, country, 2-digit sector and firm size (small, medium and large). The average of all constraints is based on all 15 constraints in the BEEPS survey.
Robust standard errors, clustered by year, country, industry and firm size (small, medium and large) in brackets
45

1 2 3 4 5 6 7 8
Log Employment 0.221 0.217 0.22 0.25 0.348 0.327 0.384 0.361[0.179] [0.181] [0.176] [0.171] [0.225] [0.257] [0.225]* [0.248]
Log Assets 0.87 0.857 0.873 0.814 0.629 0.654 0.594 0.621[0.192]*** [0.196]*** [0.189]*** [0.186]*** [0.231]*** [0.266]** [0.234]** [0.259]**
Log Exports / Sales 0.528 0.872 -0.767 -0.49[0.388] [0.407]** [0.572] [0.596]
More than 3 Competitors 0.01 0.037 0.054 0.051[0.053] [0.052] [0.051] [0.055]
Ownership [Privatized] -0.455 -0.062 -0.139 0.073[0.474] [0.467] [0.424] [0.439]
Ownership [New Private] -0.59 -0.511 -0.446 -0.412[0.323]* [0.319] [0.294] [0.298]
Ownership [Foreign] 1.061 1.785 1.382 1.794[0.436]** [0.664]*** [0.414]*** [0.626]***
Constant -0.054 -0.044 -0.071 -0.036 0.789 0.633 0.594 0.507[0.236] [0.239] [0.258] [0.251] [0.466]* [0.480] [0.441] [0.463]
Table A1: Value Added Efficiency - Baseline Regressions (IV Estimation with Year, Country and Sector Fixed Effects)
Observations 5308 5261 5117 5070 5308 5261 5117 5070
J-Test 14.04 13.67 14.54 12.39 5.97 3.15 3.42 2.38p-value 0.015 0.008 0.013 0.015 0.201 0.076 0.181 0.123
First stage F-testsLog Employment 293.91 291.24 281.35 278.59 293.91 291.24 281.35 278.59Log Assets 124.15 123.43 115.68 114.94 124.15 123.43 115.68 114.94Log Exports / Sales 52.71 53.13 52.71 53.13Ownership [Privatized] 44.34 44.28 43.11 43.12Ownership [New Private] 118.33 118.80 112.89 113.31Ownership [Foreign] 16.99 16.45 16.34 15.73
Durbin-Wu-Hausman Test 47.62 49.61 51.06 56.43 63.53 65.18 69.67 66.87p-value 0.00 0.00 0.00 0.00 0.00 0.00 0.00 0.00Robust standard errors, clustered by year, country, industry and firm size (small, medium and large) in brackets* significant at 10%; ** significant at 5%; *** significant at 1%
Note: All models were estimated using IVs for Log Employment, Log Assets, Log (1 + Export/Sales) and three Ownership Dummies. The IVs are: Firm's age, skill ratio (college/high school), skill ratio - age interaction, location (city), % change in fixed assets in previous period, % change in exports in previous period, full time employees in previous period. The skill ratio and the skill ratio - age interaction were also interacted with regional (CEB, SEE and CIS) dummies
46

More than 3 Competitors
Access to Financing
Cost of Financing Infrastructure Tax Rates Tax
Administration
Customs / Foreign Trade Regulations
Business Licencing &
Permits
Labour Regulations
Uncertainty about
Regulatory Policies
Macro-economic Instability
Functioning of the Judiciary Corruption
Street Crime, Theft & Disorder
Organised Crime & Mafia
Anti-competitive Practices
Average of all 15 Constraints
More than 3 Competitors 1.0000Access to Financing 0.0533* 1.0000Cost of Financing 0.0664* 0.7459* 1.0000Infrastructure 0.0153 0.2466* 0.2670* 1.0000Tax Rates 0.0543* 0.4592* 0.5703* 0.3466* 1.0000Tax Administration 0.0157 0.3662* 0.4160* 0.3926* 0.6839* 1.0000Customs / Foreign Trade Regulations 0.0109 0.3181* 0.3807* 0.4132* 0.4544* 0.5327* 1.0000Business Licencing & Permits 0.0335* 0.3105* 0.3103* 0.4258* 0.3569* 0.4385* 0.5244* 1.0000Labour Regulations 0.0762* 0.3134* 0.3783* 0.2819* 0.4597* 0.3338* 0.3482* 0.3118* 1.0000Uncertainty about Regulatory Policies 0.0459* 0.4252* 0.5005* 0.2570* 0.5065* 0.3797* 0.3727* 0.3456* 0.3981* 1.0000Macro-economic Instability 0.0310* 0.4640* 0.5316* 0.3151* 0.5327* 0.4423* 0.4414* 0.3755* 0.3650* 0.7836* 1.0000Functioning of the Judiciary 0.0519* 0.3201* 0.4221* 0.3837* 0.3676* 0.2942* 0.3813* 0.3916* 0.4442* 0.5417* 0.5373* 1.0000Corruption 0.0567* 0.3190* 0.4058* 0.4213* 0.4059* 0.4428* 0.4745* 0.4857* 0.2703* 0.4576* 0.4922* 0.6410* 1.0000Street Crime, Theft & Disorder 0.0435* 0.2477* 0.3484* 0.3596* 0.3910* 0.3746* 0.3139* 0.3127* 0.3323* 0.5052* 0.4662* 0.5155* 0.5908* 1.0000Organised Crime & Mafia 0.0423* 0.2838* 0.3472* 0.3648* 0.2798* 0.3069* 0.4084* 0.3702* 0.2919* 0.4662* 0.4570* 0.5448* 0.6461* 0.7486* 1.0000Anti-competitive Practices 0.1011* 0.3065* 0.3996* 0.2959* 0.4155* 0.2458* 0.3200* 0.2699* 0.4069* 0.4657* 0.4446* 0.5451* 0.4986* 0.4394* 0.4458* 1.0000Average of all 15 Constraints 0.0691* 0.6135* 0.7035* 0.5391* 0.7289* 0.6674* 0.6555* 0.6047* 0.5839* 0.7409* 0.7630* 0.7160* 0.7400* 0.6764* 0.6727* 0.6374* 1.0000
Table A2. Pairwise Correlation of Constraints
47
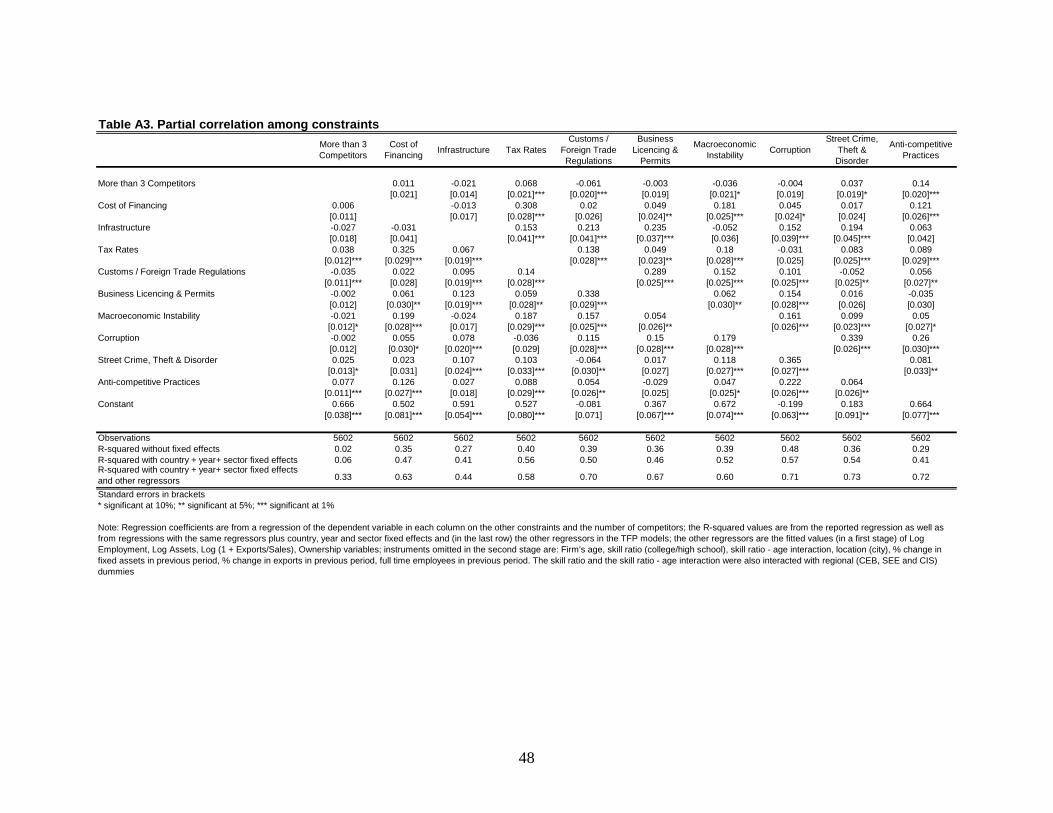
More than 3 Competitors
Cost of Financing Infrastructure Tax Rates
Customs / Foreign Trade Regulations
Business Licencing &
Permits
Macroeconomic Instability Corruption
Street Crime, Theft & Disorder
Anti-competitive Practices
More than 3 Competitors 0.011 -0.021 0.068 -0.061 -0.003 -0.036 -0.004 0.037 0.14[0.021] [0.014] [0.021]*** [0.020]*** [0.019] [0.021]* [0.019] [0.019]* [0.020]***
Cost of Financing 0.006 -0.013 0.308 0.02 0.049 0.181 0.045 0.017 0.121[0.011] [0.017] [0.028]*** [0.026] [0.024]** [0.025]*** [0.024]* [0.024] [0.026]***
Infrastructure -0.027 -0.031 0.153 0.213 0.235 -0.052 0.152 0.194 0.063[0.018] [0.041] [0.041]*** [0.041]*** [0.037]*** [0.036] [0.039]*** [0.045]*** [0.042]
Tax Rates 0.038 0.325 0.067 0.138 0.049 0.18 -0.031 0.083 0.089[0.012]*** [0.029]*** [0.019]*** [0.028]*** [0.023]** [0.028]*** [0.025] [0.025]*** [0.029]***
Customs / Foreign Trade Regulations -0.035 0.022 0.095 0.14 0.289 0.152 0.101 -0.052 0.056[0.011]*** [0.028] [0.019]*** [0.028]*** [0.025]*** [0.025]*** [0.025]*** [0.025]** [0.027]**
Business Licencing & Permits -0.002 0.061 0.123 0.059 0.338 0.062 0.154 0.016 -0.035[0.012] [0.030]** [0.019]*** [0.028]** [0.029]*** [0.030]** [0.028]*** [0.026] [0.030]
Macroeconomic Instability -0.021 0.199 -0.024 0.187 0.157 0.054 0.161 0.099 0.05[0.012]* [0.028]*** [0.017] [0.029]*** [0.025]*** [0.026]** [0.026]*** [0.023]*** [0.027]*
Corruption -0.002 0.055 0.078 -0.036 0.115 0.15 0.179 0.339 0.26[0.012] [0.030]* [0.020]*** [0.029] [0.028]*** [0.028]*** [0.028]*** [0.026]*** [0.030]***
Street Crime, Theft & Disorder 0.025 0.023 0.107 0.103 -0.064 0.017 0.118 0.365 0.081[0.013]* [0.031] [0.024]*** [0.033]*** [0.030]** [0.027] [0.027]*** [0.027]*** [0.033]**
Anti-competitive Practices 0.077 0.126 0.027 0.088 0.054 -0.029 0.047 0.222 0.064[0.011]*** [0.027]*** [0.018] [0.029]*** [0.026]** [0.025] [0.025]* [0.026]*** [0.026]**
Constant 0.666 0.502 0.591 0.527 -0.081 0.367 0.672 -0.199 0.183 0.664[0.038]*** [0.081]*** [0.054]*** [0.080]*** [0.071] [0.067]*** [0.074]*** [0.063]*** [0.091]** [0.077]***
Observations 5602 5602 5602 5602 5602 5602 5602 5602 5602 5602R-squared without fixed effects 0.02 0.35 0.27 0.40 0.39 0.36 0.39 0.48 0.36 0.29R-squared with country + year+ sector fixed effects 0.06 0.47 0.41 0.56 0.50 0.46 0.52 0.57 0.54 0.41R-squared with country + year+ sector fixed effects and other regressors 0.33 0.63 0.44 0.58 0.70 0.67 0.60 0.71 0.73 0.72
Standard errors in brackets* significant at 10%; ** significant at 5%; *** significant at 1%
Note: Regression coefficients are from a regression of the dependent variable in each column on the other constraints and the number of competitors; the R-squared values are from the reported regression as well as from regressions with the same regressors plus country, year and sector fixed effects and (in the last row) the other regressors in the TFP models; the other regressors are the fitted values (in a first stage) of Log Employment, Log Assets, Log (1 + Exports/Sales), Ownership variables; instruments omitted in the second stage are: Firm's age, skill ratio (college/high school), skill ratio - age interaction, location (city), % change in fixed assets in previous period, % change in exports in previous period, full time employees in previous period. The skill ratio and the skill ratio - age interaction were also interacted with regional (CEB, SEE and CIS) dummies
Table A3. Partial correlation among constraints
48

1 2 3 4 5 6 7 8 9 10 11Log Employment 0.636 0.64 0.637 0.647 0.649 0.649 0.639 0.638 0.645 0.64 0.667
[0.018]*** [0.018]*** [0.018]*** [0.019]*** [0.018]*** [0.018]*** [0.019]*** [0.019]*** [0.018]*** [0.018]*** [0.018]***Log Fixed Assets 0.384 0.38 0.384 0.376 0.376 0.375 0.38 0.377 0.371 0.381 0.35
[0.013]*** [0.012]*** [0.012]*** [0.013]*** [0.012]*** [0.012]*** [0.013]*** [0.012]*** [0.013]*** [0.012]*** [0.012]***Ownership [Privatized] 0.043 0.071 0.047 0.07 0.049 0.03 0.078 0.033 0.025 0.054 0.008
[0.061] [0.061] [0.061] [0.064] [0.062] [0.061] [0.063] [0.061] [0.063] [0.061] [0.064]Ownership [New Private] 0.305 0.33 0.312 0.336 0.332 0.308 0.343 0.295 0.27 0.327 0.289
[0.064]*** [0.063]*** [0.063]*** [0.065]*** [0.062]*** [0.063]*** [0.066]*** [0.064]*** [0.064]*** [0.063]*** [0.063]***Ownership [Foreign] 0.407 0.434 0.423 0.445 0.433 0.415 0.46 0.423 0.392 0.43 0.391
[0.075]*** [0.075]*** [0.074]*** [0.075]*** [0.074]*** [0.074]*** [0.077]*** [0.075]*** [0.076]*** [0.075]*** [0.075]***Log Exports / Sales 0.312 0.3 0.304 0.343 0.315 0.339 0.304 0.296 0.337 0.311 0.336
[0.115]*** [0.112]*** [0.112]*** [0.115]*** [0.110]*** [0.112]*** [0.115]*** [0.116]** [0.116]*** [0.112]*** [0.110]***More than 3 Competitors 0.199 0.184 0.204 0.193 0.189 0.2 0.203 0.21 0.191 0.202 0.173
[0.042]*** [0.042]*** [0.042]*** [0.044]*** [0.043]*** [0.041]*** [0.043]*** [0.043]*** [0.042]*** [0.042]*** [0.044]***Cost of Financing -0.083 0.013
[0.035]** [0.039]Infrastructure -0.338 -0.225
[0.063]*** [0.063]***Tax Rates -0.104 0.006
[0.042]** [0.042]Customs / Foreign Trade Regulations -0.152 0.032
[0.041]*** [0.040]Business Licencing & Permits -0.273 -0.185
[0.039]*** [0.041]***Macroeconomic Instability -0.246 -0.248
[0.036]*** [0.041]***Corruption -0.169 -0.096
[0.036]*** [0.049]**Street Crime, Theft & Disorder -0.154 0
[0.042]*** [0.054]Anti-competitive Practices 0.122 0.33
[0.039]*** [0.042]***Average of all Constraints -0.278
[0.061]***Constant 1.922 2.228 1.995 2 2.24 2.367 2.049 2.026 1.492 2.309 2.526
[0.134]*** [0.142]*** [0.156]*** [0.131]*** [0.131]*** [0.143]*** [0.129]*** [0.128]*** [0.133]*** [0.170]*** [0.178]***
Observations 4992 5121 5091 4741 4968 5059 4843 4938 4981 5127 43050.72 0.73 0.72 0.72 0.73 0.73 0.72 0.72 0.72 0.72 0.74
Robust standard errors, clustered by year, country, industry and firm size (small, medium and large) in brackets* significant at 10%; ** significant at 5%; *** significant at 1%
TableA4: Revenue Efficiency - Impact of Individual Constraints (OLS Estimation without Year, Country or Sector Fixed Effects)
Note: The constraint variables at the firm level represent the average of the constraint reported by the other firms in the same year, country, 2-digit sector and firm size (small, medium and large). The average of all constraints is based on all 15 constraints in the BEEPS survey
49

1 2 3 4 5 6 7 8 9 10 11Log Employment 0.903 0.904 0.904 0.901 0.902 0.903 0.9 0.9 0.906 0.904 0.896
[0.013]*** [0.013]*** [0.013]*** [0.013]*** [0.013]*** [0.013]*** [0.013]*** [0.013]*** [0.013]*** [0.013]*** [0.014]***Log Fixed Assets 0.157 0.155 0.153 0.153 0.156 0.155 0.158 0.155 0.153 0.155 0.154
[0.009]*** [0.009]*** [0.009]*** [0.010]*** [0.009]*** [0.009]*** [0.010]*** [0.009]*** [0.009]*** [0.009]*** [0.010]***Ownership [Privatized] 0.042 0.038 0.037 0.044 0.038 0.038 0.056 0.039 0.03 0.04 0.039
[0.043] [0.043] [0.043] [0.045] [0.044] [0.044] [0.044] [0.044] [0.044] [0.043] [0.046]Ownership [New Private] 0.137 0.133 0.13 0.133 0.135 0.133 0.149 0.135 0.129 0.135 0.134
[0.041]*** [0.042]*** [0.041]*** [0.044]*** [0.042]*** [0.042]*** [0.043]*** [0.042]*** [0.042]*** [0.042]*** [0.043]***Ownership [Foreign] 0.308 0.307 0.316 0.302 0.304 0.307 0.316 0.316 0.3 0.31 0.314
[0.055]*** [0.055]*** [0.054]*** [0.057]*** [0.057]*** [0.056]*** [0.056]*** [0.056]*** [0.056]*** [0.055]*** [0.056]***Log Export / Sales 0.173 0.181 0.174 0.18 0.18 0.181 0.184 0.168 0.196 0.178 0.175
[0.080]** [0.079]** [0.079]** [0.080]** [0.080]** [0.079]** [0.081]** [0.080]** [0.079]** [0.079]** [0.082]**More than 3 competitors -0.001 -0.004 0.001 -0.001 -0.002 -0.003 0.002 -0.001 -0.003 -0.002 0.001
[0.031] [0.030] [0.030] [0.031] [0.031] [0.031] [0.031] [0.031] [0.031] [0.030] [0.032]Cost of Financing 0.002 0.003
[0.024] [0.028]Infrastructure -0.006 0.017
[0.033] [0.039]Tax Rates -0.022 -0.031
[0.022] [0.027]Customs / Foreign Trade Regulations 0.024 0.056
[0.021] [0.027]**Business Licencing & Permits -0.021 -0.044
[0.022] [0.029]Macroeconomic Instability 0.017 0.028
[0.023] [0.028]Corruption -0.008 -0.009
[0.022] [0.030]Street Crime, Theft & Disorder -0.053 -0.047
[0.025]** [0.032]Anti-competitive Practices 0.017 0.015
[0.021] [0.025]Average of all Constraints -0.025
[0.037]Constant 1.037 1.041 1.113 1 1.072 0.991 1.047 1.154 0.987 1.089 1.099
[0.112]*** [0.104]*** [0.108]*** [0.102]*** [0.102]*** [0.113]*** [0.105]*** [0.103]*** [0.100]*** [0.127]*** [0.136]***
Observations 4992 5121 5091 4741 4968 5059 4843 4938 4981 5127 43050.85 0.85 0.85 0.85 0.85 0.85 0.85 0.85 0.85 0.85 0.85
* significant at 10%; ** significant at 5%; *** significant at 1%Robust standard errors, clustered by year, country, industry and size (small medium large) in brackets
Table A5: Revenue Efficiency - Impact of Individual Constraints (OLS Estimation with Year, Country and Sector Fixed Effects)
Note: The constraint variables at the firm level represent the average of the constraint reported by the other firms in the same year, country, 2-digit sector and firm size (small, medium and large). The average of all constraints is based on all 15 constraints in the BEEPS survey.
50
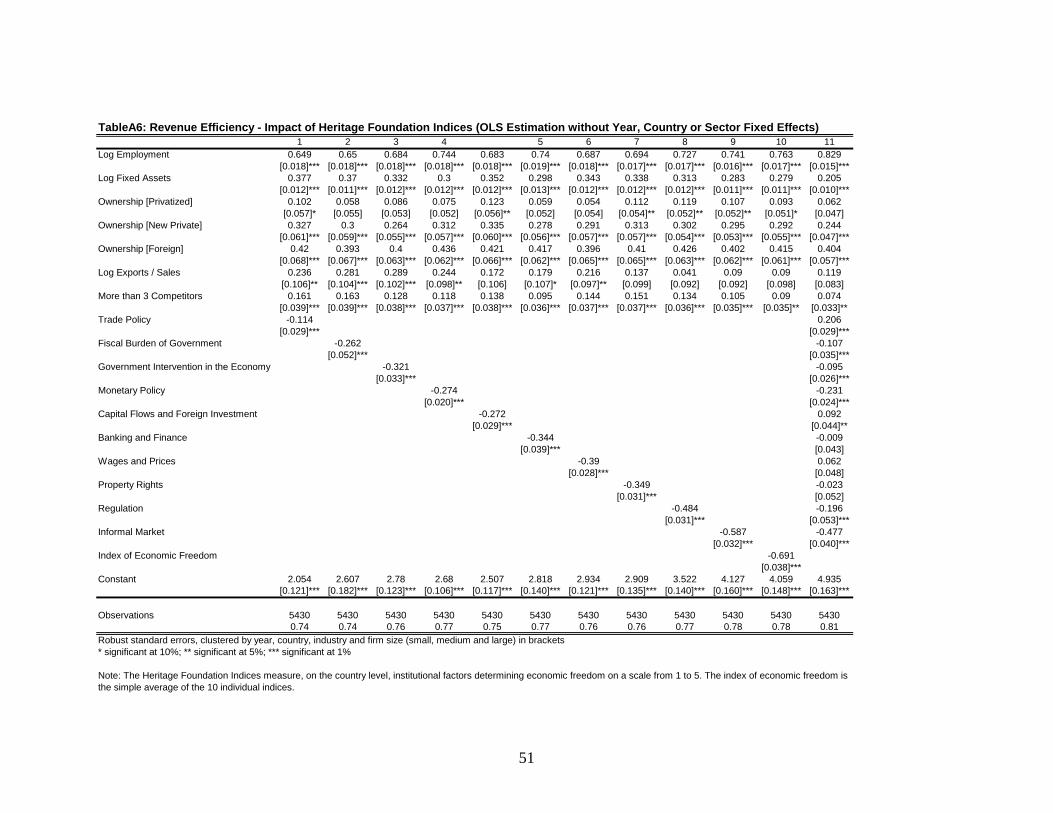
1 2 3 4 5 6 7 8 9 10 11Log Employment 0.649 0.65 0.684 0.744 0.683 0.74 0.687 0.694 0.727 0.741 0.763 0.829
[0.018]*** [0.018]*** [0.018]*** [0.018]*** [0.018]*** [0.019]*** [0.018]*** [0.017]*** [0.017]*** [0.016]*** [0.017]*** [0.015]***Log Fixed Assets 0.377 0.37 0.332 0.3 0.352 0.298 0.343 0.338 0.313 0.283 0.279 0.205
[0.012]*** [0.011]*** [0.012]*** [0.012]*** [0.012]*** [0.013]*** [0.012]*** [0.012]*** [0.012]*** [0.011]*** [0.011]*** [0.010]***Ownership [Privatized] 0.102 0.058 0.086 0.075 0.123 0.059 0.054 0.112 0.119 0.107 0.093 0.062
[0.057]* [0.055] [0.053] [0.052] [0.056]** [0.052] [0.054] [0.054]** [0.052]** [0.052]** [0.051]* [0.047]Ownership [New Private] 0.327 0.3 0.264 0.312 0.335 0.278 0.291 0.313 0.302 0.295 0.292 0.244
[0.061]*** [0.059]*** [0.055]*** [0.057]*** [0.060]*** [0.056]*** [0.057]*** [0.057]*** [0.054]*** [0.053]*** [0.055]*** [0.047]***Ownership [Foreign] 0.42 0.393 0.4 0.436 0.421 0.417 0.396 0.41 0.426 0.402 0.415 0.404
[0.068]*** [0.067]*** [0.063]*** [0.062]*** [0.066]*** [0.062]*** [0.065]*** [0.065]*** [0.063]*** [0.062]*** [0.061]*** [0.057]***Log Exports / Sales 0.236 0.281 0.289 0.244 0.172 0.179 0.216 0.137 0.041 0.09 0.09 0.119
[0.106]** [0.104]*** [0.102]*** [0.098]** [0.106] [0.107]* [0.097]** [0.099] [0.092] [0.092] [0.098] [0.083]More than 3 Competitors 0.161 0.163 0.128 0.118 0.138 0.095 0.144 0.151 0.134 0.105 0.09 0.074
[0.039]*** [0.039]*** [0.038]*** [0.037]*** [0.038]*** [0.036]*** [0.037]*** [0.037]*** [0.036]*** [0.035]*** [0.035]** [0.033]**Trade Policy -0.114 0.206
[0.029]*** [0.029]***Fiscal Burden of Government -0.262 -0.107
[0.052]*** [0.035]***Government Intervention in the Economy -0.321 -0.095
[0.033]*** [0.026]***Monetary Policy -0.274 -0.231
[0.020]*** [0.024]***Capital Flows and Foreign Investment -0.272 0.092
[0.029]*** [0.044]**Banking and Finance -0.344 -0.009
[0.039]*** [0.043]Wages and Prices -0.39 0.062
[0.028]*** [0.048]Property Rights -0.349 -0.023
[0.031]*** [0.052]Regulation -0.484 -0.196
[0.031]*** [0.053]***Informal Market -0.587 -0.477
[0.032]*** [0.040]***Index of Economic Freedom -0.691
[0.038]***Constant 2.054 2.607 2.78 2.68 2.507 2.818 2.934 2.909 3.522 4.127 4.059 4.935
[0.121]*** [0.182]*** [0.123]*** [0.106]*** [0.117]*** [0.140]*** [0.121]*** [0.135]*** [0.140]*** [0.160]*** [0.148]*** [0.163]***
Observations 5430 5430 5430 5430 5430 5430 5430 5430 5430 5430 5430 54300.74 0.74 0.76 0.77 0.75 0.77 0.76 0.76 0.77 0.78 0.78 0.81
Robust standard errors, clustered by year, country, industry and firm size (small, medium and large) in brackets* significant at 10%; ** significant at 5%; *** significant at 1%
TableA6: Revenue Efficiency - Impact of Heritage Foundation Indices (OLS Estimation without Year, Country or Sector Fixed Effects)
Note: The Heritage Foundation Indices measure, on the country level, institutional factors determining economic freedom on a scale from 1 to 5. The index of economic freedom is the simple average of the 10 individual indices.
51

1 2 3 4 5 6 7 8 9 10 11Log Employment 0.904 0.904 0.904 0.905 0.904 0.905 0.904 0.905 0.904 0.904 0.905 0.900
[0.012]*** [0.012]*** [0.012]*** [0.012]*** [0.012]*** [0.012]*** [0.012]*** [0.012]*** [0.012]*** [0.012]*** [0.012]*** [0.012]***Log Fixed Assets 0.158 0.157 0.158 0.158 0.158 0.157 0.158 0.156 0.160 0.159 0.156 0.162
[0.009]*** [0.009]*** [0.009]*** [0.009]*** [0.009]*** [0.009]*** [0.009]*** [0.009]*** [0.009]*** [0.009]*** [0.009]*** [0.009]***Ownership [Privatized] 0.036 0.033 0.036 0.036 0.037 0.035 0.033 0.036 0.038 0.036 0.034 0.038
[0.041] [0.041] [0.041] [0.041] [0.041] [0.041] [0.041] [0.041] [0.041] [0.041] [0.041] [0.041]Ownership [New Private] 0.134 0.131 0.134 0.134 0.135 0.134 0.133 0.134 0.136 0.134 0.133 0.136
[0.040]*** [0.040]*** [0.040]*** [0.040]*** [0.040]*** [0.040]*** [0.040]*** [0.040]*** [0.040]*** [0.040]*** [0.040]*** [0.040]***Ownership [Foreign] 0.322 0.320 0.321 0.322 0.323 0.321 0.321 0.323 0.323 0.322 0.320 0.322
[0.051]*** [0.050]*** [0.050]*** [0.051]*** [0.051]*** [0.050]*** [0.050]*** [0.051]*** [0.051]*** [0.050]*** [0.050]*** [0.050]***Log Exports / Sales 0.097 0.099 0.097 0.098 0.095 0.095 0.097 0.096 0.096 0.096 0.098 0.086
[0.073] [0.073] [0.073] [0.073] [0.073] [0.073] [0.073] [0.073] [0.073] [0.073] [0.073] [0.072]More than 3 Competitors -0.014 -0.014 -0.014 -0.015 -0.015 -0.018 -0.014 -0.016 -0.014 -0.015 -0.014 -0.015
[0.029] [0.029] [0.029] [0.029] [0.029] [0.029] [0.029] [0.029] [0.029] [0.029] [0.029] [0.029]Trade Policy -0.012 -0.086
[0.040] [0.056]Fiscal Burden of Government -0.056 -0.041
[0.037] [0.040]Government Intervention in the Economy -0.026 -0.045
[0.026] [0.034]Monetary Policy -0.008 0.071
[0.035] [0.040]*Capital Flows and Foreign Investment -0.059 0.023
[0.060] [0.069]Banking and Finance -0.093 -0.109
[0.036]** [0.043]**Wages and Prices -0.069 -0.047
[0.050] [0.059]Property Rights -0.194 -0.297
[0.064]*** [0.077]***Regulation 0.149 0.200
[0.083]* [0.099]**Informal Market 0.035 0.083
[0.042] [0.046]*Index of Economic Freedom -0.228
[0.109]**Constant 1.084 1.277 1.167 1.086 1.241 1.408 1.262 1.812 0.453 0.905 1.928 1.856
[0.139]*** [0.172]*** [0.142]*** [0.179]*** [0.216]*** [0.167]*** [0.184]*** [0.258]*** [0.336] [0.195]*** [0.428]*** [0.671]***
Observations 5430 5430 5430 5430 5430 5430 5430 5430 5430 5430 5430 54300.86 0.86 0.86 0.86 0.86 0.86 0.86 0.86 0.86 0.86 0.86 0.86
Robust standard errors, clustered by year, country, industry and firm size (small, medium and large) in brackets* significant at 10%; ** significant at 5%; *** significant at 1%
TableA7: Revenue Efficiency - Impact of Heritage Foundation Indices (OLS Estimation with Year, Country and Sector Fixed Effects)
Note: The Heritage Foundation Indices measure, on the country level, institutional factors determining economic freedom on a scale from 1 to 5. The index of economic freedom is the simple average of the 10 individual indices.
52

1 2 3 4 5 6 7 8 9 10 11 12 13Log Employment 0.681 0.656 0.656 0.655 0.659 0.68 0.67 0.738 0.671 0.656 0.659 0.71 0.867
[0.017]*** [0.018]*** [0.018]*** [0.018]*** [0.018]*** [0.018]*** [0.018]*** [0.019]*** [0.017]*** [0.018]*** [0.017]*** [0.017]*** [0.015]***Log Fixed Assets 0.337 0.365 0.365 0.369 0.36 0.349 0.355 0.316 0.346 0.365 0.366 0.327 0.199
[0.012]*** [0.012]*** [0.012]*** [0.012]*** [0.011]*** [0.012]*** [0.012]*** [0.014]*** [0.011]*** [0.012]*** [0.012]*** [0.012]*** [0.011]***Ownership [Privatized] 0.033 0.1 0.098 0.118 0.086 0.126 0.111 0.137 0.099 0.1 0.073 0.068 0.136
[0.055] [0.059]* [0.058]* [0.059]** [0.058] [0.058]** [0.059]* [0.057]** [0.058]* [0.058]* [0.057] [0.054] [0.051]***Ownership [New Private] 0.261 0.307 0.311 0.326 0.298 0.338 0.33 0.336 0.296 0.313 0.317 0.322 0.314
[0.058]*** [0.062]*** [0.062]*** [0.062]*** [0.061]*** [0.061]*** [0.064]*** [0.061]*** [0.061]*** [0.063]*** [0.062]*** [0.060]*** [0.052]***Ownership [Foreign] 0.355 0.4 0.406 0.416 0.39 0.404 0.401 0.472 0.4 0.403 0.4 0.42 0.459
[0.067]*** [0.071]*** [0.070]*** [0.070]*** [0.070]*** [0.070]*** [0.070]*** [0.071]*** [0.070]*** [0.071]*** [0.069]*** [0.066]*** [0.062]***Log Exports / Sales 0.337 0.332 0.332 0.288 0.324 0.224 0.267 0.06 0.343 0.313 0.293 0.168 -0.122
[0.103]*** [0.105]*** [0.105]*** [0.103]*** [0.106]*** [0.102]** [0.107]** [0.098] [0.105]*** [0.106]*** [0.106]*** [0.106] [0.087]More than 3 Competitors 0.155 0.148 0.154 0.138 0.153 0.15 0.152 0.121 0.124 0.144 0.157 0.122 0.06
[0.040]*** [0.040]*** [0.040]*** [0.041]*** [0.040]*** [0.040]*** [0.040]*** [0.038]*** [0.040]*** [0.040]*** [0.041]*** [0.039]*** [0.035]*Registering a Business [Number of Procedures] -0.085 -0.089
[0.008]*** [0.012]***Registering a Business [Time in Days] -0.001 0.002
[0.002] [0.002]Registering a Business [Cost in % GNI] -0.008 -0.008
[0.002]*** [0.002]***Employing Workers [Rigidity of Employment] 0.007 0.016
[0.002]*** [0.003]***Employing Workers [Firing] -0.004 -0.008
[0.001]*** [0.002]***Employing Workers [Firing Cost in Weeks of Wages] 0.013 0.009
[0.002]*** [0.002]***Enforcing a Contract [Number of Procedures] -0.014 -0.018
[0.004]*** [0.003]***Enforcing a Contract [Time in Days] 0.001 0.002
[0.000]*** [0.000]***Enforcing a Contract [Cost in % of Debt] -0.044 -0.015
[0.005]*** [0.005]***Closing a Business [Time in Years] -0.02 0.037
[0.017] [0.018]**Closing a Business [Cost in % of Estate] -0.011 0.021
[0.003]*** [0.003]***Closing a Business [100 - Recovery Rate in Cents to de Dollar] -0.025 -0.016
[0.003]*** [0.003]***Constant 2.69 1.851 1.924 1.482 1.973 1.48 2.221 1.28 2.452 1.863 1.958 3.594 3.035
[0.120]*** [0.108]*** [0.097]*** [0.120]*** [0.103]*** [0.099]*** [0.146]*** [0.096]*** [0.122]*** [0.114]*** [0.102]*** [0.220]*** [0.224]***
Observations 5050 5050 5050 5050 5050 5050 5050 4692 5050 5050 5050 5050 46920.76 0.74 0.75 0.74 0.74 0.75 0.75 0.77 0.75 0.74 0.75 0.76 0.82
Robust standard errors, clustered by year, country, industry and firm size (small, medium and large) in brackets* significant at 10%; ** significant at 5%; *** significant at 1%
TableA8: Revenue Efficiency - Impact of Doing Business Indicators (OLS Estimation without Year, Country or Sector Fixed Effects)
Note: The Doing Business Indicators measure elements of the business climate on a country level a score indicates that the business climate is worse; all Indicators are measured defined, except for "Employing Workers [Rigidity of Employment]" and "Employing Workers [Firing]", which are measured on a scale from 0 to 100 (100 is the most rigid); the Doing Business Indicators report "Closing a Business [Recovery Rate in Cents to the Dollar]; this was recoded to "Closing a Business [100 - Recovery Rate in Cents to the Dollar]" such that, consistent with the other indicators, a higher score is associated with a worse business climate.
53

1 2 3 4 5 6 7 8 9 10 11 12 13Log Employment 0.904 0.904 0.904 0.905 0.904 0.905 0.905 0.909 0.905 0.905 0.905 0.905 0.905
[0.013]*** [0.013]*** [0.013]*** [0.013]*** [0.013]*** [0.013]*** [0.013]*** [0.013]*** [0.013]*** [0.013]*** [0.013]*** [0.013]*** [0.013]***Log Fixed Assets 0.156 0.158 0.158 0.157 0.157 0.157 0.157 0.155 0.157 0.157 0.157 0.157 0.16
[0.009]*** [0.009]*** [0.009]*** [0.009]*** [0.009]*** [0.009]*** [0.009]*** [0.010]*** [0.009]*** [0.009]*** [0.009]*** [0.009]*** [0.010]***Ownership [Privatized] 0.06 0.063 0.065 0.067 0.064 0.059 0.063 0.052 0.064 0.062 0.062 0.062 0.056
[0.043] [0.043] [0.043] [0.044] [0.043] [0.044] [0.043] [0.046] [0.043] [0.043] [0.043] [0.043] [0.046]Ownership [New Private] 0.151 0.152 0.156 0.156 0.153 0.15 0.152 0.142 0.153 0.153 0.152 0.152 0.147
[0.042]*** [0.042]*** [0.042]*** [0.042]*** [0.042]*** [0.042]*** [0.042]*** [0.045]*** [0.042]*** [0.042]*** [0.042]*** [0.042]*** [0.045]***Ownership [Foreign] 0.349 0.35 0.355 0.355 0.353 0.35 0.351 0.341 0.353 0.351 0.351 0.351 0.348
[0.053]*** [0.053]*** [0.053]*** [0.053]*** [0.053]*** [0.053]*** [0.053]*** [0.056]*** [0.053]*** [0.053]*** [0.053]*** [0.053]*** [0.056]***Log Exports / Sales 0.137 0.135 0.133 0.131 0.131 0.135 0.134 0.119 0.133 0.135 0.134 0.134 0.111
[0.077]* [0.077]* [0.077]* [0.077]* [0.077]* [0.077]* [0.077]* [0.082] [0.077]* [0.077]* [0.077]* [0.077]* [0.081]More than 3 Competitors -0.003 -0.006 -0.004 -0.006 -0.005 -0.004 -0.005 -0.008 -0.005 -0.005 -0.005 -0.005 -0.009
[0.030] [0.030] [0.030] [0.030] [0.030] [0.030] [0.030] [0.031] [0.030] [0.030] [0.030] [0.030] [0.031]Registering a Business [Number of Procedures] -0.03 -0.018
[0.018]* [0.021]Registering a Business [Time in Days] -0.004 -0.002
[0.002]** [0.003]Registering a Business [Cost in % GNI] -0.01 -0.011
[0.003]*** [0.005]**Employing Workers [Rigidity of Employment] 0.007 0.01
[0.003]** [0.007]Employing Workers [Firing] 0.003 0.007
[0.002] [0.006]Employing Workers [Firing Cost in Weeks of Wages] -0.004 -0.013
[0.004] [0.005]***Enforcing a Contract [Number of Procedures] 0.006 0.044
[0.023] [0.030]Enforcing a Contract [Time in Days] -0.001 -0.002
[0.000]*** [0.001]***Enforcing a Contract [Cost in % of Debt] 0.014 -0.009
[0.013] [0.035]Closing a Business [Time in Years] -0.111 0.15
[0.123] [0.149]Closing a Business [Cost in % of Estate] 0.005 0.024
[0.006] [0.026]Closing a Business [100 - Recovery Rate in Cents to de Dollar] 0 -0.016
[0.007] [0.012]Constant 1.409 1.174 1.221 0.628 0.729 1.053 0.848 1.22 0.771 1.324 0.809 1.039 -0.055
[0.255]*** [0.112]*** [0.103]*** [0.202]*** [0.216]*** [0.102]*** [0.646] [0.125]*** [0.229]*** [0.368]*** [0.267]*** [0.639] [1.757]
Observations 5050 5050 5050 5050 5050 5050 5050 4692 5050 5050 5050 5050 46920.86 0.86 0.86 0.86 0.86 0.86 0.86 0.86 0.86 0.86 0.86 0.86 0.86
Robust standard errors, clustered by year, country, industry and firm size (small, medium and large) in brackets* significant at 10%; ** significant at 5%; *** significant at 1%
TableA9: Revenue Efficiency - Impact of Doing Business Indicators (OLS Estimation with Year, Country and Sector Fixed Effects)
Note: The Doing Business Indicators measure elements of the business climate on a country level a score indicates that the business climate is worse; all Indicators are measured defined, except for "Employing Workers [Rigidity of Employment]" and "Employing Workers [Firing]", which are measured on a scale from 0 to 100 (100 is the most rigid); the Doing Business Indicators report "Closing a Business [Recovery Rate in Cents to the Dollar]; this was recoded to "Closing a Business [100 - Recovery Rate in Cents to the Dollar]" such that, consistent with the other indicators, a higher score is associated with a worse business climate.
54

1 2 3 4 5 6 7 8
Log Employment 0.389 0.457 0.402 0.489 0.755 0.731 0.735 0.710[0.169]** [0.171]*** [0.174]** [0.173]*** [0.189]*** [0.193]*** [0.193]*** [0.204]***
Log Assets 0.709 0.610 0.702 0.578 0.289 0.316 0.321 0.349[0.187]*** [0.200]*** [0.192]*** [0.202]*** [0.225] [0.244] [0.229] [0.255]
Log (1 + Exports / Sales) 0.825 1.021 -0.005 -0.023[0.593] [0.670] [0.683] [0.775]
More than 3 Competitors -0.004 0.007 -0.069 -0.067[0.081] [0.074] [0.073] [0.075]
Ownership [Privatized] 0.235 0.208 0.401 0.388[0.427] [0.445] [0.422] [0.455]
Ownership [New Private] 0.089 0.053 0.215 0.180[0.317] [0.349] [0.314] [0.352]
Ownership [Foreign] 1.904 1.942 1.835 1.878[0.473]*** [0.452]*** [0.447]*** [0.414]***
Constant 0.904 0.962 0.889 0.950 0.928 0.942 0.858 0.868[0.223]*** [0.221]*** [0.257]*** [0.244]*** [0.489]* [0.555]* [0.499]* [0.571]
Observations 1372 1355 1322 1305 1372 1355 1322 1305
J-Test 16.75 15.34 16.94 14.76 6.55 5.01 6.70 4.98p-value 0.005 0.004 0.005 0.005 0.162 0.025 0.035 0.026
First stage F-testsLog Employment 108.66 108.00 111.48 110.75 108.66 108.00 111.48 110.75Log Assets 36.82 36.34 35.50 35.01 36.82 36.34 35.50 35.01Log (1 + Exports / Sales) 15.20 14.17 15.20 14.17Ownership [Privatized] 8.68 8.91 9.36 9.72Ownership [New Private] 27.76 28.73 27.32 28.34Ownership [Foreign] 5.24 4.95 5.60 5.29
Durbin-Wu-Hausman Test 22.17 21.04 20.50 20.55 33.65 33.19 29.88 29.68p-value 0.000 0.000 0.000 0.000 0.000 0.000 0.000 0.000Robust standard errors, clustered by year, country, industry and firm size (small, medium and large) in brackets* significant at 10%; ** significant at 5%; *** significant at 1%
Table A10: Revenue Efficiency - Baseline regressions on Panel Data (IV Estimation with Year, Country and Sector Fixed Effects)
Note: All models were estimated using IVs for Log Employment, Log Assets, Log (1 + Export/Sales) and three Ownership Dummies. The IVs are: Firm's age, skill ratio (college/high school), skill ratio - age interaction, location (city), % change in fixed assets in previous period, % change in exports in previous period, full time employees in previous period. The skill ratio and the skill ratio - age interaction were also interacted with regional (CEB, SEE and CIS) dummies 1
55