do-it-yourself (diy) online brokerages - beringer … · thematic - do-it-yourself (diy) online...
TRANSCRIPT

BERINGER FINANCE AS, HAAKON VII’S GATE 2, P.O. BOX 1502 VIKA, NO-0117 OSLO,
This report was prepared by an analyst engaged by Beringer Finance AS, the Norwegian affiliate of Beringer Finance US
Inc., who is not registered as a research analyst with FINRA or subject to FINRA rules governing research. This report is not
a product of Beringer Finance US Inc. See page 12 of this report for Important Disclosure Information.
The future arrived 20 years ago DO-IT-YOURSELF (DIY) ONLINE BROKERAGES
U l r i k Å r d a l Z ü r c h e r
T E L : + 4 7 2 1 1 1 3 0 2 1
u l r i k . z u r c h e r @ b e r i n g e r f i n a n c e . c o m
R E Y K J A V Í K S T O C K H O L M O S L O P A L O A L T O N E W Y O R K
Thematic - Do-it-yourself (DIY) online brokerages
Page 2 Beringer Finance
Introduction
The do-it-yourself (DIY) online brokerage industry is in an exciting position for future
growth. Structurally, defined benefit pension schemes are falling out of favor across the
Western hemisphere and people increasingly need to take responsibility for their own re-
tirement funding. In the spirit of the digital era and with increasing tech-sophistication
amongst consumers, we observe that increasingly large swaths of the populace prefer a DIY
approach to manage their savings. The online brokerages are happy to oblige and able to
support this trend.
On the technology side, online brokerages have the potential to thrive in the digital econo-
my, as they are natural user interfaces (UI). Online-incumbents, like Google and Facebook,
are challenging traditional banks as UIs for their customers (or the position as Account In-
formation Service Providers, AISP). However, the central value proposition of DIY brokerag-
es has always been user friendliness and technological prowess (+ low costs of course),
making them much harder to disrupt in the wake of the Payment and Services Directive 2
(PSD 2). Economies of scale and scope are concepts of the past, while eco-systems centered
around economies of access* are thriving. Nevertheless, there are plenty of challenges
ahead, with the most notably threat being the rise of commission-free business models –
the potential ultimate end-game of the democratization of trading evolution.
In this piece we cover: (i) the evolution of the DIY brokerage industry to date, (ii) the indus-
try’s most notable characteristic – price pressure, and (iii) the major FinTech threats. Addi-
tionally, we evaluate the strategic directions that newcomers have chosen to pursue versus
the incumbent’s positions. We keep the analysis on a high level within the Western world,
with a brief in-depth look at FinTech challenger movements in the Nordics.
This thematic piece was written as a part of our initiation of coverage of Avanza, and can be
found from page 42 of that report. Contact us (at) [email protected] for the full
report and to sign up for more of our research.
*Economy of access = business model where products and services are traded on the basis
of access rather than ownership. Noteworthy examples include Airbnb and Uber, yet we
argue that the financial industry equivalents include online brokerages as some of them
(especially in the Nordics) function as “access points” to a wider range of both commoditized
and differentiated products and services.
Thematic - Do-it-yourself (DIY) online brokerages
Beringer Finance Page 3
Thematic: Do-it-yourself (DIY) online brokerages
The future arrived 20 years ago
The self-directed brokerage industry, as we know it today, came to prominence with the
mainstream use of the internet in the second half of the 90s. The diffusion of internet tech-
nologies democratized the trading of securities and significantly lowered the barriers to
entry on the supply side. While the term “discount-broker” was first properly introduced in
1975, following deregulation in the US, the online discount-broker industry was born in the
late 90s. A discount broker is close to synonymous with a self-directed brokerage, or DIY, as
we refer to the industry.
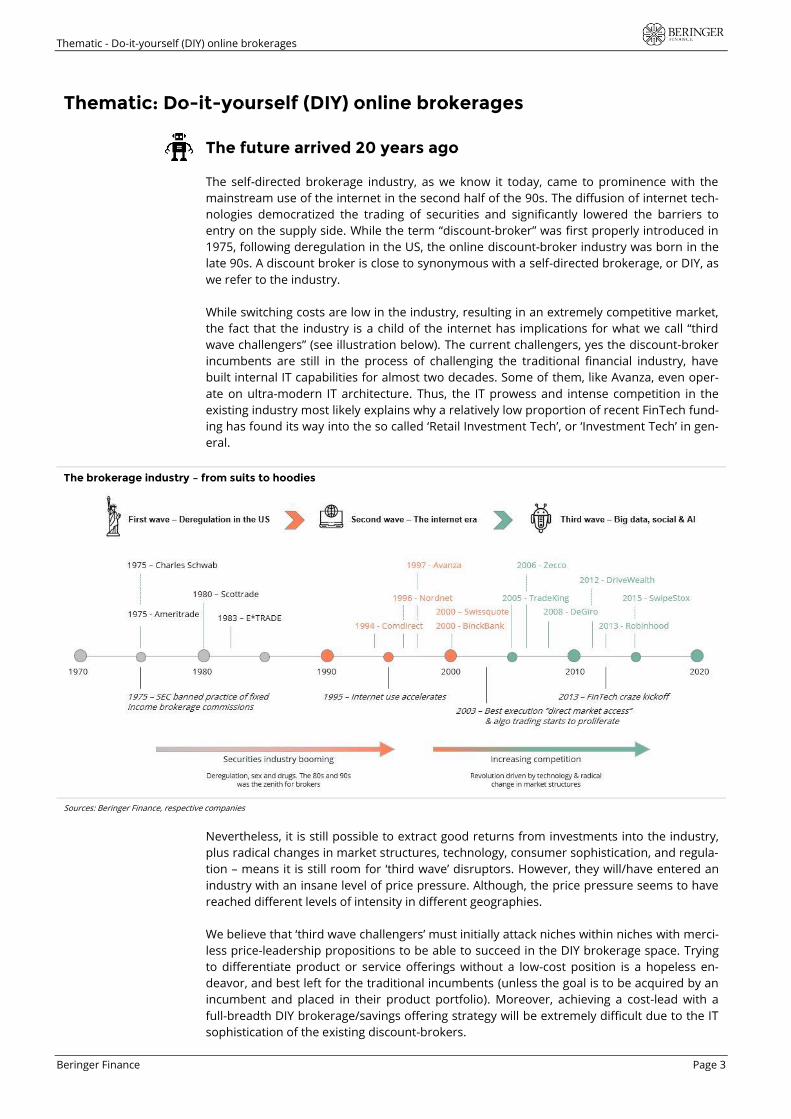
While switching costs are low in the industry, resulting in an extremely competitive market,
the fact that the industry is a child of the internet has implications for what we call “third
wave challengers” (see illustration below). The current challengers, yes the discount-broker
incumbents are still in the process of challenging the traditional financial industry, have
built internal IT capabilities for almost two decades. Some of them, like Avanza, even oper-
ate on ultra-modern IT architecture. Thus, the IT prowess and intense competition in the
existing industry most likely explains why a relatively low proportion of recent FinTech fund-
ing has found its way into the so called ‘Retail Investment Tech’, or ‘Investment Tech’ in gen-
eral.
The brokerage industry – from suits to hoodies
Sources: Beringer Finance, respective companies
Nevertheless, it is still possible to extract good returns from investments into the industry,
plus radical changes in market structures, technology, consumer sophistication, and regula-
tion – means it is still room for ‘third wave’ disruptors. However, they will/have entered an
industry with an insane level of price pressure. Although, the price pressure seems to have
reached different levels of intensity in different geographies.
We believe that ‘third wave challengers’ must initially attack niches within niches with merci-
less price-leadership propositions to be able to succeed in the DIY brokerage space. Trying
to differentiate product or service offerings without a low-cost position is a hopeless en-
deavor, and best left for the traditional incumbents (unless the goal is to be acquired by an
incumbent and placed in their product portfolio). Moreover, achieving a cost-lead with a
full-breadth DIY brokerage/savings offering strategy will be extremely difficult due to the IT
sophistication of the existing discount-brokers.
Thematic - Do-it-yourself (DIY) online brokerages
Page 4 Beringer Finance
Trading fees – price pressure extraordinaire
The DIY brokerage industry’s growth strategy has always been trading-fee price-leadership,
made possible by increasingly efficient operations (technology). For many players, the end
goal is not even to maximize their brokerage margins, but attract clients that they can cross-
sell other products to. For example, many of the DIY brokers rely heavily on interest income
generated from products such as margin loans, mortgages, and other consumer credits.
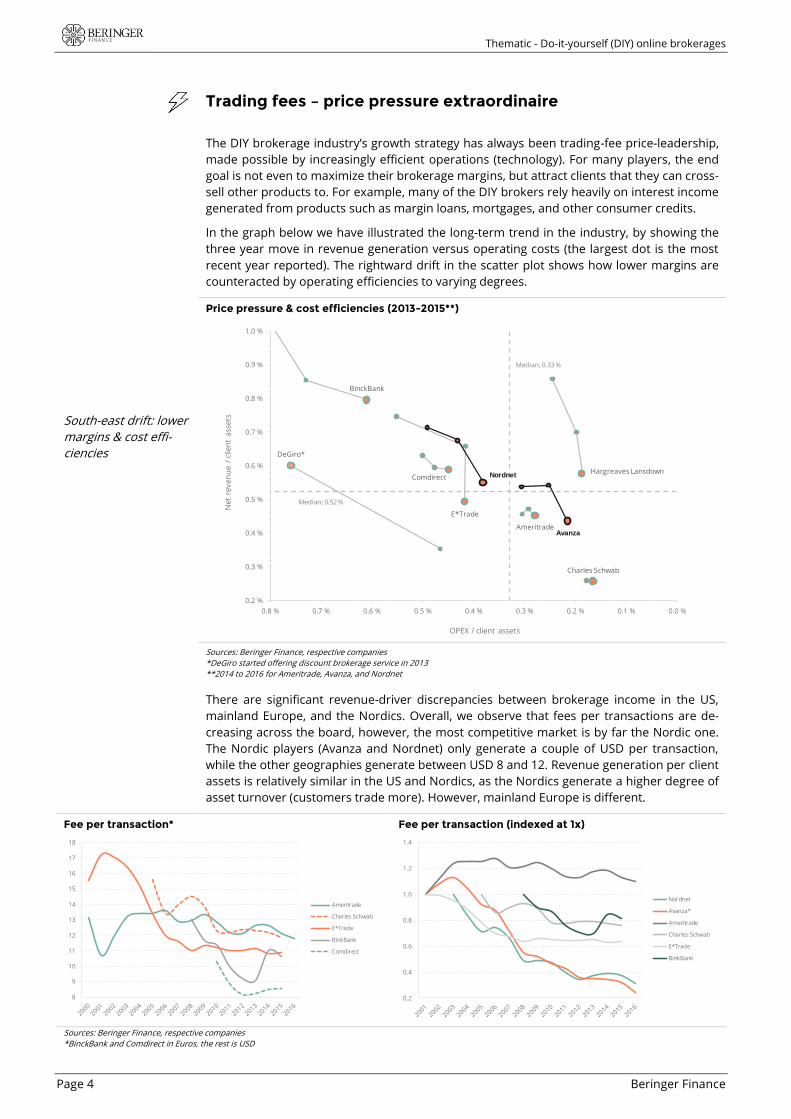
In the graph below we have illustrated the long-term trend in the industry, by showing the
three year move in revenue generation versus operating costs (the largest dot is the most
recent year reported). The rightward drift in the scatter plot shows how lower margins are
counteracted by operating efficiencies to varying degrees.
South-east drift: lower
margins & cost effi-
ciencies
Price pressure & cost efficiencies (2013-2015**)
Median; 0.33 %
Median; 0.52 %
E*Trade
Ameritrade
Charles Schwab
Hargreaves LansdownComdirect
BinckBank
Avanza
Nordnet
DeGiro*
0.2 %
0.3 %
0.4 %
0.5 %
0.6 %
0.7 %
0.8 %
0.9 %
1.0 %
0.0 %0.1 %0.2 %0.3 %0.4 %0.5 %0.6 %0.7 %0.8 %
Ne
t re
ve
nu
e /
clie
nt
ass
ets
OPEX / client assets
Sources: Beringer Finance, respective companies
*DeGiro started offering discount brokerage service in 2013
**2014 to 2016 for Ameritrade, Avanza, and Nordnet
There are significant revenue-driver discrepancies between brokerage income in the US,
mainland Europe, and the Nordics. Overall, we observe that fees per transactions are de-
creasing across the board, however, the most competitive market is by far the Nordic one.
The Nordic players (Avanza and Nordnet) only generate a couple of USD per transaction,
while the other geographies generate between USD 8 and 12. Revenue generation per client
assets is relatively similar in the US and Nordics, as the Nordics generate a higher degree of
asset turnover (customers trade more). However, mainland Europe is different.
Fee per transaction*
8
9
10
11
12
13
14
15
16
17
18
Ameritrade
Charles Schwab
E*Trade
BinkBank
Comdirect
Fee per transaction (indexed at 1x)
0.2
0.4
0.6
0.8
1.0
1.2
1.4
Nordnet
Avanza*
Ameritrade
Charles Schwab
E*Trade
BinkBank
Sources: Beringer Finance, respective companies
*BinckBank and Comdirect in Euros, the rest is USD
Thematic - Do-it-yourself (DIY) online brokerages
Beringer Finance Page 5
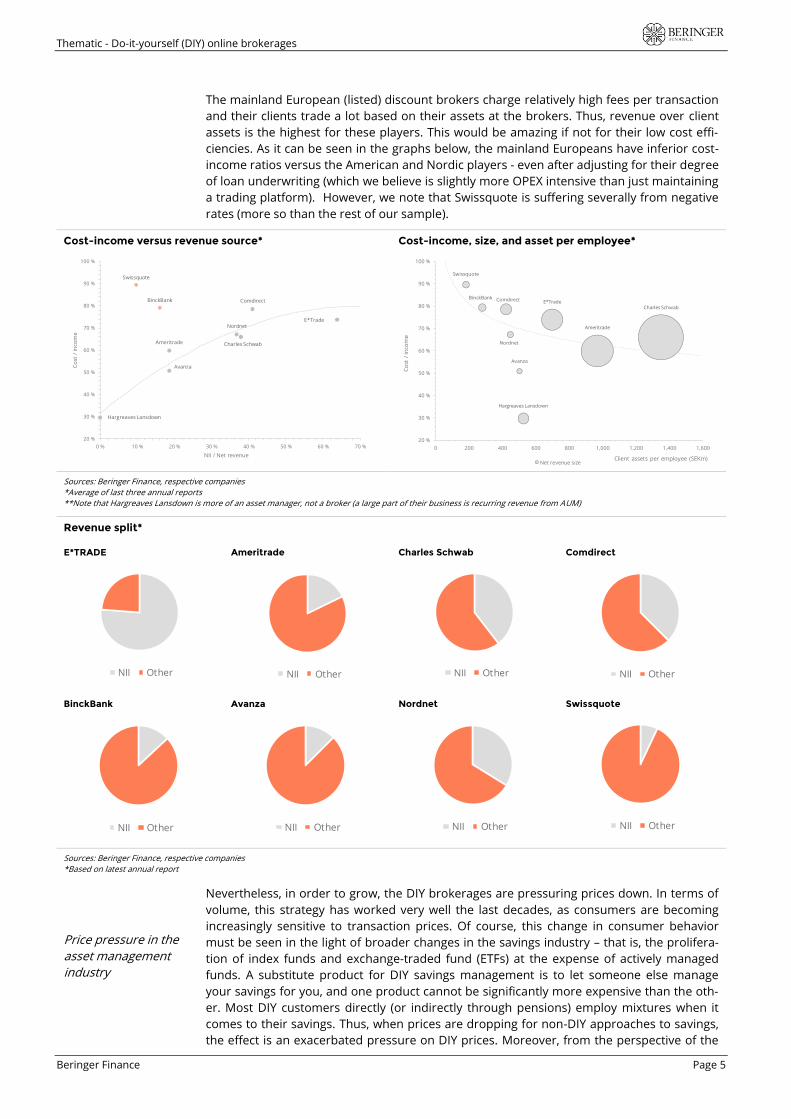
The mainland European (listed) discount brokers charge relatively high fees per transaction
and their clients trade a lot based on their assets at the brokers. Thus, revenue over client
assets is the highest for these players. This would be amazing if not for their low cost effi-
ciencies. As it can be seen in the graphs below, the mainland Europeans have inferior cost-
income ratios versus the American and Nordic players - even after adjusting for their degree
of loan underwriting (which we believe is slightly more OPEX intensive than just maintaining
a trading platform). However, we note that Swissquote is suffering severally from negative
rates (more so than the rest of our sample).
Cost-income versus revenue source*
E*Trade
Ameritrade Charles Schwab
Hargreaves Lansdown
Comdirect
Avanza
Nordnet
BinckBank
Swissquote
20 %
30 %
40 %
50 %
60 %
70 %
80 %
90 %
100 %
0 % 10 % 20 % 30 % 40 % 50 % 60 % 70 %
Co
st /
inco
me
NII / Net revenue
Cost-income, size, and asset per employee*
E*Trade
Ameritrade
Charles Schwab
ComdirectBinckBank
Swissquote
Avanza
Nordnet
Hargreaves Lansdown
20 %
30 %
40 %
50 %
60 %
70 %
80 %
90 %
100 %
0 200 400 600 800 1,000 1,200 1,400 1,600
Co
st /
inco
me
Client assets per employee (SEKm)Net revenue size
Sources: Beringer Finance, respective companies
*Average of last three annual reports
**Note that Hargreaves Lansdown is more of an asset manager, not a broker (a large part of their business is recurring revenue from AUM)
Revenue split*
E*TRADE
NII Other
Ameritrade
NII Other
Charles Schwab
NII Other
Comdirect
NII Other
BinckBank
NII Other
Avanza
NII Other
Nordnet
NII Other
Swissquote
NII Other
Sources: Beringer Finance, respective companies
*Based on latest annual report
Price pressure in the
asset management
industry
Nevertheless, in order to grow, the DIY brokerages are pressuring prices down. In terms of
volume, this strategy has worked very well the last decades, as consumers are becoming
increasingly sensitive to transaction prices. Of course, this change in consumer behavior
must be seen in the light of broader changes in the savings industry – that is, the prolifera-
tion of index funds and exchange-traded fund (ETFs) at the expense of actively managed
funds. A substitute product for DIY savings management is to let someone else manage
your savings for you, and one product cannot be significantly more expensive than the oth-
er. Most DIY customers directly (or indirectly through pensions) employ mixtures when it
comes to their savings. Thus, when prices are dropping for non-DIY approaches to savings,
the effect is an exacerbated pressure on DIY prices. Moreover, from the perspective of the
Thematic - Do-it-yourself (DIY) online brokerages
Page 6 Beringer Finance
aggregate brokerage industry, low-cost funds cannot afford to pay full commissions for full-
services – again pushing transaction revenues down. Lastly, the DIY brokerages are com-
monly third-party distributers of funds. Therefore, when fund expense ratios are heading
south, the result is lower distribution commissions for the brokers.
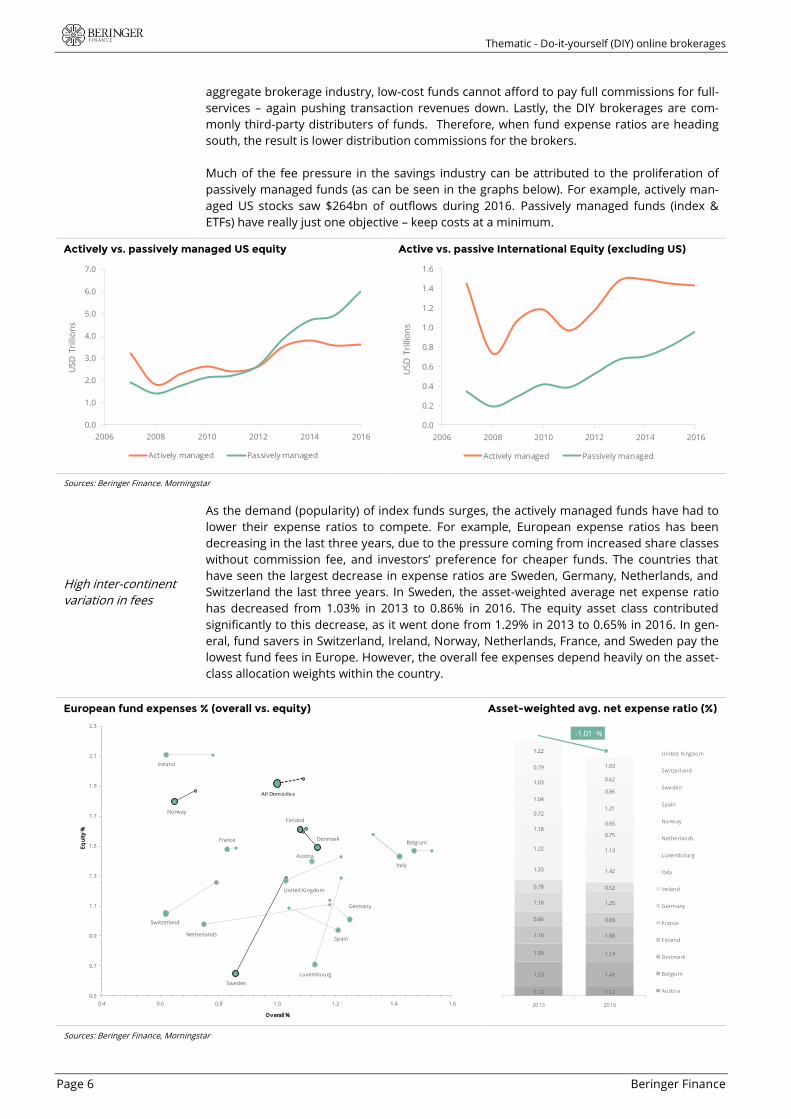
Much of the fee pressure in the savings industry can be attributed to the proliferation of
passively managed funds (as can be seen in the graphs below). For example, actively man-
aged US stocks saw $264bn of outflows during 2016. Passively managed funds (index &
ETFs) have really just one objective – keep costs at a minimum.
Actively vs. passively managed US equity
0.0
1.0
2.0
3.0
4.0
5.0
6.0
7.0
2006 2008 2010 2012 2014 2016
US
D T
rilli
on
s
Actively managed Passively managed
Active vs. passive International Equity (excluding US)
0.0
0.2
0.4
0.6
0.8
1.0
1.2
1.4
1.6
2006 2008 2010 2012 2014 2016
US
D T
rilli
on
s
Actively managed Passively managed
Sources: Beringer Finance. Morningstar
High inter-continent
variation in fees
As the demand (popularity) of index funds surges, the actively managed funds have had to
lower their expense ratios to compete. For example, European expense ratios has been
decreasing in the last three years, due to the pressure coming from increased share classes
without commission fee, and investors’ preference for cheaper funds. The countries that
have seen the largest decrease in expense ratios are Sweden, Germany, Netherlands, and
Switzerland the last three years. In Sweden, the asset-weighted average net expense ratio
has decreased from 1.03% in 2013 to 0.86% in 2016. The equity asset class contributed
significantly to this decrease, as it went done from 1.29% in 2013 to 0.65% in 2016. In gen-
eral, fund savers in Switzerland, Ireland, Norway, Netherlands, France, and Sweden pay the
lowest fund fees in Europe. However, the overall fee expenses depend heavily on the asset-
class allocation weights within the country.
European fund expenses % (overall vs. equity)
All Domiciles
Austria
BelgiumDenmark
Finland
France
Germany
Ireland
Italy
Luxembourg
Netherlands
Norway
Spain
Sweden
Switzerland
United Kingdom
0.5
0.7
0.9
1.1
1.3
1.5
1.7
1.9
2.1
2.3
0.4 0.6 0.8 1.0 1.2 1.4 1.6
Eq
uit
y %
Ov erall %
Asset-weighted avg. net expense ratio (%)
1.12 1.12
1.53 1.47
1.09 1.14
1.10 1.08
0.86 0.83
1.18 1.25
0.78 0.62
1.33 1.42
1.22 1.13
1.180.75
0.72
0.65
1.04
1.21
1.03
0.86
0.79
0.62
1.22
1.03
-1.01 %
2013 2016
United Kingdom
Switzerland
Sweden
Spain
Norway
Netherlands
Luxembourg
Italy
Ireland
Germany
France
Finland
Denmark
Belgium
Austria
Sources: Beringer Finance, Morningstar
Thematic - Do-it-yourself (DIY) online brokerages
Beringer Finance Page 7
Expense ratios are
decreasing…
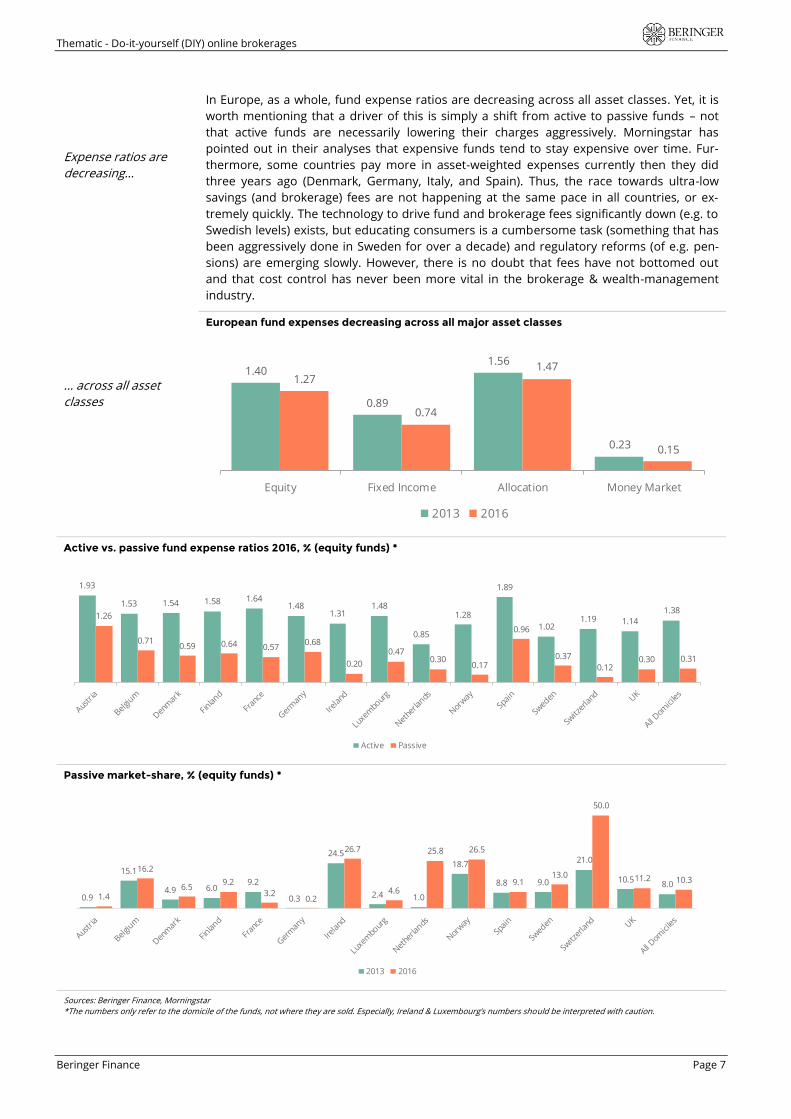
In Europe, as a whole, fund expense ratios are decreasing across all asset classes. Yet, it is
worth mentioning that a driver of this is simply a shift from active to passive funds – not
that active funds are necessarily lowering their charges aggressively. Morningstar has
pointed out in their analyses that expensive funds tend to stay expensive over time. Fur-
thermore, some countries pay more in asset-weighted expenses currently then they did
three years ago (Denmark, Germany, Italy, and Spain). Thus, the race towards ultra-low
savings (and brokerage) fees are not happening at the same pace in all countries, or ex-
tremely quickly. The technology to drive fund and brokerage fees significantly down (e.g. to
Swedish levels) exists, but educating consumers is a cumbersome task (something that has
been aggressively done in Sweden for over a decade) and regulatory reforms (of e.g. pen-
sions) are emerging slowly. However, there is no doubt that fees have not bottomed out
and that cost control has never been more vital in the brokerage & wealth-management
industry.
… across all asset
classes
European fund expenses decreasing across all major asset classes
1.40
0.89
1.56
0.23
1.27
0.74
1.47
0.15
Equity Fixed Income Allocation Money Market
2013 2016
Active vs. passive fund expense ratios 2016, % (equity funds) *
1.93
1.53 1.54 1.58 1.641.48
1.311.48
0.85
1.28
1.89
1.021.19 1.14
1.381.26
0.710.59 0.64 0.57
0.68
0.20
0.470.30
0.17
0.96
0.37
0.120.30 0.31
Active Passive
Passive market-share, % (equity funds) *
1.4
16.2
6.59.2
3.20.2
26.7
4.6
25.8 26.5
9.113.0
50.0
11.2 10.3
0.9
15.1
4.9 6.09.2
0.3
24.5
2.4 1.0
18.7
8.8 9.0
21.0
10.58.0
2013 2016
Sources: Beringer Finance, Morningstar
*The numbers only refer to the domicile of the funds, not where they are sold. Especially, Ireland & Luxembourg’s numbers should be interpreted with caution.
Thematic - Do-it-yourself (DIY) online brokerages
Page 8 Beringer Finance
The third wave – disrupting the disrupters
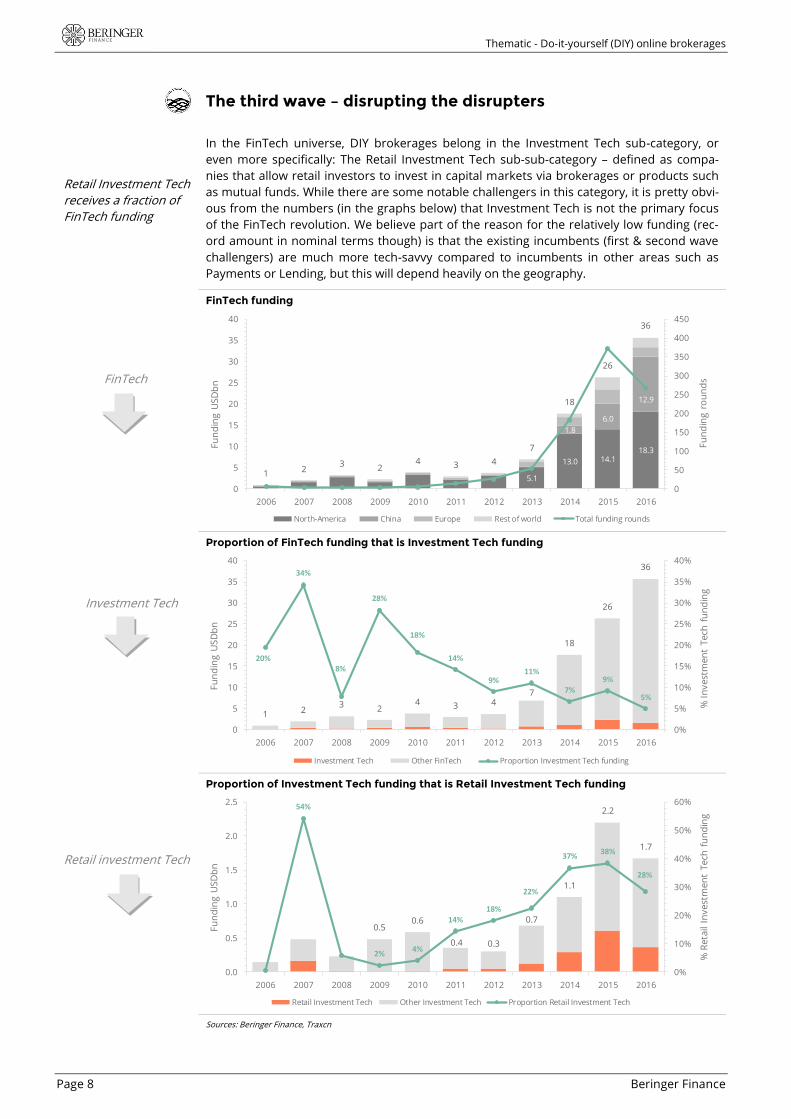
Retail Investment Tech
receives a fraction of
FinTech funding
In the FinTech universe, DIY brokerages belong in the Investment Tech sub-category, or
even more specifically: The Retail Investment Tech sub-sub-category – defined as compa-
nies that allow retail investors to invest in capital markets via brokerages or products such
as mutual funds. While there are some notable challengers in this category, it is pretty obvi-
ous from the numbers (in the graphs below) that Investment Tech is not the primary focus
of the FinTech revolution. We believe part of the reason for the relatively low funding (rec-
ord amount in nominal terms though) is that the existing incumbents (first & second wave
challengers) are much more tech-savvy compared to incumbents in other areas such as
Payments or Lending, but this will depend heavily on the geography.
FinTech
Investment Tech
Retail investment Tech
FinTech funding
5.1
13.0 14.118.3
1.8
6.0
12.9
1 23 2
4 3 4
7
18
26
36
0
50
100
150
200
250
300
350
400
450
0
5
10
15
20
25
30
35
40
2006 2007 2008 2009 2010 2011 2012 2013 2014 2015 2016
Fu
nd
ing
ro
un
ds
Fu
nd
ing
US
Db
n
North-America China Europe Rest of world Total funding rounds
Proportion of FinTech funding that is Investment Tech funding
1 23 2
4 3 47
18
26
36
20%
34%
8%
28%
18%
14%
9%11%
7%9%
5%
0%
5%
10%
15%
20%
25%
30%
35%
40%
0
5
10
15
20
25
30
35
40
2006 2007 2008 2009 2010 2011 2012 2013 2014 2015 2016
% I
nv
est
me
nt
Te
ch f
un
din
g
Fu
nd
ing
US
Db
n
Investment Tech Other FinTech Proportion Investment Tech funding
Proportion of Investment Tech funding that is Retail Investment Tech funding
0.50.6
0.4 0.3
0.7
1.1
2.2
1.7
54%
2%4%
14%18%
22%
37%38%
28%
0%
10%
20%
30%
40%
50%
60%
0.0
0.5
1.0
1.5
2.0
2.5
2006 2007 2008 2009 2010 2011 2012 2013 2014 2015 2016
% R
eta
il In
ve
stm
en
t T
ech
fu
nd
ing
Fu
nd
ing
US
Db
n
Retail Investment Tech Other Investment Tech Proportion Retail Investment Tech
Sources: Beringer Finance, Traxcn

Thematic - Do-it-yourself (DIY) online brokerages
Beringer Finance Page 9
The focus is on de-
mocratization and
discount trading
Looking at the start-up landscape in Retail Investment Tech (with a focus on brokerage type
of businesses), two factor stands out: (i) price leadership; (ii) laser-sharp product or service
focus. That is, the third-wave is trying to pinpoint weaknesses in the second-wave’s business
models. For example, DeGiro (Dutch company) tries to take advantage of the fact that you
need quite the broad offering (e.g. advanced decision making tools, pension services, and
customer service available at all times) to unlock the largest proportions of different mar-
ket’s savings capital, and that this is relatively expensive. So, DeGiro aims to offer the mar-
ket’s lowest transaction fees, but virtually nothing else – pinpointing the absolute most price
sensitive segments of the DIY savings market. Taking the second-wave head-on would re-
quire much more risk capital, and (given their broad product offering) the second-wave
companies are highly cost-efficient and tech-savvy. They have lived with intense competition
since the dawn of the online discount brokerage age and their competitive advantage(s) is
usually tightly connected to some technological factor as is – therefore it is not the easiest
industry to disrupt.
Y-axis could alterna-
tively be ‘simplicity,’
but price is definitely
the primary strategic
imperative
Another recurring
theme amongst third-
wave challengers is
“making investing fun,”
e.g. through social
networks
Competitive matrix (retail brokerages)
Sources: Beringer Finance
The circle of life moves
slowly – there are
simply too many areas
to disrupt
Another, more extreme, example of a third-wave challenger is Robinhood (American com-
pany). They do not charge money for trading securities at all, but monetize their customers
by lending them money to trade – a worrisome proposition, should it be sustainable, for
most existing brokerages. Additionally, they might offer a broader range of products and
services in the future, included IRA (pension), trust and custodial accounts. This potential
widening of product and services breath will be a natural evolution for most third-wave
challengers as they grow their customer base. Just as second-wave challengers move slowly
towards the traditional brokerage quadrant in the matrix above (at least for some business
areas). An example of this would be how Avanza (Sweden) has recently opened physical
offices in two cities in Sweden to support their pension and private banking operations
(before they only had an online presence), and how they offer traditional corporate finance
services – a business area usually reserved for the traditional brokerage houses.
While a pure differentiation strategy, without a significant price leadership element or high
products and services breadth, is completely unsustainable for retail brokerages – a bit of
product differentiation could be a viable strategy in the start-up Retail Investment Tech
segment, but then more for investment product providers. An example of this would be
Thematic - Do-it-yourself (DIY) online brokerages
Page 10 Beringer Finance
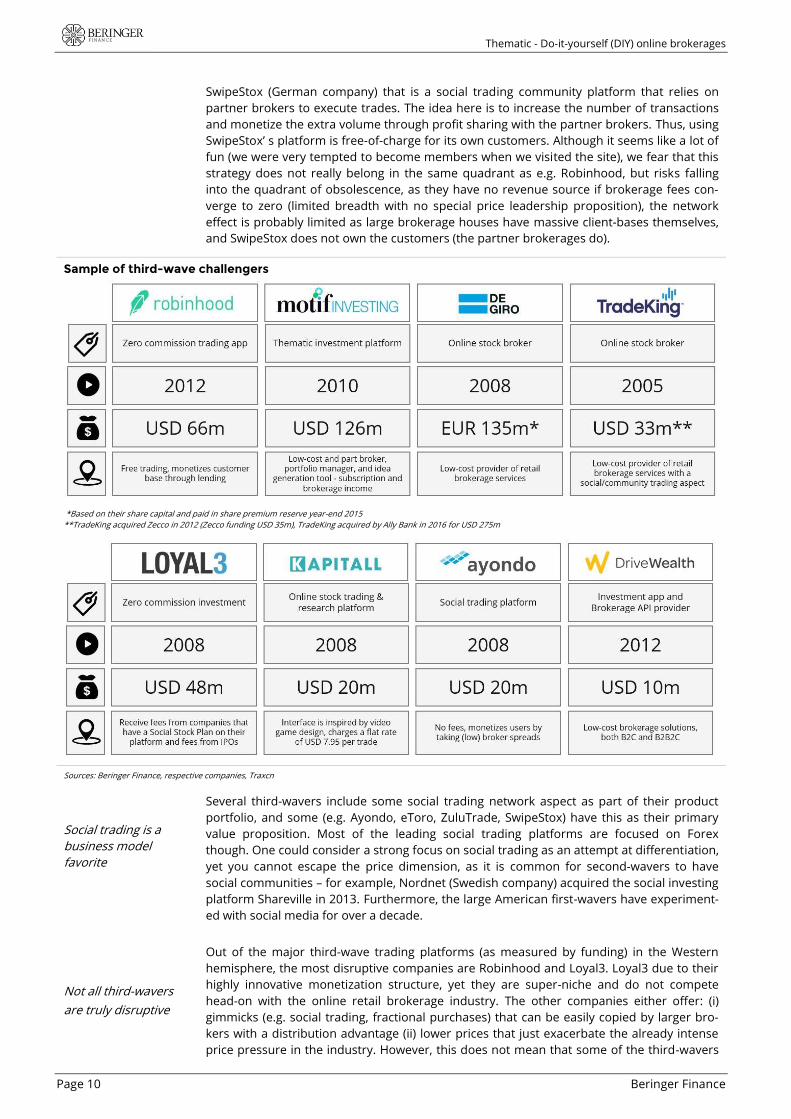
SwipeStox (German company) that is a social trading community platform that relies on
partner brokers to execute trades. The idea here is to increase the number of transactions
and monetize the extra volume through profit sharing with the partner brokers. Thus, using
SwipeStox’ s platform is free-of-charge for its own customers. Although it seems like a lot of
fun (we were very tempted to become members when we visited the site), we fear that this
strategy does not really belong in the same quadrant as e.g. Robinhood, but risks falling
into the quadrant of obsolescence, as they have no revenue source if brokerage fees con-
verge to zero (limited breadth with no special price leadership proposition), the network
effect is probably limited as large brokerage houses have massive client-bases themselves,
and SwipeStox does not own the customers (the partner brokerages do).
Sample of third-wave challengers
*Based on their share capital and paid in share premium reserve year-end 2015
**TradeKing acquired Zecco in 2012 (Zecco funding USD 35m), TradeKing acquired by Ally Bank in 2016 for USD 275m
Sources: Beringer Finance, respective companies, Traxcn
Social trading is a
business model
favorite
Not all third-wavers
are truly disruptive
Several third-wavers include some social trading network aspect as part of their product
portfolio, and some (e.g. Ayondo, eToro, ZuluTrade, SwipeStox) have this as their primary
value proposition. Most of the leading social trading platforms are focused on Forex
though. One could consider a strong focus on social trading as an attempt at differentiation,
yet you cannot escape the price dimension, as it is common for second-wavers to have
social communities – for example, Nordnet (Swedish company) acquired the social investing
platform Shareville in 2013. Furthermore, the large American first-wavers have experiment-
ed with social media for over a decade.
Out of the major third-wave trading platforms (as measured by funding) in the Western
hemisphere, the most disruptive companies are Robinhood and Loyal3. Loyal3 due to their
highly innovative monetization structure, yet they are super-niche and do not compete
head-on with the online retail brokerage industry. The other companies either offer: (i)
gimmicks (e.g. social trading, fractional purchases) that can be easily copied by larger bro-
kers with a distribution advantage (ii) lower prices that just exacerbate the already intense
price pressure in the industry. However, this does not mean that some of the third-wavers

Thematic - Do-it-yourself (DIY) online brokerages
Beringer Finance Page 11
Significant differences
between B2C and B2B
Nordics are not that
exciting
will not be part of the elite in the future, but they will have to get to the top the traditional
way by creating competitive advantages within innovation, cost leadership, and/-or distribu-
tion (much like the existing players have been doing since the dawn of the internet 20 years
ago). Most likely, many of the more successful ones will be acquired before they reach a
scale where it would be logical to increase their product and services breadth. We suspect
that first-mover differentiation advantages and network effects are not worth as much in
the online DIY brokerage industry as they were for Microsoft (PC operating systems), Google
(indexing the internet) or Facebook (social media).
However, it is important to separate between B2C and B2B in the trading space. In B2C
brokerage/trading we believe that costs have an extremely high weight in building sustaina-
ble competitive advantages and that a standalone differentiation strategy is futile (it is simp-
ly too easy for competitors to copy innovations like mobile trading, social trading etc.).
However, in B2B the standing is a bit different in that it is possible to benefit from network
effects that are built on the back on differentiation strategies. For example, Liquidnet
(American company) is a prominent example of a business model that dis-intermediates the
buy-side and exchanges by providing a platform for asset managers to execute large trades
with maximum anonymity and minimum market impact (according to the company). An-
other example would be BankerBay (American company), an online investment banking
platform that connects qualified and vetted corporate deals with providers of capital
around the world.
The Nordics have an exciting FinTech start-up scene within some areas: for example, Au-
thentication/ Security, Lending, and Payment Services (Swedish payment system provider
Klarna is a Unicorn). However, the Retail Investment Tech scene is weak. This could be due
to the sophistication of the second-wave incumbents, such as Avanza and Nordnet, which
offer lower transaction fees than most international third-wavers.
Sample of Nordic Investment Tech
Sources: Beringer Finance, respective companies, Traxcn, Crunchbase
Above, we present a selection of some platforms that have received funding in the Nordics.
Note that Midaxo is B2B and Invesdor is crowdfunding based, so not direct competitors in
the online retail brokerage space. Additionally, Sigmastocks use the second-wavers Avanza
and Nordnet to execute the trades for their clients, thus they are more an asset manager
challenger. Lastly, Huddlestock is not a brokerage either and uses third-party brokers to
execute trades. Overall, it is safe to say there are no serious third-wave challengers on the
horizon in the Nordics, at least based on funding-to-date. If this is because the incumbent
second-wavers are too “FinTech” themselves combined with vast resources (compared to a
start-up), or if the next great disrupter is tinkering in a garage, we dare not say – but we
have a feeling (in the Nordics only) it is the first. Nevertheless, it will be very interesting to
follow Robinhood going forward, because if their vision of zero-commission fees is sustain-
able, it will send ripples through the brokerage world. However, we note that second-wave
brokerages do already offer zero-commission trading. For example, Avanza offers free trad-
ing on the Stockholm Stock Exchange for customers with savings capital less than SEK 50k.
Thematic - Do-it-yourself (DIY) online brokerages
Page 12 Beringer Finance
Please go to our homepage www.beringerfinance.com for updated disclosures.
DISCLAIMER This report is provided for information purposes only. It should not be used or considered as an offer to sell or a solicitation of an offer to buy any securities. Any opinions expressed are subject to change without prior notice. This report is based on information from various sources believed to be reliable. Although all reasonable care has been taken to ensure that the information herein is not misleading, Beringer Finance AS makes no represen-tation or warranty expressed or implied as to its accuracy or completeness. Neither Beringer Finance AS, its partners and employees, nor any other person connected with it, accepts any liability whatsoever for any direct or consequential loss of any kind arising out of the use or reliance on the information in this report. This report is prepared for general circulation and general information. It does not take into account the specific investment objectives and financial situation of any recipient. Investors seeking to buy or sell any securities discussed or recommended in this report, should seek independent financial advice relating thereto. This report may not be distributed, quoted from or reproduced for any purpose without written approval by Beringer Finance AS. DISCLOSURE OF INTERESTS Beringer Finance AS is constantly seeking investment-banking mandates, and may at any time perform invest-ment banking or other services or solicit investment banking or other mandates from the company or compa-nies covered in this report. Beringer Finance AS may from time to time as part of its investment services hold positions in securities covered in this report. Under our internal regulations, our analysts are not permitted to purchase new securities in the companies they cover. DISTRIBUTION IN THE US Research reports are prepared by Beringer Finance AS for information purposes only. Beringer Finance AS and its employees are not subject to the Rules of the Financial Industry Regulatory Authority (FINRA) governing research analyst conflicts. The research reports are intended for distribution in the United States solely to “major U.S. institutional investors” as defined in Rule 15a-6 under the United States Securities Exchange Act of 1934, as amended and may not be furnished to any other person in the United States. Each major U.S. institu-tional investor that receives a copy of a Beringer Finance AS research report by its acceptance thereof repre-sents and agrees that it shall not distribute or provide copies to any other person. Reports are prepared by Beringer Finance AS and distributed to major U.S. institutional investors under Rule 15a-6(a)(2). These research reports are prepared by Beringer Finance AS and distributed in the United States by Beringer Finance US, Inc. under Rule 15a-6(a)(2). Any U.S. Person receiving these reports that desires to effect transactions in any securities discussed within the report should call or write Beringer Finance US, Inc., a member of FINRA. Beringer Finance US, Inc. is located at 140 Broadway, 46th floor, New York, NY 10005 and may be contacted at +1 212 751 8522.